early duration claims survey report - soa · on the condition that the foregoing copyright notice...
TRANSCRIPT

Report
of the
Society of Actuaries
Early Duration Claims
Survey Subcommittee
December 2009
Society of Actuaries 475 N. Martingale Rd., Ste. 600
Schaumburg, IL 60173 Phone: 847-706-3500 Fax: 847-706-3599
Web site: http://www.soa.org
Copyright © 2009 by the Society of Actuaries All rights reserved by the Society of Actuaries. Permission is granted to make brief excerpts for a published review. Permission is also granted to make limited numbers of copies of items in this issue for personal, internal, classroom or other instructional use on the condition that the foregoing copyright notice is used so as to give reasonable notice of the Society’s copyright. This consent for free limited copying without prior consent of the Society does not extend to making copies for general distribution, for advertising or promotional purposes, for inclusion in new collective works or for resale.

2
INTRODUCTION This Report presents the results of a Survey undertaken by the Society of Actuaries Committee on Life Insurance Mortality and Underwriting Surveys. The Survey was sent to actuaries and underwriters at life insurers and life reinsurers in the United States; one response per company was allowed. The topic of the Survey was life insurance claims in early policy durations – defined as the first five policy years. We asked questions regarding underwriting, claims practices, how early duration claims are monitored, and early duration mortality experience. The Survey was sent to life reinsurers as well as direct writers. Some reinsurers responded to the Survey, though only to some questions, as some of the questions were pertinent only to direct writers. We received 38 responses to this Survey, which was conducted during June and July of 2008. Some questions asked for commentary and provided space for respondents to freely type their answers. In such cases we have quoted these anonymous replies and they are reproduced in italics in this report. This Report refers to a number of tests which the reader may or may not be familiar with. A brief description of these tests can be found in Appendix B of this report. Appendix C contains a list of the participating companies. Caveat and Disclaimer We hope that these results prove useful for the industry. However, it should be noted that, while the data the Survey Subcommittee received was fairly comprehensive, it is by no means a look at the whole industry. This Survey is published by the Society of Actuaries (the SOA) and contains information based on input from companies engaged in the U.S. life insurance industry. The information published in this Survey was developed from actual historical information and does not include any projected information. The SOA and the participating companies do not recommend, encourage or endorse any particular use of the information reported in this Survey. The SOA makes no warranty, guarantee or representation whatsoever and assumes no liability or responsibility in connection with the use or misuse of this Survey. Please note that in very limited cases some careful editing of numerical responses was made when typographical errors in responses were obvious. The Society of Actuaries and the Subcommittee wish to thank all who responded to the Survey. The Subcommittee also thanks those who helped us review this document and offered helpful suggestions and comments. Finally, the Survey Subcommittee thanks a number of the Society of Actuaries staff for their help in completing this project, especially Jack Luff and Korrel Rosenberg, without whose help this could not have been completed.

3
Comments on this report and suggestions for future surveys are welcome and can be addressed to the Committee on Life Insurance Mortality and Underwriting Surveys c/o Jack Luff at the Society of Actuaries. Early Duration Claims Subcommittee of the SOA Committee on Life Insurance Mortality and Underwriting Surveys: Mark Swanson, Chair Al Klein Everett Kunzelman Lynn Ruezinsky Sharon Smith SOA Staff Liaison: John A. Luff SOA Research Liaison: Korrel E. Rosenberg

4
EXECUTIVE SUMMARY The following are the highlights from this Survey:
• The Survey had 38 respondents accounting for about 69% of US ordinary life face amounts issued and 35% of US ordinary life face amounts inforce according to figures from A.M. Best. (page 20)
• The Survey asked about the usage of questions on the application regarding a proposed insured’s past history. Topics included by more than 85% of the respondents were: aviation, avocation, depression, driving history, occupation, history of drug use or abuse, history of alcohol abuse, and felony convictions. (page 8)
• Regarding underwriting tests (page 10): o Used by all or all but one respondent: blood pressure, build, EKG, pulse. o Used by fewer than half the respondents: IADLs, ADLs, BMI, chest x-ray.
• Biggest decline in usage of a test between 2004 and 2008: chest x-ray declined from 12 respondents to 7. (page 13)
• Biggest increase in usage of a test between 2004 and 2008 (page 13): o Cognitive testing increased from 4 respondents to 19. o NT-proBNP increased from 0 respondents to 9. o eGFR increased from 8 respondents to 14. o Functional testing, ADLs and IADLs also increased.
• Considered the best indicators of early claims: o For ages 20-34: driving risk and alcohol/drug abuse. (page 15) o For ages 35-69: cancer and cardiovascular disease. (page 16) o For ages 70 and higher: cancer, cardiovascular disease, and cognitive
impairment. (pages 17-18) • Most common actual causes of early claims (page 45):
o For ages 20-34: motor vehicle accidents. o For all other ages: cancer.
• About half of the respondents did not have a claims committee. (page 22)

5
TABLE OF CONTENTS INTRODUCTION .......................................................................................................................... 2 EXECUTIVE SUMMARY ............................................................................................................ 4 SECTION 1: UNDERWRITING PRACTICES ............................................................................ 8
Table 1.1: Application Topics .................................................................................................... 8 Table 1.2: Examination Tests .................................................................................................. 10 Table 1.3: Blood Tests ............................................................................................................. 11 Table 1.4: Urine Tests .............................................................................................................. 12 Table 1.5: Application Questions and Other Tools ................................................................. 12 Table 1.6: Testing Trends ........................................................................................................ 13 Table 1.7: Other Tests Mentioned by Respondents ................................................................. 14 Table 1.8: Indicators of Early Claims for Issue Ages 20-34 .................................................... 15 Table 1.9: Indicators of Early Claims for Issue Ages 35-49 .................................................... 16 Table 1.10: Indicators of Early Claims for Issue Ages 50-69 .................................................. 17 Table 1.11: Indicators of Early Claims for Issue Ages 70+ ..................................................... 18
SECTION 2: CLAIMS PRACTICES .......................................................................................... 19 Table 2.1: Total Count of Inforce, New Business and Claims, For Years 2005, 2006 and 2007................................................................................................................................................... 19 Table 2.2: Total Face Amount Inforce, New Business and Claims, For Years 2005, 2006 and 2007 (000 omitted) .................................................................................................................... 19 Table 2.3: Mean, Minimum and Maximum of Individual Company Average Amounts (face)................................................................................................................................................... 20 Table 2.4: Claim Investigation Practices Vary by the Following Factors ............................... 21 Table 2.5: Claims Committee .................................................................................................. 22 Table 2.6: Disciplines Represented on Claims Committee ..................................................... 22 Table 2.7: Inforce Policies Rescinded Prior to Claim during 2006 or 2007 ............................ 22 Table 2.8: Denied a Claim beyond Contestable Period during 2006 or 2007 ......................... 23 Table 2.9: Percentage of Claims (by Count) Settled for a Given Amount .............................. 24 Table 2.10: Percentage of Face Amount Paid on Claims Settled for Less than Face Amount 24
SECTION 3: HOW RESULTS ARE STUDIED ......................................................................... 25 Table 3.1: How Often Early Claim History is Studied ............................................................ 25 Table 3.2: Measures Used to Study Early Duration Claim Experience ................................... 26 Table 3.3: Suggestions for Reducing / Controlling Early Duration Claims ............................ 27
SECTION 4: MORTALITY ........................................................................................................ 28 Table 4.1: Total Experience for Durations 1-5, Issue Ages 20+, Issue Years 2000-2007....... 28 Chart 4.1 – Distribution of Exposure by Duration Group ........................................................ 29 Chart 4.2 – Distribution of Claims by Duration Group ............................................................ 29 Table 4.2: Experience for Durations 1-5, Issue Ages 20+, Issue Years 2000-2007 by Duration Group - Average Face Amount Exposed (000) ........................................................................ 30 Table 4.3: Experience for Durations 1-5, Issue Ages 20+, Issue Years 2000-2007 by Duration Group - Average Face Amount of Claims (000) ...................................................................... 30 Table 4.4: Experience for Durations 1-5, Issue Ages 20+, Issue Years 2000-2007 by Duration Group - Ratio Average Face Amount of Claims to Average Face Amount Exposed .............. 31 Table 4.5: Experience for Durations 1-5, Issue Ages 20+, Issue Years 2000-2007 by Duration Group - Mortality Rate Based on Number of Claims (per 1,000) ............................................ 31

6
Table 4.6: Experience for Durations 1-5, Issue Ages 20+, Issue Years 2000-2007 by Duration Group - Mortality Rate Based on Face Amount of Claims (per 1,000) .................................... 31 Chart 4.3 – Distribution of Exposure by Issue Year Group ...................................................... 32 Chart 4.4 – Distribution of Claims by Issue Year Group ......................................................... 32 Table 4.7: Experience for Durations 1-5, Issue Ages 20+, Issue Years 2000-2007 by Issue Year Group - Average Face Amount Exposed (000) ................................................................ 33 Table 4.8: Experience for Durations 1-5, Issue Ages 20+, Issue Years 2000-2007 by Issue Year Group - Average Face Amount of Claims (000) .............................................................. 33 Table 4.9: Experience for Durations 1-5, Issue Ages 20+, Issue Years 2000-2007 by Issue Year Group – Ratio Average Face Amount of Claims to Average Face Amount Exposed ..... 33 Table 4.10: Experience for Durations 1-5, Issue Ages 20+, Issue Years 2000-2007 by Issue Year Group - Mortality Rate Based on Number of Claims (per 1000) .................................... 34 Table 4.11: Experience for Durations 1-5, Issue Ages 20+, Issue Years 2000-2007 by Issue Year Group - Mortality Rate Based on Face Amount of Claims (per 1000) ............................ 34 Chart 4.5 – Distribution of Exposure by Issue Age Group ....................................................... 35 Chart 4.6 – Distribution of Claims by Issue Age Group ........................................................... 35 Table 4.12: Experience for Durations 1-5, Issue Ages 20+, Issue Years 2000-2007 by Issue Age Group - Average Face Amount Exposed (000) ................................................................. 36 Table 4.13: Experience for Durations 1-5, Issue Ages 20+, Issue Years 2000-2007 by Issue Age Group - Average Face Amount of Claims (000) ............................................................... 36 Table 4.14: Experience for Durations 1-5, Issue Ages 20+, Issue Years 2000-2007 by Issue Age Group - Ratio Average Face Amount of Claims to Average Face Amount Exposed ....... 36 Table 4.15: Experience for Durations 1-5, Issue Ages 20+, Issue Years 2000-2007 by Issue Age Group - Mortality Rate Based on Number of Claims (per 1000)...................................... 37 Table 4.16: Experience for Durations 1-5, Issue Ages 20+, Issue Years 2000-2007 by Issue Age Group - Mortality Rate Based on Face Amount of Claims (per 1000) ............................. 37 Chart 4.7 – Distribution of Exposure by Sex ............................................................................ 38 Chart 4.8 – Distribution of Claims by Sex ................................................................................ 38 Table 4.17: Experience for Durations 1-5, Issue Ages 20+, Issue Years 2000-2007 by Sex - Average Face Amount Exposed (000) ...................................................................................... 39 Table 4.18: Experience for Durations 1-5, Issue Ages 20+, Issue Years 2000-2007 by Sex - Average Face Amount of Claims (000) .................................................................................... 39 Table 4.19: Experience for Durations 1-5, Issue Ages 20+, Issue Years 2000-2007 by Sex - Ratio Average Face Amount of Claims to Average Face Amount Exposed ............................ 39 Table 4.20: Experience for Durations 1-5, Issue Ages 20+, Issue Years 2000-2007 by Sex - Mortality Rate Based on Number of Claims (per 1,000) .......................................................... 40 Table 4.21: Experience for Durations 1-5, Issue Ages 20+, Issue Years 2000-2007 by Sex - Mortality Rate Based on Face Amount of Claims (per 1,000) ................................................. 40 Chart 4.9 – Distribution of Exposure by Rating/Tobacco Class ............................................... 41 Chart 4.10 – Distribution of Claims by Rating/Tobacco Class ................................................ 41 Table 4.22: Experience for Durations 1-5, Issue Ages 20+, Issue Years 2000-2007 by Preferred Status/Tobacco Class - Average Face Amount Exposed (000) ................................ 42 Table 4.23: Experience for Durations 1-5, Issue Ages 20+, Issue Years 2000-2007 by Preferred Status/Tobacco Class - Average Face Amount of Claims (000) .............................. 42

7
Table 4.24: Experience for Durations 1-5, Issue Ages 20+, Issue Years 2000-2007 by Preferred Status/Tobacco Class - Ratio Average Face Amount of Claims to Average Face Amount Exposed ....................................................................................................................... 43 Table 4.25: Experience for Durations 1-5, Issue Ages 20+, Issue Years 2000-2007 by Preferred Status/Tobacco Class - Mortality Rate Based on Number of Claims (per 1000) ..... 43 Table 4.26: Experience for Durations 1-5, Issue Ages 20+, Issue Years 2000-2007 by Preferred Status/Tobacco Class - Mortality Rate Based on Face Amount of Claims (per 1000)................................................................................................................................................... 43 Table 4.27: Cause of Death All Issue Years, Issue ages 20+, Durations 1-5 .......................... 44 Table 4.28: Cause of Death by Issue Era (Issue ages 20+, Durations 1-5) ............................. 45 Table 4.29: Cause of Death by Issue Age Group (Issue Years 2000-07, Durations 1-5) ........ 45 Table 4.30: Age at Death from the 2006 CDC (Table 9) ......................................................... 46 Table 4.31: Cause of Death by Duration (Issue Years 2000-07, Issue ages 20+) ................... 47 Table 4.32: Cause of Death by Sex (Issue years 2000-07, Issue Ages 20+, Durations 1-5) ... 48 Table 4.33: Cause of Death by Underwriting Class Issue Yrs 2000-07, Duration 1-5............ 48 Table 4.34: Cause of Death Range of Responses .................................................................... 49
Appendix A – Survey Questions................................................................................................... 50 Appendix B – Test Definitions ..................................................................................................... 58 Appendix C – Participating Companies ........................................................................................ 60

8
SECTION 1: UNDERWRITING PRACTICES The Survey began by asking about topics that were included on the respondent’s life insurance application to identify potential early death claims. Participants were asked to identify all topics that were on their application. Some companies ask their applicants about past history of topics (e.g., aviation). Others ask about planned future activity of these same activities. Some companies ask about both past history and future plans. The Survey asked about which of these (past history and/or future activity) companies inquired about on their applications to identify potential accidental death, suicide, or homicide risk. The Survey asked the respondents to indicate whether the topic was on the application, or if not, whether or not they were considering adding the topic to their application. Table 1.1 summarizes the responses with respect to the applicant’s past history and future plans.
Table 1.1: Application Topics
Topic Question About Applicant Considering? # of
Respondents Past History Future Plans Yes No Aviation 36 23 0 0 36 Avocations 36 22 0 0 36 Depression 34 2 0 2 36 Driving 34 0 0 2 36 Occupation 32 3 1 0 35 Drug Abuse 32 5 1 3 36 Alcohol Abuse 31 2 1 3 35 Drug Use 31 0 1 3 35 Felony Convictions 31 0 3 2 36 Alcohol Use 21 7 4 9 36 Bankruptcy 18 2 5 10 36 Foreign Travel 17 27 2 4 36 Other - Military Service 2 2 0 0 2 Other - IADL 1 0 0 0 1 Other - Premium Financing 1 0 1 0 1 The top nine past history activities in Table 1.1 were asked by at least 31 (86%) of the respondents. Alcohol use and bankruptcy had the most disparity of responses. These were the next two below those asked by at least 86% of the respondents and were the top two topics being considered, as well as the top two topics not being considered by the respondents. The use of future plans was less prevalent than the use of past history in underwriting topics related to early duration claims. Only three topics had future plans asked about by more than half of the respondents: Foreign travel, aviation, and avocation; and none of these were asked about by more than 75% of the respondents (compared to nine past history topics being asked about by over 86% of the respondents).

9
Comments from Survey respondents:
• Note: We are a reinsurer and answers reflect our overall client response as best we can determine;
• We ask about current use of alcohol and drugs in a teleunderwriting interview but not on the application;
• We ask about Foreign Travel plans in all states but only use the information in underwriting in the states we are allowed to;
• Occupation - Ask current occupation; • For drugs and alcohol, do not exactly ask about use or abuse. Ask if physician consulted,
treatment, or conviction for the use or possession of any substances; • Regarding bankruptcy, we ask about this on the agent's report and follow-up
questionnaire but not on the application. Regarding depressions, we have a question about mental disorders on our application but do not specifically mention depression. We do ask about depression on our follow-up questionnaire. Regarding felony convictions, we have a question on our application about a criminal record but do not specifically mention felonies. Felony convictions are asked about on the follow-up questionnaire, however. Regarding occupation, we only ask about current occupation--not past or future;
• Foreign Travel question used except where prohibited by legislation; and • Conceptually some may argue that out living expectation may invite criminal action if
financial pressures develop for the buyers of these policies.

10
Next, the Survey asked what tests and data were used or were under consideration for use in the underwriting process. The tests and data were divided into four groups: examination (Table 1.2), blood (Table 1.3), urine (Table 1.4) and the application and/or other sources (Table 1.5). In addition, the Survey asked about when these tests or data were used for each year from 2004 through 2008, and if the tests or data were used for some or all adult issue ages.
Table 1.2: Examination Tests
Test
Used Years Adult Ages Considering?
# of Respondents All Some All Some Yes No Blood Pressure 36 33 0 24 3 0 0 36 Build 35 32 0 25 0 0 1 36 EKG 35 27 1 6 24 0 1 36 Pulse 35 31 0 19 6 0 1 36 Treadmill EKG 31 27 0 2 27 0 4 34 Cognitive 24 4 15 2 19 10 3 36 Functional 17 4 11 1 15 10 7 34 IADLs 17 4 10 1 13 10 8 35 ADLs 16 6 10 2 16 12 2 34 BMI 15 11 2 11 1 9 10 34 Chest X-ray 14 7 5 1 11 0 21 34
The top five examination tests listed in Table 1.2 above were all used by at least 91% of the respondents. Some respondents did not indicate the years they had used the test, but noted that either all adult ages or limited adult ages were tested.

11
Table 1.3 displays the results for blood tests.
Table 1.3: Blood Tests
Test
Used Years Ages Considering?
# of RespondentsAll Some All Some Yes No A1c 36 28a 2 12 16 0 1a 36 Alkaline Phosphatase 36 32 0 21 6 0 0 36 Cholesterol 36 32 0 22 6 0 0 36 Cholesterol/HDL Ratio 36 32 0 22 6 0 0 36 GGTP 36 31 1 22 6 0 0 36 HDL 36 32 0 22 6 0 0 36 Triglycerides 36 32 0 22 6 0 0 36 AST/ALT 35 31 0 22 4 0 0 35 PSA 35 28 2 2 27 0 0 35 Serum albumin 34 31 0 21 6 0 1 35 LDL 34 30 0 22 5 0 1 35 Total Protein 33 30 0 21 6 0 1 34 Globulin 30 27 0 19 5 0 5 35 CDT 30 23 1 10 16 2 4 36 eGFR 17 8 7 8 7 6 13 34 Hemoglobin 16 9 2 5 8 5 13 34 CBC 15 10 1 2 10 5 14 34 NT-proBNP 14 0 9 2 11 13 8 36 HAA 12 8 0 5 5 3 19 34 Blood Alcohol 12 7 3 2 8 2 21 35 Apolipoprotein 7 5 0 4 1 2 21 32 hsCRP 7 2 1 2 4 6 22 35 CEA 6 1 4 1 4 11 18 35
a One respondent who had reported data for all years reported that they were reconsidering use of A1c. The top nine blood tests listed in Table 1.3 above were used by all respondents. The two that are most under consideration are NT-proBNP and CEA, which are relatively new screening tools.
12
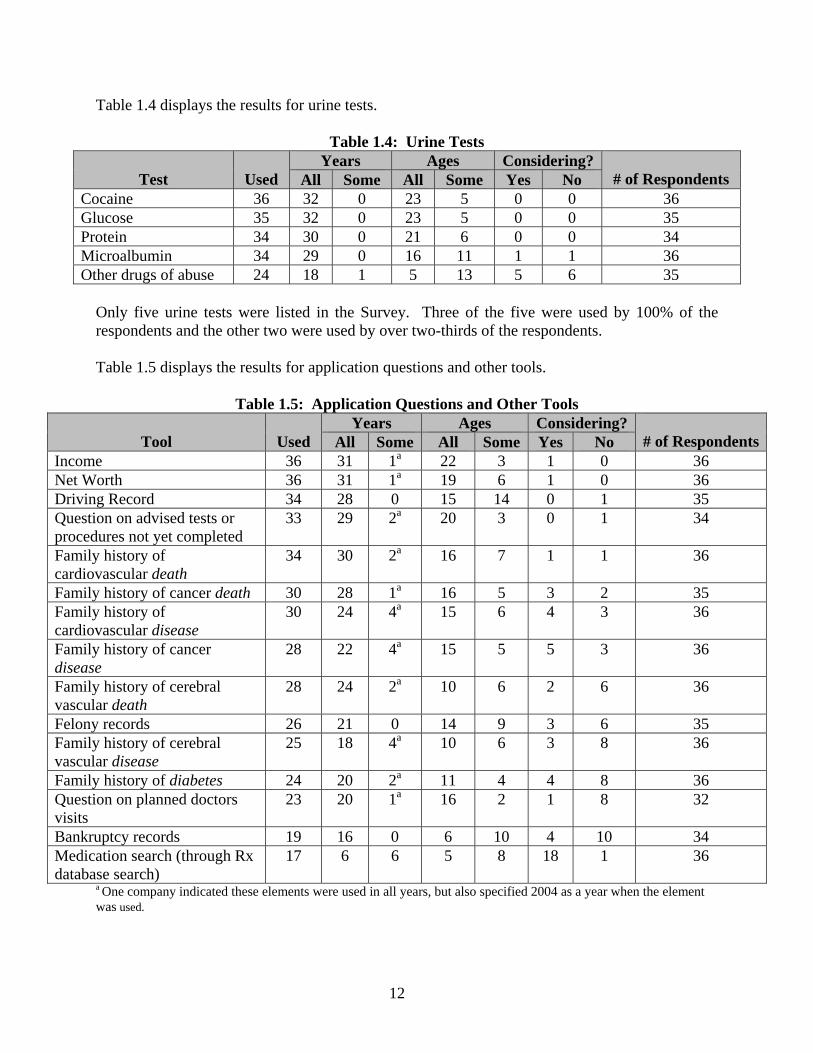
Table 1.4 displays the results for urine tests.
Table 1.4: Urine Tests
Test
Used Years Ages Considering?
# of Respondents All Some All Some Yes No Cocaine 36 32 0 23 5 0 0 36 Glucose 35 32 0 23 5 0 0 35 Protein 34 30 0 21 6 0 0 34 Microalbumin 34 29 0 16 11 1 1 36 Other drugs of abuse 24 18 1 5 13 5 6 35
Only five urine tests were listed in the Survey. Three of the five were used by 100% of the respondents and the other two were used by over two-thirds of the respondents. Table 1.5 displays the results for application questions and other tools.
Table 1.5: Application Questions and Other Tools
Tool
Used Years Ages Considering?
# of RespondentsAll Some All Some Yes No Income 36 31 1a 22 3 1 0 36 Net Worth 36 31 1a 19 6 1 0 36 Driving Record 34 28 0 15 14 0 1 35 Question on advised tests or procedures not yet completed
33 29 2a 20 3 0 1 34
Family history of cardiovascular death
34 30 2a 16 7 1 1 36
Family history of cancer death 30 28 1a 16 5 3 2 35 Family history of cardiovascular disease
30 24 4a 15 6 4 3 36
Family history of cancer disease
28 22 4a 15 5 5 3 36
Family history of cerebral vascular death
28 24 2a 10 6 2 6 36
Felony records 26 21 0 14 9 3 6 35 Family history of cerebral vascular disease
25 18 4a 10 6 3 8 36
Family history of diabetes 24 20 2a 11 4 4 8 36 Question on planned doctors visits
23 20 1a 16 2 1 8 32
Bankruptcy records 19 16 0 6 10 4 10 34 Medication search (through Rx database search)
17 6 6 5 8 18 1 36
a One company indicated these elements were used in all years, but also specified 2004 as a year when the element was used.

13
The top six questions/tools listed were used by over 85% of the respondents and all but one of the questions/tools was used by over half of the respondents. The one tool that was used by less than half of the respondents was a medication search (through an Rx database search) and this was being considered by all but one respondent who was not already using it. This is a relatively new screening tool for life insurance. Table 1.6 shows all tests for which there was a change by four or more users between 2004 and 2008.
Table 1.6: Testing Trends
Test Respondents Using By Year
2004 2005 2006 2007 2008 Cognitive 4 5 8 12 19 Functional 4 5 7 10 15 IADL 4 4 7 8 14 ADL 6 7 7 9 15 Chest X-ray 12 11 10 8 7 eGFR 8 8 11 10 14 NT-proBNP 0 0 0 4 9 Medication search (through Rx database search) 6 6 8 8 10
The general trend was toward greater use of tests. The biggest increases were on tests related to the older age market. The biggest increases happened between 2007 and 2008. The most substantial overall increase in number of respondents reporting use of a test between 2004 and 2008 was in cognitive testing. The chest x-ray was the only test that showed a decline in utilization by the respondents. Comments from Survey respondents:
• Requirements we order in an ad hoc basis vs screening:-Cognitive tests-CBC-PSA-Drug Screen;
• Some of the tests are used at specific amounts, not just specific ages; • A1c, CDT, Microalbumin are reflexed or requested due to medical history; • Some of the tests being used only on certain cases, delineated by criteria other than age; • Just discontinued Chest x-ray and CBC. Some of our tests are age limited or reflexed off
of other test values. CDT and Microalbumin – reflex; • Net worth is only asked about for business insurance. I was unsure how to fill out the
"family history" questions as we ask a general question about family history but do not ask the specifics mentioned above;
• CBC, CDT, HAA and other drugs of abuse are used when deemed necessary by the underwriter. HBA1c and microalbumin are reflex tests that are performed by the lab when certain values exist; for instance a fasting glucose of 140 will prompt the lab to reflex HBA1c and if HBA1c is normal, a microalbumin test will be performed on the urine. We also reflex to free PSA. For driving records, we have been obtaining records

14
for all ages/amount since 1/2005. Prior to 1/2005, we only obtained records for amounts $500,000+;
• Some of the tests are order on an ad hoc basis but not on every client i.e. blood alcohol, CBC;
• Some tests obtained on a discretionary basis; • As a reinsurer we see all variations with certain commonalities. Many tests are requested
for cause only as they should be; and • Information obtained by our clients varies with age, amount applied for. Note we are a
Reinsurer. Several companies mentioned that tests were “reflexed” from another test. For example, a high serum glucose blood result might lead to an A1c test being performed. Others mentioned that some tests would be ordered “for cause” or on a “discretionary basis,” meaning that the proposed insured’s medical history or some other test result prompted the additional test. A point was made by a few companies that face amount, as well as age, dictated the use of some tests. In the next question, the Survey asked if other tests or data were used to detect the probability of early claims that were not mentioned already. Eight different respondents provided 16 different tests, data and tools, which are listed in Table 1.7.
Table 1.7: Other Tests Mentioned by Respondents
Tool Years Ages
All Some All Some Cotinine (Nicotine) 5 0 5 0 Hepatitis B, BS Ag, BE 4 0 1 3 Hepatitis C 3 0 1 2 BUN 2 0 1 1 Creatinine 2 0 2 0 HIV 2 0 2 0 Beta Blockers 1 0 1 0 Bilirubin 1 0 0 1 Chest/Abdomen Measurements (males) 1 0 1 0 Free PSA 1 0 0 1 Fructosamine 1 0 1 0 Inspection Report 1 0 0 1 Leukocyte Esterase 1 0 1 0 MD Exams 1 0 0 1 Thiazide Diuretics 1 0 1 0 Internet Searches 0 1 1 0

15
The most common responses were cotinine (nicotine) testing and hepatitis B and C markers. While these are legitimate responses, they were not included in our list of tests and data, as our focus was early duration claims. If provided with these options, other respondents might have reported using these tests as well. The Survey then asked respondents to list any tests or tools they would like to use, but that they did not use, and state the reasons why they did not use it. Because only two respondents answered this question, the results are not included in this report. Respondents were asked to rank the conditions that were, in their opinion, the best indicators of early claims. The Survey listed 22 conditions with the option to list other conditions and asked for the rankings to be provided for four age groups. Thirty respondents answered this question. The responses are provided in Tables 1.8 through 1.11.
Table 1.8: Indicators of Early Claims for Issue Ages 20-34
Condition
Total Responses Ranking
1 2 3 4 5 Driving Risk 29 12 9 4 2 2 Alcohol/Drug Abuse 28 12 5 5 4 2 Risk-Taking Activities/Hobbies 23 2 6 9 4 2 Hazardous Occupation 13 1 1 3 2 6 Cancer 12 1 0 2 6 3 Smoking 9 0 5 1 1 2 Cardiovascular Disease 7 1 0 0 2 4 Diabetes 6 1 0 0 2 3 Build – Obesity 6 0 0 3 1 2 Other – Suicide, Mental Illness 3 0 1 1 0 1 Multiple Impairments 3 0 0 1 2 0 Active Lifestyle/Social Interaction 2 0 0 1 1 0 Build – Underweight 2 0 0 0 2 0 Other - Drugs/Illegal Activity 1 1 0 0 0 0 Other - Psychiatric 1 0 1 0 0 0 Cerebrovascular Disease 1 0 0 0 0 1 Infection or Inflammation 1 0 0 0 0 1 Kidney Disease 1 0 0 0 0 1 Other - Depression 1 0 0 0 0 1 Anemia 0 0 0 0 0 0 Cognitive Impairment 0 0 0 0 0 0 COPD 0 0 0 0 0 0 Frailty 0 0 0 0 0 0 Hypertension 0 0 0 0 0 0 Lipid Disorders 0 0 0 0 0 0 Malnutrition 0 0 0 0 0 0

16
In the 20-34 age group, the top responses were generally related to lifestyle risk factors, which can lead to an early accidental death.
Table 1.9: Indicators of Early Claims for Issue Ages 35-49
Condition
Total Responses Ranking
1 2 3 4 5 Cardiovascular Disease 24 3 7 5 4 5 Cancer 21 9 2 3 5 2 Alcohol/Drug Abuse 20 5 4 3 5 3 Driving Risk 15 1 3 6 0 5 Diabetes 13 0 4 0 5 4 Risk-Taking Activities/Hobbies 11 3 2 0 3 3 Build – Obesity 10 4 1 5 0 0 Multiple Impairments 7 3 1 0 1 2 Smoking 6 2 1 2 1 0 Hypertension 6 0 1 2 1 2 Cerebrovascular Disease 3 0 0 1 1 1 Build – Underweight 2 0 2 0 0 0 Kidney Disease 2 0 1 0 0 1 Other - Suicide, Mental Illness 2 0 0 1 1 0 Infection or Inflammation 2 0 0 1 0 1 COPD 2 0 0 0 0 2 Other – Accidents 1 0 0 1 0 0 Hazardous Occupation 1 0 0 0 1 0 Lipid Disorders 1 0 0 0 1 0 Other - Criminal Association/Homicide 1 0 0 0 0 1 Active Lifestyle/Social Interaction 0 0 0 0 0 0 Anemia 0 0 0 0 0 0 Cognitive Impairment 0 0 0 0 0 0 Frailty 0 0 0 0 0 0 Malnutrition 0 0 0 0 0 0
Moving from the 20-34 age group to the 35-49 age group, one can observe a general shift from lifestyle risk factors to medical risk factors. The top responses were cardiovascular disease, cancer and alcohol/drug abuse.

17
Table 1.10: Indicators of Early Claims for Issue Ages 50-69
Condition
Total Responses Ranking
1 2 3 4 5 Cardiovascular Disease 29 17 7 1 2 2 Cancer 23 7 13 2 0 1 Cerebrovascular Disease 17 0 2 10 2 3 Diabetes 15 0 1 8 4 2 Multiple Impairments 14 3 0 3 3 5 Smoking 8 2 0 2 2 2 COPD 7 0 0 1 2 4 Build – Obesity 6 1 2 0 3 0 Alcohol/Drug Abuse 6 0 0 0 4 2 Kidney Disease 4 0 1 0 2 1 Hypertension 4 0 0 1 0 3 Cognitive Impairment 3 0 1 2 0 0 Frailty 3 1 0 0 2 0 Build – Underweight 2 0 2 0 0 0 Lipid Disorders 2 0 0 0 1 1 Driving Risk 2 0 0 0 0 2 Anemia 1 0 0 0 1 0 Infection or Inflammation 1 0 0 0 0 1 Malnutrition 1 0 0 0 0 1 Other – Accidents 1 0 0 0 0 1 Risk-Taking Activities/Hobbies 1 0 0 0 0 1 Active Lifestyle/Social Interaction 0 0 0 0 0 0 Hazardous Occupation 0 0 0 0 0 0
In the 50-69 age group, more of the top responses were medically related. Those responses included cardiovascular disease, cancer, cerebrovascular disease and diabetes. Note the relative unimportance of lifestyle risk factors in this age group.

18
Table 1.11: Indicators of Early Claims for Issue Ages 70+
Condition
Total Responses Ranking
1 2 3 4 5 Cardiovascular Disease 22 11 5 0 5 1 Cognitive Impairment 22 4 5 3 5 5 Cancer 19 5 7 3 3 1 Frailty 18 7 5 0 2 4 Multiple Impairments 14 1 0 4 5 4 Cerebrovascular Disease 13 0 3 7 2 1 Build – Underweight 8 1 2 3 1 1 COPD 6 0 0 3 2 1 Active Lifestyle/Social Interaction 5 1 1 0 0 3 Malnutrition 5 0 1 2 0 2 Infection or Inflammation 5 0 0 0 2 3 Driving Risk 4 0 0 1 1 2 Smoking 3 0 0 3 0 0 Kidney Disease 3 0 0 0 0 3 Anemia 1 0 0 1 0 0 Alcohol/Drug Abuse 1 0 0 0 1 0 Diabetes 1 0 0 0 0 1 Build – Obesity 0 0 0 0 0 0 Hazardous Occupation 0 0 0 0 0 0 Hypertension 0 0 0 0 0 0 Lipid Disorders 0 0 0 0 0 0 Risk-Taking Activities/Hobbies 0 0 0 0 0 0
In the 70+ age group, the top responses were cardiovascular disease, cognitive impairment, cancer and frailty. Note the significance of frailty and cognitive impairment in this age group.

19
SECTION 2: CLAIMS PRACTICES The Survey asked companies to provide inforce, new business and claims volumes by number of policies and face amount for the years 2005, 2006 and 2007. Thirty-one companies provided some data for this section. Please note that not every company contributed data to every row, nor to every column, therefore certain rows may not add up the way a reader might expect. The first two tables display the totals across all respondents. Table 2.1 shows total claims by count and Table 2.2 shows total claims by amount.
Table 2.1: Total Count of Inforce, New Business and Claims, For Years 2005, 2006 and 2007 2005 2006 2007
A. Inforce at Beginning of Year 59,661,287 62,323,995 67,133,458B. New Business Issued During Year 3,779,698 3,490,669 3,864,692C. Claims Reported During Year 604,201 666,069 700,587D. Incontestable Claims Reported 591,247 657,632 690,808E. Contestable Claims Reported 6,105 5,545 7,046F. Contestable Claims Paid Without Contest
3,123 2,476 3,995
G. Claims Contested, i.e., Declined, Rescinded, Litigated or Other Resistance
713 736 664
H. Contestable Claims Where a Decision Has Not Yet Been Made Whether to Pay or Resist
297 317 443
Table 2.2: Total Face Amount Inforce, New Business and Claims, For Years 2005, 2006
and 2007 (000 omitted) 2005 2006 2007
A. Inforce at Beginning of Year 6,617,273,350 7,619,876,603 8,536,215,679B. New Business Issued During Year 788,977,180 860,494,010 1,428,848,235C. Claims Reported During Year 16,291,018 18,350,708 20,989,504D. Incontestable Claims Reported 13,377,170 15,028,102 17,378,475E. Contestable Claims Reported 671,245 869,601 897,532F. Contestable Claims Paid Without Contest
456,732 531,650 497,604
G. Claims Contested, i.e., Declined, Rescinded, Litigated or Other Resistance
61,270 118,075 125,074
H. Contestable Claims Where a Decision Has Not Yet Been Made Whether to Pay or Resist
10,309 63,092 158,880

20
The total US life industry issued $1.9 trillion in ordinary life during 2007 according to the A. M. Best 2008 Statistical Study (excerpts published in BestWeek July 14, 2008). Respondents other than reinsurers1, therefore, represented about 69% of new business issued during 2007. Moreover, according to the A.M. Best 2007 Statistical Study (excerpts published in BestWeek August 27, 2007), the total US life industry had $24.5 trillion ordinary life in force in 2006. Comparing this to the respondents’ 2007 beginning-of-year inforce, the respondents’ companies accounted for about 35% of the industry’s inforce. The average size of each measure was calculated for each respondent. Then the mean of the average sizes was calculated. Those means are displayed in Table 2.3. For example, each respondent’s total claim amount per 1,000 inforce was calculated. The mean of the results across respondents is reported in the first row of the table. For this table, partial responses have been ignored so that no respondent contributes to the numerator without contributing to the denominator, and vice versa. The minimum and maximum in the table are across all years and all respondents.
Table 2.3: Mean, Minimum and Maximum of Individual Company Average Amounts (face)
Mean Range 2005 2006 2007 Min Max
Total Claims During Year Per 1,000 Inforce at Beginning of Year 3.06 3.02 3.07 0.36 7.84
Contestable Claims Reported Per 1,000 New Business in Prior Year NA 0.35 0.32 0.06 3.26
Contestable Claims Reported as a Percentage of All Claims 14% 11% 13% 0% 100%
Claims Contested, i.e., Declined, Rescinded, Litigated or Other Resistance 12% 14% 11% 0% 64%
Contestable Claims Where a Decision Has Not Yet Been Made Whether to Pay or Resist 3% 9% 14% 0% 66%
Average Size Policy Inforce (000) 154 164 170 46 573 Average Size Policy Issued (000) 425 418 465 45 2,272 Average Size Claim (000) 73 71 76 4 392 Average Size Contestable Claim (000) 310 388 467 16 2,927 Average Size Incontestable Claim (000) 73 70 73 4 399
Contestable claims tend to be significantly larger than incontestable claims. This is primarily due to the fact that contestable claims are on very recently issued business, and the general trend in the US life insurance market is toward larger face amount policies. However, the relationship between average policy issued and average policy inforce (new business being issued at around 3 times the face amount of inforce business) suggests that this is only part of the explanation since the size of the average contestable claim is around 4 to 6 times the size of the average claim.
1 Since the survey data were anonymous, the Subcommittee found the amounts issued by reinsurer respondents in 2007 in the 2008 Munich American/SOA Life Reinsurance Survey. Bests’ data for amounts inforce include reinsurer data, hence no adjustment was necessary for inforce.

21
Contestable claims being larger than incontestable claims could also be affected by anti-selection. The respondents were asked if their claims investigation practices varied by certain factors.
Table 2.4: Claim Investigation Practices Vary by the Following Factors Yes # of Respondents
Location at Death 17 34 Cause of Death 14 34 Face Amount 6 35 Issue Age 6 35 Policy Status (e.g., Limited Pay, Paid Up) 4 34 Age at Death 3 34 Other (please specify in comment box) 3 25
Location at death and cause of death were the two most frequently cited factors for varying claims investigation practices. The only “Other” factor specified was whether a policy was in the contestable period or not. Comments from Survey participants:
• Accidental deaths occurring in the contestable period is not fully investigated unless circumstances warrant;
• All contestable claims are investigated. We may ask for different information depending on Cause of Death, location, etc;
• All of the factors may influence the depth, breadth and direction of an investigation; • Deaths that occur in a foreign country may require additional documentation along with
English translations where applicable; • Foreign death may have limited investigation depending on location; • Investigate cause of death if homicide, investigate location at death if foreign; • May use outside investigative firm for claims over $250,000; • Prior to 2006, contestable death investigations where the manner of death was clearly
accidental did not pursue medical records to rule out material misrepresentation because the frequency of misrepresentation on clear cut accident cases was minimal;
• The response assumes that the question pertains to contestable death claims (not to other investigated claims such as foreign deaths and ADB) and reflects current 2008 practices; and
• We do not investigate a contestable first death on a second-to-die policy, if that insured was rated uninsurable.

22
The Survey asked respondents if their company had a claims committee.
Table 2.5: Claims Committee Yes # of Respondents
Claims Committee 19 37 More than half of the respondents had a claims committee. Of the 19 respondents indicating they had a claims committee, the Survey asked which disciplines were represented and whether each was regularly present or only as required.
Table 2.6: Disciplines Represented on Claims Committee Discipline Regularly As Required
Claims 16 2 Legal 16 2 Underwriting 13 3 Actuarial 3 6 Administration/Policy Owner Service 3 3 Executive 3 1 Compliance 1 8 Medical 1 8 Sales/Marketing 1 6 CFO 1 2 COO 1 2 CEO 0 5 Other (Internal Audit - No Formal Committee) 1
Almost all of the respondents regularly involved the claims, legal and underwriting disciplines in their claims committee. Almost half of the respondents regularly, or as required, included the actuarial, compliance and medical disciplines in their claims committee. Interestingly, one respondent did not indicate that the claims discipline was represented on their committee. Respondents were asked if, during 2006 or 2007, they rescinded any inforce policy prior to claim.
Table 2.7: Inforce Policies Rescinded Prior to Claim during 2006 or 2007 Yes # of Respondents
Rescinded an Inforce Policy Prior to Claim in 2006 or 2007 18 34
More than half of respondents indicated during 2006 and 2007 they had rescinded an inforce policy prior to a claim.

23
Comments from Survey participants:
• Based on updates from Medical Information Bureau (MIB) we identified several claims that were termed "living rescissions". An investigation was completed followed up by a referral to the legal department and my understanding is the Policyholder Service issued the refund check;
• In 2006, we had 3 "live" rescissions where info was received after policy issue; • In-force policies can be "reformed” during the contestable period if a material
representation is discovered that resulted in issuing a policy differently than it would have otherwise. Examples include tobacco misrepresentation; and
• Inforce rescissions are the responsibility of the Underwriting Department as no claim is involved.
Respondents were asked whether they denied any claim during 2006 or 2007 which was incurred after the contestable period.
Table 2.8: Denied a Claim beyond Contestable Period during 2006 or 2007 Yes # of Respondents
Denied a Claim Beyond Contestable Period during 2006 or 2007 11 37 Approximately 30% of respondents indicated they had denied a claim that was beyond the contestable period in 2006 or 2007. Comments from Survey participants: • Assumption is that this question pertains to death claims where benefits were denied on the
basis of fraud at contract inception or misrepresentation beyond the contestable period; • For lapses and faked death; and • Yes. Typically, for contracts not in force due to non-payment of premium, or benefit
expiration prior to death, or fraudulent claims such as fabricated death certificates or fake foreign death claims.

24
The respondents were asked, of the claims contested in 2006, ignoring any interest paid, what percentage of claims by number was settled for each of a list of possible amounts. Twenty-three companies responded to this question and the results are summarized in Table 2.9 below.
Table 2.9: Percentage of Claims (by Count) Settled for a Given Amount
Mean
Response
Median
Response
Most Frequent Response
Maximum Response
A. Amount paid no greater than the minimum required by contract
58% 75% 100% 4 responses 100%
B. Amount paid more than the contractual minimum (A), but less than the full face amount of the contract
8% 1% 0% 11 responses 100%
C. An amount paid equal to the full face amount of the contract
31% 0% 0% 13 responses 100%
D. An amount paid more than the face amount of the contract
0% 0% 0% 21 responses 4%
E. Still unsettled 2% 0% 0% 17 responses 25%
Most claims contested in 2006 were settled for the contractual minimum and only two respondents indicated that they paid more than the face amount. The Survey asked, for those claims contested in 2006 for which the amount paid was more than the contractual minimum, but less than the full face amount (see item B in previous table), what the average percentage of the full face amount paid on these claims was. Nine companies responded to this question.
Table 2.10: Percentage of Face Amount Paid on Claims Settled for Less than Face Amount Minimum response 0% Median response 30% Mean response 38% Maximum response 95%
Comments from Survey participants:
• One claim was settled for $20,000 versus the $150,000 face amount; • Re questions 6 and 7 - n/a - we had no reported claims in 2006; and • We did not contest any claims in 2006.

25
SECTION 3: HOW RESULTS ARE STUDIED The Survey asked respondents how often they studied early duration claim history with respect to a number of different factors. The responses are shown below in Table 3.1.
Table 3.1: How Often Early Claim History is Studied
Factor
% of Respondents
# of Respondents
At least once in the last
year At least once in the last 2 years
At least once in the last 5
years
Not reviewed in last 5 years
As needed
Duration 78% 6% 0% 11% 6% 36 Face Amount 71% 6% 3% 9% 11% 35 Risk Class 70% 5% 3% 11% 11% 37 Age 70% 5% 3% 11% 11% 37 Gender 69% 6% 0% 14% 11% 35 Product 66% 9% 0% 14% 11% 35 Cause of Death 38% 6% 15% 29% 12% 34 Distribution Channel 30% 9% 9% 18% 33% 33 Producer 15% 6% 6% 33% 39% 33 Target Market 10% 3% 3% 41% 41% 29 Underwriter 3% 0% 7% 39% 52% 31 Other 39% 8% 8% 15% 31% 13
Duration was the factor most often studied at least once in the last year. Other factors studied at least once in the last year by at least 66% of the respondents were face amount, risk class, age, sex and product. In another recent SOA survey2, the top six responses to a question on the types of modifications made to the base pricing mortality table were the same as the top six from this Survey, with one exception. The other survey specifically asked about smoking status while this Survey asked about risk class, which could be interpreted as inclusive of smoking status. About a third of the respondents in this Survey indicated that they studied early duration claim results by cause of death and distribution channel at least once in the last year. Results by underwriter were studied the least, with 52% indicating they studied this only as needed and 39% indicating they had not studied this in the last five years.
2 Mortality Table Construction Survey (http://www.soa.org/research/individual-life/mort-table-con-report.aspx) conducted in July of 2006 and published in 2007.

26
Other factors respondents indicated they reviewed included issue year, study year, conversions, substandard, occupation, zip code/metropolitan area, automatic vs. facultative reinsurance and cedant. Comments from Survey participants:
• An ongoing study on early duration claims should be done, rather than infrequently in order to revise pricing structure and product. This is the part of the chief actuary function to offer viable products to public;
• Began looking at results by underwriter this year; • Tobacco status included in risk class; and • We study all of the factors listed above for business issued since 2000 when we
implemented a multiple preferred risk class structure. We do not specifically study durations 1-5 on a regular basis.
The Survey next asked which measures are used in studying early duration claims; results are shown in Table 3.2 below. The most commonly used measure was a study of the number of claims, followed closely by an actual/expected ratio and the face amount of early claims. The primary measure used was the actual/expected ratio (82%). Present value and ROI/ROE measures were used by only one respondent each.
Table 3.2: Measures Used to Study Early Duration Claim Experience % of Respondents
Measure Used Used as Primary** Number of Claims 92% 3% Actual / Expected 90% 82% Face Amt of Early Claims 84% 5% Other * 11% 0% Present Value of Future Profits 3% 0% ROI / ROE 3% 0%
Total # of Respondents 37 * Other included A/E by amount, gross and net of reinsurance and contestable claims vs. contestable inforce. One respondent mentioned that they survey the beneficiaries as to why the policy was purchased. ** The percentages do not add up to 100% because some did not indicate a primary measure.

27
The Survey asked respondents to provide one tip or suggestion to reduce or control early duration claims. Twelve companies responded. Responses fell into three broad categories (underwriting, distribution and experience studies) and have been grouped by those categories in the summary in Table 3.3 below.
Table 3.3: Suggestions for Reducing / Controlling Early Duration Claims Category Suggestion
Underwriting A sound understanding of the potential signs of anti-selection and a conservative underwriting stance when they are recognized Addition of measures to quantify heart disease risk Advise Underwriting to look carefully at unresolved medical issues and/or questionable financial cases, particularly in older age risks At older issue ages, it is important to accurately assess frailty to control early duration claims. Additionally, the value of the paramedical exam cannot be overemphasized Audit the underwriters. Many of the issues we see with early duration claims is due to uncontrolled business exceptions Disallow table shave programs with CAD, CBV or cancer risks Tighten underwriting guidelines
Distribution Closer monitoring of producers Improve agent persistency - Agents with four or five years of tenure produce much better business Prior relationship with the client, through existing P&C business. Limit walk-in business
Experience Studies Research study for eliciting this information should be conducted and updating the data and analysis
28
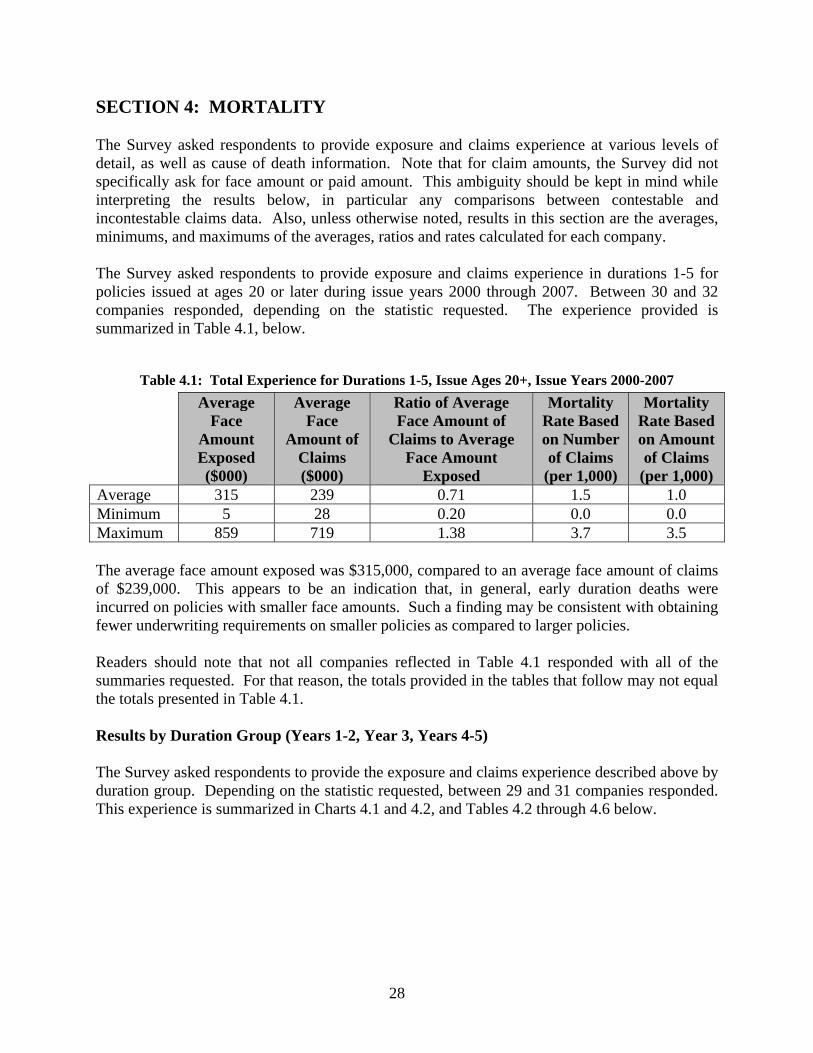
SECTION 4: MORTALITY The Survey asked respondents to provide exposure and claims experience at various levels of detail, as well as cause of death information. Note that for claim amounts, the Survey did not specifically ask for face amount or paid amount. This ambiguity should be kept in mind while interpreting the results below, in particular any comparisons between contestable and incontestable claims data. Also, unless otherwise noted, results in this section are the averages, minimums, and maximums of the averages, ratios and rates calculated for each company. The Survey asked respondents to provide exposure and claims experience in durations 1-5 for policies issued at ages 20 or later during issue years 2000 through 2007. Between 30 and 32 companies responded, depending on the statistic requested. The experience provided is summarized in Table 4.1, below.
Table 4.1: Total Experience for Durations 1-5, Issue Ages 20+, Issue Years 2000-2007
Average Face
Amount Exposed ($000)
Average Face
Amount of Claims ($000)
Ratio of Average Face Amount of
Claims to Average Face Amount
Exposed
Mortality Rate Based on Number of Claims
(per 1,000)
Mortality Rate Based on Amount of Claims
(per 1,000) Average 315 239 0.71 1.5 1.0 Minimum 5 28 0.20 0.0 0.0 Maximum 859 719 1.38 3.7 3.5 The average face amount exposed was $315,000, compared to an average face amount of claims of $239,000. This appears to be an indication that, in general, early duration deaths were incurred on policies with smaller face amounts. Such a finding may be consistent with obtaining fewer underwriting requirements on smaller policies as compared to larger policies. Readers should note that not all companies reflected in Table 4.1 responded with all of the summaries requested. For that reason, the totals provided in the tables that follow may not equal the totals presented in Table 4.1. Results by Duration Group (Years 1-2, Year 3, Years 4-5) The Survey asked respondents to provide the exposure and claims experience described above by duration group. Depending on the statistic requested, between 29 and 31 companies responded. This experience is summarized in Charts 4.1 and 4.2, and Tables 4.2 through 4.6 below.

29
Chart 4.1 – Distribution of Exposure by Duration Group
1-23
4-5
56%
19%25%
53%
20% 27%
0%
20%
40%
60%
80%
100%
Duration Group
% of TotalNumber ofPoliciesExposed
% of TotalFace AmountExposed
Chart 4.2 – Distribution of Claims by Duration Group
1-23
4-5
39%
23%
37%42%
22%36%
0%
20%
40%
60%
80%
100%
Duration Group
% of TotalNumber ofClaims
% of TotalFace Amountof Claims
Given the timing of the survey, experience for durations 3 through 5 (and to some extent, duration 2) was not available for all of the issue years requested. For example, for 2007 issues, only experience for the first duration and possibly the second duration (depending on each company’s reporting capabilities) were available when this Survey was conducted during the second quarter of 2008. Experience for later durations did not exist for 2007 issues at the time this Survey was conducted. That constraint was the largest driver of the distribution of exposed policies, with 53% reported for durations 1-2, 20% for duration 3, and 27% for durations 4-5.

30
The same held true for the distribution of face amount exposed, which follows the distribution of number of policies exposed fairly closely. The distribution of claims, both by number and face amount, did show a shift to later durations compared to the distribution of exposure. (Forty-two percent of the number of claims was incurred in durations 1-2 compared to 53% of the number of policies exposed in those durations.) This is an indication of a lower mortality rate in the first two durations, which is consistent with past industry studies and with expectations given recent underwriting and the effect of the incontestable clause. The distribution of the face amount of claims was very similar to the distribution of the number of claims.
Table 4.2: Experience for Durations 1-5, Issue Ages 20+, Issue Years 2000-2007 by Duration Group - Average Face Amount Exposed (000)
Durations 1-2 Duration 3 Durations 4-5 Total Average 352 333 314 333 Minimum 56 50 52 50 Maximum 1,059 838 779 1,059
The average face amount exposed reported decreases with increasing duration. This could be interpreted as an increasing average face amount exposed over more recent issue years.
Table 4.3: Experience for Durations 1-5, Issue Ages 20+, Issue Years 2000-2007 by Duration Group - Average Face Amount of Claims (000)
Durations 1-2 Duration 3 Durations 4-5 Total Average 254 273 244 257 Minimum 19 25 25 19 Maximum 756 787 731 787
*Note: Thirty-one companies responded with information regarding claims in durations 1-2. The highest average face amount of claims by duration group was $273,000, observed in duration 3. This finding suggests that one component of the spike in mortality rates at duration 3 (typically observed in industry mortality studies) is a greater severity of those claims, possibly as a result of anti-selection.

31
Table 4.4: Experience for Durations 1-5, Issue Ages 20+, Issue Years 2000-2007 by Duration Group - Ratio Average Face Amount of Claims to Average Face Amount Exposed Durations 1-2 Duration 3 Durations 4-5 Total Average 0.71 0.80 0.77 0.76 Minimum 0.24 0.18 0.32 0.18 Maximum 1.26 1.51 1.42 1.51
The ratio of average face amount of claims to average face amount exposed reported in Table 4.4 above is lower for durations 1-2 than for durations 3-5. This may be partially influenced by the reporting by some respondents of paid amounts as opposed to face amounts of contested claims, as described above. Contested claims are typically incurred in the first two durations. Table 4.4 also highlights a spike in the ratio of average face amount of claims to average face amount exposed in duration 3. This observation is consistent with the note above regarding the greater severity in duration 3 claims. This pattern can also be observed in Tables 4.5 and 4.6, below.
Table 4.5: Experience for Durations 1-5, Issue Ages 20+, Issue Years 2000-2007 by Duration Group - Mortality Rate Based on Number of Claims (per 1,000)
Durations 1-2 Duration 3 Durations 4-5 Total Average 1.1 1.7 2.1 1.6 Minimum 0.3 0.6 0.7 0.3 Maximum 3.1 4.6 5.4 5.4
The mortality rates reported above indicate a greater increase in mortality rates from durations 1-2 to duration 3 than from duration 3 to durations 4-5. Again, this finding is consistent with recent industry experience studies, which show a spike in duration 3.
Table 4.6: Experience for Durations 1-5, Issue Ages 20+, Issue Years 2000-2007 by Duration Group - Mortality Rate Based on Face Amount of Claims (per 1,000)
Durations 1-2 Duration 3 Durations 4-5 Total Average 0.7 1.3 1.5 1.2 Minimum 0.3 0.5 0.6 0.3 Maximum 2.8 4.4 4.9 4.9
*Note: Thirty-one companies responded with information regarding claims in durations 1-2. The mortality rates reported above based on face amount of claims are consistently lower than those reported based on number of claims. This is an indication of lower mortality at higher face amounts, where more underwriting requirements typically apply.

32
Results by Issue Era (2000-2003, 2004-2007) The Survey asked respondents to provide the exposure and claims experience described above in two separate issue year groups: issue years 2000-2003 and issue years 2004-2007. Depending on the statistic requested, between 28 and 32 companies responded. This experience is summarized in Charts 4.3 and 4.4, and Tables 4.7 through 4.11 below.
Chart 4.3 – Distribution of Exposure by Issue Year Group
2000-032004-07
67% 64%
33%36%
0%
20%
40%
60%
80%
100%
Issue Year Group
% of TotalNumber ofPoliciesExposed
% of TotalFace AmountExposed
Chart 4.4 – Distribution of Claims by Issue Year Group
2000-032004-07
69% 71%
31% 29%
0%
20%
40%
60%
80%
100%
Issue Year Group
% of TotalNumber ofClaims
% of TotalFace Amountof Claims

33
Results by issue year group are affected by the same constraint as the results by duration group as described above. Given the timing of the survey, five durations of experience were available for issue years 2000-2003, but not for issue years 2004-2007. That constraint was the largest driver of the distribution of exposed policies, with 67% reported for issue years 2000-03 vs. 33% reported for issue years 2004-07. The same holds true for the distributions of face amount exposed, number of claims and face amount of claims.
Table 4.7: Experience for Durations 1-5, Issue Ages 20+, Issue Years 2000-2007 by Issue Year Group - Average Face Amount Exposed (000)
Issue Years 2000-03
Issue Years 2004-07
Total
Average 323 356 341 Minimum 52 5 5 Maximum 895 1,095 1,095
Because the experience of later issue years (2004-2007) by definition falls into the earlier durations studied in this Report, and the experience of earlier issue years (2000-2003) falls into relatively later durations, the similarity in the relationships between issue years 2000-2003 and durations 4-5 experience and between issue years 2004-2007 and durations 1-3 experience is expected. In particular, the average face amount exposed for issue years 2004-2007 is higher than that for issue years 2000-2003, just as the average face amount exposed for durations 1-3 is higher than that for durations 4-5.
Table 4.8: Experience for Durations 1-5, Issue Ages 20+, Issue Years 2000-2007 by Issue Year Group - Average Face Amount of Claims (000)
Issue Years 2000-03
Issue Years 2004-07
Total
Average 240 291 267 Minimum 27 20 20 Maximum 629 1,160 1,160
Similarly, the average face amount of claims reported for issue years 2004-07 is higher than for issue years 2000-03.
Table 4.9: Experience for Durations 1-5, Issue Ages 20+, Issue Years 2000-2007 by Issue Year Group – Ratio Average Face Amount of Claims to Average Face Amount Exposed
Issue Years 2000-03
Issue Years 2004-07
Total
Average 0.75 0.71 0.73 Minimum 0.41 0.20 0.20 Maximum 1.43 1.25 1.43

34
The lowest average ratio (0.71) was reported for issue years 2004-07. This result is consistent with the result for durations 1-2 (coincidentally also 0.71), which was the lowest average ratio among all early duration groups.
Table 4.10: Experience for Durations 1-5, Issue Ages 20+, Issue Years 2000-2007 by Issue Year Group - Mortality Rate Based on Number of Claims (per 1000)
Issue Years 2000-03
Issue Years 2004-07
Total
Average 1.6 1.3 1.5 Minimum 0.8 0.0 0.0 Maximum 4.1 4.6 4.6
Table 4.11: Experience for Durations 1-5, Issue Ages 20+, Issue Years 2000-2007 by Issue Year Group - Mortality Rate Based on Face Amount of Claims (per 1000)
Issue Years 2000-03
Issue Years 2004-07
Total
Average 1.2 0.8 1.0 Minimum 0.6 0.0 0.0 Maximum 4.1 4.7 4.7
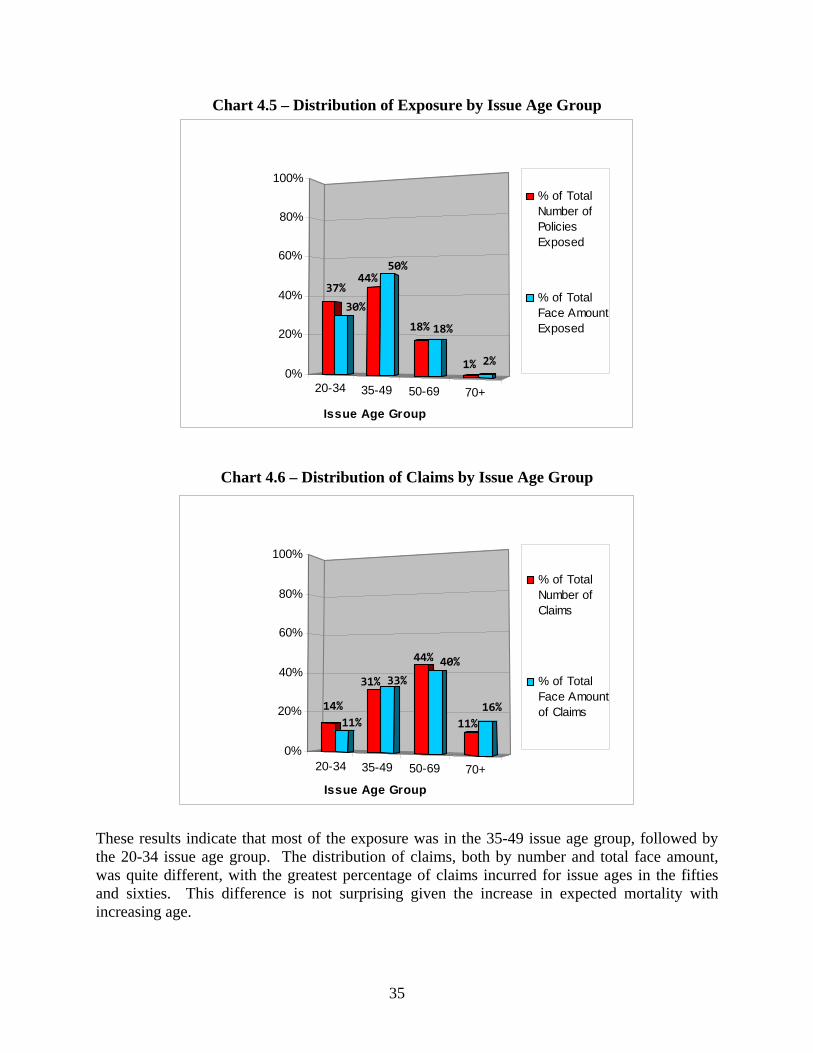
As expected, higher mortality rates were observed for issue years 2000-03, reflecting the experience of later durations where the impact of underwriting has already begun to wear off. This observation was made with respect to the mortality rate based on the number of claims, as well as the mortality rate based on the face amount of claims. Results by Issue Age Group (20-34, 35-49, 50-69, 70+) The Survey next asked respondents to provide exposure and claims experience by issue age group. Depending on the statistic requested, 29 or 30 companies responded. This experience is summarized in Charts 4.5 and 4.6, and Tables 4.12 through 4.16 below.
35
Chart 4.5 – Distribution of Exposure by Issue Age Group
20-34 35-49 50-69 70+
37%
30%
44%50%
18% 18%
1% 2%0%
20%
40%
60%
80%
100%
Issue Age Group
% of TotalNumber ofPoliciesExposed
% of TotalFace AmountExposed
Chart 4.6 – Distribution of Claims by Issue Age Group
20-34 35-49 50-69 70+
14%11%
31% 33%
44% 40%
11%16%
0%
20%
40%
60%
80%
100%
Issue Age Group
% of TotalNumber ofClaims
% of TotalFace Amountof Claims
These results indicate that most of the exposure was in the 35-49 issue age group, followed by the 20-34 issue age group. The distribution of claims, both by number and total face amount, was quite different, with the greatest percentage of claims incurred for issue ages in the fifties and sixties. This difference is not surprising given the increase in expected mortality with increasing age.

36
The second greatest percentage of claims was in the 35-49 issue age group. The lower percentage (11%) of total face amount of claims for issue ages 20-34, relative to the percentage of total number of claims (14%) for that same age range is consistent with a lower average claim amount in that age range.
Table 4.12: Experience for Durations 1-5, Issue Ages 20+, Issue Years 2000-2007 by Issue Age Group - Average Face Amount Exposed (000)
Issue Ages 20-34
Issue Ages 35-49
Issue Ages 50-69
Issue Ages >= 70
Total
Average 277 357 313 369 329 Minimum 45 61 43 33 33 Maximum 696 877 1,035 2,016 2,016
The findings noted above in Charts 4.5 and 4.6 are confirmed in Table 4.12, which reports a higher than average face amount for issue ages 35-49 and issue ages 70 and higher. Policies issued at ages 70 and higher reportedly had the highest average face amount exposed ($369,000). Issue ages 20-34 had the lowest average face amount exposed ($277,000).
Table 4.13: Experience for Durations 1-5, Issue Ages 20+, Issue Years 2000-2007 by Issue Age Group - Average Face Amount of Claims (000)
Issue Ages 20-34
Issue Ages 35-49
Issue Ages 50-69
Issue Ages >= 70
Total
Average 236 287 202 236 240 Minimum 13 32 17 15 13 Maximum 535 814 653 819 819
While the results in Table 4.12 indicate policies issued at ages 70 and higher had the highest average face amount exposed, the results in Table 4.13 indicate that those policies had only the second-highest average face amount of claims. Policies issued at ages 35-49, which had the second-highest face amount exposed, reportedly had the highest average face amount of claims ($287,000).
Table 4.14: Experience for Durations 1-5, Issue Ages 20+, Issue Years 2000-2007 by Issue Age Group - Ratio Average Face Amount of Claims to Average Face Amount Exposed Issue Ages
20-34 Issue Ages
35-49 Issue Ages
50-69 Issue Ages
>= 70
TotalAverage 0.85 0.80 0.68 0.79 0.78 Minimum 0.22 0.40 0.12 0.12 0.12 Maximum 2.15 1.73 1.41 1.90 2.15
The reported ratios of average face amount of claims to average face amount exposed highlight the relatively low average face amount of claims as compared to the average face amount exposed for issue ages 50-69 (0.68). The ratios were fairly consistent for all other issue ages.

37
Table 4.15: Experience for Durations 1-5, Issue Ages 20+, Issue Years 2000-2007 by Issue Age Group - Mortality Rate Based on Number of Claims (per 1000)
Issue Ages 20-34
Issue Ages 35-49
Issue Ages 50-69
Issue Ages >= 70
Total
Average 0.5 0. 8 3.1 12.3 4.2 Minimum 0.2 0.3 1.4 3.1 0.2 Maximum 1.8 2.2 7.8 27.7 27.7
Table 4.16: Experience for Durations 1-5, Issue Ages 20+, Issue Years 2000-2007 by Issue Age Group - Mortality Rate Based on Face Amount of Claims (per 1000)
Issue Ages 20-34
Issue Ages 35-49
Issue Ages 50-69
Issue Ages >= 70
Total
Average 0.3 0.6 1.9 9.7 3.1 Minimum 0.1 0.1 0.9 0.4 0.1 Maximum 0.8 1.1 3.0 42.6 42.6
Consistent with expectations, Tables 4.15 and 4.16 report increasing mortality rates with increasing issue age. The reported mortality rates for issue ages at or below 69 were lower than the overall mortality rate, while the reported mortality rates for issue ages at or above 70 were higher than the overall mortality rate. The difference between the average mortality rate based on face amount of claims and the average mortality rate based on number of claims for issue ages 50 and above was the greatest difference observed between these two statistics of all the summaries in this section. This finding indicates a trend toward claims at lower face amounts for older issue ages among the survey respondents. Results by Sex The Survey also asked respondents to provide the exposure and claims experience by sex. Depending on the statistic requested, 29 or 30 companies responded. This experience is summarized in Charts 4.7 and 4.8, and Tables 4.17 through 4.21 below.

38
Chart 4.7 – Distribution of Exposure by Sex
MaleFemale
68%
32%
51% 49%
0%
20%
40%
60%
80%
100%
Sex
% of TotalNumber ofPoliciesExposed
% of TotalFace AmountExposed
Chart 4.8 – Distribution of Claims by Sex
MaleFemale
73%
27%
66%
34%
0%
20%
40%
60%
80%
100%
Sex
% of TotalNumber ofClaims
% of TotalFace Amountof Claims
While historically the number of policies exposed has been weighted heavily toward males, the specific data provided in response to this Survey for issue years 2000-2007 have a more even distribution by sex. The distribution of face amount exposed by sex and the average face amount exposed, however, indicate that males tend to purchase policies with larger face amounts than females. Males reportedly incur a disproportionate number of claims, as 66% of the total number of claims provided were incurred by males, while only 51% of the number of policies exposed were for males. The distribution of face amount of claims was more in line with the distribution of

39
face amount exposed, with males incurring 73% of the face amount of claims compared to 68% of face amount exposed.
Table 4.17: Experience for Durations 1-5, Issue Ages 20+, Issue Years 2000-2007 by Sex - Average Face Amount Exposed (000)
Male Female Total Average 399 247 323 Minimum 68 33 33 Maximum 982 633 982
A higher than average face amount exposed for males is confirmed in Table 4.17, which shows an average face amount exposed for males which is over 60% higher than that for females.
Table 4.18: Experience for Durations 1-5, Issue Ages 20+, Issue Years 2000-2007 by Sex - Average Face Amount of Claims (000)
Male Female Total Average 266 225 246 Minimum 24 23 23 Maximum 741 804 804
Table 4.19: Experience for Durations 1-5, Issue Ages 20+, Issue Years 2000-2007 by Sex - Ratio Average Face Amount of Claims to Average Face Amount Exposed
Male Female Total Average 0.67 1.04 0.85 Minimum 0.08 0.35 0.08 Maximum 1.35 2.06 2.06
While the average face amount of claims presented in Table 4.18 for males ($266,000) is higher than that for females ($225,000), the difference between the two is smaller than the difference between the average face amount exposed for males versus females (see Table 4.17). That finding is confirmed in Table 4.19, which reports a ratio of average face amount of claims to average face amount exposed which is much lower for males than females (0.67 compared to 1.04). In fact, of the various analyses of this ratio presented in this section (by duration group, by issue year group, by issue age group, by sex, and by preferred status/tobacco class), the ratio for females is the only ratio greater than 1. A higher average face amount of claims than average face amount exposed for females indicates that early duration female deaths have reportedly occurred at higher face amounts than one would expect given the distribution of female exposure amounts.
40
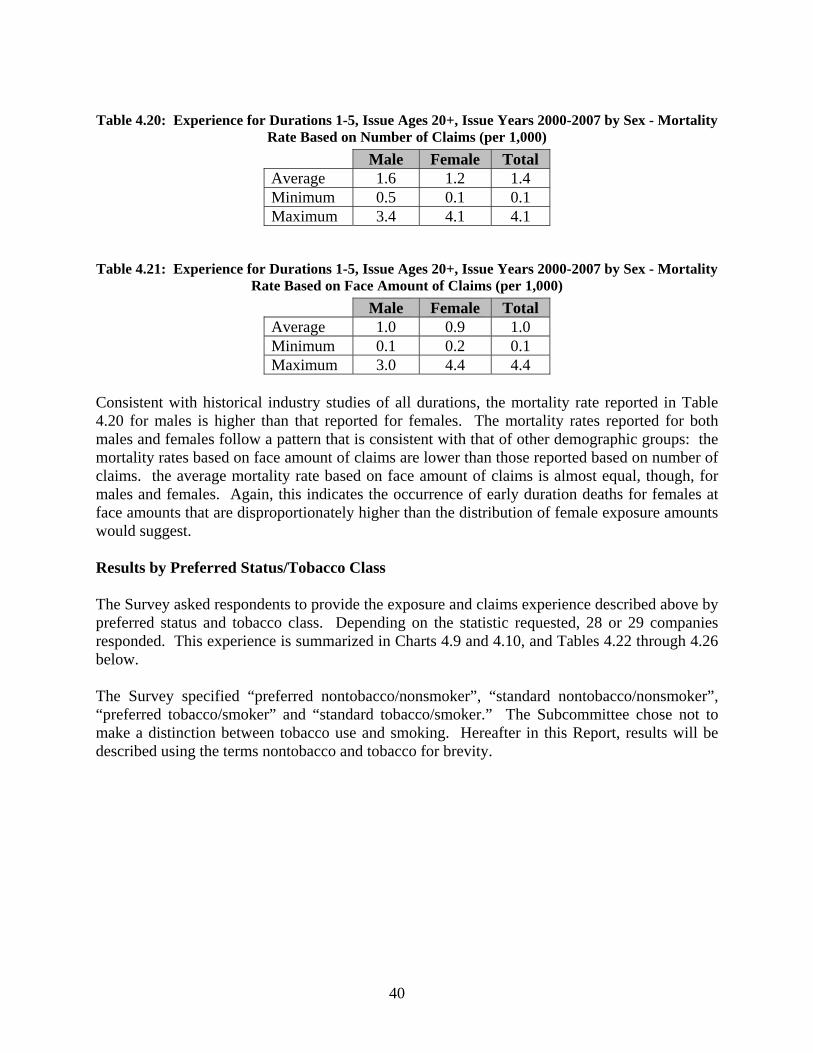
Table 4.20: Experience for Durations 1-5, Issue Ages 20+, Issue Years 2000-2007 by Sex - Mortality Rate Based on Number of Claims (per 1,000) Male Female Total Average 1.6 1.2 1.4 Minimum 0.5 0.1 0.1 Maximum 3.4 4.1 4.1
Table 4.21: Experience for Durations 1-5, Issue Ages 20+, Issue Years 2000-2007 by Sex - Mortality Rate Based on Face Amount of Claims (per 1,000)
Male Female Total Average 1.0 0.9 1.0 Minimum 0.1 0.2 0.1 Maximum 3.0 4.4 4.4
Consistent with historical industry studies of all durations, the mortality rate reported in Table 4.20 for males is higher than that reported for females. The mortality rates reported for both males and females follow a pattern that is consistent with that of other demographic groups: the mortality rates based on face amount of claims are lower than those reported based on number of claims. the average mortality rate based on face amount of claims is almost equal, though, for males and females. Again, this indicates the occurrence of early duration deaths for females at face amounts that are disproportionately higher than the distribution of female exposure amounts would suggest. Results by Preferred Status/Tobacco Class The Survey asked respondents to provide the exposure and claims experience described above by preferred status and tobacco class. Depending on the statistic requested, 28 or 29 companies responded. This experience is summarized in Charts 4.9 and 4.10, and Tables 4.22 through 4.26 below. The Survey specified “preferred nontobacco/nonsmoker”, “standard nontobacco/nonsmoker”, “preferred tobacco/smoker” and “standard tobacco/smoker.” The Subcommittee chose not to make a distinction between tobacco use and smoking. Hereafter in this Report, results will be described using the terms nontobacco and tobacco for brevity.

41
Chart 4.9 – Distribution of Exposure by Rating/Tobacco Class
PNSN
PTST
64%
29%
3% 4%
47%41%
3% 8%
0%
20%
40%
60%
80%
100%
PN = Preferred Nontobacco, SN = Standard Nontobacco, PT = Preferred
Tobacco, ST = Standard Tobacco
% of TotalNumber ofPoliciesExposed
% of TotalFace AmountExposed
Chart 4.10 – Distribution of Claims by Rating/Tobacco Class
PNSN
PTST
43% 44%
4% 9%
25%
52%
4% 19%
0%
20%
40%
60%
80%
100%
PN = Preferred Nontobacco, SN = Standard Nontobacco, PT = Preferred
Tobacco, ST = Standard Tobacco
% of TotalNumber ofClaims
% of TotalFace Amountof Claims
The distribution of tobacco vs. nontobacco exposed number of policies is consistent with other industry experience with roughly 90% of policies exposed classified as nontobacco and 10% classified as tobacco.
42
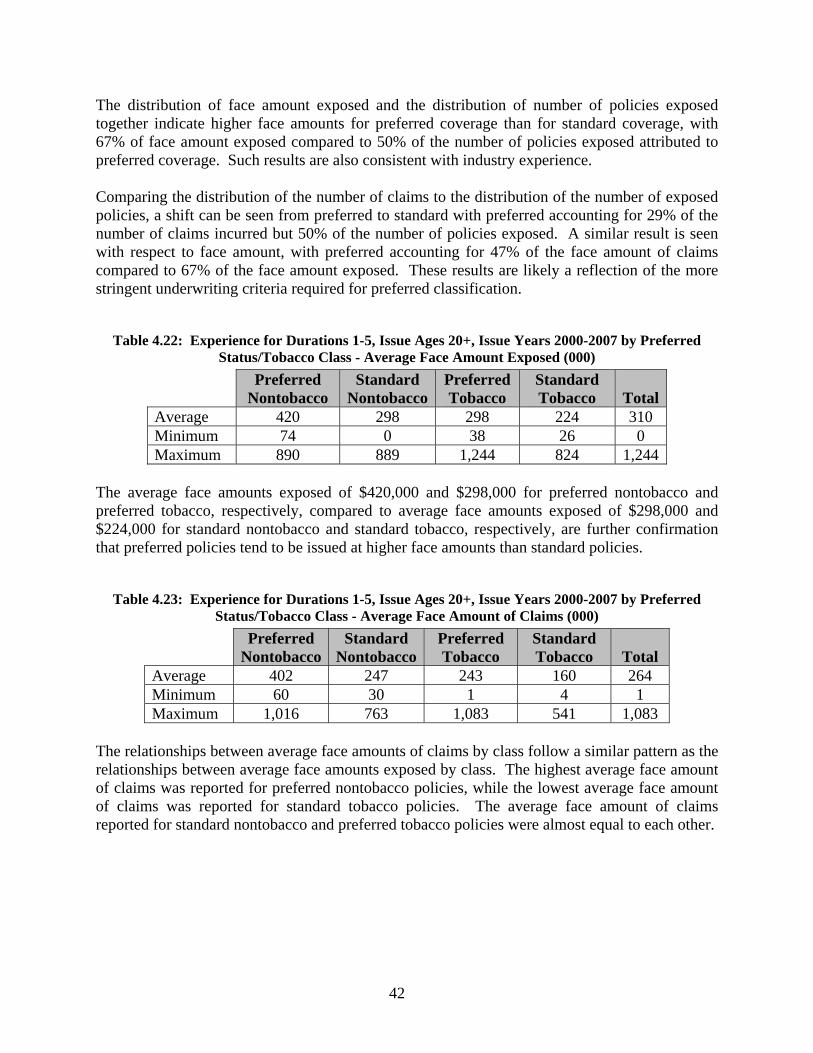
The distribution of face amount exposed and the distribution of number of policies exposed together indicate higher face amounts for preferred coverage than for standard coverage, with 67% of face amount exposed compared to 50% of the number of policies exposed attributed to preferred coverage. Such results are also consistent with industry experience. Comparing the distribution of the number of claims to the distribution of the number of exposed policies, a shift can be seen from preferred to standard with preferred accounting for 29% of the number of claims incurred but 50% of the number of policies exposed. A similar result is seen with respect to face amount, with preferred accounting for 47% of the face amount of claims compared to 67% of the face amount exposed. These results are likely a reflection of the more stringent underwriting criteria required for preferred classification.
Table 4.22: Experience for Durations 1-5, Issue Ages 20+, Issue Years 2000-2007 by Preferred Status/Tobacco Class - Average Face Amount Exposed (000)
Preferred Nontobacco
Standard Nontobacco
Preferred Tobacco
Standard Tobacco
Total
Average 420 298 298 224 310 Minimum 74 0 38 26 0 Maximum 890 889 1,244 824 1,244
The average face amounts exposed of $420,000 and $298,000 for preferred nontobacco and preferred tobacco, respectively, compared to average face amounts exposed of $298,000 and $224,000 for standard nontobacco and standard tobacco, respectively, are further confirmation that preferred policies tend to be issued at higher face amounts than standard policies.
Table 4.23: Experience for Durations 1-5, Issue Ages 20+, Issue Years 2000-2007 by Preferred Status/Tobacco Class - Average Face Amount of Claims (000)
Preferred Nontobacco
Standard Nontobacco
Preferred Tobacco
Standard Tobacco
Total
Average 402 247 243 160 264 Minimum 60 30 1 4 1 Maximum 1,016 763 1,083 541 1,083
The relationships between average face amounts of claims by class follow a similar pattern as the relationships between average face amounts exposed by class. The highest average face amount of claims was reported for preferred nontobacco policies, while the lowest average face amount of claims was reported for standard tobacco policies. The average face amount of claims reported for standard nontobacco and preferred tobacco policies were almost equal to each other.

43
Table 4.24: Experience for Durations 1-5, Issue Ages 20+, Issue Years 2000-2007 by Preferred Status/Tobacco Class - Ratio Average Face Amount of Claims to Average Face Amount Exposed
Preferred Nontobacco
Standard Nontobacco
Preferred Tobacco
Standard Tobacco
Total
Average 0.97 0.82 0.98 0.96 0.93 Minimum 0.44 0.40 0.03 0.13 0.03 Maximum 1.89 1.70 4.09 6.46 6.46
In general, the ratio of the average face amount of claims to the average face amount exposed is close to 1.00 for all preferred status/tobacco classes except standard nontobacco, for which the ratio was 0.82. This seems to indicate that for standard nontobacco coverage, early duration claims are incurred at lower face amounts.
Table 4.25: Experience for Durations 1-5, Issue Ages 20+, Issue Years 2000-2007 by Preferred Status/Tobacco Class - Mortality Rate Based on Number of Claims (per 1000)
Preferred Nontobacco
Standard Nontobacco
Preferred Tobacco
Standard Tobacco
Total
Average 0.6 1.9 1.4 3.6 1.9 Minimum 0.3 0.8 0.0 0.6 0.0 Maximum 1.0 5.0 5.4 10.0 10.0
As expected, stricter underwriting rules for preferred policies have resulted in lower mortality rates based on number claims for preferred policies (per thousand rates of 0.6 for preferred nontobacco versus 1.9 for standard nontobacco, and 1.4 for preferred tobacco versus 3.6 for standard tobacco). Lower mortality rates for nontobacco versus tobacco policies were also reported, in line with industry studies.
Table 4.26: Experience for Durations 1-5, Issue Ages 20+, Issue Years 2000-2007 by Preferred Status/Tobacco Class - Mortality Rate Based on Face Amount of Claims (per 1000)
Preferred Nontobacco
Standard Nontobacco
Preferred Tobacco
Standard Tobacco
Total
Average 0.6 1.5 1.2 3.1 1.6 Minimum 0.3 0.6 0.0 0.1 0.0 Maximum 1.3 5.6 5.9 22.8 22.8
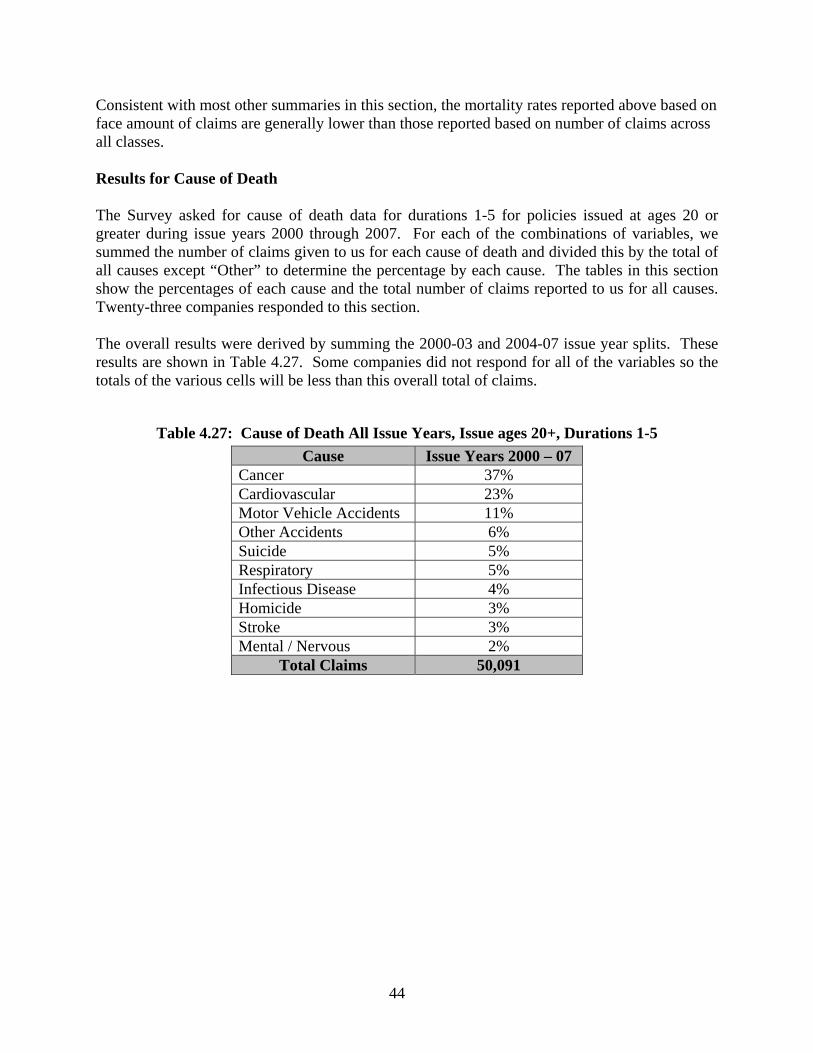
44
Consistent with most other summaries in this section, the mortality rates reported above based on face amount of claims are generally lower than those reported based on number of claims across all classes. Results for Cause of Death The Survey asked for cause of death data for durations 1-5 for policies issued at ages 20 or greater during issue years 2000 through 2007. For each of the combinations of variables, we summed the number of claims given to us for each cause of death and divided this by the total of all causes except “Other” to determine the percentage by each cause. The tables in this section show the percentages of each cause and the total number of claims reported to us for all causes. Twenty-three companies responded to this section. The overall results were derived by summing the 2000-03 and 2004-07 issue year splits. These results are shown in Table 4.27. Some companies did not respond for all of the variables so the totals of the various cells will be less than this overall total of claims.
Table 4.27: Cause of Death All Issue Years, Issue ages 20+, Durations 1-5 Cause Issue Years 2000 – 07
Cancer 37% Cardiovascular 23% Motor Vehicle Accidents 11% Other Accidents 6% Suicide 5% Respiratory 5% Infectious Disease 4% Homicide 3% Stroke 3% Mental / Nervous 2%
Total Claims 50,091

45
Over the whole period 2000-07, cancer was the leading cause of death for 22 of the 23 respondents. The lone respondent with the different top cause of death indicated their top cause of death was cardiovascular disease. The percent of claims attributed to cancer ranged from 30-47% for all of the respondents. The Survey asked respondents to provide the number of claims they incurred by cause of death and issue year group. The results are shown in Table 4.28 below. The causes of death for Tables 4.28 through 4.34 are in the order of the overall results in Table 4.27.
Table 4.28: Cause of Death by Issue Era (Issue ages 20+, Durations 1-5) Cause Issue Years 2000 – 03 Issue Years 2004 – 07
Cancer 39% 34% Cardiovascular 24% 23% Motor Vehicle Accidents 10% 14% Other Accidents 6% 6% Suicide 5% 5% Respiratory 5% 5% Infectious Disease 3% 5% Homicide 3% 4% Stroke 3% 3% Mental / Nervous 2% 2%
Total Claims 34,223 15,868 The top three causes of death in order for each of the issue year groups were: cancer, cardiovascular disease and motor vehicle accidents. The two causes that seemed to shift over the period were cancer, which reduced by five percentage points, and motor vehicle accidents, which increased by four percentage points, between 2000-03 and 2004-07. The Survey asked respondents to provide the number of claims they incurred by cause of death and issue age group. The results are shown in Table 4.29 below.
Table 4.29: Cause of Death by Issue Age Group (Issue Years 2000-07, Durations 1-5) Cause Issue Ages 20 - 34 Issue Ages 35 - 49 Issue Ages 50 - 69 Issue Ages 70+
Cancer 16% 34% 48% 39% Cardiovascular 12% 22% 27% 31% Motor Vehicle Accidents 29% 14% 5% 2% Other Accidents 11% 7% 3% 2% Suicide 10% 8% 3% 1% Respiratory 3% 4% 5% 11% Infectious Disease 3% 4% 4% 5% Homicide 13% 3% 1% 0% Stroke 1% 2% 3% 5% Mental / Nervous 2% 2% 2% 5%
Total Claims 7,795 16,136 20,914 4,404

46
The variation by age is not surprising. Causes of death which increase with age include cancer (although it reaches a peak of 48% at 50-69), cardiovascular disease (more than doubling from 12% to 31%), respiratory disease (more than tripling from 3% to 11%), infectious disease (slightly from 3% to 5%) and stroke (from 1% to 5%). The percentage of deaths attributed to mental/nervous causes is flat and then increases for ages 70+. Causes of death which decrease with age include motor vehicle accidents (from 29% down to 2%), other accidents (from 11% down to 2%), suicide (from 10% to 1%) and homicide (down to 0% at 70+ from 13%). Table 4.30 below shows the percentage of each cause of death by age at death from the 2006 Center for Disease Control (CDC) National Vital Statistics Reports (Volume 57, Number 14). Twelve of the 15 top CDC causes of death were used. Diabetes, liver disease and nephritis were excluded. Several of the remaining 12 were combined to match our categories. Individual years 2000-06 were averaged. The CDC had different age groupings than were used in this Report. In addition, the ages shown are ages at death rather than issue ages. Since the Survey addressed early duration claims and only durations 1-5 are studied, the age at death is no more than five years from the age at issue. Finally, in the CDC’s cause of death/age at death data, the CDC did not separate motor vehicle accidents from other accidents. Results are shown in Table 4.30 below.
Table 4.30: Age at Death from the 2006 CDC (Table 9)
Cause Ages
15 -24 25 - 34 35 - 44 45 - 54 55 - 64 65 - 74 75 -84 85+ Cancer 4% 12% 25% 39% 47% 43% 30% 15% Cardiovascular 4% 11% 22% 30% 32% 33% 38% 49% Accidents 56% 42% 27% 13% 4% 2% 2% 2% Suicide 15% 16% 11% 5% 2% 1% 0% 0% Respiratory 0% 1% 2% 3% 6% 9% 9% 6% Infectious Disease 1% 2% 3% 3% 3% 4% 5% 8% Homicide 19% 15% 5% 2% 0% 0% 0% 0% Stroke 1% 2% 4% 5% 5% 6% 9% 12% Mental / Nervous 0% 0% 0% 0% 0% 2% 5% 8%
The generally lower percentage of cardiovascular and accidental deaths reflected in the insured experience (Table 4.29) relative to the CDC experience above may be an indication of the effectiveness of underwriting applicants with cardiovascular disease or risky lifestyles. Conversely, the percentage of deaths attributed to cancer reflected in the insured experience which is equal to or greater than that reflected in the CDC experience seems to indicate less effective underwriting or perhaps even anti-selection with respect to cancer.

47
The survey asked respondents to provide the number of claims they incurred by cause of death and duration group. The results are provided below in Table 4.31.
Table 4.31: Cause of Death by Duration (Issue Years 2000-07, Issue ages 20+) Cause Duration 1 - 2 Duration 3 Duration 4 - 5
Cancer 32% 41% 42% Cardiovascular 24% 23% 23% Motor Vehicle Accidents 16% 9% 7% Other Accidents 6% 5% 5% Suicide 4% 6% 6% Respiratory 4% 5% 5% Infectious Disease 3% 4% 4% Homicide 5% 3% 2% Stroke 3% 2% 3% Mental / Nervous 2% 2% 3%
Total Claims 20,638 11,125 17,257 Causes of death which decrease as a percentage by duration may be indicative of anti-selection. Causes which follow this pattern are motor vehicle deaths and homicides. An increase was observed in the percentage of claims in duration 3 relative to the percentage of claims in durations 1-2 for both cancer and suicide. This increase may be due to insureds’ motivation to survive until after the contestable period and the company resisting some cancer and suicide claims in the first two policy years, thus lowering the percentages in durations 1-2 relative to later years. Note that the percentages for cancer and suicide stay relatively flat in durations 4-5 as compared to duration 3.

48
The Survey asked respondents to provide the number of claims they incurred by cause of death and sex. Table 4.32 below shows the results.
Table 4.32: Cause of Death by Sex (Issue years 2000-07, Issue Ages 20+, Durations 1-5) Cause Male Female
Cancer 33% 47% Cardiovascular 26% 20% Motor Vehicle Accidents 12% 8% Other Accidents 8% 4% Suicide 7% 3% Respiratory 4% 6% Infectious Disease 2% 4% Homicide 4% 3% Stroke 2% 3% Mental / Nervous 2% 3%
Total Claims 27,356 13,824 Considering causes where the difference between sexes was material (four percentage points or more), males have a greater percentage of cardiovascular, motor vehicle accident, other accident and suicide claims than females, and females have a greater percentage of cancer claims than males. With respect to the other causes of death, the data imply that claims on females are slightly more likely to be caused by respiratory and infectious diseases than claims on males. Table 4.33 below shows the cause of death by underwriting class.
Table 4.33: Cause of Death by Underwriting Class Issue Yrs 2000-07, Duration 1-5
Cause Preferred
NontobaccoStandard
NontobaccoPreferred Tobacco
Standard Tobacco
Cancer 41% 37% 41% 38% Cardiovascular 18% 25% 24% 26% Motor Vehicle Accidents 13% 10% 10% 9% Other Accidents 9% 6% 8% 6% Suicide 7% 4% 7% 6% Respiratory 3% 5% 3% 5% Infectious Disease 2% 3% 1% 3% Homicide 3% 4% 2% 3% Stroke 3% 3% 2% 2% Mental / Nervous 2% 3% 2% 2%
Total Claims 8,883 21,666 1,430 8,645 Underwriting the risk of fatal cancer is difficult; accordingly, one observes that cancer is the leading cause of death across all risk classes. The relatively low percentage of cardiovascular

49
deaths in the preferred nontobacco class seems to indicate that underwriting of applicants with cardiovascular conditions is particularly effective in that preferred class/tobacco status. Table 4.34 below shows the range of results for the respondents on their overall percentages by cause of death.
Table 4.34: Cause of Death Range of Responses Cause Minimum Average Maximum
Cancer 30% 37% 47% Cardiovascular 19% 23% 31% Motor Vehicle Accidents 0% 11% 17% Other Accidents 0% 6% 13% Suicide 0% 5% 14% Respiratory 2% 5% 15% Infectious Disease 0% 4% 21% Homicide 0% 3% 8% Stroke 0% 3% 8% Mental / Nervous 0% 2% 11%
Total Claims 50,091 Due to some outliers, the ranges were fairly wide for all but the top three causes. For example, one company indicated that they had no motor vehicle accidental deaths and another company indicated that 21% of their deaths were due to infectious disease. This may be due in part to a unique categorization of causes of death by some companies.

50
Appendix A – Survey Questions Section 1 – Underwriting Practices 1. Which of the following topics are asked about on your application to identify potential accidental death, suicide or homicide risk? (Check all that apply)
Question about Past History
Question about Future Plans
If Do Not Ask (Check one) Not Considering Asking Considering Asking
Alcohol Abuse Alcohol Use Aviation Avocations Bankruptcy Depression Driving Drug Abuse Drug Use Felony Convictions Foreign Travel Occupation Other Additional comments: 2. Please indicate the tests and data your company uses or is considering using: Tool/Test Used Test? (Check all that apply) If Currently Using, Do
You Use It For…? (Check one)
If Not Currently Using (Check one)
All Years
2008 2007 2006 2005 2004 All Adult Issue Ages
Limited Adult Issue Ages
Not Considering Using
Considering Using
Examination ADLs Blood pressure BMI Build Chest x-ray Cognitive tests EKG Functional tests IADLs Pulse Treadmill EKG
Blood A1c Alk Phos Apolipoprotein AST & ALT Blood alcohol CBC CDT

51
CEA Chol/HDL ratio Cholesterol eGFR GGTP Globulin HAA HDL Hemoglobin hsCRP LDL NT ProBNP PSA Serum albumin Total Protein Triglycerides
Urine Cocaine markers Glucose Microalbumin Other Drugs of Abuse
Protein Application and/or Other Sources
Bankruptcy records Driving record Family history of cancer death
Family history of cancer disease
Family history of cardiovascular death
Family history of cardiovascular disease
Family history of cerebral vascular death
Family history of cerebral vascular disease
Family history of diabetes
Felony records Income Medication search (through Rx database search)
Net worth Question on advised tests or procedures not yet completed
Question on planned doctors visits
Additional comments:

52
3. Please indicate any other tests or data your company uses to assist in the detection of risks or conditions that may result in an early claim:
Test/Data Used Test? (Check all that apply) If Currently Using, Do You Use It For…? (Check one)
If Not Currently Using (Check one)
All Years 2008 2007 2006 2005 2004 All Adult Issue Ages
Limited Adult Issue Ages
Not Considering Using
Considering Using
Additional comments: 4. Are there any tests/questions that your company is not currently using that you believe could help in the detection of risks or conditions that may result in an early claim? Please list.
Test/Question Do Not Currently Use Because… (Check all that apply) Accuracy Added
Process Time
Competition Cost Difficult to
Collect
Invasiveness Negative Agent
Reaction
Regulatory Concerns
Other Other
Additional Comments: 5. Rank the conditions that, in your opinion, are the five best indicators of early claims for each issue age group, with “1” being the most important and “5” being the fifth most important.
Conditions 20-34 35-49 50-69 70+ Active Lifestyle/Social Interaction Alcohol/drug abuse Anemia Build - Obesity Build - Underweight Cancer Cardiovascular disease Cerebrovascular disease Cognitive impairment COPD Diabetes Driving risk Frailty Hazardous Occupation Hypertension Infection or Inflammation Kidney disease Lipid disorders Malnutrition Multiple Impairments Risk-Taking Activities/Hobbies Smoking Other (please specify)
Additional Comments:

53
Section 2 – Claims Practices 1. Please fill out as much of the grid below as possible.
2005 2006 2007 No. of
Policies Face Amount (in thousands)
No. of Policies
Face Amount (in thousands)
No. of Policies
Face Amount (in thousands)
A. In Force at Beginning of Year
B. New Business Issued During Year
C. Claims Reported During Year (C = D + E)
D. Incontestable Claims Reported
E. Contestable Claims Reported (E = F + G + H)
F. Contestable Claims Paid without Contest
G. Claims Contested, i.e., declined, rescinded, litigated or other resistance
H. Contestable Claims where a decision has not yet been made whether to Pay or Resist
Additional Comments: 2. Do your claim investigation practices vary by any of the following factors?
Yes No Age at Death Cause of Death Face Amount Issue Age Location at Death Policy Status (e.g., Limited Pay, Paid Up) Other (please specify in comment box)
Additional Comments:

54
3a. Do you have a claims committee? y/n If no, please skip to Question 4. b. Which of the following disciplines are represented? (Check all that apply)
Disciplines Regularly As Required Actuarial Administration/Policy Owner Service CEO CFO Claims Compliance COO Executive Legal Medical Sales/Marketing Underwriting Other (please specify)
4. During 2006 or 2007, did you rescind any in-force policy prior to claim? y/n Additional Comments: 5. During 2006 or 2007, did you deny a claim that was beyond the contestable period? y/n Additional Comments: 6. Ignoring the interest paid, of the claims contested in 2006, what percentage by number was settled for the following: (Note the percentages should add up to 100%.) a. An amount paid no greater than the minimum required by contract (usually a return of premium): _____% b. An amount paid more than the contractual minimum (as defined in a.), but less than the full face amount of the contract: _____% c. An amount paid equal to the full face amount of the contract: ______% d. An amount paid more than the face amount of the contract: _____% e. Still unsettled: _____% 7. For those claims contested in 2006 for which the amount paid was more than the contractual minimum, but less than the full face amount (as reported in 6b.), what was the average percentage of the full face amount on these claims? Additional Comments:

55
Section 3 – How Results Are Studied 1. How often have you studied early claim history? By At least once in
the last yr. At least once in the last 2 yrs.
At least once in the last 5 yrs.
Not Reviewed in the last 5 yrs.
As Needed Additional Comments
Cause of Death Distribution Channel Producer Underwriter Duration Gender Face Amount
Risk Class
Age Product Target Market Other (please specify)
2a. When you study early claim results, which measures do you use? (Check all that apply) Actual/Expected Face Amount of Early Claims Number of Claims Present Value of Future Profits ROI/ ROE Other (please specify) Other (please specify) b. Of these measures used in a, please indicate which is the primary measure? Actual/Expected Face Amount of Early Claims Number of Claims Present Value of Future Profits ROI/ ROE Other (please specify) Other (please specify) 3. If you could give one tip or suggestion to reduce/control early duration claims what would it be?

56
Section 4 – Mortality 1. Please enter the number of policies exposed, face amount exposed, number of claims and face amount of claims summarized by the categories shown below. If you are unable to provide information for each category requested, please provide information at the most detailed level available.
# of Policies Exposed
Face Amount Exposed # of Claims Face Amount of
Claims Issue Years 2000-03 (Issue ages 20+, Dur 1-5)
2004-07 (Issue ages 20+, Dur 1-5) Issue Ages 20-34 (Issue years 2000-07, Dur 1-5)
35-49 (Issue years 2000-07, Dur 1-5)
50-69 (Issue years 2000-07, Dur 1-5)
70+ (Issue years 2000-07, Dur 1-5) Duration Group Dur 1-2 (Issue years 2000-07, Issue ages
20+)
Dur 3 (Issue years 2000-07, Issue ages 20+)
Dur 4-5 (Issue years 2000-07, Issue ages 20+)
Sex M = Male (Issue years 2000-07, Issue ages 20+, Dur 1-5)
F = Female (Issue years 2000-07, Issue ages 20+, Dur 1-5)
Class PN = Preferred Nontobacco/Nonsmoker (Issue years 2000-07, Issue ages 20+, Dur 1-5)
SN = Standard Nontobacco/Nonsmoker (Issue years 2000-07, Issue ages 20+, Dur 1-5)
PT = Preferred Tobacco/Smoker (Issue years 2000-07, Issue ages 20+, Dur 1-5)
ST = Standard Tobacco/Smoker (Issue years 2000-07, Issue ages 20+, Dur 1-5)
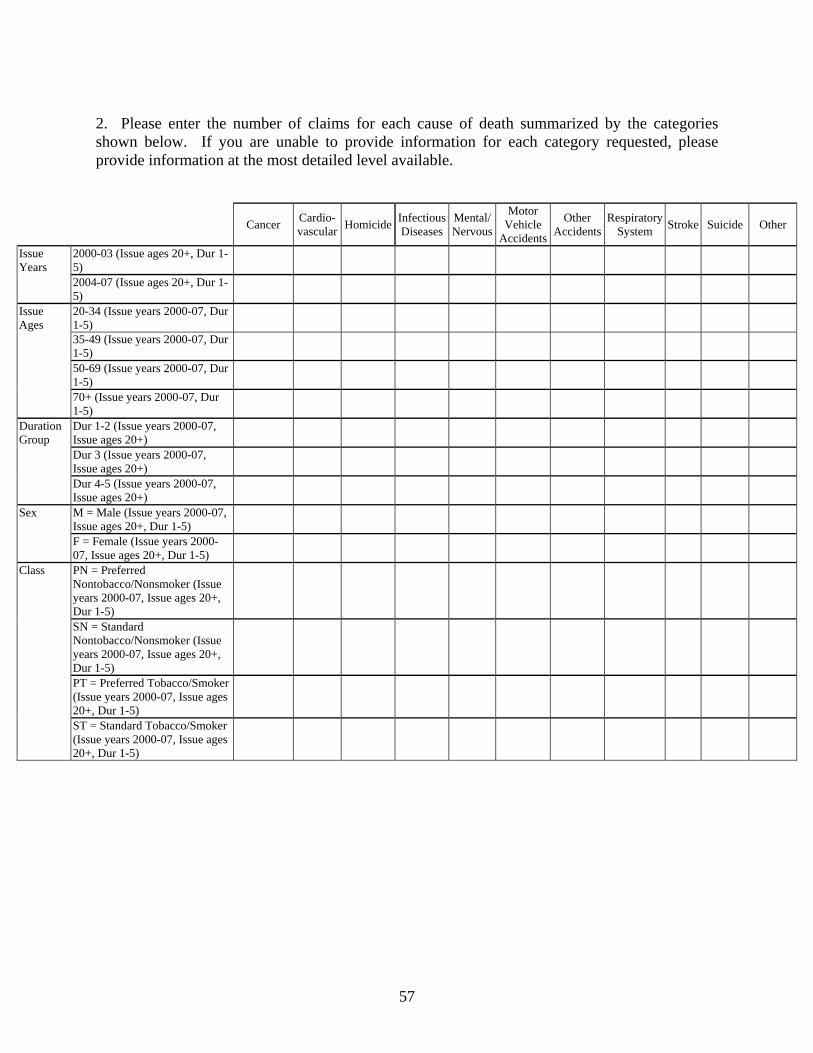
57
2. Please enter the number of claims for each cause of death summarized by the categories shown below. If you are unable to provide information for each category requested, please provide information at the most detailed level available.
Cancer Cardio-
vascular Homicide Infectious Diseases
Mental/ Nervous
Motor Vehicle
Accidents
Other Accidents
RespiratorySystem Stroke Suicide Other
Issue Years
2000-03 (Issue ages 20+, Dur 1-5)
2004-07 (Issue ages 20+, Dur 1-5)
Issue Ages
20-34 (Issue years 2000-07, Dur 1-5)
35-49 (Issue years 2000-07, Dur 1-5)
50-69 (Issue years 2000-07, Dur 1-5)
70+ (Issue years 2000-07, Dur 1-5)
Duration Group
Dur 1-2 (Issue years 2000-07, Issue ages 20+)
Dur 3 (Issue years 2000-07, Issue ages 20+)
Dur 4-5 (Issue years 2000-07, Issue ages 20+)
Sex M = Male (Issue years 2000-07, Issue ages 20+, Dur 1-5)
F = Female (Issue years 2000-07, Issue ages 20+, Dur 1-5)
Class
PN = Preferred Nontobacco/Nonsmoker (Issue years 2000-07, Issue ages 20+, Dur 1-5)
SN = Standard Nontobacco/Nonsmoker (Issue years 2000-07, Issue ages 20+, Dur 1-5)
PT = Preferred Tobacco/Smoker (Issue years 2000-07, Issue ages 20+, Dur 1-5)
ST = Standard Tobacco/Smoker (Issue years 2000-07, Issue ages 20+, Dur 1-5)

58
Appendix B – Test Definitions A1c (glycohemoglobin A1c): A test for glucose control over the past four to six weeks. Indicative of diabetes mellitus when elevated. ADLs (activities of daily living): Tasks of everyday life (eating, toileting, dressing, bathing and transferring). Typically asked about for older age applicants. Alkaline Phosphatase: An enzyme found in the liver, bones and other body components. Apolipoprotein: A protein portion of lipoproteins. Apolipoprotein A-1 is the major part of HDL cholesterol. AST/ALT: AST is aspartate aminotransferase, an enzyme found in heart, liver and other organs and has been known as SGOT. ALT, alanine aminotransferase, is an enzyme found primarily in the liver and has been known as SGPT. Blood Alcohol: The level of alcohol in serum. Blood Pressure: Blood pressure is the result of interaction between the pressure required to move blood through the circulatory system, pumped by the heart, and the muscle tone of the artery walls. BMI (body mass index): A relationship between height and weight that is related to body fat and health risk. Build: Height and weight. CBC (complete blood count): A measure of the most common hematologic parameters, such as hemoglobin, hematocrit, white blood count and platelets. CDT (carbohydrate-deficient transferrin): An alcohol marker for detecting alcohol abuse. CEA (carcino-embryonic antigen): A tumor marker. Chest X-ray: A view of the skeletal frame and internal organs (lung and heart, primarily) using a projection radiograph. Cholesterol: Total cholesterol level in serum. Cholesterol/HDL Ratio: The ratio of total cholesterol to HDL cholesterol in serum. Cocaine: The presence of cocaine derivatives in urine. Cognitive: Tests of cognition (perceiving, thinking and remembering). EGFR (estimate of glomerular filtration rate): A kidney function indicator. EKG (electrocardiogram): A test of general heart function performed on a person in a resting state. Functional (Functional Assessment): Tests of functional ability, especially in the elderly. GGTP (gamma glutamyl transferase): A liver enzyme. Globulin: One of the two primary components of total protein (along with serum albumin). Glucose (glucosuria): Sugar detected in urine. Indicative of diabetes or glucose intolerance. HAA (hemoglobin-associated acetaldehyde): An alcohol marker related more to direct intake of alcohol. HDL (high density lipoprotein cholesterol): One part of total cholesterol, commonly referred to as “good cholesterol.” Hemoglobin: The oxygen-carrying pigment in the blood. HsCRP (high sensitivity C-reactive protein): A substance in serum indicative of inflammation. IADLs (instrumental activities of daily living): Daily tasks indicative of independent living (light housework, medication management, meal preparation, shopping, telephone use and money management).

59
LDL (low density lipoprotein cholesterol): One part of total cholesterol, commonly referred to as “bad cholesterol.” Microalbumin (microalbuminuria): Small amounts of albumin in the urine. NT-proBNP: N-terminal pro-B-type natriuretic peptide, a serum test for cardiac function. Other Drugs of Abuse: Marijuana, heroin or other drugs. Protein (proteinuria): Excess of protein in urine. Indicative of kidney disorders. PSA (prostate specific antigen): A tumor marker for prostate cancer. Pulse: Heart beat. Serum Albumin: One of the two primary components of total protein (along with globulin). Total Protein: Serum albumin, globulin and related proteins. Treadmill EKG (treadmill electrocardiogram or exercise EKG): An exercise test of heart function providing a more accurate assessment than a resting test. Triglycerides: Blood fats related to intake of calories.

60
Appendix C – Participating Companies ASD Consulting Services ACE Tempest Life Re USA AIG American General Allstate Financial American Fidelity Assurance Company American National Insurance Company American United Life Insurance Company Americo Financial Life and Annuity Insurance Company Aviva USA Beneficial Financial Group Cincinnati Life Insurance Company Columbus Life Conseco Insurance Companies Generali USA Life Re Genworth Financial Horace Mann ING Retail Life John Hancock Kansas City Life Insurance Company Liberty Bankers Life Ins. Company Lincoln Financial Group MassMutual Financial Group MetLife Midland National Life New York Life Insurance Company North American Company for Life and Health Northwestern Mutual Pacific Life Penn Mutual Phoenix Life Insurance Company Protective Life Insurance Company Prudential Financial RiverSource Insurance SCOR Global Life U.S. Re Insurance Company State Farm Life Insurance Company Symetra Financial West Coast Life Insurance Company XL Re Life America Inc.