early discontinuation and restart of insulin in the ... · original research early discontinuation...
TRANSCRIPT
ORIGINAL RESEARCH
Early Discontinuation and Restart of Insulinin the Treatment of Type 2 Diabetes Mellitus
Haya Ascher-Svanum • Maureen J. Lage •
Magaly Perez-Nieves • Matthew D. Reaney •
Joanne Lorraine • Angel Rodriguez • Michael Treglia
To view enhanced content go to www.diabetestherapy-open.comReceived: January 28, 2014 / Published online: April 30, 2014� The Author(s) 2014. This article is published with open access at Springerlink.com
ABSTRACT
Introduction: Although the largest
improvement in glycemic control occurs
within the first 90 days of insulin therapy,
little is known about early persistence on
insulin therapy. This research aimed to
identify predictors of early discontinuation
and of subsequent restart of basal or mixture
insulin among patients with type 2 diabetes
mellitus (T2DM) and to assess the economic
cost associated with such behaviors over a
1-year period.
Methods: Truven’s Health Analytics
Commercial Claims and Encounters database
was utilized for the study. Logistic regressions
were used to examine factors associated with
early discontinuation of insulin (basal or
mixture) and, among patients who
discontinued early, the factors associated with
restarting. Cost regressions were estimated
using generalized linear models with a gamma
distribution and logistic link. Kaplan–Meier
survival curves were used to examine time to
discontinuation and time to restart among
those who discontinued.
Results: Multivariate analyses revealed that
patient characteristics, prior healthcare
resource utilization, comorbid diagnoses, and
type of initiated insulin were associated with
early discontinuation of insulin and of
restarting among patients who discontinued
early. Acute care (hospitalization and
emergency room) costs were 9.6% higher
among patients who discontinued early
(P\0.001), although outpatient, drug, and
Electronic supplementary material The onlineversion of this article (doi:10.1007/s13300-014-0065-z)contains supplementary material, which is available toauthorized users.
H. Ascher-Svanum � M. Perez-NievesGlobal Patient Outcomes and Real World Evidence,Eli Lilly and Company, Indianapolis, IN, USA
M. J. Lage (&) � M. TregliaHealthMetrics Outcomes Research, Bonita Springs,FL, USAe-mail: [email protected]
M. D. ReaneyEli Lilly and Company, Windlesham, Surrey, UK
Present Address:M. D. ReaneyERT, Peterborough Business Park, Lynch Wood,Peterborough PE2 6FZ, UK
J. LorraineEli Lilly Canada, Toronto, ON, Canada
A. RodriguezEli Lilly Spain, Madrid, Spain
Diabetes Ther (2014) 5:225–242
DOI 10.1007/s13300-014-0065-z

total costs were significantly lower among
individuals who discontinued early. Among the
early discontinuation subgroup, restarting insulin
was associated with higher costs. Specifically:
11.3% higher acute care costs (P\0.001), 24.0%
higher outpatient costs (P\0.001), 80.2% higher
drug costs (P\0.001), and 30.3% higher total
costs (P\0.001), compared to patients who
discontinued early but did not restart insulin
therapy in the 1-year post-period.
Conclusion: Among patients with T2DM who
were initiated on insulin therapy, early
discontinuation of insulin and its subsequent
restart were associated with significantly higher
acute care costs, which may signal a more
complex and challenging subgroup of patients
who tend to be less engaged in outpatient care
and may have poorer long-term outcomes.
Keywords: Costs; Early discontinuation;
Insulin; Persistence; Restart; Type 2 diabetes
mellitus
INTRODUCTION
In the United States (US), an estimated 24.4
million adults aged 20–79 years, or 10.90% of
the population, have diabetes mellitus, with an
additional 13.94% estimated to have impaired
glucose tolerance [1]. The prevalence of diabetes
is growing steeply, with some projections
indicating that one in three Americans may
have the disease by the year 2050 if recent
incidence trends continue [2]. The impact of
diabetes on the US economy is vast: the annual
cost of the disease in 2012 was an estimated
$245 billion, comprising $176 billion in direct
medical costs and $69 billion in decreased
productivity [3]. Diabetes is currently the
leading cause of kidney failure, lower-limb
amputations (non-trauma related), and new
cases of blindness among US adults, as well as
one of the foremost causes of heart disease,
stroke, and death [4]. The vast majority of
individuals with diabetes (90–95%) have type
2 diabetes mellitus (T2DM) [5], which is
characterized by high blood glucose
(hyperglycemia) in the context of insulin
resistance and/or insulin deficiency [6].
Metformin therapy, in combination with
lifestyle interventions, is the first line of
treatment for T2DM [7]. However, many
patients will ultimately require insulin
therapy, either alone or in combination with
other agents to maintain glucose control [8].
Insulin therapy is the oldest and most effective
glucose-lowering treatment available [7], and
patients with T2DM who start on insulin soon
after the failure of oral antidiabetic drug (OAD)
therapy have a greater likelihood of attaining
the standard glycemic goal [glycated
hemoglobin (HbA1c) \7%] relative to those
whose insulin treatment is delayed [9, 10].
Previous research has highlighted the critical
importance of maintaining persistence
throughout the first several months of insulin
drug therapy. Specifically, a recent study of
patients with T2DM has demonstrated that the
largest improvements in HbA1c occur within
the first 90 days post-initiation of insulin [10].
However, some studies have indicated that
when patients stop taking their antidiabetic
medicines they do so approximately within the
first 90 days [11, 12]. The likelihood of
persistence with insulin therapy, in particular,
throughout the first 90 days of post-initiation is
currently unclear, as are the predictors and costs
of early discontinuation.
To begin to address this information gap, the
present retrospective study examined a US
nationwide sample of patients with T2DM to
identify observable characteristics associated
with early discontinuation of basal or mixed
insulin, and, among patients who discontinued
226 Diabetes Ther (2014) 5:225–242

early, the factors associated with restarting. In
addition, using patients’ cost data for the
12-month post-insulin initiation, this study
quantified different types of medical costs
associated with early discontinuation of
insulin therapy and its subsequent restart.
METHODS
Data for this cohort study were obtained from
the Truven Health Analytics Marketscan
Commercial Claims and Encounters (CCAE)
database. The CCAE database contains
retrospective claims information on patient
demographics, enrollment, inpatient,
outpatient, and prescription drug use from a
geographically diverse population living across
the US. The data used spanned the period from
January 1, 2008 through December 31, 2011
and were fully compliant with the Health
Insurance Portability and Accountability Act.
The analysis in this article is based on existing
data, and does not involve any new studies of
human or animal subjects performed by any of
the authors.
To be included in this investigation, an
individual had to have received a prescription
for basal or mixture insulin between July 1,
2008 and January 1, 2011. The date of the first
prescription was identified as the index date;
patients were required to be at least 18 years old
as of this date. They were also required to have
been identified as having T2DM either through
the coding of T2DM at least twice from
6 months before (the pre-period) to 12 months
after the index date (the post-period), or,
alternatively, through the coding of at least 1
diagnosis of T2DM and at least 1 prescription
for an OAD. Patients were excluded from the
study if they received a prescription for any
insulin in the pre-period or for basal or mixture
insulin with greater than or equal to 90 days’
supply in the first 90 days of the post-period
since there was no way to determine if such
individuals discontinued early (within the first
90 days). Individuals were also excluded if they
were diagnosed with gestational diabetes or
pregnancy at any time from the start of the
pre-period through the end of the post-period.
Finally, participants were required to have pre-
and post-period cost values greater than or
equal to zero and to have continuous
insurance coverage from the start of the pre-
period through the end of the post-period.
The study focused on the factors associated
with early discontinuation and the association
between early discontinuation and medical
costs, where early discontinuation was defined
as a gap of at least 30 days between the end of 1
prescription (based upon fill date and days
supplied) and the fill date for a subsequent
prescription. Note that early discontinuation
could be initiated by either the physician or the
patient and the reason for such an action is
unattainable in a claims database. In addition,
among patients identified as early
discontinuers, the factors associated with the
restart of insulin therapy were examined, as
were the associations between restarting insulin
and medical costs. Restarting was defined as
filling a prescription for insulin after a gap in
insulin use of at least 30 days. All analyses
controlled for patient characteristics, index
medication prescribed, general health status,
pre-period resource utilization, medication
usage, and comorbidities. Patient
characteristics included age, sex, region of
residence, and type of insurance coverage.
General health status and comorbidity burden
were proxied by the Charlson Comorbidity
Index (CCI) [13, 14]. Resource use in the pre-
period included indicator variables for
Diabetes Ther (2014) 5:225–242 227

hospitalization or emergency room (ER) visits
and total medical costs. Comorbid diagnoses
identified in the pre-period included micro- and
macrovascular complications, obesity,
depression, dementia, alcohol abuse, and other
mental health disorders. Pre-period medication
use included any usage of an OAD,
antidepressant, or other mental health-related
medication as well as the total number of
antidiabetic medications and all-cause drug
classes prescribed. Index medication
characteristics included human or analog, pen
or vial, basal or mixture, and copayment
amount.
Descriptive statistics (mean and standard
deviation for continuous variables, and
frequency and percentages for categorical
variables) were used to characterize the
sample; t tests and Chi-square tests assessed
differences between the cohorts. Separate
logistic regressions examined the likelihood of
being an early discontinuer and the likelihood
of restarting insulin therapy among early
discontinuers. In addition, general linear
models with a gamma distribution and log
link analyzed costs, where costs were proxied
as gross payments to a provider for a service.
The analyses focused on total medical as well as
component costs, including: acute care (e.g.,
hospitalization and ER), outpatient, all-cause
drug, and diabetes-related drug. All costs were
measured over the entire 1-year post-period and
were inflated to 2011 US dollars using the
medical component of the consumer price
index [15]. Kaplan–Meier curves also examined
the time to discontinuation among all
individuals and the time to restart among
individuals who discontinued early. When
examining time to discontinuation the
analysis controlled for censoring among
individuals who started a gap in therapy in the
11th month after the index date; such persons
could not be identified as discontinuers since
30 days of data post-gap initiation was
unavailable. Among the early discontinuation
cohort, censoring controlled for the fact that
the time from restart to the end of the post-
period differed across individuals.
To assess the robustness of the findings, all
analyses were repeated four times. Specifically,
the definition of discontinuation was modified
from a minimum gap of 30 days to consider
minimum gaps of 60, 90, or 120 days.
Furthermore, the analyses controlled for the
possibility of sample selection among use of
basal compared to mixed insulin by utilizing a
Heckman two-stage sample selection model
[16]. All analyses were conducted using SAS,
version 9.3 (SAS Institute Inc., Cary, NC, USA).
A P value \0.05 was considered to be
statistically significant.
RESULTS
The final sample consisted of 74,399 individuals
and Table 1 illustrates how each of the inclusion
and exclusion criteria affected sample size.
Table 2 presents the descriptive statistics for
the entire cohort. Results revealed that the
mean patient age was 51.0 years (SD 9.0) years
and that just over half of patients (54.0%) were
male. In addition, 45.5% resided in the South
and 60.6% were insured via a preferred provider
organization. Basal rather than mixture was
more commonly the first insulin prescribed.
Analog was more commonly prescribed than
human insulin, and a pen was prescribed
initially more frequently than a vial. A
majority of patients received at least one OAD
in the pre-period. Macrovascular complications
were diagnosed in the pre-period for 16.5% of
patients; mental health disorder in 11.1%.
228 Diabetes Ther (2014) 5:225–242

Early Discontinuation
A Kaplan–Meier survival curve shows time to
discontinuation for the whole cohort (Fig. 1).
After controlling for data censoring, Fig. 1
reveals that discontinuation occurred relatively
early after initiation of insulin. Specifically, the
estimated probability of discontinuation was
82.0% in the first year, 61.5% in the first
90 days, and 41.0% in the first 31 days.
Table 2 also shows descriptive characteristics
based on early discontinuation status. Patients
who discontinued early, compared to those
who did not, were significantly younger, as
well as more likely to be female and to reside in
the South. Furthermore, early discontinuers
were significantly more likely to be initiated
on basal insulin and a pen. Early discontinuers
were significantly more likely in the pre-period
to have had a hospital stay, an ER visit, and
higher mean total medical costs. However, on
average, patients who did not discontinue early
used more types of antidiabetic and all-cause
medications; they also had greater use of
antidepressants, and psychiatric medication
and a higher prevalence of macrovascular
complications.
Table 3 examines factors associated with a
change in the likelihood of early
discontinuation. Results revealed that
observable factors, such as patient
characteristics, type of index medication
prescribed, prior resource use, comorbid
conditions and other medications prescribed
all were associated with changes in the
likelihood of early discontinuation. Older age,
and residence in the Northeast, the North
Central region, or the West, as compared to
the South, were associated with a lower
likelihood of early discontinuation. Females
Table 1 Inclusion–exclusion criteria and sample size
Criteria Sample size
1. Initiation on basal or mixture insulin, with first such date identified as index date 707,143
2. No receipt of an insulin prescription with a day’s supply of C90 in first 90 days of post-period 537,556
3. No insulin use (basal, bolus, or mixture) in 6 months prior to index date (e.g., the pre-period) 479,475
4. No receipt of an insulin prescription with 0 days supply or missing days supply in the post-period 472,863
5. Age at least 18 on index date 455,740
6. Identified as having type 2 diabetes mellitus based upon either: 392,553
a. Receipt of at least two diagnoses of type 2 diabetes from start of the pre-period through 1-year post-index
date (e.g., the post-period), or
b. Receipt of one diagnosis of type 2 diabetes from the start of the pre-period through the end of the
post-period and receipt of an oral antidiabetic medication in the pre-period
7. No diagnosis of gestational diabetes or pregnancy at any time from the start of the pre-period through
the end of the post-period
382,412
8. Continuous insurance coverage from the start of the pre-period through 12 months post-index date
(e.g., the post-period)
74,531
9. Pre-period and post-period costs C0 74,399
Diabetes Ther (2014) 5:225–242 229

Table 2 Descriptive statistics—entire cohort and by early discontinuation status
Entire sample(N 5 74,399)
No earlydiscontinuation(N 5 28,667)
Earlydiscontinuation(N 5 45,732)
P value
N or mean % or SD N or mean % or SD N or mean % or SD
Patient characteristics
Age (mean; SD) 51.0 9.0 51.7 8.7 50.5 9.2 \0.001
Sex \0.001
Male 40,197 54.0 15,883 55.4 24,314 53.2
Female 34,202 46.0 12,784 44.6 21,418 46.8
Region \0.001
Northeast 9,856 13.3 4,202 14.7 5,654 12.4
North Central 18,054 24.3 7,324 25.6 10,730 23.5
South 33,816 45.5 12,228 42.7 21,588 47.2
West 11,330 15.2 4,394 15.3 6,936 15.2
Unknown 1,343 1.8 519 1.8 824 1.8
Insurance plan type \0.001
Comprehensive 1,826 2.5 741 2.6 1,085 2.4
Exclusive provider organization 835 1.1 309 1.1 526 1.2
Health maintenance organization 12,858 17.3 4,686 16.4 8,172 17.9
Point of service 5,919 8.0 2,246 7.8 3,673 8.0
Preferred provider organization 45,048 60.6 17,418 60.8 27,630 60.4
Point of service with capitation 341 0.5 129 0.5 212 0.5
Consumer-directed health plan 2,214 3.0 919 3.2 1,295 2.8
High deductible health plan 917 1.2 379 1.3 538 1.2
Unknown 4,441 6.0 1,840 6.4 2,601 5.7
Index medication
Human vs. analog 0.160
Analog 67,118 90.2 25,917 90.4 41,201 90.1
Human 7,281 9.8 2,750 9.6 4,531 9.9
Basal vs. mixture \0.001
Basal 65,990 88.7 25,063 87.4 40,927 89.5
Mixture 8,409 11.3 3,604 12.6 4,805 10.5
Administration mode \0.001
Pen 44,065 59.2 16,101 56.2 27,964 61.2
230 Diabetes Ther (2014) 5:225–242

were more likely to be early discontinuers
compared to males, as were patients insured
with a health maintenance compared to a
preferred provider organization. When
examining the index prescription of insulin,
results revealed that patients who were
prescribed analog rather than human insulin,
a vial instead of a pen, or mixture instead of
basal were significantly less likely to be early
discontinuers.
Table 3 also shows that the pre-period
variables associated with a higher likelihood of
early discontinuation were: visits to the ER,
higher total costs, receipt of an OAD, or a
diagnosis of comorbid depression. In contrast, a
comorbid diagnosis of obesity was associated
Table 2 continued
Entire sample(N 5 74,399)
No earlydiscontinuation(N 5 28,667)
Earlydiscontinuation(N 5 45,732)
P value
N or mean % or SD N or mean % or SD N or mean % or SD
Vial 30,334 40.8 12,566 43.8 17,768 38.9
Copayment (mean; SD) 26.7 27.4 26.2 25.8 27.1 28.3 \0.001
Pre-period variables
Charlson comorbidity index
(mean; SD)
1.7 1.4 1.7 1.4 1.7 1.4 0.195
Hospitalized 16,626 22.4 6,241 21.8 10,385 22.7 0.003
Emergency room visit 22,270 29.9 8,256 28.8 14,014 30.6 \0.001
Use of oral antidiabetic medication 50,992 68.5 20,075 70.0 30,917 67.6 \0.001
Number of antidiabetic medication
classes (mean; SD)
1.9 1.5 2.0 1.5 1.8 1.4 \0.001
Number of all-cause medication
classes (mean; SD)
6.5 4.4 6.7 4.5 6.3 4.3 \0.001
Microvascular complication 5,276 7.1 2,057 7.2 3,219 7.0 0.480
Macrovascular complication 12,290 16.5 4,918 17.2 7,372 16.1 \0.001
Depression 2,609 3.5 1,006 3.5 1,603 3.5 0.977
Obesity 5,955 8.0 2,361 8.2 3,594 7.9 0.065
Dementia 51 0.1 15 0.1 36 0.1 0.181
Alcohol use disorder 595 0.8 228 0.8 367 0.8 0.915
Mental health disorder 8,224 11.1 3,141 11.0 5,083 11.1 0.504
Use of antidepressant 14,995 20.2 6,381 22.3 8,614 18.8 \0.001
Psychiatric medication use 14,476 19.5 5,752 20.1 8,724 19.1 \0.001
Total healthcare costs (mean; SD) 13,963 42,048 13,391 38,206 14,322 44,284 0.002
Diabetes Ther (2014) 5:225–242 231
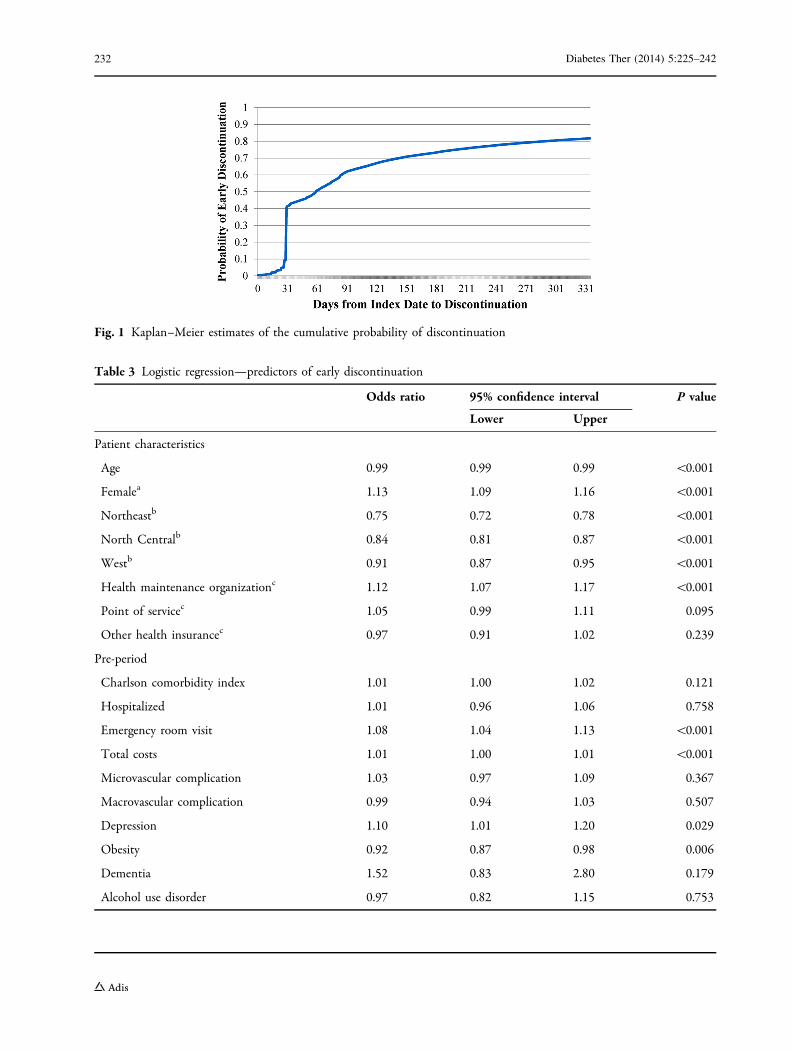
Fig. 1 Kaplan–Meier estimates of the cumulative probability of discontinuation
Table 3 Logistic regression—predictors of early discontinuation
Odds ratio 95% confidence interval P value
Lower Upper
Patient characteristics
Age 0.99 0.99 0.99 \0.001
Femalea 1.13 1.09 1.16 \0.001
Northeastb 0.75 0.72 0.78 \0.001
North Centralb 0.84 0.81 0.87 \0.001
Westb 0.91 0.87 0.95 \0.001
Health maintenance organizationc 1.12 1.07 1.17 \0.001
Point of servicec 1.05 0.99 1.11 0.095
Other health insurancec 0.97 0.91 1.02 0.239
Pre-period
Charlson comorbidity index 1.01 1.00 1.02 0.121
Hospitalized 1.01 0.96 1.06 0.758
Emergency room visit 1.08 1.04 1.13 \0.001
Total costs 1.01 1.00 1.01 \0.001
Microvascular complication 1.03 0.97 1.09 0.367
Macrovascular complication 0.99 0.94 1.03 0.507
Depression 1.10 1.01 1.20 0.029
Obesity 0.92 0.87 0.98 0.006
Dementia 1.52 0.83 2.80 0.179
Alcohol use disorder 0.97 0.82 1.15 0.753
232 Diabetes Ther (2014) 5:225–242

with a significantly lower likelihood of early
discontinuation, as was the use of more
antidiabetic medications, more classes of
medications for any cause, or an antidepressant.
Figure 2 examines the association between
early discontinuation and costs, after
controlling for patient characteristics, index
medication prescribed, general health, pre-
period comorbidities, resource utilization, and
medication usage. Given that we used a
generalized linear model with a gamma
distribution and log link, the exponentiated
coefficient associated with early
discontinuation (eb) could be easily interpreted
Fig. 2 Association between early discontinuation and costs estimated percentage change in costs associated with earlydiscontinuation
Table 3 continued
Odds ratio 95% confidence interval P value
Lower Upper
Mental health disorder 1.05 1.00 1.10 0.071
Use of oral antidiabetic medication 1.13 1.08 1.18 \0.001
Number of antidiabetic medications classes 0.92 0.90 0.93 \0.001
Number of classes of all-cause medications 0.99 0.98 0.99 \0.001
Use of antidepressant 0.84 0.80 0.87 \0.001
Use of other mental health medications 1.04 1.00 1.09 0.060
Index prescription
Analogd 0.78 0.74 0.83 \0.001
Viale 0.73 0.71 0.75 \0.001
Mixturef 0.74 0.70 0.78 \0.001
Copayment 1.00 1.00 1.00 0.187
Reference categories: amale, bSouth, cpreferred provider organization, dhuman insulin, epen, fbasal insulin
Diabetes Ther (2014) 5:225–242 233

[17] and provided the proportional change in
costs for each covariate [18]. Results revealed
that early discontinuation was associated with
9.6% significantly higher acute care costs
(P\0.0001) and significantly lower outpatient,
diabetes drug, all-cause drug, and total costs.
Restarting Insulin Therapy
Figure 3 examines the cumulative probability of
restarting insulin therapy among those who
discontinued early. Results revealed that,
among those who discontinued early, there
was a 90.3% probability of restarting within
the first year post-initiation. The probability of
restarting within 3 months of discontinuation
was 55.3%, while the probability of restarting
within 6 months was 77.5%. Among those who
restarted, the average time between
discontinuation and restart was 160 days (SD
82.0 days). During this time period, 57.5% of
patients received a prescription for an OAD,
while 3.7% received a prescription for both an
OAD and an injectable non-insulin antidiabetic
agent; 37.8% received no antidiabetic
medication.
Among the early discontinuers, there were a
number of statistically significant differences
between those who restarted insulin therapy
and those who did not (Table 4). Specifically,
patients who restarted were older and less likely
to reside in the South. Furthermore, patients
who restarted insulin therapy were significantly
more likely to have had an index prescription
for analog compared to human insulin, basal
relative to mixture and pens rather than vials.
Finally, patients who restarted were less likely to
have had a pre-period hospitalization or ER visit
and, in the pre-period, they also had lower total
medical costs.
Table 5 examines factors associated with a
change in the likelihood of restarting insulin
from multivariable analysis. Consistent with
the unadjusted statistics presented in Table 4,
factors associated with a higher likelihood of
restarting insulin within the 1-year period of
observation were: being older, being female,
and residing in the North Central US rather
than the South. Factors associated with a lower
likelihood of restarting were: using a vial rather
than a pen, using mixture rather than basal, and
having a higher index medication copayment.
Patients with more pre-period hospitalizations
or ER visits were also less likely to restart insulin
therapy, while those who, in the pre-period,
used more medications in general or more
Fig. 3 Kaplan–Meier estimates of the cumulative probability of restarting among early discontinuers
234 Diabetes Ther (2014) 5:225–242

Table 4 Descriptive statistics for early discontinuers—by restart status
No restart (N 5 4,422) Restart (N 5 41,310) P value
N or mean % or SD N or mean % or SD
Patient characteristics
Age (mean; SD) 49.1 9.7 50.7 9.1 \0.001
Sex \0.001
Male 2,513 56.8 21,801 52.8
Female 1,909 43.2 19,509 47.2
Region 0.001
Northeast 537 12.1 5,117 12.4
North Central 947 21.4 9,783 23.7
South 2,181 49.3 19,407 47.0
West 652 14.7 6,284 15.2
Unknown 105 2.4 719 1.7
Insurance plan type 0.070
Comprehensive 99 2.2 986 2.4
Exclusive provider organization 45 1.0 481 1.2
Health maintenance organization 733 16.6 7,439 18.0
Point of service 351 7.9 3,322 8.0
Preferred provider organization 2,739 61.9 24,891 60.3
Point of service with capitation 16 0.4 196 0.5
Consumer-directed health plan 119 2.7 1,176 2.9
High deductible health plan 68 1.5 470 1.1
Unknown 252 5.7 2,349 5.7
Index medication
Human vs. analog \0.001
Analog 3,895 88.1 37,306 90.3
Human 527 11.9 4,004 9.7
Basal vs. mixture \0.001
Basal 3,819 86.4 37,108 89.8
Mixture 603 13.6 4,202 10.2
Administration mode \0.001
Pen 2,159 48.8 25,805 62.5
Vial 2,263 51.2 15,505 37.5
Copayment (mean; SD) 29.3 44.7 26.8 25.9 \0.001
Diabetes Ther (2014) 5:225–242 235

antidiabetic medications in particular were
more likely to restart their insulin therapy.
Figure 4 examines the association between
restarting and total costs over the 1-year post-
period, including periods of treatment with
insulin and periods of treatment without
insulin, among those who discontinued early.
After controlling for patient characteristics,
index medication, general health, medications
prescribed, and comorbidities among the early
discontinuers, our analyses revealed that those
who restarted insulin had significantly higher
medical costs than those who did not.
Specifically, relative to the early discontinuers
who did not restart, the restarters had higher
costs in all of the following areas: acute care
(11.3%; P\0.001), outpatient (24.0%;
P\0.001), diabetes-related drug (112.9%;
P\0.001), all-cause drug (80.2%; P\0.001),
and total medical (30.3%; P\0.001).
Sensitivity of Results
Results from the multiple sensitivity analyses
revealed few differences compared to the main
results reported. As expected, both the
probability of discontinuation and the odds of
restarting declined as the length of the
minimum gap in therapy required to be
defined as a discontinuer increased from 30 to
60, 90, or 120 days. As the duration of gap days
required for discontinuation increased, the
Table 4 continued
No restart (N 5 4,422) Restart (N 5 41,310) P value
N or mean % or SD N or mean % or SD
Pre-period variables
Charlson comorbidity index (mean; SD) 1.7 1.6 1.63 1.4 \0.001
Hospitalized 1,564 35.4 8,821 21.4 \0.001
Emergency room visit 1,830 41.4 12,184 29.5 \0.001
Receipt of oral medication 2,254 51.0 28,663 69.4 \0.001
Number of antidiabetic medication classes (mean; SD) 1.3 1.3 1.9 1.4 \0.001
Number of all-cause medication classes (mean; SD) 5.1 4.3 6.4 4.3 \0.001
Microvascular complication 278 6.3 2,941 7.1 0.040
Macrovascular complication 839 19.0 6,533 15.8 \0.001
Depression 144 3.3 1,459 3.6 0.344
Obesity 467 10.6 3,127 7.6 \0.001
Dementia 5 0.1 31 0.1 0.392
Alcohol use disorder 59 1.3 308 0.8 \0.001
Mental health disorder 585 13.2 4,498 10.9 \0.001
Use of antidepressant 611 13.8 8,003 19.4 \0.001
Psychiatric medication use 736 16.6 7,998 19.3 \0.001
Total costs (mean; SD) 21,454 68,454 13,559 40,786 \0.001
236 Diabetes Ther (2014) 5:225–242

Table 5 Logistic regression—predictors of restart among early discontinuers
Odds ratio 95% confidence interval P value
Lower Upper
Patient characteristics
Age 1.01 1.01 1.01 \0.001
Femalea 1.07 1.00 1.14 0.041
Northeast regionb 1.06 0.95 1.17 0.301
North Central regionb 1.16 1.07 1.26 \0.001
West regionb 1.03 0.93 1.13 0.574
Health maintenance organizationc 1.07 0.98 1.17 0.152
Point of servicec 1.02 0.90 1.14 0.808
Other health insurancec 0.97 0.86 1.10 0.619
Pre-period
Charlson comorbidity index 0.98 0.96 1.01 0.160
Hospitalized 0.68 0.62 0.75 \0.001
Emergency room visit 0.88 0.81 0.95 0.002
Total costs 0.99 0.98 1.00 \0.001
Microvascular complication 1.20 1.05 1.37 0.006
Macrovascular complication 1.01 0.91 1.11 0.921
Depression 1.18 0.98 1.42 0.077
Obesity 0.87 0.78 0.97 0.015
Dementia 0.98 0.37 2.57 0.960
Alcohol use disorder 0.90 0.67 1.21 0.485
Mental health disorder 0.92 0.83 1.02 0.099
Use of oral antidiabetic medication 1.19 1.07 1.31 \0.001
Number of antidiabetic medications classes 1.11 1.07 1.16 \0.001
Number of classes of all-cause medications 1.04 1.03 1.05 \0.001
Use of antidepressant 1.12 1.01 1.24 0.034
Use of other mental health medications 0.95 0.87 1.05 0.343
Index prescription
Analogd 0.90 0.80 1.00 0.058
Viale 0.70 0.66 0.75 \0.001
Mixturef 0.80 0.73 0.89 \0.001
Copayment 1.00 1.00 1.00 0.001
Reference categories: amale, bSouth, cpreferred provider organization, dhuman insulin, epen
Diabetes Ther (2014) 5:225–242 237

estimated association between early
discontinuation and all costs (acute care,
outpatient, diabetes drug, all-cause drug, and
total) became greater. Among those who
discontinued early, as the gap in days required
to be identified as a discontinuer grew, the
association between restart and acute care costs
increased. However, the association between
restart and outpatient, diabetes drug, all-cause
drug, and total costs all decreased. Note though,
that in all cases, there was no change in either
the sign or the statistical significance associated
with the main analyses. Likewise, the sample
selection model revealed little difference
compared to the main analyses reported.
DISCUSSION
Consistent with earlier studies of persistence
with antidiabetic treatments of various kinds
[11, 12, 19], this examination of basal and
mixture insulin initiators found that early
discontinuation is prevalent. Indeed, the
probability of discontinuation of insulin in the
first 90 days was 61.5%, with a 41.0%
probability of discontinuation within the first
31 days. These results highlight the importance
of the first 90 days of therapy from both the
clinician and payer perspectives. Moreover,
these findings elucidate the need to assess
restart of the treatment among patients who
have discontinued early. Notably, focusing only
on early discontinuation in the present study
would have provided a partial and inaccurate
picture of the true insulin therapy attrition rate,
given the 90.3% probability of restarting during
the first year post-initiation.
Identifying Early Discontinuers
and Restarters
This study revealed a distinct set of identifiable
predictors that may help recognize early
discontinuers and non-restarters even prior to
initiating insulin therapy. This information
may help target these patients for adherence/
persistence interventions, which may in turn
help reduce the use and cost of acute care
(hospitalization and ER) and improve patients’
long-term outcomes. In particular, the early
discontinuers in this study, compared to the
patients who persisted on therapy past the first
Fig. 4 Association between restart and costs among early discontinuers—estimated percentage change in costs associatedwith restart
238 Diabetes Ther (2014) 5:225–242

90 days, appeared to be less engaged in
outpatient care, as indicated by their lower
outpatient costs and greater likelihood of pre-
period ER use. These findings are consistent
with previous research linking greater
outpatient engagement with improvement in
glycemic control [20].
In addition, while patients diagnosed with
depression were more likely to discontinue
early, those prescribed an antidepressant were
less likely to discontinue early. These findings
further highlight the importance of outpatient
care and are consistent with previous research
showing an association between comorbid
depression and poor adherence among
patients with T2DM [21], as well as with
studies showing that medication adherence
and glycemic outcomes improve among
patients with T2DM when their depression is
treated [22].
Early Discontinuers are Likely to Restart
Insulin Therapy
Among early discontinuers, the probability of
restarting therapy in the post-period was high
(90.3%), pointing not only to a low treatment
attrition rate but also to the realization that
early discontinuation appears to reflect a
temporary interruption of the long-term
treatment process rather than a true and
complete cessation. The probability of
restarting was 55.3% within 3 months of the
discontinuation date and 77.5% within
6 months. Importantly, an earlier study, which
looked at persistence over a 10-year period,
found similar results: most patients (57.9%)
discontinued antidiabetic drug treatment at
some point over the decade, but most
discontinuers restarted, with only 8–10% of
insulin users discontinuing and never
restarting [19]. Moreover, the earlier study also
reported that most discontinuers lapsed early—
in that investigation within the first year post-
diagnosis—and that after restarting generally
did not lapse again throughout the decade [19].
Taken together, the evidence from the present
study and the earlier investigation may be
useful not only for motivating better
persistence on insulin but also for setting
realistic treatment expectations.
High Burden of Early Discontinuation
and Restart
Our study exposed another strong incentive for
maintaining persistence on insulin therapy:
early discontinuation and restart of insulin are
associated with adverse economic and
humanistic ramifications. Compared to non-
early discontinuation, early discontinuation
was associated with significantly greater acute
care costs. In particular, the early discontinuers
had 9.6% higher acute care costs compared to
the patients who did not discontinue early. As it
has been argued previously, it is important in
the treatment of chronic disease to go beyond
assessing patients’ total medical costs and to
distinguish between expectable and
unexpectable medical costs [23]. Expectable
costs are those incurred to support
comprehensive and continuous care and tend
to reflect patients’ engagement in their
treatment. Such costs often include routine
outpatient care, medications, and various
medical tests and supplies and may be
justifiable in light of the considerable
intangible costs (e.g., human suffering)
prevented [23]. In contrast, unexpectable costs
are those incurred for acute or intensive care,
such as ER services and hospitalization. Such
costs are potentially modifiable and avoidable
and are often linked to poorer long-term
treatment outcomes.
Diabetes Ther (2014) 5:225–242 239

Finally, the present study revealed that
restarting insulin therapy provided no
mitigation of the higher costs linked to early
discontinuation. Indeed, the direct costs of the
restarterswerehigher thanthoseofnon-restarting
early discontinuers, both in total and in
component costs, including those associated
with acute care. It may be that a hospitalization
or an ER visit was the precipitating event for the
restart of insulin. A large body of literature on
T2DM has likewise shown a link between poor
adherence and worse outcomes, including an
increased risk of hospitalization [24–29].
Limitations
The results of this study should be viewed in the
context of its potential limitations. First, the
analyses were based on observational health-
claims data which may affect the
generalizability of the results. For instance, the
analysis included only individuals with
continuous medical and prescription benefit
coverage over an 18-month period and
excluded patients who received a 3-month or
greater supply of insulin with their initial
prescription, since there was no way to
determine whether such patients discontinued
early. Second, the use of diagnostic codes is not
as rigorous as formal assessments for identifying
patients with T2DM, and may under-represent
certain conditions, such as obesity or alcohol
abuse. Third, the use of claims data precluded
an examination of associations between health
outcomes and factors such as race, body mass
index, or duration of diabetes. Fourth, the
dataset did not allow for a study of the causes
of discontinuation or restart; for instance,
neither the initiator (physician or patient) nor
the reason for the discontinuation or restart
could be determined. Fifth, the follow-up
period was relatively short and, hence, did not
allow for investigation of whether secondary or
primary persistence was better in restarters.
Finally, the analysis focused on statistical
significance and is unable to determine
whether differences in outcomes represent
minimal clinically important differences.
Given these limitations, we believe that these
results should be generally representative of
clinical practice, as the Truven Health Analytics
Marketscan CCAE database contains
information from a large, geographically
diverse US population. Furthermore, results
reported here were generally consistent with
alternative models which controlled for sample
selection and allowed for at least a 60, 90, or
120-day gap in insulin therapy before
identifying a patient as having discontinued.
CONCLUSION
In this study of patients with T2DM who were
initiated on insulin therapy, more than half
discontinued within the first 3 months but
almost all of these early discontinuers restarted
therapy a few months later. These findings
highlight the importance of the first 90 days of
insulin therapy and the need togobeyond routine
assessment of persistence and also to capture
restart of therapy, which appears to be highly
prevalent. This study identified specific predictors
of earlydiscontinuationand restartof insulin, and
thus may enable timely identification of patients
for targeted interventions that could improve
persistence, reduce healthcare costs, and improve
long-term outcomes. Furthermore, early
discontinuation and restart of insulin therapy
appear to be associated with significantly higher
acute care (hospitalization and ER) costs that are
potentially avoidable and may signal a more
complex and challenging subgroup of patients
who tend tobe less engaged inoutpatient care and
have poorer long-term outcomes.
240 Diabetes Ther (2014) 5:225–242

ACKNOWLEDGMENTS
Patricia Platt assisted in the writing of the
manuscript and Joyce Healey, from Words
With Joyce, LLC, assisted in the editing of this
manuscript. Patricia Platt and Joyce Healey were
compensated by HealthMetrics Outcomes
research for their work on this project.
Maureen J. Lage and Michael Treglia were
compensated by Eli Lilly and Company for
their work on the project, while Joanne
Lorraine, Magaly Perez-Nieves, Matthew D.
Reaney, Angel Rodriguez, and Haya Ascher-
Svanum, were employed by Eli Lilly and
Company while working on this project. Eli
Lilly and Company provided funding for all
article processing fees.
Haya Ascher-Svanum was responsible for study
design of this project. Maureen J. Lage and
Michael Treglia were responsible for analyses.
All authors contributed to the writing and
review of the manuscript. Haya Ascher-
Svanum is the guarantor for this manuscript.
Maureen J. Lage is the corresponding author for
this manuscript. All named authors meet the
ICMJE criteria for authorship for this
manuscript, take responsibility for the
integrity of the work as a whole, and have
given final approval for the version to be
published.
Conflict of interest. Maureen J. Lage was
compensated by Eli Lilly and Company for their
work on this project. Michael Treglia was
compensated by Eli Lilly and Company for
their work on this project. Haya Ascher-
Svanum, conducted this research as an
employee and shareholder of Eli Lilly and
Company. Magaly Perez conducted this
research as an employee and shareholder of Eli
Lilly and Company. Joanne Lorraine conducted
this research as an employee and shareholder of
Eli Lilly and Company. Matthew D. Reaney
conducted this research as an employee and
shareholder of Eli Lilly and Company. Angel
Rodriguez conducted this research as an
employee and shareholder of Eli Lilly and
Company.
Compliance with ethics guidelines. The
analysis in this article is based on existing
data, and does not involve any new studies of
human or animal subjects performed by any of
the authors.
Open Access. This article is distributed
under the terms of the Creative Commons
Attribution Noncommercial License which
permits any noncommercial use, distribution,
and reproduction in any medium, provided the
original author(s) and the source are credited.
REFERENCES
1. International Diabetes Foundation. IDF DiabetesAtlas. 6th ed; 2013. http://www.idf.org/sites/default/files/EN_6E_Atlas_Full_0.pdf (last accessedJan 26, 2014).
2. Boyle JP, Thompson TJ, Gregg EW, Barker LE,Williamson DF. Projection of the year 2050burden of diabetes in the US adult population:dynamic modeling of incidence, mortality, andprediabetes prevalence. Popul Health Metrics.2010;8:29.
3. American Diabetes Association. Economic costs ofdiabetes in the U.S. in 2012. Diabetes Care.2013;36:1033–46.
4. Centers for Disease Control and Prevention. CDC—fast facts on diabetes—2011 National Diabetes FactSheet—publications—diabetes DDT [Internet].Centers for Disease Control and Prevention; 2013.http://www.cdc.gov/diabetes/pubs/factsheet11/fastfacts.htm (last accessed Jan 26, 2014).
5. American Diabetes Association. Diagnosis andclassification of diabetes mellitus. Diabetes Care.2013;36(Suppl 1):S67–74.
Diabetes Ther (2014) 5:225–242 241

6. Kumar V, Abbas AK, Fausto N, Robbins SL, CotranRS. Robbins and Cotran pathologic basis of disease.Philadelphia: Elsevier Saunders; 2005.
7. Nathan DM, Buse JB, Davidson MB, et al. Medicalmanagement of hyperglycemia in type 2 diabetes: aconsensus algorithm for the initiation andadjustment of therapy: a consensus statement ofthe American Diabetes Association and theEuropean Association for the Study of Diabetes.Diabetes Care. 2009;32:193–203.
8. Inzucchi SE, Bergenstal RM, Buse JB, et al.Management of hyperglycemia in type 2 diabetes:a patient-centered approach position statement ofthe American Diabetes Association (ADA) and theEuropean Association for the Study of Diabetes(EASD). Diabetes Care. 2012;35:1364–79.
9. Nichols GA, Kimes TM, Harp JB, Kou TD, BrodoviczKG. Glycemic response and attainment of A1Cgoals following newly initiated insulin therapy fortype 2 diabetes. Diabetes Care. 2012;35:495–7.
10. Oguz A, Benroubi M, Brismar K, et al. Clinicaloutcomes after 24 months of insulin therapy inpatients with type 2 diabetes in five countries:results from the TREAT study. Curr Med Res Opin.2013;29:911–20.
11. Boccuzzi SJ, Wogen J, Fox J, Sung JC, Shah AB, KimJ. Utilization of oral hypoglycemic agents in a drug-insured U.S. population. Diabetes Care.2001;24:1411–5.
12. Catalan VS, Couture JA, LeLorier J. Predictors ofpersistence of use of the novel antidiabetic agentacarbose. Arch Intern Med. 2001;161:1106–12.
13. D’Hoore W, Sicotte C, Tilquin C. Risk adjustment inoutcome assessment: the Charlson comorbidityindex. Methods Inf Med. 1993;32:382–7.
14. Quan H, Sundararajan V, Halfon P, Fong A,Burnand B, Luthi J-C, et al. Coding algorithms fordefining comorbidities in ICD-9-CM and ICD-10administrative data. Med Care. 2005;43:1130–9.
15. U.S. Bureau of Labor Statistics [Internet]. http://bls.gov/ (last accessed Jan 26, 2014).
16. Heckman JJ. Sample selection bias as a specificationerror. Econometrica. 1979;47:153–61.
17. Griswold M, Parmigiani G, Potoskey A, Lipscomb J.Analyzing health care costs: a comparison ofstatistical methods motivated by Medicarecolorectal cancer charges. Biostatistics. 2004;1:1–23.
18. Halpern R, Becker L, Iqbal SU, Kazis LE, Macarios D,Badamgarav E. The association of adherence to
osteoporosis therapies with fracture, all-causemedical costs, and all-cause hospitalizations: aretrospective claims analysis of female health planenrollees with osteoporosis. J Manag Care Pharm.2011;17:25–39.
19. Brown JB, Nichols GA, Glauber HS, Bakst A. Ten-year follow-up of antidiabetic drug use,nonadherence, and mortality in a definedpopulation with type 2 diabetes mellitus. ClinTher. 1999;21:1045–57.
20. Rhee MK, Slocum W, Ziemer DC, et al. Patientadherence improves glycemic control. DiabetesEduc. 2005;31:240–50.
21. Gonzalez JS, Peyrot M, McCarl LA, et al. Depressionand diabetes treatment nonadherence: a meta-analysis. Diabetes Care. 2008;31:2398–403.
22. Bogner HR, Morales KH, de Vries HF, Cappola AR.Integrated management of type 2 diabetes mellitusand depression treatment to improve medicationadherence: a randomized controlled trial. Ann FamMed. 2012;10:15–22.
23. Tunis SL, Ascher-Svanum H, Stensland M, Kinon BJ.Assessing the value of antipsychotics for treatingschizophrenia: the importance of evaluating andinterpreting the clinical significance of individualservice costs. Pharmacoeconomics. 2004;22:1–8.
24. Balkrishnan R, Rajagopalan R, Camacho FT, HustonSA, Murray FT, Anderson RT. Predictors ofmedication adherence and associated health carecosts in an older population with type 2 diabetesmellitus: a longitudinal cohort study. Clin Ther.2003;25:2958–71.
25. Breitscheidel L, Stamenitis S, Dippel F-W, SchoffskiO. Economic impact of compliance to treatmentwith antidiabetes medication in type 2 diabetesmellitus: a review paper. J Med Econ. 2010;13:8–15.
26. Cramer JA. A systematic review of adherence withmedications for diabetes. Diabetes Care. 2004;27:1218–24.
27. Currie CJ, Peyrot M, Morgan CL, et al. The impact oftreatment noncompliance on mortality in peoplewith type2 diabetes. DiabetesCare. 2012;35:1279–84.
28. Ho P, Rumsfeld JS, Masoudi FA, et al. Effect ofmedication nonadherence on hospitalization andmortality among patients with diabetes mellitus.Arch Intern Med. 2006;166:1836–41.
29. Salas M, Hughes D, Zuluaga A, Vardeva K, LebmeierM. Costs of medication nonadherence in patientswith diabetes mellitus: a systematic review andcritical analysis of the literature. Value Health.2009;12:915–22.
242 Diabetes Ther (2014) 5:225–242