early childhood longitudinal study, kindergarten class of ... · the early childhood longitudinal...
TRANSCRIPT

Early Childhood Longitudinal Study, Kindergarten Class of 2010–11 (ECLS-K:2011)
User’s Manual for the ECLS-K:2011 Kindergarten–Fourth Grade Data File and Electronic Codebook, Public Version
NCES 2018-032 U.S. DEPARTMENT OF EDUCATION


Early Childhood Longitudinal Study, Kindergarten Class of 2010–11 (ECLS-K:2011)
User’s Manual for the ECLS-K:2011 Kindergarten–Fourth Grade Data File and Electronic Codebook, Public Version
MARCH 2018
Karen Tourangeau Christine Nord Thanh Lê Kathleen Wallner-Allen Nancy Vaden-Kiernan Lisa Blaker Westat
Michelle Najarian Educational Testing Service
Gail M. Mulligan Project Officer National Center for Education Statistics
NCES 2018-032
U.S. DEPARTMENT OF EDUCATION

U.S. Department of Education Betsy DeVos Secretary Institute of Education Sciences Thomas W. Brock Commissioner for Education Research Delegated Duties of the Director National Center for Education Statistics James L. WoodworthCommissioner
The National Center for Education Statistics (NCES) is the primary federal entity for collecting, analyzing, and reporting data related to education in the United States and other nations. It fulfills a congressional mandate to collect, collate, analyze, and report full and complete statistics on the condition of education in the United States; conduct and publish reports and specialized analyses of the meaning and significance of such statistics; assist state and local education agencies in improving their statistical systems; and review and report on education activities in foreign countries.
NCES activities are designed to address high-priority education data needs; provide consistent, reliable, complete, and accurate indicators of education status and trends; and report timely, useful, and high-quality data to the U.S. Department of Education, the Congress, the states, other education policymakers, practitioners, data users, and the general public. Unless specifically noted, all information contained herein is in the public domain.
We strive to make our products available in a variety of formats and in language that is appropriate to a variety of audiences. You, as our customer, are the best judge of our success in communicating information effectively. If you have any comments or suggestions about this or any other NCES product or report, we would like to hear from you. Please direct your comments to
NCES, IES, U.S. Department of Education 550 12th Street SW Washington, DC 20202
March 2018
The NCES Home Page address is https://nces.ed.gov. The NCES Publications and Products address is https://nces.ed.gov/pubsearch. This publication is only available online. To download, view, and print the report as a PDF file, go to the NCES Publications and Products address shown above. The Early Childhood Longitudinal Study, Kindergarten Class of 2010–11 (ECLS-K:2011) has been funded by the U.S. Department of Education, Institute of Education Sciences, under contract number ED-IES-12-C-0037 with Westat. This report was produced under that contract. Mention of trade names, commercial products, or organizations does not imply endorsement by the U.S. Government.
Suggested Citation Tourangeau, K., Nord, C., Lê, T., Wallner-Allen, K., Vaden-Kiernan, N., Blaker, L. and Najarian, M. (2018). Early Childhood Longitudinal Study, Kindergarten Class of 2010–11 (ECLS-K:2011) User’s Manual for the ECLS-K:2011 Kindergarten–Fourth Grade Data File and Electronic Codebook, Public Version (NCES 2018-032). U.S. Department of Education. Washington, DC: National Center for Education Statistics.
Content Contact Gail M. Mulligan (202) [email protected]
iii
CONTENTS
Chapter Page
LIST OF TABLES ................................................................................................................ ix
LIST OF EXHIBITS ............................................................................................................. xiv
1 INTRODUCTION ........................................................................................... 1-1
1.1 Background ......................................................................................... 1-2 1.2 Periods of Data Collection .................................................................. 1-2 1.3 Overview of the Fourth-Grade Round of Data Collection .................. 1-4 1.4 ECLS-K:2011 Kindergarten–Fourth Grade (K-4) Public-Use
Data File .............................................................................................. 1-5 1.5 Contents of Manual ............................................................................. 1-5
2 DATA COLLECTION INSTRUMENTS AND METHODS ......................... 2-1
2.1 Data Collection Instruments ............................................................... 2-1
2.1.1 Direct Child Assessment ..................................................... 2-3 2.1.2 Child Questionnaire ............................................................ 2-7 2.1.3 Parent Interview .................................................................. 2-9 2.1.4 General Classroom Teacher Questionnaires ....................... 2-13 2.1.5 Special Education Teacher Questionnaires ......................... 2-20 2.1.6 School Administrator Questionnaires ................................. 2-22 2.1.7 Copyrighted Materials ......................................................... 2-24
2.2 Data Collection Methods .................................................................... 2-25
2.2.1 Comparison of Data Collection Methods Used in Fourth Grade to Those Used in Earlier Data Collection Rounds ................................................................................ 2-25
3 ECLS-K:2011 DIRECT AND INDIRECT ASSESSMENT DATA ............... 3-1
3.1 Direct Cognitive Assessment: Reading, Mathematics, and Science ................................................................................................ 3-2
3.1.1 IRT-Based Scores Developed for the ECLS-K:2011 .......... 3-2
3.1.1.1 Theta and the Standard Error of Measurement (SEM) of Theta.............................. 3-3
3.1.1.2 Scale Scores ......................................................... 3-6
3.1.2 Variables Indicating Exclusion from the Direct Assessment Due to Disability ............................................. 3-8

iv
CONTENTS—Continued
Chapter Page
3.1.3 Choosing the Appropriate Score for Analysis ..................... 3-9 3.1.4 Analytic Considerations for Measuring Gains in the
ECLS-K:2011 ...................................................................... 3-10 3.1.5 Reliability of the ECLS-K:2011 Scores .............................. 3-11 3.1.6 Validity of the ECLS-K:2011 Scores .................................. 3-12
3.2 Direct Cognitive Assessment: Executive Function ............................. 3-14
3.2.1 Dimensional Change Card Sort .......................................... 3-14
3.2.1.1 Dimensional Change Card Sort Data Flags ........ 3-21
3.2.2 Numbers Reversed .............................................................. 3-24
3.2.2.1 Numbers Reversed Data Flags ............................ 3-31
3.2.3 The NIH Toolbox Flanker Inhibitory Control and Attention Task (Flanker) ..................................................... 3-32
3.2.3.1 Flanker Data Flag ................................................ 3-38
3.3 Child Questionnaire ............................................................................ 3-39 3.4 Teacher- and Parent-Reported Measures of Child Behavior and
Peer Relationships............................................................................... 3-41
3.4.1 Teacher-Reported Social Skills ........................................... 3-42 3.4.2 Teacher-Reported Approaches to Learning Items and
Scale .................................................................................... 3-46 3.4.3 Teacher-Reported Attentional Focusing and Inhibitory
Control: Children’s Behavior Questionnaire (CBQ) and Temperament in Middle Childhood Questionnaire (TMCQ) ............................................................................... 3-47
3.4.4 Parent-Report Working Memory ........................................ 3-52 3.4.5 Teacher- and Parent-Reports of Children’s Peer
Relationships ....................................................................... 3-53 3.4.6 Teacher- and Parent-Reports of Children’s School
Liking and Avoidance ......................................................... 3-56
4 SAMPLE DESIGN AND SAMPLING WEIGHTS ........................................ 4-1
4.1 Sample Design .................................................................................... 4-1
4.1.1 ECLS-K:2011 School Sample ............................................. 4-2 4.1.2 The Sample of Children ...................................................... 4-4

v
CONTENTS—Continued
Chapter Page
4.2 Sample Design for the First- Through Fourth-Grade Years ............... 4-7
4.2.1 Fall First Grade and Fall Second Grade .............................. 4-7 4.2.2 Spring First Grade Through Spring Fourth Grade .............. 4-14 4.2.3 Following Movers ............................................................... 4-22
4.3 Calculation and Use of Sample Weights ............................................ 4-25
4.3.1 Types of Sample Weights ................................................... 4-25 4.3.2 Computation of Sample Weights ........................................ 4-37
4.3.2.1 Student Base Weights .......................................... 4-37 4.3.2.2 Student Weights Adjusted for Mover
Subsampling ........................................................ 4-38 4.3.2.3 Student Nonresponse-Adjusted Weights ............. 4-38 4.3.2.4 Raking to Sample Control Totals ........................ 4-39
4.3.3 Characteristics of Sample Weights ..................................... 4-40 4.3.4 Variance Estimation ............................................................ 4-42
4.3.4.1 Jackknife Method ................................................ 4-42 4.3.4.2 Taylor Series Method .......................................... 4-43 4.3.4.3 Specifications for Computing Standard
Errors ................................................................... 4-44
4.3.5 Use of Design Effects .......................................................... 4-45
5 RESPONSE RATES ........................................................................................ 5-1
5.1 Study Instruments ............................................................................... 5-1 5.2 Unit Response Rates and Overall Response Rates ............................. 5-2 5.3 Nonresponse Bias Analysis ................................................................ 5-31
5.3.1 Effect of Nonresponse on Child Assessment Data .............. 5-32 5.3.2 Effect of Nonresponse on Parent Interview Data ................ 5-37 5.3.3 Effect of Nonresponse on Teacher Questionnaire Data ...... 5-43 5.3.4 Effect of Nonresponse on School Administrator
Questionnaire Data .............................................................. 5-48 5.3.5 Effect of Nonresponse on Characteristics from the
Base Year ............................................................................ 5-52

vi
CONTENTS—Continued
Chapter Page
6 DATA PREPARATION .................................................................................. 6-1
6.1 Coding Text Responses ...................................................................... 6-2
6.1.1 Household Roster Review ................................................... 6-2 6.1.2 Partially Complete Parent Interviews .................................. 6-3
6.2 Receipt, Coding, and Editing of Hard-Copy Questionnaires .............. 6-4
6.2.1 Receipt Control ................................................................... 6-4 6.2.2 Scanning of Hard-Copy Questionnaires .............................. 6-4 6.2.3 Coding for Hard-Copy Questionnaires ............................... 6-4 6.2.4 Data Editing ........................................................................ 6-4
7 DATA FILE CONTENT AND COMPOSITE VARIABLES ......................... 7-1
7.1 Variable Naming Conventions ............................................................ 7-2 7.2 Identification Variables ....................................................................... 7-4 7.3 Missing Values ................................................................................... 7-7 7.4 Data Flags ........................................................................................... 7-11
7.4.1 Child Assessment Flags (X8RDGFLG, X8MTHFLG, X8SCIFLG, X8NRFLG, X8NRGEST, X8DCCSFLG, X8FLNKFLG, X8HGTFLG, X8WGTFLG, X8ASMTST, X8EXDIS) .................................................... 7-11
7.4.2 Parent Data Flags (X8PARDAT, X8EDIT, X8BRKFNL) ....................................................................... 7-13
7.4.3 Teacher Flags (X8TQTDAT, X8TQZDAT, X8TQRDGDAT, X8TQMTHDAT, X8TQSCIDAT, X8MSFLAG, X8SETQA, X8SETQC) ............................... 7-14
7.4.4 School Administrator Data Flag (X8INSAQ) ..................... 7-16 7.4.5 Child Destination School Flag (X8DEST) .......................... 7-16
7.5 Composite Variables ........................................................................... 7-17
7.5.1 Child Composite Variables ................................................. 7-17
7.5.1.1 Child’s Date of Birth (X_DOBYY_R and X_DOBMM_R) ................................................... 7-17
7.5.1.2 Child’s Age at Assessment and the Date of Assessment (X8AGE, X8ASMTDD, X8ASMTMM, X8ASMTYY) ............................. 7-18
7.5.1.3 Child’s Sex (X_CHSEX_R) ................................ 7-18

vii
CONTENTS—Continued
Chapter Page
7.5.1.4 Race/Ethnicity (X_AMINAN_R, X_ASIAN_R, X_HAWPI_R, X_BLACK_R, X_WHITE_R, X_ HISP_R, X_MULTR_R, X_RACETHP_R, X _RACETH_R).................... 7-19
7.5.1.5 Child’s Height (X8HEIGHT) .............................. 7-21 7.5.1.6 Child’s Weight (X8WEIGHT) ............................ 7-22 7.5.1.7 Child’s Body Mass Index (X8BMI) .................... 7-23 7.5.1.8 Child’s Disability Status (X8DISABL2,
X8DISABL) ........................................................ 7-23 7.5.1.9 Student Grade Level (X8GRDLVL) ................... 7-25 7.5.1.10 Child Linked to a Special Education Teacher
(X8SPECS) .......................................................... 7-26
7.5.2 Family and Household Composite Variables ...................... 7-26
7.5.2.1 Household Counts (X8HTOTAL, X8NUMSIB, X8LESS18, X8OVER18) ............. 7-27
7.5.2.2 Household Rosters ............................................... 7-28 7.5.2.3 Parent Identifiers and Type in the Household
(X8IDP1, X8IDP2, X8HPAR1, X8HPAR2, X8HPARNT) ....................................................... 7-31
7.5.2.4 Parent Demographic Variables (X8PAR1AGE, X8PAR2AGE, X8PAR1RAC, X8PAR2RAC) ............................ 7-35
7.5.2.5 Household Income and Poverty (X8INCCAT_I, X8POVTY_I) ............................ 7-36
7.5.2.6 Creation of a Socioeconomic Status Variable ..... 7-40 7.5.2.7 Respondent ID and Relationship to Focal
Child (X8RESID, X8RESREL2) ........................ 7-41 7.5.2.8 Food Security Status ............................................ 7-42
7.5.2.8.1 Food Security Status: Raw Scores (X8FSADRA2) .................................... 7-43
7.5.2.8.2 Food Security Status: Continuous Measures (X8FSADSC2) .................... 7-44
7.5.2.8.3 Food Security Status: Categorical Measures (X8FSADST2) .................... 7-45
7.5.3 Teacher Composite Variables ............................................. 7-45 7.5.4 School Composite Variables ............................................... 7-45
7.5.4.1 School Type (X8SCTYP) .................................... 7-46 7.5.4.2 Public or Private School (X8PUBPRI) ................ 7-47 7.5.4.3 School Enrollment (X8ENRLS) .......................... 7-47

viii
CONTENTS—Continued
Chapter Page
7.5.4.4 Percent Non-White Students in the School (X8RCETH) ........................................................ 7-48
7.5.4.5 Highest and Lowest Grade at the School (X8LOWGRD, X8HIGGRD) .............................. 7-49
7.5.4.6 Students Eligible for Free or Reduced-Price School Meals (X8FRMEAL_I) ........................... 7-50
7.5.4.7 Geographic Region and Locality of the Child’s School (X8REGION, X8LOCALE) ....... 7-53
7.5.5 Field Management System (FMS) Composite Variables ............................................................................. 7-55
7.5.5.1 School Year Start and End Dates (X8SCHBDD, X8SCHBMM, X8SCHBYY, X8SCHEDD, X8SCHEMM, X8SCHEYY) ........ 7-55
7.5.5.2 Year-Round Schools (X8YRRND) ..................... 7-55
7.5.6 School District Poverty (X8DISTPOV) .............................. 7-56
7.6 Methodological Variables ................................................................... 7-56
8 ELECTRONIC CODEBOOK (ECB) .............................................................. 8-1
8.1 Introduction ......................................................................................... 8-1
8.1.1 Hardware and Software Requirements ................................ 8-1
8.2 Installing, Starting, and Exiting the ECB............................................ 8-2
8.2.1 Installing the ECB Program on Your Personal Computer ............................................................................. 8-2
8.2.2 How to Start the ECB .......................................................... 8-6
REFERENCES ................................................................................................ R-1
APPENDIX A: DATA ADDENDA, ANOMALIES, ERRATA, AND DATA CONSIDERATIONS ........................................................................... A-1
APPENDIX B: SUPPLEMENTAL GUIDE FOR THE KINDERGARTEN–FOURTH GRADE PUBLIC-USE DATA FILE ............ B-1
ix
CONTENTS—Continued
List of Tables
Tables Page
3-1 Direct cognitive assessment: IRT theta scores, fall and spring kindergarten, fall and spring first-grade, fall and spring second grade, spring third-grade, and spring fourth-grade assessments: School years 2010–11, 2011–12, 2012–13, spring 2014, and spring 2015 ........................... 3-5
3-2 Direct cognitive assessment: IRT standard errors of measurement (SEM), fall and spring kindergarten, fall and spring first-grade, fall and spring second-grade, spring third-grade, and spring fourth-grade assessments: School years 2010–11, 2011–12, 2012–13, spring 2014, and spring 2015 ..... 3-6
3-3 Direct cognitive assessment: IRT scale scores, fall and spring kindergarten, fall and spring first-grade, fall and spring second-grade, spring third-grade, and spring fourth-grade assessments: School years 2010–11, 2011–12, 2012–13, spring 2014, and spring 2015 ........................... 3-8
3-4 Reliability of IRT-based scores (theta and scale scores), by round of data collection and domain, for fall and spring kindergarten, fall and spring first grade, fall and spring second grade, spring third grade, and spring fourth grade: School years 2010–11, 2011–12, 2012–13, spring 2014, and spring 2015 ................................................................................................ 3-12
3-5 Dimensional Change Card Sort variable names, descriptions, value ranges, weighted means, and standard deviations for fall and spring second grade, spring third grade, and spring fourth grade: School year 2012–13, spring 2014, and spring 2015 ........................................................... 3-21
3-6 Numbers Reversed variable names, descriptions, value ranges, weighted means, and standard deviations for fall and spring kindergarten, fall and spring first grade, fall and spring second grade, spring third grade, and spring fourth grade: School years 2010–11, 2011–12, 2012–13, spring 2014, and spring 2015 ...................................................................................... 3-30
3-7 Flanker variable names, descriptions, value ranges, weighted means, and standard deviations for spring fourth grade: Spring 2015 ................................ 3-38
3-8 Teacher-reported social skills scales variable names, descriptions, value ranges, weighted means, and standard deviations for fall and spring kindergarten, fall and spring first grade, fall and spring second grade, spring third grade, and spring fourth grade: School years 2010–11, 2011–12, 2012–13, spring 2014, and spring 2015 ..................................................... 3-43
x
CONTENTS—Continued
List of Tables—Continued
Tables Page
3-9 Teacher-reported social skill scales reliability estimates for fall and spring kindergarten, fall and spring first grade, fall and spring second grade, spring third grade, and spring fourth grade: School years 2010–11, 2011–12, 2012–13, spring 2014, and spring 2015 ........................................... 3-45
3-10 Teacher-reported Approaches to Learning scale variable names, descriptions, value ranges, weighted means, and standard deviations for fall and spring kindergarten, fall and spring first grade, fall and spring second grade, spring third grade, and spring fourth grade: School years 2010–11, 2011–12, 2012-13, spring 2014, and spring 2015 ............................ 3-47
3-11 Children’s Behavior Questionnaire variable names, descriptions, value ranges, weighted means, and standard deviations for fall and spring kindergarten and spring first grade: School year 2010–11 and spring 2012 ................................................................................................................. 3-49
3-12 Temperament in Middle Childhood Questionnaire variable names, descriptions, value ranges, weighted means, and standard deviations for spring second grade, spring third grade, and spring fourth grade: Spring 2013, spring 2014, and spring 2015 ................................................................. 3-50
3-13 Reliability estimates for the teacher-reported Attentional Focus and Inhibitory Control scales for fall and spring kindergarten, spring first grade, spring second grade, spring third grade, and spring fourth grade: School year 2010–11, spring 2012, spring 2013, spring 2014, and spring 2015 ................................................................................................................. 3-51
3-14 Parent-Reported Working Memory variable names, descriptions, value ranges, weighted means, and standard deviations for spring third grade and spring fourth grade: Spring 2014 and spring 2015 .................................... 3-53
3-15 Reliability estimates for the parent-reported Working Memory scores for spring third grade and spring fourth grade: Spring 2014 and spring 2015 ...... 3-53
4-1 The ECLS-K:2011 school sample after school substitution ............................ 4-3
4-2 Number (unweighted) of eligible children sampled for the ECLS-K:2011, by selected characteristics: School year 2010–11 ................... 4-5
4-3 Number (unweighted) of sampled children who are base-year respondents, by selected characteristics: School year 2010–11 ....................... 4-6

xi
CONTENTS—Continued
List of Tables—Continued
Tables Page
4-4 Number (unweighted) of original sampled schools in the 30 PSUs selected for the fall data collections, by selected characteristics: Fall 2011 and fall 2012 ........................................................................................... 4-8
4-5 Number (unweighted) of original sampled schools with base-year respondents at the start of the fall data collections, by selected characteristics: Fall 2011 and fall 2012 ........................................................... 4-9
4-6 Number (unweighted) of base-year respondents in the fall first- and second-grade sample, by selected characteristics: Fall 2011 and fall 2012 ..... 4-10
4-7 Number (unweighted) of base-year respondents in fall first grade, by type of sampled school and selected characteristics: Fall 2011 ....................... 4-12
4-8 Number (unweighted) of base-year respondents in the fall second grade, by type of sampled school and selected characteristics: Fall 2012 .................. 4-13
4-9 Number (unweighted) of original sampled schools in the 90 PSUs selected for the spring data collections with base-year respondents, by selected characteristics: Spring 2012, spring 2013, spring 2014, and spring 2015 ...................................................................................................... 4-14
4-10 Number (unweighted) of base-year respondents in spring first grade, by type of sampled school and selected characteristics: Spring 2012 .................. 4-16
4-11 Number (unweighted) of base-year respondents in spring second grade, by type of sampled school and selected characteristics: Spring 2013 ............. 4-17
4-12 Number (unweighted) of base-year respondents in spring third grade, by type of sampled school and selected characteristics: Spring 2014 .................. 4-18
4-13 Number (unweighted) of base-year respondents in spring fourth grade, by type of sampled school and selected characteristics: Spring 2015 ............. 4-19
4-14 Number (unweighted) of base-year respondents in spring fourth grade who were selected for the mathematics teacher questionnaire, by type of sampled school and selected characteristics: Spring 2015 ............................... 4-20
4-15 Number (unweighted) of base-year respondents in spring fourth grade who were selected for the science teacher questionnaire, by type of sampled school and selected characteristics: Spring 2015 ............................... 4-21

xii
CONTENTS—Continued
List of Tables—Continued
Tables Page
4-16 Characteristics of the fourth-grade weights ..................................................... 4-41
4-17 Standard errors and design effects for selected survey items, fourth grade: Spring 2015 ........................................................................................... 4-48
4-18 Median design effects for the spring fourth-grade survey items, by school characteristic: Spring 2015 .............................................................................. 4-51
5-1 Response rates for child assessment and parent interview, by selected school characteristics, fourth grade: Spring 2015 ............................................ 5-6
5-2 Response rates for child assessment and parent interview, by selected student characteristics, fourth grade: Spring 2015 ........................................... 5-8
5-3 Response rates for reading teacher questionnaires, by selected school characteristics, fourth grade: Spring 2015 ....................................................... 5-9
5-4 Response rates for reading teacher questionnaires, by selected student characteristics, fourth grade: Spring 2015 ....................................................... 5-11
5-5 Response rates for mathematics teacher questionnaires, by selected school characteristics, fourth grade: Spring 2015 ............................................ 5-12
5-6 Response rates for mathematics teacher questionnaires, by selected student characteristics, fourth grade: Spring 2015 ........................................... 5-14
5-7 Response rates for science teacher questionnaires, by selected school characteristics, fourth grade: Spring 2015 ....................................................... 5-15
5-8 Response rates for science teacher questionnaires, by selected student characteristics, fourth grade: Spring 2015 ....................................................... 5-17
5-9 Overall response rates for child assessment and parent interview, by selected school characteristics, fourth grade: Spring 2015 .............................. 5-18
5-10 Overall response rates for reading teacher questionnaires, by selected school characteristics, fourth grade: Spring 2015 ............................................ 5-20
5-11 Overall response rates for mathematics teacher questionnaires, by selected school characteristics, fourth grade: Spring 2015 .............................. 5-22
5-12 Overall response rates for science teacher questionnaires, by selected school characteristics, fourth grade: Spring 2015 ............................................ 5-24

xiii
CONTENTS—Continued
List of Tables—Continued
Tables Page
5-13 Response rates for special education teacher questionnaires, fourth grade: Spring 2015 ...................................................................................................... 5-26
5-14 Response rates for school administrator questionnaire, by selected school characteristics, fourth grade: Spring 2015 ....................................................... 5-27
5-15 Response rates for school administrator questionnaire, by selected student characteristics, fourth grade: Spring 2015 ........................................... 5-29
5-16 Overall response rates for school administrator questionnaire, by selected school characteristics, fourth grade: Spring 2015 ............................................ 5-30
5-17 Weighted and unweighted response rates for all instruments, fourth grade: Spring 2015 ........................................................................................... 5-31
5-18 Estimates using unadjusted and nonresponse-adjusted weights, child assessment, spring fourth grade: Spring 2015 ................................................. 5-34
5-19 Differences between unweighted and weighted estimates, and between unadjusted and adjusted estimates, child assessment, spring fourth grade: Spring 2015 ...................................................................................................... 5-35
5-20 Estimates using unadjusted and nonresponse-adjusted weights, parent interview, spring fourth grade: Spring 2015 .................................................... 5-38
5-21 Differences between unweighted and weighted estimates, and between unadjusted and adjusted estimates, parent interview, spring fourth grade: Spring 2015 ...................................................................................................... 5-40
5-22 Estimates using unadjusted and nonresponse-adjusted weights, teacher questionnaire data, spring fourth grade: Spring 2015 ...................................... 5-43
5-23 Differences between unweighted and weighted estimates, and between unadjusted and adjusted estimates, teacher questionnaire data, spring fourth grade: Spring 2015 ................................................................................ 5-45
5-24 Estimates using unadjusted and nonresponse-adjusted weights, school administrator questionnaire data, spring fourth grade: Spring 2015 ................ 5-48
5-25 Differences between unweighted and weighted estimates, and between unadjusted and adjusted estimates, school administrator questionnaire data, spring fourth grade: Spring 2015 ............................................................ 5-50

xiv
CONTENTS—Continued
List of Tables—Continued
Tables Page
5-26 Differences between unadjusted base-year estimates from kindergarten respondents and unadjusted base-year estimates from fourth-grade respondents: Spring 2011 and spring 2015 ...................................................... 5-53
5-27 Differences between adjusted base-year estimates from kindergarten respondents and adjusted base-year estimates from fourth-grade respondents: Spring 2011 and spring 2015 ...................................................... 5-55
7-1 Pointers to parent figure questions ................................................................... 7-34
7-2 Detailed income range categories used in the parent interview: Spring 2015 ................................................................................................................. 7-37
7-3 Missing data for household income: Spring 2015 ........................................... 7-38
7-4 Criteria for reporting income to the nearest $1,000 in the spring parent interview and 2014 thresholds for 200 percent of poverty: Spring 2015 ......... 7-39
7-5 ECLS-K:2011 poverty composite and 2014 census poverty thresholds: Spring 2015 ...................................................................................................... 7-40
7-6 Number and percent of public and private schools and study students with missing data for the percent of children in the school eligible for free or reduced-price lunch (S8PCTFLN): Spring 2015 .................................. 7-51
List of Exhibits
Exhibits
1-1 Data collection schedule: School years 2010–11 through 2015–16 ................ 1-4
2-1 Instruments used in the ECLS-K:2011 kindergarten, first-, second-, third-, and fourth-grade rounds of data collection: School years 2010–11, 2011–12, 2012–13, spring 2014, and spring 2015 ........................................... 2-2
2-2 Child questionnaire topics by round of data collection in the ECLS-K:2011: Spring 2014 and spring 2015 .................................................. 2-9
2-3 Parent interview topics, by round of data collection in the ECLS-K:2011: School years 2010–11, 2011–12, 2012–13, spring 2014, and spring 2015 ..... 2-11

xv
CONTENTS—Continued
List of Exhibits—Continued
Exhibits Page
2-4 General classroom teacher teacher-level questionnaire topics, by round of data collection in the ECLS-K:2011: School year 2010–11, spring 2012, spring 2013, spring 2014, and spring 2015 ............................................ 2-17
2-5 General classroom teacher child-level questionnaire topics, by round of data collection in the ECLS-K:2011: School years 2010–11, 2011–12, 2012–13, spring 2014, and spring 2015 ........................................................... 2-19
2-6 Special education teacher questionnaire topics, by round of data collection in the ECLS-K:2011: Spring 2011, spring 2012, spring 2013, spring 2014, and spring 2015 ........................................................................... 2-21
2-7 School administrator questionnaire topics, by round of data collection in the ECLS-K:2011: Spring 2011, spring 2012, spring 2013, spring 2014, and spring 2015 ................................................................................................ 2-23
2-8 Copyright-protected instsruments in the ECLS-K:2011 .................................. 2-24
3-1 Data flag description for the computerized Dimensional Change Card Sort for fall and spring second grade and spring fourth grade: Schools years 2012–13 and spring 2015 ....................................................................... 3-22
3-2 Data flag description for the computerized Dimensional Change Card Sort for spring third grade: Spring 2014 .......................................................... 3-23
3-3 Data flag description for the Flanker for the spring of fourth grade: Spring 2015 ...................................................................................................... 3-38
3-4 Child questionnaire content and item-level variables for spring third grade and spring fourth grade: Spring 2014 and spring 2015 .......................... 3-40
3-5 Teacher-reported item-level variables on peer relationships in spring second grade, spring third grade, and spring fourth grade: Spring 2013, spring 2014, and spring 2015 ........................................................................... 3-55
3-6 Parent-reported item-level variables on peer relationships and friendships in spring second grade, spring third grade, and spring fourth grade: Spring 2013, spring 2014, and spring 2015 ..................................................... 3-56
3-7 Teacher- and parent-reported item-level variables on school liking and avoidance in spring fourth grade: Spring 2015 ................................................ 3-57

xvi
CONTENTS—Continued
List of Exhibits—Continued
Exhibits Page
4-1 ECLS-K:2011 fourth-grade main sampling weights for analysis not including data from teachers ............................................................................ 4-28
4-2 ECLS-K:2011 fourth-grade main sampling weights associated with data from teachers .................................................................................................... 4-29
4-3 Weights developed for use with the ECLS-K:2011 fourth-grade data, by components for which nonresponse adjustments were made .......................... 4-35
5-1 ECLS-K:2011 survey instruments and definition of completed instrument: Spring 2015 ................................................................................... 5-2
7-1 Prefixes for fourth-grade variables .................................................................. 7-3
7-2 Identification variables included in the ECLS-K:2011 kindergarten–fourth grade restricted-use data file ................................................................. 7-4
7-3 Missing value codes used in the ECLS-K:2011 data file ................................. 7-7
7-4 Definitions of negative and affirmed values for the food security items in the ECLS-K:2011 kindergarten–fourth grade restricted-use data file ............. 7-44
8-1 InstallShield Wizard ........................................................................................ 8-3
8-2 Welcome window ............................................................................................ 8-4
8-3 Choose Destination Location ........................................................................... 8-4
8-4 Setup Status...................................................................................................... 8-5
8-5 InstallShield Wizard Complete ........................................................................ 8-5
8-6a Desktop icon .................................................................................................... 8-6
8-6b Desktop screen—click start ............................................................................. 8-6
8-7 First-time user dialog box ................................................................................ 8-7
8-8 ECB splash screen ........................................................................................... 8-7
8-9 Select Catalog screen ....................................................................................... 8-8
8-10 Main ECB screen ............................................................................................. 8-8

xvii
CONTENTS—Continued
List of Exhibits—Continued
Exhibits Page
B-1 ECLS-K:2011 masked variables, spring 2015 child assessment ..................... B-3
B-2 ECLS-K:2011 masked variables, spring 2015 parent interview ...................... B-4
B-3 ECLS-K:2011 masked variables, spring 2015 teacher-level reading teacher questionnaire ....................................................................................... B-13
B-4 ECLS-K:2011 masked variables, spring 2015 teacher-level mathematics/science teacher questionnaire ..................................................... B-15
B-5 ECLS-K:2011 masked variables, spring 2015 child-level teacher questionnaires .................................................................................................. B-16
B-6 ECLS-K:2011 masked variables, spring 2015 school administrator questionnaire .................................................................................................... B-17
B-7 ECLS-K:2011 masked variables, spring 2015 composite variables ................ B-20
B-8 ECLS-K:2011 masked variables, spring 2015 field management system and identification variables .............................................................................. B-21

This page intentionally left blank.

1-1
1. INTRODUCTION
This manual provides guidance and documentation for users of the longitudinal kindergarten–fourth grade (K-4) data file of the Early Childhood Longitudinal Study, Kindergarten Class of 2010–11 (ECLS-K:2011). It mainly provides information specific to the fourth-grade round of data collection. Users should refer to the Early Childhood Longitudinal Study, Kindergarten Class of 2010–11 (ECLS-K:2011), User’s Manual for the ECLS-K:2011 Kindergarten Data File and Electronic Codebook, Public Version (NCES 2015-074) (Tourangeau et al. 2015), hereinafter referred to as the base-year User’s Manual, for information about the general study methodology and the kindergarten rounds of data collection, to the Early Childhood Longitudinal Study, Kindergarten Class of 2010–11 (ECLS-K:2011), User’s Manual for the ECLS-K:2011 Kindergarten–First Grade Data File and Electronic Codebook, Public Version (NCES 2015-078) (Tourangeau et al. 2015) for information about the first-grade rounds of data collection, to the Early Childhood Longitudinal Study, Kindergarten Class of 2010–11 (ECLS-K:2011), User’s Manual for the ECLS-K:2011 Kindergarten–Second Grade Data File and Electronic Codebook, Public Version (NCES 2017-285) (Tourangeau et al. 2017) for information about the second-grade rounds of data collection, and to the Early Childhood Longitudinal Study, Kindergarten Class of 2010–11 (ECLS-K:2011), User’s Manual for the ECLS-K:2011 Kindergarten–Third Grade Data File and Electronic Codebook, Public Version (NCES 2018-034) (Tourangeau et al. 2018) for information about the third-grade rounds of data collection.
This chapter provides an overview of the ECLS-K:2011. Subsequent chapters provide details on the fourth-grade data collection instruments and methods, including a description of how the fourth-grade data collection differs from the earlier rounds; the direct and indirect child assessments; the sample design; weighting procedures; response rates; and data file content, including composite variables.
Data for the ECLS-K:2011 are released in both a restricted-use and a public-use version. This manual, which has been developed for public dissemination and use with the public version of the data, is almost identical to the manual released with the kindergarten-fourth-grade restricted-use file.1 Edits have been made to round or remove unweighted sample sizes that cannot be generated with the public-use file (PUF). Estimates such as means that are presented in the tables throughout the manual were calculated with the restricted-use file. Some estimates may not be able to be reproduced exactly with variables in the PUF because the variables have been masked to make them suitable for public release. Appendix B provides information about the ways in which data were masked on the PUF and includes tables that
1 Early Childhood Longitudinal Study, Kindergarten Class of 2010–11(ECLS-K:2011) User’s Manual for the ECLS-K:2011 Kindergarten-Fourth Grade Data File and Electronic Codebook, Restricted Version (NCES 2018-082) (Tourangeau et al. 2018).
1-2
list all variables that have been masked or suppressed. Also, throughout this manual references are made to materials that are on the restricted-use DVD. Public-release versions of these materials are available under “Data Products” on the ECLS-K:2011 website, https://nces.ed.gov/ecls/kindergarten2011.asp.
The ECLS-K:2011 followed a nationally representative sample of children from kindergarten through their elementary school years. It is a multisource, multimethod study that focuses on children’s early school experiences. It included interviews with parents, self-administered questionnaires completed by teachers and school administrators, one-on-one assessments of children, and beginning in third grade, a computer-assisted self-administered questionnaire for children. During the kindergarten year, the ECLS-K:2011 also included self-administered questionnaires for nonparental before- and after-school care providers. The ECLS-K:2011 is sponsored by the National Center for Education Statistics (NCES) within the Institute of Education Sciences (IES) of the U.S. Department of Education.
1.1 Background
The ECLS-K:2011 is the third and latest study in the Early Childhood Longitudinal Study (ECLS) program, which comprises three longitudinal studies of young children: the Early Childhood Longitudinal Study, Kindergarten Class of 1998–99 (ECLS-K); the Early Childhood Longitudinal Study, Birth Cohort (ECLS-B); and the ECLS-K:2011. The ECLS program is broad in its scope and coverage of child development, early learning, and school progress. It draws together information from multiple sources, including children, parents, teachers, school administrators, and early care and education providers, to provide data for researchers and policymakers to use to answer questions regarding children’s early educational experiences and address important policy questions. The ECLS-K:2011 provides current information about today’s elementary school children. Also, coming more than a decade after the inception of the ECLS-K, the ECLS-K:2011 allows for cross-cohort comparisons of two nationally representative kindergarten classes experiencing different policy, educational, and demographic environments.
The three studies in the ECLS program provide national data on children’s developmental status at birth and at various points thereafter; children’s transitions to nonparental care, early education programs, and school; and children’s home and school experiences, growth, and learning. The ECLS program also provides data that enable researchers to analyze how a wide range of child, family, school, classroom, nonparental care and education provider, and community characteristics relate to children’s development and to their experiences and success in school. Together, these three studies provide the range and breadth of data needed to more fully describe and understand children’s education experiences, early learning, development, and health in the late 1990s, 2000s, and 2010s.

1-3
More information about all three of these studies can be found on the ECLS website (https://nces.ed.gov/ecls).
1.2 Periods of Data Collection
The ECLS-K:2011 followed a cohort of children from their kindergarten year (the 2010–11 school year, referred to as the base year) through the 2015–16 school year, when most of the children were expected to be in fifth grade (exhibit 1-1). The sample included both children who were in kindergarten for the first time and those who were repeating kindergarten during 2010–11. Although the study refers to later rounds of data collection by the grade the majority of children were expected to be in (that is, the modal grade for children who were in kindergarten in the 2010–11 school year), children were included in subsequent data collections regardless of their grade level.2 During the 2010–11 school year, when both a fall and a spring data collection were conducted, approximately 18,170 kindergartners from about 1,310 schools3 and their parents, teachers, school administrators, and before- and after-school care providers participated in the study. Fall and spring data collections were also conducted during the first-grade year. While the fall kindergarten collection included the full ECLS-K:2011 sample, the fall first-grade collection was conducted with children in one-third of the sample of primary sampling units (PSUs) selected for the study. These children are referred to as the fall subsample. The data collection schedule for second grade was similar to the schedule for first grade, with a fall second-grade collection that included the same subsample of children from the fall of first grade and a spring collection that included the entire sample of children who participated in at least one of the two base-year data collection rounds. In the third, fourth, and fifth grades, a spring data collection was conducted with the entire sample of children who participated in the base year.4
2 Children may not be in the modal grade due to retention in a grade or promotion to a higher grade ahead of schedule. 3 This number includes both schools that were part of the original sample of schools selected for the study (approximately 970) and schools to which children transferred during the base year (approximately 340). 4 Beginning with the fall first-grade data collection, children who moved away from their original base-year schools were subsampled for follow-up. More information about the sample for fourth grade, including the subsampling of movers, is provided in chapter 4.

1-4
Exhibit 1-1. Data collection schedule: School years 2010–11 through 2015–16
School year Grade1 Data collections2
2010–11 Kindergarten Fall 2010 Spring 2011
2011–12 First grade Fall 2011 Spring 2012
2012–13 Second grade Fall 2012 Spring 2013
2013–14 Third grade Spring 2014 2014–15 Fourth grade Spring 2015 2015–16 Fifth grade Spring 2016
1 Grade indicates the modal grade for children who were in kindergarten in the 2010–11 school year. After the kindergarten rounds of data collection, children were included in data collection regardless of their grade level. 2 All but two rounds of data collection included the entire sample of children. The fall first-grade data collection included approximately one-third of the total ECLS-K:2011 sample of children. The fall second-grade data collection included the same subsample selected for the fall of first grade. SOURCE: U.S. Department of Education, National Center for Education Statistics, Early Childhood Longitudinal Study, Kindergarten Class of 2010–11 (ECLS-K:2011).
1.3 Overview of the Fourth-Grade Round of Data Collection
As described in chapter 1 of the base-year User’s Manual, the ECLS-K:2011 collected information from children, parents, classroom teachers, special education teachers, and school administrators. In the base year, information was also collected from children’s before- and after-school care providers. Data collection instruments for all of these different respondent types were included in the fourth-grade round of data collection, with the exception of the care provider questionnaires. The care provider component was included in the base year to obtain more information about young children’s activities outside of school, which is particularly important for understanding differences in the educational environments of children attending full-day kindergarten and of those attending part-day kindergarten.
The assessments and instruments used in fourth grade were largely the same as those used in earlier rounds to allow for longitudinal analysis. However, the earlier assessments and instruments were revised, as necessary, to make them appropriate for the fourth-grade data collections. For example, questions in the school administrator questionnaire asking about the school’s third-graders were revised to ask about the school’s fourth-graders. As in third grade, fourth-grade instruments included a child questionnaire. Specifically, children completed an audio computer-assisted self-administered questionnaire about themselves. For the fourth-grade collection, the direct child assessment included a similar battery of assessments as previous rounds and a third measure of executive function was added in addition to the two fielded previously. More detailed information about the fourth-grade study instruments, including how they differ from the instruments used in the earlier rounds, is provided in chapter 2.

1-5
1.4 ECLS-K:2011 Kindergarten–Fourth Grade (K-4) Public-Use Data File
The ECLS-K:2011 kindergarten–fourth grade (K-4) public-use data file includes the base-year, first-grade, second-grade, third-grade, and fourth-grade data encompassing both the fall and spring rounds of data collection in kindergarten, first grade, and second grade and the spring rounds of data collection in third and fourth grade. The data file includes information for all students who participated during the kindergarten year even if they did not participate during later rounds. Fourth-grade data for students who did not participate in the fourth-grade round are set to “system missing.” The K-4 public-use file (PUF) is intended to replace the previously released PUFs; the K-4 PUF includes all of the cases included in prior PUFs and has some important corrections and updates to previously released data, including the child assessment scores.
In preparing data files for release, NCES takes steps to minimize the likelihood that individual schools, teachers, parents, or students participating in the study can be identified. Every effort is made to protect the identity of individual respondents. The process of preparing the files for release includes a formal disclosure risk analysis. Small percentages of values are swapped across cases with similar characteristics to make it very difficult to identify a respondent with certainty. The modifications used to reduce the likelihood that any respondent could be identified in the data do not affect the overall data quality.
Analysts should be aware that the ECLS-K:2011 data file is provided as a child-level data file containing one record for each child who participated in the base year. The record for each child contains information from each of the study respondents: the child, as well as his or her parent, teacher(s), school administrator and, if applicable, before- or after-school care provider.
The ECLS-K:2011 K-4 data are provided in an electronic codebook (ECB) that permits analysts to view the variable frequencies, tag selected variables, and prepare data extract files for analysis with SAS, SPSS, or Stata. The public-use version of the data will be available online.
1.5 Contents of Manual
The remainder of this manual contains more detailed information on the fourth-grade data collection instruments (chapter 2) and the direct and indirect child assessments (chapter 3). It also describes the ECLS-K:2011 sample design and weighting procedures (chapter 4), response rates and bias analysis

1-6
(chapter 5), and data preparation procedures (chapter 6). In addition, this manual describes the structure of the K-4 data file and the composite variables that have been developed for the file (chapter 7). The last chapter of this manual contains a short introduction to the ECLS-K:2011 Electronic Codebook and how to use it (chapter 8).
Additional information about the ECLS-K:2011 study design, methods, and measures can be found in earlier round user’s manuals noted above, as well as in the Early Childhood Longitudinal Study, Kindergarten Class of 2010–11 (ECLS-K:2011), Kindergarten Psychometric Report (Najarian et al. forthcoming), the Early Childhood Longitudinal Study, Kindergarten Class of 2010–11 (ECLS-K:2011), First-Grade and Second-Grade Psychometric Report (Najarian et al. forthcoming), and the Early Childhood Longitudinal Study, Kindergarten Class of 2010-11 (ECLS-K:2011), Third-Grade Through Fifth-Grade Psychometric Report (Najarian et al. forthcoming). Also, as noted earlier, additional information about the ECLS program can be found online at http://nces.ed.gov/ecls.

2-1
2. DATA COLLECTION INSTRUMENTS AND METHODS
This chapter describes the data collection instruments used in the Early Childhood Longitudinal Study, Kindergarten Class of 2010–11 (ECLS-K:2011) fourth-grade round of data collection, including the child assessments, child questionnaire, parent interview, school administrator questionnaires, and teacher questionnaires.1 Differences between earlier rounds of data collection and the fourth-grade round in the study instruments and data collection procedures are discussed. For more information on the earlier data collection instruments and methods, consult the user’s manuals for those rounds.
2.1 Data Collection Instruments
The design of the ECLS-K:2011 and its survey instruments is guided by a conceptual framework of children’s development and learning that emphasizes the interaction among the various environments in which children live and learn, and the resources within those environments to which children have access. A comprehensive picture of children’s environments and experiences is created by combining information from children themselves, their parents, their school administrators, their teachers, and their kindergarten before- and after-school care providers.
Exhibit 2-1 presents a listing of the ECLS-K:2011 data collection instruments and the rounds
of data collection in which they were used. The instruments for the kindergarten, first-grade, second-grade, third-grade, and fourth-grade collections are included on the ECLS-K:2011 kindergarten–fourth grade (K–4) restricted-use DVD and are available online at https://nces.ed.gov/ecls, with the exception of copyrighted materials or items adapted from copyrighted materials that cannot be publicly distributed without copyright holder and NCES permission. Study instruments and items for which copyright permissions are needed are discussed further in section 2.1.7.
The information collected in the ECLS-K:2011 instruments can be used to answer a wide
variety of research questions about how home, school, and neighborhood factors relate to children’s cognitive, social, emotional, and physical development. Sections 2.1.1 through 2.1.6 describe the major topics covered in each instrument.
1 For ease of presentation, this chapter refers to all students as “fourth-grade students.” However, the reader should keep in mind that some children had been retained in a grade and a very small number of students had been advanced to a higher grade. These children are included in the group being referred to as fourth-graders.

2-2
Exhibit 2-1. Instruments used in the ECLS-K:2011 kindergarten, first-, second-, third-, and fourth-grade rounds of data collection: School years 2010–11, 2011–12, 2012–13, spring 2014, and spring 2015
Instrument
Fall kinder- garten
Spring kinder-garten
Fall first
grade
Spring first
grade
Fall second
grade
Spring second
grade
Spring third
grade
Spring fourth grade
Child assessment Language screener X X X X Reading X X X X X X X X Mathematics X X X X X X X X Executive function X X X X X X X X Science X X X X X X X Height and weight X X X X X X X X Hearing evaluation X X
Child questionnaire X X Parent interview X X X X X X X X
Classroom teacher questionnaires – grades K, 1, 2, and 3
Teacher level X X X X X Teacher level – subject area X Teacher background (new
teacher supplement) X
Child level X X X X X X X
Classroom teacher questionnaires – grade 4
Teacher Background Questionnaire
X
Reading and Language Arts Teacher Questionnaire
X
Mathematics Teacher Questionnaire
X
Science Teacher Questionnaire X
Special education teacher questionnaires
Teacher level X X X X X Child level X X X X X
See notes at end of exhibit.

2-3
Exhibit 2-1. Instruments used in the ECLS-K:2011 kindergarten, first-, second-, third-, and fourth-grade rounds of data collection: School years 2010–11, 2011–12, 2012–13, spring 2014, and spring 2015—Continued
Instrument
Fall kinder- garten
Spring kinder-garten
Fall first
grade
Spring first
grade
Fall second
grade
Spring second
grade
Spring third
grade
Spring fourth grade
School administrator questionnaires
X X X X X
Before- and after-school care
questionnaires
Center director X Center-based care provider X Home-based care provider X Child level X SOURCE: U.S. Department of Education, National Center for Education Statistics, Early Childhood Longitudinal Study, Kindergarten Class of 2010–11 (ECLS-K:2011), fall 2010, spring 2011, fall 2011, spring 2012, fall 2012, spring 2013, spring 2014, and spring 2015.
2.1.1 Direct Child Assessment
In the fourth-grade data collection, children were assessed in the spring in reading, mathematics, science, and executive function skills, and their height and weight were measured. The majority of the items included in the fourth-grade assessments in reading, mathematics, and science had been included in the earlier assessments. However, to ensure that these assessments adequately measured the knowledge and skills of the children as they progressed through school, new, more difficult items were added to the assessments in fourth grade, and easier items reflecting lower level skills were omitted. All children received the assessments designed for the fourth-grade collection, regardless of their actual grade level. The reading, mathematics, and science assessments were administered directly to the sampled children on an individual basis by trained and certified child assessors. This battery of assessments was designed to be administered within about 60 minutes per child.2 Child responses were entered by the assessor into a computer-assisted interviewing (CAI) program. Executive function skills were assessed through two computer-administered tasks completed by children and an oral task in which child responses were input into the computer using the CAI program.
Two-stage assessment. The fourth-grade direct cognitive assessment included two-stage assessments for reading, mathematics, and science. For each assessment domain, the first stage of the assessment was a routing section that included items covering a broad range of difficulty. A child’s
2 Together the fourth-grade reading, mathematics, and science assessments took an average of 51 minutes. The executive function assessments averaged a little more than 13 minutes, which was longer than in third grade because there was a third measure of executive function (the Flanker task) added for fourth grade. The measurement of height and weight took about 5 minutes.
2-4
performance on the routing section of a domain determined which one of three second-stage tests (low, middle, or high difficulty) the child was next administered for that domain. The second-stage tests varied by level of difficulty so that a child would be administered questions appropriate for his or her demonstrated level of ability for each of the cognitive domains. The purpose of this adaptive assessment design was to maximize accuracy of measurement while minimizing administration time.
Language screener for children whose home language was not English. In kindergarten and first grade, a language screener was used for children whose home language was not English. By the spring of first grade, nearly all children (99.9 percent) were routed through the assessment in English; therefore, the language screener was not administered beyond the spring of first grade.
Cognitive domains. The fourth-grade cognitive assessment focused on four domains: reading (language use and literacy), mathematics, science, and executive function (working memory, cognitive flexibility, and inhibitory control). For the reading, mathematics, and science assessments, assessors asked the children questions related to images or text that were presented on a small easel, such as words, short sentences, or items associated with passages for reading; numbers and number problems for mathematics; and predictions based on observations and cause-and-effect relationships for science. For the reading assessment, children were also asked questions about short reading selections they were asked to read in a passages booklet developed for the assessment. These questions were also presented on the easel. Children were not required to explain their reasoning. The executive function component included a computer-administered card sort task, for which children entered responses in the assessor’s laptop computer; a backward digit span task, for which children provided verbal responses to the assessor; and a computer-administered inhibitory control task, for which children entered responses in the assessor’s laptop computer. A brief description of each of the cognitive assessment components follows.
Reading (language and literacy). The reading assessment included questions measuring basic skills (e.g., word recognition), vocabulary knowledge, and reading comprehension. Reading comprehension questions asked the child to identify information specifically stated in text (e.g., definitions, facts, supporting details); to make complex inferences within texts; and to consider the text objectively and judge its appropriateness and quality. The reading assessment began with a set of 19 routing items, with the child’s score on these items determining which second-stage form (low, middle, or high difficulty) the child received.
Mathematics. The mathematics assessment was designed to measure skills in conceptual knowledge, procedural knowledge, and problem solving. The assessment consisted of questions on number sense, properties, and operations; measurement; geometry and spatial sense; data analysis, statistics, and

2-5
probability; and patterns, algebra, and functions. A set of 17 routing items was administered to all children, and the score on these items determined which second-stage test (low, middle, or high difficulty) a child received. Most of the text that the children could see on the easel pages, for example, question text for word problems or graph labels, was read to them by the assessor to reduce the likelihood that the children’s reading ability would affect their mathematics assessment performance.3 Paper and pencil were offered to the children for use during the mathematics assessment, and children were periodically reminded of the availability of paper and pencil as part of the assessment protocol.
Science. The science assessment domain included questions about physical sciences, life sciences, Earth and space sciences, and scientific inquiry. The science assessment included 15 routing items that all children received, followed by one of three second-stage forms (low, middle, or high difficulty). As with reading and mathematics, the second-stage form children received depended on their responses to the routing items. The questions, response options, and any text the children could see on the easel pages (for example, graph labels) were read to the children to reduce the likelihood that their reading ability would affect their science assessment score.
Executive function. The executive function component of the cognitive assessment obtained information on cognitive processes associated with learning: cognitive flexibility, working memory, and—new to fourth grade—inhibitory control. To measure cognitive flexibility, children were administered the Dimensional Change Card Sort (DCCS) (Zelazo 2006). Different versions of the DCCS were used in different rounds of data collection because there was no single task that was age appropriate across all rounds of data collection when the study began. During the kindergarten and first-grade rounds, the hard-copy or physical version of the DCCS, as described in Zelazo 2006, was administered using cards that children were asked to sort into piles. Because the physical version of the DCCS would have been too easy for the majority of the study children during the second-grade rounds, beginning in the fall second-grade round, children were administered a new, age-appropriate, computerized version of the DCCS in which the “cards” were presented on a computer screen and children sorted them into “piles” on the computer screen using keys on the keyboard to indicate where to place each card. The computerized task was developed as part of the National Institutes of Health (NIH) Toolbox for the Assessment of Neurological and Behavioral Function (NIH Toolbox) and is appropriate for ages 3–85 (Zelazo et al. 2013). The NIH Toolbox DCCS has two different administrations based on the age of the child: one for children 7 years and younger and one for children 8 years and older. The task had been under development during the kindergarten and first-grade rounds of data collection but became available in time to be incorporated into the second-grade data collections. The ECLS-K:2011 used the version for children 8 years and older beginning in the fall second-
3 Numbers were read to the child only when the question text referenced the number.

2-6
grade round. Although the physical and the computer versions assess the same construct, the scoring and the way by which the construct is assessed differ across the two tasks (for information on scoring, see chapter 3, section 3.2.1).
Like the physical version of the DCCS administered in the kindergarten and first-grade data collections, the computerized version asks children to sort cards either by shape or color. However, rather than administer the cards in sections with a consistent sorting rule (with cards first sorted only by color, then only by shape, and finally by color or shape depending on whether a card had a black border), in the computerized DCCS the sorting rules are intermixed across the 30 trials of the task. In the computerized DCCS, one rule is more common than the other to build a response tendency (i.e., a response that is “preferred” because it happens more frequently, resulting in a predisposition to respond in that manner). Also, whereas performance on the physical version is measured by sorting accuracy, performance on the computerized version is measured as a function of both accuracy and reaction time. Reaction time is calculated based on reaction time only for trials using the sorting rule that is presented less often and only when there is a correct response. The reaction time of the less frequent trials or nondominant trials is of most interest because when a child is predisposed to respond in a particular way, it is harder and takes more time to inhibit that response tendency and switch the response to maintain accuracy. As children get older, it is important to incorporate reaction time into the DCCS score because older children and adults tend to slow down in order to respond accurately. Younger children do not tend to show a speed/accuracy tradeoff, and therefore accuracy is a better metric of performance for young children (Davidson et al. 2006). Performance on the computerized version of the DCCS is derived from a formula that takes into consideration both accuracy and reaction time (Zelazo et al. 2013; Slotkin, Nowinski et al. 2012).
After the card sort, children were administered the Numbers Reversed task, which is a measure of working memory. In this task, children were asked to repeat strings of orally presented numbers in reverse order. The sequence of numbers became increasingly longer, up to a maximum of eight numbers. The task was ended when children responded incorrectly to three consecutive number sequences of the same length, so that they would not be asked to continue at a level that was too difficult, or when all number sequences had been completed.
Beginning in fourth grade, children were administered a task that measured inhibitory control in the context of selective visual attention. The NIH Toolbox Flanker Inhibitory Control and Attention Task (Flanker) is a computerized task that was developed as part of the NIH Toolbox for the Assessment of Neurological and Behavioral Function (NIH Toolbox) and is appropriate for ages 3–85 (Zelazo et al. 2013). The ECLS-K:2011 used the version of the NIH Toolbox Flanker task that is for children 8 years and older.

2-7
The Flanker task measures both inhibitory control and attention. Children must inhibit an automatic response tendency that may interfere with achieving a goal and use selective attention to consciously direct sensory or thought processes to a stimulus in the visual field in the service of goal-directed behavior. In the Flanker task, children are asked to focus attention on a central stimulus while ignoring or inhibiting attention to stimuli presented on either side of the central stimulus. The stimuli used for children 8 years or older are a series of five arrows, pointing either left of right. The stimuli that “flank” the central stimulus either point in the same direction as the central stimulus (congruent) or in the opposite direction as the central stimulus (incongruent). Children are presented with 20 trials and are asked to press a button on the computer to indicate the direction the central stimulus is pointing. Like the DCCS, performance on the Flanker is derived from a formula that takes into consideration both accuracy and reaction time (Zelazo et al. 2013; Slotkin, Nowinski et al. 2012). Performance on the incongruent trials is used to derive a score that is a measure of inhibitory control in the context of selective visual attention.
Height and weight measurement. In addition to the cognitive domains described above, children’s height and weight were measured during each data collection. A Shorr board (a tall wooden stand with a ruled edge used for measuring height) and a digital scale were used to obtain the measurements.4 Assessors recorded the children’s height (in inches to the nearest one-quarter inch) and weight (in pounds to the nearest half pound) on a height and weight recording form and then entered the measurements into a laptop computer. Each measurement was taken and recorded twice to ensure reliable measurement.
2.1.2 Child Questionnaire
Beginning in the spring of third grade, a child questionnaire (CQ) was administered to children prior to the cognitive assessment components. The fourth-grade questionnaire had 35 questions and took approximately 8 minutes to complete.
Unlike the hard-copy child questionnaires that were administered during the Early Childhood Longitudinal Study, Kindergarten Class of 1998–99 (ECLS-K) by assessors who read the questions/items to the children, the ECLS-K:2011 child questionnaire was administered on a computer using audio computer-assisted self-interview (audio-CASI) technology and headphones. Children listened as the software system read the instructions and questionnaire items. One questionnaire item at a time was displayed on the laptop’s screen, and in fourth grade a computer-generated voice read each question and the response options to the child. The child responded by selecting the desired response on the laptop’s 4 The Shorr board that was used is manufactured by Weigh and Measure, LLC, and is model ICA. The digital scale used was Seca Bella model 840.

2-8
touch screen. The audio-CASI questionnaire standardized administration and accommodated the variation in children’s reading ability levels. It also allowed the child privacy to respond to the questions and limited distractions because the headphones worn during the administration minimized extraneous noise.
Exhibit 2-2 shows the content areas included in the third- and fourth-grade child questionnaires. The fourth-grade child questionnaire included both new items and items that were also included in the third-grade questionnaire. In both the third- and fourth-grade questionnaires, children were asked about social anxiety, specifically fear of negative evaluation by peers, and about peer victimization. The peer victimization questions were parallel to questions asked of teachers in third and fourth grades and parents in third grade. New questions that were part of the fourth-grade questionnaire asked children about their behavioral engagement in school, peer social support, feelings of loneliness at school, media usage and parental monitoring of media usage, and pets. In contrast to the third-grade child questionnaire, the content of the fourth-grade questionnaire did not overlap with the content of the child questionnaires that were administered in the prior cohort study, the ECLS-K.

2-9
Exhibit 2-2. Child questionnaire topics by round of data collection in the ECLS-K:2011: Spring 2014 and spring 2015
Child questionnaire topics Spring
third grade Spring
fourth grade Perceived Interest/Competence in Reading1 X Perceived Interest/Competence in Math1 X Perceived Interest/Competence in Science1 X Perceived Interest/Competence in Peer Relationships1 X Peer Victimization2 X X Social Anxiety/Fear of Negative Evaluation3 X X Prosocial Behavior4 X Life Satisfaction5 X Behavioral Engagement6 X Peer Social Support7 X Loneliness8 X Media Usage9 X Pets10 X 1 Adapted from the Self Description Questionnaire I (SDQI) © Herbert Marsh. SELF Research Centre (Bankstown Campus) University of Western Sydney, Australia. Used with permission. 2 Peer victimization items were adapted from a 21-item scale by Espelage, D. L. and Holt, M. (2001). Bullying and victimization during early adolescence: Peer influences and psychosocial correlates. Journal of Emotional Abuse, 2: 123–142. 3 Adapted from the Social Anxiety Scale for Children—Revised ©1993 Annette M. La Greca, University of Miami. Used with permission. La Greca, A. M. and Stone, W. L. (1993). Social anxiety scale for children—revised: Factor structure and concurrent validity. Journal of Clinical Child Psychology, 22(1): 17–27. 4 Adapted from the Children’s Social Behavior Scale—Self Report (CSBS-S). Crick, N.R. and Grotpeter, J.K. (1995). Relational aggression, gender, and social psychological adjustment. Child Development, 66: 710–722. 5 Adapted from the NIH Toolbox for Assessment of Neurological and Behavioral Function (version 1.0): Domain-Specific Life Satisfaction Survey from the NIH Toolbox Emotion Battery (www.NIHToolbox.org) © 2012 Northwestern University and the National Institutes of Health. Used with permission. 6 Adapted from Skinner, Ellen A., Kindermann, T. A., and Furrer, C. J. (2009). A motivational perspective on engagement and disaffection: Conceptualization and assessment of children's behavioral and emotional participation in academic activities in the classroom. Educational and Psychological Measurement, 69(3), 493-525. 7 Adapted from Vandell, D. (2000). Peer Social Support, Bullying, and Victimization (Form FLV05GS: Kids in My Class at School) [measurement instrument]. NICHD Study of Early Child Care and Youth development: Phase III , 2000–2004. 8 Adapted from Parker, J. G. and Asher, S. R. (1993). Friendship and friendship quality in middle childhood: Links with peer group acceptance and feelings of loneliness and social dissatisfaction. Developmental Psychology, 29(4), 611–621. 9 Adapted from the Pew September Tracking Survey 2009. Citation: Princeton Survey Research Associates International (2009). Pew September Tracking Survey 2009. Pew Internet & American Life Project. 10 Adapted from the CENSHARE Pet Attachment Survey. Holcomb, R., Williams, R. C., and Richards, P. S. (1985). The elements of attachment: Relationship maintenance and intimacy. Journal of the Delta Society, 2(1), 28-34. SOURCE: U.S. Department of Education, National Center for Education Statistics, Early Childhood Longitudinal Study, Kindergarten Class of 2010–11 (ECLS-K:2011), spring 2014 and spring 2015.
2.1.3 Parent Interview
A parent interview was conducted during the spring of fourth grade. Unlike the kindergarten, first-grade, and second-grade data collections that had both fall and spring interviews, an interview was not conducted in the fall of subsequent rounds of the study. The average length of the spring fourth-grade parent interview was approximately 34 minutes. The spring fourth-grade parent interview was slightly longer than
2-10
the spring second-grade parent interview and shorter than the spring kindergarten, spring first-grade, and spring third-grade parent interviews, but captured much of the same information.
The spring fourth-grade parent interview included many of the same questions that were included in the kindergarten, first-grade, second-grade, and third-grade rounds of the study, for example, questions about parent involvement in the child’s school; homework; time children spent playing video games; children’s participation in out-of-school activities; whether there had been a change in the relationship of one of the parent figures to the child (e.g., adoption); and child health and well-being. In addition, information about children’s country of origin was collected if it had not been collected in kindergarten, first grade, second grade, or third grade. The spring fourth-grade parent interview also included some questions that were added in the spring of third grade, including whether parents monitor homework and the number of hours of sleep that the child gets. New to the fourth-grade data collection were questions about parents’ use of a computer or other electronic device to communicate with or get information from the child’s school; parent report of the child’s grades; school avoidance; parent monitoring of child’s internet use; number of close friends the child has; influence of the child’s best friend; whether academic extracurricular activities included education about mathematics, science, or technology; how often the parent argues with the child; and the parent’s life stress in the past 12 months.
Exhibit 2-3 shows the content areas included in the parent interview in the fall and spring of three grades (kindergarten, first grade, and second grade) and in the spring of third grade and fourth grade, by data collection round. While many of the same topics were addressed in multiple rounds, there were some differences in the specific questions asked for each topic. For example, there was only one question about employment in the springs of third grade and fourth grade, but multiple questions about employment in earlier interviews. Also, questions about whether parents were on active duty in the military were asked in the employment section of the spring third-grade and spring fourth-grade parent interview, but were not asked in earlier interviews.
The parent interview was conducted by telephone for most cases. The respondent to the parent interview was usually a parent or guardian in the household who identified himself or herself as the person who knew the most about the child’s care, education, and health. During the spring fourth-grade data collection round, interviewers attempted to complete the parent interview with the same respondent who completed the parent interview in the previous rounds. Another parent or guardian in the household who knew about the child’s care, education, and health was selected if the previous respondent was not available.
The parent interview was fully translated into Spanish before data collection began and was administered by bilingual interviewers if parent respondents preferred to speak in Spanish. The parent

2-11
interview was not translated into other languages because it was cost prohibitive to do so. However, interviews were completed with parents who spoke other languages by using an interpreter who translated the English version during the interview.
Exhibit 2-3. Parent interview topics, by round of data collection in the ECLS-K:2011: School years 2010–11, 2011–12, 2012–13, spring 2014, and spring 2015
Parent interview topics
Fall kinder-garten
Spring kinder- garten
Fall first
grade
Spring first
grade
Fall second
grade
Spring second
grade
Spring third
grade
Spring fourth grade
Child care arrangements1 X X X X X X X X
Child demographic characteristics2
X X X X X X X X
Child disabilities and services3 X X X X X X X
Child health and well-being X X X X X X X
Child mobility X X X X X X X
Child social skills, problem behaviors, and approaches to learning4
X X X X X
Country of origin of parent and child5
X X X X X
Family structure X X X X X X
Food sufficiency and food consumption
X X X X
Household roster X X X X X X
Home environment, activities, resources, and cognitive stimulation6
X X X X X X X X
Home language5 X X X X X X
Involvement of nonresident parent
X X X X X X
Neighborhood safety X X X
Parent characteristics X X X X X X Parenting stress X X X See notes at end of exhibit.

2-12
Exhibit 2-3. Parent interview topics, by round of data collection in the ECLS-K:2011: School years 2010–11, 2011–12, 2012–13, spring 2014, and spring 2015—Continued
Parent interview topics
Fall kinder- garten
Spring kinder- garten
Fall first
grade
Spring first
grade
Fall second
grade
Spring second
grade
Spring third
grade
Spring fourth grade
Parent education5 X X X X X
Parent employment7 X X X X X
Parent income and assets X X X X X
Parent involvement with the child’s education
X X X X X X
Parent marital history5 X X X
Parent marital status X X X X X X Parent respondent’s
psychological well-being and health
X X X X
Parent social support X
Parental beliefs and expectations related to education
X X
Parental discipline, warmth, and emotional supportiveness
X X X X X
Peer victimization X X
Time father/other adult male spends with child
X
Welfare and other public transfers
X X X X X
1 In the fall of kindergarten, questions were asked about current child care and child care in the year before kindergarten. In the spring of kindergarten, questions about child care in the year before kindergarten were asked if information had not been collected in the fall. In the fall of first and second grades, questions were about child care during the previous summer. In the spring of first, second, third, and fourth grades, questions asked about current child care. 2 Questions about child demographic characteristics were asked in the fall and spring of kindergarten and then asked in later rounds of the study if the information was missing from a previous round. Questions about the child’s specific ethnic origin were first asked in the spring third-grade parent interview; if the information was not provided in the spring of third grade, the questions were asked again in the spring fourth-grade parent interview. 3 Questions in the fall first- and second-grade interviews were about services for special needs or participation in a special education program over the previous summer. Questions about disabilities and services in other rounds of the study were not limited to the past summer. 4 In the spring of third and fourth grades, the questions in this section were about working memory. In previous rounds of the study, the questions were about social skills, behavior, and approaches to learning. 5 Asked if information had not been collected in a previous round. 6 Questions in the fall first- and second-grade interviews were about home activities, outings with family members, camps, and summer school during the previous summer. Questions in other rounds of the study were not limited to the summer. 7 In the spring of third and fourth grades, employment was asked about in a single question about whether a parent figure worked part-time, full-time, was a stay-at-home parent or guardian, or was not working. In previous rounds of the study, multiple questions about employment and occupation were asked. SOURCE: U.S. Department of Education, National Center for Education Statistics, Early Childhood Longitudinal Study, Kindergarten Class of 2010–11 (ECLS-K:2011), fall 2010, spring 2011, fall 2011, spring 2012, fall 2012, spring 2013, spring 2014, and spring 2015.

2-13
2.1.4 General Classroom Teacher Questionnaires
Teachers completed questionnaires in the spring fourth-grade data collection (spring 2015). The purposes of these questionnaires were (1) to gather information about the classroom environments and experiences that may relate to children’s academic and social development and (2) to obtain information from the teacher’ perspective about the child’s academic and social development.
The ECLS-K:2011 made a major change in its approach to collecting the teacher questionnaire data starting in fourth grade. In general, as children move into the upper elementary grades, more than one teacher is involved in a given child’s instruction. Although in some schools children may have one teacher who teaches them all subjects, it becomes more common for children in upper elementary grades to have different teachers for at least a few subject areas, such as reading and language arts, mathematics, science, and/or social studies. There are variations of this model with multiple teachers providing instruction implemented in schools. For example, students may have had a different teacher for each subject taught or they may have had one primary teacher for most subjects and a single other teacher for one subject (e.g., science). In short, it cannot be assumed that each child had only one regular classroom teacher who could respond to questions about the instruction of all subjects and the child’s performance in all subjects.
In order to accommodate this variation in organization for instruction, for the spring 2015 fourth-grade data collection, the same approach for collecting the teacher questionnaire data that was used in the fifth-grade round of the ECLS-K was followed. All sampled children had their reading teacher identified, and that teacher was asked to complete questionnaires. Information was also collected from children’s mathematics and science teachers. To reduce the response burden on teachers, half of the sampled children were randomly assigned to have their mathematics teacher complete questionnaires, while the other half of the sampled children were randomly assigned to have their science teacher complete questionnaires. Thus, every child had a reading teacher and either a mathematics or a science teacher identified for him or her. If a child had the same teacher for both reading and mathematics (for those selected for the mathematics teacher questionnaire) or for both reading and science (for those selected for the science teacher questionnaire), that same teacher was asked to provide information on both subjects.
All identified teachers received a self-administered teacher-level questionnaire that collected information about the teacher. Teachers were also asked to complete another questionnaire with questions about the study child and the teachers’ classrooms. This second questionnaire had many items tailored to the specific subject (reading, mathematics, or science) the teachers taught to study children.

2-14
Teacher Questionnaire, Teacher Level
The teacher-level teacher questionnaire asked teachers to provide information on the subjects he or she taught, use of class time by subject area, school climate, the teacher’s sense of efficacy and job satisfaction, and background information (e.g., education, certification, teaching experience). In the exhibits below, content included in the teacher-level questionnaire in the spring of fourth grade is marked with “A8,” which are the first two characters in the names of variables included on the data file that contain information collected through the teacher-level questionnaire.
Teacher Questionnaire, Child and Classroom Level
The child- and classroom-level questionnaire consisted of two parts: part 1 containing child-specific questions and part 2 containing classroom-specific questions. Separate questionnaires were developed for reading teachers, for mathematics teachers, and for science teachers.
Part 1: Child-specific questions. Each teacher was asked to answer questions about a specific ECLS-K:2011 study child in his or her classroom in part 1 of the child- and classroom-level questionnaire. If a teacher had multiple ECLS-K:2011 study children in his or her classroom, the teacher received different questionnaires for each child and was asked to complete the questions in Part 1 for each child. The questionnaires for mathematics and science teachers contained only a few child-level questions specifically related to mathematics or science, respectively. Because each child’s reading teacher completed a child- and classroom-level teacher questionnaire, the reading teacher was asked to answer additional child-level questions that were not included in the mathematics and science teacher questionnaires. Specifically, the reading teacher questionnaire contained questions related not only to reading but also to the child’s academic and social skills, classroom behaviors, and peer relationships. There were also questions in all three reading, mathematics, and science teacher questionnaires asking for child-specific instructional information (for example, instructional group placement and additional services the child receives).
Part 2: Classroom-specific questions. The questions in the classroom section of the child- and classroom-level teacher questionnaire pertained to the reading, mathematics, or science class in which the sampled student was taught. Specifically, teachers were asked to indicate how much time was spent on specific skills and activities in that subject area, and to answer questions on instruction and grading practices, behavioral issues, and homework assignments.
Since one teacher could instruct multiple study children in the same class and would be given multiple child- and classroom-level questionnaires, data collection procedures were implemented to

2-15
minimize teacher burden by not asking teachers to answer questions about the same class for multiple children. One “key child” was identified for each subject and class. Teachers were asked to complete the classroom-level questions in Part 2 of the questionnaire only for the “key child.” Part 2 questions were left unanswered in questionnaires for other students in the same class as the “key child.” If a teacher taught more than one section/class containing an ECLS-K:2011 student for a given subject, a “key child” was identified for each of the sections/classes, and the teacher was asked to complete the classroom questions in part 2 about each of the sections/classes.
The classroom-specific questions focused on the concepts and skills in each subject area. The kindergarten items in reading and mathematics came from the ECLS-K. The reading and mathematics concepts and skills in later rounds were based on the Common Core State Standards.5 Beginning in fourth grade, the parallel items in the science questionnaire relied on the Next Generation Science Standards.6 These two sets of standards are nationally recognized and were developed collaboratively by state departments of education and subject-matter specialists. The classroom-level questions also gathered information on instruction and grading practices, classroom behavioral issues, and homework assignments in the key child’s classroom.
In the exhibits below, content included in the child- and classroom-level questionnaire in the spring of fourth grade is marked with “G8” (reading), “M8” (mathematics), and/or “N8” (science). The characters G8, M8, and N8 are the first two characters in the names of variables included on the data file that contain information collected through the child- and classroom-level questionnaires provided to reading teachers, mathematics teachers, and science teachers, respectively.
Taken together, the content of the various teacher questionnaires is much the same as the content in the spring 2014 third-grade teacher questionnaires, but topics were reorganized across the teacher-level questionnaire and the child- and classroom-level questionnaire.
5 See www.corestandards.org for further information. An effort led by state governors and state commissioners of education to develop the Common Core State Standards for kindergarten through grade 12 was begun in 2009, through the National Governors Association Center for Best Practices and the Council of Chief State School Officers. 6 See www.nextgenscience.org for further information. The Next Generation Science Standards (NGSS) is a multi-state effort to create new science education standards for grades K-12 that are grounded in the most current research on science and scientific learning, which was outlined in the report Framework for K-12 Science Education that was released in 2011 from the National Academies of Science, a nongovernmental organization whose mission is to advise the nation on scientific and engineering issues. In 2013, the NGSS were released for states to consider for adoption.

2-16
The following teacher-level topics were introduced in fourth grade:
time spent on specific skills and topics in science;
time spent on specific activities in reading and language arts, in mathematics, and in science; and
time spent working independently and in groups (note that this construct appeared in teacher questionnaires in first and second grades).
Two items were added to the section on activities and resources related to Response to Intervention programs:
use of formal assessments in science, by purpose; and
views on school benchmarks or criteria in science performance.
Teacher-level items that had appeared in third-grade questionnaires but were omitted in fourth grade included:
student mobility;
language spoken by teachers in the classroom; and
topics and skills taught in social studies.
Child-level topics were added based on discussions with experts who participated in a Technical Review Panel meeting in November of 2013. New child-level topics added for fourth grade included:
student’s school liking and avoidance;
teacher ratings of child’s peer group;
social understanding; and
peer relationships.
Exhibits 2-4 and 2-5 show the teacher- and child-level topics addressed in the kindergarten through fourth-grade teacher- and child-level questionnaires, respectively, by data collection round. As noted in text above, abbreviations in the fourth-grade column (which are defined in the notes to the tables and which match the relevant data file prefix) indicate in which of the fourth-grade teacher questionnaires a particular topic was addressed. Although the same topics are included across rounds, the actual items can vary by data collection round.
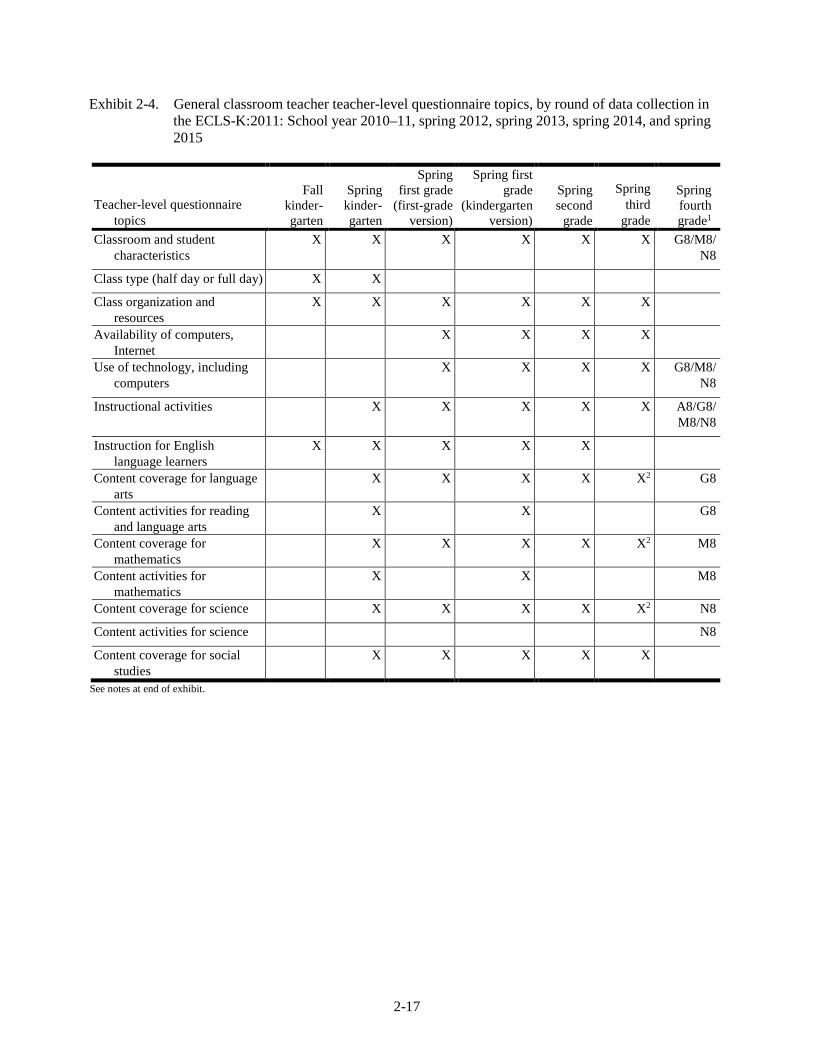
2-17
Exhibit 2-4. General classroom teacher teacher-level questionnaire topics, by round of data collection in the ECLS-K:2011: School year 2010–11, spring 2012, spring 2013, spring 2014, and spring 2015
Teacher-level questionnaire topics
Fall kinder-garten
Spring kinder-garten
Spring first grade (first-grade
version)
Spring first grade
(kindergarten version)
Spring second
grade
Spring third
grade
Spring fourth grade1
Classroom and student characteristics
X X X X X X G8/M8/ N8
Class type (half day or full day) X X
Class organization and resources
X X X X X X
Availability of computers, Internet
X X X X
Use of technology, including computers
X X X X G8/M8/ N8
Instructional activities X X X X X A8/G8/ M8/N8
Instruction for English language learners
X X X X X
Content coverage for language arts
X X X X X2 G8
Content activities for reading and language arts
X X G8
Content coverage for mathematics
X X X X X2 M8
Content activities for mathematics
X X M8
Content coverage for science X X X X X2 N8
Content activities for science N8
Content coverage for social studies
X X X X X
See notes at end of exhibit.

2-18
Exhibit 2-4. General classroom teacher teacher-level questionnaire topics, by round of data collection in the ECLS-K:2011: School year 2010–11, spring 2012, spring 2013, spring 2014, and spring 2015—Continued
Teacher-level questionnaire topics
Fall kinder-garten
Spring kinder-garten
Spring first grade
(first-grade
version)
Spring first grade
(kindergarten version)
Spring second
grade
Spring third
grade
Spring fourth grade1
Activities and resources related to Response to Intervention programs
X X X X G8/M8/ N8
Teacher evaluation and grading practices
X X X X X A8
Parent involvement X X X X X A8
Meeting with other teachers X
Respect from and cooperation with other teachers
X X X X X
Opportunities for professional development
X X X X X X G8/M8/ N8
Teacher’s views on teaching, school climate, and environment
X X X X X X A8
Teacher’s experience, education, and background
X X3 X X X X A8
1 For the spring of fourth grade, teacher questionnaires were reorganized by subject area, which resulted in a mix of teacher-level and child-level content within the three subject area questionnaires. To indicate the location of the identified content within the different teacher questionnaires, the column for fourth grade identifies the prefix used for the names of variables containing data from each of the questionnaires. The prefix for each questionnaire is as follows: A8: Spring 2015 Fourth-Grade Teacher Questionnaire G8: Spring 2015 Fourth-Grade Reading and Language Arts Teacher Questionnaire M8: Spring 2015 Fourth-Grade Mathematics Teacher Questionnaire N8: Spring 2015 Fourth-Grade Science Teacher Questionnaire 2 In spring third grade, these items were contained in a separate questionnaire to facilitate obtaining responses from multiple teachers, if applicable. 3 In the spring of kindergarten, teachers new to the study were asked to complete a supplemental teacher-level questionnaire in order to collect information on their experience, education, and background that had been collected from other teachers in the fall. Teachers who provided information in the fall were not asked the same questions again in the spring. SOURCE: U.S. Department of Education, National Center for Education Statistics, Early Childhood Longitudinal Study, Kindergarten Class of 2010–11 (ECLS-K:2011), fall 2010, spring 2011, spring 2012, spring 2013, spring 2014, and spring 2015.

2-19
Exhibit 2-5. General classroom teacher child-level questionnaire topics, by round of data collection in the ECLS-K:2011: School years 2010–11, 2011–12, 2012–13, spring 2014, and spring 2015
Child-level questionnaire topics
Fall kinder-garten
Spring kinder-garten
Fall first
grade
Spring first
grade
Spring first
grade (kinder-
garten version)
Fall second
grade
Spring second
grade
Spring third
grade
Spring fourth grade1
Student and enrollment information
X X X X X X X X G8/M8/N8
Summer assignments X X
Language and literacy skills and knowledge
X X X X X X
Mathematical thinking skills and knowledge
X X X X
Science skills and knowledge X X
Overall academic rating X X
Overall academic rating, by subject
X X G8/M8/N8
Social skills X X X X X X X G8
Approaches to learning X X X X X X X G8
Attention focusing and inhibitory control
X X X X X G8
School liking and avoidance G8
Student-teacher relationship X X X X
Peer relationships X G8
Bullying, victimization X X G8
Working memory, executive function
X
Specialized programs and services for the child
X X X X X G8/M8/N8
See notes at end of exhibit.

2-20
Exhibit 2-5. General classroom teacher child-level questionnaire topics, by round of data collection in the ECLS-K:2011: School years 2010–11, 2011–12, 2012–13, spring 2014, and spring 2015—Continued
Child-level questionnaire topics
Fall kinder-garten
Spring kinder-garten
Fall first
grade
Spring first
grade
Spring first
grade (kinder-
garten version)
Fall second
grade
Spring second
grade
Spring third
grade
Spring fourth grade1
Instruction for English language learners
X X X X X G8
Prediction of child’s ultimate educational attainment
X X X
Parent involvement X X X X X G8
Child’s primary teacher in reading, mathematics, science, and social studies
X X X X G8/M8/N8
1 For the spring of fourth grade, teacher questionnaires were reorganized by subject area, which resulted in a mix of teacher-level and child-level content within the three subject area questionnaires. To indicate the location of the identified content within the different teacher questionnaires, the column for fourth grade identifies the prefix used for the names of variables containing data from each of the questionnaires. The prefix for each questionnaire is as follows: G8: Spring 2015 Fourth-Grade Reading and Language Arts Teacher Questionnaire M8: Spring 2015 Fourth-Grade Mathematics Teacher Questionnaire N8: Spring 2015 Fourth-Grade Science Teacher Questionnaire SOURCE: U.S. Department of Education, National Center for Education Statistics, Early Childhood Longitudinal Study, Kindergarten Class of 2010–11 (ECLS-K:2011), fall 2010, spring 2011, fall 2011, spring 2012, fall 2012, spring 2013, spring 2014, and spring 2015.
2.1.5 Special Education Teacher Questionnaires
As was done in each year from kindergarten through third grade, a set of special education teacher questionnaires was completed in the spring of the fourth-grade year for each participating child with an Individualized Education Program (IEP) or equivalent program on record with the school. The respondent to the questionnaire could have been a staff member identified as the child’s special education teacher, a related service provider if the child was not taught by a special education teacher, or the child’s general classroom teacher if that teacher provided all of the child’s education and services required by an IEP. Two self-administered hard-copy instruments were used, a teacher-level questionnaire and a child-level questionnaire.
The special education teacher-level questionnaire collected information on the special education teacher’s background, education, teaching experience, teaching position, and caseload. The special education child-level questionnaire addressed the following topics: current services received through an IEP, child’s disabilities (primary disability and all those for which the child received services),

2-21
IEP goals and meeting those goals, classroom placement, expectations regarding general education goals, the special education teacher’s communication with other teachers and the child’s parents, grade placement, and participation in assessments.
The addition of one item was the only change in the special education questionnaires used in fourth grade compared with those in the third-grade round of data collection. The added item, under the topic of special education and related services, was the following: Whether the child had had the assistance of a service animal at school.
Exhibit 2-6 shows the topics addressed in the kindergarten through fourth-grade special education teacher-level and child-level questionnaires by data collection round.
Exhibit 2-6. Special education teacher questionnaire topics, by round of data collection in the ECLS-K:2011: Spring 2011, spring 2012, spring 2013, spring 2014, and spring 2015
Special education teacher questionnaire topics
Spring kindergarten
Spring first grade
Spring second
grade Spring
third grade Spring
fourth grade Teacher-level topics
Teacher characteristics X X X X X Teacher education and experience X X X X X Teacher position, assignment, and
caseload X X X X X
Child-level topics
Prekindergarten services received through an Individualized Education Program (IEP)
X
Current special education and related services received through an IEP
X X X X X
Child’s disabilities (primary disability and those for which services have been received)
X X X X X
Goals of the child’s IEP and extent to which goals have been met
X X X X X
Classroom placement X X X X X Special education teacher’s
communication with other teachers and the child’s parents
X X X X X
Expectations regarding general education goals
X X X X X
Grade placement X X X X Participation in assessments X X X X X
SOURCE: U.S. Department of Education, National Center for Education Statistics, Early Childhood Longitudinal Study, Kindergarten Class of 2010–11 (ECLS-K:2011), spring 2011, spring 2012, spring 2013, spring 2014, and spring 2015.

2-22
2.1.6 School Administrator Questionnaires
As in first through third grade, there were two versions of the school administrator questionnaire (SAQ) used in fourth grade: (1) a version for schools that were new to the study or for which a completed school administrator questionnaire was not received in a prior data collection, and (2) a shorter version for schools for which a school administrator questionnaire had been completed in a prior year. To reduce respondent burden, the shorter version did not include questions for which the responses were not expected to change significantly from year to year, for example, grades offered by the school, type of school (public, private, magnet, charter), adequacy of facilities, and neighborhood problems.
The school administrator questionnaires were hard-copy paper questionnaires completed by the school principal/administrator and/or his or her designee during the spring data collection round of the fourth-grade year. The school administrator questionnaires addressed the following topics: school characteristics; facilities and resources; school-family-community connections; school policies and practices; implementation of Response to Intervention programs and practices; school programs for particular populations (language minority children and children with special needs); federal programs; staffing and teacher characteristics; and school administrator characteristics and background.
The school administrator questionnaires for the fourth grade were very similar to those used in the third-grade year. Compared with the third-grade questionnaires, those for fourth grade had two new constructs:
modes used by the school to communicate with parents (electronic and nonelectronic) and the general content of the communications (these were added to the school-family-community connections section); and
whether and when the school had implemented the Common Core State Standards (in the policies and practices section).
In fourth grade the following items were omitted from both versions of the SAQ:
availability and adequacy of facilities and resources;
school-based programs or services for parents and families;
level of parent involvement;
degree of community support;
school’s willingness to let parents observe classes;

2-23
type of instruction for English language learners—it should be noted that this topic is included in the child-level items of the reading teacher questionnaire in fourth grade, as part of the specialized programs and services for the child;
specific services and programs provided by Title I and Title III federal programs; and
school-level state assessment data and school improvement activities resulting from status on “Adequate Yearly Progress.”
Exhibit 2-7 shows the topics addressed in the kindergarten through fourth-grade school administrator questionnaires by data collection round, with separate columns for new schools and returning schools.
Exhibit 2-7. School administrator questionnaire topics, by round of data collection in the ECLS-K:2011:
Spring 2011, spring 2012, spring 2013, spring 2014, and spring 2015
School administrator questionnaire topics
Spring kinder- garten
Spring first
grade (new
schools)
Spring first
grade (returning
schools)
Spring second
grade (new
schools)
Spring second
grade (returning
schools)
Spring third
grade (new
schools)
Spring third
grade (returning
schools)
Spring fourth grade (new
schools)
Spring fourth grade
(returning schools)
School characteristics X X X X X X X X X Facilities and resources X X X X X X School-family-community
connections X X X X X X X X X
School policies and practices
X X X X X X X X X
Response to Intervention programs
X X X X X X X X
School programs for particular populations (language minority children and children with special needs)
X X X X X X X X X
Federal programs X X X X X X X X X Staffing and teacher
characteristics X X X X X X X X X
School administrator characteristics and background
X X X X X X X X X
SOURCE: U.S. Department of Education, National Center for Education Statistics, Early Childhood Longitudinal Study, Kindergarten Class of 2010–11(ECLS-K:2011), spring 2011, spring 2012, spring 2013, spring 2014, and spring 2015.
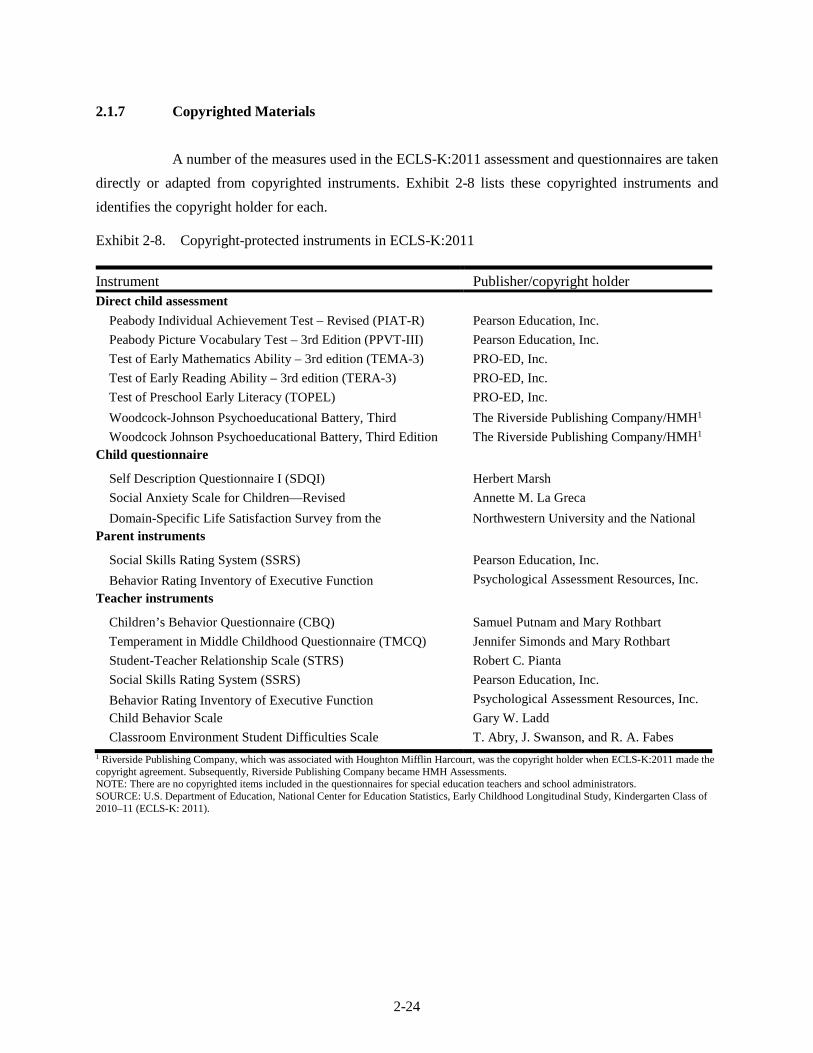
2-24
2.1.7 Copyrighted Materials
A number of the measures used in the ECLS-K:2011 assessment and questionnaires are taken directly or adapted from copyrighted instruments. Exhibit 2-8 lists these copyrighted instruments and identifies the copyright holder for each.
Exhibit 2-8. Copyright-protected instruments in ECLS-K:2011
Instrument Publisher/copyright holder Direct child assessment Peabody Individual Achievement Test – Revised (PIAT-R) Pearson Education, Inc. Peabody Picture Vocabulary Test – 3rd Edition (PPVT-III) Pearson Education, Inc. Test of Early Mathematics Ability – 3rd edition (TEMA-3) PRO-ED, Inc. Test of Early Reading Ability – 3rd edition (TERA-3) PRO-ED, Inc. Test of Preschool Early Literacy (TOPEL) PRO-ED, Inc. Woodcock-Johnson Psychoeducational Battery, Third
The Riverside Publishing Company/HMH1
Woodcock Johnson Psychoeducational Battery, Third Edition
The Riverside Publishing Company/HMH1
Child questionnaire Self Description Questionnaire I (SDQI) Herbert Marsh Social Anxiety Scale for Children—Revised Annette M. La Greca Domain-Specific Life Satisfaction Survey from the
Northwestern University and the National Parent instruments
Social Skills Rating System (SSRS) Pearson Education, Inc. Behavior Rating Inventory of Executive Function
Psychological Assessment Resources, Inc. Teacher instruments Children’s Behavior Questionnaire (CBQ) Samuel Putnam and Mary Rothbart Temperament in Middle Childhood Questionnaire (TMCQ) Jennifer Simonds and Mary Rothbart Student-Teacher Relationship Scale (STRS) Robert C. Pianta Social Skills Rating System (SSRS) Pearson Education, Inc. Behavior Rating Inventory of Executive Function
Psychological Assessment Resources, Inc. Child Behavior Scale Gary W. Ladd Classroom Environment Student Difficulties Scale T. Abry, J. Swanson, and R. A. Fabes 1 Riverside Publishing Company, which was associated with Houghton Mifflin Harcourt, was the copyright holder when ECLS-K:2011 made the copyright agreement. Subsequently, Riverside Publishing Company became HMH Assessments. NOTE: There are no copyrighted items included in the questionnaires for special education teachers and school administrators. SOURCE: U.S. Department of Education, National Center for Education Statistics, Early Childhood Longitudinal Study, Kindergarten Class of 2010–11 (ECLS-K: 2011).

2-25
2.2 Data Collection Methods
The data collection methods used for the spring fourth-grade round of the ECLS-K:2011 were the same as those used in previous rounds, with just a few exceptions described below. Please refer to the Early Childhood Longitudinal Study, Kindergarten Class of 2010–11 (ECLS-K:2011), User’s Manual for the ECLS-K:2011 Kindergarten Data File and Electronic Codebook , Public Version (NCES 2015-074) (Tourangeau et al. 2015 for an overview of the general study procedures for school recruitment, field staff training, school contact in the fall, data collection, tracing activities, and data collection quality control.
2.2.1 Comparison of Data Collection Methods Used in Fourth Grade to Those Used in Earlier Data Collection Rounds
School recruitment. Fourth-grade school recruitment followed the same procedures used in third–grade school recruitment. Data collection staff team leaders7 recruited only new transfer schools, meaning those schools to which study children moved between third grade and the spring of fourth grade. Recruitment was not repeated for schools that had participated in the kindergarten, first-, second-, or third-grade years.
Field staff training. Training for the fourth-grade data collection was similar to the training for the spring third-grade collection. Both team leaders and assessors completed a home study prior to attending in-person training. Both team leaders and assessors were trained on the parent interview, the child assessment, and the child questionnaire during a 6-day, in-person training. Child assessment and child questionnaire training included interactive sessions, individual practice, and role plays with partners. In the spring of fourth grade, all team leaders were trained via the Learning Management System (LMS), an online learning platform that delivers and tracks assigned trainings in a browser environment. New team leaders participated in an additional 1-day, in-person training. Training for school recruiters for the fourth-grade data collection was conducted via WebEx8 as was done in third grade.
Advance school contact in the fall. Advance school contact for fourth grade remained the same as in the third grade. However, a new protocol for the collection of teacher information was implemented. Each child was linked to a reading teacher and to either a mathematics or science teacher, unlike in previous rounds where each child was linked to one regular classroom teacher.
7 The team leader is a specially trained ECLS-K:2011 staff member responsible for communicating with schools and making arrangements for assessment activities and for leading a team of assessors in each school. 8 WebEx is an Internet-based web conferencing tool for sharing presentations in any format with an audience in multiple remote locations.

2-26
Data collection. Data collection procedures used in fourth grade were the same as those used during the third-grade year. As described above, however, revisions were made to the instruments that had been used in the earlier rounds. As in third grade, a child questionnaire was administered via an audio computer-assisted self-interview (audio-CASI). A new executive function component, the Flanker task, was added to the fourth grade child assessment. The Flanker task measures inhibitory control.
Tracing activities. Tracing activities for the fourth-grade round remained the same as those used in earlier rounds.
Quality control. Quality control and validation procedures for the fourth-grade round remained the same as those used in in earlier rounds.

3-1
3. ECLS-K:2011 DIRECT AND INDIRECT ASSESSMENT DATA
This chapter provides information primarily about the direct and indirect assessment data from the fourth-grade collection of the ECLS-K:2011. The chapter begins with a description of the direct cognitive assessments, providing information about the scores available in the data file. The chapter then presents information on the executive function assessments. Beginning in fourth grade, study children completed a new direct measure of executive function, a flanker task, in addition to measures administered in previous rounds, a card sort task and a numbers reversed task. Next the chapter presents information on the fourth-grade child questionnaire, which repeated some content from the third-grade child questionnaire but also included new content. Finally, the chapter closes with information on teacher- and parent-reported assessments of children’s cognitive and socioemotional knowledge and skills.
This chapter includes information about assessment data from the kindergarten through fourth-grade rounds of data collection in three instances: when those data have been changed since their release on previous files, when new data from those rounds have been added to the kindergarten through fourth-grade (K-4) data file, and when necessary to illustrate how fourth-grade data related to a particular measure or construct differ from data related to the same measure or construct released for the earlier rounds. Information about assessments that were used in prior rounds but not in fourth grade, for example the Spanish Early Reading Skills (SERS) assessment, and about scores that were produced only for earlier rounds, such as raw number-right scores, can be found in the Early Childhood Longitudinal Study, Kindergarten Class of 2010–11 (ECLS-K:2011), User’s Manual for the ECLS-K:2011 Kindergarten Data File and Electronic Codebook, Public Version (NCES 2015-074) (Tourangeau et al. 2015), hereinafter referred to as the base-year User’s Manual, the Early Childhood Longitudinal Study, Kindergarten Class of 2010–11 (ECLS-K:2011), User’s Manual for the ECLS-K:2011 Kindergarten–First Grade Data File and Electronic Codebook, Public Version (NCES 2015-078) (Tourangeau et al. 2015), the Early Childhood Longitudinal Study, Kindergarten Class of 2010–11 (ECLS-K:2011), User’s Manual for the ECLS-K:2011 Kindergarten–Second Grade Data File and Electronic Codebook, Public Version (2017-285) (Tourangeau et al. 2017), and the User’s Manual for the ECLS-K:2011 Kindergarten–Third Grade Data File and Electronic Codebook, Public Version (2018-034) (Tourangeau et al. 2018).

3-2
3.1 Direct Cognitive Assessment: Reading, Mathematics, and Science
The kindergarten, first-grade, second-grade, third-grade, and fourth-grade direct cognitive assessments measured children’s knowledge and skills in reading, mathematics, and science. This section presents information about the direct cognitive assessment scores available in the data file. More detailed information about the development of the scores, including a more complete discussion of item response theory (IRT) procedures, can be found in the Early Childhood Longitudinal Study, Kindergarten Class of 2010–11 (ECLS-K:2011), Kindergarten Psychometric Report (Najarian et al. forthcoming); in the Early Childhood Longitudinal Study, Kindergarten Class of 2010–11 (ECLS-K:2011), First-Grade and Second-Grade Psychometric Report (Najarian et al. forthcoming); and in the Early Childhood Longitudinal Study, Kindergarten Class of 2010–11 (ECLS-K:2011), Third- Through Fifth-Grade Psychometric Report (Najarian et al. forthcoming). A description of the administration of the direct assessments is provided in chapter 2.
It must be emphasized that the direct cognitive assessment scores described below are not directly comparable with those developed for the Early Childhood Longitudinal Study, Kindergarten Class of 1998–99 (ECLS-K). Although the IRT procedures used in the analysis of data were similar in the ECLS-K and in the ECLS-K:2011, each study incorporated different items and the resulting scales are different.
3.1.1 IRT-Based Scores Developed for the ECLS-K:2011
Broad-based scores using the full set of items administered in the kindergarten, first-grade, second-grade, third-grade, and fourth-grade assessments in reading, mathematics, and science were calculated using IRT procedures. IRT is a method for modeling assessment data that makes it possible to calculate an overall score for each domain measured for each child that can be compared to scores of other children regardless of which specific items a child is administered. This method was used to calculate scores for the ECLS-K:2011 because, as discussed in chapter 2, the study employed a two-stage assessment (in reading and mathematics in kindergarten and in reading, mathematics, and science in first, second, third, and fourth grades) in which children were administered a set of items appropriate for their demonstrated ability level rather than all the items in the assessment. Although this procedure resulted in children being administered different sets of items, there was a subset of items that all children received (the items in the routing tests, plus a set of items common across the different second-stage forms). These common items were used to calculate scores for all children on the same scale.

3-3
IRT also was used to calculate scores for all children on the same scale for the science assessment fielded in the spring of kindergarten even though that assessment was not two-stage. In that assessment, the assortment of items a child received was not dependent upon routing to a second stage, but instead on omissions by the child or the discontinuation of the administration of the assessment. In those cases, IRT was used to estimate the probability that a child would have provided a correct response when no response was available.
IRT uses the pattern of right and wrong responses to the items actually administered in an assessment and the difficulty, discriminating ability,1 and “guess-ability” of each item to estimate each child’s ability on the same continuous scale. IRT has several advantages over raw number-right scoring. By using the overall pattern of right and wrong responses and the characteristics of each item to estimate ability, IRT can adjust for the possibility of a low-ability child guessing several difficult items correctly. If answers on several easy items are wrong, the probability of a correct answer on a difficult item would be quite low. Omitted items are also less likely to cause distortion of scores, as long as enough items have been answered to establish a consistent pattern of right and wrong answers. Unlike raw number-right scoring, which treats omitted items as if they had been answered incorrectly, IRT procedures use the pattern of responses to estimate the probability of a child providing a correct response for each assessment question. Finally, IRT scoring makes possible longitudinal measurement of gain in achievement, even when the assessments that are administered to a child are not identical at each point, for example, when a child was administered different levels of the second-stage form in the fall and spring data collections within one year or different sets of items across grades.
3.1.1.1 Theta and the Standard Error of Measurement (SEM) of Theta
A theta score is provided in the ECLS-K:2011 data file for each child who participated in the direct cognitive assessment for each cognitive domain assessed and for each data collection in which the assessment was administered. The theta score2 is an estimate of a child’s ability in a particular domain (e.g., reading, mathematics, or science) based on his or her performance on the items he or she was actually administered. The theta scores are reported on a metric ranging from -8 to 8, with lower scores indicating lower ability and higher scores indicating higher ability. Theta scores tend to be normally distributed because they represent a child’s latent ability and are not dependent on the difficulty of the items included within a specific test.
1 The discriminating ability describes how well changes in ability level predict changes in the probability of answering the item correctly at a particular ability level. 2 Theta is iteratively estimated and re-estimated, and the theta score is derived from the means of the posterior distribution of the theta estimate.

3-4
The standard error of theta provides a measure of uncertainty of the theta score estimate for each child. Adding and subtracting twice the standard error from the theta score estimates provides an approximate 95 percent confidence interval or range of values that is likely to include the true theta score. Unlike classical item theory, in which the precision of the scores is consistent across all examinees, IRT allows the standard error to vary. Larger standard errors of measurement can be the result of estimations of thetas in the extremes of the distribution (very low or very high ability) or for children who responded to a limited number of items (i.e., children who responded to all items administered generally had lower standard errors of measurement than those children responding to fewer items because more information about their actual performance was available, thereby making estimates of their ability more precise).
Tables 3-1 and 3-2 list the names of the variables pertaining to the reading, mathematics, and science IRT theta scores and standard errors of measurement available in the data file, along with the variable descriptions, value ranges, weighted means, and standard deviations.3 As can be seen in the tables, theta scores are available for all data collection rounds for reading and mathematics. For science, theta scores are available for all rounds except the fall of kindergarten; the science assessment was not included in that first round of data collection. The variable names and descriptions end with K4, indicating these are scores released on the kindergarten–fourth grade (K–4) longitudinal data file.
The method used to compute the theta scores allows for the calculation of theta for a given round that will not change based on later administrations of the assessments (which is not true for the scale scores, as described in the next section). Therefore, for any given child, the kindergarten, first-grade, second-grade, third-grade, and fourth-grade theta scores provided in subsequent data files will be the same as theta scores released in earlier data files, with one exception: the reading thetas provided in the base-year data file. After the kindergarten-year data collection, the methodology used to calibrate and compute reading scores changed; therefore, the reading thetas reported in the base-year file are not the same as the kindergarten reading thetas provided in the files with later-round data. Any analysis involving kindergarten reading theta scores and reading theta scores from later rounds, for example an analysis looking at growth in reading knowledge and skills between the spring of kindergarten and the spring of first grade, should use the kindergarten reading theta scores from a data file released after the base year. The reading theta scores released in the kindergarten-year data file are appropriate for analyses involving only the kindergarten-round data; analyses conducted with only data released in the base-year file are not incorrect, since those analyses do not compare kindergarten scores to scores in later rounds that were computed differently.
3 The name and description for each variable in the tables begin with an “X,” indicating that it is a derived/calculated variable, and a data collection round number (1 for the fall kindergarten round, 2 for the spring kindergarten round, 3 for the fall first-grade round, 4 for the spring first-grade round, 5 for the fall second-grade round, 6 for the spring second-grade round, 7 for the spring third-grade round, and 8 for the spring fourth-grade round). These variable naming conventions are used for all the variables mentioned in this chapter. More information about variable naming conventions can be found in chapter 7.

3-5
However, now that the recomputed kindergarten theta scores are available in the kindergarten through first-grade, kindergarten through second-grade, kindergarten through third-grade, and kindergarten through fourth-grade data files, it is recommended that researchers conduct any new analyses with the recomputed kindergarten reading theta scores. For more information on the methods used to calculate theta scores, see the ECLS-K:2011 First-Grade and Second-Grade Psychometric Report (Najarian et al. forthcoming) and the ECLS-K:2011 Third- Through Fifth-Grade Psychometric Report (Najarian et al. forthcoming).
Table 3-1. Direct cognitive assessment: IRT theta scores, fall and spring kindergarten, fall and spring first-grade, fall and spring second-grade, spring third-grade, and spring fourth-grade assessments: School years 2010–11, 2011–12, 2012–13, spring 2014, and spring 2015
Variable Description n Range of
possible values Weighted
mean Standard deviation
X1RTHETK4 X1 READING THETA-K4 15,669 -8.0–+8.0 -0.56 0.844 X2RTHETK4 X2 READING THETA-K4 17,185 -8.0–+8.0 0.44 0.774 X3RTHETK4 X3 READING THETA-K4 5,194 -8.0–+8.0 0.87 0.778 X4RTHETK4 X4 READING THETA-K4 15,115 -8.0–+8.0 1.59 0.753 X5RTHETK4 X5 READING THETA-K4 4,725 -8.0–+8.0 1.83 0.654 X6RTHETK4 X6 READING THETA-K4 13,837 -8.0–+8.0 2.19 0.630 X7RTHETK4 X7 READING THETA-K4 12,866 -8.0–+8.0 2.61 0.649 X8RTHETK4 X8 READING THETA-K4 12,074 -8.0–+8.0 2.90 0.603 X1MTHETK4 X1 MATH THETA-K4 15,595 -8.0–+8.0 -0.52 0.932 X2MTHETK4 X2 MATH THETA-K4 17,143 -8.0–+8.0 0.42 0.776 X3MTHETK4 X3 MATH THETA-K4 5,222 -8.0–+8.0 0.91 0.821 X4MTHETK4 X4 MATH THETA-K4 15,103 -8.0–+8.0 1.65 0.840 X5MTHETK4 X5 MATH THETA-K4 4,729 -8.0–+8.0 1.91 0.817 X6MTHETK4 X6 MATH THETA-K4 13,830 -8.0–+8.0 2.45 0.802 X7MTHETK4 X7 MATH THETA-K4 12,866 -8.0–+8.0 3.05 0.759 X8MTHETK4 X8 MATH THETA-K4 12,080 -8.0–+8.0 3.42 0.761 X2STHETK4 X2 SCIENCE THETA-K4 16,936 -8.0–+8.0 0.00 0.891 X3STHETK4 X3 SCIENCE THETA-K4 5,180 -8.0–+8.0 0.43 0.932 X4STHETK4 X4 SCIENCE THETA-K4 15,072 -8.0–+8.0 0.89 0.965 X5STHETK4 X5 SCIENCE THETA-K4 4,724 -8.0–+8.0 1.18 0.954 X6STHETK4 X6 SCIENCE THETA-K4 13,819 -8.0–+8.0 1.61 0.908 X7STHETK4 X7 SCIENCE THETA-K4 12,856 -8.0–+8.0 2.20 0.779 X8STHETK4 X8 SCIENCE THETA-K4 12,069 -8.0–+8.0 2.61 0.818 NOTE: Fall kindergarten estimates (X1) and spring kindergarten estimates (X2) estimates are weighted by W1C0. Fall first-grade estimates (X3) are weighted by W3CF3P_30, and spring first-grade estimates (X4) are weighted by W4CS4P_20. Fall second-grade estimates (X5) are weighted by W6CF6P_2A0, and spring second-grade estimates (X6) are weighted by W6CS6P_20. Spring third-grade estimates (X7) are weighted by W7C7P_20. Spring fourth-grade estimates (X8) are weighted by W8C8P_20. The unweighted sample n indicates the number of cases with valid data regardless of the presence of a valid analytic weight. SOURCE: U.S. Department of Education, National Center for Education Statistics, Early Childhood Longitudinal Study, Kindergarten Class of 2010–11 (ECLS-K:2011), fall 2010, spring 2011, fall 2011, spring 2012, fall 2012, spring 2013, spring 2014, and spring 2015.

3-6
Table 3-2. Direct cognitive assessment: IRT standard errors of measurement (SEM), fall and spring kindergarten, fall and spring first-grade, fall and spring second-grade, spring third-grade, and spring fourth-grade assessments: School years 2010–11, 2011–12, 2012–13, spring 2014, and spring 2015
Variable Description n
Range of possible
values Weighted
mean Standard deviation
X1RSETHK4 X1 READING STD ERR OF THETA-K4 15,669 0.0–6.0 0.36 0.092 X2RSETHK4 X2 READING STD ERR OF THETA-K4 17,185 0.0–6.0 0.26 0.077 X3RSETHK4 X3 READING STD ERR OF THETA-K4 5,194 0.0–6.0 0.23 0.057 X4RSETHK4 X4 READING STD ERR OF THETA-K4 15,115 0.0–6.0 0.22 0.050 X5RSETHK4 X5 READING STD ERR OF THETA-K4 4,725 0.0–6.0 0.20 0.035 X6RSETHK4 X6 READING STD ERR OF THETA-K4 13,837 0.0–6.0 0.22 0.042 X7RSETHK4 X7 READING STD ERR OF THETA-K4 12,866 0.0–6.0 0.24 0.051 X8RSETHK4 X8 READING STD ERR OF THETA-K4 12,074 0.0–6.0 0.23 0.038 X1MSETHK4 X1 MATH STD ERR OF THETA-K4 15,595 0.0–6.0 0.36 0.101 X2MSETHK4 X2 MATH STD ERR OF THETA-K4 17,143 0.0–6.0 0.29 0.064 X3MSETHK4 X3 MATH STD ERR OF THETA-K4 5,222 0.0–6.0 0.28 0.048 X4MSETHK4 X4 MATH STD ERR OF THETA-K4 15,103 0.0–6.0 0.28 0.037 X5MSETHK4 X5 MATH STD ERR OF THETA-K4 4,729 0.0–6.0 0.29 0.043 X6MSETHK4 X6 MATH STD ERR OF THETA-K4 13,830 0.0–6.0 0.28 0.035 X7MSETHK4 X7 MATH STD ERR OF THETA-K4 12,866 0.0–6.0 0.23 0.015 X8MSETHK4 X8 MATH STD ERR OF THETA-K4 12,080 0.0–6.0 0.21 0.012 X2SSETHK4 X2 SCIENCE STD ERR OF THETA-K4 16,936 0.0–6.0 0.71 0.081 X3SSETHK4 X3 SCIENCE STD ERR OF THETA-K4 5,180 0.0–6.0 0.59 0.039 X4SSETHK4 X4 SCIENCE STD ERR OF THETA-K4 15,072 0.0–6.0 0.59 0.032 X5SSETHK4 X5 SCIENCE STD ERR OF THETA-K4 4,724 0.0–6.0 0.46 0.066 X6SSETHK4 X6 SCIENCE STD ERR OF THETA-K4 13,819 0.0–6.0 0.46 0.050 X7SSETHK4 X7 SCIENCE STD ERR OF THETA-K4 12,856 0.0–6.0 0.39 0.045 X8SSETHK4 X8 SCIENCE STD ERR OF THETA-K4 12,069 0.0–6.0 0.34 0.039
NOTE: Fall kindergarten estimates (X1) and spring kindergarten estimates (X2) are weighted by W1C0. Fall first-grade estimates (X3) are weighted by W3CF3P_30, and spring first-grade estimates (X4) are weighted by W4CS4P_20. Fall second-grade estimates (X5) are weighted by W6CF6P_2A0, and spring second-grade estimates (X6) are weighted by W6CS6P_20. Spring third-grade estimates (X7) are weighted by W7C7P_20. Spring fourth-grade estimates (X8) are weighted by W8C8P_20. The unweighted sample n indicates the number of cases with valid data regardless of the presence of a valid analytic weight. SOURCE: U.S. Department of Education, National Center for Education Statistics, Early Childhood Longitudinal Study, Kindergarten Class of 2010–11 (ECLS-K:2011), fall 2010, spring 2011, fall 2011, spring 2012, fall 2012, spring 2013, spring 2014, and spring 2015.
3.1.1.2 Scale Scores
The IRT-based overall scale score for each content domain is an estimate of the number of items a child would have answered correctly in each data collection round if he or she had been administered all of the questions for that domain that were included in the kindergarten, first-grade, second-grade, third-grade, and fourth-grade assessments (that is, all of the 155 unique questions in the router and the three second-stage reading forms administered in kindergarten, first grade, second grade, third grade, and fourth grade; all of the 146 unique questions in the router and the three second-stage mathematics forms
3-7
administered in kindergarten, first grade, second grade, third grade, and fourth grade; and all of the 100 unique items administered in the router and three second-stage science forms in first grade, second grade, third grade, fourth grade and in the single-stage kindergarten science form).
To calculate the IRT-based overall scale score for each domain, a child’s theta is used to predict a probability for each assessment item that the child would have gotten that item correct. Then, the probabilities for all the items fielded as part of the domain in every round are summed to create the overall scale score. Because the computed scale scores are sums of probabilities, the scores are not integers.
Gain scores in each domain may be obtained by subtracting the IRT scale scores at an earlier round from the IRT scale scores at a later round. For example, subtracting the fall kindergarten mathematics score from the spring kindergarten mathematics score would result in a score indicating gain across the kindergarten year. Similarly, a gain score from kindergarten entry to the end of fourth grade would be obtained by subtracting the fall kindergarten mathematics score from the spring fourth-grade mathematics score. Users should note that the scale scores are only comparable across rounds within a single data file. In other words, the scale scores for a given domain in the K–4 data file are all comparable to one other, but they are not comparable to the scale scores for that domain reported in the previously released files. Although the thetas remain the same for a given domain across rounds, the scale scores are recomputed for each file because the scale scores represent the estimated number correct for all items across all assessments administered; the total number of items in the pool expanded each year as more difficult items were added to the assessments.
Scores for different subject areas are not comparable to each other because they are based on different numbers of questions and content that is not necessarily equivalent in difficulty. For example, if a child’s IRT scale score in reading is higher than in mathematics, it would not be appropriate to interpret that to mean the child performs better in reading than in mathematics.

3-8
Table 3-3 provides the names of the variables pertaining to the IRT scale scores available in the data file, along with the variable descriptions, value ranges, weighted means, and standard deviations.
Table 3-3. Direct cognitive assessment: IRT scale scores, fall and spring kindergarten, fall and spring first-grade, fall and spring second-grade, spring third-grade, and spring fourth-grade assessments: School years 2010–11, 2011–12, 2012–13, spring 2014, and spring 2015
Variable Description n
Range of possible
values Weighted
mean Standard deviation
X1RSCALK4 X1 READING IRT SCALE SCORE-K4 15,669 0.0–155.0 52.27 11.205 X2RSCALK4 X2 READING IRT SCALE SCORE-K4 17,186 0.0–155.0 66.48 13.599 X3RSCALK4 X3 READING IRT SCALE SCORE-K4 5,194 0.0–155.0 74.84 16.718 X4RSCALK4 X4 READING IRT SCALE SCORE-K4 15,115 0.0–155.0 91.60 17.795 X5RSCALK4 X5 READING IRT SCALE SCORE-K4 4,725 0.0–155.0 97.24 16.198 X6RSCALK4 X6 READING IRT SCALE SCORE-K4 13,837 0.0–155.0 106.14 15.322 X7RSCALK4 X7 READING IRT SCALE SCORE-K4 12,866 0.0–155.0 115.65 14.698 X8RSCALK4 X8 READING IRT SCALE SCORE-K4 12,074 0.0–155.0 122.17 12.984 X1MSCALK4 X1 MATH IRT SCALE SCORE-K4 15,595 0.0–146.0 34.14 11.507 X2MSCALK4 X2 MATH IRT SCALE SCORE-K4 17,143 0.0–146.0 48.08 12.727 X3MSCALK4 X3 MATH IRT SCALE SCORE-K4 5,222 0.0–146.0 57.18 15.867 X4MSCALK4 X4 MATH IRT SCALE SCORE-K4 15,103 0.0–146.0 72.13 17.319 X5MSCALK4 X5 MATH IRT SCALE SCORE-K4 4,729 0.0–146.0 77.71 16.766 X6MSCALK4 X6 MATH IRT SCALE SCORE-K4 13,830 0.0–146.0 89.13 16.564 X7MSCALK4 X7 MATH IRT SCALE SCORE-K4 12,866 0.0–146.0 101.47 15.662 X8MSCALK4 X8 MATH IRT SCALE SCORE-K4 12,080 0.0–146.0 109.01 15.325 X2SSCALK4 X2 SCIENCE IRT SCALE SCORE-K4 16,936 0.0–96.0 33.55 7.466 X3SSCALK4 X3 SCIENCE IRT SCALE SCORE-K4 5,180 0.0–96.0 37.70 9.421 X4SSCALK4 X4 SCIENCE IRT SCALE SCORE-K4 15,072 0.0–96.0 42.76 10.899 X5SSCALK4 X5 SCIENCE IRT SCALE SCORE-K4 4,724 0.0–96.0 46.23 10.621 X6SSCALK4 X6 SCIENCE IRT SCALE SCORE-K4 13,819 0.0–96.0 51.64 11.134 X7SSCALK4 X7 SCIENCE IRT SCALE SCORE-K4 12,856 0.0–96.0 59.59 10.896 X8SSCALK4 X8 SCIENCE IRT SCALE SCORE-K4 12,069 0.0–96.0 65.66 11.575 NOTE: Fall kindergarten estimates (X1) and spring kindergarten estimates (X2) are weighted by W1C0. Fall first-grade estimates (X3) are weighted by W3CF3P_30, and spring first-grade estimates (X4) are weighted by W4CS4P_20. Fall second-grade estimates (X5) are weighted by W6CF6P_2A0, and spring second-grade estimates (X6) are weighted by W6CS6P_20. Spring third-grade estimates (X7) are weighted by W7C7P_20. Spring fourth-grade estimates (X8) are weighted by W8C8P_20. The unweighted sample n indicates the number of cases with valid data regardless of the presence of a valid analytic weight. SOURCE: U.S. Department of Education, National Center for Education Statistics, Early Childhood Longitudinal Study, Kindergarten Class of 2010–11 (ECLS-K:2011), fall 2010, spring 2011, fall 2011, spring 2012, fall 2012, spring 2013, spring 2014, and spring 2015.
3.1.2 Variables Indicating Exclusion from the Direct Assessment Due to Disability
The variables X1EXDIS, X2EXDIS, X3EXDIS, X4EXDIS, X5EXDIS, X6EXDIS, X7EXDIS, and X8EXDIS can be used to identify children who were excluded from the assessment because they needed an accommodation the study did not provide or because they had an Individualized Education Program (IEP) that indicated they could not take part in standardized assessments. These variables are

3-9
coded 1, Excluded from assessment due to disability, for children who were excluded from the assessment for these reasons. All other children are coded 0 for variables X1EXDIS, X2EXDIS, X4EXDIS, X6EXDIS, X7EXDIS, and X8EXDIS. For the variables pertaining to the fall first-grade and fall second-grade data collections (X3EXDIS and X5EXDIS), children who were part of the subsample in those rounds and not excluded from the assessments are coded 0 and children who were not part of the subsample (and, therefore, not eligible for the assessments in these rounds) are coded as system missing.4
3.1.3 Choosing the Appropriate Score for Analysis
When choosing scores to use in analysis, researchers should consider the nature of their research questions, the type of statistical analysis to be conducted, the population of interest, and the audience. The sections below discuss the general suitability of the different types of scores for different analyses.
The IRT-based theta scores are overall measures of ability. They are appropriate for both cross-sectional and longitudinal analyses. They are useful in examining differences in overall achievement among subgroups of children in a given data collection round or across rounds, as well as in analysis of correlations between achievement and child, family, and school characteristics. The fall kindergarten, spring kindergarten, fall first-grade, spring first-grade, fall second-grade, spring second-grade, spring third-grade, and spring fourth-grade theta scores included in the K-4 data file are on the same metric. Therefore, an analyst looking at growth across the kindergarten year could subtract the fall kindergarten score from the spring kindergarten score to compute a gain score. Or when looking at growth from kindergarten entry to the end of fourth grade, an analyst could subtract the fall kindergarten score from the spring fourth-grade score to compute a gain score.
The theta scores may be more desirable than the scale scores for use in a multivariate analysis because their distribution generally tends to be more normal than the distribution of the scale scores. It is recommended that analysts review the distributions for normality. In assessments where the number of items or number of observations is low, the normality of the distribution may be affected. In the ECLS-K:2011, the kindergarten science and kindergarten and first-grade SERS distributions deviated from normal, due to the limited number of items and observations, respectively. Additionally, in the extreme tails of the theta distributions in each domain, a combination of some extremely low-performing and some extremely high-performing children who took the assessment and the instrument itself may result in clustered estimates. By design, in order to limit the length of the assessment and the number of too easy or too difficult items any one child would be administered, the assessment did not have many items administered at the difficulty ranges in the tails. Including more items appropriate for children at the ability extremes would have required a reduction in the number of items
4 The “system missing” code appears as a blank when viewing codebook frequencies and in the ASCII data file. System missing codes (blanks) indicate that data for an entire instrument or assessment are missing due to unit nonresponse.

3-10
at the range of ability of nearly all the sampled children (> 99 percent). Thus, some clustering of thetas may be observed in the extreme tails of the theta distributions.
For a broader audience of readers unfamiliar with IRT modeling techniques, the metric of the theta scores (from -8 to 8) may be less readily interpretable than the metric of the scale scores. Researchers should consider their analysis and the audience for their research when selecting between the theta and the scale score.
The IRT-based scale scores also are overall measures of achievement. They are appropriate for both cross-sectional and longitudinal analyses. They are useful in examining differences in overall achievement among subgroups of children in a given data collection round or in different rounds, as well as in analysis looking at correlations between achievement and child, family, and school characteristics. The fall kindergarten, spring kindergarten, fall first-grade, spring first-grade, fall second-grade, spring second-grade, spring third-grade, and spring fourth-grade scale scores included in the K-4 data file are on the same metric. Therefore, an analyst looking at growth across the kindergarten year could subtract the fall kindergarten score from the spring kindergarten score to compute a gain score. Or when looking at growth from kindergarten entry to the end of fourth grade, an analyst could subtract the fall kindergarten score from the spring fourth-grade score to compute a gain score. Results expressed in terms of scale score points, scale score gains, or an average scale score may be more easily interpretable by a wider audience than results based on the theta scores.
3.1.4 Analytic Considerations for Measuring Gains in the ECLS-K:2011
An important issue to be considered when analyzing achievement scores and gains is assessment timing: children’s age at assessment, the date of assessment, and the time interval between assessments. Most sampled children were born throughout the second half of 2004 and first half of 2005, but their birth dates were not related to testing dates. As a result, children were tested at different developmental and chronological ages. Assessment dates ranged from August to December for the fall data collections, and from March to June for the spring data collections. Children assessed later in a data collection period in a particular grade level, for example in December during a fall collection, may be expected to have an advantage over children assessed earlier in the data collection period, for example in the first days or weeks of school, because they had more exposure to educational content before being assessed. Substantial differences in the intervals between assessments may also affect analysis of gain scores. Children assessed in September for the fall data collection and June for the spring data collection had more time to learn knowledge skills than did children assessed first in November and then again in March. These differences in interval may or may not have a significant impact on analysis results. In designing an analysis plan, it is important to consider whether and how differences in age, assessment date, and interval may affect the results; to look at relationships between these factors and other variables of interest; and to adjust for differences, if necessary.

3-11
When using the IRT scale scores as longitudinal measures of overall growth, analysts should keep in mind that gains made at different points on the scale have qualitatively different interpretations. Children who made gains toward the lower end of the scale, for example, in skills such as identifying letters and associating letters with sounds, were learning different skills than children who made gains at the higher end of the scale, for example, those who had gone from reading sentences to reading passages, although their gains in number of scale score points might be the same. Comparison of gains in scale score points is most meaningful for groups that started with similar initial status. One way to account for children’s initial status is to include a prior round assessment score as a control variable in an analytic model. For example, the fall kindergarten scale score could be included in a model using the spring kindergarten scale score as the outcome.
3.1.5 Reliability of the ECLS-K:2011 Scores
Reliability statistics assess consistency of measurement, or the extent to which test items in a set are related to each other and to the score scale as a whole. For tests of equal length, reliability estimates can be expected to be higher for sets of items that are closely related to the underlying construct than for tests with more diversity of content. Conversely, for tests with similar levels of diversity in content, reliabilities tend to be higher for longer tests compared to shorter tests. Reliabilities range from 0 to 1.
Table 3-4 presents the reliability statistics computed for the IRT-based scores for each subject area for the fall and spring of kindergarten, the fall and spring of first grade, the fall and spring of second grade, the spring of third grade, and the spring of fourth grade. The reliability of the overall ability estimate, theta, is based on the variance of repeated estimates of theta for each individual child compared with total sample variance. The reliabilities calculated for theta also apply to the scores derived from the theta estimate, namely, the IRT scale scores. The reliabilities are relatively high, ranging from .75 to .95. Science, the domain with the most diverse content and the smallest number of items, has lower reliability coefficients than reading and mathematics.5 The reading reliability has decreased in third and fourth grades relative to the earlier rounds of data collection, a result of the reduction in the number of items administered.6
5 Diversity in the science assessments was by design. To develop measures of children’s expected ability levels in science required assessing an assortment of items in several content strands: scientific inquiry, Earth science, physical science, and life science. Although the reading and mathematics domains also included differing content strands, the content strands in science were not as highly correlated as those in reading and mathematics. 6 In the earlier rounds of the reading assessment, it was possible to administer relatively more items, as the items were of relatively easy difficulty and/or took less time to administer (e.g., items on letter recognition). As time progressed, more complex items were administered, most associated with reading passages, that were more time consuming and thus the number of items administered decreased.

3-12
Table 3-4. Reliability of IRT-based scores (theta and scale scores), by round of data collection and domain, for fall and spring kindergarten, fall and spring first grade, fall and spring second grade, spring third grade, and spring fourth grade: School years 2010–11, 2011–12, 2012–13, spring 2014, and spring 2015
Domain
Number of
items Fall
kindergarten Spring
kindergarten
Fall first
grade
Spring first
grade
Fall second
grade
Spring second
grade
Spring third
grade
Spring fourth grade
Reading 155 .95 .95 .95 .93 .93 .91 .87 .88 Mathematics 146 .92 .94 .93 .93 .92 .94 .92 .92 Science 100 † .75 .83 .83 .83 .83 .83 .83 † Not applicable: field test findings indicated that science knowledge and skills could not be validly and reliably assessed in the fall of kindergarten using the items that were field tested and, therefore, were assessed beginning in spring kindergarten. SOURCE: U.S. Department of Education, National Center for Education Statistics, Early Childhood Longitudinal Study, Kindergarten Class of 2010–11 (ECLS-K:2011), fall 2010, spring 2011, fall 2011, spring 2012, fall 2012, spring 2013, spring 2014, and spring 2015.
3.1.6 Validity of the ECLS-K:2011 Scores
Evidence for the validity of the direct cognitive assessments was derived from several sources. A review of national and state performance standards, comparison with state and commercial assessments, and the judgments of curriculum experts all informed the development of the test specifications.
The content category specifications for the ECLS-K:2011 reading assessments in kindergarten through second grade are based on the 2009 Reading Frameworks for NAEP (National Assessment Governing Board 2008), with the addition of basic reading skills and vocabulary categories suited for the earlier grades. Although the NAEP framework was selected for its rigorous design and its use in many years of national administrations by NCES, because the NAEP assessments are administered starting in fourth grade, it was necessary to consult other sources to extend the NAEP content percentage specifications down to earlier grades. Experts in reading assessment development consulted the ECLS-K kindergarten, first-grade, and third-grade reading assessment frameworks; current curriculum standards from Texas, California, New Jersey, Florida, and Virginia; and the Common Core State Standards.7 The ECLS-K:2011 reading specifications for third grade and fourth grade were built upon those developed for the earlier grades and supplemented by the fourth- and eighth-grade NAEP Reading Frameworks for 2011 (National Assessment Governing Board 2010), as well as the third-grade and fourth-grade standards from the same five states noted.
7 See http://www.corestandards.org for further information. An effort led by state governors and state commissioners of education to develop the Common Core State Standards for kindergarten through grade 12 was begun in 2009, through the National Governors Association Center for Best Practices and the Council of Chief State School Officers.

3-13
The ECLS-K:2011 mathematics test specifications for kindergarten through second grade are based on the frameworks developed for the ECLS-K assessments, which were based on the NAEP mathematics frameworks and extended down to earlier grades. The content of the mathematics framework is consistent with recommendations presented in the Mathematics Framework for the 2005 NAEP (National Assessment Governing Board 2004a), the National Council of Teachers of Mathematics Principles and Standards for School Mathematics (2000), and with state standards of California, New Jersey, Tennessee, Texas, and Virginia. These are also consistent with general findings from the National Mathematics Advisory Panel (2008). For third grade and fourth grade, the content covered in the ECLS-K:2011 mathematics assessment was determined by comparing the state or national standards from Texas, Virginia, NAEP, and the National Council of Teachers of Mathematics (NCTM). Common Core State Standards were not used in the comparison since these standards are similar to the national standards set by NCTM and NAEP. As in reading, the framework in the later grades builds on the framework developed for the earlier grades, using the same sources.
The science knowledge and skills assessed in the ECLS-K:2011 were chosen based on the areas identified as being important to assess in the 1996–2005 and 2011 NAEP science frameworks (National Assessment Governing Board 2004b, 2010). However, because the NAEP science frameworks begin in fourth grade, the science standards of six states (Arizona, California, Florida, New Mexico, Texas, and Virginia) were analyzed to find common topics that are taught at the lower grade levels. In these states and for each grade level, three or four standards were drawn from each of four common content categories (scientific inquiry, life science, physical science, and Earth and space science) and these four areas were selected as the content categories for the ECLS-K:2011 science assessment framework.
Pools of potential assessment items were developed for each content domain based on the framework or standards pertinent to the domain. An expert panel of school educators, including curriculum specialists in the subject areas, then examined the pool of items for content and framework strand design, accuracy, nonambiguity of response options, and appropriate formatting. The items were included in a field test and better performing items were selected for the final assessment battery.
3.2 Direct Cognitive Assessment: Executive Function
Executive functions are interdependent processes that work together to regulate and orchestrate cognition, emotion, and behavior and that help a child to learn in the classroom. Three measures of executive function were administered in the fourth-grade direct child assessment battery, including one new measure, the Flanker task, and two measures administered in previous rounds, the Dimensional
3-14
Change Card Sort and a numbers reversed task. The Flanker task (Zelazo et al 2013), which measures inhibitory control in the context of selective visual attention, was administered for the first time in fourth grade. The Flanker complemented the two additional measures of executive function included in fourth grade, which were also included in the kindergarten, first-grade, second-grade, and third-grade assessments: the Dimensional Change Card Sort (DCCS) (Zelazo 2006; Zelazo et al. 2013), assessing children’s cognitive flexibility, and the Numbers Reversed subtest of the Woodcock-Johnson III (WJ III) Tests of Cognitive Abilities (Woodcock, McGrew, and Mather 2001), assessing working memory. The same versions of the DCCS and the Numbers Reversed tasks were administered in fall and spring of the kindergarten year and fall and spring of first grade. In second grade, the DCCS was changed to computerized administration to remain age-appropriate through fifth grade. The same computerized version was used again in third grade and in fourth grade. The Numbers Reversed task remained the same across all rounds of collection, kindergarten through fourth grade.
3.2.1 Dimensional Change Card Sort
The Dimensional Change Card Sort (DCCS) (Zelazo 2006; Zelazo et al. 2013) is used to collect information on children’s cognitive flexibility.
In the kindergarten and first-grade data collections, the DCCS was administered as a physical, table-top card sort with the items administered by a trained assessor. Beginning with the second-grade data collections, a computerized version of the DCCS developed for the National Institutes of Health Toolbox for the Assessment of Neurological and Behavioral Function (NIH Toolbox) was administered. The shift to a computerized version of the task was made so that the DCCS would remain age-appropriate through the end of data collection for ECLS-K:2011. For more information on the physical, table-top card sort task administered in kindergarten and first grade and differences between the physical version and computerized version, see chapter 3 of the User’s Manual for the Kindergarten–Second Grade Data File and Electronic Codebook, Public Version (NCES 2017-285) (Tourangeau et al. 2017). This section describes the computerized version of the DCCS that was administered in the spring of fourth grade, which is the same version administered in the second- and third-grade rounds.
The computerized task was developed as part of the National Institutes of Health Toolbox for the Assessment of Neurological and Behavioral Function (see http://www.nihtoolbox.org) and is appropriate for ages 3–85 (Zelazo et al. 2013). The task had been under development during the planning phases for the earliest rounds of the ECLS-K:2011 and became available in time to be incorporated into the second-grade data collections. The NIH Toolbox Dimensional Change Card Sort Test (NIH Toolbox
3-15
DCCS) is a task that is used across the 3 through 85 age range, but it has two different start points based on the age of the child in order to limit administration time. The NIH Toolbox DCCS consists of 40 trials, including 5 pre-switch trials (where children are asked to sort by one dimension, e.g., color), 5 post-switch trials (where children are asked to sort by a different dimension, e.g., shape), and 30 mixed-block trials (in which the sorting dimension, either color or shape, varies by trial). Testing conducted in the development of the NIH Toolbox DCCS indicated that 8-year-olds typically scored at ceiling on the pre-switch and post-switch trials. Consequently, children under age 8 begin with the pre-switch trials, and children age 8 and above begin with the mixed-block trials and are given credit in the scoring for completing the pre-switch and post-switch trials accurately.
For the ECLS-K:2011 administrations of the computerized DCCS, all ECLS-K:2011 children were administered the version of the NIH Toolbox DCCS for ages 8 years and older, regardless of their age at the time of assessment. In second grade, approximately 90 percent of the ECLS-K:2011 children in the fall subsample for second grade and approximately 40 percent of children in the spring of second grade who had a score on the DCCS were not yet 8 years old when the DCCS was administered. In third grade, nearly all children who participated in the DCCS (99.95 percent) were at least 8 years old when the DCCS was administered. In fourth grade, all children who participated in the DCCS were at least 8 years old when the DCCS was administered. The decision to administer the same version of the DCCS from second grade forward, regardless of whether the child was age 8, was made so that all study children would receive the same version of the DCCS task in second grade and in later rounds of data collection. Use of the same measure allows for a longitudinal analysis of performance on the DCCS from second grade into later rounds of data collection.
As noted earlier, the construct assessed in the physical version of the DCCS that was administered in kindergarten and first grades and the computerized version of the DCCS is the same—cognitive flexibility. However, the way the construct is assessed and the scoring differ across the versions. One key difference between the two versions is that the computerized version captures data on the amount of time in milliseconds that it takes the child to complete any given item; it is not possible to accurately measure reaction time at the necessary level of precision in the physical version. Therefore, the computerized version supports the use of both accuracy of sorting and reaction time to assess overall performance while the physical card sort assesses performance by accuracy alone.
In each of the 30 mixed-block trials administered via computer to children in the ECLS-K:2011 beginning in the second-grade rounds, the children were presented with a stimulus picture of a ball or truck that was either yellow or blue. A prerecorded female voice announced the sorting rule to be used for that trial (“color” or “shape”) as the appropriate word “color” or “shape” was briefly displayed in the

3-16
center of screen. Next, the stimulus picture was displayed in the center of screen, where the word had just appeared. Children then selected one of two pictures at the bottom of the screen (a blue ball on the left or a yellow truck on the right) that was either the same shape or the same color as the stimulus picture, depending on whether the shape or color sorting rule was in effect for the trial. Children indicated their choice of picture by pressing the arrow key on the laptop keyboard that was associated with the picture; the left arrow key was used to select the picture on the left side of the screen and the right arrow key was used to select the picture on the right side of the screen. Children were instructed to use just one pointer finger to press the arrow keys. They were asked to return their pointer finger to the button in between the left and right arrow keys (marked with a fuzzy sticker, and so identified as the “fuzzy button”) in between trials to standardize the start location for every child’s finger, with the goal of maximizing accuracy in the measurement of response time. Both reaction time to sort the card and accuracy of its placement according to the sorting rule in effect for the trial were recorded by the computer program.
The sorting rules (i.e., to either sort by shape or color) were intermixed across the trials, and one rule was more common than the other. The shape rule was used for 23 trials while the color rule was used in 7 trials. For example, the child might be asked to sort by shape for 4 trials in a row, then to sort by color on trial 5, and then to sort by shape on trials 6 and 7. One sorting rule was presented more frequently in order to build a response tendency (i.e., a response that is “preferred” because it happens more frequently, resulting in a predisposition to respond in that manner). A predisposition to sort by the dominant rule (i.e., shape) can result in either more errors or a slower reaction or response time on nondominant trials because it is necessary to inhibit the dominant response (i.e., sorting by shape) in order to shift to the less frequent sorting rule (i.e., color). The “cost” associated with the shift from a more frequent rule (the “dominant” rule) to a less frequent rule (the “nondominant” rule) tends to differ by the age of the participant (Davidson et al. 2006). The “cost” to younger children is that they tend to make more errors on the nondominant rule trials; that is, they do not demonstrate the cognitive flexibility to make the switch between rules even when prompted. Younger children do not tend to slow themselves down in favor of higher accuracy and, therefore, accuracy is a better metric of performance for young children (Zelazo et al. 2013). In contrast, older children and adults tend to demonstrate a speed/accuracy tradeoff; they slow down the pace at which they respond in order to maintain accuracy. Thus, the “cost” to older children and adults is seen in reaction time on the nondominant rule trials. The formula used to produce scores from the data collected by the computerized DCCS factors in reaction time on the infrequent or nondominant trials when a child demonstrates sufficiently accurate performance across all the test trials, defined as being accurate on more than 80 percent of the trials (Zelazo et al. 2013). Thus, the computerized DCCS provides a measure of performance through this developmental shift to learning to trade speed for accuracy. More information on scoring is provided below.

3-17
The 30 test trials were administered only to children who successfully completed the practice portion of the DCCS. The practice consisted of a minimum of 8 trials and a maximum of 24 trials, depending upon how quickly the child demonstrated that he or she understood the task. For the first set of practice trials, the assessor instructed the child how to sort by shape using text automatically presented on the DCCS screen that was read by the assessor along with additional standardized instructions presented by the assessor. Following the instructions, the computer administered four practice trials asking the child to sort by shape. If the child sorted at least three of the four items correctly by shape, he or she progressed to the color practice. If the child sorted more than one item in the set of four incorrectly, he or she was presented with a second set of four practice items. If the child failed to sort three of four items correctly by shape in the second set of practice items, he or she was presented a third set; failure of this third set ended the DCCS program before any actual scored trials were presented.
Once a child passed the shape practice trials, the assessor instructed on how to sort by color, and the computer presented 4 to 12 practice trials asking to sort by color. Like the shape practice trials, up to three sets of four items could be presented before the DCCS advanced to the scored trials. If the child was not able to pass the color practice, the DCCS program ended after the third set of color practice items, again before any actual scored trials were presented.
In contrast with the scored trials, the practice trials maintained one sorting rule for all items presented in succession until practice for the rule was complete. An additional difference between the practice and scored trials was that the stimulus pictures in the practice trials were white or brown rabbits and boats.
Item-level data for the 30 test trials are included in the data file. They are provided in three blocks of 30 items for each participant that indicate: (1) correct versus incorrect responses (C*DCCS1-C*DCCS30); (2) the type of trial, reported as dominant (most frequently presented but not included in reaction time scores; shape is the dominant sorting rule) or nondominant (less frequently presented and used to calculate reaction time scores; color is the non-dominant sorting rule) (C*GAME1-C*GAME30); and (3) reaction times reported in milliseconds (C*TARGRT1-C*TARGRT30). Variable names for the item-level data begin with “C8” for spring fourth grade.
As in second and third grades, the overall computed score reported for the fourth-grade DCCS is derived using a formula provided by the task developer and follows the scoring algorithm used for this task in the NIH Toolbox (see the NIH Toolbox Scoring and Interpretation Guide, [Slotkin, Nowinski et al. 2012], for additional information on scoring). Scores range from 0 to 10, with weight given to accuracy (0 to 5 units) and reaction time (0 to 5 units) in the computation of the scores. Accuracy is considered first. If

3-18
the child’s accuracy rate is less than or equal to 80 percent, the child’s overall computed score is based entirely on accuracy. If the child’s accuracy rate is more than 80 percent, the child’s overall computed score is based on a combination of accuracy and reaction time.
The accuracy score factored into the computation of the overall score can range from 0 to 5. There are a total of 40 accuracy points that are scaled down to a maximum score of 5: for each correct response, the child earns a score of .125 (5 points divided by 40 trials). Because all children used the start point of the DCCS for children 8 years and older, each child was administered the 30 mixed-block trials, and each child who successfully passed the practice items was automatically given 10 accuracy points for the 5 pre-switch and the 5 post-switch trials of the DCCS that were not administered. Therefore, the accuracy component of the overall computed DCCS score is calculated as follows:
DCCS accuracy score = 0.125 * number of correct responses8
If the child’s accuracy rate is higher than 80 percent, a reaction time score is added to the child’s accuracy score.9 Like the accuracy score, the reaction time score ranges from 0 to 5 points.
The reaction time component of the overall computed score for the computerized DCCS is computed using the child’s median reaction time to correct nondominant trials (i.e., the trials with the less frequently used sorting rule, color), following the same scoring algorithm outlined in the scoring manual for the NIH Toolbox (Slotkin, Nowinski et al. 2012). First, for those children with greater than 80 percent accuracy on the 40 trials, the median reaction time is calculated based on reaction times for correct nondominant trials with reaction times greater than or equal to 100 milliseconds (msec) and within plus or minus three standard deviations from the child’s mean reaction time on the correct nondominant trials. The minimum median reaction time allowed is 500 msec; the maximum median reaction time is 3,000 msec. If the child’s median reaction time falls outside this range, the child’s median reaction is set to the minimum or maximum allowable range: reaction times between 100 msec and 500 msec were set to 500 msec and reaction times between 3,000 msec and 10,000 msec (the maximum trial duration) are set to 3,000 msec. A
8 The number of correct responses = 10 + the number of correct trials out of the 30 mixed block trials. Once the child has passed the practice trials and advanced into the scored portion of the assessment, 10 accuracy points are automatically awarded due to the chosen start point for the task. For this reason, it is not possible for ECLS-K:2011 children to get an accuracy score of 0. Therefore, the minimum possible value for the DCCS accuracy score is 1.25 and the maximum possible DCCS accuracy score is 5. 9 The criterion of greater than 80 percent accuracy is calculated based on all 40 trials (30 administered trials plus the 10 trials not administered). That is, 80 percent of 40 trials is 32 items. However, this can also be thought of in terms of how many items out of the 30 administered trials are required. If the criterion is 80 percent of the 40 trials, this translates to 23 of the 30 administered trials. For example, if a child responds accurately on 23 of the 30 mixed block trials, the child’s accuracy rate equals 82.5 percent (10 points automatically awarded for the pre-switch and post-switch trials plus the 23 correct mixed block trials divided by 40; 33/40 = .825). In this example, the child’s accuracy score would be [(10 + 23) * .125] = 4.125. Because the accuracy rate is greater than 80 percent, the child’s reaction time score would be added to this accuracy score to obtain the overall computed score for the DCCS. Alternatively, if the child responded accurately on 22 of the 30 mixed-block trials, the child’s accuracy rate would equal 80 percent and, therefore, the child’s accuracy is not greater than 80 percent and the child’s overall score would be based solely on accuracy (overall computed score = [(10 + 22) * .125] = 4).

3-19
log (base 10) transformation is applied to the median reaction times to create a more normal distribution. The log values are then algebraically rescaled to a 0 to 5 range and then reversed such that faster (better) reaction times have higher values and slower reaction times have lower values. The formula for rescaling the median reaction times is the following:
Reaction time score = 5 − (5 ∗ [log𝑅𝑇 − log (500)
log(3000) - log (500)])
where RT is the median reaction time on nondominant trials within set outer limits.10
To summarize, the overall computed score on the computerized DCCS is equal to the child’s accuracy score if the child’s accuracy rate is less than or equal to 80 percent. If the child’s accuracy rate is greater than 80 percent, the child’s overall computed score is equal to the child’s accuracy score plus the child’s reaction time score, which is derived from the child’s reaction time on correct nondominant trials as described above. Additional details on the calculation of the computed score are available in the NIH Toolbox Scoring and Interpretation Guide (Slotkin, Nowinski, et al. 2012) and the NIH Toolbox Technical Manual (Slotkin, Kallen, et al. 2012).
The fall and spring second-grade, spring third-grade, and spring fourth-grade computed scores (X5DCCSSCR, X6DCCSSCR, X7DCCSSCR, and X8DCCSSCR) range from 0 to 10, with weight given to accuracy (0 to 5 units) and reaction time (0 to 5 units) in the computation of the score. The overall computed score for the computerized DCCS can be used to examine change across rounds that use the computerized DCCS (i.e., performance in the fall of second grade can be directly compared to performance in the spring of second grade, the spring of third grade, and the spring of fourth grade).
It is important for researchers using the DCCS data to be aware of the characteristics of the overall DCCS scores and determine how best to use these scores in their analyses. As noted above, the NIH-developed scoring model computes scores differently depending on sorting accuracy. The use of this scoring model with the data collected from children in the ECLS-K:2011 resulted in a non-normal distribution. For example, approximately 4 percent of children in the third-grade data collection who have a computed overall score failed to achieve greater than 80 percent accuracy. In fourth grade, this percentage was 2 percent. The score for these children is calculated based solely on accuracy. The remaining children
10 The median reaction time (RT) used to calculate the reaction time score falls within the range of 500 msec through 3,000 msec. Calculation of the median score requires a minimum of at least one correct nondominant trial reaction time that is greater than 100 msec. When the child reached the accuracy threshold for including the reaction time component in the scoring but did not have any within-range reaction times on correct nondominant trials, the child’s overall computed score on the DCCS was set equal to the child’s accuracy score, and reaction time was not factored into the child’s score.
3-20
(96 percent in third grade and 98 percent in fourth grade) who have a computed overall score have scores calculated based on both accuracy and reaction time.
The non-normal distribution may be problematic for statistical analyses. For this reason, users may want to run analyses that do not use the overall score as is with the full sample. For example, users could conduct their analyses separately for the two groups of children so that each analysis only includes children with scores calculated in the same way, or they may decide to limit their analyses to only one group. Another option is for users to analyze all children using the score indicating accuracy alone, recognizing that this score is highly skewed, as most children were able to sort the cards with at least 80 percent accuracy. Users may also want to consider investigating alternative scoring models using the item-level accuracy and reaction time data available on the data file. The decision about how best to use the DCCS overall score in analysis is left to the user, given the research questions being addressed. Analysts may choose to examine other ways researchers have analyzed data with similar distributions, or other executive function or card sort data, in deciding how best to utilize the ECLS-K:2011 DCCS data.
The variable names, descriptions, value ranges, weighted means, and standard deviations for the second-, third-, and fourth-grade DCCS scores are provided in table 3-5. For information on the kindergarten and first-grade scores, see the User’s Manual for the ECLS-K:2011 Kindergarten–Second Grade Data File and Electronic Codebook, Public Version (NCES 2017-285) (Tourangeau et al. 2017). The following scores based on the fourth-grade computerized administration are presented on the data file: overall score for spring fourth grade (X8DCCSSCR; range: 0-10); accuracy score for spring fourth grade (X8CSACC; range: 0-5) that is scaled as described above to compute the overall DCCS score; reaction time score for spring fourth grade (X8CSNDRT; range: 0-5) that is scaled to compute the overall DCCS score; count of correct, dominant trials (X8CSDAC; range: 0-23); and count of correct nondominant trials (X8CSNDAC; range: 0-7). Researchers should note that the count of correct dominant trials and the count of correct nondominant trials represent accuracy by trial type for the 30 administered trials and are different from the total accuracy score (X8CSACC, DCCS Accuracy Component [0-5] Score) that is derived to compute the overall DCCS computed score. Researchers should also note that the reaction time score was only computed for cases for which the accuracy score was greater than 80 percent. If the accuracy score was not greater than 80 percent, then the reaction time score was set to -9 (not ascertained).

3-21
Table 3-5. Dimensional Change Card Sort variable names, descriptions, value ranges, weighted means, and standard deviations for fall and spring second grade, spring third grade, and spring fourth grade: School year 2012–13, spring 2014, and spring 2015
Variable name Description n
Range of possible values1
Weighted mean
Standard deviation
X5DCCSSCR X5 Computed (Overall) Score 4,708 0-10 6.37 1.402 X6DCCSSCR X6 Computed (Overall) Score 13,774 0-10 6.69 1.345 X7DCCSSCR X7 Computed (Overall) Score 12,744 0-10 7.19 1.098 X8DCCSSCR X8 Computed (Overall) Score 12,021 0-10 7.63 0.965 X5CSACC X5 DCCS Accuracy Component (0-5) Score 4,708 0-5 4.53 0.589 X6CSACC X6 DCCS Accuracy Component (0-5) Score 13,774 0-5 4.59 0.504 X7CSACC X7 DCCS Accuracy Component (0-5) Score 12,744 0-5 4.72 0.356 X8CSACC X8 DCCS Accuracy Component (0-5) Score 12,021 0-5 4.80 0.274 X5CSNDRT X5 DCCS Nondom RT Component (0-5) Score 4,067 0-5 2.09 0.758 X6CSNDRT X6 DCCS Nondom RT Component (0-5) Score 12,405 0-5 2.33 0.765 X7CSNDRT X7 DCCS Nondom RT Component (0-5) Score 12,222 0-5 2.58 0.777 X8CSNDRT X8 DCCS Nondom RT Component (0-5) Score 11,790 0-5 2.88 0.768 X5CSDAC X5 DCCS Dominant Trial Accuracy Count 4,708 0-23 20.19 4.468 X6CSDAC X6 DCCS Dominant Trial Accuracy Count 13,774 0-23 20.62 3.758 X7CSDAC X7 DCCS Dominant Trial Accuracy Count 12,744 0-23 21.53 2.535 X8CSDAC X8 DCCS Dominant Trial Accuracy Count 12,021 0-23 22.05 1.852 X5CSNDAC X5 DCCS Nondominant Trial Accuracy Count 4,708 0-7 6.08 1.128 X6CSNDAC X6 DCCS Nondominant Trial Accuracy Count 13,774 0-7 6.11 1.100 X7CSNDAC X7 DCCS Nondominant Trial Accuracy Count 12,744 0-7 6.21 1.011 X8CSNDAC X8 DCCS Nondominant Trial Accuracy Count 12,021 0-7 6.33 0.926 1 Because 10 accuracy points are automatically awarded due to the chosen start point for the task, it is not possible for ECLS-K:2011 children to obtain an accuracy score of 0. Therefore, the lowest accuracy component (0-5) score in the data file is 1.25, and the lowest computed (overall) score in the data file is also 1.25. NOTE: Fall second-grade estimates (X5) are weighted by W6CF6P_2A0, and spring second-grade estimates (X6) are weighted by W6CS6P_20. Spring third-grade estimates (X7) are weighted by W7C7P_20. Spring fourth-grade estimates (X8) are weighted by W8C8P_20. The unweighted sample n indicates the number of cases with valid data regardless of the presence of a valid analytic weight. SOURCE: U.S. Department of Education, National Center for Education Statistics, Early Childhood Longitudinal Study, Kindergarten Class of 2010–11 (ECLS-K:2011), fall 2012, spring 2013, spring 2014, and spring 2015.
3.2.1.1 Dimensional Change Card Sort Data Flags
Eight flags indicate the presence or absence of Dimensional Change Card Sort data. X1DCCSFLG and X2DCCSFLG indicate the presence of data for the fall and spring of kindergarten, respectively. X3DCCSFLG and X4DCCSFLG indicate the presence of first-grade data for the fall and spring, respectively; X5DCCSFLG and X6DCCSFLG indicate that data are present for the overall computed DCCS score (X5DCCSSCR/X6DCCSSCR) for the fall and spring of second grade, respectively; X7DCCSFLG indicates that data are present for the overall computed DCCS score (X7DCCSSCR) for the spring of third grade; and X8DCCSFLG indicates that data are present for the overall DCCS score (X8DCCSSCR) for the spring of fourth grade.
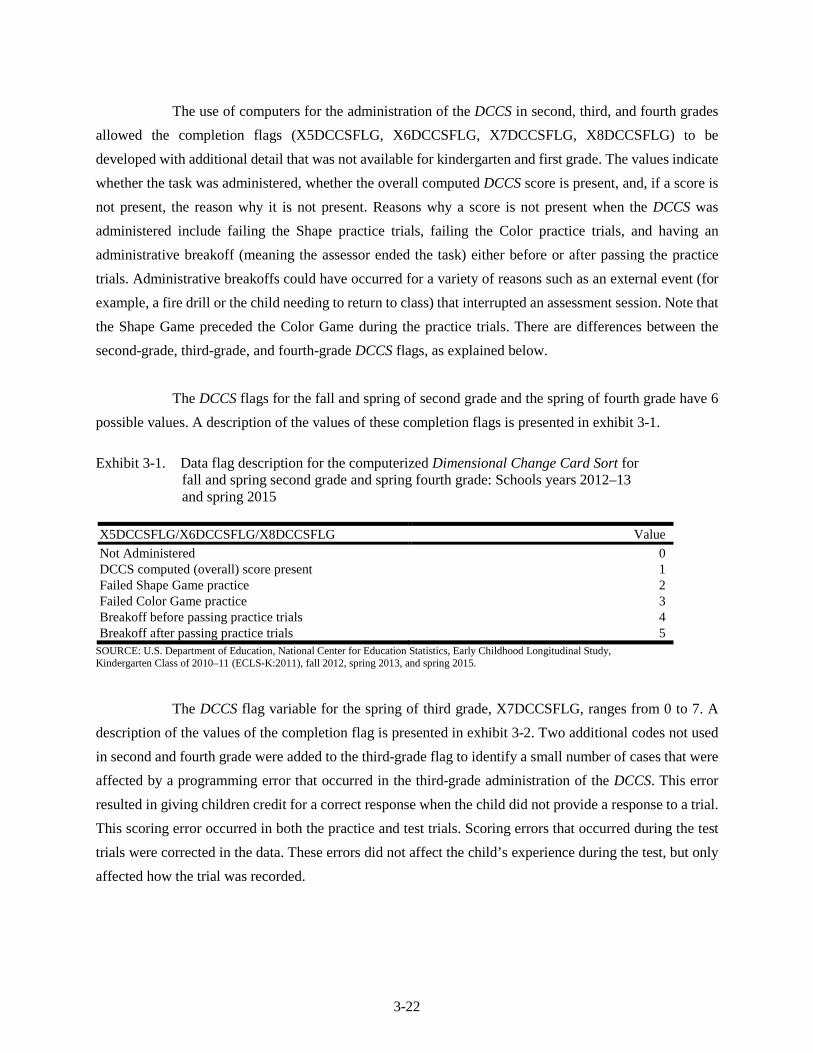
3-22
The use of computers for the administration of the DCCS in second, third, and fourth grades allowed the completion flags (X5DCCSFLG, X6DCCSFLG, X7DCCSFLG, X8DCCSFLG) to be developed with additional detail that was not available for kindergarten and first grade. The values indicate whether the task was administered, whether the overall computed DCCS score is present, and, if a score is not present, the reason why it is not present. Reasons why a score is not present when the DCCS was administered include failing the Shape practice trials, failing the Color practice trials, and having an administrative breakoff (meaning the assessor ended the task) either before or after passing the practice trials. Administrative breakoffs could have occurred for a variety of reasons such as an external event (for example, a fire drill or the child needing to return to class) that interrupted an assessment session. Note that the Shape Game preceded the Color Game during the practice trials. There are differences between the second-grade, third-grade, and fourth-grade DCCS flags, as explained below.
The DCCS flags for the fall and spring of second grade and the spring of fourth grade have 6
possible values. A description of the values of these completion flags is presented in exhibit 3-1.
Exhibit 3-1. Data flag description for the computerized Dimensional Change Card Sort for fall and spring second grade and spring fourth grade: Schools years 2012–13 and spring 2015
X5DCCSFLG/X6DCCSFLG/X8DCCSFLG Value Not Administered 0 DCCS computed (overall) score present 1 Failed Shape Game practice 2 Failed Color Game practice 3 Breakoff before passing practice trials 4 Breakoff after passing practice trials 5
SOURCE: U.S. Department of Education, National Center for Education Statistics, Early Childhood Longitudinal Study, Kindergarten Class of 2010–11 (ECLS-K:2011), fall 2012, spring 2013, and spring 2015.
The DCCS flag variable for the spring of third grade, X7DCCSFLG, ranges from 0 to 7. A
description of the values of the completion flag is presented in exhibit 3-2. Two additional codes not used in second and fourth grade were added to the third-grade flag to identify a small number of cases that were affected by a programming error that occurred in the third-grade administration of the DCCS. This error resulted in giving children credit for a correct response when the child did not provide a response to a trial. This scoring error occurred in both the practice and test trials. Scoring errors that occurred during the test trials were corrected in the data. These errors did not affect the child’s experience during the test, but only affected how the trial was recorded.

3-23
Exhibit 3-2. Data flag description for the computerized Dimensional Change Card Sort for spring third grade: Spring 2014
X7DCCSFLG Value Not Administered 0 DCCS computed (overall) score present 1 Failed Shape Game practice 2 Failed Color Game practice 3 Breakoff before passing practice trials 4 Breakoff after passing practice trials 5 Programming error but still passed practice, DCCS data present 6 Programming error, insufficient practice, DCCS data set to -4 7
SOURCE: U.S. Department of Education, National Center for Education Statistics, Early Childhood Longitudinal Study, Kindergarten Class of 2010–11 (ECLS-K:2011), spring 2014.
Errors that occurred during the third-grade practice trials, however, did affect the child’s experience during the test and, in some cases, resulted in insufficient opportunity for the child to demonstrate an understanding of the rules of the game. When a child did not respond to a trial in the practice, the program treated the nonresponse as a correct response and provided incorrect audio feedback to the child. The audio feedback that the child heard was “That’s right,” even though the child did not provide a response. If the child did not respond to a trial, the trial was supposed to be scored as incorrect, and the audio feedback was supposed to indicate that the child responded with an incorrect answer and reteach the rule. The erroneous feedback during the practice could have confused the child about the rules of the game. It is important for the child to demonstrate a clear understanding of the rules of the game in the practice trials before progressing to the test trials to ensure that performance is not a reflection of failing to understand the instructions. Under some circumstances, having nonresponse scored as correct affected what practice trials were administered.
Cases affected by the third-grade programming error were examined to determine whether they met the criteria for moving into the test trials based on the items for which they did provide a response (that is, whether they demonstrated sufficient understanding of the task despite receiving erroneous feedback). These cases, children who had at least one instance of nonresponse in the practice, are flagged as a 6 or 7 in the DCCS flag variable depending on whether they met the criteria. Cases that have X7DCCSFLG=6 passed the practice trials with the responses they provided during the administration of the DCCS. For example, a child may have had 3 correct responses and 1 nonresponse within the block of four practice trials and, thus, the criterion of responding correctly to at least 3 of 4 correct in order to proceed was still reached. As another example, the child could have had two nonresponse trials and two incorrect trials and failed the first practice set. In this case, the child would have been administered another practice block of four trials and could have passed on that set of practice trials. Cases that have the value of 6 on the DCCS flag are cases that successfully met the criteria for passing both the shape and color practice and

3-24
advanced to the test trial, despite receiving at least one instance of erroneous feedback. There are 189 cases that have X7DCCSFLG=6, and data for these cases are provided on the data file. Additional information on this error is provided in the appendix.
Cases that have X7DCCSFLG=7 did not demonstrate sufficient understanding of the task with the responses they provided and were not given sufficient practice per the administration protocols to have their scores included in the data file. These cases were not given the opportunity to meet the criterion for passing the practice because nonresponse was incorrectly recorded as a correct response. For example, children who had 2 correct trials, 1 incorrect trial and 1 nonresponse trial (incorrectly scored as “correct”) were incorrectly given credit for passing the practice, even though they only had 2 correct trials and did not meet the criterion of at least 3 of 4 correct to pass. In this example, if the program had performed correctly, the child would have been given additional training and additional opportunities to pass the practice. Because of the programming error, this did not happen and the child progressed to the test trials without truly meeting the criterion for successfully passing the practice. Because it was not possible to determine whether the children could have passed the practice if given the correct opportunities, the data were suppressed. There are 92 cases that have X7DCCSFLG=7. These cases have DCCS data set to -4 (suppressed due to insufficient practice).
3.2.2 Numbers Reversed
The Numbers Reversed measure assesses the child’s working memory. It is a backward digit span task that requires the child to repeat an orally presented sequence of numbers in the reverse order in which the numbers are presented. For example, if presented with the sequence “3…5,” the child would be expected to say “5…3.” Children are given up to 5 two-number sequences. If the child gets three consecutive two-number sequences incorrect, then the Numbers Reversed task ends. If the child does not get three consecutive two-number sequences incorrect, the child is then given up to 5 three-number sequences. The sequence becomes increasingly longer, up to a maximum of eight numbers, until the child gets three consecutive number sequences of the same length incorrect (or completes all number sequences).
Item-level data for the Numbers Reversed subtask for the fall and spring of kindergarten, first grade, second grade, third grade, and fourth grade are provided in the ECLS-K:2011 K-4 data file. The maximum number of items any child could have been administered in all data collection rounds was 30 items (5 two-digit number items; 5 three-digit number items; 4 four-digit number items; 4 five-digit number items; 4 six-digit number items; 4 seven-digit number items; and 4 eight-digit number items). Each item is scored “correct” (i.e., the child correctly repeated the number sequence in reversed order), “incorrect” (i.e.,
3-25
the child did not correctly repeat the number sequence in reversed order), or “not administered” (i.e., the child was not administered the item because he or she did not answer enough items correctly to advance to this item). The “not administered” code is different than a system missing code in that only those children who were administered the Numbers Reversed subtask could have a “not administered” code. If a child was not administered the Numbers Reversed subtask at all, his or her case would have a missing code for the Numbers Reversed scores. Variable names for the item-level data from the fall kindergarten assessments begin with “C1,” and variable names for the item-level data from the spring kindergarten assessments begin with “C2.” Similarly, variable names for item-level data from the fall and spring first-grade assessments begin with “C3” and “C4,” while those for fall and spring second grade and spring third grade begin with “C5”, “C6,” and “C7”, respectively. Variable names for the item-level data from the spring fourth-grade assessment begin with “C8.” Variable descriptions for these items indicate the length of the digit sequence (e.g., C1 Numbers Reversed Two-digit sequence #1). In addition to the item-level data, five scores developed using guidelines from the publisher’s scoring materials are included in the data file for Numbers Reversed: the W-ability11 score, the age standard score, the grade standard score, the age percentile score, and the grade percentile score.
Before analyzing the Numbers Reversed data, it is important that researchers understand the characteristics of these scores and how these characteristics may affect the analysis and interpretation of the Numbers Reversed data in the context of the ECLS-K:2011. Depending on the research question and analysis being conducted, one of the scores may be more preferable than another. For example, the W score may be best for a longitudinal analysis, whereas the age or grade percentile rank and/or age or grade standardized score may be better suited for an analysis focusing on one point in time. The descriptions below provide more information about which score may be better suited for a given analysis.12
The W score, a type of standardized score, is a special transformation of the Rasch ability scale and provides a common scale of equal intervals that represents both a child’s ability and the task difficulty. The W scale is particularly useful for the measurement of growth and can be considered a growth scale. Typically, the W scale has a mean of 500 and standard deviation of 100. Furthermore, the publisher of the WJ III has set the mean to the average of performance for a child of 10 years, 0 months. This means that it would be expected that most children younger than 10 years, 0 months would obtain W scores lower than the mean of 500, and most older children would be expected to have scores above the mean of 500. Also, as a child develops with age, it would be expected that the child’s W score would increase to reflect growth. For example, when a child’s W-ability score increases from 420 to 440, this indicates growth, and
11 The W-ability score is a W score that represents the individual’s level of ability on the task presented. 12 More information on these publisher scores can be found in the Woodcock-Johnson III Tests of Achievement Examiner’s Manual: Standard and Extended Batteries (Mather and Woodcock 2001).

3-26
this would be the same amount of growth in the measured ability as any other student who gained 20 W points elsewhere on the measurement scale.
As mentioned above, the W score is an equal-interval scale, suited for analyses such as correlations and regressions. Higher W scores indicate that a child provided more correct responses and generally indicate that a child was able to correctly respond to at least some longer number sequences. The W score accounts for only the total number of administered sequences answered correctly and does not reflect the pattern of responses, meaning the W score does not indicate how many of each length number sequence the child answered correctly. As noted above, the data file includes item-level data that can be used to examine patterns of response.
The W score for each child in the ECLS-K:2011 was determined using norming data provided by the publisher. More specifically, a sample child was assigned the W score from the publisher norming data that was associated with the child’s raw number-right score, the child’s age (in months), and the language of administration.
In kindergarten and first grade, the Numbers Reversed subtask was administered in both English and Spanish. It was administered in Spanish to children routed through the assessment battery in Spanish because they did not pass an English language screener.13 Norming data were provided separately for English and Spanish administrations of the task. Publisher materials indicate that the W scores earned on English administrations of the Numbers Reversed task are comparable to W scores earned on Spanish administrations of the task; nevertheless, differences related to precision of measurement in the norming samples result in different W scores for the same raw-number right score depending on the language of administration. For example, the lowest earnable W score on the English administration of the Numbers Reversed task is 403 (equivalent to a raw score of 0), and the lowest earnable W score on the Spanish administration is 393 (equivalent to raw score of 0). While this difference in the W scores between English and Spanish administration is largest at the lower end of the W distribution, the difference occurs along the entirety of the W distribution. For example, a raw score of 11 corresponds to a W score of 496 in the English administration norming data and a W score of 494 in the Spanish administration norming data. The data file includes one W score variable per round of data collection that contains data for all children administered the Numbers Reversed task, regardless of the language of administration. Researchers who want to account for language of administration in their analyses can use the data flag provided on the data file for each round (X*FLSCRN) to identify which children were administered Numbers Reversed in English and which children were administered Numbers Reversed in Spanish. All children were
13 More information about how children’s home language affected children’s routing through the assessment battery in each round of data collection is provided in chapter 5 of the ECLS-K:2011 Kindergarten Psychometric Report (Najarian et al. forthcoming).

3-27
administered the assessments in English starting with the second-grade data collection. Therefore, the second-, third-, and fourth-grade Numbers Reversed scores for all children are based on an English administration of the assessment, and data flags to indicate language administration in grades second through fourth are not provided on the data file.
Although the W score is reflective of the average performance of 10-year-olds, and the ECLS-K:2011 children were younger in the earlier rounds of the study, it is included in the data file to enable the measurement of changes in children’s working memory longitudinally across all rounds of the study. Also, it facilitates comparisons of the ECLS-K:2011 data with data from other studies that include the Numbers Reversed task. Users should keep in mind that most ECLS-K:2011 sample children were primarily 5 or 6 years old during the kindergarten data collections, 6 or 7 years old during the first-grade data collections, 7 or 8 years old during the second-grade data collections, 8 or 9 years old during the third-grade data collection, and 9 and 10 years old during the fourth-grade data collection14 while the W scores compare their performance to that of 10-year-olds. As a result, W scores from the ECLS-K:2011 sample appear to show that the ECLS-K:2011 children demonstrated below average performance on this task. As expected, the discrepancy is declining as the participating children grow older and closer to age 10.
A score of 403 (393 for the Spanish administration) is potentially a meaningful baseline value for the ability level of children who are unable to answer any items correctly. Over time, as children develop more ability that is measurable by the WJ III Numbers Reversed task, the study is able to compare children’s baseline Numbers Reversed W score (fall kindergarten and/or spring kindergarten Numbers Reversed W score) with children’s scores across future administrations of the task. However, researchers should understand that a raw score of 0 (which translates to a W score of 403 for the English administration and 393 for the Spanish administration) is an imprecise measure of children’s ability in the area of working memory, because it is unknown how close a child was to getting at least one answer correct.
In the fall of kindergarten, approximately 40 percent of students did not demonstrate sufficient skills as measured by this assessment to score above the lowest scalable score (403 for English assessment and 393 for Spanish assessment). In the spring of kindergarten, approximately 20 percent of students did not score above the lowest scalable score (403 for English, 393 for Spanish). In the fall of first grade, less than 13 percent scored at the lowest scalable score, and only 6 percent scored at the lowest scalable score in the spring of first grade. In the fall of second grade, less than 4 percent scored the lowest scalable score, and slightly more than 2 percent received the lowest score in the spring. In the spring of third grade,
14 For the fourth-grade assessment, approximately 56 percent of the children were 10 years old or older, and approximately 44 percent of the children were 9 years old or younger.

3-28
approximately 1 percent scored at the lowest scalable score. In the spring of fourth grade, approximately 0.5 percent scored at the lowest scalable score.
A factor that may contribute to the large number of children scoring 403 (and 393 for Spanish) in kindergarten is that some ECLS-K:2011 assessors did not properly administer the practice items, which may have resulted in some children never fully understanding what they were being asked to do during the Numbers Reversed task. During field observations of the assessors, it was noted that when children did not correctly answer the first practice item, there were inconsistencies in the administration of additional practice items. It is not possible to determine the extent to which improper administration of the practice items affected the results. However, readers should keep in mind that this may have affected performance for some (but not all) children. In conducting analyses, researchers need to decide how to handle the 403 (393 for Spanish) scores; the decision for how to do so is left up to the analyst based on his or her analytic goals. For the first-grade and later data collections, assessor training for the Numbers Reversed task was changed to improve the consistency and clarity of administration of the practice items. The instructions trainers provided to the assessors emphasized the need to present practice items consistently and to present multiple practice items when necessary. More information about the Numbers Reversed scoring and data can be found in the ECLS-K:2011 Kindergarten Psychometric Report (Najarian et al. forthcoming).
The four additional Numbers Reversed scores are the age standard score, the grade standard score, the age percentile score, and the grade percentile score. These scores indicate children’s status relative to their peers through age-normed and grade-normed transformations of the data. That is, these scores are relative to same-aged or same-grade subjects in the WJ III norming sample. The standard scores are created by the publisher and have a mean of 100 and a standard deviation of 15. The score is a linear transformation of a Z score (mean of 0 and a standard deviation of 1), which is derived from a person’s achieved W score. The percentile rank scores describe performance on a scale from 0 to 100 relative to the performance of subjects in the WJ III norming sample that is at the same age or grade as the ECLS-K:2011 subjects.
As with the kindergarten and first-grade W scores, the kindergarten and first-grade standard scores and percentile scores in the data file contain data from both the English and Spanish administrations of the Numbers Reversed task. Standard scores and percentile scores are a function of the child’s age or grade at assessment. The publisher’s scoring protocols result in standard and percentile scores that extend to slightly lower ages for children who were administered the task in Spanish compared to children who were administered the task in English, again due to differences in the precision of measurement within the norming samples. Children 62 months and younger who were administered the Numbers Reversed task in
3-29
English and who earned a raw score of 0 or 1 have a W score but do not have a standard score or percentile score (W scores are a function of the number correct and not a function of age). However, all children who were administered this task in Spanish, including those aged 62 months and younger have a W score, standard scores, and percentile scores, regardless of their raw score. Again, researchers who want to account for language of administration in their analyses during kindergarten or first grade can use the variables X1FLSCRN, X2FLSCRN, X3FLSCRN, and X4FLSCRN to identify language.
For both the age-normed scores and the grade-normed scores, standard scores and percentile ranks lend themselves to different interpretations. Standard scores and percentile ranks are not essentially the same. Standard scores are deviation-based scores, based upon a mean and standard deviation that remains constant across the entire range. They are interval data, where values are separated by a constant interval that maintains the same meaning across the full range. Percentile ranks are neither interval data nor constant and cannot be used interchangeably with standardized scores. As such, standard scores are most appropriately used for comparisons across children and between groups; W scores (also a deviation-based score metric) are most appropriately used to look at growth over time, where age-normed standard scores may remain relatively constant with an age-expected rate of growth. Percentiles are less ideal for longitudinal analyses; although they can be used to examine relative rank order consistency across time periods, the W scores would be better to assess change and/or stability across time.
The weighted means for the ECLS-K:2011 population are lower than the established means from the WJ III norming sample:15 the average W scores for the ECLS-K:2011 population are less than 500, the average age and grade standard scores are less than 100, and the average age and grade percentile scores are less than 50. The lower mean for the W scores in the ECLS-K:2011 may be attributed to the derivation of the score being a comparison to the average 10-year-old (generally 10-year-olds are in fourth or fifth grade)16 or to differences between the ECLS-K:2011 population and the WJ III norming sample. The lower means for the standard percentile scores in the ECLS-K:2011 may also be attributable to differences between the ECLS-K:2011 population and the WJ III norming sample.
15 Normative data for the WJ III were gathered from 8,818 subjects in more than 100 geographically diverse U.S. communities (McGrew and Woodcock 2001). The kindergarten through 12th grade sample was composed of 4,783 subjects. The norming sample was selected to be representative of the U.S. population from age 24 months to age 90 years and older. Subjects were randomly selected within a stratified sampling design that controlled for the following 10 specific community and subject variables: census region (Northeast, Midwest, South, West); community size (city and urban, larger community, smaller community, rural area); sex; race (White, Black, American Indian, Asian and Pacific Islander); Hispanic or non-Hispanic; type of school (elementary, secondary, public, private, home); type of college/university (2-year, 4-year, public, private); education of adults; occupational status of adults; occupation of adults in the labor force. 16 For the fourth-grade assessment, approximately 56 percent of the children were 10 years old or older, and approximately 44 percent of the children were 9 years old or younger.

3-30
The variable names, descriptions, value ranges, weighted means, and standard deviations for the Numbers Reversed scores from the fall of kindergarten to the spring of fourth grade are shown in table 3-6.
Table 3-6. Numbers Reversed variable names, descriptions, value ranges, weighted means, and standard deviations for fall and spring kindergarten, fall and spring first grade, fall and spring second grade, spring third grade, and spring fourth grade: School years 2010–11, 2011–12, 2012–13, spring 2014, and spring 2015
Variable name Description n
Range of Possible
values Weighted
mean Standard deviation
X1NRWABL X1 Numbers Reversed W-Ability Score 15,598 393-603 432.56 30.028 X1NRSSCR X1 Numbers Reversed Age Standard Score 14,445 45-200 93.10 16.510 X1NRSSGR X1 Numbers Reversed Grade Standard Score 15,598 74-190 96.40 14.569 X1NRPERC X1 Numbers Reversed Age Percentile 14,445 0-100 37.89 31.786 X1NRPEGR X1 Numbers Reversed Grade Percentile 15,598 0-100 41.98 30.886 X2NRWABL X2 Numbers Reversed W-Ability Score 17,147 393-603 449.49 30.412 X2NRSSCR X2 Numbers Reversed Age Standard Score 17,124 39-200 94.92 17.017 X2NRSSGR X2 Numbers Reversed Grade Standard Score 17,147 54-200 94.76 16.049 X2NRPERC X2 Numbers Reversed Age Percentile 17,124 0-100 42.44 30.970 X2NRPEGR X2 Numbers Reversed Grade Percentile 17,147 0-100 41.89 29.980 X3NRWABL X3 Numbers Reversed W-Ability Score 5,222 393-603 458.42 27.990 X3NRSSCR X3 Numbers Reversed Age Standard Score 5,221 36-200 94.21 16.969 X3NRSSGR X3 Numbers Reversed Grade Standard Score 5,222 29-200 95.19 17.815 X3NRPERC X3 Numbers Reversed Age Percentile 5,221 0-100 41.23 28.832 X3NRPEGR X3 Numbers Reversed Grade Percentile 5,222 0-100 43.61 29.857 X4NRWABL X4 Numbers Reversed W-Ability Score 15,107 393-603 469.56 25.395 X4NRSSCR X4 Numbers Reversed Age Standard Score 15,102 32-200 95.90 16.872 X4NRSSGR X4 Numbers Reversed Grade Standard Score 15,107 19-200 95.42 18.159 X4NRPERC X4 Numbers Reversed Age Percentile 15,102 0-100 44.35 28.470 X4NRPEGR X4 Numbers Reversed Grade Percentile 15,107 0-100 44.07 29.276 X5NRWABL X5 Numbers Reversed W-Ability Score 4,727 403-603 473.93 23.736 X5NRSSCR X5 Numbers Reversed Age Standard Score 4,727 29-200 94.93 16.574 X5NRSSGR X5 Numbers Reversed Grade Standard Score 4,727 23-200 95.85 17.561 X5NRPERC X5 Numbers Reversed Age Percentile 4,727 0-100 42.13 27.609 X5NRPEGR X5 Numbers Reversed Grade Percentile 4,727 0-100 44.17 28.742 X6NRWABL X6 Numbers Reversed W-Ability Score 13,832 403-603 480.70 22.841 X6NRSSCR X6 Numbers Reversed Age Standard Score 13,828 25-200 95.80 16.749 X6NRSSGR X6 Numbers Reversed Grade Standard Score 13,832 19-200 95.52 17.715 X6NRPERC X6 Numbers Reversed Age Percentile 13,828 0-100 43.67 27.765 X6NRPEGR X6 Numbers Reversed Grade Percentile 13,832 0-100 43.59 28.680 X7NRWABL X7 Numbers Reversed W-Ability Score 12,877 403-603 489.78 21.624 X7NRSSCR X7 Numbers Reversed Age Standard Score 12,874 20-200 96.34 16.185 X7NRSSGR X7 Numbers Reversed Grade Standard Score 12,877 19-200 102.74 17.037 X7NRPERC X7 Numbers Reversed Age Percentile 12,874 0-100 44.10 27.742 X7NRPEGR X7 Numbers Reversed Grade Percentile 12,877 0-100 55.90 28.907
See notes at end of table.
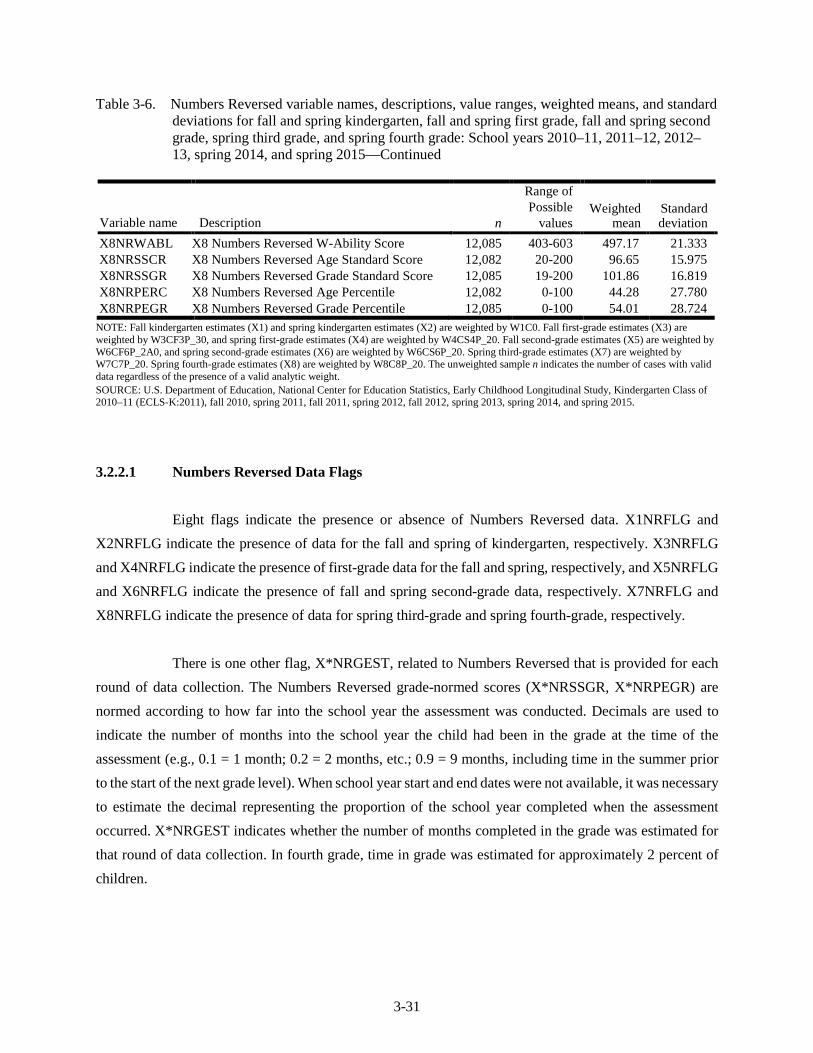
3-31
Table 3-6. Numbers Reversed variable names, descriptions, value ranges, weighted means, and standard deviations for fall and spring kindergarten, fall and spring first grade, fall and spring second grade, spring third grade, and spring fourth grade: School years 2010–11, 2011–12, 2012–13, spring 2014, and spring 2015—Continued
Variable name Description n
Range of Possible
values Weighted
mean Standard deviation
X8NRWABL X8 Numbers Reversed W-Ability Score 12,085 403-603 497.17 21.333 X8NRSSCR X8 Numbers Reversed Age Standard Score 12,082 20-200 96.65 15.975 X8NRSSGR X8 Numbers Reversed Grade Standard Score 12,085 19-200 101.86 16.819 X8NRPERC X8 Numbers Reversed Age Percentile 12,082 0-100 44.28 27.780 X8NRPEGR X8 Numbers Reversed Grade Percentile 12,085 0-100 54.01 28.724
NOTE: Fall kindergarten estimates (X1) and spring kindergarten estimates (X2) are weighted by W1C0. Fall first-grade estimates (X3) are weighted by W3CF3P_30, and spring first-grade estimates (X4) are weighted by W4CS4P_20. Fall second-grade estimates (X5) are weighted by W6CF6P_2A0, and spring second-grade estimates (X6) are weighted by W6CS6P_20. Spring third-grade estimates (X7) are weighted by W7C7P_20. Spring fourth-grade estimates (X8) are weighted by W8C8P_20. The unweighted sample n indicates the number of cases with valid data regardless of the presence of a valid analytic weight. SOURCE: U.S. Department of Education, National Center for Education Statistics, Early Childhood Longitudinal Study, Kindergarten Class of 2010–11 (ECLS-K:2011), fall 2010, spring 2011, fall 2011, spring 2012, fall 2012, spring 2013, spring 2014, and spring 2015.
3.2.2.1 Numbers Reversed Data Flags
Eight flags indicate the presence or absence of Numbers Reversed data. X1NRFLG and X2NRFLG indicate the presence of data for the fall and spring of kindergarten, respectively. X3NRFLG and X4NRFLG indicate the presence of first-grade data for the fall and spring, respectively, and X5NRFLG and X6NRFLG indicate the presence of fall and spring second-grade data, respectively. X7NRFLG and X8NRFLG indicate the presence of data for spring third-grade and spring fourth-grade, respectively.
There is one other flag, X*NRGEST, related to Numbers Reversed that is provided for each round of data collection. The Numbers Reversed grade-normed scores (X*NRSSGR, X*NRPEGR) are normed according to how far into the school year the assessment was conducted. Decimals are used to indicate the number of months into the school year the child had been in the grade at the time of the assessment (e.g., 0.1 = 1 month; 0.2 = 2 months, etc.; 0.9 = 9 months, including time in the summer prior to the start of the next grade level). When school year start and end dates were not available, it was necessary to estimate the decimal representing the proportion of the school year completed when the assessment occurred. X*NRGEST indicates whether the number of months completed in the grade was estimated for that round of data collection. In fourth grade, time in grade was estimated for approximately 2 percent of children.
3-32
3.2.3 The NIH Toolbox Flanker Inhibitory Control and Attention Task (Flanker)
The NIH Toolbox Flanker Inhibitory Control and Attention Task (Flanker) is a computerized task that was developed as part of the NIH Toolbox for the Assessment of Neurological and Behavioral Function (NIH Toolbox) and is appropriate for ages 3–85 (Zelazo et al. 2013). The Flanker was adapted from the Attention Network Test (ANT; e.g., Rueda et al., 2004), which was based on the Eriksen flanker task (Eriksen and Eriksen, 1974). The Flanker (Zelazo et al 2013) was added to the ECLS-K:2011 assessment battery in fourth grade. It is a measure of executive function; specifically, it is a measure of inhibitory control in the context of selective visual attention.
The ECLS-K:2011 used the version of the NIH Toolbox Flanker task that is for children 8 years and older.17 In the fourth-grade administration of the ECLS-K:2011, all children were at least 8 years old. The Flanker task measures inhibitory control in the context of selective visual attention (Slotkin, Nowinski, et al. 2012). In this task children must inhibit an automatic response tendency that may interfere with achieving a goal and use selective attention to consciously direct sensory or thought processes to a stimulus in the visual field in the service of goal-directed behavior. In the Flanker task, children are asked to focus attention on a central stimulus while ignoring or inhibiting attention to stimuli presented on either side of the central stimulus. The stimulus used for children 8 years and older is a series of five arrows, pointing either left of right. The arrows that “flank” the central arrow, which are referred to as “flankers,” either point in the same direction as the central arrow (congruent) or in the opposite direction as the central arrow (incongruent). The flanker arrows act as distractors, taking attention away from the central arrow that is supposed to be the focus of the child’s attention. Children are presented with 20 arrow trials and are asked to press a button on the computer to indicate the direction the central stimulus (arrow) is pointing. Like the DCCS, the score based on the Flanker is derived from a formula that takes into consideration both accuracy and reaction time (Zelazo et al. 2013; Slotkin, Nowinski, et al. 2012). Performance on the incongruent trials is used to derive a score that is a measure of inhibitory control in the context of selective visual attention.
At the start of the 20 test trials, children were instructed to “Keep your eyes on the star. Answer as fast as you can without making mistakes. If you make a mistake, just keep going.” Each of the test trials began with a picture of a star presented on the screen in the location where the central (target) stimulus was about to appear. The star served to direct the child’s gaze and orient the child’s attention to a standard
17 The NIH Toolbox Flanker task has two different start points based on the age of the child. Children aged 3-7 begin the task with trials that use fish as the stimulus and progress to harder trials that use arrows as stimuli if performance on the fish trials is 90 percent or more correct. By design, children who are 8 years and older begin with the arrow trials and are given credit for successful completion of the fish trials because it was determined that the majority of children 8 years and older could successfully complete the easier fish trials. The task includes two different start points in order to reduce participant burden and create a task with a shorter administration time. Because all children in the ECLS-K:2011 study were at least 8 years of age in the fourth-grade data collection, all of them began with the arrow trials and were given credit in the scoring for successfully completing the fish trials.

3-33
location, the location where the child needed to be looking. Next, the word “MIDDLE” appeared on the screen in the same location while a prerecorded female voice said “middle,” to remind the child to look at the middle arrow and to indicate the direction of that arrow. Next, a series of five arrows appeared on the screen in a line, and the child’s task was to press the left arrow key if the arrow in the middle of the five arrows (i.e., the central arrow) was pointing to the left or press the right arrow key if the central arrow was pointing to the right.
The 20 test trials were the same for all children. The direction of the central arrow was counterbalanced across the 20 trials, and there were more congruent trials than incongruent trials. There were 13 congruent trials (central arrow pointed in the same direction as the arrows flanking it) and 7 incongruent trials (central arrow pointed in the opposite direction as the arrows flanking it). For example, the central arrow for trial 1 was left-facing, and the flankers were congruent; the central arrow for trial 2 was right-facing, and the flankers were congruent; and the center arrow for trial 3 was right-facing, and the flankers were incongruent (i.e., left-facing). Like the DCCS, the congruent and incongruent trials in the Flanker were intermixed across the trials, and the number of congruent trials preceding an incongruent trial did not follow a pattern. Congruent trials were more frequent in order to build a response tendency (i.e., a response that is “preferred” because it happens more frequently, resulting in a predisposition to respond in that manner). A predisposition to respond based on the orientation of the distractors flanking the central stimulus further increases the difficulty of the incongruent trials; the child must ignore or inhibit attention to the distractors, and this is easier to do when the flankers are congruent. Congruent trials are easier because there is no conflict between the central stimulus and its flankers since all the arrows are pointing in the same direction. Incongruent trials are more difficult because the flankers pointing in the opposition direction from the central stimulus create a distraction with conflicting information. The child needs to respond based solely on the direction of the central stimulus rather than the conflicting and distracting information. To do this, the child must selectively attend to the central arrow, inhibit attention to the conflicting and distracting information provided by the flankers, and inhibit an automatic tendency to respond based on the direction of the flankers.
There is a “cost” in performance that is associated with the conflicting and distracting information presented in the incongruent trials. As discussed in the section on the DCCS, the “cost” to the child’s performance on this task that is associated with this conflict can be seen in either more errors or a slower reaction or response time on incongruent trials. The type of “cost” that is demonstrated (more errors vs. slower reaction time) tends to differ by the age of the participant (Davidson et al. 2006). Younger children tend to demonstrate this cost by having more errors in performance, whereas older children tend to demonstrate this cost by having slower reaction times. Younger children tend to make more errors on incongruent trials because they tend to respond quickly without making an adjustment for the need to ignore

3-34
the conflict presented by the distractors. Younger children do not slow themselves down in favor of higher accuracy, and, therefore, accuracy is a better metric of performance for young children (Zelazo et al. 2013). In contrast, older children and adults tend to demonstrate a speed/accuracy tradeoff; they slow down the pace at which they respond in order to maintain accuracy. Thus, older children and adults demonstrate their “cost” to ignore the conflict of the incongruent flankers in terms of their reaction time on incongruent trials. Using a scoring method that takes both speed and accuracy into consideration is a strategy for overcoming the challenge of comparing scores of children with developmental differences in the ability to make a speed accuracy tradeoff. The scoring algorithm used to produce scores from the data collected by the Flanker is analogous to the formula used for the computerized DCCS. The scoring algorithm factors in reaction time on the incongruent trials but only when the child demonstrates sufficiently accurate performance across all the test trials, defined as being accurate on more than 80 percent of the trials (Zelazo et al. 2013). Thus, the Flanker provides a measure of performance through this developmental shift to learning to trade speed for accuracy. More information on scoring is provided below.
The 20 test trials were administered only to children who successfully completed the practice portion of the Flanker. The assessor instructed the child on how to do the task by reading the standardized task instructions that appeared on the screen alongside example stimuli and by familiarizing the child with the response buttons to use on the computer keyboard (left and right arrow key). The child could be presented with up to three sets of four practice trials. Each set of practice trials included two congruent trials (one with all arrows pointing to the left and one with all arrows pointing to the right) and two incongruent trials (one with a left-facing central arrow and one with a right-facing central arrow). In order to pass the practice and progress to the test or scored trials, the child had to have three or more correct practice trials within a single set of four practice trials. If the child did not pass the first set of practice trials, a second set was presented. If the child did not pass the second set of practice trials, a third set of practice trials was administered. If the child was not able to pass any of the three sets of practice trials, the Flanker ended before any actual scored trials were presented and the child moved into the science assessment.
Before the practice trials started, children were presented with a screen providing the same standardized instructions that are described above for the test trials, which the assessor read. As noted above, the instructions stated, “Keep your eyes on the star. Answer as fast as you can without making mistakes. If you make a mistake, just keep going.” The practice trials were like the subsequent test trials in that a star appeared first on the screen to act as focal point and a recorded female voice said “middle” to remind the child to look at and indicate the direction of the middle arrow. However, unlike in the test trials, during the practice trials the recorded voice was used to provide feedback to the child. If the child answered a practice trial correctly, the recorded voice said “That’s right!” If the child did not respond correctly to a
3-35
practice trial, the recorded voice provided feedback to the child to explain the correct answer and why it was correct.
Item-level data for the 20 scored test trials are included in the data file. Data are provided for four aspects of each test trial: (1) correct versus incorrect responses (C8FLKACC1-C8FLKACC20); (2) the type of trial, reported as congruent (more frequently presented but not included in reaction time scores; central arrow faces in the same direction as the flanking arrows) or incongruent (less frequently presented and used to calculate reaction time scores; central arrow faces in the direction opposite from the flanking arrows) (C8FLKCIC1-C8FLKCIC20); (3) reaction time reported in milliseconds (C8FLKRT1-C8FLKRT20); and (4) the direction that the central arrow faces (C8FLKARW1-C8FLKARW20).18 Therefore, there are four variables associated with each of the 20 test trials. Children who did not pass any of the three sets of practice trials do not have item-level data because the item-level data correspond to the actual scored trials. Variable names for the item-level data begin with “C8” for spring fourth grade.
The overall computed score reported for the fourth-grade Flanker is derived using a formula provided by the task developer and follows the scoring algorithm used for this task in the NIH Toolbox (see NIH Toolbox Scoring and Interpretation Guide (Slotkin, Nowinski et al. 2012) for additional information on scoring). This is the same formula used to score the computerized DCCS score, adjusted for task parameters (number of administered trials). Like the DCCS, the overall Flanker score ranges from 0 to 10, with weight given to accuracy (0 to 5 units) and reaction time (0 to 5 units) in the computation of scores. Accuracy is considered first. If the child’s accuracy rate is less than or equal to 80 percent, the child’s overall computer score is based entirely on accuracy. If the child’s accuracy rate is more than 80 percent, the child’s overall computed score is based on a combination of accuracy and reaction time. Children who did not pass any of the three sets of practice trials do not have an overall Flanker score.
The accuracy score factored into the computation of the overall score can range from 0 to 5. Because all children used the Flanker start point for children 8 years and older, each child who successfully passed the practice was administered 20 test trials and was automatically given 20 accuracy points for 20 trials that are only administered to children younger than 8 years old. Therefore, there are a total of 40 accuracy points that are scaled down to a maximum score of 5: for each correct response, the child earns a
18 A variable to describe the direction that the central arrow faces is not necessary for analyzing task performance. It is included on the data file to allow researchers to reconstruct the exact trials that were presented in case there is interest in doing so.

3-36
score of .125 (5 points divided by 40). The accuracy component of the overall computed Flanker score is calculated as follows:
Flanker accuracy score = 0.125 * number of correct responses19
If the child’s accuracy rate is higher than 80 percent, a reaction time score is added to the child’s accuracy score.20 Like the accuracy score, the reaction time score ranges from 0 to 5 points.
The reaction time component of the overall computed score for the Flanker is computed using the child’s median reaction time to correct incongruent trials (i.e., the trials with the flanking arrows facing in a direction opposite the central arrow), following the same scoring algorithm outlined in the scoring manual for the NIH Toolbox (Slotkin, Nowinski, et al. 2012). First, for those children with greater than 80 percent accuracy on the 40 trials, the median reaction time is calculated based on reaction times for correct incongruent trials with reaction times greater than or equal to 100 milliseconds (msec) and within plus or minus three standard deviations from the child’s mean reaction time on the correct incongruent trials. The minimum median reaction time allowed is 500 msec; the maximum median reaction time is 3,000 msec. If the child’s median reaction time falls outside this range, the child’s median reaction is set to the minimum or maximum allowable range: reaction times between 100 msec and 500 msec were set to 500 msec and reaction times between 3,000 msec and 10,000 msec (the maximum trial duration) are set to 3,000 msec. A log (base 10) transformation is applied to the median reaction times to create a more normal distribution. The log values are then algebraically rescaled to a range of 0 to 5 and then reversed such that faster (better) reaction times have higher values and slower reaction times have lower values. The formula for rescaling the median reaction times is the following:
Reaction time score = 5 − (5 ∗ [log𝑅𝑇 − log (500)
log(3000) - log (500)])
where RT is the median reaction time on incongruent trials within set outer limits.21
19 The number of correct responses = 20 + the number of correct arrow trials out of the 20 administered trials. Thus, once the child has passed the practice trials and advanced into the scored portion of the assessment, 20 accuracy points are automatically awarded due to the chosen start point for the task. For this reason, it is not possible for ECLS-K:2011 children to get an accuracy score of 0. Therefore, the minimum possible value for the Flanker accuracy score is 2.5, and the maximum possible Flanker accuracy score is 5. 20 The criterion of greater than 80 percent accuracy is calculated based on all 40 trials (20 administered arrow trials plus the 20 that are only administered to children younger than 8 years old). That is, 80 percent of 40 trials is 32 items. However, this can also be thought of in terms of how many items out of the 20 administered arrow trials are required. If the criterion is 80 percent of the 40 trials, this translates to 12 of the 20 administered trials. For example, if a child responds accurately on 13 of the 20 administered arrow trials, the child’s accuracy rate equals 82.5 percent (20 points automatically awarded for the nonadministered 20 trials plus the 13 correct arrow trials divided by 40; 33/40 = .825). In this example, the child’s accuracy score would be [(20 + 13) * .125] = 4.125. Because the accuracy rate is greater than 80 percent, the child’s reaction time score would be added to this accuracy score to obtain the overall computed score for the Flanker. Alternatively, if the child responded accurately on 12 of the 20 administered arrow trials, the child’s accuracy rate would equal 80 percent and, therefore, the child’s accuracy is not greater than 80 percent and the child’s overall score would be based solely on accuracy (overall computed score = [(20 + 12) * .125] = 4). 21 The median reaction time (RT) used to calculate the reaction time score falls within the range of 500 msec through 3,000 msec. Calculation of the median score requires a minimum of at least one correct incongruent trial reaction time that is greater than 100 msec. When the child reached the accuracy threshold for including the reaction time component in the scoring but did not have any within-range reaction times on correct incongruent trials, the child’s overall computed score on the Flanker was set equal to the child’s accuracy score, and reaction time was not factored into the child’s score.

3-37
To summarize, the overall computed score on the computerized Flanker is equal to the child’s accuracy score if the child’s accuracy rate is less than or equal to 80 percent. If the child’s accuracy rate is greater than 80 percent, the child’s overall computed score is equal to the child’s accuracy score plus the child’s reaction time score, which is derived from the child’s reaction time on correct incongruent trials as described above. Additional details on the calculation of the computed score are available in the NIH Toolbox Scoring and Interpretation Guide (Slotkin, Nowinski, et al. 2012) and the NIH Toolbox Technical Manual (Slotkin, Kallen, et al. 2012).
It is important for researchers using the Flanker data to be aware of the characteristics of the overall Flanker scores and determine how best to use these scores in their analyses. As noted above, the NIH-developed scoring model computes scores differently depending on accuracy. The use of this scoring model with the data collected from children in the ECLS-K:2011 resulted in a non-normal distribution. For example, 48 children who have a computed overall Flanker score in the fourth-grade data collection failed to achieve greater than 80 percent accuracy (0.4 percent). The score for these children is calculated based solely on accuracy. There are 27 children in the fourth-grade data collection (0.2 percent) who met the accuracy threshold but did not have any correct incongruent trials; therefore, their score was set equal to their accuracy score because it was not possible to have a reaction time score for correct, incongruent trials. Thus, there were a total of 75 children (48 + 27) whose overall Flanker score is based on accuracy alone (0.6 percent). The remaining children (99 percent in fourth grade) who have a computed overall score have scores calculated based on both accuracy and reaction time.
The non-normal distribution may be problematic for statistical analyses. For this reason, users may want to run analyses that do not use the overall Flanker score as is with the full sample. For example, users could conduct their analyses separately for the two groups of children so that each analysis only includes children with scores calculated in the same way, or they may decide to limit their analyses to only one group. Users who want to analyze all children using the score indicating accuracy alone should recognize that this score is highly skewed, as nearly all children were able to indicate the direction the central arrow was pointing with at least 80 percent accuracy. Users may also want to consider investigating alternative scoring models using the item-level accuracy and reaction time data available on the data file. The decision about how best to use the Flanker overall score in analysis is left to the user, given the research questions being addressed. Analysts may choose to examine other ways researchers have analyzed data with similar distributions, or other executive function or flanker data, in deciding how best to utilize the ECLS-K:2011 Flanker data. Table 3-7 presents the Flanker variable names, descriptions, value ranges, weighted means, and standard deviations for the spring of fourth grade.

3-38
Table 3-7. Flanker variable names, descriptions, value ranges, weighted means, and standard deviations for spring fourth grade: Spring 2015
Variable name Description n
Range of possible values1
Weighted mean
Standard deviation
X8FLANKER X8 Flanker Computed (Overall) Score 12,009 0-10 7.98 0.984 X8FLKACC X8 Flanker Accuracy Component (0-5) Scr 12,009 0-5 4.96 0.129 X8FLKICRT X8 Flanker Incon RT Component (0-5) Scr 11,934 0-5 3.03 0.923 X8FLKCAC X8 Flanker Congruent Accuracy Count 12,009 0-13 12.93 0.484 X8FLKICAC X8 Flanker Incongruent Accuracy Count 12,009 0-7 6.78 0.770 1 Because 20 accuracy points are automatically awarded due to the chosen start point for the task, it is not possible for ECLS-K:2011 children to obtain an accuracy score of 0. Therefore, the lowest accuracy component (0-5) score in the data file is 2.5, and the lowest computed (overall) score in the data file is also 2.5. NOTE: Spring fourth-grade estimates (X8) are weighted by W8C8P_20. The unweighted sample n indicates the number of cases with valid data regardless of the presence of a valid analytic weight. SOURCE: U.S. Department of Education, National Center for Education Statistics, Early Childhood Longitudinal Study, Kindergarten Class of 2010–11 (ECLS-K:2011), spring 2015.
3.2.3.1 Flanker Data Flag
One flag indicates the presence or absence of Flanker data. X8FLNKFLG indicates the presence of data for the overall computed Flanker score (X8FLANKER) for the spring of fourth grade. The flag values indicate whether the task was administered, whether the overall computed Flanker score is present and, if a score is not present, the reason why it is not present. Reasons why a score is not present when the Flanker was administered include failing the practice trials or having an administrative breakoff (meaning the assessor ended the task) either before or after passing the practice trials. Administrative breakoffs could have occurred for a variety of reasons such as an external event (for example, a fire drill or the child needing to return to class) that interrupted an assessment session.
The Flanker flag for the spring of fourth grade has five possible values. A description of the values of this completion flag is presented in exhibit 3-3. The flag is equal to system missing when the child was not a participant in the round of data collection.
Exhibit 3-3. Data flag description for the Flanker for the spring of fourth grade: Spring 2015
X8FLNKFLG Value Not Administered 0 Flanker computed (overall) score present 1 Failed Arrows practice 2 Breakoff before passing practice trials 3 Breakoff after passing practice trials 4 SOURCE: U.S. Department of Education, National Center for Education Statistics, Early Childhood Longitudinal Study Kindergarten Class of 2010–11 (ECLS-K:2011), spring 2015.
3-39
3.3 Child Questionnaire
In the spring of third grade and the spring of fourth grade, a child questionnaire was administered to children at the beginning of the child assessment session. As discussed in section 2.1.1, the ECLS-K:2011 child questionnaire (CQ) was administered on a computer using audio computer-assisted self-interview (audio-CASI) technology and headphones. In third grade, the child questionnaire had 37 questions and took approximately 11 minutes to complete. In fourth grade, the child questionnaire had 35 questions and took approximately 8 minutes to complete.
The fourth-grade child questionnaire included both new items and items that were also included in the third-grade questionnaire. In both the third- and fourth-grade questionnaires, children were asked about social anxiety, specifically fear of negative evaluation by peers, and about peer victimization. The peer victimization questions were parallel to questions asked of teachers in the third and fourth grades and of parents in third grade. New questions that were included in the fourth-grade questionnaire asked children about their behavioral engagement in school, peer social support, feelings of loneliness at school, media usage and parental monitoring of media usage,22 and relationships with pets. In contrast to the third-grade child questionnaire, the content of the fourth-grade questionnaire did not overlap with the content of the child questionnaires that were administered in the prior cohort study ECLS-K.
Exhibit 3-4 shows the content areas included in the third-grade and fourth-grade child questionnaires and the corresponding item-level variables along with their sources. Variable names for the item-level data begin with “C7” for spring third grade and “C8” for spring fourth grade. Many of the items in the child questionnaire were adapted from existing scales and were used with the permission of the author. Data for the individual items are included in the K-4 data file, but composite variables for each construct are not provided; it is left to analysts to decide how best to use these data in their analyses.
22 In the spring of fourth grade, parents were also asked about parental monitoring of media usage. Parents were asked if they monitored how many hours their child spent online (P8MONTIM) and if they monitored what their child looked at online or what websites and accounts their child could join online (P8MONCON). These questions complement questions asked of the child on the child questionnaire.

3-40
Exhibit 3-4. Child questionnaire content and item-level variables for spring third grade and spring fourth grade: Spring 2014 and spring 2015
Child questionnaire content area Grade Number of items Item-level variable names
Perceived Interest/Competence in Reading1 3 5 C7LKREAD, C7INTREAD, C7CTWREAD, C7GDREAD, C7ENJREAD
Perceived Interest/Competence in Math1 3 5 C7LIKMTH, C7INTMTH, C7CTWMTH, C7GDMTH, C7ENJMTH
Perceived Interest/Competence in Science1 3 5 C7LKSCI, C7INTSCI, C7CTWSCI, C7GDSCI, C7ENJSCI
Perceived Interest/Competence in Peer Relationships1
3 6 C7HASFRNDS, C7MKFRNDS, C7GETALNG, C7EASYLIK,C7WTMEFRND, C7MORFRND
Peer Victimization2 3, 4 4 C*TEASED, C*LIESABT, C*PUSHCH, C*EXCLDCH
Social Anxiety/Fear of Negative Evaluation3
3, 4 3 C*WRYTHK, C*WRYDTLK, C*AFRDNTLK
Prosocial Behavior4 3 3 C7CHEERUP, C7HLPOTH, C7NICEOTH Life Satisfaction5 3 6 C7HAPHOB, C7HAPTHGS, C7HAPATTN,
C7HAPFRND, C7HAPSKIL, C7HAPNBHD Behavioral Engagement6 4 5 C8TRYHRD, C8WRKHRD, C8PARDIS,
C8PAYATT, C8LSTNCL Peer Social Support7 4 6 C8KIDBTR, C8KIDPLY, C8KIDHAP, C8KIDHLP,
C8FRIEND, C8HELPMN Loneliness8 4 3 C8LONELY, C8LFTOUT, C8ALONE Media Usage9 4 3 C8OFTTXT, C8RULWHO, C8RULWHN Pets10 4 18 C8CURPET, C8EVRPET, C8AGEPET, C8NUMPET,
C8PETDOG, C8PETCAT, C8PETRAB, C8PETBRD, C8PETFSH, C8PETSNK, C8PETHRS, C8PETOTH, C8HVFVPET, C8FAVPET, C8PLYPET, C8PETHMW, C8PETSAD, C8PETFAM
1 Adapted from the Self Description Questionnaire I (SDQI) © Herbert Marsh. SELF Research Centre (Bankstown Campus) University of Western Sydney, Australia. Used with permission. 2 Peer victimization items were adapted from a 21-item scale by Espelage, D. L. and Holt, M. (2001). Bullying and victimization during early adolescence: Peer influences and psychosocial correlates. Journal of Emotional Abuse, 2: 123–142. 3 Adapted from the Social Anxiety Scale for Children—Revised ©1993 Annette M. La Greca, University of Miami. Used with permission. La Greca, A. M. and Stone, W. L. (1993). Social anxiety scale for children—revised: Factor structure and concurrent validity. Journal of Clinical Child Psychology, 22(1): 17–27. 4 Adapted from the Children’s Social Behavior Scale—Self Report (CSBS-S). Crick, N.R. and Grotpeter, J.K. (1995). Relational aggression, gender, and social psychological adjustment. Child Development, 66: 710–722. 5 Adapted from the NIH Toolbox for Assessment of Neurological and Behavioral Function (version 1.0): Domain-Specific Life Satisfaction Survey from the NIH Toolbox Emotion Battery (www.NIHToolbox.org) © 2012 Northwestern University and the National Institutes of Health. Used with permission. 6 Adapted from Skinner, Ellen A., Kindermann, T. A., and Furrer, C. J. (2009). A motivational perspective on engagement and disaffection: Conceptualization and assessment of children's behavioral and emotional participation in academic activities in the classroom. Educational and Psychological Measurement, 69(3), 493-525. 7 Adapted from Vandell, D. (2000). Peer Social Support, Bullying, and Victimization (Form FLV05GS: Kids in My Class at School) [measurement instrument]. NICHD Study of Early Child Care and Youth development: Phase III , 2000-2004. 8 Adapted from Parker, J. G. and Asher, S. R. (1993). Friendship and friendship quality in middle childhood: Links with peer group acceptance and feelings of loneliness and social dissatisfaction. Developmental Psychology, 29(4), 611-621. 9 Adapted from the PEW September Tracking Survey 2009. Princeton Survey Research Associates International (2009). PEW September Tracking Survey 2009. Pew Internet and American Life Project. 10 Adapted from the CENSHARE Pet Attachment Survey. Holcomb, R., Williams, R. C., and Richards, P. S. (1985). The elements of attachment: Relationship maintenance and intimacy. Journal of the Delta Society, 2(1), 28-34. NOTE: An asterisk “*” is a placeholder for the round number in variable names. Third grade is round 7, and fourth grade is round 8. For example, the variable C*TEASED is listed in the table; this indicates that the variables C7TEASED and C8TEASED are available in the dataset. SOURCE: U.S. Department of Education, National Center for Education Statistics, Early Childhood Longitudinal Study, Kindergarten Class of 2010–11 (ECLS-K:2011), spring 2014 and spring 2015.

3-41
3.4 Teacher- and Parent-Reported Measures of Child Behavior and Peer Relationships
In the fourth-grade data collection, teachers and parents reported their perceptions of the child’s behavior and the child’s friendships or relationships with peers. This section provides information on teacher-reported social skills, approaches to learning behaviors, attentional focusing, inhibitory control, peer relationships, and school liking and avoidance behaviors. This section also provides information on parents’ perceptions of their child’s working memory, their child’s friendships, and their child’s school avoidance behaviors. This section focuses on child behaviors and relationships reported by teachers and parents in the fourth-grade data collection. Prior-round manuals contain information on additional measures of child behavior and relationships that were collected in earlier rounds (e.g., teachers completed the Student-Teacher-Relationship Scale in kindergarten through third grades, and information on this scale can be found in the User’s Manual for the ECLS-K:2011 Kindergarten–Third Grade Data File and Electronic Codebook, Public Version [NCES 2018-034]).
In kindergarten through third grade, the child’s classroom teacher completed a child-level teacher questionnaire that included questions about the child’s behavior. A single classroom teacher was asked to report for each child in these earlier grades because it is more typical for a child to have only one teacher or to be taught by one teacher for a majority or significant portion of the day. The ECLS-K:2011 made a major change in its approach to collecting the teacher questionnaire data starting in fourth grade because it becomes increasingly more likely that students have different teachers for different subjects as students progress through elementary school. In fourth grade, instead of having a single child-level teacher questionnaire, there were three separate subject-specific child-level teacher questionnaires: one for the child’s reading and language arts teacher, one for the child’s mathematics teacher, and one for the child’s science teacher. (See chapter 2 for additional information on the structure of the teacher questionnaires.) The reading, mathematics, and science subject-specific child-level teacher questionnaires each contained classroom-level questions related to the content of the class but also a few child-level questions specifically related to either the child’s reading, mathematics, or science experience and one question related to classroom-level social and self-regulatory child behaviors in the specific class. The reading teacher was asked to answer additional child-level questions that were not included in the mathematics and science teacher questionnaires, many of which were asked of the classroom teacher in prior rounds of data collection (kindergarten through third grade), including reports of the teacher’s perceptions of the child’s behaviors. In fourth grade, the teacher identified as the child’s reading and language arts teacher reported his or her perceptions of the child’s behavior, including social skills, approaches to learning, attentional focusing, inhibitory control, school liking, and social interactions and relationships in the classroom.

3-42
3.4.1 Teacher-Reported Social Skills
In the fall and spring data collections in kindergarten through second grade, and the spring data collections in third and fourth grade, teachers reported how often their ECLS-K:2011 students exhibited certain social skills and behaviors using a four-option frequency scale ranging from “never” to “very often.” Teachers also had the option of indicating that they had not had an opportunity to observe the described behavior for the child being asked about. The items measuring children’s social skills and behaviors are based on items from the Social Skills Rating System (NCS Pearson 1990)23 and were included in the self-administered child-level teacher questionnaire in kindergarten, first grade, second grade, and third grades and in the child-level Reading and Language Arts Teacher Questionnaire in fourth grade. The social skills battery includes some items taken verbatim from the Social Skills Rating System, some items that are modifications of original Social Skills Rating Systems items, and some items that measure the same kinds of skills and behaviors captured in the Social Skills Rating System but use wording developed specifically for the ECLS studies. Sections 2.1.3 and 2.1.4. in chapter 2 have additional information on the teacher questionnaires.
Four social skill scales were developed based on teachers’ responses to these questionnaire items. The score on each scale is the mean rating on the items included in the scale. The four teacher scales are as follows: Self-Control (4 items), Interpersonal Skills (5 items), Externalizing Problem Behaviors (6 items),24 and Internalizing Problem Behaviors (4 items). A score was computed when the respondent provided a rating on at least a minimum number of the items that composed the scale. The minimum numbers of items that were required to compute a score were as follows: Self-Control (3 out of 4 items), Interpersonal Skills (4 out of 5 items), Externalizing Problem Behaviors (4 out of 6 items), and Internalizing Problem Behaviors (3 out of 4 items). Higher scores indicate that the child exhibited the behavior represented by the scale more often (e.g., higher Self-Control scores indicate that the child exhibited behaviors indicative of self-control more often; higher Interpersonal Skills scores indicate that the child interacted with others in a positive way more often). Variable names for the teacher scale scores, descriptions, value ranges, weighted means, and standard deviations for these scales are shown in
23 The Social Skills Rating System is a copyrighted instrument (1990 NCS Pearson) and has been adapted with permission. These are items developed by Gresham and Elliott (1990). 24 For children who were in first grade during the first-grade data collections (rounds 3 and 4) and for all children in subsequent rounds of data collection (rounds 5, 6, 7, and 8), the externalizing problem behaviors composite is based on 6 items. This is different from how the composite was created for the kindergarten rounds (rounds 1 and 2). One additional item was included at the end of the “Social Skills” section of the questionnaire in first, second, third, and fourth grades. The item asked about the child’s tendency to talk at times when the child was not supposed to be talking. The item was added because it had been included in the first-grade round of the ECLS-K and was factored into the calculation of that study’s first-grade composite score.

3-43
table 3-8.25 Data for the individual items contributing to each scale are not included in the K–4 data file due to copyright restrictions.
Table 3-9 presents the internal consistency reliability (Cronbach’s alpha) estimates of the Self-Control, Interpersonal Skills, Externalizing Problem Behaviors, and Internalizing Problem Behaviors scales derived from information reported by the teacher.
Table 3-8. Teacher-reported social skills scales variable names, descriptions, value ranges, weighted means, and standard deviations for fall and spring kindergarten, fall and spring first grade, fall and spring second grade, spring third grade, and spring fourth grade: School years 2010–11, 2011–12, 2012–13, spring 2014, and spring 2015
Variable name Description n
Range of possible
values Weighted
mean Standard deviation
X1TCHCON X1 Teacher Report Self-Control 13,550 1–4 3.07 0.629 X1TCHPER X1 Teacher Report Interpersonal Skills 13,708 1–4 2.98 0.639 X1TCHEXT X1 Teacher Report Externalizing Problem Behaviors 14,385 1–4 1.61 0.631 X1TCHINT X1 Teacher Report Internalizing Problem Behaviors 14,239 1–4 1.47 0.494
X2TCHCON X2 Teacher Report Self-Control 15,796 1–4 3.17 0.637 X2TCHPER X2 Teacher Report Interpersonal Skills 15,799 1–4 3.13 0.650 X2TCHEXT X2 Teacher Report Externalizing Problem Behaviors 15,903 1–4 1.64 0.639 X2TCHINT X2 Teacher Report Internalizing Problem Behaviors 15,865 1–4 1.51 0.498
X3TCHCON X3 Teacher Report Self-Control 4,658 1–4 3.21 0.591 X3TCHPER X3 Teacher Report Interpersonal Skills 4,724 1–4 3.14 0.613 X3TCHEXT X3 Teacher Report Externalizing Problem Behaviors 4,964 1–4 1.67 0.590 X3TCHINT X3 Teacher Report Internalizing Problem Behaviors 4,848 1–4 1.48 0.483
X4TCHCON X4 Teacher Report Self-Control 13,202 1–4 3.21 0.621 X4TCHPER X4 Teacher Report Interpersonal Skills 13,288 1–4 3.14 0.657 X4TCHEXT X4 Teacher Report Externalizing Problem Behaviors 13,398 1–4 1.73 0.619 X4TCHINT X4 Teacher Report Internalizing Problem Behaviors 13,306 1–4 1.55 0.508
X4KTCHCON X4K Teacher Report Self-Control 418 1–4 3.09 0.616 X4KTCHPER X4K Teacher Report Interpersonal Skills 418 1–4 3.04 0.671 X4KTCHEXT X4K Teacher Report Externalizing Problem Behaviors 419 1–4 1.78 0.614 X4KTCHINT X4K Teacher Report Internalizing Problem Behaviors 418 1–4 1.62 0.498 See notes at end of table.
25 Two versions of the teacher-level and child-level teacher questionnaires were used in the spring of first grade: one version for students who were in first grade or higher during the data collection period and one for students who had been retained in kindergarten for the 2011–12 school year. Details of the differences in these questionnaires are presented in chapter 2 of the ECLS-K:2011 User’s Manual for the ECLS-K:2011 Kindergarten–First Grade Data File and Electronic Codebook, Public Version (NCES 2015-078) (Tourangeau et al. 2015).
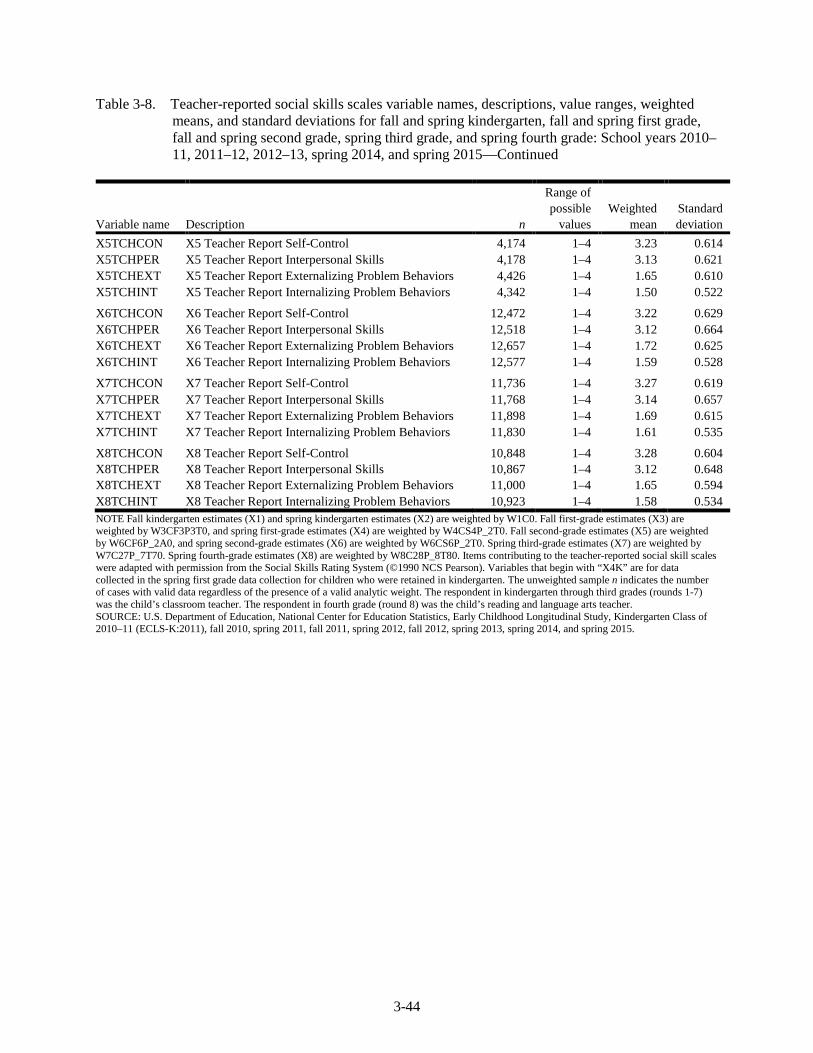
3-44
Table 3-8. Teacher-reported social skills scales variable names, descriptions, value ranges, weighted means, and standard deviations for fall and spring kindergarten, fall and spring first grade, fall and spring second grade, spring third grade, and spring fourth grade: School years 2010–11, 2011–12, 2012–13, spring 2014, and spring 2015—Continued
Variable name Description n
Range of possible
values Weighted
mean Standard deviation
X5TCHCON X5 Teacher Report Self-Control 4,174 1–4 3.23 0.614 X5TCHPER X5 Teacher Report Interpersonal Skills 4,178 1–4 3.13 0.621 X5TCHEXT X5 Teacher Report Externalizing Problem Behaviors 4,426 1–4 1.65 0.610 X5TCHINT X5 Teacher Report Internalizing Problem Behaviors 4,342 1–4 1.50 0.522
X6TCHCON X6 Teacher Report Self-Control 12,472 1–4 3.22 0.629 X6TCHPER X6 Teacher Report Interpersonal Skills 12,518 1–4 3.12 0.664 X6TCHEXT X6 Teacher Report Externalizing Problem Behaviors 12,657 1–4 1.72 0.625 X6TCHINT X6 Teacher Report Internalizing Problem Behaviors 12,577 1–4 1.59 0.528
X7TCHCON X7 Teacher Report Self-Control 11,736 1–4 3.27 0.619 X7TCHPER X7 Teacher Report Interpersonal Skills 11,768 1–4 3.14 0.657 X7TCHEXT X7 Teacher Report Externalizing Problem Behaviors 11,898 1–4 1.69 0.615 X7TCHINT X7 Teacher Report Internalizing Problem Behaviors 11,830 1–4 1.61 0.535
X8TCHCON X8 Teacher Report Self-Control 10,848 1–4 3.28 0.604 X8TCHPER X8 Teacher Report Interpersonal Skills 10,867 1–4 3.12 0.648 X8TCHEXT X8 Teacher Report Externalizing Problem Behaviors 11,000 1–4 1.65 0.594 X8TCHINT X8 Teacher Report Internalizing Problem Behaviors 10,923 1–4 1.58 0.534 NOTE Fall kindergarten estimates (X1) and spring kindergarten estimates (X2) are weighted by W1C0. Fall first-grade estimates (X3) are weighted by W3CF3P3T0, and spring first-grade estimates (X4) are weighted by W4CS4P_2T0. Fall second-grade estimates (X5) are weighted by W6CF6P_2A0, and spring second-grade estimates (X6) are weighted by W6CS6P_2T0. Spring third-grade estimates (X7) are weighted by W7C27P_7T70. Spring fourth-grade estimates (X8) are weighted by W8C28P_8T80. Items contributing to the teacher-reported social skill scales were adapted with permission from the Social Skills Rating System (©1990 NCS Pearson). Variables that begin with “X4K” are for data collected in the spring first grade data collection for children who were retained in kindergarten. The unweighted sample n indicates the number of cases with valid data regardless of the presence of a valid analytic weight. The respondent in kindergarten through third grades (rounds 1-7) was the child’s classroom teacher. The respondent in fourth grade (round 8) was the child’s reading and language arts teacher. SOURCE: U.S. Department of Education, National Center for Education Statistics, Early Childhood Longitudinal Study, Kindergarten Class of 2010–11 (ECLS-K:2011), fall 2010, spring 2011, fall 2011, spring 2012, fall 2012, spring 2013, spring 2014, and spring 2015.

3-45
Table 3-9. Teacher-reported social skill scales reliability estimates for fall and spring kindergarten, fall and spring first grade, fall and spring second grade, spring third grade, and spring fourth grade: School years 2010–11, 2011–12, 2012–13, spring 2014, and spring 2015
Variable name Description Number of items
Reliability coefficient
X1TCHCON X1 Teacher Report Self-Control 4 .81 X1TCHPER X1 Teacher Report Interpersonal Skills 5 .86 X1TCHEXT X1 Teacher Report Externalizing Problem Behaviors 5 .88 X1TCHINT X1 Teacher Report Internalizing Problem Behaviors 4 .79 X2TCHCON X2 Teacher Report Self-Control 4 .82 X2TCHPER X2 Teacher Report Interpersonal Skills 5 .87 X2TCHEXT X2 Teacher Report Externalizing Problem Behaviors 5 .89 X2TCHINT X2 Teacher Report Internalizing Problem Behaviors 4 .78 X3TCHCON X3 Teacher Report Self-Control 4 .79 X3TCHPER X3 Teacher Report Interpersonal Skills 5 .85 X3TCHEXT X3 Teacher Report Externalizing Problem Behaviors 5 .88 X3TCHINT X3 Teacher Report Internalizing Problem Behaviors 4 .77 X4TCHCON X4 Teacher Report Self-Control 4 .81 X4TCHPER X4 Teacher Report Interpersonal Skills 5 .86 X4TCHEXT X4 Teacher Report Externalizing Problem Behaviors 5 .86 X4TCHINT X4 Teacher Report Internalizing Problem Behaviors 4 .76 X4KTCHCON X4K Teacher Report Self-Control 4 .79 X4KTCHPER X4K Teacher Report Interpersonal Skills 5 .88 X4KTCHEXT X4K Teacher Report Externalizing Problem Behaviors 5 .87 X4KTCHINT X4K Teacher Report Internalizing Problem Behaviors 4 .73 X5TCHCON X5 Teacher Report Self-Control 4 .80 X5TCHPER X5 Teacher Report Interpersonal Skills 5 .85 X5TCHEXT X5 Teacher Report Externalizing Problem Behaviors 6 .88 X5TCHINT X5 Teacher Report Internalizing Problem Behaviors 4 .78 X6TCHCON X6 Teacher Report Self-Control 4 .81 X6TCHPER X6 Teacher Report Interpersonal Skills 5 .86 X6TCHEXT X6 Teacher Report Externalizing Problem Behaviors 6 .87 X6TCHINT X6 Teacher Report Internalizing Problem Behaviors 4 .78 X7TCHCON X7 Teacher Report Self-Control 4 .80 X7TCHPER X7 Teacher Report Interpersonal Skills 5 .86 X7TCHEXT X7 Teacher Report Externalizing Problem Behaviors 6 .87 X7TCHINT X7 Teacher Report Internalizing Problem Behaviors 4 .78 X8TCHCON X8 Teacher Report Self-Control 4 .80 X8TCHPER X8 Teacher Report Interpersonal Skills 5 .86 X8TCHEXT X8 Teacher Report Externalizing Problem Behaviors 6 .87 X8TCHINT X8 Teacher Report Internalizing Problem Behaviors 4 .79 NOTE: Items contributing to the teacher-reported social skill scales were adapted with permission from the Social Skills Rating System (SSRS) (©1990 NCS Pearson). The respondent in kindergarten through third grades (rounds 1-7) was the child’s classroom teacher. The respondent in fourth grade (round 8) was the child’s reading and language arts teacher. SOURCE: U.S. Department of Education, National Center for Education Statistics, Early Childhood Longitudinal Study, Kindergarten Class of 2010–11 (ECLS-K:2011), fall 2010, spring 2011, fall 2011, spring 2012, fall 2012, spring 2013, spring 2014, and spring 2015.

3-46
3.4.2 Teacher-Reported Approaches to Learning Items and Scale
The child-level teacher questionnaire fielded in every round of data collection from the fall of kindergarten to the spring of third grade and the child-level reading and language arts teacher subject-specific child-level teacher questionnaire in fourth grade included seven items, referred to as “Approaches to Learning” items, that asked the teachers to report how often their ECLS-K:2011 students exhibited a selected set of learning behaviors (keeps belongings organized; shows eagerness to learn new things; works independently; easily adapts to changes in routine; persists in completing tasks; pays attention well; and follows classroom rules).26 These items were presented in the same item set as the social skills items adapted from the Social Skills Rating System (described above in section 3.4.1), and teachers used the same frequency scale to report how often each child demonstrated the behaviors described. The Approaches to Learning scale score is the mean rating on the seven items included in the scale. A score was computed when the respondent provided a rating on at least 4 of the 7 items that composed the scale. Higher scale scores indicate that the child exhibited positive learning behaviors more often. The item-level data for the teacher-reported Approaches to Learning items are included in the data file along with the other child-level teacher questionnaire data. Variable names for the item-level data from the fall and spring kindergarten child-level teacher questionnaire begin with “T1” and “T2,” respectively. Variable names for the item-level data from the fall first-grade child-level teacher questionnaire begin with “T3.” Those for the item-level data from the spring first-grade child-level teacher questionnaire for children in first grade begin with “T4,” while those for children held back in kindergarten begin with “T4K.” Variable names for the fall of second grade begin with “T5,” and those for the spring of second grade begin with “T6.” Variable names for the spring of third grade begin with “T7,” and those for spring of fourth grade begin with “G8.” The variable names, descriptions, value ranges, weighted means, and standard deviations for the teacher-reported Approaches to Learning scale scores are shown in table 3-10. The Approaches to Learning scale has a reliability estimate of .91 for each round of data collection, as measured by Cronbach’s alpha. Additionally, the item-level data for the teacher-reported Approaches to Learning items are included in the data file along with the other child-level teacher questionnaire data.
26The Approaches to Learning teacher items were developed specifically for the ECLS-K; they are not taken from an existing source. These are the same items that were fielded as part of what was called the Teacher Social Rating Scale in the ECLS-K. The first six items (i.e., keeps belongings organized; shows eagerness to learn new things; works independently; easily adapts to changes in routine; persists in completing tasks; pays attention well) were included in the Teacher Social Rating Scale used in the kindergarten rounds of the ECLS-K. The seventh item (i.e., follows classroom rules) was added in the first-grade round of the ECLS-K.

3-47
Table 3-10. Teacher-reported Approaches to Learning scale variable names, descriptions, value ranges, weighted means, and standard deviations for fall and spring kindergarten, fall and spring first grade, fall and spring second grade, spring third grade, and spring fourth grade: School years 2010–11, 2011–12, 2012–13, spring 2014, and spring 2015
Variable name Description n
Range of possible
values Weighted
mean Standard deviation
X1TCHAPP X1 Teacher Report Approaches to Learning 14,770 1–4 2.93 0.680 X2TCHAPP X2 Teacher Report Approaches to Learning 15,978 1–4 3.09 0.689 X3TCHAPP X3 Teacher Report Approaches to Learning 5,022 1–4 3.04 0.677 X4TCHAPP X4 Teacher Report Approaches to Learning 13,449 1–4 3.07 0.700 X4KTCHAPP X4K Teacher Report Approaches to Learning 417 1–4 2.94 0.704 X5TCHAPP X5 Teacher Report Approaches to Learning 4,507 1–4 3.05 0.688 X6TCHAPP X6 Teacher Report Approaches to Learning 12,689 1–4 3.07 0.707 X7TCHAPP X7 Teacher Report Approaches to Learning 11,913 1–4 3.08 0.711 X8TCHAPP X8 Teacher Report Approaches to Learning 11,028 1–4 3.09 0.696 NOTE: Fall kindergarten estimates (X1) and spring kindergarten estimates (X2) are weighted by W1C0. Fall first-grade estimates (X3) are weighted by W3CF3P3T0, and spring first-grade estimates (X4) are weighted by W4CS4P_2T0. Fall second-grade estimates (X5) are weighted by W6CF6P_2A0, and spring second-grade estimates (X6) are weighted by W6CS6P_2T0. Spring third-grade estimates (X7) are weighted by W7C27P_7T70. Spring fourth-grade estimates (X8) are weighted by W8C28P_8T80. Variables that begin with “X4K” are for data collected in the spring first grade data collection for children who were retained in kindergarten. The unweighted sample n indicates the number of cases with valid data regardless of the presence of a valid analytic weight. The respondent in kindergarten through third grades (rounds 1-7) was the child’s classroom teacher. The respondent in fourth grade (round 8) was the child’s reading and language arts teacher. SOURCE: U.S. Department of Education, National Center for Education Statistics, Early Childhood Longitudinal Study, Kindergarten Class of 2010–11 (ECLS-K:2011), fall 2010, spring 2011, fall 2011, spring 2012, fall 2012, spring 2013, spring 2014, and spring 2015.
3.4.3 Teacher-Reported Attentional Focusing and Inhibitory Control: Children’s Behavior Questionnaire (CBQ) and Temperament in Middle Childhood Questionnaire (TMCQ)
The fall kindergarten, spring kindergarten, and spring first-grade child-level teacher questionnaires (both the version for students in first grade and the version for students in kindergarten) included 12 items from the Short Form of the Children’s Behavior Questionnaire (Putnam and Rothbart 2006)27 asking teachers to indicate how often their ECLS-K:2011 children exhibited certain social skills and behaviors related to inhibitory control and attentional focusing, two indicators related to executive functioning. Rothbart describes inhibitory control as the “capacity to plan and to suppress inappropriate approach responses under instructions or in novel or uncertain situations” (Rothbart et al. 2001, p. 1406). Teachers were presented with statements about how the children might have reacted to a number of situations in the past 6 months and were asked to indicate how “true” or “untrue” those statements were about that child on a 7-point scale ranging from “extremely untrue” to “extremely true,” with a middle option of “neither true nor untrue.” If a statement or situation did not apply to that child, the teacher could indicate “not applicable.”
27 The Children’s Behavior Questionnaire is a copyrighted instrument: Putnam, S. P., and Rothbart, M. K. (2006). Development of Short and Very Short Forms of the Children’s Behavior Questionnaire. Journal of Personality Assessment, 87(1): 103-113. Used with permission.

3-48
The CBQ is appropriate for assessment of children ages 3 through 7 years, so it could not be used past the first-grade rounds of data collection. To remain age appropriate, the CBQ was replaced with the Temperament in Middle Childhood Questionnaire (TMCQ) (Simonds and Rothbart 2004)28 in the spring of second grade. The TMCQ was designed as an upward age-extension of the CBQ and is appropriate for children ages 7 through 10 years. While many of the items from the TMCQ are different from the items on the CBQ, the items are believed to assess the same or similar constructs in an age-appropriate way. Teachers received the same instructions for the CBQ and TMCQ items, although the TMCQ items were rated on a 5-point scale instead of the 7-point scale used for the CBQ items. For the TMCQ items, teachers used a 5-point scale ranging from “almost always untrue” to “almost always true,” with a middle option of “sometimes true, sometimes untrue.” Like the CBQ, there was a “not applicable” option that the teacher could select if the statement or situation did not apply to the child.
Item-level data for the items that make up the Attentional Focusing and Inhibitory Control scales are provided on the kindergarten-fourth grade data file. Variable names for the item-level data from the fall and spring kindergarten child-level teacher questionnaire begin with “T1” and “T2,” respectively. Variable names for the item-level data from the spring first-grade child-level teacher questionnaire for children in first grade begin with “T4,” while variable names for children held back in kindergarten begin with “T4K.” Variable names for the spring second grade begin with “T6,” and those for spring third grade begin with “T7.” Variable names from the reading subject-specific child-level questionnaire in fourth grade begin with “G8.”
The data file includes two scale scores for each round of data collection in which each measure was included: (1) Attentional Focus and (2) Inhibitory Control. In kindergarten and first grade these scores are derived from the CBQ, and in second, third, and fourth grade these scores are derived primarily from the TMCQ, as explained further below. The scale scores were developed using guidelines from the developers of both the CBQ and TMCQ.
In kindergarten and first grade, the ECLS-K:2011 fielded all 6 items from the Attentional Focusing subscale and all 6 items from the Inhibitory Control subscale of the CBQ Short Form. As such, the kindergarten and first-grade Attentional Focus and Inhibitory Control scores are each based on all 6 items in the relevant Short Form subscale. Because the CBQ was initially designed as a parent-report measure, the item wording for 3 of the items from the CBQ Inhibitory Control subscale was modified slightly for use in the ECLS-K:2011 to make them more appropriate for a school setting.
28 The Temperament in Middle Childhood Questionnaire is a copyrighted instrument: Adapted from the Temperament in Middle Childhood Questionnaire. © 2004 Jennifer Simonds and Mary K. Rothbart, University of Oregon. Used with permission.

3-49
In second, third, and fourth grade, the ECLS-K:2011 fielded 6 of the 7 items from the original TMCQ Attentional Focusing subscale. For the inhibitory control dimension, the ECLS-K:2011 fielded 6 of the 8 items from the TMCQ Inhibitory Control subscale and one item from the CBQ Inhibitory Control subscale. Therefore, the second-, third-, and fourth-grade Attentional Focusing scale scores reflect the 6 items fielded by the ECLS-K:2011, not the full set of items in the original TMCQ scale. The second-, third-, and fourth-grade Inhibitory Control scale scores reflect the 7 items fielded by the ECLS-K:2011 (6 from the TMCQ and one from the CBQ), again not the full set of items in the original TMCQ scale. Because the TMCQ was designed as a parent-report measure, the item wording on one item from the TMCQ Attentional Focusing subscale was modified slightly to make it more appropriate for a school setting and, similarly, one item on the TMCQ Inhibitory Control subscale was modified.
For the kindergarten, first-grade, second-grade, third-grade, and fourth-grade Attentional Focusing and Inhibitory Control scales, the score on each scale is the mean rating on the items included in the scale. A score was computed when the respondent provided a rating on at least 4 of the 6 or 7 items that made up the scale. Higher scale scores on the Attentional Focus scale indicate that the child exhibited more behaviors that demonstrate the ability to focus attention on cues in the environment that are relevant to the task. Higher scale scores on the Inhibitory Control scale indicate that the child exhibited more behaviors that demonstrate the ability to hold back or suppress a behavior as necessary for a particular situation. The variable names, descriptions, value ranges, weighted means, and standard deviations for these scales are shown in tables 3-11 and 3-12.
Table 3-11. Children’s Behavior Questionnaire variable names, descriptions, value ranges, weighted means, and standard deviations for fall and spring kindergarten and spring first grade: School year 2010–11 and spring 2012
Variable name Description n
Range of possible
values Weighted
mean Standard deviation
X1ATTNFS X1 Teacher Report Attentional Focus 14,562 1–7 4.68 1.323 X1INBCNT X1 Teacher Report Inhibitory Control 14,556 1–7 4.88 1.291 X2ATTNFS X2 Teacher Report Attentional Focus 15,937 1–7 4.90 1.329 X2INBCNT X2 Teacher Report Inhibitory Control 15,925 1–7 5.06 1.292 X4ATTNFS X4 Teacher Report Attentional Focus 13,390 1–7 4.84 1.292 X4INBCNT X4 Teacher Report Inhibitory Control 13,399 1–7 5.04 1.287 X4KATTNFS X4K Teacher Report Attentional Focus 417 1–7 4.61 1.323 X4KINBCNT X4K Teacher Report Inhibitory Control 417 1–7 4.88 1.267 NOTE: Fall kindergarten estimates (X1) and spring kindergarten estimates (X2) are weighted by W1C0. Spring first-grade estimates (X4) are weighted by W4CS4P_2T0. Items contributing to these scales come from the Children’s Behavior Questionnaire (Putnam and Rothbart 2006). Variables that begin with “X4K” are for data collected in the spring first grade data collection for children who were retained in kindergarten. The unweighted sample n indicates the number of cases with valid data regardless of the presence of a valid analytic weight. SOURCE: U.S. Department of Education, National Center for Education Statistics, Early Childhood Longitudinal Study, Kindergarten Class of 2010–11 (ECLS-K:2011), fall 2010, spring 2011, and spring 2012.
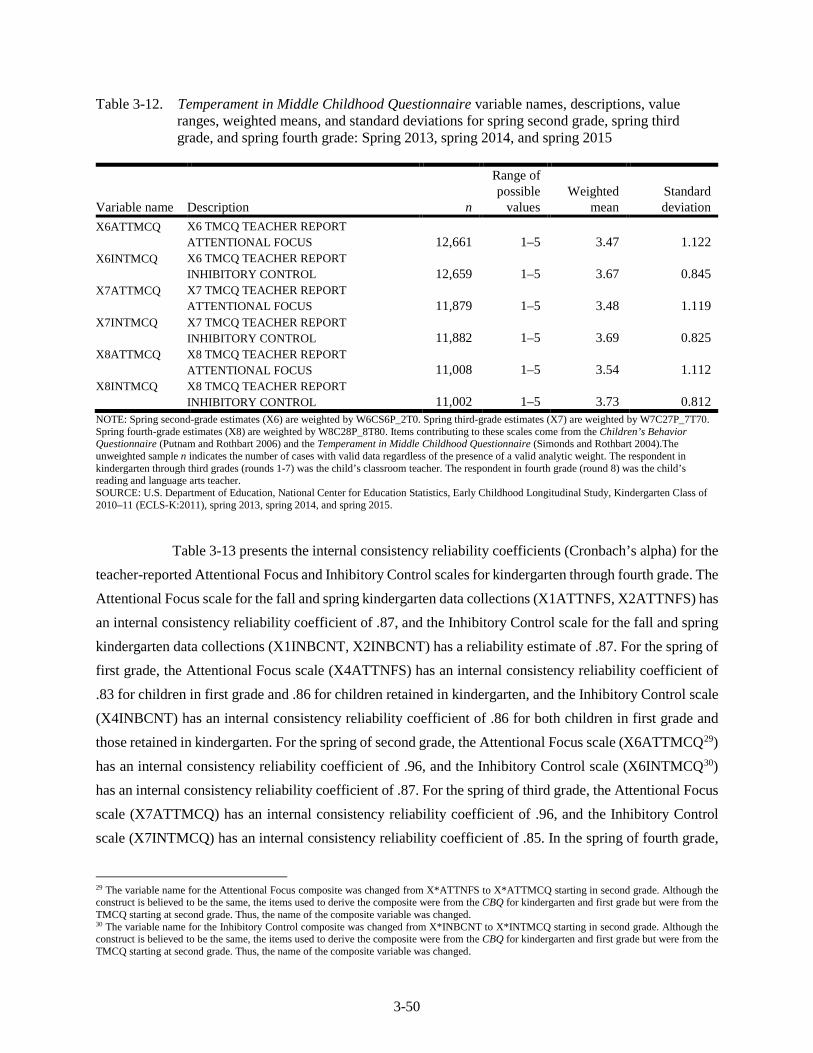
3-50
Table 3-12. Temperament in Middle Childhood Questionnaire variable names, descriptions, value ranges, weighted means, and standard deviations for spring second grade, spring third grade, and spring fourth grade: Spring 2013, spring 2014, and spring 2015
Variable name Description n
Range of possible
values Weighted
mean Standard deviation
X6ATTMCQ X6 TMCQ TEACHER REPORT ATTENTIONAL FOCUS 12,661 1–5 3.47 1.122
X6INTMCQ X6 TMCQ TEACHER REPORT INHIBITORY CONTROL 12,659 1–5 3.67 0.845
X7ATTMCQ X7 TMCQ TEACHER REPORT ATTENTIONAL FOCUS 11,879 1–5 3.48 1.119
X7INTMCQ X7 TMCQ TEACHER REPORT INHIBITORY CONTROL 11,882 1–5 3.69 0.825
X8ATTMCQ X8 TMCQ TEACHER REPORT ATTENTIONAL FOCUS 11,008 1–5 3.54 1.112
X8INTMCQ X8 TMCQ TEACHER REPORT INHIBITORY CONTROL 11,002 1–5 3.73 0.812
NOTE: Spring second-grade estimates (X6) are weighted by W6CS6P_2T0. Spring third-grade estimates (X7) are weighted by W7C27P_7T70. Spring fourth-grade estimates (X8) are weighted by W8C28P_8T80. Items contributing to these scales come from the Children’s Behavior Questionnaire (Putnam and Rothbart 2006) and the Temperament in Middle Childhood Questionnaire (Simonds and Rothbart 2004).The unweighted sample n indicates the number of cases with valid data regardless of the presence of a valid analytic weight. The respondent in kindergarten through third grades (rounds 1-7) was the child’s classroom teacher. The respondent in fourth grade (round 8) was the child’s reading and language arts teacher. SOURCE: U.S. Department of Education, National Center for Education Statistics, Early Childhood Longitudinal Study, Kindergarten Class of 2010–11 (ECLS-K:2011), spring 2013, spring 2014, and spring 2015.
Table 3-13 presents the internal consistency reliability coefficients (Cronbach’s alpha) for the teacher-reported Attentional Focus and Inhibitory Control scales for kindergarten through fourth grade. The Attentional Focus scale for the fall and spring kindergarten data collections (X1ATTNFS, X2ATTNFS) has an internal consistency reliability coefficient of .87, and the Inhibitory Control scale for the fall and spring kindergarten data collections (X1INBCNT, X2INBCNT) has a reliability estimate of .87. For the spring of first grade, the Attentional Focus scale (X4ATTNFS) has an internal consistency reliability coefficient of .83 for children in first grade and .86 for children retained in kindergarten, and the Inhibitory Control scale (X4INBCNT) has an internal consistency reliability coefficient of .86 for both children in first grade and those retained in kindergarten. For the spring of second grade, the Attentional Focus scale (X6ATTMCQ29) has an internal consistency reliability coefficient of .96, and the Inhibitory Control scale (X6INTMCQ30) has an internal consistency reliability coefficient of .87. For the spring of third grade, the Attentional Focus scale (X7ATTMCQ) has an internal consistency reliability coefficient of .96, and the Inhibitory Control scale (X7INTMCQ) has an internal consistency reliability coefficient of .85. In the spring of fourth grade,
29 The variable name for the Attentional Focus composite was changed from X*ATTNFS to X*ATTMCQ starting in second grade. Although the construct is believed to be the same, the items used to derive the composite were from the CBQ for kindergarten and first grade but were from the TMCQ starting at second grade. Thus, the name of the composite variable was changed. 30 The variable name for the Inhibitory Control composite was changed from X*INBCNT to X*INTMCQ starting in second grade. Although the construct is believed to be the same, the items used to derive the composite were from the CBQ for kindergarten and first grade but were from the TMCQ starting at second grade. Thus, the name of the composite variable was changed.

3-51
the internal consistency reliability coefficient is .96 for the Attentional Focus scale (X8ATTMCQ) and .85, for the Inhibitory Control scale (X8INTMCQ).
The study received copyright permission to include item-level data from both the CBQ and the TMCQ in the ECLS-K:2011 data files. Therefore, these data have been included in the kindergarten through fourth-grade data file with the other child-level teacher questionnaire data. Variable names for the item-level data from the fall of kindergarten, the spring of kindergarten, the spring of first grade, the spring of second grade, and the spring of third grade begin with “T1,” “T2,” “T4,” “T6,” and “T7,” respectively. Variable names from the item-level data from the spring of fourth grade begin with “G8.” Variable names that begin with “T4K” are for item-level data from the spring of first grade for students retained in kindergarten.
Table 3-13. Reliability estimates for the teacher-reported Attentional Focus and Inhibitory Control scales for fall and spring kindergarten, spring first grade, spring second grade, spring third grade, and spring fourth grade: School year 2010–11, spring 2012, spring 2013, spring 2014, and spring 2015
Variable name Description Number of items
Reliability coefficient
X1ATTNFS X1 Teacher Report Attentional Focus 6 .87 X1INBCNT X1 Teacher Report Inhibitory Control 6 .87 X2ATTNFS X2 Teacher Report Attentional Focus 6 .87 X2INBCNT X2 Teacher Report Inhibitory Control 6 .87 X4ATTNFS X4 Teacher Report Attentional Focus 6 .83 X4INBCNT X4 Teacher Report Inhibitory Control 6 .86 X4KATTNFS X4 Teacher Report Attentional Focus 6 .86 X4KINBCNT X4 Teacher Report Inhibitory Control 6 .86 X6ATTMCQ X6 TMCQ Teacher Report Attentional Focus 6 .96 X6INTMCQ X6 TMCQ Teacher Report Inhibitory Control 7 .87 X7ATTMCQ X7 TMCQ Teacher Report Attentional Focus 6 .96 X7INTMCQ X7 TMCQ Teacher Report Inhibitory Control 7 .85 X8ATTMCQ X8 TMCQ Teacher Report Attentional Focus 6 .96 X8INTMCQ X8 TMCQ Teacher Report Inhibitory Control 7 .85 NOTE: Items contributing to these scales come from the Children’s Behavior Questionnaire (Putnam and Rothbart 2006) and the Temperament in Middle Childhood Questionnaire (Simonds and Rothbart 2004). The respondent in kindergarten through third grades (Rounds 1-7) was the child’s classroom teacher. The respondent in fourth grade (Round 8) was the child’s reading and language arts teacher. SOURCE: U.S. Department of Education, National Center for Education Statistics, Early Childhood Longitudinal Study, Kindergarten Class of 2010–11 (ECLS-K:2011), fall 2010, spring 2011, spring 2012, spring 2013, spring 2014, and spring 2015.
3-52
3.4.4 Parent-Reported Working Memory
In third and fourth grade, parents reported on child behaviors related to working memory. In third grade, teachers also reported on child behaviors related to working memory. This section focuses on the parent-provided reports of working memory. For information on the teacher-provided reports of working memory from the third grade, refer to the User’s Manual for the ECLS-K:2011 Kindergarten–Third Grade Data File and Electronic Codebook, Public Version (NCES 2018-034).
Parents were asked 4 items as part of the parent interview in third and fourth grade.31 The items are 4 of the 10 items that make up the Parent Form of the Working Memory Scale of the Behavior Rating Inventory of Executive Function (BRIEF).32 Items from the BRIEF Working Memory Scale measure “the capacity to hold information in mind for the purpose of completing a task” (Gioia et al. 2000, p. 19). Parents were presented with statements that describe child behaviors related to working memory, and they were asked to rate how often (never, sometimes, or often) the child has had problems with these behaviors over the past 6 months.
Item-level data are provided on the kindergarten–fourth grade data file. Variables for the item-level data from the spring third grade parent interview begin with “P7.” Variables from the spring fourth grade parent interview begin with “P8.”
The data file also contains scale scores for parent-reported working memory in third and fourth grades (X7PWKMEM, X8PWKMEM). For the parent scale score, a score was computed when the respondent provided a rating on at least 3 of the 4 items that made up the scale. Scores on rated items were summed and divided by the number of items rated to derive the scale score. Higher scale scores indicate that the child exhibited more behaviors indicating problems with working memory. That is, higher scores indicate worse working memory. Lower scale scores indicate fewer difficulties related to working memory, and, therefore, indicate better working memory. The variable names, descriptions, value ranges, weighted means, and standard deviations for these scales are shown in table 3-14.
31 The items rated by parents were the same each round and matched the items from the Behavior Rating Inventory of Executive Function (BRIEF). The instructions were adapted from the instructions on the cover of the BRIEF questionnaire to be appropriate for the mode of data collection used in this study. The instructions were adapted to be as similar as possible to the intent of the BRIEF instructions. 32 ECLS-K:2011 used 4 of 10 items from the Parent Form of the BRIEF. The items used were adapted and reproduced by special permission of the Publisher, Psychological Assessment Resources, Inc., 16204 North Florida Avenue, Lutz, Florida 33549, from the Behavior Rating Inventory of Executive Function by Gerard A. Gioia, Peter K. Isquith, Steven C. Guy, and Lauren Kenworthy, Copyright 1996, 1998, 2000 by PAR, Inc. Further reproduction is prohibited without permission from PAR, Inc.

3-53
Table 3-15 presents internal consistency reliability coefficients (Cronbach’s alpha) for the parent Working Memory scale. The parent Working Memory scale has an internal consistency reliability coefficient of .81 in the spring of third grade and .83 in the spring of fourth grade.
Table 3-14. Parent-Reported Working Memory variable names, descriptions, value ranges, weighted means, and standard deviations for spring third grade and spring fourth grade: Spring 2014 and spring 2015
Variable name Description n
Range of possible
values Weighted
mean Standard deviation
X7PWKMEM X7 Parent Report Working Memory 10,689 1-3 1.70 0.535 X8PWKMEM X8 Parent Report Working Memory 10,297 1-3 1.71 0.547 NOTE: Spring third-grade estimates (X7) for parent-reported data are weighted by W7C27P_7A0. Spring fourth-grade estimates (X8) for parent-reported data are weighted by W8C28P_8A0. Items contributing to these scales come from the Working Memory Scale of the Behavior Rating Inventory of Executive Function (BRIEF) Teacher Form and Parent Form. The items used were adapted and reproduced by special permission of the Publisher, Psychological Assessment Resources, Inc., 16204 North Florida Avenue, Lutz, Florida 33549, from the Behavior Rating Inventory of Executive Function by Gerard A. Gioia, Peter K. Isquith, Steven C. Guy, and Lauren Kenworthy, Copyright 1996, 1998, 2000 by PAR, Inc. Further reproduction is prohibited without permission from PAR, Inc. The unweighted sample n indicates the number of cases with valid data regardless of the presence of a valid analytic weight. SOURCE: U.S. Department of Education, National Center for Education Statistics, Early Childhood Longitudinal Study, Kindergarten Class of 2010–11 (ECLS-K:2011), spring 2014 and spring 2015.
Table 3-15. Reliability estimates for the parent-reported Working Memory scores for spring third grade and spring fourth grade: Spring 2014 and spring 2015
Variable name Description Number of items
Reliability coefficient
X7PWKMEM X7 Parent Report Working Memory 4 .81 X8PWKMEM X8 Parent Report Working Memory 4 .83 NOTE: Items contributing to these scales come from the Working Memory Scale of the Behavior Rating Inventory of Executive Function (BRIEF) Parent Form. The items used were adapted and reproduced by special permission of the Publisher, Psychological Assessment Resources, Inc., 16204 North Florida Avenue, Lutz, Florida 33549, from the Behavior Rating Inventory of Executive Function by Gerard A. Gioia, Peter K. Isquith, Steven C. Guy, and Lauren Kenworthy, Copyright 1996, 1998, 2000 by PAR, Inc. Further reproduction is prohibited without permission from PAR, Inc. SOURCE: U.S. Department of Education, National Center for Education Statistics, Early Childhood Longitudinal Study, Kindergarten Class of 2010–11 (ECLS-K:2011), spring 2014 and spring 2015.
3.4.5 Teacher- and Parent-Reports of Children’s Peer Relationships
Teachers reported their perceptions of the child’s peer relationships in the child-level teacher questionnaire in spring of second grade and spring of third grade and in the reading subject-specific child-level teacher questionnaire in spring of fourth grade. Parents reported their perceptions of the child’s peer relationships in the parent interview.
Exhibit 3-5 shows the constructs on peer relationships included in the second-, third-, and fourth-grade child-level teacher questionnaires and the corresponding item-level variables along with their
3-54
sources. In second, third, and fourth grade, teachers provided information on peer victimization, both with the child as the victim and with the child as the aggressor. In the spring of third grade and spring of fourth grade, teachers were asked about whether the child was excluded or ignored by peers and about whether the child exhibited prosocial behaviors with peers. In the spring of fourth grade, teachers were asked about the behaviors of the peers in the child’s peer group and about the child’s social skills with peers. These items were adapted from existing scales and were used with the permission of the authors. Data for the individual items are included in the K-4 data file. Variable names for the item-level data from the child-level teacher questionnaire in the spring of second grade and the spring of third grade begin with “T6” and “T7,” respectively. Variable names from the item-level data from the reading subject-specific child-level teacher questionnaire for the spring of fourth grade begin with “G8.” Composite variables for each construct are not provided; it is left to analysts to decide how best to use these data in their analyses.
There are questions in the parent interview that complement the teacher-reported information on peer relationships. In addition to teacher-reported information on peer victimization in second, third, and fourth grades, parents provided information on peer victimization in second and third grade. In fourth grade, whereas teachers reported their perceptions of the child’s peer group, parents were asked how many close friends the child has and about the influence of the child’s best friend. Exhibit 3-6 shows the constructs on peer relationships included in the second-, third-, and fourth-grade parent interviews and the corresponding item-level variables along with their sources. The teacher- and parent-provided information complements information collected from children on peer victimization, which is described above in section 3.3. Children were asked only about their experiences as a victim, not as the aggressor.

3-55
Exhibit 3-5. Teacher-reported item-level variables on peer relationships in spring second grade, spring third grade, and spring fourth grade: Spring 2013, spring 2014, and spring 2015
Construct/scale Grade administered
Number of items Item-level variable names
Peer Victimization (child as victim)1
2-4 4 T6OSTEAS/T7OSTEAS/G8OSTEAS; T6OSLIES/T7OSLIES/G8OSLIES; T6OSPUSH/T7OSPUSH/G8OSPUSH; T6OSLFTO/T7OSLFTO/G8OSLFTO
Peer Victimization (child as aggressor)1
2-4 4 T6TSTEAS/T7TSTEAS/G8TSTEAS; T6TSLIES/T7TSLIES/G8TSLIES; T6TSPUSH/T7TSPUSH/G8TSPUSH; T6TSLFTO/T7TSLFTO/G8TSLFTO
Excluded by Peers2 3-4 4 T7PLYMTE/G8PLYMTE; T7PAVOID/G8PAVOID; T7EXLUED/G8EXLUED; T7IGNRED/G8IGNRED
Prosocial with Peers2 3-4 5 T7OTDIST/G8OTDIST; T7ISKIND/G8ISKIND; T7COPRTV/G8COPRTV; T7CNMORL/G8CNMORL; T7HLPUPS/G8HLPUPS
Positive Peer Group3 4 9 G8GOODGP, G8WORYGP, G8BADINF, G8SUPVIS, G8TRBLGP, G8EXCSTU, G8HRDWKR, G8FUNGRP, G8KINDGP
Social Skills with Peers4 4 4 G8UNDFEL, G8INTPER, G8SOLINT, G8EFFBEV
1 Peer victimization items were adapted from a 21-item scale by Espelage, D. L. and Holt, M. (2001). Bullying and victimization during early adolescence: Peer influences and psychosocial correlates. Journal of Emotional Abuse, 2: 123–142. 2 Adapted from the Child Behavior Scale © Gary W. Ladd. Used with permission. A subset of items from the Excluded by Peers and Prosocial with Peers scales from the Child Behavior Scale were adapted and used in the spring of third grade. 3 Adapted from Vandell, Deborah Lowe (2001). Relationships With Peers: Part D (Teacher). Unpublished scale, NICHD Study of Early Child Care and Youth Development, Form FSV10G3. These items reflect positive and negative peer group characteristics. The NICHD Study of Early Child Care and Youth Development decided to form one composite for “Positive Peer Group” with these items, reflecting 4 of the 9 items when creating a composite. 4 Adapted from Pierce, K. M., Hamm, J. V., and Vandell, D. L. (1999). Experiences in after-school programs and children's adjustment in first-grade classrooms. Child Development, 70, 756-767. These items include 4 of 7 items from the “Mock Report Card” (e.g., Form FSV08G3) used in the NICHD Study of Early Child Care and Youth Development and were originally adapted from Coie and Dodge (1988). SOURCE: U.S. Department of Education, National Center for Education Statistics, Early Childhood Longitudinal Study, Kindergarten Class of 2010–11 (ECLS-K:2011), spring 2013, spring 2014, and spring 2015.

3-56
Exhibit 3-6. Parent-reported item-level variables on peer relationships and friendships in spring second grade, spring third grade, and spring fourth grade: Spring 2013, spring 2014, and spring 2015
Construct/scale Number of items Response categories Item-level variable names Peer Victimization 1 3 (second grade) Yes, No P*OTHTEA
(child as victim) 4 (third grade) P7OTHLIE2 P*OTHHIT P*OTHEXC Peer Victimization 1 3 (second grade) Never, Sometimes, Often P*OFTTEA
(child as victim) 4 (third grade) P7OFTLIE2 P*OFTHIT P*OFTEXC Number of Close Friends 1 (fourth grade) Number P8NUMFRD Influence of Best Friend 1( fourth grade) Always a good influence,
Usually a good influence, Neither a good nor a bad influence, Usually a bad influence, Always a bad influence
P8FRINFL
1 Peer victimization items were adapted from a 21-item scale by Espelage, D. L. and Holt, M. (2001). Bullying and victimization during early adolescence: Peer influences and psychosocial correlates. Journal of Emotional Abuse, 2: 123–142. 2 In second grade, parents were not asked about whether other children told lies or untrue stories about their child. An item was added in third grade so that parents, teachers, and children were asked about the same forms of peer victimization. NOTE: An asterisk “*” is a placeholder for round number in variable names. Third grade is round 7, and fourth grade is round 8. For example, the variable P*OTHTEA is listed in the table; this indicates that the variables P7OTHTEA and P8OTHTEA are available in the dataset. SOURCE: U.S. Department of Education, National Center for Education Statistics, Early Childhood Longitudinal Study, Kindergarten Class of 2010–11 (ECLS-K:2011), spring 2013, spring 2014, and spring 2015.
3.4.6 Teacher- and Parent-Reports of Children’s School Liking and Avoidance
In the spring of fourth grade, teachers and parents reported their perceptions of the child’s school liking and avoidance behaviors using items adapted from the parent and teacher versions of the School Liking and Avoidance Questionnaire (SLAQ) (Ladd and Price 1987; Ladd 1990). Teachers rated perceptions of school liking with seven items, four positively worded items (e.g., “Likes to come to school”) and three negatively worded items (e.g., “Dislikes school”), on a 3-point Likert-type scale to indicate whether the item “doesn’t apply,” “applies sometimes,” or “certainly applies.” Ladd used these seven items to create a single teacher-reported school liking construct by combining these seven items (reverse scoring the negatively worded items). Parents rated five items about the parent’s perception of school avoidance behaviors on a 5-point Likert-type scale, using response items similar to the SLAQ (almost never, rarely, sometimes, a lot, almost always). Ladd used these five items to create a single parent-reported school

3-57
avoidance scale (exhibit 3-7). Composite variables for these teacher and parent constructs are not provided; it is left to analysts to decide how best to use these data in their analyses.
Exhibit 3-7. Teacher- and parent-reported item-level variables on school liking and avoidance in spring fourth grade: Spring 2015
Construct/scale Grade administered
Number of items Item-level variable names
Teacher-report School Liking1 4 7 G8LIKSCH, G8DISLSH, G8FUNSCH, G8LBESCH, G8UNHAPY, G8ENJACT, G8GRNACT
Parent-reported School Avoidance1 4 5 P8MKREAS, P8CDREAD, P8CUPSET, P8STAYHM, P8CMPLNS
1 Adapted from the parent and teacher versions of the School Liking and Avoidance Questionnaire (SLAQ; Adapted from Ladd and Price, 1987; Ladd, 1990) SOURCE: U.S. Department of Education, National Center for Education Statistics, Early Childhood Longitudinal Study, Kindergarten Class of 2010–11 (ECLS-K:2011), spring 2015.

This page intentionally left blank.

4-1
4. SAMPLE DESIGN AND SAMPLING WEIGHTS
The Early Childhood Longitudinal Study, Kindergarten Class of 2010–11 (ECLS-K:2011) provides national data on children’s characteristics as they progressed from kindergarten through the 2015–16 school year, when most of the children were in fifth grade. In the 2010–11 school year, the ECLS-K:2011 collected data from a nationally representative sample of 18,174 children enrolled in 968 schools.1 This chapter summarizes the process used to select the sample for the study in the base year (i.e., kindergarten), describes how the sample design changed for the first- through fourth-grade years, and provides information necessary to properly analyze the data that were collected.
4.1 Sample Design
The optimal sample design for collecting data to produce national child-level estimates is to sample children with probabilities that are approximately the same for each child. In most studies, this is achieved using a multistage sampling design that involves sampling primary sampling units (PSUs) and schools with probabilities proportional to the targeted number of children attending the school and selecting a fixed number of children per school. Such a sampling procedure was used for the ECLS-K:2011. Additionally, a clustered design was used to minimize data collection costs, which are strongly related to the dispersion of the children in the sample. Restricting data collection to a limited number of geographic areas and to as few schools as possible helps to minimize costs while still achieving an acceptable level of precision in the estimates produced with the data.
The sample for the ECLS-K:2011 was selected using a three-stage process. In the first stage
of sampling, the country was divided into primary sampling units (PSUs), or geographic areas that are counties or groups of contiguous counties, and 90 PSUs were sampled for inclusion in the study. In the second stage, samples of public and private schools with kindergarten programs or that educated children of kindergarten age (i.e., 5-year-old children) in ungraded settings were selected within the sampled PSUs. Both PSUs and schools were selected with probability proportional to measures of size (defined as the population of 5-year-old children) that took into account a desired oversampling of Asians, Native Hawaiians, and Other Pacific Islanders (APIs).2 In the third stage of sampling, children enrolled in kindergarten and 5-year-old children in ungraded schools or classrooms were selected within each sampled
1 This is the number of schools with at least one child or parent respondent at the end of the spring data collection; this number includes originally sampled schools and substitute schools. Children who transferred from the school in which they were originally sampled during the kindergarten year were retained in the study and followed into their new school; this number does not include schools to which study children transferred during the kindergarten year. 2 Asian, Native Hawaiian, and Other Pacific Islander children were oversampled as one group, not as three groups that were distinct from one another.

4-2
school. For a detailed description of the three stages of sampling, see chapter 4 of the Early Childhood Longitudinal Study, Kindergarten Class of 2010–11 (ECLS-K:2011), User’s Manual for the ECLS-K:2011 Kindergarten Data File and Electronic Codebook, Public Version (NCES 2015-074) (Tourangeau et al. 2015), hereinafter referred to as the base-year User’s Manual.
4.1.1 ECLS-K:2011 School Sample
A total of 1,221 clusters of schools3 were originally selected for the ECLS-K:2011, of which 1,003 were clusters of public schools and 218 were clusters of private schools. This resulted in 1,036 sampled public schools and 283 sampled private schools, for a total of 1,319 sampled schools.
The sample frames used to select schools were the 2006–07 Common Core of Data (CCD)
and the 2007–08 Private School Survey (PSS), which were the most recent CCD and PSS data available at the time of sampling. Because the 2006–07 CCD and the 2007–08 PSS school frames were several years old, additional schools were sampled from supplemental frames that included newly opened schools and existing schools that added a kindergarten program after the 2006–07 CCD and the 2007–08 PSS data were collected. These additional schools were added to the original school sample. In total, 33 new schools were added, of which 16 were public, 4 were Catholic, and 13 were non-Catholic private schools. The total number of sampled schools after updating was 1,352 (1,052 public schools and 300 private schools). For a detailed discussion of the supplemental school sample, see section 4.1.2.7 of the base-year User’s Manual.
Early in the process of recruiting schools that had been sampled for the study, it was
determined that the rate at which public schools were agreeing to participate was lower than expected and it would be difficult to meet the target number of participating schools by the end of the recruitment period. The decision was made to select public schools not selected into the original ECLS-K:2011 sample that would replace those sampled public schools that had already refused to participate. For a detailed discussion of school substitution, see section 4.1.2.8 of the base-year User’s Manual. The characteristics of the school sample are presented in table 4-1. This table includes characteristics for sampled schools after substitution, which makes it different from table 4-2 in the base-year User’s Manual, which shows characteristics for the originally sampled schools before substitution.
3 Public schools with fewer than 23 children and private schools with fewer than 12 children were clustered together for sampling. Thus, clusters of schools were sampled, each cluster comprising one or more schools. For a discussion of school clustering, see section 4.1.2.3 of the base-year User’s Manual.
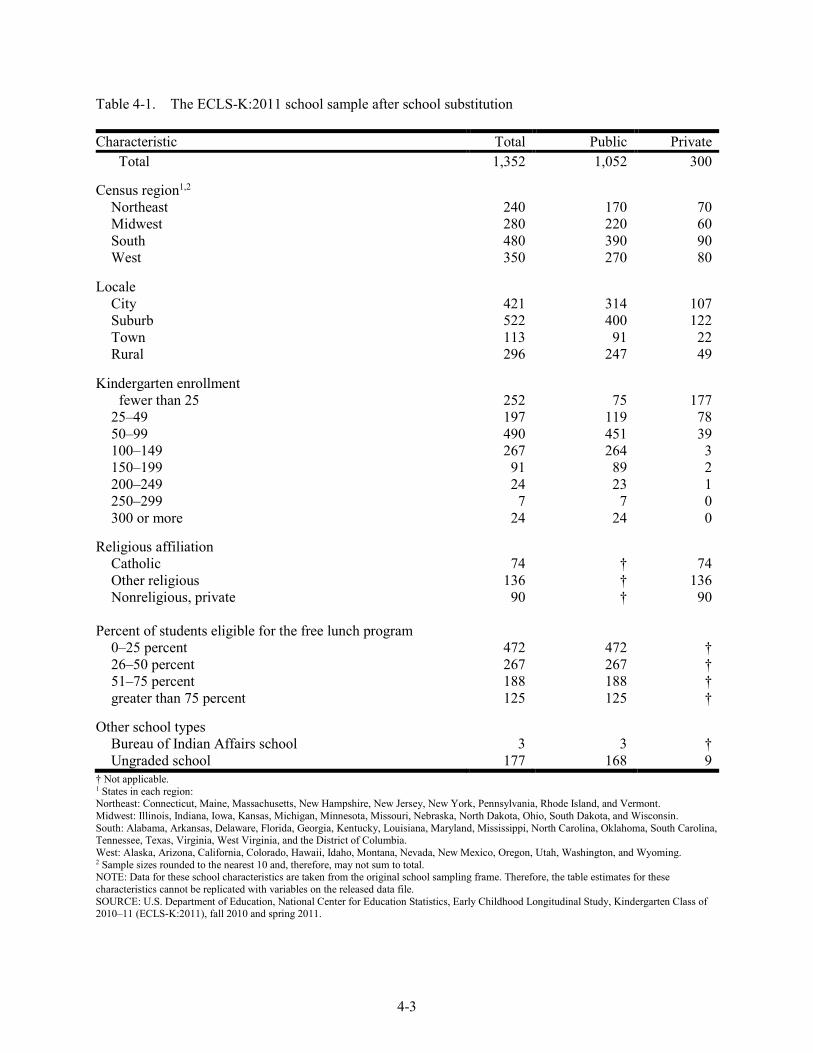
4-3
Table 4-1. The ECLS-K:2011 school sample after school substitution Characteristic Total Public Private
Total 1,352 1,052 300 Census region1,2
Northeast Midwest South West
240 280 480 350
170 220 390 270
70 60 90 80
Locale
City Suburb Town Rural
421 522 113 296
314 400 91
247
107 122
22 49
Kindergarten enrollment
fewer than 25 25–49 50–99 100–149 150–199 200–249 250–299 300 or more
252 197 490 267 91 24 7
24
75
119 451 264 89 23 7
24
177 78 39
3 2 1 0 0
Religious affiliation
Catholic Other religious Nonreligious, private
74
136 90
† † †
74
136 90
Percent of students eligible for the free lunch program
0–25 percent 26–50 percent 51–75 percent greater than 75 percent
472 267 188 125
472 267 188 125
† † † †
Other school types
Bureau of Indian Affairs school Ungraded school
3
177
3
168
† 9
† Not applicable. 1 States in each region: Northeast: Connecticut, Maine, Massachusetts, New Hampshire, New Jersey, New York, Pennsylvania, Rhode Island, and Vermont. Midwest: Illinois, Indiana, Iowa, Kansas, Michigan, Minnesota, Missouri, Nebraska, North Dakota, Ohio, South Dakota, and Wisconsin. South: Alabama, Arkansas, Delaware, Florida, Georgia, Kentucky, Louisiana, Maryland, Mississippi, North Carolina, Oklahoma, South Carolina, Tennessee, Texas, Virginia, West Virginia, and the District of Columbia. West: Alaska, Arizona, California, Colorado, Hawaii, Idaho, Montana, Nevada, New Mexico, Oregon, Utah, Washington, and Wyoming. 2 Sample sizes rounded to the nearest 10 and, therefore, may not sum to total. NOTE: Data for these school characteristics are taken from the original school sampling frame. Therefore, the table estimates for these characteristics cannot be replicated with variables on the released data file. SOURCE: U.S. Department of Education, National Center for Education Statistics, Early Childhood Longitudinal Study, Kindergarten Class of 2010–11 (ECLS-K:2011), fall 2010 and spring 2011.

4-4
4.1.2 The Sample of Children
The goal of the sample design was to obtain an approximately self-weighting sample of children, with the exception of Asians, Native Hawaiians, and Other Pacific Islanders (API) who needed to be oversampled to meet sample size goals. Table 4-2 shows the distribution of the eligible children sampled for the ECLS-K:2011, by selected characteristics. Table 4-3 shows the distribution of the children who were respondents in the base year, by selected characteristics. To be considered a base-year respondent, a student had to have child assessment data (defined as having at least one set of scoreable mathematics/reading/science data OR a height or weight measurement, or having been excluded from the assessment due to lack of accommodation for a disability) or parent interview data from the fall or spring data collection, or both, in the base year. Later rounds of data collection were conducted only with base-year respondents. Sampled students who did not participate in the base year were not recontacted for later rounds of data collection, and no new students were added to the study sample after the base year.
As mentioned in the base-year User’s Manual, operational problems prevented the study from
conducting data collection activities in some areas of the country where Asian, Native Hawaiian/Other Pacific Islander, and American Indian/Alaska Native students sampled for the study resided. For this reason, base-year response rates for these groups of students were lower than response rates for students of other racial/ethnic backgrounds. As a result, a relatively small number of ECLS-K:2011 sample children in the Native Hawaiian/Other Pacific Islander group resided in Hawaii. Additionally, nonresponse on the child assessment, parent interview, or both, leads to some of these sampled cases not being included in weighted analyses depending on the weight used. Also, none of the ECLS-K:2011 sample children in the American Indian/Alaska Native group resided in Alaska at the time of sampling. Users are encouraged to consider these sample characteristics when making statements about children in these two racial groups. As a reminder, however, the study was not designed to be representative at the state level or for subgroups within any specific racial or ethnic group.

4-5
Table 4-2. Number (unweighted) of eligible children sampled for the ECLS-K:2011, by selected characteristics: School year 2010–11
Characteristic Total Public school Private school
Total 20,234 17,733 2,501 Census region1,2,3
Northeast Midwest South West
3,500 4,240 7,230 5,270
2,930 3,520 6,620 4,660
570 710 610 610
Locale1,4
City Suburb Town Rural
6,675 7,657 1,557 4,345
5,822 6,461 1,383 4,067
853
1,196 174 278
Religious affiliation1
Catholic Other religious Nonreligious, private
974
1,002 525
† † †
974
1,002 525
Child’s race/ethnicity5
White, non-Hispanic Black, non-Hispanic Hispanic Asian, non-Hispanic Native Hawaiian/Other Pacific Islander, non-Hispanic American Indian or Alaska Native, non-Hispanic Other6
9,673 2,619 4,832 1,830
152 218 910
8,167 2,357 4,491 1,597
130 207 784
1,506
262 341 233
22 11
126 † Not applicable. 1 Data for this school characteristic are taken from the original school sampling frame. Therefore, the table estimates for this characteristic cannot be replicated with variables on the released data file. 2 States in each region: Northeast: Connecticut, Maine, Massachusetts, New Hampshire, New Jersey, New York, Pennsylvania, Rhode Island, and Vermont. Midwest: Illinois, Indiana, Iowa, Kansas, Michigan, Minnesota, Missouri, Nebraska, North Dakota, Ohio, South Dakota, and Wisconsin. South: Alabama, Arkansas, Delaware, Florida, Georgia, Kentucky, Louisiana, Maryland, Mississippi, North Carolina, Oklahoma, South Carolina, Tennessee, Texas, Virginia, West Virginia, and the District of Columbia. West: Alaska, Arizona, California, Colorado, Hawaii, Idaho, Montana, Nevada, New Mexico, Oregon, Utah, Washington, and Wyoming. 3 Sample sizes rounded to the nearest 10 and, therefore, may not sum to total. 4 Locale information was taken from the school sampling frame for most schools. For approximately 30 schools sampled via the new school procedure (see section 4.1.2.7 of the base-year User's Manual), locale information was not available in the school frame and was imputed for the estimates in this table. Imputed values for locale are not included in the data file. 5 Race/ethnicity information was obtained from schools at the time of sampling. 6 This category includes children who are more than one race (non-Hispanic) and children whose race/ethnicity is unknown. SOURCE: U.S. Department of Education, National Center for Education Statistics, Early Childhood Longitudinal Study, Kindergarten Class of 2010–11 (ECLS-K:2011), fall 2010 and spring 2011.

4-6
Table 4-3. Number (unweighted) of sampled children who are base-year respondents, by selected characteristics: School year 2010–11
Characteristic Total Public school Private school Total 18,174 15,953 2,221 Census region1,2,3
Northeast Midwest South West
3,010 3,870 6,640 4,660
2,540 3,220 6,070 4,130
470 650 570 530
Locale1,4
City Suburb Town Rural
6,014 6,793 1,405 3,962
5,252 5,746 1,254 3,701
762
1,047 151 261
Religious affiliation1
Catholic Other religious Nonreligious, private
863 903 455
† † †
863 903 455
Child’s race/ethnicity5
White, non-Hispanic Black, non-Hispanic Hispanic Asian, non-Hispanic Native Hawaiian/Other Pacific Islander,
non-Hispanic American Indian or Alaska Native,
non-Hispanic Two or more races Unknown
8,489 2,397 4,590 1,543
117
168 826 44
7,175 2,160 4,267 1,357
100
159 708 27
1,314
237 323 186
17
9
118 17
† Not applicable. 1 Data for this school characteristic are taken from the original school sampling frame. Therefore, the table estimates for this characteristic cannot be replicated with variables on the released data file. 2 States in each region: Northeast: Connecticut, Maine, Massachusetts, New Hampshire, New Jersey, New York, Pennsylvania, Rhode Island, and Vermont. Midwest: Illinois, Indiana, Iowa, Kansas, Michigan, Minnesota, Missouri, Nebraska, North Dakota, Ohio, South Dakota, and Wisconsin. South: Alabama, Arkansas, Delaware, Florida, Georgia, Kentucky, Louisiana, Maryland, Mississippi, North Carolina, Oklahoma, South Carolina, Tennessee, Texas, Virginia, West Virginia, and the District of Columbia. West: Alaska, Arizona, California, Colorado, Hawaii, Idaho, Montana, Nevada, New Mexico, Oregon, Utah, Washington, and Wyoming. 3 Sample sizes rounded to the nearest 10 and, therefore, may not sum to total. 4 Locale information was taken from the school sampling frame for most schools. For approximately 30 schools sampled via the new school procedure (see section 4.1.2.7 of the base-year User's Manual), locale information was not available in the school frame and was imputed for the estimates in this table. Imputed values for locale are not included in the data file. 5 Race/ethnicity information is from the fourth-grade race/ethnicity composite X_RACETH_R. The counts of children by race/ethnicity are slightly different from the counts in similar tables in the user’s manuals from previous years. X_RACETH_R was revised after every data collection. SOURCE: U.S. Department of Education, National Center for Education Statistics, Early Childhood Longitudinal Study, Kindergarten Class of 2010–11 (ECLS-K:2011), fall 2010 and spring 2011.

4-7
4.2 Sample Design for the First- Through Fourth-Grade Years
4.2.1 Fall First Grade and Fall Second Grade
This section describes the sample design for the fall data collections that occurred in first and second grades. Beginning with third grade, data collections occurred only in the spring of the school year. A subsample of students was selected for the fall first-grade and second-grade data collections from the full study sample described above via a three-step procedure. This subsample was designed to be representative of the full sample. In the first step, 30 PSUs were sampled from the 90 PSUs selected for the base year. Within the 30 subsampled PSUs, the 10 self-representing PSUs are large in population size and were included in the fall first-grade sample with certainty. The remaining 20 PSUs were selected from the 80 non-self-representing PSUs in 40 strata. To select the 20 non-self-representing PSUs, 20 strata were sampled with equal probability, and then one PSU was sampled within each stratum also with equal probabilities. This is equivalent to selection with probability proportional to size since the original PSU sample was selected with probability proportional to size.
In the second step, all schools within the 30 subsampled PSUs that were eligible for the base-
year collection were included in the fall subsample for both first and second grades. However, data collection was not conducted in the subsampled schools in which no children participated in the base year because the study did not try to recruit base-year nonrespondents for later rounds of data collections. Table 4-4 shows the characteristics of all fall subsampled schools in the 30 PSUs selected in the first stage of sampling.4 Table 4-5 shows the characteristics for the subsampled schools with base-year respondents; these are the schools in which data collection was conducted. Transfer schools (those schools that children moved into after the fall of kindergarten) are not included in this table. Of the 346 original sampled schools at the start of the fall data collections, 306 schools still cooperated in fall second grade. 5
In the third step of sampling, students attending the subsampled schools who were respondents
in the base year and who had not moved outside of the United States or died before the day assessments began in their school for the fall first-grade data collection were included as part of the fall sample for the first-grade data collection. This sample formed the base sample for the fall second-grade data collection as well, though subsampled children who had died or moved outside of the United States before the day
4 The fall second-grade data collection also included schools to which the children sampled for the fall collections in the third step of sampling had moved after sampling. These schools were not part of the original subsample selected in the second step of sampling and, therefore, are not included in table 4-4. 5After the base year, some original sampled schools no longer have students originally sampled in them, but the schools remain in the study because students originally sampled in other schools have moved into them. Other original sampled schools include both students originally sampled in them and transfer students.

4-8
assessments began in their school for the fall second-grade data collection were excluded. Table 4-6 shows the characteristics of base-year respondents in the fall subsample who were selected in the third sampling step.
Table 4-4. Number (unweighted) of original sampled schools in the 30 PSUs selected for the fall data
collections, by selected characteristics: Fall 2011 and fall 2012 Characteristic Total Public Private
Total 568 462 106 Census region1,2
Northeast Midwest South West
90
100 170 210
60 90
150 170
30 10 30 40
Locale3 City Suburb Town Rural
241 224 19 84
202 175 15 70
39 49
4 14
Religious affiliation Catholic Other religious Nonreligious, private
29 43 34
† † †
29 43 34
† Not applicable. 1 States in each region: Northeast: Connecticut, Maine, Massachusetts, New Hampshire, New Jersey, New York, Pennsylvania, Rhode Island, and Vermont. Midwest: Illinois, Indiana, Iowa, Kansas, Michigan, Minnesota, Missouri, Nebraska, North Dakota, Ohio, South Dakota, and Wisconsin. South: Alabama, Arkansas, Delaware, Florida, Georgia, Kentucky, Louisiana, Maryland, Mississippi, North Carolina, Oklahoma, South Carolina, Tennessee, Texas, Virginia, West Virginia, and the District of Columbia. West: Alaska, Arizona, California, Colorado, Hawaii, Idaho, Montana, Nevada, New Mexico, Oregon, Utah, Washington, and Wyoming. 2 Sample sizes rounded to the nearest 10 and, therefore, may not sum to total. 3 Locale information was taken from the school sampling frame for most schools. For a very small number of schools sampled via the new school procedure (see section 4.1.2.7 of the base-year User's Manual), locale information was not available in the school frame and was imputed for the estimates in this table. Imputed values for locale are not included in the data file. NOTE: Data for these school characteristics are taken from the original school sampling frame. Therefore, the table estimates for these characteristics cannot be replicated with variables on the released data file. SOURCE: U.S. Department of Education, National Center for Education Statistics, Early Childhood Longitudinal Study, Kindergarten Class of 2010–11 (ECLS-K:2011), fall 2011 and fall 2012.
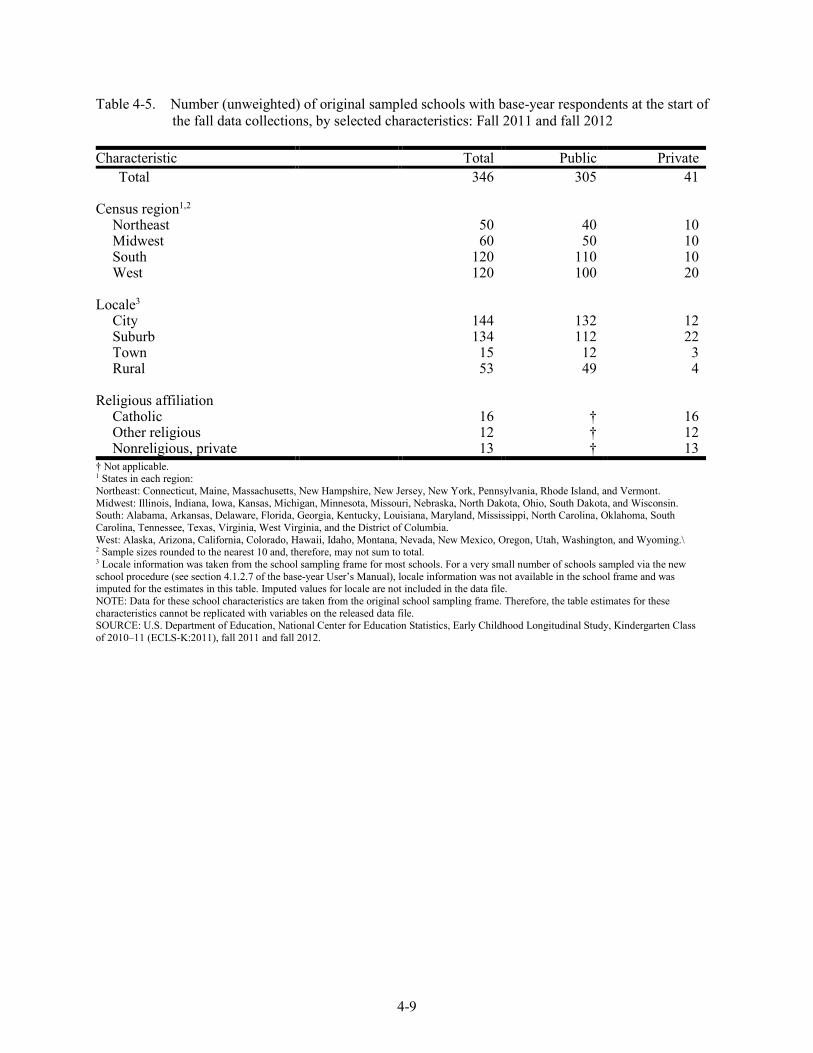
4-9
Table 4-5. Number (unweighted) of original sampled schools with base-year respondents at the start of the fall data collections, by selected characteristics: Fall 2011 and fall 2012
Characteristic Total Public Private
Total 346 305 41 Census region1,2
Northeast Midwest South West
50 60
120 120
40 50
110 100
10 10 10 20
Locale3 City Suburb Town Rural
144 134 15 53
132 112 12 49
12 22
3 4
Religious affiliation Catholic Other religious Nonreligious, private
16 12 13
† † †
16 12 13
† Not applicable. 1 States in each region: Northeast: Connecticut, Maine, Massachusetts, New Hampshire, New Jersey, New York, Pennsylvania, Rhode Island, and Vermont. Midwest: Illinois, Indiana, Iowa, Kansas, Michigan, Minnesota, Missouri, Nebraska, North Dakota, Ohio, South Dakota, and Wisconsin. South: Alabama, Arkansas, Delaware, Florida, Georgia, Kentucky, Louisiana, Maryland, Mississippi, North Carolina, Oklahoma, South Carolina, Tennessee, Texas, Virginia, West Virginia, and the District of Columbia. West: Alaska, Arizona, California, Colorado, Hawaii, Idaho, Montana, Nevada, New Mexico, Oregon, Utah, Washington, and Wyoming.\ 2 Sample sizes rounded to the nearest 10 and, therefore, may not sum to total. 3 Locale information was taken from the school sampling frame for most schools. For a very small number of schools sampled via the new school procedure (see section 4.1.2.7 of the base-year User’s Manual), locale information was not available in the school frame and was imputed for the estimates in this table. Imputed values for locale are not included in the data file. NOTE: Data for these school characteristics are taken from the original school sampling frame. Therefore, the table estimates for these characteristics cannot be replicated with variables on the released data file. SOURCE: U.S. Department of Education, National Center for Education Statistics, Early Childhood Longitudinal Study, Kindergarten Class of 2010–11 (ECLS-K:2011), fall 2011 and fall 2012.

4-10
Table 4-6. Number (unweighted) of base-year respondents in the fall first- and second-grade sample, by selected characteristics: Fall 2011 and fall 2012
Characteristic Total Public Private Total 6,109 5,458 651
Census region1,2,3
Northeast Midwest South West
820
1,120 2,000 2,170
730
1,010 1,840 1,880
90
110 170 280
Locale1,4 City Suburb Town Rural
2,549 2,461
250 849
2,295 2,101
227 835
254 360
23 14
Religious affiliation1 Catholic Other religious Nonreligious, private
242 233 176
† † †
242 233 176
Race/ethnicity5 White, non-Hispanic Black, non-Hispanic Hispanic Asian, non-Hispanic Native Hawaiian/Other Pacific
Islander, non-Hispanic American Indian or Alaska Native,
non-Hispanic Two or more races Unknown
2,261
676 2,289
476
33
117 244 13
1,917
612 2,156
422
27
110 207
7
344
64 133 54
6
7
37 6
† Not applicable. 1 Data for this school characteristic are taken from the original school sampling frame. Therefore, the table estimates for this characteristic cannot be replicated with variables on the released data file. 2 States in each region: Northeast: Connecticut, Maine, Massachusetts, New Hampshire, New Jersey, New York, Pennsylvania, Rhode Island, and Vermont. Midwest: Illinois, Indiana, Iowa, Kansas, Michigan, Minnesota, Missouri, Nebraska, North Dakota, Ohio, South Dakota, and Wisconsin. South: Alabama, Arkansas, Delaware, Florida, Georgia, Kentucky, Louisiana, Maryland, Mississippi, North Carolina, Oklahoma, South Carolina, Tennessee, Texas, Virginia, West Virginia, and the District of Columbia. West: Alaska, Arizona, California, Colorado, Hawaii, Idaho, Montana, Nevada, New Mexico, Oregon, Utah, Washington, and Wyoming. 3 Sample sizes rounded to the nearest 10 and, therefore, may not sum to total. 4 Locale information was taken from the school sampling frame for most schools. For a very small number of schools sampled via the new school procedure (see section 4.1.2.7 of the base-year User’s Manual), locale information was not available in the school frame and was imputed for the estimates in this table. Imputed values for locale are not included in the data file. 5 Race/ethnicity is from the fourth-grade race/ethnicity composite X_RACETH_R. The counts of children by race/ethnicity are slightly different from the counts in similar tables in the user’s manuals from previous years. X_RACETH_R was revised after every data collection. NOTE: A base-year respondent has child data (scoreable assessment data or height or weight measurements, or was excluded from assessment due to lack of accommodation for a disability) or parent interview data from at least one round of data collection in the base year. SOURCE: U.S. Department of Education, National Center for Education Statistics, Early Childhood Longitudinal Study, Kindergarten Class of 2010–11 (ECLS-K:2011), fall 2011 and fall 2012.

4-11
Tables 4-7 and 4-8 show the characteristics of base-year respondents in the fall samples, by whether the students were still in the original sampled schools or had transferred to other schools by the end of first grade and second grade, respectively.
Table 4-7 shows that 81 percent of students were still attending their original sampled schools
in the fall of first grade. Table 4-8 shows that 70 percent of students were still attending their original sampled schools in the fall of second grade. In the fall of first grade, the lowest percentages of students who were still attending their original sample schools are for students in non-Catholic private schools, students in the West, students in the suburbs, and Black students. The same is true for the fall of second grade with the percentage of students in non-Catholic private schools even lower than in first grade.6
6 Significance tests were not conducted for the comparisons in this chapter because the differences discussed were based on the same sample of base-year respondents.

4-12
Table 4-7. Number (unweighted) of base-year respondents in fall first grade, by type of sampled school and selected characteristics: Fall 2011
Characteristic Total Original
sampled school Transfer
school Percent in original
sampled school Total 6,109 4,945 1,164 80.9
School type1
Public Private
Catholic Other private
Unknown/home school
4,900
552 232 320 657
4,414
468 208 260 63
486 84 24 60
594
90.1 84.8 89.7 81.3 9.6
Census region1,2,3 Northeast Midwest South West Unknown
760 980
1,780 1,960
640
660 900
1,620 1,720
50
90 80
160 240 590
87.8 91.6 90.8 87.9 7.2
Locale1,4 City Suburb Town Rural Unknown
2,354 2,057
217 781 700
2,127 1,831
198 718 71
227 226 19 63
629
90.4 89.0 91.2 91.9 10.1
Race/ethnicity5 White, non-Hispanic Black, non-Hispanic Hispanic Asian, non-Hispanic Native Hawaiian/Other Pacific
Islander, non-Hispanic American Indian or Alaska Native,
non-Hispanic Two or more races Unknown
2,261
676 2,289
476
33
117 244 13
1,906
488 1,825
400
26
97 196
7
355 188 464 76
7
20 48 6
84.3 72.1 79.7 84.0
78.8
82.9 80.3 57.1
1 Because this table includes transfer schools that were not in the original school frame, school frame data could not be used for school characteristics. Data for school census region and school locale are taken from the first-grade composite variables X3REGION and X3LOCALE. There was no school administrator questionnaire in the fall of first grade. Therefore, the composite for school type, X3SCTYP, was constructed specially for the User’s Manual and not included in the data file. 2 States in each region: Northeast: Connecticut, Maine, Massachusetts, New Hampshire, New Jersey, New York, Pennsylvania, Rhode Island, and Vermont. Midwest: Illinois, Indiana, Iowa, Kansas, Michigan, Minnesota, Missouri, Nebraska, North Dakota, Ohio, South Dakota, and Wisconsin. South: Alabama, Arkansas, Delaware, Florida, Georgia, Kentucky, Louisiana, Maryland, Mississippi, North Carolina, Oklahoma, South Carolina, Tennessee, Texas, Virginia, West Virginia, and the District of Columbia. West: Alaska, Arizona, California, Colorado, Hawaii, Idaho, Montana, Nevada, New Mexico, Oregon, Utah, Washington, and Wyoming. 3 Sample sizes rounded to the nearest 10 and, therefore, may not sum to total. 4 Locale information was taken from the school sampling frame for most schools. For a very small number of schools sampled via the new school procedure (see section 4.1.2.7 of the base-year User’s Manual), locale information was not available in the school frame and was imputed for the estimates in this table. Imputed values for locale are not included in the data file. 5 Race/ethnicity is from the fourth-grade race/ethnicity composite X_RACETH_R. The counts of children by race/ethnicity are slightly different from the counts in similar tables in the user’s manuals from previous years. X_RACETH_R was revised after every data collection. NOTE: A base-year respondent has child data (scoreable assessment data or height or weight measurements, or was excluded from assessment due to lack of accommodation for a disability) or parent interview data from at least one round of data collection in the base year. SOURCE: U.S. Department of Education, National Center for Education Statistics, Early Childhood Longitudinal Study, Kindergarten Class of 2010–11 (ECLS-K:2011), fall 2011.

4-13
Table 4-8. Number (unweighted) of base-year respondents in the fall second grade, by type of sampled school and selected characteristics: Fall 2012
Characteristic Total Original
sampled school Transfer
school Percent in original
sampled school Total 6,109 4,274 1,835 70.0
School type1
Public Private
Catholic Other private
Unknown/home school
5,036
424 220 204 649
3,951
323 161 162
0
1,085
101 59 42
649
78.5 76.2 73.2 79.4 0.0
Census region1,2,3
Northeast Midwest South West Unknown
760 950
1,700 1,930
770
630 760
1,410 1,480
#
130 190 300 460 770
83.4 80.0 82.6 76.3 0.3
Locale1,4
City Suburb Town Rural Unknown
2,201 2,032
182 801 893
1,786 1,617
159 687 25
415 415 23
114 868
81.1 79.6 87.4 85.8 2.8
Race/ethnicity5 White, non-Hispanic Black, non-Hispanic Hispanic Asian, non-Hispanic Native Hawaiian/Other Pacific
Islander, non-Hispanic American Indian or Alaska Native,
non-Hispanic Two or more races Unknown
2,261
676 2,289
476
33
117 244 13
1,701
388 1,573
347
22
75 161
7
560 288 716 129
11
42 83 6
75.2 57.3 68.7 72.9
66.7
64.1 66.0 57.1
# Rounds to zero. 1 Because this table includes transfer schools that were not in the original school frame, school frame data could not be used for school characteristics. Data for school census region and school locale are taken from the second-grade composite variables X5REGION and X5LOCALE. There was no school administrator questionnaire in the fall of second grade; therefore, the composite for school type, X5SCTYP, was constructed specially for the User’s Manual and not included in the data file. 2 States in each region: Northeast: Connecticut, Maine, Massachusetts, New Hampshire, New Jersey, New York, Pennsylvania, Rhode Island, and Vermont. Midwest: Illinois, Indiana, Iowa, Kansas, Michigan, Minnesota, Missouri, Nebraska, North Dakota, Ohio, South Dakota, and Wisconsin. South: Alabama, Arkansas, Delaware, Florida, Georgia, Kentucky, Louisiana, Maryland, Mississippi, North Carolina, Oklahoma, South Carolina, Tennessee, Texas, Virginia, West Virginia, and the District of Columbia. West: Alaska, Arizona, California, Colorado, Hawaii, Idaho, Montana, Nevada, New Mexico, Oregon, Utah, Washington, and Wyoming. 3 Sample sizes rounded to the nearest 10 and, therefore, may not sum to total. 4 Locale information was taken from the school sampling frame for most schools. For a very small number of schools sampled via the new school procedure (see section 4.1.2.7 of the base-year User’s Manual), locale information was not available in the school frame and was imputed for the estimates in this table. Imputed values for locale are not included in the data file. 5 Race/ethnicity is from the fourth-grade race/ethnicity composite X_RACETH_R. The counts of children by race/ethnicity are slightly different from the counts in similar tables in the user’s manuals from previous years. X_RACETH_R was revised after every data collection. NOTE: A base-year respondent has child data (scoreable assessment data or height or weight measurements, or was excluded from assessment due to lack of accommodation for a disability) or parent interview data from at least one round of data collection in the base year. SOURCE: U.S. Department of Education, National Center for Education Statistics, Early Childhood Longitudinal Study, Kindergarten Class of 2010–11 (ECLS-K:2011), fall 2012.

4-14
4.2.2 Spring First Grade Through Spring Fourth Grade
All base-year respondents were statistically eligible for the spring data collections from first grade through fourth grade, with the exception of those who moved outside the United States or died before the assessments began in their school. Table 4-9 shows the characteristics of the original sample schools with base-year respondents in all 90 study PSUs. Transfer schools (those schools that children moved into after the fall of kindergarten) are not included in this table. Of the 989 original sampled schools at the start of the spring data collections, 910 cooperated in spring first grade, 896 cooperated in spring second grade, 891 cooperated in spring third grade, and 854 cooperated in spring fourth grade.
Table 4-9. Number (unweighted) of original sampled schools in the 90 PSUs selected for the spring data
collections with base-year respondents, by selected characteristics: Spring 2012, spring 2013, spring 2014, and spring 2015
Characteristic Tota1 Public Private
Total 989 858 131 Census region1,2
Northeast Midwest South West
170 200 360 260
150 150 330 230
30 40 40 30
Locale3
City Suburb Town Rural
321 357 86
225
278 302 73
205
43 55 13 20
Religious affiliation
Catholic Other religious Nonreligious, private
52 55 24
† † †
52 55 24
† Not applicable. 1 States in each region: Northeast: Connecticut, Maine, Massachusetts, New Hampshire, New Jersey, New York, Pennsylvania, Rhode Island, and Vermont. Midwest: Illinois, Indiana, Iowa, Kansas, Michigan, Minnesota, Missouri, Nebraska, North Dakota, Ohio, South Dakota, and Wisconsin. South: Alabama, Arkansas, Delaware, Florida, Georgia, Kentucky, Louisiana, Maryland, Mississippi, North Carolina, Oklahoma, South Carolina, Tennessee, Texas, Virginia, West Virginia, and the District of Columbia. West: Alaska, Arizona, California, Colorado, Hawaii, Idaho, Montana, Nevada, New Mexico, Oregon, Utah, Washington, and Wyoming. 2 Sample sizes rounded to the nearest 10 and, therefore, may not sum to total. 3 Locale information was taken from the school sampling frame for most schools. For approximately 30 schools sampled via the new school procedure (see section 4.1.2.7 of the base-year User’s Manual), locale information was not available in the school frame and was imputed for the estimates in this table. Imputed values for locale are not included in the data file. NOTE: Data for these school characteristics are taken from the original school sampling frame. Therefore, the table estimates for these characteristics cannot be replicated with variables on the released data file. SOURCE: U.S. Department of Education, National Center for Education Statistics, Early Childhood Longitudinal Study, Kindergarten Class of 2010–11 (ECLS-K:2011), spring 2012, spring 2013, spring 2014, and spring 2015.

4-15
The characteristics of base-year respondents who were eligible for the spring data collections for first through fourth grade are those presented above in table 4-3; since there was no subsampling for the spring rounds of data collection, all base-year respondents were initially eligible for data collection if they had not moved outside the United States or died prior to data collection. By the end of the fourth-grade data collections, about 180 base-year respondents had moved out the country and 5 had died.
Tables 4-10 to 4-13 show the characteristics of base-year respondents in the spring samples,
by whether the students were still in their original sampled schools or had transferred to other schools. In the spring of first grade, 78 percent of base-year respondents were still attending their original sampled schools. This percent is 68 for the spring of second grade, 59 for the spring of third grade, and 52 for the spring of fourth grade. As is seen with the fall subsample, the lowest percentages of students who were still attending their original sample schools in the spring of first grade are for students in non-Catholic private schools, students in the West, students in the suburbs, and Black students. For the spring of second grade and for third grade, the pattern is the same except that students in different types of private schools moved at about the same rate, while students in public schools moved at a higher rate than students in Catholic schools and in non-Catholic private schools, and students in the Northeast moved at a higher rate than students in other census regions. In fourth grade, the pattern is again similar to previous data collections. Namely, Black students moved at a higher rate, and so did students in the suburbs, students in the West, and students in non-Catholic private schools.
As discussed in chapter 2, in the spring of fourth grade separate child-/classroom-level
questionnaires were given to reading, mathematics, and science teachers to accommodate variations in the organization of instruction, with study children having different teachers for the different subject areas. Reading teacher questionnaires were distributed for all children. Mathematics teacher questionnaires were distributed for half of the children, and science teacher questionnaires were distributed for the other half. Selection was done with equal probability, using the third-grade response status of child and parent for stratification (respondent, nonrespondent/unknown eligibility, and ineligible/non-followed movers). There is a flag variable (X8MSFLAG) on the data file that indicates whether a child case was selected for mathematics (X8MSFLAG=0) or science (X8MSFLAG=1). Each teacher linked to a study child was also asked to complete a teacher-level questionnaire. Every teacher received the same teacher-level questionnaire; it was not tailored to a specific subject. Tables 4-14 and 4-15 show the characteristics of base-year respondents in fourth grade who were selected for the mathematics teacher questionnaires, and those who were selected for the science teacher questionnaires, respectively.

4-16
Table 4-10. Number (unweighted) of base-year respondents in spring first grade, by type of sampled school and selected characteristics: Spring 2012
Characteristic Total Original
sampled school Transfer
school Percent in original
sampled school Total 18,174 14,104 4,070 77.6
School type1
Public Private
Catholic Other private
Unknown/home school
13,772 1,946
774 1,172 2,456
12,361 1,736
726 1,010
7
1,411
210 48
162 2,449
89.8 89.2 93.8 86.2 0.3
Census region1,2,3 Northeast Midwest South West Unknown
2,600 3,280 5,690 4,160 2,460
2,350 2,960 5,190 3,600
10
250 320 490 560
2,500
90.5 90.2 91.3 86.5 0.3
Locale1,4 City Suburb Town Rural Unknown
5,231 5,613 1,221 3,344 2,765
4,643 4,961 1,140 3,162
198
588 652 81
182 2,567
88.8 88.4 93.4 94.6 7.2
Race/ethnicity5 White, non-Hispanic Black, non-Hispanic Hispanic Asian, non-Hispanic Native Hawaiian/Other Pacific
Islander, non-Hispanic American Indian or Alaska Native,
non-Hispanic Two or more races Unknown
8,489 2,397 4,590 1,543
117
168 826 44
6,822 1,624 3,540 1,254
87
122 634 21
1,667
773 1,050
289
30
46 192 23
80.4 67.8 77.1 81.3
74.4
72.6 76.8 47.7
1 Because this table includes transfer schools that were not in the original school frame, school frame data could not be used for school characteristics. Data for school census region and school locale are taken from the first grade composite variables X4SCTYP, X4REGION, and X4LOCALE. 2 States in each region: Northeast: Connecticut, Maine, Massachusetts, New Hampshire, New Jersey, New York, Pennsylvania, Rhode Island, and Vermont. Midwest: Illinois, Indiana, Iowa, Kansas, Michigan, Minnesota, Missouri, Nebraska, North Dakota, Ohio, South Dakota, and Wisconsin. South: Alabama, Arkansas, Delaware, Florida, Georgia, Kentucky, Louisiana, Maryland, Mississippi, North Carolina, Oklahoma, South Carolina, Tennessee, Texas, Virginia, West Virginia, and the District of Columbia. West: Alaska, Arizona, California, Colorado, Hawaii, Idaho, Montana, Nevada, New Mexico, Oregon, Utah, Washington, and Wyoming. 3 Sample sizes rounded to the nearest 10 and, therefore, may not sum to total. 4 Locale information was taken from the school sampling frame for most schools. For approximately 30 schools sampled via the new school procedure (see section 4.1.2.7 of the base-year User's Manual), locale information was not available in the school frame and was imputed for the estimates in this table. Imputed values for locale are not included in the data file. 5 Race/ethnicity is from fourth-grade race/ethnicity composite X_RACETH_R. The counts of children by race/ethnicity are slightly different from the counts in similar tables in the user’s manuals from previous years. X_RACETH_R was revised after every data collection. NOTE: A base-year respondent has child data (scoreable assessment data or height or weight measurements, or was excluded from assessment due to lack of accommodation for a disability) or parent interview data from at least one round of data collection in the base year. SOURCE: U.S. Department of Education, National Center for Education Statistics, Early Childhood Longitudinal Study, Kindergarten Class of 2010–11 (ECLS-K:2011), spring 2012.

4-17
Table 4-11. Number (unweighted) of base-year respondents in spring second grade, by type of sampled school and selected characteristics: Spring 2013
Characteristic Total Original
sampled school Transfer
school Percent in original
sampled school Total 18,174 12,274 5,900 67.5
School type1
Public Private
Catholic Other private
Unknown/home school
13,116 1,388
655 733
3,670
11,029 1,245
587 658
0
2,087
143 68 75
3,670
84.1 89.7 89.6 89.8 0.0
Census region1,2,3 Northeast Midwest South West Unknown
2,400 3,020 5,180 3,860 3,700
2,060 2,570 4,500 3,150
#
350 450 690 720
3,700
85.6 85.0 86.8 81.5 0.1
Locale1,4 City Suburb Town Rural Unknown
4,762 5,139 1,070 3,149 4,054
3,968 4,248
976 2,906
176
794 891 94
243 3,878
83.3 82.7 91.2 92.3 4.3
Race/ethnicity5 White, non-Hispanic Black, non-Hispanic Hispanic Asian, non-Hispanic Native Hawaiian/Other Pacific
Islander, non-Hispanic American Indian or Alaska Native,
non-Hispanic Two or more races Unknown
8,489 2,397 4,590 1,543
117
168 826 44
6,079 1,299 3,093 1,101
73
98
515 16
2,410 1,098 1,497
442
44
70 311 28
71.6 54.2 67.4 71.4
62.4
58.3 62.3 36.4
# Rounds to zero. 1 Because this table includes transfer schools that were not in the original school frame, school frame data could not be used for school characteristics. Data for school type, school census region, and school locale are taken from the second-grade composite variables X6SCTYP, X6REGION, and X6LOCALE. 2 States in each region: Northeast: Connecticut, Maine, Massachusetts, New Hampshire, New Jersey, New York, Pennsylvania, Rhode Island, and Vermont. Midwest: Illinois, Indiana, Iowa, Kansas, Michigan, Minnesota, Missouri, Nebraska, North Dakota, Ohio, South Dakota, and Wisconsin. South: Alabama, Arkansas, Delaware, Florida, Georgia, Kentucky, Louisiana, Maryland, Mississippi, North Carolina, Oklahoma, South Carolina, Tennessee, Texas, Virginia, West Virginia, and the District of Columbia. West: Alaska, Arizona, California, Colorado, Hawaii, Idaho, Montana, Nevada, New Mexico, Oregon, Utah, Washington, and Wyoming. 3 Sample sizes rounded to the nearest 10 and, therefore, may not sum to total. 4 Locale information was taken from the school sampling frame for most schools. For approximately 30 schools sampled via the new school procedure (see section 4.1.2.7 of the base-year User's Manual), locale information was not available in the school frame and was imputed for the estimates in this table. Imputed values for locale are not included in the data file. 5 Race/ethnicity is from fourth-grade race/ethnicity composite X_RACETH_R. The counts of children by race/ethnicity are slightly different from the counts in similar tables in the user’s manuals from previous years. X_RACETH_R was revised after every data collection. NOTE: A base-year respondent has child data (scoreable assessment data or height or weight measurements, or was excluded from assessment due to lack of accommodation for a disability) or parent interview data from at least one round of data collection in the base year. SOURCE: U.S. Department of Education, National Center for Education Statistics, Early Childhood Longitudinal Study, Kindergarten Class of 2010–11 (ECLS-K:2011), spring 2013.

4-18
Table 4-12. Number (unweighted) of base-year respondents in spring third grade, by type of sampled school and selected characteristics: Spring 2014
Characteristic Total Original
sampled school Transfer
school Percent in original
sampled school Total 18,174 10,641 7,533 58.6
School type1
Public Private
Catholic Other private
Unknown/home school
12,369 1,286
631 655
4,519
9,532 1,109
545 564
0
2,837
177 86 91
4519
77.1 86.2 86.4 86.1 0.0
Census region1,2,3 Northeast Midwest South West Unknown
2,280 2,850 4,840 3,700 4,520
1,740 2,210 3,860 2,840
0
550 640 970 860
4520
76.1 77.6 79.9 76.7 0.0
Locale1,4 City Suburb Town Rural Unknown
4,467 4,841
990 2,993 4,883
3,503 3,594
814 2574 156
964
1247 176 419
4727
78.4 74.2 82.2 86.0 3.2
Race/ethnicity5 White, non-Hispanic Black, non-Hispanic Hispanic Asian, non-Hispanic Native Hawaiian/Other Pacific
Islander, non-Hispanic American Indian or Alaska Native,
non-Hispanic Two or more races Unknown
8,489 2,397 4,590 1,543
117
168 826 44
5,317 1,059 2,684
978
63
85 440 15
3172 1338 1906 565
54
83
386 29
62.6 44.2 58.5 63.4
53.8
50.6 53.3 34.1
1 Because this table includes transfer schools that were not in the original school frame, school frame data could not be used for school characteristics. Data for school type, school census region, and school locale are taken from the third-grade composite variables X7SCTYP, X7REGION, and X7LOCALE. 2 States in each region: Northeast: Connecticut, Maine, Massachusetts, New Hampshire, New Jersey, New York, Pennsylvania, Rhode Island, and Vermont. Midwest: Illinois, Indiana, Iowa, Kansas, Michigan, Minnesota, Missouri, Nebraska, North Dakota, Ohio, South Dakota, and Wisconsin. South: Alabama, Arkansas, Delaware, Florida, Georgia, Kentucky, Louisiana, Maryland, Mississippi, North Carolina, Oklahoma, South Carolina, Tennessee, Texas, Virginia, West Virginia, and the District of Columbia. West: Alaska, Arizona, California, Colorado, Hawaii, Idaho, Montana, Nevada, New Mexico, Oregon, Utah, Washington, and Wyoming. 3 Sample sizes rounded to the nearest 10 and, therefore, may not sum to total. 4 Locale information was taken from the school sampling frame for most schools. For approximately 30 schools sampled via the new school procedure (see section 4.1.2.7 of the base-year User's Manual), locale information was not available in the school frame and was imputed for the estimates in this table. Imputed values for locale are not included in the data file. 5 Race/ethnicity is from the fourth-grade race/ethnicity composite X_RACETH_R. The counts of children by race/ethnicity are slightly different from the counts in similar tables in the user’s manuals from previous years. X_RACETH_R was revised after every data collection. NOTE: A base-year respondent has child data (scoreable assessment data or height or weight measurements, or was excluded from assessment due to lack of accommodation for a disability) or parent interview data from at least one round of data collection in the base year. SOURCE: U.S. Department of Education, National Center for Education Statistics, Early Childhood Longitudinal Study, Kindergarten Class of 2010–11 (ECLS-K:2011), spring 2014.

4-19
Table 4-13. Number (unweighted) of base-year respondents in spring fourth grade, by type of sampled school and selected characteristics: Spring 2015
Characteristic Total Original
sampled school Transfer
school Percent in original
sampled school Total 18,174 9,496 8,678 52.3
School type1
Public Private
Catholic Other private
Unknown/home school
11,770 1,198
590 608
5,206
8,493 1,003
503 500
0
3,277
195 87
108 5,206
72.2 83.7 85.3 82.2 0.0
Census region1,2,3 Northeast Midwest South West Unknown
2,160 2,710 4,560 3,540 5,210
1,470 2,010 3,440 2,570
0
690 700
1,120 970
5,210
68.2 74.3 75.4 72.7 0.0
Locale1,4 City Suburb Town Rural Unknown
4,113 5,422
851 2,237 5,551
3,071 3,824
630 1,848
123
1,042 1,598
221 389
5,428
74.7 70.5 74.0 82.6 2.2
Race/ethnicity5 White, non-Hispanic Black, non-Hispanic Hispanic Asian, non-Hispanic Native Hawaiian/Other Pacific
Islander, non-Hispanic American Indian or Alaska Native,
non-Hispanic Two or more races Unknown
8,489 2,397 4,590 1,543
117
168 826 44
4,766
908 2,426
862
54
79 387 14
3,723 1,489 2,164
681
63
89 439 30
56.1 37.9 52.9 55.9
46.2
47.0 46.9 31.8
1 Because this table includes transfer schools that were not in the original school frame, school frame data could not be used for school characteristics. Data for school type, school census region, and school locale are taken from the fourth-grade composite variables X8SCTYP, X8REGION, and X8LOCALE. 2 States in each region: Northeast: Connecticut, Maine, Massachusetts, New Hampshire, New Jersey, New York, Pennsylvania, Rhode Island, and Vermont. Midwest: Illinois, Indiana, Iowa, Kansas, Michigan, Minnesota, Missouri, Nebraska, North Dakota, Ohio, South Dakota, and Wisconsin. South: Alabama, Arkansas, Delaware, Florida, Georgia, Kentucky, Louisiana, Maryland, Mississippi, North Carolina, Oklahoma, South Carolina, Tennessee, Texas, Virginia, West Virginia, and the District of Columbia. West: Alaska, Arizona, California, Colorado, Hawaii, Idaho, Montana, Nevada, New Mexico, Oregon, Utah, Washington, and Wyoming. 3 Sample sizes rounded to the nearest 10 and, therefore, may not sum to total. 4 Locale information was taken from the school sampling frame for most schools. For approximately 30 schools sampled via the new school procedure (see section 4.1.2.7 of the base-year User's Manual), locale information was not available in the school frame and was imputed for the estimates in this table. Imputed values for locale are not included in the data file. 5 Race/ethnicity is from the fourth-grade race/ethnicity composite X_RACETH_R. NOTE: A base-year respondent has child data (scoreable assessment data or height or weight measurements, or was excluded from assessment due to lack of accommodation for a disability) or parent interview data from at least one round of data collection in the base year. SOURCE: U.S. Department of Education, National Center for Education Statistics, Early Childhood Longitudinal Study, Kindergarten Class of 2010–11 (ECLS-K:2011), spring 2015.
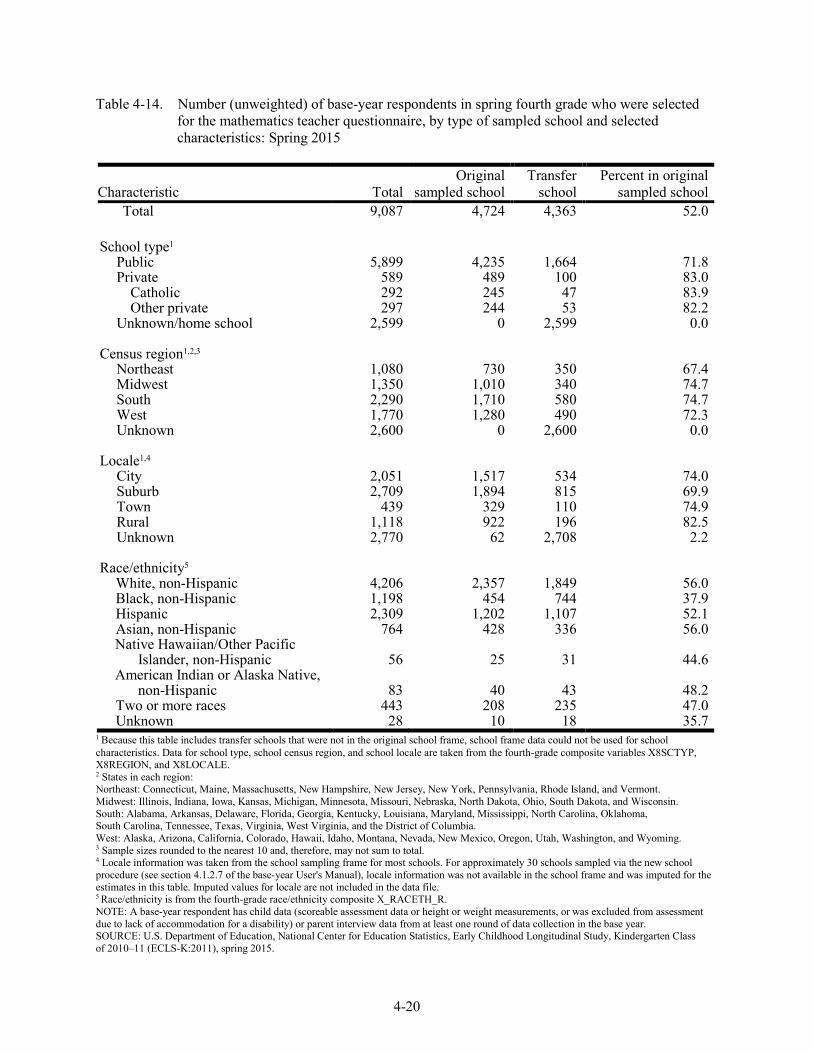
4-20
Table 4-14. Number (unweighted) of base-year respondents in spring fourth grade who were selected for the mathematics teacher questionnaire, by type of sampled school and selected characteristics: Spring 2015
Characteristic Total Original
sampled school Transfer
school Percent in original
sampled school Total 9,087 4,724 4,363 52.0
School type1
Public Private
Catholic Other private
Unknown/home school
5,899
589 292 297
2,599
4,235
489 245 244
0
1,664
100 47 53
2,599
71.8 83.0 83.9 82.2 0.0
Census region1,2,3 Northeast Midwest South West Unknown
1,080 1,350 2,290 1,770 2,600
730
1,010 1,710 1,280
0
350 340 580 490
2,600
67.4 74.7 74.7 72.3 0.0
Locale1,4 City Suburb Town Rural Unknown
2,051 2,709
439 1,118 2,770
1,517 1,894
329 922 62
534 815 110 196
2,708
74.0 69.9 74.9 82.5 2.2
Race/ethnicity5 White, non-Hispanic Black, non-Hispanic Hispanic Asian, non-Hispanic Native Hawaiian/Other Pacific
Islander, non-Hispanic American Indian or Alaska Native,
non-Hispanic Two or more races Unknown
4,206 1,198 2,309
764
56
83 443 28
2,357
454 1,202
428
25
40 208 10
1,849
744 1,107
336
31
43 235 18
56.0 37.9 52.1 56.0
44.6
48.2 47.0 35.7
1 Because this table includes transfer schools that were not in the original school frame, school frame data could not be used for school characteristics. Data for school type, school census region, and school locale are taken from the fourth-grade composite variables X8SCTYP, X8REGION, and X8LOCALE. 2 States in each region: Northeast: Connecticut, Maine, Massachusetts, New Hampshire, New Jersey, New York, Pennsylvania, Rhode Island, and Vermont. Midwest: Illinois, Indiana, Iowa, Kansas, Michigan, Minnesota, Missouri, Nebraska, North Dakota, Ohio, South Dakota, and Wisconsin. South: Alabama, Arkansas, Delaware, Florida, Georgia, Kentucky, Louisiana, Maryland, Mississippi, North Carolina, Oklahoma, South Carolina, Tennessee, Texas, Virginia, West Virginia, and the District of Columbia. West: Alaska, Arizona, California, Colorado, Hawaii, Idaho, Montana, Nevada, New Mexico, Oregon, Utah, Washington, and Wyoming. 3 Sample sizes rounded to the nearest 10 and, therefore, may not sum to total. 4 Locale information was taken from the school sampling frame for most schools. For approximately 30 schools sampled via the new school procedure (see section 4.1.2.7 of the base-year User's Manual), locale information was not available in the school frame and was imputed for the estimates in this table. Imputed values for locale are not included in the data file. 5 Race/ethnicity is from the fourth-grade race/ethnicity composite X_RACETH_R. NOTE: A base-year respondent has child data (scoreable assessment data or height or weight measurements, or was excluded from assessment due to lack of accommodation for a disability) or parent interview data from at least one round of data collection in the base year. SOURCE: U.S. Department of Education, National Center for Education Statistics, Early Childhood Longitudinal Study, Kindergarten Class of 2010–11 (ECLS-K:2011), spring 2015.

4-21
Table 4-15. Number (unweighted) of base-year respondents in spring fourth grade who were selected for the science teacher questionnaire, by type of sampled school and selected characteristics: Spring 2015
Characteristic Total Original
sampled school Transfer
school Percent in original
sampled school Total 9,087 4,772 4,315 52.5
School type1
Public Private
Catholic Other private
Unknown/home school
5,871
609 298 311
2,607
4,258
514 258 256
0
1,613
95 40 55
2,607
72.5 84.4 86.6 82.3 0.0
Census region1,2,3 Northeast Midwest South West Unknown
1,080 1,360 2,280 1,770 2,610
740
1,000 1,740 1,290
0
330 350 540 480
2,610
68.9 73.9 76.2 73.1 0.0
Locale1,4 City Suburb Town Rural Unknown
2,062 2,713
412 1,119 2,781
1,554 1,930
301 926 61
508 783 111 193
2,720
75.4 71.1 73.1 82.8 2.2
Race/ethnicity5 White, non-Hispanic Black, non-Hispanic Hispanic Asian, non-Hispanic Native Hawaiian/Other Pacific
Islander, non-Hispanic American Indian or Alaska Native,
non-Hispanic Two or more races Unknown
4,283 1,199 2,281
779
61
85 383 16
2,409
454 1,224
434
29
39 179
4
1,874
745 1,057
345
32
46 204 12
56.2 37.9 53.7 55.7
47.5
45.9 46.7 25.0
1 Because this table includes transfer schools that were not in the original school frame, school frame data could not be used for school characteristics. Data for school type, school census region, and school locale are taken from the fourth-grade composite variables X8SCTYP, X8REGION, and X8LOCALE. 2 States in each region: Northeast: Connecticut, Maine, Massachusetts, New Hampshire, New Jersey, New York, Pennsylvania, Rhode Island, and Vermont. Midwest: Illinois, Indiana, Iowa, Kansas, Michigan, Minnesota, Missouri, Nebraska, North Dakota, Ohio, South Dakota, and Wisconsin. South: Alabama, Arkansas, Delaware, Florida, Georgia, Kentucky, Louisiana, Maryland, Mississippi, North Carolina, Oklahoma, South Carolina, Tennessee, Texas, Virginia, West Virginia, and the District of Columbia. West: Alaska, Arizona, California, Colorado, Hawaii, Idaho, Montana, Nevada, New Mexico, Oregon, Utah, Washington, and Wyoming. 3 Sample sizes rounded to the nearest 10 and, therefore, may not sum to total. 4 Locale information was taken from the school sampling frame for most schools. For approximately 30 schools sampled via the new school procedure (see section 4.1.2.7 of the base-year User's Manual), locale information was not available in the school frame and was imputed for the estimates in this table. Imputed values for locale are not included in the data file. 5 Race/ethnicity is from the fourth-grade race/ethnicity composite X_RACETH_R. NOTE: A base-year respondent has child data (scoreable assessment data or height or weight measurements, or was excluded from assessment due to lack of accommodation for a disability) or parent interview data from at least one round of data collection in the base year. SOURCE: U.S. Department of Education, National Center for Education Statistics, Early Childhood Longitudinal Study, Kindergarten Class of 2010–11 (ECLS-K:2011), spring 2015.

4-22
4.2.3 Following Movers
Sections 4.2.1 and 4.2.2 discuss the samples of eligible students included in the fall and spring data collections in first and second grades and in the spring data collections in third and fourth grades. As noted, students who moved outside the United States or died prior to data collection in their schools became ineligible for the study. Their exclusion represents a limitation on the population to which the study generalizes in later rounds of data collection. For example, the data collected in spring 2014 are representative of the experiences of children in the kindergarten class of 2010–11 who were living in the United States in the spring of 2014.
In order to control data collection costs, there are some students who are part of the statistical
samples for the first-, second-, third-, and fourth-grade data collections but were excluded from actual data collection. These students, while statistically eligible for the study, were operationally ineligible. Specifically, not all students who moved away from their original base-year schools after the spring base-year data collection (known as “movers”) were followed into their new schools. While some movers were followed with certainty, some subsampling of other movers occurred, as described below. Although information was not collected from all students in every round, the study sampling procedures, combined with the use of sampling weights that include mover subsampling adjustments (described below in section 4.3.2.2) in data analysis, result in the collected data being representative of the students in the kindergarten class of 2010–11 who remain living in the United States.
Homeschooled children (i.e., those who were enrolled in a school at the time of sampling in
the base year but left school to become homeschooled) were followed with certainty; they were assessed in their home if there was parental consent to do so.
Destination schools. When four or more students moved from an original sampled school into
the same transfer school, all those movers were followed into the new school, which is referred to as a destination school. This type of movement occurred for children who attended sampled schools that ended at a particular grade, which are referred to as terminal schools. For example, study students who attended an original sample school that ended with third grade would move as a group to a new school for fourth grade. In some cases, an original sample school did not terminate in a particular grade, but for some reason four or more students from that school moved together into the same transfer school for the subsequent data collections. For example, this would happen if an original sample school closed after the spring third-grade data collection. More than one destination school may be identified for an original school if separate clusters of four or more students moved into different transfer schools.

4-23
Language minority (LM) students, students with an Individualized Education Program (IEP), and students who had an Individualized Family Service Plan (IFSP). Students who were identified as language minority (LM) based on parent report of home language in the base year, as well as students identified as currently having an Individualized Education Program (IEP), or who had an Individualized Family Service Plan (IFSP) were followed at a rate of 100 percent in fourth grade. The IEP status of the child was obtained during the preassessment call when the team leader asked the school coordinator whether the child had an IEP or equivalent program on record with the school. The school records also may have indicated that a child had an IFSP when he or she was younger, even if the child did not have an IEP at the time of data collection, which the team leader could have noted during the call. Additionally, information about whether a child had had an IFSP prior to kindergarten was collected in the base-year parent interview. Due to an identification error before third grade, a number of these children who moved from their originally sampled school were not flagged to be followed with certainty in first grade and second grade. Despite this lack of sample protection, approximately 92 percent of the students who had had an IFSP were followed into second grade, either because they did not change schools, they had an IEP and became part of the protected group as a result of the IEP, or because they were part of the mover subsample that was followed at a rate of 50 percent.7 In third grade, the identification error was corrected, and an additional 350 students who had had an IFSP were identified and followed with certainty. In fourth grade, about 590 were followed with certainly, and about 520 had child or parent data.
General procedures for all other movers. Fifty percent of students who did not meet one of
the criteria described above (i.e., did not move to a destination school, were not LM, and did not have an IEP) were sampled with equal probability to be flagged as “follow” if they moved from their original sample school. If a student was flagged as “do not follow,” no data were collected for him or her.
7 There are some differences between the group of IFSP children who were followed and those who were not. However, some of these differences appear to be related to the likelihood that a child had an IEP (and, therefore, whether the child became part of the protected group as a result of the IEP). For example, compared to those IFSP children who were not followed, a higher percentage of IFSP children who were followed attended public schools, which are required to provide disability services through an IEP. The subsampling process itself should not have introduced bias into the sample of IFSP children who were followed, because cases were randomly flagged to be followed. Additionally, the sampling weights developed for use with second-grade data account for this random subsampling. A comparison of key weighted estimates (such as school type, region of residence, school locale, percent of students in the school who were races other than White, and student race/ethnicity, gender, and year of birth) between kindergarten and first grade generally suggests the loss of those children who were not followed has little impact on the overall estimates for children who had IFSPs before age 3. Where slight differences between the kindergarten and first-grade estimates were noticed (for example, in the percent of students of race other than White in a school), the pattern with the sample of IFSP children is reflective of differences seen in the full ECLS-K:2011 sample. Also, it should be kept in mind that identifying a child to be followed with certainty does not necessarily mean that the child would have participated in the round(s) in which he or she was followed. Due to general sample attrition, the IFSP students who were not flagged to be followed with certainty constitute only about half of all IFSP children who did not participate in first grade and second grade. It is unlikely that differences in weighted estimates for the entire group of IFSP children (about 680) are due solely to the absence of the approximately 60 IFSP cases that were not followed neither in first grade nor in second grade. Nonparticipation of IFSP children in later rounds of the study for any reason does reduce the IFSP sample available for analysis. As is the case for analysis of any small subgroup, users should consider the size of their analytic sample and whether there is enough power in the data to make generalizations about the groups being examined.

4-24
Students flagged as “do not follow” were not sought for participation in any further data collection unless they were part of the fall subsample, as explained further below. If a student was flagged as “follow,” and
1. the student moved into a school in a study PSU: the student was included in all aspects
of data collection (child assessment, child questionnaire, parent interview, school administrator questionnaire, and teacher questionnaires);
2. the student moved into a school outside a study PSU: only a parent interview was attempted; and,
3. the student moved into a school outside the country: the student was out of scope and considered ineligible for continuation in the study.
Procedures for students in the fall subsample. Fifty percent of all students in the subsample had their follow flag set to “follow” after the base-year data collection. Children were sampled with equal probability to be flagged as “follow,” meaning that if they transferred to a new school they would be followed into that new school for the fall first- and second- grade data collections. As explained in detail below, all students who were subsampled in the fall, regardless of their mover status, were followed in the spring data collections. As a result of these procedures, some subsample students were not followed in the fall collections, because their follow flag applicable to the fall collections was set to “not follow,” but they were followed in the spring collections.
Procedures for students in the spring main sample. Fifty percent of the schools in the main
sample were subsampled with equal probability to have follow flags (i.e., all students in the 50 percent subsample of schools have flags set to “follow”) applicable for the spring data collections. All fall schools in the 30 sampled PSUs were included in the “mover follow” sample for the spring of first, second, third, and fourth grade. An additional sample of schools that were not part of the fall subsample was selected to arrive at 50 percent of the entire sample of schools being included in the “mover follow” subsample in the spring first-, second-, third-, and fourth-grade data collections. In this way, students who were originally sampled for fall data collections were included in the spring data collections with certainty. These fall subsample cases were followed for the spring data collections even if they were movers in the fall and had their fall mover flag set to “not follow” or they were nonrespondents in the fall. Also, this method allows fall subsample movers to continue to be followed in each subsequent round of data collection, as well as more clustering of the movers to be followed, thus cutting down on field costs.

4-25
4.3 Calculation and Use of Sample Weights
The ECLS-K:2011 data should be weighted to account for differential probabilities of selection at each sampling stage and to adjust for the effect nonresponse can have on the estimates. For the base year, weights were provided at the child and school levels. Estimates produced using the base-year child-level weights are representative of children who attended kindergarten or who attended an ungraded school or classroom and were of kindergarten age in the United States in the 2010–11 school year. Estimates produced using the base-year school-level weight are representative of schools with kindergarten programs or schools that educate children of kindergarten age in an ungraded setting.
For all data collections after the kindergarten year, weights are provided only at the child level,
to produce estimates for the kindergarten cohort during the 2011–12 school year, the 2012–13 school year, the 2013–14 school year, and the 2014-15 school year, respectively. There are no school-level weights because the school sample is no longer nationally representative; it is not representative of schools with first-grade students, second-grade students, third-grade students, fourth-grade students or ungraded schools serving children of first-grade, second-grade, third-grade, or fourth-grade age. The school sample is simply a set of schools attended by the children in the ECLS-K:2011 cohort during the 2011–12, the 2012–13, the 2013–14, and the 2014–15 school years.
The use of weights is essential to produce estimates that are representative of the cohort of
children who were in kindergarten in 2010–11. Main sampling weights should be used to produce survey estimates. When testing hypotheses (e.g., conducting t tests, regression analyses, etc.) using weighted data from a study such as the ECLS-K:2011 that has a complex design, analysts also should use methods to adjust the standard errors. Two such methods are jackknife replication variance estimation and the Taylor series linearization method. Replicate weights are provided in the data file for use with the paired jackknife replication procedure, and PSU and stratum identifiers are provided for use with the Taylor series method.
4.3.1 Types of Sample Weights
Main sampling weights designed for use with data from a complex sample survey serve two primary purposes. When used in analyses, the main sampling weight weights the sample size up to the population total of interest. In the ECLS-K:2011, weighting produces national-level estimates. Also, the main sampling weight adjusts for differential nonresponse patterns that can lead to bias in the estimates. If people with certain characteristics are systematically less likely than others to respond to a survey, the collected data may not accurately reflect the characteristics and experiences of the nonrespondents, which

4-26
can lead to bias. To adjust for this, respondents are assigned weights that, when applied, result in respondents representing their own characteristics and experiences as well as those of nonrespondents with similar attributes.
A sample weight could be produced for use with data from every component of the study (e.g.,
data from the fourth-grade parent interview; the fourth-grade child assessment and child questionnaire; the fourth-grade teacher teacher-level questionnaire; the fourth-grade teacher child- and classroom-level reading , mathematics, or science teacher questionnaire; or the fourth-grade school administrator questionnaire) and for every combination of components for the study (e.g., data from the fourth-grade child assessment with data from the fourth-grade school administrator questionnaire, or data from the spring kindergarten child assessment with data from the fourth-grade child assessment or child questionnaire and the fourth-grade parent interview). However, creating all possible weights for a study with as many components as the ECLS-K:2011 would be impractical, especially as the study progresses and the number of possible weights increases. In order to determine which weights would be most useful for researchers analyzing data from fourth grade, completion rates for each fourth-grade component (e.g., response to the child assessment and child questionnaire, the parent interview, various parts of the teacher questionnaire) were reviewed in combination with completion rates from the kindergarten, first-grade, second-grade, third-grade, and fourth-grade years, and consideration was given to how analysts are likely to use the data.
The best approach to choosing a sample weight for a given analysis is to select one that
maximizes the number of sources of data included in the analyses for which nonresponse adjustments are made, which in turn minimizes bias in estimates, while maintaining as large an unweighted sample size as possible. Exhibits 4-1 and 4-2 show the 17 weights computed for the analyses of fourth-grade data. It also identifies the survey component(s), or sources of data, for which nonresponse adjustments are made for each weight.
Note that for four sets of weights involving the fourth-grade teacher data, separate weights
were computed for the analyses of the teacher child- and classroom-level reading, mathematics, and science questionnaires. Analytic weights that adjust for nonresponse to the reading teacher questionnaire apply to all children enrolled in school since they were all eligible for a reading teacher questionnaire. As discussed above, half of the study children were eligible for a mathematics teacher questionnaire and half were eligible for a science teacher questionnaire. Weights that adjust for nonresponse for each of these questionnaires are not provided in separate mathematics and science weighting variables. Instead, the mathematics and science weight values are combined in the same weight variables. To use weights applicable only to the set of children selected for a mathematics teacher or only to the set of children selected for a science teacher, the user needs to subset the data to a specific subject using the flag variable X8MSFLAG. When analyzing

4-27
information provided by the mathematics teacher, the user needs to subset data to mathematics by setting the flag X8MSFLAG to 0. When analyzing data provided by science teachers the user needs to subset the data to science by setting the flag X8MSFLAG to 1. When analyzing data that include the reading teacher questionnaire, no subsetting is necessary.
Many of the weights that adjust for nonresponse to the reading teacher questionnaire have
parallel weights that adjust for nonresponse to the mathematics/science teacher questionnaires. However, some weights that adjust for nonresponse to the reading teacher questionnaire do not have a similar weight that has mathematics or science nonresponse adjustments. This is because the reading teacher questionnaire contained child-level questions that were not included in the mathematics or science teacher questionnaires. The mathematics and science questionnaires contained only a few child-level questions specifically related to mathematics or science. The reading teacher questionnaire contained questions related not only to reading but also to the child’s academic and social skills, classroom behaviors, and peer relationships. To help users better understand the series of weights include nonresponse adjustments for teacher data, those weights are presented separately in exhibit 4-2.
Since every child who was assessed also had child questionnaire data, the response rates have
the same pattern. Therefore, nonresponse adjustments for the child questionnaire did not need to be made separately from nonresponse adjustments for the child assessment. Analyses that include either child assessment data or child questionnaire data should be done with a weight that includes the C8 component.

4-28
Exhibit 4-1. ECLS-K:2011 fourth-grade main sampling weights for analysis not including data from teachers
Weight Description W8C8P_2
Child base weight adjusted for nonresponse associated with child assessment/child questionnaire data from spring fourth grade, and parent data from either fall kindergarten or spring kindergarten (C8)(P1_P2)
W8C18P_2
Child base weight adjusted for nonresponse associated with child assessment/child questionnaire data from both kindergarten rounds and spring fourth grade, as well as parent data from fall kindergarten or spring kindergarten (C1C2C8)(P1_P2)
W8C18P_8
Child base weight adjusted for nonresponse associated with child assessment/child questionnaire data from both kindergarten rounds and spring fourth grade, as well as parent data from fall kindergarten or spring kindergarten, spring first grade, spring second grade, spring third grade, and spring fourth grade (C1C2C8)(P1_P2)(P4P6P7P8)
W8C28P_8A
Child base weight adjusted for nonresponse associated with child assessment/child questionnaire data from spring kindergarten, spring first grade, spring second grade, spring third grade, and spring fourth grade, as well as parent data from fall kindergarten or spring kindergarten, and parent data from spring fourth grade (C2C4C6C7C8)(P1_P2)(P8)
W8C28P_8B
Child base weight adjusted for nonresponse associated with child assessment/child questionnaire data from spring kindergarten, spring first grade, spring second grade, spring third grade, and spring fourth grade, as well as parent data from fall kindergarten or spring kindergarten, parent data from spring first grade, parent data from spring second grade, parent data from spring third grade, and parent data from spring fourth grade (C2C4C6C7C8)(P1_P2)(P4P6P7P8)
W8CF8P_8
Child base weight adjusted for nonresponse associated with child assessment/child questionnaire data from all eight rounds from kindergarten through fourth grade, as well as parent data from fall kindergarten or spring kindergarten, and parent data from all rounds from fall first grade through spring fourth grade. (C1C2C3C4C5C6C7C8)(P1_P2)(P3P4P5P6P7P8)
NOTE: Having child assessment/child questionnaire data includes (1) having reading and/or mathematics and/or science scores, (2) having at least one executive function score, (3) having a height or weight measurement, or (4) being excluded from assessment due to lack of accommodation for a disability. In spring fourth grade, every child who was assessed also had questionnaire data. The weight designations (C1, C2, etc.) use the same prefixes that are used for other variables in the kindergarten–fourth grade data file. The prefixes are listed in exhibit 7-1. SOURCE: U.S. Department of Education, National Center for Education Statistics, Early Childhood Longitudinal Study, Kindergarten Class of 2010–11 (ECLS-K:2011), kindergarten–fourth grade (K-4) restricted-use data file.

4-29
Exhibit 4-2. ECLS-K:2011 fourth-grade main sampling weights associated with data from teachers Weight Description W8C18P_2T28
Child base weight adjusted for nonresponse associated with child assessment/child questionnaire data from both kindergarten rounds and spring fourth grade, as well as parent data from fall kindergarten or spring kindergarten, and teacher data from spring kindergarten, spring first grade, spring second grade, spring third grade, and spring fourth grade (C1C2C8)(P1_P2)(T2T4T6T7T8) Note: This weight was created with nonresponse adjustments for the reading teacher only. There is no similar weight with nonresponse adjustments for the mathematics or science teacher.
W8C18P_8T28A
Child base weight adjusted for nonresponse associated with child assessment/child questionnaire data from both kindergarten rounds and spring fourth grade, as well as parent data from fall kindergarten or spring kindergarten, parent data from spring fourth grade, and teacher data from spring kindergarten, spring first grade, spring second grade, spring third grade, and spring fourth grade (C1C2C8)(P1_P2)(P8)(T2T4T6T7T8) Note: This weight was created with nonresponse adjustments for the reading teacher only. There is no similar weight with nonresponse adjustments for the mathematics or science teacher.
W8C18P_8T28B
Child base weight adjusted for nonresponse associated with child assessment/child questionnaire data from both kindergarten rounds and spring fourth grade, as well as parent data from fall kindergarten or spring kindergarten, parent data from spring first grade, parent data from spring second grade, parent data from spring third grade, parent data from spring fourth grade, teacher data from spring kindergarten, spring first grade, spring second grade, spring third grade, and spring fourth grade (C1C2C8)(P1_P2)(P4P6P7P8)(T2T4T6T7T8) Note: This weight was created with nonresponse adjustments for the reading teacher only. There is no similar weight with nonresponse adjustments for the mathematics or science teacher.
See notes at end of exhibit.

4-30
Exhibit 4-2. ECLS-K:2011 fourth-grade main sampling weights associated with data from teachers—Continued
Weight Description W8C18P_8T18
Child base weight adjusted for nonresponse associated with child assessment/child questionnaire data from both kindergarten rounds, spring first grade, spring second grade, spring third grade, and spring fourth grade, as well as parent data from fall kindergarten or spring kindergarten, parent data from spring first grade, parent data from spring second grade, parent data from spring third grade, parent data from spring fourth grade, and teacher data from fall and spring kindergarten, spring first grade, spring second grade, spring third grade, and spring fourth grade (C1C2C4C6C7C8)(P1_P2)(P4P6P7P8)(T1T2T4T6T7T8) Note: This weight was created with nonresponse adjustments for the reading teacher only. There is no similar weight with nonresponse adjustments for the mathematics or science teacher.
W8C28P_2T28
Child base weight adjusted for nonresponse associated with child assessment/child questionnaire data from spring kindergarten, spring first grade, spring second grade, spring third grade, and spring fourth grade, as well as parent data from fall kindergarten or spring kindergarten, and teacher data from spring kindergarten, spring first grade, spring second grade, spring third grade, and spring fourth grade (C2C4C6C7C8)(P1_P2)(T2T4T6T7T8) Note: This weight was created with nonresponse adjustments for the reading teacher only. There is no similar weight with nonresponse adjustments for the mathematics or science teacher.
W8CF8P_2T18
Child base weight adjusted for nonresponse associated with child assessment/child questionnaire data from all eight rounds from kindergarten through fourth grade, as well as parent data from fall kindergarten or spring kindergarten, and teacher data from fall and spring kindergarten, fall and spring first grade, fall and spring second grade, spring third grade, and spring fourth grade (C1C2C3C4C5C6C7C8)(P1_P2)(T1T2T3T4T5T6T7T8) Note: This weight was created with nonresponse adjustments for the reading teacher only. There is no similar weight with nonresponse adjustments for the mathematics or science teacher.
See notes at end of exhibit.

4-31
Exhibit 4-2. ECLS-K:2011 fourth-grade main sampling weights associated with data from teachers—Continued
Weight Description W8C18P_8T8
Child base weight adjusted for nonresponse associated with child assessment/child questionnaire data from both kindergarten rounds and spring fourth grade, parent data from either fall kindergarten or spring kindergarten, parent data from spring fourth grade, as well as teacher data from spring fourth grade (C1C2C8)(P1_P2)(P8)(T8) Note: This weight was created with nonresponse adjustments for the reading teacher. The similar weight with nonresponse adjustments for the mathematics or science teacher is W8C18P_8T8Z.
W8C18P_8T8Z
Child base weight adjusted for nonresponse associated with child assessment/child questionnaire data from both kindergarten rounds and spring fourth grade, parent data from either fall kindergarten or spring kindergarten, parent data from spring fourth grade, as well as teacher data from spring fourth grade (C1C2C8)(P1_P2)(P8)(T8Z) Note: Users must subset records to include cases with mathematics teacher data only (X8MSFLAG=1) or science teacher data only (X8MSFLAG=0) when using this weight.
W8C18P_8T28C
Child base weight adjusted for nonresponse associated with child assessment/child questionnaire data from both kindergarten rounds and spring fourth grade, parent data from fall kindergarten or spring kindergarten, parent data from spring fourth grade, as well as either teacher-/classroom- or child-level teacher data from spring kindergarten (from a core or supplemental teacher questionnaire), and teacher data from spring kindergarten and spring fourth grade (C1C2C8)(P1_P2)(P8)(T2T8) Note: This weight was created with nonresponse adjustments for the reading teacher. The similar weight with nonresponse adjustments for the mathematics or science teacher is W8C18P_8T28Z.
W8C18P_8T28Z
Child base weight adjusted for nonresponse associated with child assessment/child questionnaire data from both kindergarten rounds and spring fourth grade, parent data from fall kindergarten or spring kindergarten, parent data from spring fourth grade, and teacher data from spring kindergarten and spring fourth grade (C1C2C8)(P1_P2)(P8)(T2T8Z) Note: Users must subset records to include cases with mathematics teacher data only (X8MSFLAG=1) or science teacher data only (X8MSFLAG=0) when using this weight.
See notes at end of exhibit.

4-32
Exhibit 4-2. ECLS-K:2011 fourth-grade main sampling weights associated with data from teachers—Continued
Weight Description W8C28P_8T8
Child base weight adjusted for nonresponse associated with child assessment/child questionnaire data from spring kindergarten and spring fourth grade, as well as parent data from fall kindergarten or spring kindergarten, parent data from spring fourth grade, and teacher data from spring fourth grade (C2C8)(P1_P2)(P8)(T8) Note: This weight was created with nonresponse adjustments for the reading teacher. The similar weight with nonresponse adjustments for the mathematics or science teacher is W8C28P_8T8Z.
W8C28P_8T8Z
Child base weight adjusted for nonresponse associated with child assessment/child questionnaire data from spring kindergarten and spring fourth grade, as well as parent data from fall kindergarten or spring kindergarten, parent data from spring fourth grade, and teacher data from spring fourth grade (C2C8)(P1_P2)(P8)(T8Z) Note: Users must subset records to include cases with mathematics teacher data only (X8MSFLAG=1) or science teacher data only (X8MSFLAG=0) when using this weight.
W8C28P_2T8
Child base weight adjusted for nonresponse associated with child assessment/child questionnaire data from spring kindergarten, spring first grade, spring second grade, spring third grade, and spring fourth grade, as well as parent data from fall kindergarten or spring kindergarten, and teacher data from spring fourth grade (C2C4C6C7C8)(P1_P2)(T8) Note: This weight was created with nonresponse adjustments for the reading teacher. The similar weight with nonresponse adjustments for the mathematics or science teacher is W8C28P_2T8Z.
W8C28P_2T8Z
Child base weight adjusted for nonresponse associated with child assessment/child questionnaire data from spring kindergarten, spring first grade, spring second grade, spring third grade, and spring fourth grade, as well as parent data from fall kindergarten or spring kindergarten, and teacher data from spring fourth grade (C2C4C6C7C8)(P1_P2)(T8Z) Note: Users must subset records to include cases with mathematics teacher data only (X8MSFLAG=1) or science teacher data only (X8MSFLAG=0) when using this weight.
See notes at end of exhibit.
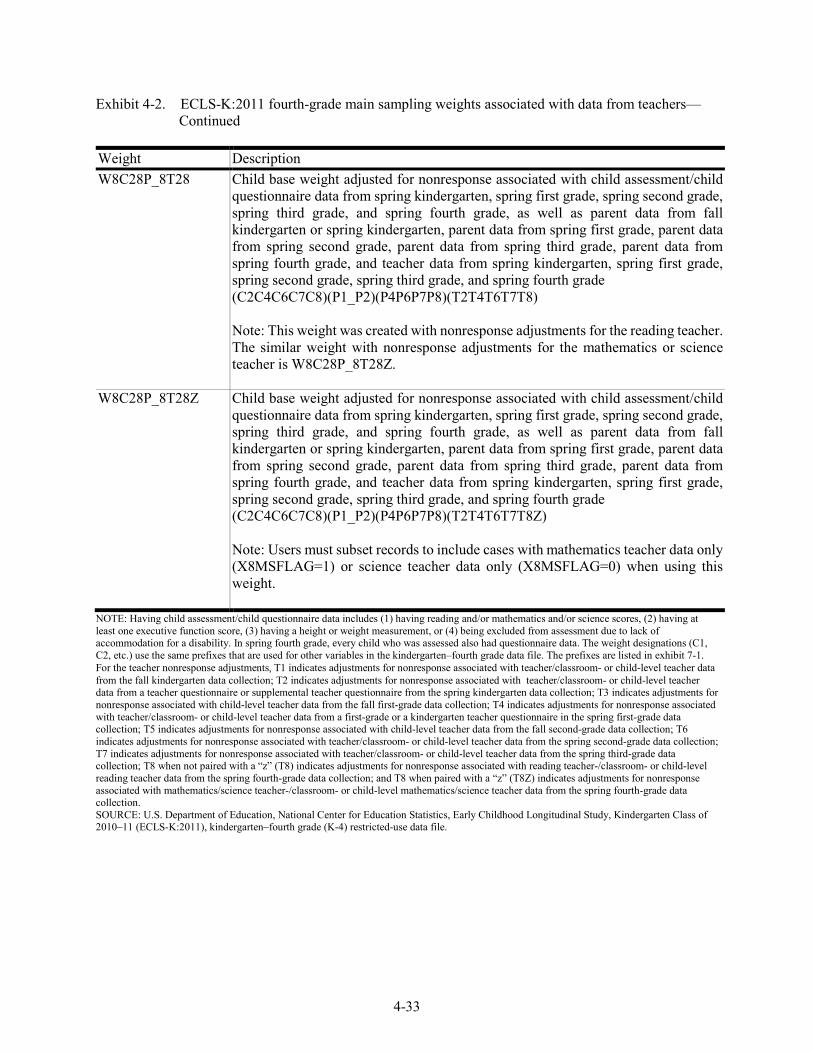
4-33
Exhibit 4-2. ECLS-K:2011 fourth-grade main sampling weights associated with data from teachers—Continued
Weight Description W8C28P_8T28
Child base weight adjusted for nonresponse associated with child assessment/child questionnaire data from spring kindergarten, spring first grade, spring second grade, spring third grade, and spring fourth grade, as well as parent data from fall kindergarten or spring kindergarten, parent data from spring first grade, parent data from spring second grade, parent data from spring third grade, parent data from spring fourth grade, and teacher data from spring kindergarten, spring first grade, spring second grade, spring third grade, and spring fourth grade (C2C4C6C7C8)(P1_P2)(P4P6P7P8)(T2T4T6T7T8) Note: This weight was created with nonresponse adjustments for the reading teacher. The similar weight with nonresponse adjustments for the mathematics or science teacher is W8C28P_8T28Z.
W8C28P_8T28Z
Child base weight adjusted for nonresponse associated with child assessment/child questionnaire data from spring kindergarten, spring first grade, spring second grade, spring third grade, and spring fourth grade, as well as parent data from fall kindergarten or spring kindergarten, parent data from spring first grade, parent data from spring second grade, parent data from spring third grade, parent data from spring fourth grade, and teacher data from spring kindergarten, spring first grade, spring second grade, spring third grade, and spring fourth grade (C2C4C6C7C8)(P1_P2)(P4P6P7P8)(T2T4T6T7T8Z) Note: Users must subset records to include cases with mathematics teacher data only (X8MSFLAG=1) or science teacher data only (X8MSFLAG=0) when using this weight.
NOTE: Having child assessment/child questionnaire data includes (1) having reading and/or mathematics and/or science scores, (2) having at least one executive function score, (3) having a height or weight measurement, or (4) being excluded from assessment due to lack of accommodation for a disability. In spring fourth grade, every child who was assessed also had questionnaire data. The weight designations (C1, C2, etc.) use the same prefixes that are used for other variables in the kindergarten–fourth grade data file. The prefixes are listed in exhibit 7-1. For the teacher nonresponse adjustments, T1 indicates adjustments for nonresponse associated with teacher/classroom- or child-level teacher data from the fall kindergarten data collection; T2 indicates adjustments for nonresponse associated with teacher/classroom- or child-level teacher data from a teacher questionnaire or supplemental teacher questionnaire from the spring kindergarten data collection; T3 indicates adjustments for nonresponse associated with child-level teacher data from the fall first-grade data collection; T4 indicates adjustments for nonresponse associated with teacher/classroom- or child-level teacher data from a first-grade or a kindergarten teacher questionnaire in the spring first-grade data collection; T5 indicates adjustments for nonresponse associated with child-level teacher data from the fall second-grade data collection; T6 indicates adjustments for nonresponse associated with teacher/classroom- or child-level teacher data from the spring second-grade data collection; T7 indicates adjustments for nonresponse associated with teacher/classroom- or child-level teacher data from the spring third-grade data collection; T8 when not paired with a “z” (T8) indicates adjustments for nonresponse associated with reading teacher-/classroom- or child-level reading teacher data from the spring fourth-grade data collection; and T8 when paired with a “z” (T8Z) indicates adjustments for nonresponse associated with mathematics/science teacher-/classroom- or child-level mathematics/science teacher data from the spring fourth-grade data collection. SOURCE: U.S. Department of Education, National Center for Education Statistics, Early Childhood Longitudinal Study, Kindergarten Class of 2010–11 (ECLS-K:2011), kindergarten–fourth grade (K-4) restricted-use data file.
4-34
Exhibit 4-3, which presents the same information as exhibits 4-1 and 4-2 but in matrix format, was developed to further assist researchers in deciding which weight to use for analyses. In exhibit 4-3, the components for which nonresponse adjustments are made for each weight are noted with a “Yes.” Researchers should choose a weight that has a “Yes” in the column(s) for the source(s) of data they are using in their analyses. The best weight would have a “Yes” for each and every source used and only those sources. For example, if a researcher is conducting an analysis that includes fourth-grade child assessment/child questionnaire data, and fall kindergarten or spring kindergarten parent interview data, the weight W8C8P_20 should be used since it adjusts for nonresponse on all of those components (i.e., exhibit 4-3 shows a “Yes” in the fall kindergarten and spring kindergarten parent columns and the spring fourth-grade child assessment/child questionnaire column; the italicized Yes indicates an “or” condition).
However, for many analyses, there will be no weight that adjusts for nonresponse to all the
sources of data that are included and for only those sources. When no weight corresponds exactly to the combination of components included in the desired analysis, researchers might prefer to use a weight that includes nonresponse adjustments for more components than they are using in their analysis (i.e., a weight with “Yes” in columns corresponding to components that are not included in their analyses) if that weight also includes nonresponse adjustments for the components they are using. Although such a weight may result in a smaller analytic sample than would be available when using a weight that corresponds exactly to the components from which the analyst is using data, it will adjust for the potential differential nonresponse associated with the components. If researchers instead choose a weight with nonresponse adjustments for fewer components than they are using in their analysis, missing data should be examined for potential bias.

4-35
Exhibit 4-3. Weights developed for use with the ECLS-K:2011 fourth-grade data, by components for which nonresponse adjustments were made
Fall
kindergarten Spring
kindergarten Fall
first grade Spring
first grade Fall
second grade Spring
second grade Spring
third grade Spring
fourth grade Weight C1 P1 T11 C2 P2 T22 C3 P3 T33 C4 P4 T44 C5 P5 T55 C6 P6 T66 C7 P7 T77 C8 P8 T88
W8C8P_2 † Yes † † Yes † † † † † † † † † † † † † † † † Yes † † W8C18P_2 Yes Yes † Yes Yes † † † † † † † † † † † † † † † † Yes † † W8C18P_8 Yes Yes † Yes Yes † † † † † Yes † † † † † Yes † † Yes † Yes Yes † W8C28P_8A † Yes † Yes Yes † † † † Yes † † † † † Yes † † Yes † † Yes Yes † W8C28P_8B † Yes † Yes Yes † † † † Yes Yes † † † † Yes Yes † Yes Yes † Yes Yes † W8CF8P_8 Yes Yes † Yes Yes † Yes Yes † Yes Yes † Yes Yes † Yes Yes † Yes Yes † Yes Yes † W8C18P_2T28 Yes Yes † Yes Yes Yes † † † † † Yes † † † † † Yes † † Yes Yes † Yes W8C18P_8T28A Yes Yes † Yes Yes Yes † † † † † Yes † † † † † Yes † † Yes Yes Yes Yes W8C18P_8T28B Yes Yes † Yes Yes Yes † † † † Yes Yes † † † † Yes Yes † Yes Yes Yes Yes Yes W8C18P_8T18 Yes Yes Yes Yes Yes Yes † † † Yes Yes Yes † † † Yes Yes Yes Yes Yes Yes Yes Yes Yes W8C28P_2T28 † Yes † Yes Yes Yes † † † Yes † Yes † † † Yes † Yes Yes † Yes Yes † Yes W8CF8P_2T18 Yes Yes Yes Yes Yes Yes Yes † Yes Yes † Yes Yes † Yes Yes † Yes Yes † Yes Yes † Yes W8C18P_8T8 Yes Yes † Yes Yes † † † † † † † † † † † † † † † † Yes Yes Yes W8C18P_8T8Z9 Yes Yes † Yes Yes † † † † † † † † † † † † † † † † Yes Yes Yes W8C18P_8T28C Yes Yes † Yes Yes Yes † † † † † † † † † † † † † † † Yes Yes Yes W8C18P_8T28Z9 Yes Yes † Yes Yes Yes † † † † † † † † † † † † † † † Yes Yes Yes See notes at end of exhibit.

4-36
Exhibit 4-3. Weights developed for use with the ECLS-K:2011 fourth-grade data, by components for which nonresponse adjustments were made—Continued
Fall
kindergarten Spring
kindergarten Fall
first grade Spring
first grade Fall
second grade Spring
second grade Spring
third grade Spring
fourth grade Weight C1 P1 T11 C2 P2 T22 C3 P3 T33 C4 P4 T44 C5 P5 T55 C6 P6 T66 C7 P7 T77 C8 P8 T88
W8C28P_8T8 † Yes † Yes Yes † † † † † † † † † † † † † † † † Yes Yes Yes W8C28P_8T8Z9 † Yes † Yes Yes † † † † † † † † † † † † † † † † Yes Yes Yes W8C28P_2T8 † Yes † Yes Yes † † † † Yes † † † † † Yes † † Yes † † Yes † Yes W8C28P_2T8Z9 † Yes † Yes Yes † † † † Yes † † † † † Yes † † Yes † † Yes † Yes W8C28P_8T28 † Yes † Yes Yes Yes † † † Yes Yes Yes † † † Yes Yes Yes Yes Yes Yes Yes Yes Yes W8C28P_8T28Z9 † Yes † Yes Yes Yes † † † Yes Yes Yes † † † Yes Yes Yes Yes Yes Yes Yes Yes Yes † Not applicable. 1 A case had to have either teacher/classroom- or child-level teacher data from the fall kindergarten data collection to have a valid weight. 2 A case had to have either teacher/classroom- or child-level teacher data from a teacher questionnaire or supplemental teacher questionnaire from the spring kindergarten data collection to have a valid weight. 3 A case had to have child-level teacher data from the fall first-grade data collection to have a valid weight. 4 A case had to have either teacher/classroom- or child-level teacher data from a first-grade or a kindergarten teacher questionnaire in the spring first-grade data collection to have a valid weight. 5 A case had to have child-level teacher data from the fall second-grade data collection to have a valid weight. 6 A case had to have either teacher/classroom- or child-level teacher data from the spring second-grade data collection to have a valid weight. 7 A case had to have either teacher/classroom- or child-level teacher data from the third-grade data collection to have a valid weight. 8 A case had to have either teacher/classroom- or child-level teacher data from the fourth-grade data collection to have a valid weight. 9 This weight is for the analysis of data that include the mathematics/science teacher/classroom or child-level mathematics/science teacher data from the fourth grade NOTE: C indicates child assessment/child questionnaire data. P indicates parent interview data. T indicates teacher data. The weight designations (C1, C2, etc.) use the same prefixes that are used for other variables in the kindergarten–fourth grade data file. The prefixes are listed in exhibit 7-1. “Yes” indicates that the weight includes nonresponse adjustments for that component. An italicized Yes indicates an “or” condition. SOURCE: U.S. Department of Education, National Center for Education Statistics, Early Childhood Longitudinal Study, Kindergarten Class of 2010–11 (ECLS-K:2011), kindergarten–fourth grade (K-4) restricted-use data file.

4-37
4.3.2 Computation of Sample Weights
To compute sample weights, first a base weight is computed to reflect the sample design, and then the base weight is adjusted for nonresponse and unknown eligibility. When there is an intermediate adjustment (e.g., a mover subsampling adjustment), it is the intermediate weight that is adjusted for nonresponse and not the base weight.
The nonresponse adjustment was computed as the sum of the base weights for all eligible units
in a nonresponse class divided by the sum of the base weights of the respondent units in that nonresponse class. Nonresponse classes were formed separately for students in each type of school (public/Catholic/non-Catholic private). Within school type, analysis of school response propensity was done using school characteristics such as census region, locale, school enrollment size, and percent minority in school.8 Nonresponse classes were created based on this analysis of response propensity. Similarly, student characteristics such as sex and race/ethnicity were used to analyze response propensity and create nonresponse classes. Rules for collapsing nonresponse adjustment cells were adopted; for example, cells had to have a maximum adjustment factor of 2 and a minimum cell size of 30.
Main sampling weights (indicated by the suffix 0) and replicate weights (indicated by the
suffixes 1 to 40 or 1 to 80) were computed and included in the data file. In the sections that follow, only the main sampling weight is discussed, but any adjustment done to the main sampling weight was done to the replicate weights as well.
4.3.2.1 Student Base Weights
Only base-year respondents were eligible to participate in the fourth-grade data collection. The fourth-grade student base weight is the base-year student base weight adjusted for base-year nonresponse. The adjustment factor for base-year nonresponse is the sum of the base weights of the eligible students in the base year divided by the sum of the base weights of the base-year respondents within nonresponse adjustment classes.9 For a description of the computation of the base-year student base weights, see section 4.2.2.3.1 of the base-year User’s Manual.
8 This was part of the school nonresponse adjustment that was done in the base year. 9 A base-year respondent has child data (scoreable assessment data or height or weight measurements, or was excluded from assessment due to lack of accommodation for a disability) or parent interview data from at least one round of data collection in the base year.

4-38
For weights needed to analyze the child-level mathematics or science data from their teachers, a separate base weight was computed to account for the sampling of children to have mathematics or science teacher data. Only half of the students were selected for the mathematics teacher questionnaire, and the other half for the science teacher questionnaire. Because selection was with equal probability, the base-year student base weight was multiplied by 2 to get the mathematics/science base weight which was then adjusted for base-year nonresponse.
4.3.2.2 Student Weights Adjusted for Mover Subsampling
The student base weight described in section 4.3.2.1 was adjusted to reflect the subsampling of movers described in section 4.2.3. For every student who is a base-year respondent, a “follow” flag was assigned a value of 0 (do not follow if student moves) or 1 (follow if student moves). A mover-subsampling adjustment factor was set to 1 if the student has never moved out of an original sampled school, 2 if the student moved out of the original sampled school at any time after the base year and was followed into his or her new school, and 0 if the student moved out of the original sampled school at any time after the base year and was not followed. The mover-subsampling adjusted weight is the product of the base weight described in section 4.3.2.1 and this mover-subsampling adjustment factor. Note that child assessments were not conducted and school staff questionnaires were not fielded for students who moved into nonsampled PSUs even if their flag was set to “follow”; such students are counted as nonrespondents in the adjustment for nonresponse on weights involving child assessment or teacher data.10 However, an attempt was made to complete a parent interview for students who moved into nonsampled PSUs if their flag was set to “follow”; therefore, their parents would be counted as respondents in the adjustment for parent nonresponse if a parent interview was completed and as nonrespondents if a parent interview was not completed.
4.3.2.3 Student Nonresponse-Adjusted Weights
The mover-subsampling adjusted weight described in section 4.3.2.2 was adjusted for nonresponse to produce each of the student-level weights described in exhibit 4-1. For each weight, a response status was defined based on the presence of data for the particular component(s) and round(s) covered by the weight.
10 Only homeschooled children were considered “not eligible” for the collection of teacher data; they are the only students who were not included in the adjustment for nonresponse for teacher data.

4-39
For example, for the weight W8C8P_20, an eligible respondent is a base-year respondent who satisfies both of these criteria: (1) the student has child assessment/child questionnaire data11 from fourth grade, and (2) the student has parent interview data from either the fall or spring of kindergarten. An ineligible student is one who moved out of the country or is deceased or moved to another school and was not assigned to be followed. A student of unknown eligibility is one who could not be located. The remaining students are eligible nonrespondents.
Nonresponse adjustment was done in two steps: (1) adjustment for children whose eligibility
was not determined (i.e., those who could not be located, or those who moved to another sampled PSU and who did not have parent interview data because the parent could not be contacted), and (2) adjustment for eligible nonrespondents. In the first step, a portion of cases with unknown eligibility was assumed to be ineligible. This proportion varied between 1.1 and 2.1 percent for the weights that do not include data from the fall collections, and between 1.6 and 3 percent for the weights that include data from the fall collections; it is highest for those weights that adjusted for teacher nonresponse. The latter is because children who were homeschooled were considered not eligible to have teacher data. Nonresponse classes were created using school and child characteristics and used in adjustments for both unknown eligibility and nonresponse.
4.3.2.4 Raking to Sample Control Totals
To reduce the variability due to the subsampling of movers and to ensure that the final weights continue to sum to the base-year population total, the student nonresponse-adjusted weights were raked to sample-based control totals using the fourth-grade student base weights. Raking is a calibration estimator that is closely related to poststratification. The poststratification adjustment procedure involves applying a ratio adjustment to the weights. Respondents are partitioned into groups, known as poststrata cells, and a single ratio adjustment factor is applied to the weights of all units in a given poststratification cell. The numerator of the ratio is a “control total” usually obtained from a secondary source; the denominator is a weighted total for the survey data. Therefore at the poststratum level, estimates obtained using the poststratified survey weights will correspond to the control totals used. If either the cell-level population counts are not available for all cells or the majority of the cell sample sizes are too small, raking is used to adjust the survey estimates to the known marginal totals of several categorical variables. Raking is essentially a multivariate poststratification. In the ECLS-K:2011, multiple background characteristics from schools, students, and parents were combined to create raking cells.
11 Having child assessment data includes (1) having reading and/or mathematics and/or science scores, (2) having at least one executive function score, (3) having a height or weight measurement, or (4) being excluded from assessment due to lack of accommodation for a disability.

4-40
The student records included in the file used for computing the control totals are records of base-year eligible children. The sum of the base weights from this file is the estimated number of children who were in kindergarten in 2010–11. Raking was done within raking cells (also known as raking dimensions). The raking dimensions were based on single characteristics (e.g., locale) or a combination of characteristics (e.g., age and race/ethnicity). Chi-Square Automatic Interaction Detector (CHAID) analysis was used to determine the best set of raking cells.
The final weight is the product of the raking factor and the student nonresponse-adjusted
weight. The raking factor was computed as the ratio of the base-year sample control total for a raking cell over the sum of the nonresponse-adjusted fourth-grade weights in that raking cell.
4.3.3 Characteristics of Sample Weights
The statistical characteristics of the sample weights are presented in table 4-16. For each weight, the number of cases with a nonzero weight is presented along with the mean weight, the standard deviation, the coefficient of variation (i.e., the standard deviation as a percentage of the mean weight), the minimum weight, the maximum weight, the design effect of the final weight, the skewness, the kurtosis, and the sum of weights. The procedure for raking to control totals included respondents and ineligible cases. Afterwards, weights of ineligible cases were set to zero. Because a portion of children of unknown eligibility was assumed to be ineligible (as discussed in section 4.3.2.3) and this adjustment for unknown eligibility was done within adjustment cells, there are small differences in the sums of weights.
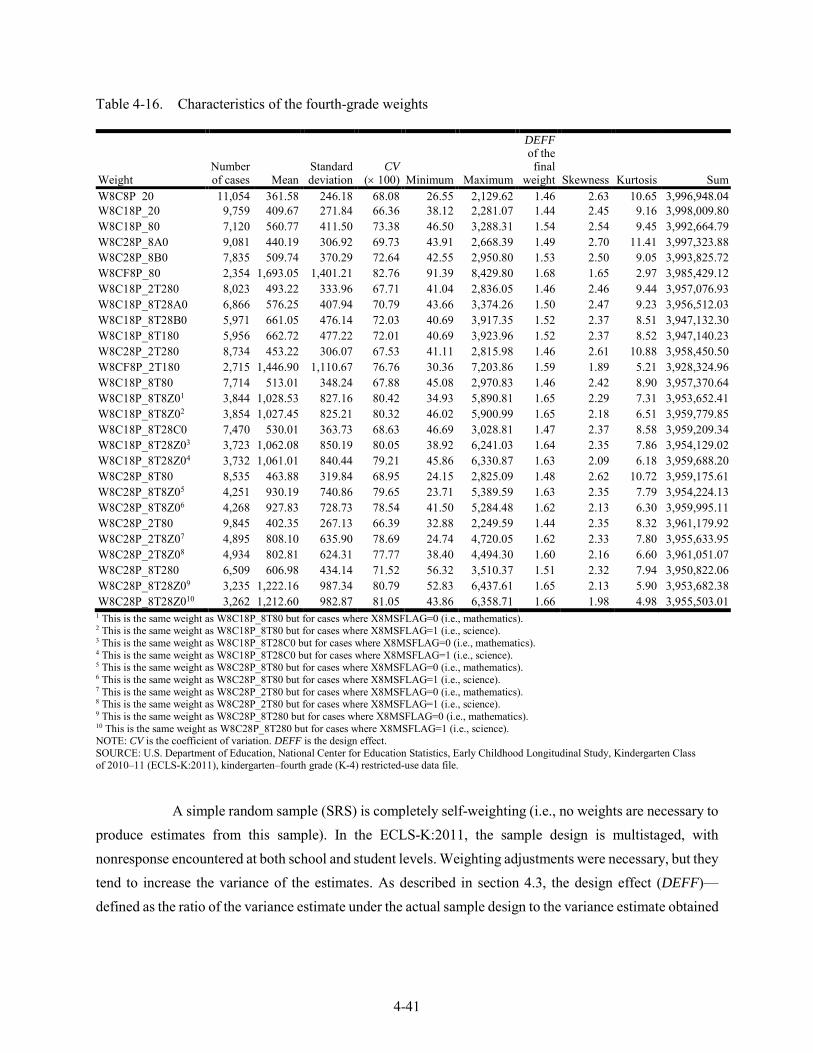
4-41
Table 4-16. Characteristics of the fourth-grade weights
Weight Number of cases Mean
Standard deviation
CV (× 100) Minimum Maximum
DEFF of the final
weight Skewness Kurtosis Sum W8C8P 20 11,054 361.58 246.18 68.08 26.55 2,129.62 1.46 2.63 10.65 3,996,948.04 W8C18P_20 9,759 409.67 271.84 66.36 38.12 2,281.07 1.44 2.45 9.16 3,998,009.80 W8C18P_80 7,120 560.77 411.50 73.38 46.50 3,288.31 1.54 2.54 9.45 3,992,664.79 W8C28P_8A0 9,081 440.19 306.92 69.73 43.91 2,668.39 1.49 2.70 11.41 3,997,323.88 W8C28P_8B0 7,835 509.74 370.29 72.64 42.55 2,950.80 1.53 2.50 9.05 3,993,825.72 W8CF8P_80 2,354 1,693.05 1,401.21 82.76 91.39 8,429.80 1.68 1.65 2.97 3,985,429.12 W8C18P_2T280 8,023 493.22 333.96 67.71 41.04 2,836.05 1.46 2.46 9.44 3,957,076.93 W8C18P_8T28A0 6,866 576.25 407.94 70.79 43.66 3,374.26 1.50 2.47 9.23 3,956,512.03 W8C18P_8T28B0 5,971 661.05 476.14 72.03 40.69 3,917.35 1.52 2.37 8.51 3,947,132.30 W8C18P_8T180 5,956 662.72 477.22 72.01 40.69 3,923.96 1.52 2.37 8.52 3,947,140.23 W8C28P_2T280 8,734 453.22 306.07 67.53 41.11 2,815.98 1.46 2.61 10.88 3,958,450.50 W8CF8P_2T180 2,715 1,446.90 1,110.67 76.76 30.36 7,203.86 1.59 1.89 5.21 3,928,324.96 W8C18P_8T80 7,714 513.01 348.24 67.88 45.08 2,970.83 1.46 2.42 8.90 3,957,370.64 W8C18P_8T8Z01 3,844 1,028.53 827.16 80.42 34.93 5,890.81 1.65 2.29 7.31 3,953,652.41 W8C18P_8T8Z02 3,854 1,027.45 825.21 80.32 46.02 5,900.99 1.65 2.18 6.51 3,959,779.85 W8C18P_8T28C0 7,470 530.01 363.73 68.63 46.69 3,028.81 1.47 2.37 8.58 3,959,209.34 W8C18P_8T28Z03 3,723 1,062.08 850.19 80.05 38.92 6,241.03 1.64 2.35 7.86 3,954,129.02 W8C18P_8T28Z04 3,732 1,061.01 840.44 79.21 45.86 6,330.87 1.63 2.09 6.18 3,959,688.20 W8C28P_8T80 8,535 463.88 319.84 68.95 24.15 2,825.09 1.48 2.62 10.72 3,959,175.61 W8C28P_8T8Z05 4,251 930.19 740.86 79.65 23.71 5,389.59 1.63 2.35 7.79 3,954,224.13 W8C28P_8T8Z06 4,268 927.83 728.73 78.54 41.50 5,284.48 1.62 2.13 6.30 3,959,995.11 W8C28P_2T80 9,845 402.35 267.13 66.39 32.88 2,249.59 1.44 2.35 8.32 3,961,179.92 W8C28P_2T8Z07 4,895 808.10 635.90 78.69 24.74 4,720.05 1.62 2.33 7.80 3,955,633.95 W8C28P_2T8Z08 4,934 802.81 624.31 77.77 38.40 4,494.30 1.60 2.16 6.60 3,961,051.07 W8C28P_8T280 6,509 606.98 434.14 71.52 56.32 3,510.37 1.51 2.32 7.94 3,950,822.06 W8C28P_8T28Z09 3,235 1,222.16 987.34 80.79 52.83 6,437.61 1.65 2.13 5.90 3,953,682.38 W8C28P_8T28Z010 3,262 1,212.60 982.87 81.05 43.86 6,358.71 1.66 1.98 4.98 3,955,503.01
1 This is the same weight as W8C18P_8T80 but for cases where X8MSFLAG=0 (i.e., mathematics). 2 This is the same weight as W8C18P_8T80 but for cases where X8MSFLAG=1 (i.e., science). 3 This is the same weight as W8C18P_8T28C0 but for cases where X8MSFLAG=0 (i.e., mathematics). 4 This is the same weight as W8C18P_8T28C0 but for cases where X8MSFLAG=1 (i.e., science). 5 This is the same weight as W8C28P_8T80 but for cases where X8MSFLAG=0 (i.e., mathematics). 6 This is the same weight as W8C28P_8T80 but for cases where X8MSFLAG=1 (i.e., science). 7 This is the same weight as W8C28P_2T80 but for cases where X8MSFLAG=0 (i.e., mathematics). 8 This is the same weight as W8C28P_2T80 but for cases where X8MSFLAG=1 (i.e., science). 9 This is the same weight as W8C28P_8T280 but for cases where X8MSFLAG=0 (i.e., mathematics). 10 This is the same weight as W8C28P_8T280 but for cases where X8MSFLAG=1 (i.e., science). NOTE: CV is the coefficient of variation. DEFF is the design effect. SOURCE: U.S. Department of Education, National Center for Education Statistics, Early Childhood Longitudinal Study, Kindergarten Class of 2010–11 (ECLS-K:2011), kindergarten–fourth grade (K-4) restricted-use data file.
A simple random sample (SRS) is completely self-weighting (i.e., no weights are necessary to
produce estimates from this sample). In the ECLS-K:2011, the sample design is multistaged, with nonresponse encountered at both school and student levels. Weighting adjustments were necessary, but they tend to increase the variance of the estimates. As described in section 4.3, the design effect (DEFF)—defined as the ratio of the variance estimate under the actual sample design to the variance estimate obtained

4-42
with an SRS of the same sample size—shows an estimate of the variance increase. One way of approximating this increase due to weighting is by way of the coefficient of variation (CV):
𝐷𝐷𝐷𝐷𝐷𝐷𝐷𝐷 𝑑𝑑𝑑𝑑𝑑𝑑 𝑡𝑡𝑡𝑡 𝑤𝑤𝑑𝑑𝑤𝑤𝑤𝑤ℎ𝑡𝑡𝑤𝑤𝑡𝑡𝑤𝑤 = 1 + 𝐶𝐶𝐶𝐶2
In table 4-16, the design effect due to weighting is included for each weight. For example, for weight W8C8P_20, the design effect due to weighting is 1+(0.6808)2 = 1.46 (i.e., the variance is increased by 46 percent due to weight adjustments). The design effect due to weighting varies between 1.44 and 1.68. The highest design effect due to weighting is for the fall subsample that did not include the teacher component (weight W8CF8P_80). The other weight for the fall subsample (weight W8CF8P_2T180) has a slightly smaller design effect due to weighting because it included the teacher component and not multiple rounds of parent data past kindergarten; therefore the CV for this weight is smaller. The fall subsample includes an additional sampling stage and is about 30 percent of the main sample (see section 4.2.1 for a discussion of the fall subsample).
4.3.4 Variance Estimation
The precision of the sample estimates derived from a survey can be evaluated by estimating the variances of these estimates. For a complex sample design such as the one employed in the ECLS-K:2011, replication and Taylor Series methods have been developed to correctly estimate variance. These methods take into account the clustered, multistage sampling design and the use of differential sampling rates to oversample targeted subpopulations. For the ECLS-K:2011, in which the first-stage self-representing sampling units (i.e., PSUs) were selected with certainty and the first-stage non-self-representing sampling units were selected with two units per stratum, the paired jackknife replication method (JK2) is recommended. This section describes the JK2 and the Taylor series methods, which can be used to compute correct standard errors for any analysis.
4.3.4.1 Jackknife Method
The final main sampling and replicate weights can be used to compute estimates of variance for survey estimates using the jackknife method with two PSUs per stratum (JK2) using several software packages, including WesVar, AM, SUDAAN, SAS, Stata, and R. In the jackknife method, each survey estimate of interest is calculated for the full sample as well as for each of the g replicates, where g is 80 for the spring weights, and 40 for the fall weights. The variation of the replicate estimates around the full-

4-43
sample estimate is used to estimate the variance for the full sample. The variance estimator is computed as the sum of squared deviations of the replicate estimates from the full sample estimate:
𝑣(θ) = ∑(θ(𝑔) − θ)2
𝐺
𝑔=1
where θ is the survey estimate of interest,
θ is the estimate of θ based on the full sample, G is the number of replicates, and
θ(𝑔) is the gth replicate estimate of θ based on the observations included in the gth replicate.
Each main sampling weight that does not include adjustments for nonresponse to components
from the fall data collections has 80 corresponding replicate weights for use with the JK2 method. The replicate weights begin with the same characters as the main sampling weight and end with the numbers 1 to 80. For example, the replicate weights corresponding to weight W8C8P_20 are W8C8P_21 through W8C8P_280. For weights that include nonresponse adjustments for components from the fall data collections, there are 40 replicate weights. For example, weight W8CF8P_80 has W8CF8P_81 through W8CF8P_840 as replicate weights.
4.3.4.2 Taylor Series Method
Variance stratum and variance unit (first-stage sample unit [i.e., PSU]) identifiers were also created to be used in statistical software that computes variance estimates based on the Taylor series method (for example, AM, SUDAAN, SAS, SPSS, and Stata). In this method, a linear approximation of a statistic is formed and then substituted into the formula for calculating the variance of a linear estimate appropriate for the sample design.
If ( )'1,..., pY Y Y= denotes a p-dimensional vector of population parameters, ( )'1ˆ ˆ ˆ,..., pY Y Y=
is the corresponding vector of estimators based on a sample s of size n(s), θ = 𝑔(𝑌) is the population parameter of interest, and θ = 𝑔(��) is an estimator of θ, then
θ − θ = ∑𝜕𝑔(𝑌)
𝜕𝑦𝑗
𝑝
𝑗=1
(��𝑗 − 𝑌𝑗)
and

4-44
𝑣(θ) = 𝑣 (∑∂g(Y)
∂yi(Yj − 𝑌𝑖)
𝑝𝑗=1 ) = ∑ ∑
𝜕𝑔(𝑌)
𝜕𝑦𝑗
𝜕𝑔(𝑌)
𝜕𝑦𝑖𝐶𝑜𝑣{��𝑗, ��𝑖}
𝑝𝑖=1
𝑝𝑗=1 .
where θ is the estimate of θ based on the full sample, θ is the survey estimate of interest, Y is a p-dimensional vector of population parameters,
�� is a p-dimensional vector of estimators, y is an element of the vector Y, and 𝑤𝑤(𝑌𝑌) is an estimator of θ.
The Taylor series method relies on a simplified procedure for estimating the variance for a
linear statistic even with a complex sample design and is valid when analyzing data from large samples in which the first-stage units are sampled with replacement.12 The stratum and first-stage unit identifiers needed to use the Taylor series method were assigned as follows: all independent sampling strata were numbered sequentially from 1 to h; within each sampling stratum, first-stage sampling units were numbered from 1 to nh. Care was taken to ensure that there were at least two responding units in each stratum. For instances in which a stratum did not have at least two responding units, the stratum was combined with an adjacent stratum. Stratum and first-stage unit identifiers are provided in the data file. Each main sampling weight has corresponding stratum and PSU identifiers for use with the Taylor series method. The stratum and PSU identifiers begin with the same characters as the main sampling weight and end with either STR or PSU. For example, the stratum and PSU identifiers corresponding to weight W8C8P_20 are W8C8P_2STR and W8C8P_2PSU, respectively.
4.3.4.3 Specifications for Computing Standard Errors
For the jackknife replication method, the main sampling weight, the replicate weights, and the method of replication must be specified. All analyses of the ECLS-K:2011 data using the replication method should be done using JK2. As an example, an analyst using the main sample weight W8C8P_20 to compute child-level estimates of mean reading scores for fourth grade would need to specify W8C8P_20 as the main sampling weight, W8C8P_21 to W8C8P_280 as the replicate weights, and JK2 as the method of replication. Note that there are 40 replicate weights for each weight that involves the any of the fall data collections, and 80 replicate weights for each weight not involving any of the fall data collections.
For the Taylor series method, the main sampling weight, the sample design, the nesting
stratum, and PSU variables must be specified. As an example, an analyst using the main sample weight
12 For the ECLS-K:2011, the sample of PSUs was selected using the Durbin method. In this method, two PSUs were selected per stratum without replacement with probability proportional to size and known joint probability of inclusion in such a way to allow variances to be estimated as if the units had been selected with replacement.

4-45
W8C8P_20 to compute child-level estimates of mean reading scores for fourth grade must specify the main sampling weight (W8C8P_20), the stratum variable (W8C8P_2STR), and the PSU variable (W8C8P_2PSU). The “with replacement” sample design option, WR, must also be specified if using SUDAAN.
4.3.5 Use of Design Effects
An important analytic device is to compare the statistical efficiency of survey estimates from a complex sample survey such as the ECLS-K:2011 with what would have been obtained in a hypothetical and usually impractical simple random sample (SRS) of the same size. In a stratified clustered design, stratification generally leads to a gain in efficiency over simple random sampling, but clustering has the opposite effect because of the positive intracluster correlation of the units in the cluster. The basic measure of the relative efficiency of the sample is the design effect (DEFF), defined as the ratio, for a given statistic, of the variance estimate under the actual sample design to the variance estimate that would be obtained with an SRS of the same sample size:
DESIGN
SRS
VARDEFFVAR
= .
The root design effect (DEFT) is the square root of the design effect:
DESIGN
SRS
SEDEFT DEFFSE
= =
where SE is the standard error of the estimate.
As discussed above, jackknife replication and Taylor Series can be used to compute more
precise standard errors for data from complex surveys. If statistical analyses are conducted using software packages that assume the data were collected using simple random sampling (i.e., adjustments are not made using jackknife replication or the Taylor series method), the standard errors will be calculated under this assumption and will be incorrect. They can be adjusted using the average DEFT, although this method is less precise than JK or Taylor series.13 The standard error of an estimate under the actual sample design can be approximated as the product of the DEFT and the standard error assuming simple random sampling.
13 Common procedures in SAS, SPSS, and Stata assume simple random sampling. Data analysts should use the SURVEY procedure (SAS), the Complex Samples module (SPSS), or the SVY command (Stata) to account for complex samples.

4-46
In the ECLS-K:2011, a large number of data items were collected from children, parents, teachers, school administrators, and before- and after-school care providers. Each item has its own design effect that can be estimated from the survey data. Standard errors and design effects are presented in the tables below for selected items from the study to allow analysts to see the range of standard errors and design effects for the study variables. They were computed using the paired jackknife replication method in the statistical software package WesVar.
However, as discussed in section 4.3.4, not all statistical analysis software packages have
procedures to compute the variance estimate or standard error using the replication method, and some analysts may not have access to software packages that do have such procedures. In such situations the correct variance estimate or standard error can be approximated using the design effect or the root design effect.
As the first step in the approximation of a standard error, the analyst should normalize the
overall sample weights for packages that use the weighted population size (N) in the calculation of standard errors (SPSS but not SAS). The normalized weight will sum to the sample size (n) and is calculated as
𝑡𝑡𝑡𝑡𝑛𝑛𝑛𝑛𝑛𝑛𝑛𝑛𝑤𝑤𝑛𝑛𝑑𝑑𝑑𝑑 𝑤𝑤𝑑𝑑𝑤𝑤𝑤𝑤ℎ𝑡𝑡 = 𝑤𝑤𝑑𝑑𝑤𝑤𝑤𝑤ℎ𝑡𝑡 ×𝑡𝑡𝑁𝑁
where n is the sample size (i.e., the number of cases with a valid main sampling weight) and N is the sum of weights. See table 4-16 for the sample size n and the sum of weights N.
As the second step in the approximation, the standard errors produced by the statistical software, the test statistics, or the sample weight used in analysis can be adjusted to reflect the actual complex design of the study. To adjust the standard error of an estimate, the analyst should multiply the standard error produced by the statistical software by the square root of the DEFF or the DEFT as follows:
DESIGN SRS SRSSE DEFF VAR DEFT SE= × = ×
A standard statistical analysis package can be used to obtain VARSRS and SESRS. The DEFF
and DEFT used to make adjustments can be calculated for specific estimates, can be the median DEFF and DEFT across a number of variables, or can be the median DEFF and DEFT for a specific subgroup in the population.

4-47
Adjusted standard errors can then be used in hypothesis testing, for example, when calculating t and F statistics. A second option is to adjust the t and F statistics produced by statistical software packages using unadjusted (i.e., SRS) standard errors. To do this, first conduct the desired analysis weighted by the normalized weight and then divide a t statistic by the DEFT or divide an F statistic by the DEFF. A third alternative is to create a new analytic weight variable in the data file by dividing the normalized analytic weight by the DEFF and using the adjusted weight in the analyses.
Table 4-17 shows estimates, standard errors, and design effects for 58 means and proportions
selected from the fourth-grade data collection. Table 4-18 shows the median design effects for the same items but for subgroups. For each survey item, table 4-17 presents the number of cases for which data are nonmissing, the estimate, the standard error taking into account the actual sample design (Design SE), the standard error assuming SRS (SRS SE), the root design effect (DEFT), and the design effect (DEFF). Standard errors (Design SE) were produced in WesVar using JK2 based on the actual ECLS-K:2011 complex design. For each survey item, the variable name as it appears in the data file is also provided in the table.
Overall, design effects for the fourth grade are slightly higher than for the third grade (median
design effect of 4.003 for fourth grade, compared with 3.815 for third grade). This is because of the smaller sample sizes in fourth grade due to nonresponse, and also for the inclusion of the items from the mathematics/science teacher questionnaire that apply to only half of the sample in each case. As was the case in earlier years, design effects for the teacher-level data and the school-level data are quite large compared to the design effects of items coming from the child assessment or parent interview because the intraclass correlation is 100 percent for children in the same class with the same teacher and for children in the same school.

4-48
Table 4-17. Standard errors and design effects for selected survey items, fourth grade: Spring 2015 Survey item Variable n Estimate SE SESRS DEFT DEFF Scores (mean)1, 2
Mathematics scale score X8MSCALK4 10,967 109.01 0.352 0.146 2.406 5.788 Reading scale score X8RSCALK4 10,961 122.17 0.244 0.124 1.970 3.881 Science scale score X8SSCALK4 10,957 65.66 0.295 0.111 2.665 7.101 Mathematics theta score X8MTHETK4 10,967 3.42 0.018 0.007 2.409 5.802 Reading theta score X8RTHETK4 10,961 2.90 0.012 0.006 1.999 3.997 Science theta score X8STHETK4 10,957 2.61 0.021 0.008 2.630 6.917 Difference in mathematics scale score between
spring third grade and spring fourth grade X8MSCALK4 –
X7MSCALK4 10,876 7.38 0.143 0.070 2.057 4.231 Difference in reading scale score between
spring third grade and spring fourth grade X8RSCALK4 –
X7RSCALK4 10,871 6.29 0.161 0.076 2.114 4.468 Difference in science scale score between
spring third grade and spring fourth grade X8SSCALK4 –
X7SSCALK4 10,862 5.96 0.103 0.061 1.681 2.825 Difference in mathematics theta score between
spring third grade and spring fourth grade X8MTHETK4 –
X7MTHETK4 10,876 0.37 0.007 0.003 2.067 4.274 Difference in reading theta score between
spring third grade and spring fourth grade X8RTHETK4 –
X7RTHETK4 10,871 0.28 0.007 0.003 2.116 4.476 Difference in science theta score between spring
third grade and spring fourth grade X8STHETK4 –
X7STHETK4 10,862 0.41 0.007 0.004 1.567 2.454 Approaches to Learning-Teacher X8TCHAPP 8,431 3.09 0.010 0.007 1.346 1.813 Externalizing Problem Behaviors -Teacher X8TCHEXT 8,407 1.65 0.010 0.006 1.609 2.588 Internalizing Problem Behaviors -Teacher X8TCHINT 8,359 1.58 0.009 0.006 1.468 2.154 Interpersonal Skills -Teacher X8TCHPER 8,316 3.12 0.011 0.007 1.559 2.431 Self-control -Teacher X8TCHCON 8,298 3.28 0.011 0.007 1.602 2.567
Student characteristics from parent interview (percent)3
Parent is currently married/in civil union/in domestic partnership P8CURMAR 9,062 70.62 0.962 0.478 2.011 4.044
At least one parent has a high school diploma or equivalent
X8PAR1ED_I, X8PAR2ED_I 9,081 91.78 0.501 0.289 1.736 3.014
Child cares for self P8SELFCA 8,790 8.35 0.429 0.295 1.453 2.111 Child participated in organized athletic
activities P8ATHLET 8,875 63.19 0.818 0.512 1.599 2.556 Child participated in performing arts programs P8PERFRM 8,870 23.56 0.603 0.450 1.339 1.793 Child has art classes or lessons P8ARTLSN 8,869 11.86 0.465 0.343 1.356 1.838 Parent volunteered at school P8VOLSCH 9,060 47.19 1.103 0.524 2.103 4.423 Parent used computer to get information from
school P8CMPSCH 9,067 80.45 0.962 0.416 2.311 5.340 Often or sometimes true that parent could not
afford balanced meals in last 12 months P8BLMEAL 8,613 9.90 0.501 0.322 1.558 2.427 See notes at end of table.

4-49
Table 4-17. Standard errors and design effects for selected survey items, fourth grade: Spring 2015—Continued
Survey item Variable n Estimate SE SESRS DEFT DEFF
Student characteristics from teacher questionnaire (percent)2
Teacher took course to address using assessment data for teaching reading A8DATRD 8,384 67.16 1.266 0.513 2.468 6.093
Teacher has regular or standard state certificate or advanced professional certificate A8STATCT 8,425 90.81 0.630 0.315 2.002 4.009
Teacher has bachelor’s degree or higher A8HGHSTD 8,461 99.79 0.105 0.050 2.104 4.428 Teacher agreed/strongly agreed that school
administrator was encouraging of staff A8ENCOUR 8,401 82.03 1.065 0.419 2.543 6.468 Teacher agreed/strongly agreed that child
misbehavior interfered with teaching A8MISBHV 8,408 28.62 1.167 0.493 2.368 5.606 More than 50 percent of parents volunteered
regularly A8REGHLP 8,392 7.45 0.609 0.287 2.125 4.517 Student reading skills were below grade level as
rated by reading teacher G8RTREAD 8,428 25.50 0.804 0.475 1.694 2.870 Student received individual tutoring in
reading/language arts G8TTRRD 8,413 25.65 0.859 0.476 1.803 3.251 Parent was very involved at the school G8PARIN 8,373 27.10 0.828 0.486 1.704 2.905 Student was in program to learn English skills G8PRGES 1,475 46.01 2.716 1.298 2.093 4.381 Student usually worked to best ability in math M8BESABL 4,193 49.87 0.816 0.772 1.056 1.116 Student math skills were below grade level as
rated by math teacher M8RTMAT 4,187 22.34 0.857 0.644 1.332 1.773 Student solved math problems in small groups
almost every day M8PRBGRP 4,162 56.25 1.574 0.769 2.047 4.191 Student used computer for math almost every
day M8COMPMT 4,161 19.56 1.289 0.615 2.096 4.392 Student usually worked to best ability in science N8BESABL 4,191 53.25 0.933 0.771 1.210 1.464 Student science skills were below grade level as
rated by science teacher N8RTSCI 4,180 15.48 0.729 0.559 1.303 1.698 Student worked with others on science project
almost every day N8SCIPRJ 4,152 9.01 0.951 0.445 2.139 4.577 Student used computer for science almost every
day N8SCICMP 4,160 4.24 0.682 0.312 2.183 4.765 See notes at end of table.

4-50
Table 4-17. Standard errors and design effects for selected survey items, spring fourth grade: Spring 2015—Continued
Survey item Variable n Estimate SE SESRS DEFT DEFF School characteristics from school
administrator questionnaire (percent)2 Taught classroom programs provided by school
at least once a year S8CLASPR 8,070 99.00 0.294 0.111 2.660 7.075 School had staff in computer technology S8CTECYN 8,045 74.55 1.981 0.486 4.080 16.646 School used electronic communication with
parents several times a month S8ELECOM 8,045 40.11 2.329 0.546 4.262 18.165 School used Response to Intervention S8RTLUSE 8,020 85.64 1.319 0.392 3.369 11.347 Received Title I funding S8TT1 7,164 73.33 2.252 0.523 4.310 18.572 Bullying happened on occasion S8BULLY 8,048 72.77 1.318 0.496 2.655 7.050 Crime in the area of the school was somewhat of
a problem or a big problem S8CRIME 606 36.24 3.667 1.953 1.878 3.527 Other student characteristics (mean)1,3
Student’s age (in months) X8AGE 10,988 121.05 0.109 0.043 2.533 6.417 Student’s height X8HEIGHT 10,716 55.65 0.043 0.029 1.471 2.163 Student’s weight X8WEIGHT 10,629 86.76 0.335 0.244 1.371 1.881 Student’s body mass index (BMI) X8BMI 10,616 19.49 0.060 0.043 1.389 1.928 Total number of persons in household X8HTOTAL 9,081 4.66 0.027 0.015 1.829 3.344 Total number of siblings in household X8NUMSIB 9,081 1.62 0.024 0.012 1.972 3.890 Total number of persons in household less than
18 years of age X8LESS18 9,063 2.55 0.022 0.012 1.881 3.537 1 Estimates of assessment scores (X8), age (X8), height (X8), weight (X8), and BMI (X8) computed using weight W8C8P_20. 2 Estimates of variables from the teacher (A8), reading teacher (G8), and school administrator questionnaires (S8) computed using weight W8C28P_8T80. Estimates of variables from the math (M8) or science (N8) teacher and school administrator questionnaires computed using weight W8C28P_8T8Z0. 3 Estimates of variables from the parent interview (P8) computed using weight W8C28P_8A0. NOTE: SE is the standard error based on the sample design. SEsrs is the standard error assuming simple random sampling. DEFT is the root design effect. DEFF is the design effect. Estimates produced with the restricted-use file. Due to top- and bottom-coding, the same estimates may not be obtained from the public-use file. SOURCE: U.S. Department of Education, National Center for Education Statistics, Early Childhood Longitudinal Study, Kindergarten Class of 2010–11 (ECLS-K:2011), spring 2015.
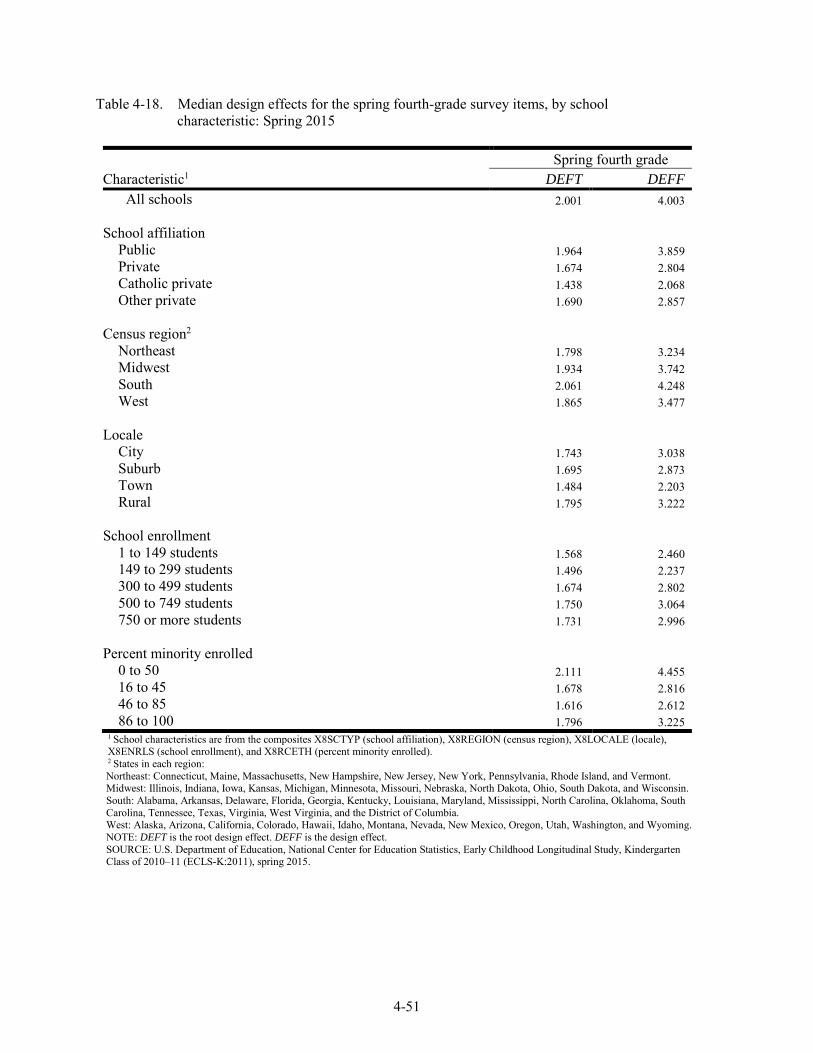
4-51
Table 4-18. Median design effects for the spring fourth-grade survey items, by school characteristic: Spring 2015
Characteristic1 Spring fourth grade
DEFT DEFF All schools 2.001 4.003
School affiliation
Public 1.964 3.859 Private 1.674 2.804 Catholic private 1.438 2.068 Other private 1.690 2.857
Census region2
Northeast 1.798 3.234 Midwest 1.934 3.742 South 2.061 4.248 West 1.865 3.477
Locale
City 1.743 3.038 Suburb 1.695 2.873 Town 1.484 2.203 Rural 1.795 3.222
School enrollment
1 to 149 students 1.568 2.460 149 to 299 students 1.496 2.237 300 to 499 students 1.674 2.802 500 to 749 students 1.750 3.064 750 or more students 1.731 2.996
Percent minority enrolled
0 to 50 2.111 4.455 16 to 45 1.678 2.816 46 to 85 1.616 2.612 86 to 100 1.796 3.225
1 School characteristics are from the composites X8SCTYP (school affiliation), X8REGION (census region), X8LOCALE (locale), X8ENRLS (school enrollment), and X8RCETH (percent minority enrolled). 2 States in each region: Northeast: Connecticut, Maine, Massachusetts, New Hampshire, New Jersey, New York, Pennsylvania, Rhode Island, and Vermont. Midwest: Illinois, Indiana, Iowa, Kansas, Michigan, Minnesota, Missouri, Nebraska, North Dakota, Ohio, South Dakota, and Wisconsin. South: Alabama, Arkansas, Delaware, Florida, Georgia, Kentucky, Louisiana, Maryland, Mississippi, North Carolina, Oklahoma, South Carolina, Tennessee, Texas, Virginia, West Virginia, and the District of Columbia. West: Alaska, Arizona, California, Colorado, Hawaii, Idaho, Montana, Nevada, New Mexico, Oregon, Utah, Washington, and Wyoming. NOTE: DEFT is the root design effect. DEFF is the design effect. SOURCE: U.S. Department of Education, National Center for Education Statistics, Early Childhood Longitudinal Study, Kindergarten Class of 2010–11 (ECLS-K:2011), spring 2015.

This page intentionally left blank.

5-1
5. RESPONSE RATES
This chapter presents unit response rates and overall response rates for the different instruments included in the fourth-grade round of data collection (spring 2015) for the ECLS-K:2011. A unit response rate is the ratio of the number of units with a completed interview, questionnaire, or assessment (for example, the units are students with a completed assessment) to the number of units sampled and eligible for the interview, questionnaire, or assessment. Unit response rates are used to describe the outcomes of data collection activities and to measure the quality of the study. The overall response rate indicates the percentage of eligible units with a completed interview, questionnaire, or assessment, taking all survey stages into account.
5.1 Study Instruments
For the ECLS-K:2011 fourth-grade data collection, there were several survey instruments, as shown in exhibit 5-1. Exhibit 5-1 also indicates how much information had to be collected for each instrument for it to be considered “complete” and, therefore, for a case to be considered a respondent to that instrument for the purpose of calculating response rates. Response rates are presented in section 5.2 for all of these instruments.

5-2
Exhibit 5-1. ECLS-K:2011 survey instruments and definition of completed instrument: Spring 2015
Survey instrument Spring 2015 Definition of completed instrument Child assessment Yes Student has at least one of the following: (1) at least one
assessment score (mathematics, reading, or science); (2) at least one executive function score (DCCS, numbers reversed, or Flanker)1; (3) at least one completed item in the child questionnaire (CQ; or (4) has height or weight measurement
Parent interview Yes Parent answered all applicable items in the family structure section of the questionnaire (FSQ) through item FSQ200 on current marital status.
Teacher teacher-level questionnaire
Yes Teacher (linked to sampled children) completed at least one item2 in this questionnaire
Teacher child- and classroom-level questionnaire
Yes Teacher (linked to sampled children) completed at least one item2 in this questionnaire
Teacher-level special education teacher questionnaire
Yes Student has special education teacher, and teacher completed at least one item2 in this questionnaire
Child-level special education teacher questionnaire
Yes Student has special education teacher, and teacher completed at least one item2 in this questionnaire
School administrator questionnaire3
Yes School administrator completed at least one item2 in this questionnaire
1 In first, second, and third grade, numbers reversed and DCCS were the only executive function scores included in this criterion. 2 The one item that needed to be completed could have been anywhere in the child- and classroom-level questionnaire. 3 In the fourth-grade data collection, there were two versions of the school administrator questionnaire. SAQ-A was given to administrators in schools that were new to the study or administrators in schools for which there was no previously completed SAQ. SAQ-B was given to administrators in schools that had a previously completed SAQ.
SOURCE: U.S. Department of Education, National Center for Education Statistics, Early Childhood Longitudinal Study, Kindergarten Class of 2010–11 (ECLS-K:2011), spring 2015.
5.2 Unit Response Rates and Overall Response Rates
The tables in this section present both weighted and unweighted response rates for the different components of data collection shown above in exhibit 5-1 (the child assessment, parent interview, teacher teacher-level questionnaire, teacher child- and classroom-level questionnaire, school administrator questionnaire (SAQ), and special education teacher questionnaires) computed at the student level. Response rates for all students and response rates by selected school and student background characteristics are provided.

5-3
Only weighted rates are discussed in this section. The unweighted rate provides a useful description of the success of the operational aspects of the survey. The weighted rate gives a better description of the success of the survey with respect to the population sampled since the weights allow for inference of the sample data (including response status) to the population level. Both rates are usually similar unless the probabilities of selection and the unit response rates in the categories with different selection probabilities vary considerably. All of the unit response rates discussed in this chapter are weighted unless noted specifically in the text, since the main purpose of this chapter is to describe the success of the survey with respect to the survey population. The weights used in the computation of the student-level unit response rates are the fourth-grade student base weights. For a description of these weights, see chapter 4.
In order to compute response rates by different characteristics, the selected characteristics must be known for both respondents and nonrespondents. Multiple sources were used to obtain information on school characteristics in order to have data that were as complete as possible for the calculation of response rates. For respondents, data for school census region, school locale, school type, and school enrollment come from the composite variables derived for the data file. For nonrespondents, school characteristic variables were computed for use in the response rate calculations using the same process that was used to compute the data file composite variables. Information on the derivation of variables indicating school region (X8REGION) and school locale (X8LOCALE) is provided in section 7.5.4.7. Information on the derivation of the variable indicating school type (X8SCTYP) is provided in section 7.5.4.1. Information on the derivation of the variable indicating school enrollment (X8ENRLS) is provided in section 7.5.4.3. Information on the derivation of the variable indicating percent minority enrollment (X8RCETH) is provided in section 7.5.4.4.
Information on the child characteristics presented in the tables comes from the fourth-grade data collection. Information on student sex comes from the composite variable X_CHSEX_R (described in section 7.5.1.3). Information on student race/ethnicity comes from the composite variable X_RACETH_R (described in section 7.5.1.4). Information on student year of birth comes from the composite variable X_DOBYY_R (described in section 7.5.1.1). These composites were derived for all base-year respondents; therefore, they exist for fourth-grade respondents as well as nonrespondents.
When necessary, comparisons in this chapter were examined to ensure that the differences discussed were statistically significant at the 95 percent level of confidence. For example, this was done for tables in sections 5.3 when comparing characteristics of the data using different weights, or when comparing data from different years. Significance tests were not conducted for statements related to response rates in
5-4
section 5.2 because the base weights were used to produce all rates, which are calculated over the same sample of eligible cases.
The overall response rate indicates the percentage of possible interviews, questionnaires, or assessments completed, taking all survey stages into account. In the base-year data collection, children were identified for assessment in a two-stage process. The first stage involved the recruitment of sampled schools to participate in the study. Assessments were then conducted for the sampled children whose parents consented to the children’s participation. In fourth grade, children were contacted for follow-up unless they (1) became ineligible for the study because they had moved out of the country or had died, or (2) were movers who were not sampled for follow-up and, therefore, were excluded from data collection. The response rate for the child assessment is the percentage of sampled and eligible children not subsampled out as an unfollowed mover who completed the assessment. The overall weighted response rate is the product of the base-year before-substitution school response rate for all schools (62.7 percent) and the fourth-grade weighted child assessment response rate. The overall unweighted response rate is the product of the unweighted base-year before-substitution response rate for all schools (61.3 percent) and the fourth-grade unweighted child assessment response rate. In the overall response rate tables, the response rates by characteristic are also a product of the fourth-grade response rate by the corresponding (weighted or unweighted) overall base-year rate.
Because children were sampled in the base year and school participation after the base year was not required for the children to stay in the study, the school response rates used to calculate the student-level response rates in these tables are those from the base year (the base-year response rates are presented in table 5-2 of the Early Childhood Longitudinal Study, Kindergarten Class of 2010–11 (ECLS-K:2011), User’s Manual for the ECLS-K:2011 Kindergarten Data File and Electronic Codebook, Public Version (NCES 2015-074) (Tourangeau et al. 2015), hereinafter referred to as the base-year User’s Manual).
In the fourth-grade data collection, all 18,174 base-year respondents were part of the sample. Of these, about 180 became ineligible for the data collection because they had moved out of the country sometime between the base year and the start of the fourth-grade data collection and 5 had died. An additional 3,030 students were not included in the data collection because they were movers who were subsampled out of the study (see section 4.2.3 for information on mover subsampling). After these exclusions for ineligibility and subsampling, the number of children followed for data collection in fourth grade was about 14,960. This number is the denominator used to calculate the unweighted parent interview response rate. This is also the basis of the denominator used to calculate the unweighted child assessment response rate. However, children who were excluded from the assessment because the study did not provide needed accommodations for a disability, such as an assessment in Braille, are not included in the calculation
5-5
of response rates for the child assessment. Therefore, the denominator used to calculate the unweighted child assessment response rate is about 14,880. All children enrolled in school were eligible for a reading teacher questionnaire; therefore, the denominator used to calculate the reading teacher response rate is 12,853. Similarly, all children enrolled in school were eligible for a school administrator questionnaire; therefore, the denominator used to calculate the school administrator response rate also is 12,853. This denominator is lower than the ones used to calculate response rates for the child assessment and parent interview because it excludes students who were not eligible for the reading teacher and administrator questionnaire components: homeschooled children and children who did not have either a complete child assessment score or parent interview (per the definition of complete provided in exhibit 5-1) for the fourth-grade collection. Because half of the cases were selected for a math teacher questionnaire and the other half for a science teacher questionnaire, the denominators used to calculate the mathematics/science teacher response rates are 6,412 and 6,441, respectively. Again, these numbers vary because while a child may have been selected for a particular questionnaire, the child may not have been eligible because of the exclusion of homeschooled children and children who did not have either a complete child assessment score or parent interview (per the definition of complete provided in exhibit 5-1) for the fourth-grade collection. The parent and teacher rates are computed at the student level, meaning they indicate the percentages of students for whom a parent interview was completed or for whom a teacher questionnaire was received. The school administrator rate is also computed at the student level and indicates the percentage of students whose school administrator completed a questionnaire. There were two versions of the administrator questionnaire but response rates were not calculated separately for each version since a student would only have data for one version.
Table 5-1 presents weighted and unweighted response rates for the child assessment and the parent interview in the fourth-grade data collection by selected school characteristics. Response rates for the child questionnaire are the same as for the child assessment because all children with assessment data have child questionnaire data and vice-versa. Researchers should note that the “unknown/homeschool group” has a low response rate, in large part because this group includes unlocatable cases who are, by default, nonrespondents. This unknown/homeschool group (1,994 cases) is about 13 percent of the overall sample of eligible cases. Because their school characteristics are unknown, cases in this group cannot be included in a specific school characteristics category. This may have an impact on the calculation of the response rates by school characteristics that should be considered. Specifically, including these unlocatable cases in a separate category likely results in response rates by different school characteristics being higher than they would be if the unlocatable cases were included as nonrespondents when calculating response rates for the different school characteristic categories. Not including the “unknown” subgroups, the lowest response rate by school characteristics for the child assessment/child questionnaire was for students in non-Catholic private schools (81.0 percent). For other subgroups, response rates ranged from 86.5 to 96.4
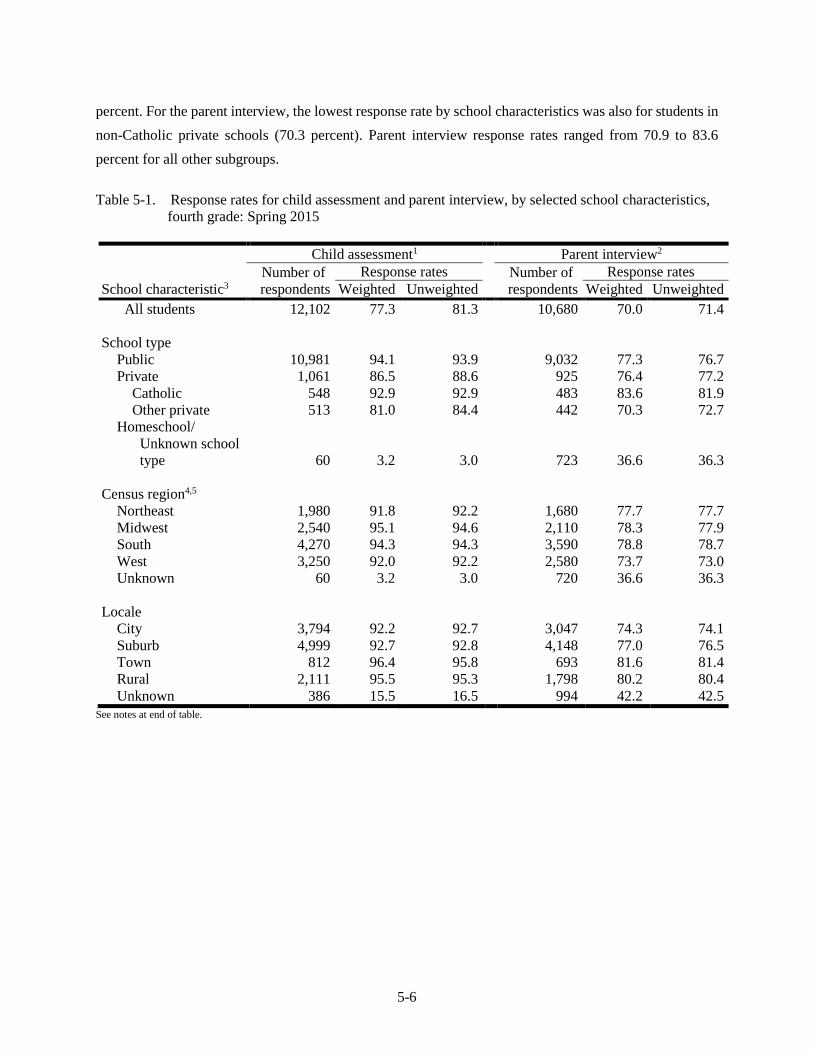
5-6
percent. For the parent interview, the lowest response rate by school characteristics was also for students in non-Catholic private schools (70.3 percent). Parent interview response rates ranged from 70.9 to 83.6 percent for all other subgroups.
Table 5-1. Response rates for child assessment and parent interview, by selected school characteristics, fourth grade: Spring 2015
School characteristic3
Child assessment1 Parent interview2
Number of respondents
Response rates Number of respondents
Response rates Weighted Unweighted Weighted Unweighted
All students 12,102 77.3 81.3 10,680 70.0 71.4
School type Public 10,981 94.1 93.9 9,032 77.3 76.7 Private 1,061 86.5 88.6 925 76.4 77.2
Catholic 548 92.9 92.9 483 83.6 81.9 Other private 513 81.0 84.4 442 70.3 72.7
Homeschool/ Unknown school type 60 3.2 3.0 723 36.6 36.3
Census region4,5
Northeast 1,980 91.8 92.2 1,680 77.7 77.7 Midwest 2,540 95.1 94.6 2,110 78.3 77.9 South 4,270 94.3 94.3 3,590 78.8 78.7 West 3,250 92.0 92.2 2,580 73.7 73.0 Unknown 60 3.2 3.0 720 36.6 36.3
Locale City 3,794 92.2 92.7 3,047 74.3 74.1 Suburb 4,999 92.7 92.8 4,148 77.0 76.5 Town 812 96.4 95.8 693 81.6 81.4 Rural 2,111 95.5 95.3 1,798 80.2 80.4 Unknown 386 15.5 16.5 994 42.2 42.5
See notes at end of table.

5-7
Table 5-1. Response rates for child assessment and parent interview, by selected school characteristics, fourth grade: Spring 2015—Continued
School characteristic3
Child assessment1 Parent interview2 Number of
respondents4 Response rates Number of
respondents Response rates
Weighted Unweighted Weighted Unweighted School enrollment
1 to 149 students 442 88.4 91.1 369 74.2 75.8 150 to 299 students 1,429 92.9 93.3 1,187 76.4 77.2 300 to 499 students 3,437 93.5 93.3 2,867 77.8 77.3 500 to 749 students 4,433 94.2 94.1 3,660 77.8 77.1 750 or more students 2,281 93.9 93.5 1,852 76.7 75.7 Unknown 80 3.9 3.9 745 36.8 36.6
Percent minority enrolled
0 to 15 2,839 94.7 94.5 2,470 81.9 81.7 16 to 45 3,363 93.8 93.9 2,882 80.0 80.0 46 to 85 2,875 92.2 92.0 2,338 75.0 74.4 86 to 100 2,921 93.6 93.8 2,226 70.9 71.1 Unknown 104 5.0 5.1 764 37.4 37.1
1 Student had scoreable reading or mathematics or science data, or at least one executive function score, or a height or weight measurement, or a completed item from the child questionnaire. 2 Parent answered all applicable items in the family structure section of the questionnaire (FSQ) through item FSQ200 on current marital status. 3 School characteristics were taken from the fourth-grade school administrator questionnaire (SAQ) when available. When fourth-grade SAQ data were not available, information was taken from prior-round SAQ responses, the Common Core of Data (CCD), or the Private School Survey (PSS). The versions of the school characteristics variables used to produce this table were specially derived for the User’s Manual and are not included in the data file. 4 States in each region: Northeast: Connecticut, Maine, Massachusetts, New Hampshire, New Jersey, New York, Pennsylvania, Rhode Island, and Vermont. Midwest: Illinois, Indiana, Iowa, Kansas, Michigan, Minnesota, Missouri, Nebraska, North Dakota, Ohio, South Dakota, and Wisconsin. South: Alabama, Arkansas, Delaware, Florida, Georgia, Kentucky, Louisiana, Maryland, Mississippi, North Carolina, Oklahoma, South Carolina, Tennessee, Texas, Virginia, West Virginia, and the District of Columbia. West: Alaska, Arizona, California, Colorado, Hawaii, Idaho, Montana, Nevada, New Mexico, Oregon, Utah, Washington, and Wyoming. 5 Sample sizes rounded to the nearest 10 and, therefore, may not sum to total. NOTE: The weighted response rates were calculated using the fourth-grade student base weight. SOURCE: U.S. Department of Education, National Center for Education Statistics, Early Childhood Longitudinal Study, Kindergarten Class of 2010–11 (ECLS-K:2011), spring 2015.
Table 5-2 presents weighted and unweighted response rates for the child assessment and the parent interview in the fourth-grade data collection by selected student characteristics. For the child assessment, Hispanic students had the highest response rate at 81.9 percent, while the lowest child assessment response rates were for the following subgroups: Black (68.5 percent), and American Indian/Alaska Native (70.6 percent), not accounting for subgroups with very small sample size (fewer than 100 children). For the parent interview, the highest response rate was for White students (74.5 percent), while the lowest parent response rates were for the following subgroups: Black students (57.1 percent) and Native Hawaiians/Other Pacific Islanders (58.0 percent).
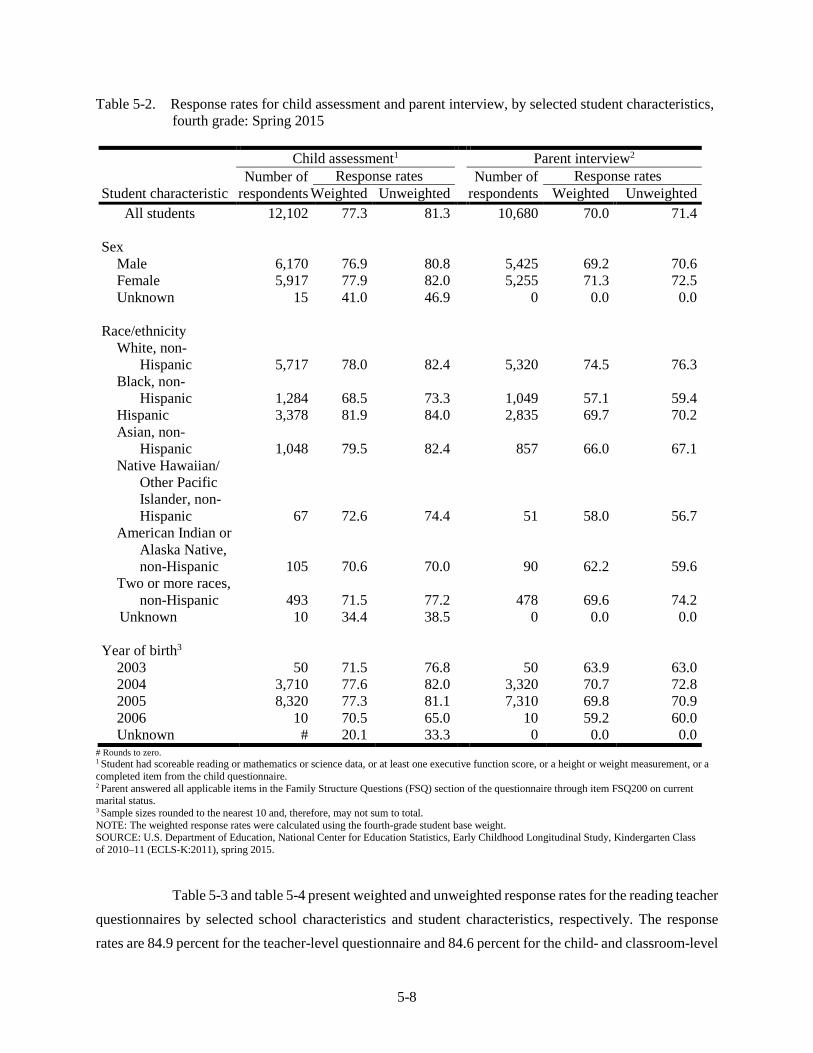
5-8
Table 5-2. Response rates for child assessment and parent interview, by selected student characteristics, fourth grade: Spring 2015
Student characteristic
Child assessment1 Parent interview2
Number of respondents
Response rates Number of respondents
Response rates Weighted Unweighted Weighted Unweighted
All students 12,102 77.3 81.3 10,680 70.0 71.4
Sex Male 6,170 76.9 80.8 5,425 69.2 70.6 Female 5,917 77.9 82.0 5,255 71.3 72.5 Unknown 15 41.0 46.9 0 0.0 0.0
Race/ethnicity White, non-
Hispanic 5,717 78.0 82.4 5,320 74.5 76.3 Black, non-
Hispanic 1,284 68.5 73.3 1,049 57.1 59.4 Hispanic 3,378 81.9 84.0 2,835 69.7 70.2 Asian, non-
Hispanic 1,048 79.5 82.4 857 66.0 67.1 Native Hawaiian/
Other Pacific Islander, non-Hispanic 67 72.6 74.4 51 58.0 56.7
American Indian or Alaska Native, non-Hispanic 105 70.6 70.0 90 62.2 59.6
Two or more races, non-Hispanic 493 71.5 77.2 478 69.6 74.2
Unknown 10 34.4 38.5 0 0.0 0.0
Year of birth3
2003 50 71.5 76.8 50 63.9 63.0 2004 3,710 77.6 82.0 3,320 70.7 72.8 2005 8,320 77.3 81.1 7,310 69.8 70.9 2006 10 70.5 65.0 10 59.2 60.0 Unknown # 20.1 33.3 0 0.0 0.0
# Rounds to zero. 1 Student had scoreable reading or mathematics or science data, or at least one executive function score, or a height or weight measurement, or a completed item from the child questionnaire. 2 Parent answered all applicable items in the Family Structure Questions (FSQ) section of the questionnaire through item FSQ200 on current marital status. 3 Sample sizes rounded to the nearest 10 and, therefore, may not sum to total. NOTE: The weighted response rates were calculated using the fourth-grade student base weight. SOURCE: U.S. Department of Education, National Center for Education Statistics, Early Childhood Longitudinal Study, Kindergarten Class of 2010–11 (ECLS-K:2011), spring 2015.
Table 5-3 and table 5-4 present weighted and unweighted response rates for the reading teacher questionnaires by selected school characteristics and student characteristics, respectively. The response rates are 84.9 percent for the teacher-level questionnaire and 84.6 percent for the child- and classroom-level
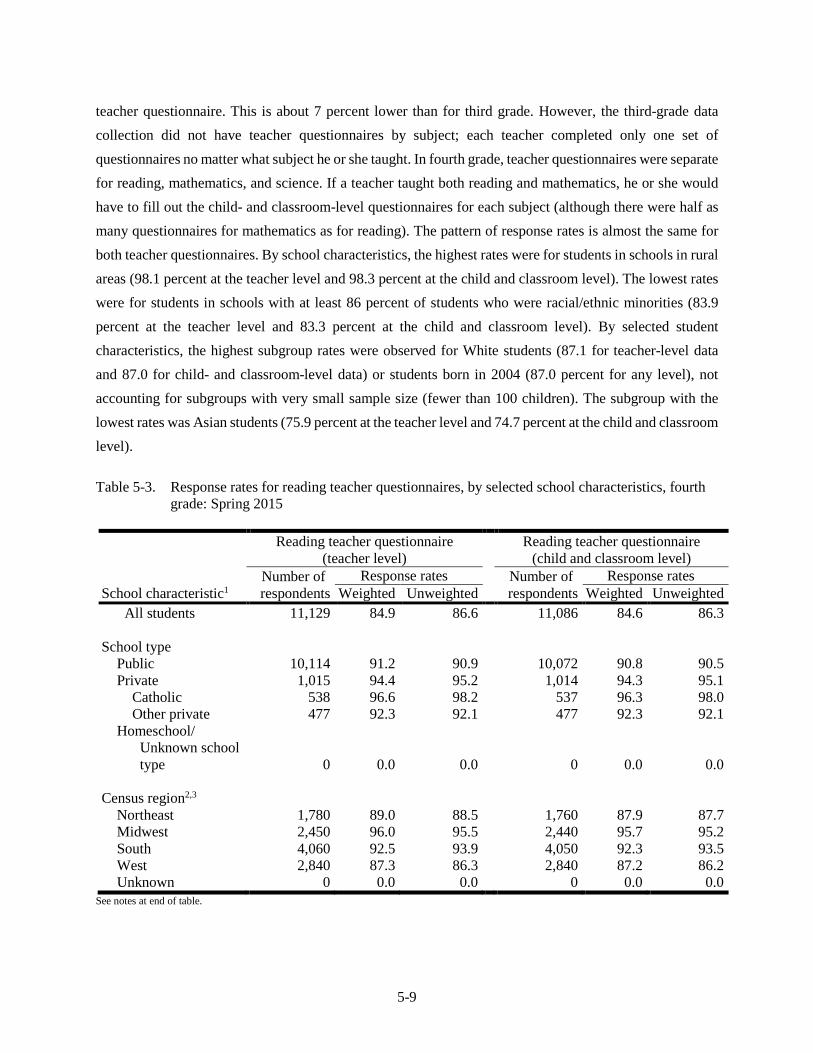
5-9
teacher questionnaire. This is about 7 percent lower than for third grade. However, the third-grade data collection did not have teacher questionnaires by subject; each teacher completed only one set of questionnaires no matter what subject he or she taught. In fourth grade, teacher questionnaires were separate for reading, mathematics, and science. If a teacher taught both reading and mathematics, he or she would have to fill out the child- and classroom-level questionnaires for each subject (although there were half as many questionnaires for mathematics as for reading). The pattern of response rates is almost the same for both teacher questionnaires. By school characteristics, the highest rates were for students in schools in rural areas (98.1 percent at the teacher level and 98.3 percent at the child and classroom level). The lowest rates were for students in schools with at least 86 percent of students who were racial/ethnic minorities (83.9 percent at the teacher level and 83.3 percent at the child and classroom level). By selected student characteristics, the highest subgroup rates were observed for White students (87.1 for teacher-level data and 87.0 for child- and classroom-level data) or students born in 2004 (87.0 percent for any level), not accounting for subgroups with very small sample size (fewer than 100 children). The subgroup with the lowest rates was Asian students (75.9 percent at the teacher level and 74.7 percent at the child and classroom level).
Table 5-3. Response rates for reading teacher questionnaires, by selected school characteristics, fourth grade: Spring 2015
School characteristic1
Reading teacher questionnaire (teacher level)
Reading teacher questionnaire (child and classroom level)
Number of respondents
Response rates Number of respondents
Response rates Weighted Unweighted Weighted Unweighted
All students 11,129 84.9 86.6 11,086 84.6 86.3
School type Public 10,114 91.2 90.9 10,072 90.8 90.5 Private 1,015 94.4 95.2 1,014 94.3 95.1
Catholic 538 96.6 98.2 537 96.3 98.0 Other private 477 92.3 92.1 477 92.3 92.1
Homeschool/ Unknown school type 0 0.0 0.0 0 0.0 0.0
Census region2,3 Northeast 1,780 89.0 88.5 1,760 87.9 87.7 Midwest 2,450 96.0 95.5 2,440 95.7 95.2 South 4,060 92.5 93.9 4,050 92.3 93.5 West 2,840 87.3 86.3 2,840 87.2 86.2 Unknown 0 0.0 0.0 0 0.0 0.0
See notes at end of table.

5-10
Table 5-3. Response rates for reading teacher questionnaires, by selected school characteristics, fourth grade: Spring 2015 —Continued
School characteristic1
Reading teacher questionnaire (teacher level)
Reading teacher questionnaire (child and classroom level)
Number of respondents
Response rates Number of respondents
Response rates Weighted Unweighted Weighted Unweighted
Locale City 3,344 88.5 86.9 3,325 88.1 86.4 Suburb 4,630 91.0 91.5 4,608 90.5 91.0 Town 762 88.9 93.2 743 88.1 90.8 Rural 2,091 98.1 97.8 2,106 98.3 98.5 Unknown 302 28.7 30.5 304 28.8 30.7
School enrollment 1 to 149 students 424 96.1 95.1 440 97.9 98.7 150 to 299 students 1,325 93.6 92.0 1,307 92.7 90.8 300 to 499 students 3,253 93.7 93.5 3,244 93.5 93.2 500 to 749 students 4,079 89.4 90.7 4,042 88.7 89.8 750 or more students 2,043 90.7 88.7 2,048 91.0 89.0 Unknown 5 0.3 0.7 5 0.3 0.7
Percent minority enrolled
0 to 15 2,783 97.2 97.1 2,780 97.1 97.0 16 to 45 3,235 93.9 95.3 3,235 93.8 95.3 46 to 85 2,624 89.6 89.7 2,601 89.0 89.0 86 to 100 2,458 83.9 83.1 2,441 83.3 82.5 Unknown 29 3.7 4.1 29 3.7 4.1
1 School characteristics were taken from the fourth-grade school administrator questionnaire (SAQ) when available. When fourth-grade SAQ data were not available, information was taken from prior-round SAQ responses, the Common Core of Data (CCD), or the Private School Survey (PSS). The versions of the school characteristics variables used to produce this table were specially derived for the User’s Manual and are not included in the data file. 2 States in each region: Northeast: Connecticut, Maine, Massachusetts, New Hampshire, New Jersey, New York, Pennsylvania, Rhode Island, and Vermont. Midwest: Illinois, Indiana, Iowa, Kansas, Michigan, Minnesota, Missouri, Nebraska, North Dakota, Ohio, South Dakota, and Wisconsin. South: Alabama, Arkansas, Delaware, Florida, Georgia, Kentucky, Louisiana, Maryland, Mississippi, North Carolina, Oklahoma, South Carolina, Tennessee, Texas, Virginia, West Virginia, and the District of Columbia. West: Alaska, Arizona, California, Colorado, Hawaii, Idaho, Montana, Nevada, New Mexico, Oregon, Utah, Washington, and Wyoming. 3 Sample sizes rounded to the nearest 10 and, therefore, may not sum to total. NOTE: A respondent is defined as a child for whom a teacher questionnaire was returned with at least one response, and who had either child assessment or parent interview data. The weighted response rates were calculated using the fourth-grade student base weight. SOURCE: U.S. Department of Education, National Center for Education Statistics, Early Childhood Longitudinal Study, Kindergarten Class of 2010–11 (ECLS-K:2011), spring 2015.

5-11
Table 5-4. Response rates for reading teacher questionnaires, by selected student characteristics, fourth grade: Spring 2015
Student characteristic
Reading teacher questionnaire (teacher level)
Reading teacher questionnaire (child and classroom level)
Number of respondents
Response rates Number of respondents
Response rates Weighted Unweighted Weighted Unweighted
All students 11,129 84.9 86.6 11,086 84.6 86.3
Sex Male 5,692 85.1 86.7 5,669 84.9 86.4 Female 5,423 84.6 86.4 5,403 84.3 86.1 Unknown 14 96.1 93.3 14 87.9 93.3
Race/ethnicity White, non-
Hispanic 5,474 87.1 90.1 5,473 87.0 90.0 Black, non-
Hispanic 1,191 83.6 86.5 1,183 82.8 85.9 Hispanic 3,007 83.3 84.9 2,990 82.8 84.4 Asian, non-
Hispanic 843 75.9 75.5 830 74.7 74.4 Native Hawaiian/
Other Pacific Islander, non-Hispanic 56 81.8 82.4 54 79.6 79.4
American Indian or Alaska Native, non-Hispanic 99 84.9 86.1 99 84.9 86.1
Two or more races, non-Hispanic 449 80.2 82.4 447 79.7 82.0
Unknown 10 94.6 90.9 10 94.6 90.9
Year of birth1 2003 60 89.7 93.3 50 87.0 90.0 2004 3,510 87.0 89.1 3,510 87.0 89.1 2005 7,550 83.9 85.4 7,510 83.5 85.0 2006 10 71.2 66.7 10 71.2 66.7 Unknown # 100.0 100.0 # 100.0 100.0
# Rounds to zero.1 Sample sizes rounded to the nearest 10 and, therefore, may not sum to total. NOTE: A respondent is defined as a child for whom a teacher questionnaire was returned with at least one response, and who had either child assessment or parent interview data. The weighted response rates were calculated using the fourth-grade student base weight. SOURCE: U.S. Department of Education, National Center for Education Statistics, Early Childhood Longitudinal Study, Kindergarten Class of 2010–11 (ECLS-K:2011), spring 2015.

5-12
Table 5-5 and table 5-6 present weighted and unweighted response rates for the mathematics teacher questionnaires by selected school characteristics and student characteristics, respectively. The response rates are 84.8 percent for the teacher-level questionnaire and 84.7 percent for the child- and classroom-level teacher questionnaire. By school characteristics, the highest rate at the teacher level was 97.9 percent for students in schools in rural areas; it was 99.2 percent at the child and classroom level for students in the smallest schools (those with fewer than 150 students enrolled). By selected student characteristics, the rates are more similar between the teacher level and the child and classroom level, from 87.9 percent for students born in 2004 down to 74.8 and 73.8 percent for Asian students (for teacher level and child/classroom level, respectively), again not accounting for subgroups with very small sample size (fewer than 100 children).
Table 5-5. Response rates for mathematics teacher questionnaires, by selected school characteristics, fourth grade: Spring 2015
School characteristic1
Mathematics teacher questionnaire (teacher level)
Mathematics teacher questionnaire (child and classroom level)
Number of respondents
Response rates Number of respondents
Response rates Weighted Unweighted Weighted Unweighted
All students 5,551 84.8 86.6 5,534 84.7 86.3
School type Public 5,054 91.3 91.0 5,038 91.1 90.7 Private 497 93.8 94.8 496 93.7 94.7
Catholic 263 95.0 97.4 263 95.0 97.4 Other private 234 92.6 92.1 233 92.4 91.7
Homeschool/ Unknown school type 0 0.0 0.0 0 0.0 0.0
Census region2,3 Northeast 890 88.9 88.5 880 88.1 87.6 Midwest 1,210 96.1 95.4 1,210 96.2 95.4 South 2,030 92.2 93.9 2,030 91.9 93.6 West 1,420 88.0 86.5 1,420 88.1 86.5 Unknown 0 0.0 0.0 0 0.0 0.0
Locale City 1,663 88.6 87.0 1,653 88.4 86.5 Suburb 2,310 91.4 91.7 2,303 91.2 91.4 Town 386 87.7 92.8 379 87.3 91.1 Rural 1,043 97.9 97.7 1,049 98.0 98.2 Unknown 149 27.8 30.0 150 27.9 30.2
See notes at end of table.

5-13
Table 5-5. Response rates for mathematics teacher questionnaires, by selected school characteristics, fourth grade: Spring 2015 —Continued
School characteristic1
Mathematics teacher questionnaire (teacher level)
Mathematics teacher questionnaire (child and classroom level)
Number of respondents
Response rates Number of respondents
Response rates Weighted Unweighted Weighted Unweighted
School enrollment 1 to 149 students 209 97.3 95.9 217 99.2 99.5 150 to 299 students 664 93.4 91.8 657 93.1 90.9 300 to 499 students 1,612 93.6 93.4 1,606 93.4 93.1 500 to 749 students 2,047 89.5 90.6 2,036 89.1 90.1 750 or more students 1,017 91.0 89.3 1,016 91.0 89.2 Unknown 2 0.4 0.6 2 0.4 0.6
Percent minority enrolled
0 to 15 1,384 97.8 97.4 1,384 97.8 97.4 16 to 45 1,604 93.4 95.2 1,603 93.3 95.1 46 to 85 1,315 89.3 89.4 1,305 88.9 88.7 86 to 100 1,235 85.0 83.7 1,229 84.7 83.3 Unknown 13 3.0 3.6 13 3.0 3.6
1 School characteristics were taken from the fourth-grade school administrator questionnaire (SAQ) when available. When fourth-grade SAQ data were not available, information was taken from prior-round SAQ responses, the Common Core of Data (CCD), or the Private School Survey (PSS). The versions of the school characteristics variables used to produce this table were specially derived for the User’s Manual and are not included in the data file. 2 States in each region: Northeast: Connecticut, Maine, Massachusetts, New Hampshire, New Jersey, New York, Pennsylvania, Rhode Island, and Vermont. Midwest: Illinois, Indiana, Iowa, Kansas, Michigan, Minnesota, Missouri, Nebraska, North Dakota, Ohio, South Dakota, and Wisconsin. South: Alabama, Arkansas, Delaware, Florida, Georgia, Kentucky, Louisiana, Maryland, Mississippi, North Carolina, Oklahoma, South Carolina, Tennessee, Texas, Virginia, West Virginia, and the District of Columbia. West: Alaska, Arizona, California, Colorado, Hawaii, Idaho, Montana, Nevada, New Mexico, Oregon, Utah, Washington, and Wyoming. 3 Sample sizes rounded to the nearest 10 and, therefore, may not sum to total. NOTE: A respondent is defined as a child for whom a teacher questionnaire was returned with at least one response, and who had either child assessment or parent interview data. The weighted response rates were calculated using the fourth-grade student base weight for the sample of students selected for the mathematics teacher questionnaires. SOURCE: U.S. Department of Education, National Center for Education Statistics, Early Childhood Longitudinal Study, Kindergarten Class of 2010–11 (ECLS-K:2011), spring 2015.

5-14
Table 5-6. Response rates for mathematics teacher questionnaires, by selected student characteristics, fourth grade: Spring 2015
Student characteristic
Mathematics teacher questionnaire (teacher level)
Mathematics teacher questionnaire (child and classroom level)
Number of respondents
Response rates Number of respondents
Response rates Weighted Unweighted Weighted Unweighted
All students 5,551 84.8 86.6 5,534 84.7 86.3
Sex Male 2,813 85.8 87.2 2,802 85.6 86.8 Female 2,731 83.8 85.9 2,725 83.7 85.7 Unknown 7 100.0 100.0 7 100.0 100.0
Race/ethnicity White, non-
Hispanic 2,709 87.1 90.2 2,707 87.1 90.1 Black, non-
Hispanic 593 82.9 86.4 593 83.0 86.4 Hispanic 1,513 83.4 85.0 1,507 83.1 84.7 Asian, non-
Hispanic 418 74.8 75.2 410 73.8 73.7 Native Hawaiian/
Other Pacific Islander, non-Hispanic 24 84.2 82.8 23 82.7 79.3
American Indian or Alaska Native, non-Hispanic 46 87.4 85.2 46 87.4 85.2
Two or more races, non-Hispanic 239 80.4 80.7 239 80.2 80.7
Unknown 9 100.0 100.0 9 100.0 100.0
Year of birth1 2003 30 91.7 92.6 20 88.7 88.9 2004 1790 87.9 89.8 1790 87.9 89.7 2005 3730 83.4 85.1 3710 83.2 84.8 2006 10 94.2 87.5 10 94.2 87.5 Unknown # 100.0 100.0 # 100.0 100.0
# Rounds to zero.1 Sample sizes rounded to the nearest 10 and, therefore, may not sum to total. NOTE: A respondent is defined as a child for whom a teacher questionnaire was returned with at least one response, and who had either child assessment or parent interview data The weighted response rates were calculated using the fourth-grade student base weight for the sample of students selected for the mathematics teacher questionnaires. SOURCE: U.S. Department of Education, National Center for Education Statistics, Early Childhood Longitudinal Study, Kindergarten Class of 2010–11 (ECLS-K:2011), spring 2015.
Table 5-7 and table 5-8 present weighted and unweighted response rates for the science teacher questionnaires by selected school characteristics and student characteristics, respectively. The response rates are 84.6 percent for the teacher-level questionnaire and 84.2 percent for the child- and classroom-level

5-15
teacher questionnaire. By school characteristics, the highest rates were 98.0 percent at the teacher level and 98.3 percent at the child and classroom level for students in Catholic schools. The lower rates are for students in schools with more than 85 percent minority enrollment: 83.3 percent at the teacher level and 81.6 percent at the child and classroom level. By selected student characteristics, the highest rates are for White students (86.6 percent at the teacher level and 86.7 percent at the child and classroom level), and some of the lowest rates are for Asian students (76.7 at the teacher level, and 75.2 at the child and classroom level).
Table 5-7. Response rates for science teacher questionnaires, by selected school characteristics, fourth grade: Spring 2015
School characteristic1
Science teacher questionnaire (teacher level)
Science teacher questionnaire (child and classroom level)
Number of respondents
Response rates Number of respondents
Response rates Weighted Unweighted Weighted Unweighted
All students 5,553 84.6 86.2 5,538 84.2 86.0
School type Public 5,036 90.7 90.4 5,018 90.2 90.1 Private 517 94.9 95.4 520 95.6 95.9
Catholic 274 98.0 98.6 275 98.3 98.9 Other private 243 91.9 92.0 245 93.0 92.8
Homeschool/ Unknown school type 0 0.0 0.0 0 0.0 0.0
Census region2,3 Northeast 890 89.5 88.9 890 88.1 88.1 Midwest 1,230 95.0 95.0 1,220 94.2 94.2 South 2,030 93.0 93.9 2,020 92.7 93.7 West 1,400 85.4 84.7 1,410 85.8 85.2 Unknown 0 0.0 0.0 0 0.0 0.0
Locale City 1,676 88.1 86.6 1,669 87.5 86.3 Suburb 2,309 90.3 90.8 2,305 89.8 90.7 Town 375 89.5 93.3 365 88.5 90.8 Rural 1,041 97.8 97.3 1,047 97.9 97.9 Unknown 152 29.2 30.9 152 29.2 30.9
See notes at end of table.

5-16
Table 5-7. Response rates for science teacher questionnaires, by selected school characteristics, fourth grade: Spring 2015 —Continued
School characteristic1
Science teacher questionnaire (teacher level)
Science teacher questionnaire (child and classroom level)
Number of respondents
Response rates Number of respondents
Response rates Weighted Unweighted Weighted Unweighted
School enrollment 1 to 149 students 215 94.8 94.3 225 98.0 98.7 150 to 299 students 655 93.1 91.4 644 91.5 89.8 300 to 499 students 1,633 93.2 93.0 1,622 92.8 92.4 500 to 749 students 2,023 89.2 90.4 2,011 88.3 89.8 750 or more students 1,024 90.6 88.0 1,033 90.9 88.8 Unknown 3 0.3 0.9 3 0.3 0.9
Percent minority enrolled 0 to 15 1,393 96.3 96.5 1,397 96.5 96.7 16 to 45 1,624 93.9 94.9 1,622 93.7 94.8 46 to 85 1,295 89.3 89.1 1,293 89.0 89.0 86 to 100 1,226 83.3 82.7 1,211 81.6 81.7 Unknown 15 3.8 4.3 15 3.8 4.3
1 School characteristics were taken from the fourth-grade school administrator questionnaire (SAQ) when available. When fourth-grade SAQ data were not available, information was taken from prior-round SAQ responses, the Common Core of Data (CCD), or the Private School Survey (PSS). The versions of the school characteristics variables used to produce this table were specially derived for the User’s Manual and are not included in the data file. 2 States in each region: Northeast: Connecticut, Maine, Massachusetts, New Hampshire, New Jersey, New York, Pennsylvania, Rhode Island, and Vermont. Midwest: Illinois, Indiana, Iowa, Kansas, Michigan, Minnesota, Missouri, Nebraska, North Dakota, Ohio, South Dakota, and Wisconsin. South: Alabama, Arkansas, Delaware, Florida, Georgia, Kentucky, Louisiana, Maryland, Mississippi, North Carolina, Oklahoma, South Carolina, Tennessee, Texas, Virginia, West Virginia, and the District of Columbia. West: Alaska, Arizona, California, Colorado, Hawaii, Idaho, Montana, Nevada, New Mexico, Oregon, Utah, Washington, and Wyoming. 3 Sample sizes rounded to the nearest 10 and, therefore, may not sum to total. NOTE: A respondent is defined as a child for whom a teacher questionnaire was returned with at least one response, and who had either child assessment or parent interview data. The weighted response rates were calculated using the fourth-grade student base weight for the sample of students selected for the science teacher questionnaires. SOURCE: U.S. Department of Education, National Center for Education Statistics, Early Childhood Longitudinal Study, Kindergarten Class of 2010–11 (ECLS-K:2011), spring 2015.
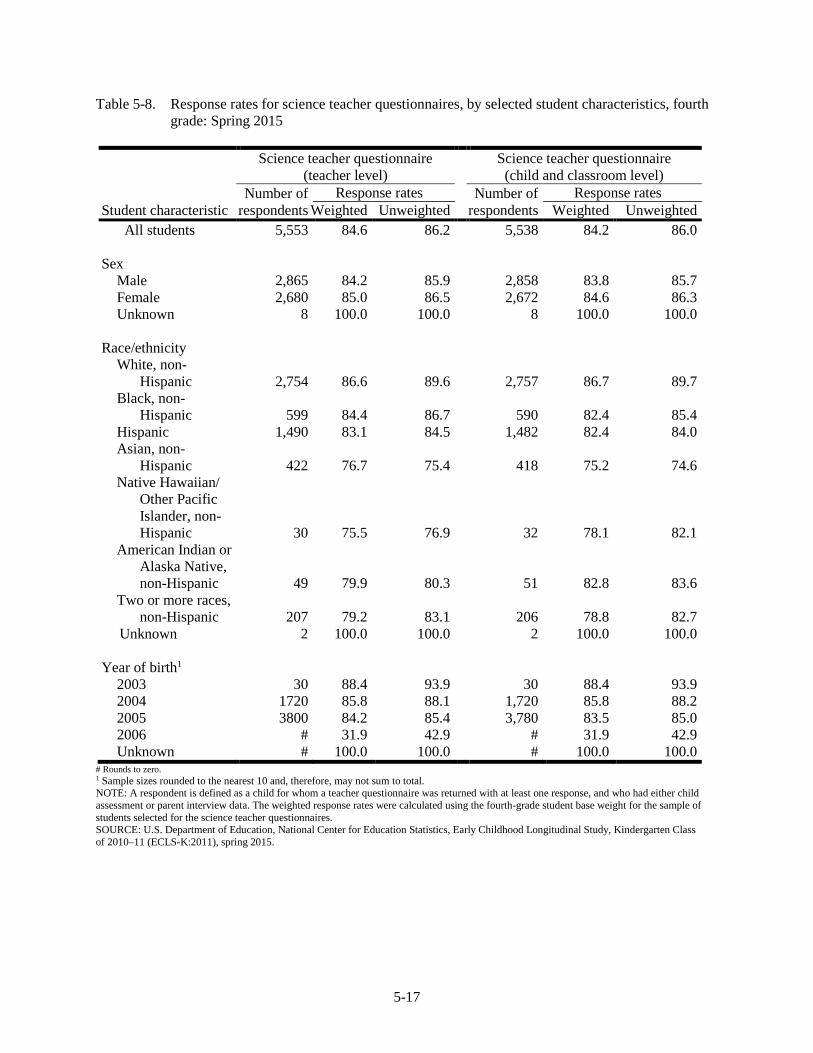
5-17
Table 5-8. Response rates for science teacher questionnaires, by selected student characteristics, fourth grade: Spring 2015
Student characteristic
Science teacher questionnaire (teacher level)
Science teacher questionnaire (child and classroom level)
Number of respondents
Response rates Number of respondents
Response rates Weighted Unweighted Weighted Unweighted
All students 5,553 84.6 86.2 5,538 84.2 86.0
Sex Male 2,865 84.2 85.9 2,858 83.8 85.7 Female 2,680 85.0 86.5 2,672 84.6 86.3 Unknown 8 100.0 100.0 8 100.0 100.0
Race/ethnicity White, non-
Hispanic 2,754 86.6 89.6 2,757 86.7 89.7 Black, non-
Hispanic 599 84.4 86.7 590 82.4 85.4 Hispanic 1,490 83.1 84.5 1,482 82.4 84.0 Asian, non-
Hispanic 422 76.7 75.4 418 75.2 74.6 Native Hawaiian/
Other Pacific Islander, non-Hispanic 30 75.5 76.9 32 78.1 82.1
American Indian or Alaska Native, non-Hispanic 49 79.9 80.3 51 82.8 83.6
Two or more races, non-Hispanic 207 79.2 83.1 206 78.8 82.7
Unknown 2 100.0 100.0 2 100.0 100.0
Year of birth1 2003 30 88.4 93.9 30 88.4 93.9 2004 1720 85.8 88.1 1,720 85.8 88.2 2005 3800 84.2 85.4 3,780 83.5 85.0 2006 # 31.9 42.9 # 31.9 42.9 Unknown # 100.0 100.0 # 100.0 100.0
# Rounds to zero.1 Sample sizes rounded to the nearest 10 and, therefore, may not sum to total. NOTE: A respondent is defined as a child for whom a teacher questionnaire was returned with at least one response, and who had either child assessment or parent interview data. The weighted response rates were calculated using the fourth-grade student base weight for the sample of students selected for the science teacher questionnaires. SOURCE: U.S. Department of Education, National Center for Education Statistics, Early Childhood Longitudinal Study, Kindergarten Class of 2010–11 (ECLS-K:2011), spring 2015.

5-18
Table 5-9 presents weighted and unweighted overall response rates for the child assessment and the parent interview in the fourth-grade data collection by selected school characteristics. The overall response rate is the percentage of possible assessments, interviews, or questionnaires completed, taking into account the base-year school response rate. Of the 2,839 original and transfer schools that were initially eligible for the fourth-grade data collection, 2,699 schools participated in the study, 31 schools refused, and 109 became ineligible because all ECLS-K:2011 students in the school had moved to other schools. The school response rates used in the overall rates are from the base year because children were sampled in the base year and were eligible to stay in the study regardless of school participation after the base year. The overall weighted response rate is the product of the base-year before-substitution school response rate for all schools (62.7 percent) and the fourth-grade weighted response rate. The overall unweighted response rate is the product of the unweighted base-year before-substitution response rate for all schools (61.3 percent) and the fourth-grade unweighted response rate. In the overall response rate tables, the response rates by characteristic are also a product of the fourth-grade response rate by the corresponding (weighted or unweighted) overall base-year rate.
The overall weighted response rate for the child assessment was 48.5 percent. For the parent interview, the overall weighted response rate was 43.9 percent. Because the driving factor of the overall response rate is the base-year school response rate for all schools, the pattern of overall response rates by subgroups is the same as the pattern for the fourth-grade response rates.
Table 5-9. Overall response rates for child assessment and parent interview, by selected school characteristics, fourth grade: Spring 2015
School characteristic3
Child assessment1 Parent interview2 Number of
respondents Overall response rates Number of
respondents Overall response rates
Weighted Unweighted Weighted Unweighted All students 12,102 48.5 49.8 10,680 43.9 43.8
School type Public 10,981 59.0 57.6 9,032 48.5 47.0 Private 1,061 54.2 54.3 925 47.9 47.3
Catholic 548 58.2 56.9 483 52.4 50.2 Other private 513 50.8 51.7 442 44.1 44.6
Census region4,5 Northeast 1,980 57.6 56.5 1,680 48.7 47.6 Midwest 2,540 59.6 58.0 2,110 49.1 47.8 South 4,270 59.1 57.8 3,590 49.4 48.2 West 3,250 57.7 56.5 2,580 46.2 44.7
See notes at end of table.
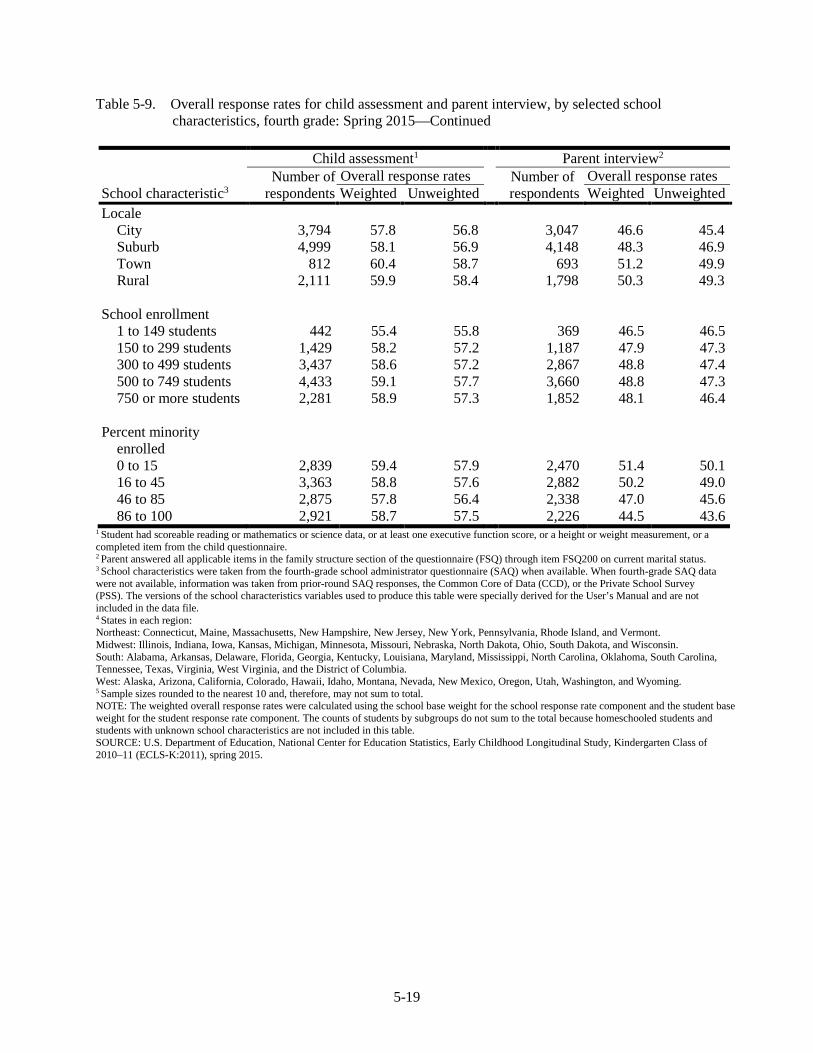
5-19
Table 5-9. Overall response rates for child assessment and parent interview, by selected school characteristics, fourth grade: Spring 2015—Continued
School characteristic3
Child assessment1 Parent interview2 Number of
respondents Overall response rates Number of
respondents Overall response rates
Weighted Unweighted Weighted Unweighted Locale
City 3,794 57.8 56.8 3,047 46.6 45.4 Suburb 4,999 58.1 56.9 4,148 48.3 46.9 Town 812 60.4 58.7 693 51.2 49.9 Rural 2,111 59.9 58.4 1,798 50.3 49.3
School enrollment 1 to 149 students 442 55.4 55.8 369 46.5 46.5 150 to 299 students 1,429 58.2 57.2 1,187 47.9 47.3 300 to 499 students 3,437 58.6 57.2 2,867 48.8 47.4 500 to 749 students 4,433 59.1 57.7 3,660 48.8 47.3 750 or more students 2,281 58.9 57.3 1,852 48.1 46.4
Percent minority enrolled 0 to 15 2,839 59.4 57.9 2,470 51.4 50.1 16 to 45 3,363 58.8 57.6 2,882 50.2 49.0 46 to 85 2,875 57.8 56.4 2,338 47.0 45.6 86 to 100 2,921 58.7 57.5 2,226 44.5 43.6
1 Student had scoreable reading or mathematics or science data, or at least one executive function score, or a height or weight measurement, or a completed item from the child questionnaire. 2 Parent answered all applicable items in the family structure section of the questionnaire (FSQ) through item FSQ200 on current marital status. 3 School characteristics were taken from the fourth-grade school administrator questionnaire (SAQ) when available. When fourth-grade SAQ data were not available, information was taken from prior-round SAQ responses, the Common Core of Data (CCD), or the Private School Survey (PSS). The versions of the school characteristics variables used to produce this table were specially derived for the User’s Manual and are not included in the data file. 4 States in each region: Northeast: Connecticut, Maine, Massachusetts, New Hampshire, New Jersey, New York, Pennsylvania, Rhode Island, and Vermont. Midwest: Illinois, Indiana, Iowa, Kansas, Michigan, Minnesota, Missouri, Nebraska, North Dakota, Ohio, South Dakota, and Wisconsin. South: Alabama, Arkansas, Delaware, Florida, Georgia, Kentucky, Louisiana, Maryland, Mississippi, North Carolina, Oklahoma, South Carolina, Tennessee, Texas, Virginia, West Virginia, and the District of Columbia. West: Alaska, Arizona, California, Colorado, Hawaii, Idaho, Montana, Nevada, New Mexico, Oregon, Utah, Washington, and Wyoming. 5 Sample sizes rounded to the nearest 10 and, therefore, may not sum to total. NOTE: The weighted overall response rates were calculated using the school base weight for the school response rate component and the student base weight for the student response rate component. The counts of students by subgroups do not sum to the total because homeschooled students and students with unknown school characteristics are not included in this table. SOURCE: U.S. Department of Education, National Center for Education Statistics, Early Childhood Longitudinal Study, Kindergarten Class of 2010–11 (ECLS-K:2011), spring 2015.

5-20
Tables 5-10 to 5-12 present weighted and unweighted overall response rates for teacher questionnaires in the fourth-grade data collection, by selected school characteristics. The overall response rates for the teacher-level teacher questionnaire were 53.2 percent for the students linked to reading and mathematics teachers and 53.0 percent for students linked to science teachers. The overall response rates for the child- and classroom-level teacher questionnaire were 53.0 percent for students linked to reading teachers, 53.1 percent for those linked to mathematics teachers, and 52.8 percent for those linked to science teachers. The response rates by subgroup follow the same pattern as was seen for the fourth-grade teacher response rates.
Table 5-10. Overall response rates for reading teacher questionnaires, by selected school characteristics, fourth grade: Spring 2015
School characteristic1
Reading teacher questionnaire (teacher level)
Reading teacher questionnaire (child and classroom level)
Number of respondents
Overall response rates Number of respondents
Overall response rates Weighted Unweighted Weighted Unweighted
All students 11,129 53.2 53.1 11,086 53.0 52.9
School type Public 10,114 57.2 55.7 10,072 56.9 55.5 Private 1,015 59.2 58.4 1,014 59.1 58.3
Catholic 538 60.6 60.2 537 60.4 60.1 Other private 477 57.9 56.5 477 57.9 56.5
Census region2,3 Northeast 1,780 55.8 54.3 1,760 55.1 53.8 Midwest 2,450 60.2 58.5 2,440 60.0 58.4 South 4,060 58.0 57.6 4,050 57.9 57.3 West 2,840 54.7 52.9 2,840 54.7 52.8
Locale City 3,344 55.5 53.3 3,325 55.2 53.0 Suburb 4,630 57.1 56.1 4,608 56.7 55.8 Town 762 55.7 57.1 743 55.2 55.7 Rural 2,091 61.5 60.0 2,106 61.6 60.4
See notes at end of table.
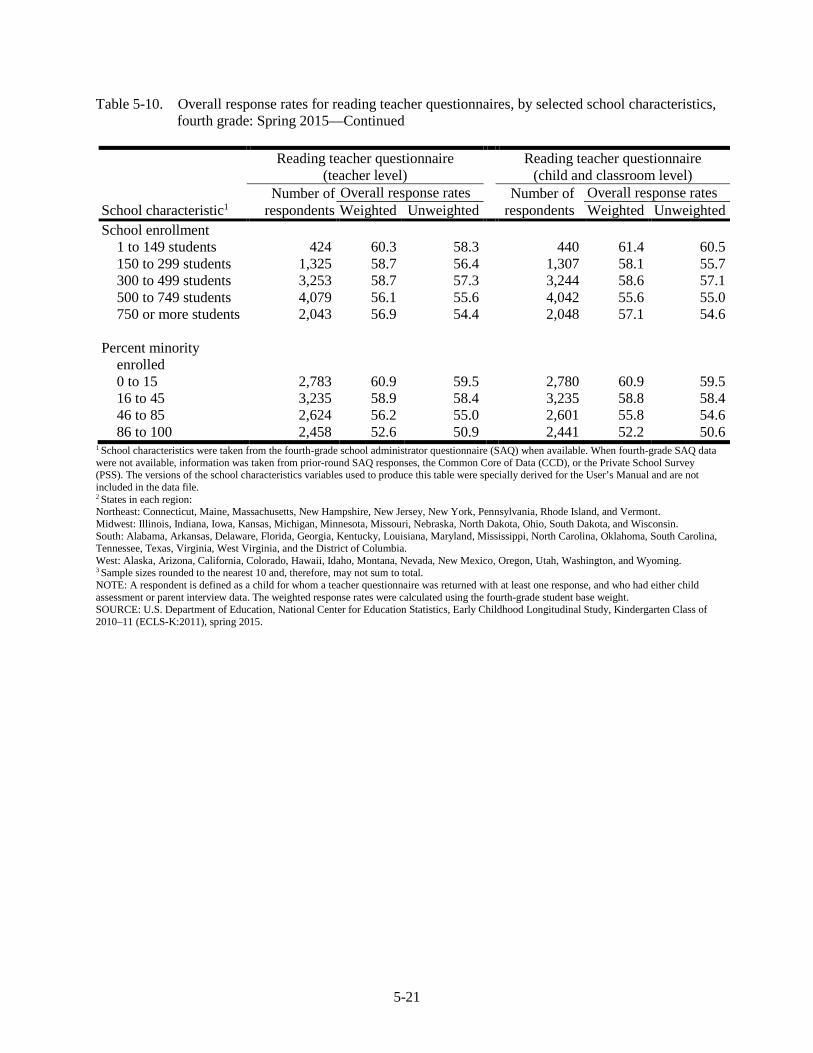
5-21
Table 5-10. Overall response rates for reading teacher questionnaires, by selected school characteristics, fourth grade: Spring 2015—Continued
School characteristic1
Reading teacher questionnaire (teacher level)
Reading teacher questionnaire (child and classroom level)
Number of respondents
Overall response rates Number of respondents
Overall response rates Weighted Unweighted Weighted Unweighted
School enrollment 1 to 149 students 424 60.3 58.3 440 61.4 60.5 150 to 299 students 1,325 58.7 56.4 1,307 58.1 55.7 300 to 499 students 3,253 58.7 57.3 3,244 58.6 57.1 500 to 749 students 4,079 56.1 55.6 4,042 55.6 55.0 750 or more students 2,043 56.9 54.4 2,048 57.1 54.6
Percent minority enrolled 0 to 15 2,783 60.9 59.5 2,780 60.9 59.5 16 to 45 3,235 58.9 58.4 3,235 58.8 58.4 46 to 85 2,624 56.2 55.0 2,601 55.8 54.6 86 to 100 2,458 52.6 50.9 2,441 52.2 50.6
1 School characteristics were taken from the fourth-grade school administrator questionnaire (SAQ) when available. When fourth-grade SAQ data were not available, information was taken from prior-round SAQ responses, the Common Core of Data (CCD), or the Private School Survey (PSS). The versions of the school characteristics variables used to produce this table were specially derived for the User’s Manual and are not included in the data file. 2 States in each region: Northeast: Connecticut, Maine, Massachusetts, New Hampshire, New Jersey, New York, Pennsylvania, Rhode Island, and Vermont. Midwest: Illinois, Indiana, Iowa, Kansas, Michigan, Minnesota, Missouri, Nebraska, North Dakota, Ohio, South Dakota, and Wisconsin. South: Alabama, Arkansas, Delaware, Florida, Georgia, Kentucky, Louisiana, Maryland, Mississippi, North Carolina, Oklahoma, South Carolina, Tennessee, Texas, Virginia, West Virginia, and the District of Columbia. West: Alaska, Arizona, California, Colorado, Hawaii, Idaho, Montana, Nevada, New Mexico, Oregon, Utah, Washington, and Wyoming. 3 Sample sizes rounded to the nearest 10 and, therefore, may not sum to total. NOTE: A respondent is defined as a child for whom a teacher questionnaire was returned with at least one response, and who had either child assessment or parent interview data. The weighted response rates were calculated using the fourth-grade student base weight. SOURCE: U.S. Department of Education, National Center for Education Statistics, Early Childhood Longitudinal Study, Kindergarten Class of 2010–11 (ECLS-K:2011), spring 2015.

5-22
Table 5-11. Overall response rates for mathematics teacher questionnaires, by selected school characteristics, fourth grade: Spring 2015
School characteristic1
Mathematics teacher questionnaire (teacher level)
Mathematics teacher questionnaire (child and classroom level)
Number of respondents
Overall response rates Number of respondents
Overall response rates Weighted Unweighted Weighted Unweighted
All students 5,551 53.2 53.1 5,534 53.1 52.9
School type Public 5,054 57.2 55.8 5,038 57.1 55.6 Private 497 58.8 58.1 496 58.7 58.1
Catholic 263 59.6 59.7 263 59.6 59.7 Other private 234 58.1 56.5 233 57.9 56.2
Census region2,3 Northeast 890 55.7 54.3 880 55.2 53.7 Midwest 1,210 60.3 58.5 1,210 60.3 58.5 South 2,030 57.8 57.6 2,030 57.6 57.4 West 1,420 55.2 53.0 1,420 55.2 53.0
Locale City 1,663 55.6 53.3 1,653 55.4 53.0 Suburb 2,310 57.3 56.2 2,303 57.2 56.0 Town 386 55.0 56.9 379 54.7 55.8 Rural 1,043 61.4 59.9 1,049 61.4 60.2
See notes at end of table.

5-23
Table 5-11. Overall response rates for mathematics teacher questionnaires, by selected school characteristics, fourth grade: Spring 2015—Continued
School characteristic1
Mathematics teacher questionnaire (teacher level)
Mathematics teacher questionnaire (child and classroom level)
Number of respondents
Overall response rates Number of respondents
Overall response rates Weighted Unweighted Weighted Unweighted
School enrollment 1 to 149 students 209 61.0 58.8 217 62.2 61.0 150 to 299 students 664 58.6 56.3 657 58.4 55.7 300 to 499 students 1,612 58.7 57.3 1,606 58.6 57.1 500 to 749 students 2,047 56.1 55.5 2,036 55.9 55.2 750 or more students 1,017 57.1 54.7 1,016 57.1 54.7
Percent minority enrolled 0 to 15 1,384 61.3 59.7 1,384 61.3 59.7 16 to 45 1,604 58.6 58.4 1,603 58.5 58.3 46 to 85 1,315 56.0 54.8 1,305 55.7 54.4 86 to 100 1,235 53.3 51.3 1,229 53.1 51.1
1 School characteristics were taken from the fourth-grade school administrator questionnaire (SAQ) when available. When fourth-grade SAQ data were not available, information was taken from prior-round SAQ responses, the Common Core of Data (CCD), or the Private School Survey (PSS). The versions of the school characteristics variables used to produce this table were specially derived for the User’s Manual and are not included in the data file. 2 States in each region: Northeast: Connecticut, Maine, Massachusetts, New Hampshire, New Jersey, New York, Pennsylvania, Rhode Island, and Vermont. Midwest: Illinois, Indiana, Iowa, Kansas, Michigan, Minnesota, Missouri, Nebraska, North Dakota, Ohio, South Dakota, and Wisconsin. South: Alabama, Arkansas, Delaware, Florida, Georgia, Kentucky, Louisiana, Maryland, Mississippi, North Carolina, Oklahoma, South Carolina, Tennessee, Texas, Virginia, West Virginia, and the District of Columbia. West: Alaska, Arizona, California, Colorado, Hawaii, Idaho, Montana, Nevada, New Mexico, Oregon, Utah, Washington, and Wyoming. 3 Sample sizes rounded to the nearest 10 and, therefore, may not sum to total. NOTE: A respondent is defined as a child for whom a teacher questionnaire was returned with at least one response, and who had either child assessment or parent interview data. The weighted response rates were calculated using the fourth-grade student base weight for the sample of students selected for the mathematics teacher questionnaires. SOURCE: U.S. Department of Education, National Center for Education Statistics, Early Childhood Longitudinal Study, Kindergarten Class of 2010–11 (ECLS-K:2011), spring 2015.

5-24
Table 5-12. Overall response rates for science teacher questionnaires, by selected school characteristics, fourth grade: Spring 2015
School characteristic1
Science teacher questionnaire (teacher level)
Science teacher questionnaire (child and classroom level)
Number of respondents
Overall response rates Number of respondents
Overall response rates Weighted Unweighted Weighted Unweighted
All students 5,553 53.0 52.8 5,538 52.8 52.7
School type Public 5,036 56.9 55.4 5,018 56.6 55.2 Private 517 59.5 58.5 520 59.9 58.8
Catholic 274 61.4 60.4 275 61.6 60.6 Other private 243 57.6 56.4 245 58.3 56.9
Census region2,3 Northeast 890 56.1 54.5 890 55.2 54.0 Midwest 1,230 59.6 58.2 1,220 59.1 57.7 South 2,030 58.3 57.6 2,020 58.1 57.4 West 1,400 53.5 51.9 1,410 53.8 52.2
Locale City 1,676 55.2 53.1 1,669 54.9 52.9 Suburb 2,309 56.6 55.7 2,305 56.3 55.6 Town 375 56.1 57.2 365 55.5 55.7 Rural 1,041 61.3 59.6 1,047 61.4 60.0
See notes at end of table.

5-25
Table 5-12. Overall response rates for science teacher questionnaires, by selected school characteristics, fourth grade: Spring 2015—Continued
School characteristic1
Science teacher questionnaire (teacher level)
Science teacher questionnaire (child and classroom level)
Number of respondents
Overall response rates Number of respondents
Overall response rates Weighted Unweighted Weighted Unweighted
School enrollment 1 to 149 students 215 59.4 57.8 225 61.4 60.5 150 to 299 students 655 58.4 56.0 644 57.4 55.0 300 to 499 students 1,633 58.4 57.0 1,622 58.2 56.6 500 to 749 students 2,023 55.9 55.4 2,011 55.4 55.0 750 or more students 1,024 56.8 53.9 1,033 57.0 54.4
Percent minority enrolled 0 to 15 1,393 60.4 59.2 1,397 60.5 59.3 16 to 45 1,624 58.9 58.2 1,622 58.7 58.1 46 to 85 1,295 56.0 54.6 1,293 55.8 54.6 86 to 100 1,226 52.2 50.7 1,211 51.2 50.1
1 School characteristics were taken from the fourth-grade school administrator questionnaire (SAQ) when available. When fourth-grade SAQ data were not available, information was taken from prior-round SAQ responses, the Common Core of Data (CCD), or the Private School Survey (PSS). The versions of the school characteristics variables used to produce this table were specially derived for the User’s Manual and are not included in the data file. 2 States in each region: Northeast: Connecticut, Maine, Massachusetts, New Hampshire, New Jersey, New York, Pennsylvania, Rhode Island, and Vermont. Midwest: Illinois, Indiana, Iowa, Kansas, Michigan, Minnesota, Missouri, Nebraska, North Dakota, Ohio, South Dakota, and Wisconsin. South: Alabama, Arkansas, Delaware, Florida, Georgia, Kentucky, Louisiana, Maryland, Mississippi, North Carolina, Oklahoma, South Carolina, Tennessee, Texas, Virginia, West Virginia, and the District of Columbia. West: Alaska, Arizona, California, Colorado, Hawaii, Idaho, Montana, Nevada, New Mexico, Oregon, Utah, Washington, and Wyoming. 3 Sample sizes rounded to the nearest 10 and, therefore, may not sum to total. NOTE: A respondent is defined as a child for whom a teacher questionnaire was returned with at least one response, and who had either child assessment or parent interview data. The weighted response rates were calculated using the fourth-grade student base weight for the sample of students selected for the science teacher questionnaires. SOURCE: U.S. Department of Education, National Center for Education Statistics, Early Childhood Longitudinal Study, Kindergarten Class of 2010–11 (ECLS-K:2011), spring 2015.

5-26
Table 5-13 presents the response rates for the two special education teacher questionnaires. Response rates are not presented by subgroup for the special education teacher questionnaires because of the relatively small number of students eligible for this component. The denominator for the special education teacher rates is 1,325. This denominator excludes children who did not have either a complete child assessment score or parent interview for the fourth-grade collection, even if they had special education teacher data. The two special education teacher questionnaires had almost the same response rates for the fourth-grade data collection (92.2 and 92.0 percent) and overall (57.8 and 57.7 percent).
Table 5-13. Response rates for special education teacher questionnaires, fourth grade: Spring 2015
Questionnaire Number of
respondents
Response rates Overall response rates
Weighted Unweighted Weighted Unweighted Special education teacher
Teacher-level questionnaire 1,224 92.2 92.4 57.8 56.6
Child-level questionnaire 1,222 92.0 92.2 57.7 56.5
NOTE: A child was eligible for the special education questionnaire if he or she had an Individualized Education Plan (IEP) on file with the school. A respondent is defined as a child for whom a special education teacher questionnaire was returned with at least one response, and who had either child assessment or parent interview data. The weighted response rates were calculated using the fourth-grade student base weight. SOURCE: U.S. Department of Education, National Center for Education Statistics, Early Childhood Longitudinal Study, Kindergarten Class of 2010–11 (ECLS-K:2011), spring 2014.
Tables 5-14 and 5-15 present response rates for the school administrator questionnaire (SAQ) included in the fourth-grade data collection. In the base year, the school sample was representative of schools educating kindergartners and kindergarten-aged children, so the base-year User’s Manual presented response rates at the school level. After the base year, the school sample is the set of schools attended by children in the ECLS-K:2011 and is no longer a nationally representative sample of schools. For this reason, response rates for the SAQ are presented only at the student level.
Table 5-14 presents the weighted and unweighted response rates for the school administrator questionnaire by selected school characteristics. They are rates for students who were not homeschooled and were respondents in the fourth-grade data collection.1 The weighted response rate for the school administrator questionnaire was 84.3 percent. The highest response rates by school characteristics for this questionnaire were between 98.3 for students in schools with zero to 15 percent of students who were racial/ethnic minorities and 97.3 percent for students in rural areas. Aside from the “unknown” categories, which had very low response rates (as discussed above, this group includes unlocatable cases who are, by default, nonrespondents), the lowest response rates were for students in schools with at least 86 percent of
1 A fourth-grade respondent has child data (scoreable reading or mathematics or science data, or at least one executive function score, or a height or weight measurement, or child questionnaire data, or was excluded from assessment due to lack of accommodation for a disability) or parent interview data from the fourth-grade round of data collection.

5-27
students who were racial/ethnic minorities (81.8 percent) and in cities (87.7 percent). In this table, the “unknown” categories include a small number of students with SAQ data, but for whom locale, school size, and/or minority enrollment data are missing.
Table 5-15 presents the weighted and unweighted response rates for the school administrator
questionnaire by selected student characteristics. Excluding subgroups with small numbers of sampled students, the highest response rate was for White students (86.9 percent) and the lowest response rate was for Asian students (78.8 percent).
Table 5-14. Response rates for school administrator questionnaire, by selected school characteristics, fourth grade: Spring 2015
School characteristic1
Student-level school administrator questionnaire
Number of respondents Response rates
Weighted Unweighted All students 11,052 84.3 86.0
School type Public 10,029 90.5 90.1 Private 1,023 94.6 96.0
Catholic 538 96.8 98.2 Other private 485 92.4 93.6
Census region2,3 Northeast 1,790 88.3 89.0 Midwest 2,420 95.5 94.4 South 3,930 90.4 90.8 West 2,910 88.8 88.4 Unknown 0 0.0 0.0
Locale City 3,302 87.7 85.8 Suburb 4,607 90.6 91.0 Town 773 89.5 94.5 Rural 2,081 97.3 97.3 Unknown 289 27.2 29.2
See notes at end of table.
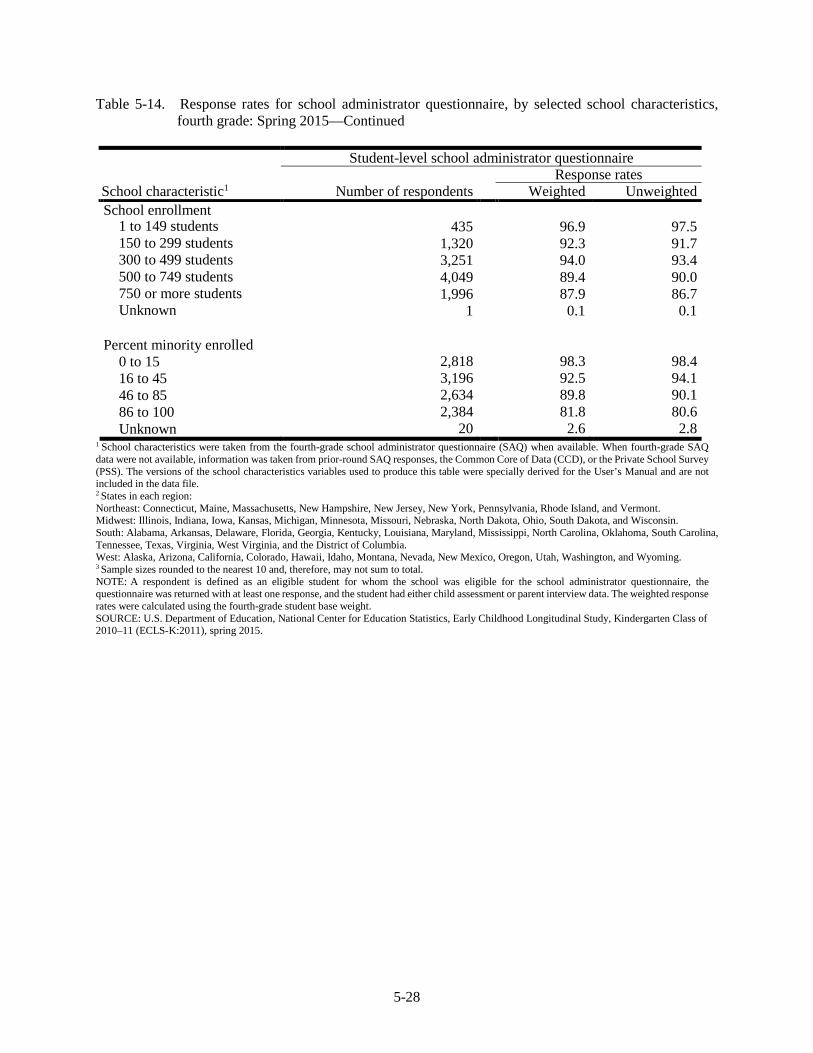
5-28
Table 5-14. Response rates for school administrator questionnaire, by selected school characteristics, fourth grade: Spring 2015—Continued
School characteristic1
Student-level school administrator questionnaire
Number of respondents Response rates
Weighted Unweighted School enrollment
1 to 149 students 435 96.9 97.5 150 to 299 students 1,320 92.3 91.7 300 to 499 students 3,251 94.0 93.4 500 to 749 students 4,049 89.4 90.0 750 or more students 1,996 87.9 86.7 Unknown 1 0.1 0.1
Percent minority enrolled 0 to 15 2,818 98.3 98.4 16 to 45 3,196 92.5 94.1 46 to 85 2,634 89.8 90.1 86 to 100 2,384 81.8 80.6 Unknown 20 2.6 2.8
1 School characteristics were taken from the fourth-grade school administrator questionnaire (SAQ) when available. When fourth-grade SAQ data were not available, information was taken from prior-round SAQ responses, the Common Core of Data (CCD), or the Private School Survey (PSS). The versions of the school characteristics variables used to produce this table were specially derived for the User’s Manual and are not included in the data file. 2 States in each region: Northeast: Connecticut, Maine, Massachusetts, New Hampshire, New Jersey, New York, Pennsylvania, Rhode Island, and Vermont. Midwest: Illinois, Indiana, Iowa, Kansas, Michigan, Minnesota, Missouri, Nebraska, North Dakota, Ohio, South Dakota, and Wisconsin. South: Alabama, Arkansas, Delaware, Florida, Georgia, Kentucky, Louisiana, Maryland, Mississippi, North Carolina, Oklahoma, South Carolina, Tennessee, Texas, Virginia, West Virginia, and the District of Columbia. West: Alaska, Arizona, California, Colorado, Hawaii, Idaho, Montana, Nevada, New Mexico, Oregon, Utah, Washington, and Wyoming. 3 Sample sizes rounded to the nearest 10 and, therefore, may not sum to total. NOTE: A respondent is defined as an eligible student for whom the school was eligible for the school administrator questionnaire, the questionnaire was returned with at least one response, and the student had either child assessment or parent interview data. The weighted response rates were calculated using the fourth-grade student base weight. SOURCE: U.S. Department of Education, National Center for Education Statistics, Early Childhood Longitudinal Study, Kindergarten Class of 2010–11 (ECLS-K:2011), spring 2015.

5-29
Table 5-15. Response rates for school administrator questionnaire, by selected student characteristics, fourth grade: Spring 2015
Student characteristic
Student-level school administrator questionnaire Number of
respondents Response rates
Weighted Unweighted All students 11,052 84.3 86.0
Sex Male 5,646 84.5 86.0 Female 5,393 84.1 85.9 Unknown 13 92.1 86.7
Race/ethnicity White, non-Hispanic 5,482 86.9 90.2 Black, non-Hispanic 1,113 79.8 80.8 Hispanic 2,949 82.4 83.2 Asian, non-Hispanic 887 78.8 79.5 Native Hawaiian/Other Pacific Islander,
non-Hispanic 60 87.9 88.2 American Indian or Alaska Native, non-
Hispanic 99 86.7 86.1 Two or more races, non-Hispanic 451 80.6 82.8 Unknown 11 100.0 100.0
Year of birth1 2003 50 87.6 90.0 2004 3460 86.0 87.8 2005 7520 83.5 85.2 2006 10 71.2 66.7 Unknown # 100.0 100.0
# Rounds to zero. 1 Sample sizes rounded to the nearest 10 and, therefore, may not sum to total. NOTE: A respondent is defined as an eligible student for whom the school was eligible for the school administrator questionnaire, the questionnaire was returned with at least one response, and the student had either child assessment or parent interview data. The weighted response rates were calculated using the fourth-grade student base weight. SOURCE: U.S. Department of Education, National Center for Education Statistics, Early Childhood Longitudinal Study, Kindergarten Class of 2010–11 (ECLS-K:2011), spring 2015.
Table 5-16 shows the overall response rates for the school administrator questionnaire. The overall weighted response rate was 52.9 percent. As with other overall response rates, the overall rates by subgroups have the same patterns as the fourth-grade response rates because the base-year school response rate is for all schools and, thus, the same for all subgroups.

5-30
Table 5-16. Overall response rates for school administrator questionnaire, by selected school characteristics, fourth grade: Spring 2015
School characteristic1
Student-level school administrator questionnaire
Number of respondents Overall response rates
Weighted Unweighted All students 11,052 52.9 52.7
School type Public 10,029 56.7 55.2 Private 1,023 59.3 58.8
Catholic 538 60.7 60.2 Other private 485 57.9 57.4
Census region2,3 Northeast 1,790 55.4 54.6 Midwest 2,420 59.9 57.9 South 3,930 56.7 55.7 West 2,910 55.7 54.2
Locale City 3,302 55.0 52.6 Suburb 4,607 56.8 55.8 Town 773 56.1 57.9 Rural 2,081 61.0 59.6
School enrollment 1 to 149 students 435 60.8 59.8 150 to 299 students 1,320 57.9 56.2 300 to 499 students 3,251 58.9 57.3 500 to 749 students 4,049 56.1 55.2 750 or more students 1,996 55.1 53.1
Percent minority enrolled 0 to 15 2,818 61.6 60.3 16 to 45 3,196 58.0 57.7 46 to 85 2,634 56.3 55.2 86 to 100 2,384 51.3 49.4
1 School characteristics were taken from the fourth-grade school administrator questionnaire (SAQ) when available. When fourth-grade SAQ data were not available, information was taken from prior-round SAQ responses, the Common Core of Data (CCD), or the Private School Survey (PSS). The versions of the school characteristics variables used to produce this table were specially derived for the User’s Manual and are not included in the data file. 2 States in each region: Northeast: Connecticut, Maine, Massachusetts, New Hampshire, New Jersey, New York, Pennsylvania, Rhode Island, and Vermont. Midwest: Illinois, Indiana, Iowa, Kansas, Michigan, Minnesota, Missouri, Nebraska, North Dakota, Ohio, South Dakota, and Wisconsin. South: Alabama, Arkansas, Delaware, Florida, Georgia, Kentucky, Louisiana, Maryland, Mississippi, North Carolina, Oklahoma, South Carolina, Tennessee, Texas, Virginia, West Virginia, and the District of Columbia. West: Alaska, Arizona, California, Colorado, Hawaii, Idaho, Montana, Nevada, New Mexico, Oregon, Utah, Washington, and Wyoming. 3 Sample sizes rounded to the nearest 10 and, therefore, may not sum to total. NOTE: A respondent is defined as an eligible student for whom the school was eligible for the school administrator questionnaire, the questionnaire was returned with at least one response, and the student had either child assessment or parent interview data. The weighted overall response rates were calculated using the school base weight for the school response rate component and the fourth-grade student base weight for the student response rate component. The counts of students by subgroups do not sum to the total because students with unknown school characteristics are not included in this table. SOURCE: U.S. Department of Education, National Center for Education Statistics, Early Childhood Longitudinal Study, Kindergarten Class of 2010–11 (ECLS-K:2011), spring 2015.

5-31
5.3 Nonresponse Bias Analysis
NCES statistical standards require that any survey instrument with a weighted unit response rate less than 85 percent be evaluated for potential nonresponse bias. For the fourth-grade data collection, almost all components had weighted response rates lower than 85 percent. Table 5-17 shows response rates for all instruments:
Table 5-17. Weighted and unweighted response rates for all instruments, fourth grade: Spring 2015
Survey instrument Number of eligible
students Weighted response
rate Unweighted
response rate
Child assessment 14,884 77.3 81.3
Parent interview 14,962 70.0 71.4 Teacher questionnaire A
Reading 12,853 84.9 86.6 Teacher questionnaire A
Mathematics 6,412 84.8 86.6 Teacher questionnaire A
Science 6,441 84.6 86.2 Child- and classroom-level
teacher questionnaire Reading 12,853 84.6 86.3
Child- and classroom-level teacher questionnaire Mathematics 6,412 84.7 86.3
Child- and classroom-level teacher questionnaire Science 6,441 84.2 86.0
Teacher-level special education teacher questionnaire 1,325 92.2 92.4
Child- and classroom-level special education teacher questionnaire 1,325 92.0 92.2
School administrator questionnaire 12,853 84.3 86.0
SOURCE: U.S. Department of Education, National Center for Education Statistics, Early Childhood Longitudinal Study, Kindergarten Class of 2010–11 (ECLS-K:2011), spring 2015.
The effect of nonresponse is examined in two ways. Sections 5.3.1 to 5.3.4 discuss the effect of nonresponse on estimates produced from each instrument with weighted response rate lower than 85 percent. Section 5.3.5 compares estimates of selected base-year characteristics between base-year

5-32
respondents and fourth-grade respondents.2 A comparison of the study estimates to frame estimates, which pertain to schools with fourth grade and to fourth-graders in the United States, cannot be done because the sample of study schools is not a representative sample and the sample of study students is not representative of all fourth-graders. After the base year, students in the ECLS-K:2011 can only represent the cohort of children who attended kindergarten or were of kindergarten age in ungraded classrooms in the 2010–11 school year. For a comparison to frame estimates that was conducted in the base year of the study, see chapter 5 of the base-year User’s Manual.
5.3.1 Effect of Nonresponse on Child Assessment Data
Estimates weighted by the nonresponse-adjusted weights are compared with estimates weighted by the base weights (which are referred to as unadjusted estimates). Large differences between the estimates weighted by the nonresponse-adjusted weights and the unadjusted weights may indicate the potential for bias in the unadjusted estimates. If the differences are small, then either there is very small bias in the estimates or the characteristics used in the adjustment process are not related to the survey estimates and, therefore, the adjustments do not introduce changes in the estimates.
The unadjusted base weight only takes into account the selection probabilities of the sampling units and the subsampling of movers to be followed. The nonresponse-adjusted weights are the weights used to analyze ECLS-K:2011 data. The nonresponse adjusted weight used in this analysis of the effect of nonresponse on child assessment data is W8C8P_20, which is adjusted for nonresponse to the child assessment. For a discussion of how the weights were constructed, see chapter 4.
In the ECLS-K:2011, chi-square analyses were used to identify characteristics that are most related to nonresponse, and these characteristics were used in the adjustment. Therefore, the likelihood that the weighted estimates are biased as a result of nonresponse would be lower than if nonresponse adjustment was not implemented. This method of examining nonresponse bias provides an indication of the degree to which nonresponse adjustments are needed and how effective the adjustments are.
Table 5-18 shows estimates of selected items from the child assessment. Table 5-19 shows the differences between unweighted and weighted estimates, and between estimates produced using base weights (unadjusted estimates) and estimates produced using nonresponse-adjusted weights. The 2 A base-year respondent has child data (scoreable assessment data, or height or weight measurements, or was excluded from assessment due to lack of accommodation for a disability) or parent interview data from at least one round of data collection in the base year. A fourth-grade respondent has child data (scoreable assessment data, or executive function data, or child questionnaire data, or height or weight measurements or was excluded from assessment due to lack of accommodation for a disability) or parent interview data from the fourth-grade round of data collection.
5-33
differences are shown in absolute value and as a percent (relative difference), together with their p value (α = 0.05). For example, for the differences between unweighted and unadjusted estimates, the difference is the absolute value of the unweighted estimate minus the unadjusted estimate, and the percent is the difference divided by the unweighted estimate. A p value of less than .05 means that there is a statistically significant difference between the two estimates.
The differences between the unadjusted and adjusted estimates are indications of potential nonresponse bias. As can be seen in table 5-18 and 5-19, many of the differences in the estimates are not statistically significant as shown by the p value. For the child assessment, 18 percent of the items included in the analysis show statistical differences between unadjusted and adjusted estimates, meaning that the nonresponse adjustment was essential to reduce the potential bias. Where there is no statistical difference, it means that the effect of the nonresponse adjustment is neutral (i.e., it does not result in changes between unadjusted and adjusted estimates). The range of absolute differences is 0 to 1.23, with an average of 0.25. Even though there are more items with statistical difference in fourth grade than in third grade, the average difference in the range of absolute differences is similar (.25 in fourth grade and .23 in third grade).
In terms of interpreting percent difference (relative difference), the percent difference is sensitive not only to sample size but also to the prevalence of a particular characteristic. Large relative differences can be a function of small sample sizes. For example, as seen in table 5-19 for students who attended school in a town, there is an absolute difference between the nonresponse-adjusted and unadjusted estimates of 0.37 and a relative difference of 3.66. For students who attended school in the West, there is an absolute difference between the nonresponse-adjusted and unadjusted estimates of 0.66 and a relative difference of 2.68. Proportionately there are fewer students who attended school in a town than students who attended school in the West; therefore, the relative difference is higher for students who went to school in a town even though the absolute difference is smaller for students in this group compared to students who attended school in the West. The differences found in the analyses show that there is some potential for nonresponse bias in the unweighted assessment data, but the weights used to produce estimates were adjusted for nonresponse and, thus, reduce that potential for bias.

5-34
Table 5-18. Estimates using unadjusted and nonresponse-adjusted weights, child assessment, spring fourth grade: Spring 2015
Characteristic Sample
size Unweighted
estimate Unadjusted1 Adjusted2
Estimate SE Estimate SE Proportion of students by school type
Public 12,192 91.26 92.67 0.410 92.02 0.399 Private 12,192 8.74 7.33 0.410 7.98 0.399
Proportion of students by census region3,4 Northeast 12,190 16.48 16.09 0.763 15.94 0.176 Midwest 12,190 21.05 22.23 0.703 22.14 0.225 South 12,190 35.48 37.09 0.767 37.99 0.308 West 12,190 26.98 24.59 0.556 23.93 0.269
Proportion of students by locale City 11,864 32.43 30.26 1.305 31.06 1.212 Suburb 11,864 42.66 41.04 1.381 39.81 1.245 Town 11,864 6.89 10.12 1.316 10.49 1.282 Rural 11,864 18.02 18.58 1.170 18.64 1.215
Proportion of students by race/ethnicity White, non-Hispanic 18,130 46.82 51.54 1.686 51.76 1.680 Black, non-Hispanic 18,130 13.22 13.25 1.157 13.32 1.219 Hispanic 18,130 25.32 24.93 1.246 24.77 1.247 Asian, non-Hispanic 18,130 8.51 4.61 0.600 4.46 0.659 Native Hawaiian/Pacific Islander, non-
Hispanic 18,130 0.65 0.43 0.078 0.43 0.090
American Indian/Alaska Native, non-Hispanic 18,130 0.93 1.18 0.526 1.16 0.535
Two or more races 18,130 4.56 4.06 0.249 4.10 0.219 Mean estimate of the following student
scores and characteristics Mathematics scale score 12,080 108.97 108.96 0.330 109.01 0.352 Reading scale score 12,074 121.86 122.04 0.267 122.17 0.244 Science scale score 12,069 65.31 65.54 0.300 65.66 0.295 Mathematics theta score 12,080 3.42 3.42 0.017 3.42 0.018 Reading theta score 12,074 2.88 2.89 0.013 2.90 0.012 Science theta score 12,069 2.58 2.60 0.021 2.61 0.021 Number reversed age percentile 12,082 44.61 44.37 0.410 44.28 0.410 Age (in months) 12,099 120.97 121.02 0.108 121.05 0.109 Height (in inches) 11,776 55.57 55.62 0.042 55.65 0.043 Weight (in pounds) 11,674 86.35 86.42 0.315 86.76 0.335 Body mass index (BMI) 11,658 19.45 19.44 0.058 19.49 0.060
1 Unadjusted estimates are produced using the fourth-grade student base weight. The sample size is the count of cases with nonzero fourth-grade student base weight. 2 Adjusted estimates are produced using weight W8C8P_20. 3 States in each region: Northeast: Connecticut, Maine, Massachusetts, New Hampshire, New Jersey, New York, Pennsylvania, Rhode Island, and Vermont. Midwest: Illinois, Indiana, Iowa, Kansas, Michigan, Minnesota, Missouri, Nebraska, North Dakota, Ohio, South Dakota, and Wisconsin. South: Alabama, Arkansas, Delaware, Florida, Georgia, Kentucky, Louisiana, Maryland, Mississippi, North Carolina, Oklahoma, South Carolina, Tennessee, Texas, Virginia, West Virginia, and the District of Columbia. West: Alaska, Arizona, California, Colorado, Hawaii, Idaho, Montana, Nevada, New Mexico, Oregon, Utah, Washington, and Wyoming. 4 Sample sizes rounded to the nearest 10 and, therefore, may not sum to total. NOTE: SE = standard error. The sample sizes are the number of cases with a nonzero fourth-grade base weight and a nonmissing value for the characteristic or group of characteristics. SOURCE: U.S. Department of Education, National Center for Education Statistics, Early Childhood Longitudinal Study, Kindergarten Class of 2010–11 (ECLS-K:2011), spring 2015.

5-35
Table 5-19. Differences between unweighted and weighted estimates, and between unadjusted and adjusted estimates, child assessment, spring fourth grade: Spring 2015
Between unweighted and unadjusted1
Between unweighted and adjusted2
Between unadjusted1 and adjusted2
Survey item Sample Absolute
difference Relative
difference p value Absolute
difference Relative
difference p value Absolute
difference Relative
difference p value Proportion of students by school type
Public 12,192 1.41 1.55 0.001 0.76 0.83 0.060 0.65 0.70 0.012 Private 12,192 1.41 16.13 0.001 0.76 8.70 0.060 0.65 8.87 0.012
Proportion of students by census region3,4 Northeast 12,190 0.39 2.37 0.613 0.54 3.28 0.003 0.15 0.93 0.838 Midwest 12,190 1.18 5.61 0.100 1.09 5.18 0.000 0.09 0.40 0.900 South 12,190 1.61 4.54 0.039 2.51 7.07 0.000 0.90 2.43 0.214 West 12,190 2.39 8.86 0.000 3.05 11.30 0.000 0.66 2.68 0.260
Proportion of students by locale City 11,864 2.17 6.69 0.101 1.37 4.22 0.265 0.80 2.64 0.136 Suburb 11,864 1.62 3.80 0.243 2.85 6.68 0.025 1.23 3.00 0.034 Town 11,864 3.23 46.88 0.016 3.60 52.25 0.006 0.37 3.66 0.368 Rural 11,864 0.56 3.11 0.633 0.62 3.44 0.614 0.06 0.32 0.880
Proportion of students by race/ethnicity White, non-Hispanic 18,130 4.72 10.08 0.006 4.94 10.55 0.004 0.22 0.43 0.090 Black, non-Hispanic 18,130 0.03 0.23 0.980 0.10 0.76 0.936 0.07 0.53 0.809 Hispanic 18,130 0.39 1.54 0.755 0.55 2.17 0.663 0.16 0.64 0.157 Asian, non-Hispanic 18,130 3.90 45.83 0.000 4.05 47.59 0.000 0.15 3.25 0.343 Native Hawaiian/Pacific Islander, non-
Hispanic 18,130 0.22 33.85 0.007 0.22 33.85 0.019 0.00 0.00 0.990 American Indian/Alaska Native, non-
Hispanic 18,130 0.25 26.88 0.627 0.23 24.73 0.660 0.02 1.69 0.689 Two or more races 18,130 0.50 10.96 0.050 0.46 10.09 0.039 0.04 0.99 0.776
See notes at end of table.

5-36
Table 5-19. Differences between unweighted and weighted estimates, and between unadjusted and adjusted estimates, child assessment, spring fourth grade: Spring 2015—Continued
Between unweighted and unadjusted1
Between unweighted and adjusted2
Between unadjusted1 and adjusted2
Survey item Sample Absolute
difference Relative
difference p value Absolute
difference Relative
difference p value Absolute
difference Relative
difference p value Mean estimate of the following student scores
and characteristics Mathematics scale score 12,080 0.01 0.01 0.978 0.04 0.04 0.913 0.05 0.05 0.661 Reading scale score 12,074 0.18 0.15 0.509 0.31 0.25 0.212 0.13 0.11 0.099 Science scale score 12,069 0.23 0.35 0.454 0.35 0.54 0.249 0.12 0.18 0.147 Mathematics theta score 12,080 0.00 0.00 0.963 0.00 0.00 0.949 0.00 0.00 0.721 Reading theta score 12,074 0.01 0.35 0.531 0.02 0.69 0.279 0.01 0.35 0.206 Science theta score 12,069 0.02 0.78 0.445 0.03 1.16 0.231 0.01 0.38 0.124 Number reversed age percentile 12,082 0.24 0.54 0.561 0.33 0.74 0.413 0.09 0.20 0.471 Age (in months) 12,099 0.05 0.04 0.658 0.08 0.07 0.473 0.03 0.02 0.316 Height (in inches) 11,776 0.05 0.09 0.312 0.08 0.14 0.059 0.03 0.05 0.003 Weight (in pounds) 11,674 0.07 0.08 0.811 0.41 0.47 0.219 0.34 0.39 0.026 Body mass index (BMI) 11,658 0.01 0.05 0.916 0.04 0.21 0.506 0.05 0.26 0.108
1 Unadjusted estimates are produced using the fourth-grade student base weight. The sample size is the count of cases with nonzero fourth-grade student base weight. 2 Adjusted estimates are produced using weight W8C8P_20. 3 States in each region: Northeast: Connecticut, Maine, Massachusetts, New Hampshire, New Jersey, New York, Pennsylvania, Rhode Island, and Vermont. Midwest: Illinois, Indiana, Iowa, Kansas, Michigan, Minnesota, Missouri, Nebraska, North Dakota, Ohio, South Dakota, and Wisconsin. South: Alabama, Arkansas, Delaware, Florida, Georgia, Kentucky, Louisiana, Maryland, Mississippi, North Carolina, Oklahoma, South Carolina, Tennessee, Texas, Virginia, West Virginia, and the District of Columbia. West: Alaska, Arizona, California, Colorado, Hawaii, Idaho, Montana, Nevada, New Mexico, Oregon, Utah, Washington, and Wyoming. 4 Sample sizes rounded to the nearest 10 and, therefore, may not sum to total. NOTE: The sample sizes are the number of cases with a nonzero fourth-grade base weight and a nonmissing value for the characteristic or group of characteristics. SOURCE: U.S. Department of Education, National Center for Education Statistics, Early Childhood Longitudinal Study, Kindergarten Class of 2010–11 (ECLS-K:2011), spring 2015.

5-37
5.3.2 Effect of Nonresponse on Parent Interview Data
The adjusted weight used in the analysis of the effect of nonresponse on parent interview data is W8C28P_8A0. For a discussion of how the weights were constructed, see chapter 4. Table 5-20 shows estimates of selected items from the parent interview. Table 5-21 shows the differences between unweighted and weighted estimates, and between estimates produced using base weights (unadjusted estimates) and estimates produced using nonresponse-adjusted weights. The range of absolute differences is 0 to 3.59, and the average is 0.69.
The discussion of how to interpret the relative difference provided above in the section on the child assessment applies to the parent interview data as well. As noted above, the percent difference is sensitive not only to sample size but also to the prevalence of a particular characteristic. For example, as shown in table 5-20, the percent of students who participated in organized athletic activities is 63.19; the absolute difference between the nonresponse-adjusted estimate and unadjusted estimate is 1.47, and the relative difference between these two estimates is 2.27, as shown in table 5-21. The percent of students whose parents volunteered at school is 47.19, with an absolute difference of 2.23 and a relative difference of 4.51 between the nonresponse-adjusted estimate and the unadjusted estimate. The relative difference is smaller for the groups of students with higher prevalence in the characteristic examined.
As with the child assessment data, the differences found in the analyses show that there is some potential for nonresponse bias in the unweighted parent interview data, but the weights used to produce estimates were adjusted for nonresponse and, thus, reduce that potential for bias.
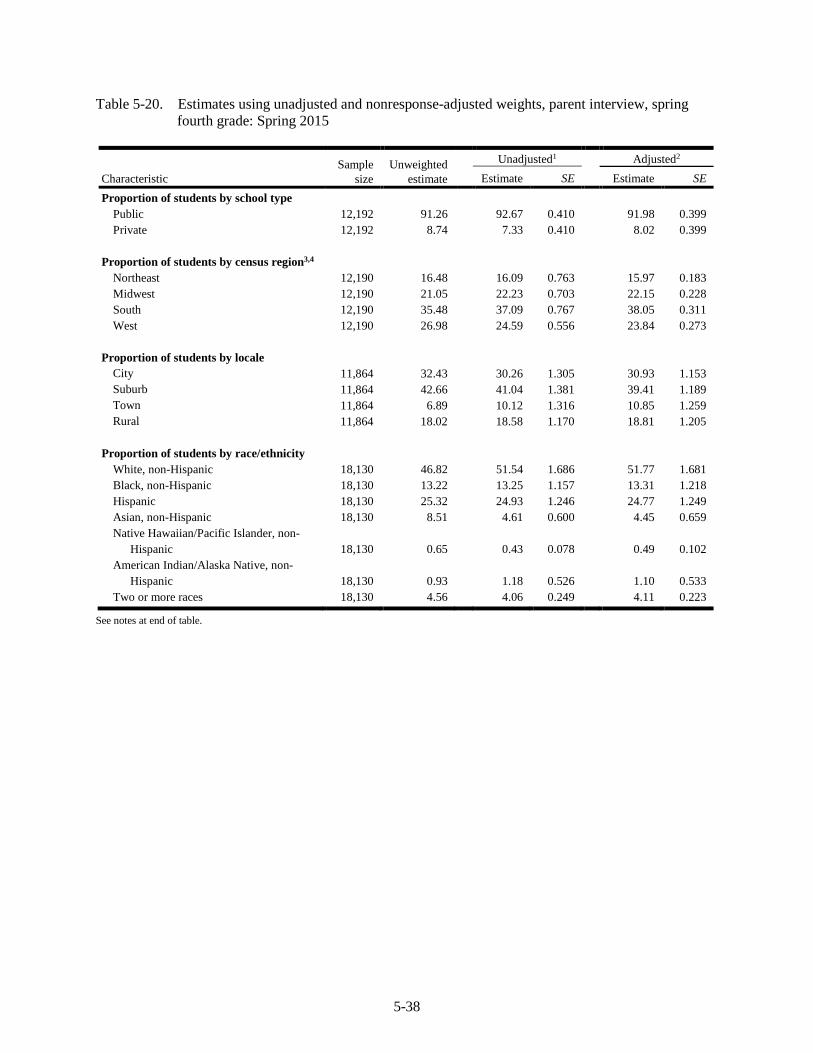
5-38
Table 5-20. Estimates using unadjusted and nonresponse-adjusted weights, parent interview, spring fourth grade: Spring 2015
Characteristic Sample
size Unweighted
estimate
Unadjusted1 Adjusted2 Estimate SE Estimate SE
Proportion of students by school type Public 12,192 91.26 92.67 0.410 91.98 0.399 Private 12,192 8.74 7.33 0.410 8.02 0.399
Proportion of students by census region3,4 Northeast 12,190 16.48 16.09 0.763 15.97 0.183 Midwest 12,190 21.05 22.23 0.703 22.15 0.228 South 12,190 35.48 37.09 0.767 38.05 0.311 West 12,190 26.98 24.59 0.556 23.84 0.273
Proportion of students by locale City 11,864 32.43 30.26 1.305 30.93 1.153 Suburb 11,864 42.66 41.04 1.381 39.41 1.189 Town 11,864 6.89 10.12 1.316 10.85 1.259 Rural 11,864 18.02 18.58 1.170 18.81 1.205
Proportion of students by race/ethnicity White, non-Hispanic 18,130 46.82 51.54 1.686 51.77 1.681 Black, non-Hispanic 18,130 13.22 13.25 1.157 13.31 1.218 Hispanic 18,130 25.32 24.93 1.246 24.77 1.249 Asian, non-Hispanic 18,130 8.51 4.61 0.600 4.45 0.659 Native Hawaiian/Pacific Islander, non-
Hispanic 18,130 0.65 0.43 0.078 0.49 0.102 American Indian/Alaska Native, non-
Hispanic 18,130 0.93 1.18 0.526 1.10 0.533 Two or more races 18,130 4.56 4.06 0.249 4.11 0.223
See notes at end of table.

5-39
Table 5-20. Estimates using unadjusted and nonresponse-adjusted weights, parent interview, spring fourth grade: Spring 2015—Continued
Characteristic Sample
size Unweighted
estimate
Unadjusted1 Adjusted2
Estimate SE Estimate SE Proportion of students with the following
characteristics from the parent interview
Parent is currently married/in civil union/in domestic partnership 10,655 73.12 71.92 0.890 70.62 0.962
At least one parent has a high school diploma or equivalent 10,680 90.73 91.78 0.565 91.78 0.501
Child cares for self 10,292 8.39 8.45 0.418 8.35 0.429 Child participated in organized athletic
activities 10,403 62.81 64.66 0.923 63.19 0.818 Child participated in performing arts
programs 10,394 23.71 23.80 0.580 23.56 0.603 Child has art classes or lessons 10,394 12.70 12.52 0.454 11.86 0.465 Parent volunteered at school 10,654 48.99 49.42 1.184 47.19 1.103 Parent used computer to get information
from school 10,663 79.91 81.64 0.955 80.45 0.962 Often or sometimes true that parent could
not afford balanced meals in last 12 months 10,056 9.24 9.57 0.506 9.90 0.501
Household poverty index Below poverty threshold 10,680 23.07 22.61 1.054 23.83 1.010 At or above poverty threshold but below
200 percent poverty threshold 10,680 22.36 21.84 0.635 24.21 0.677 At or above 200 percent poverty
threshold 10,680 54.57 55.55 1.292 51.96 1.163
Mean estimate of the following student characteristics
Total number of persons in household 10,680 4.69 4.66 0.026 4.66 0.027 Total number of siblings in household 10,680 1.62 1.63 0.023 1.62 0.024 Total number of persons in household less
than 18 years of age 10,656 2.56 2.57 0.022 2.55 0.022 1 Unadjusted estimates are produced using the fourth-grade student base weight. The sample size is the count of cases with nonzero fourth-grade student base weight. 2 Adjusted estimates are produced using weight W8C28P_8A0. 3 States in each region: Northeast: Connecticut, Maine, Massachusetts, New Hampshire, New Jersey, New York, Pennsylvania, Rhode Island, and Vermont. Midwest: Illinois, Indiana, Iowa, Kansas, Michigan, Minnesota, Missouri, Nebraska, North Dakota, Ohio, South Dakota, and Wisconsin. South: Alabama, Arkansas, Delaware, Florida, Georgia, Kentucky, Louisiana, Maryland, Mississippi, North Carolina, Oklahoma, South Carolina, Tennessee, Texas, Virginia, West Virginia, and the District of Columbia. West: Alaska, Arizona, California, Colorado, Hawaii, Idaho, Montana, Nevada, New Mexico, Oregon, Utah, Washington, and Wyoming. 4 Sample sizes rounded to the nearest 10 and, therefore, may not sum to total. NOTE: SE = standard error. The sample sizes are the number of cases with a nonzero fourth-grade base weight and a nonmissing value for the characteristic or group of characteristics. SOURCE: U.S. Department of Education, National Center for Education Statistics, Early Childhood Longitudinal Study, Kindergarten Class of 2010–11 (ECLS-K:2011), spring 2015.
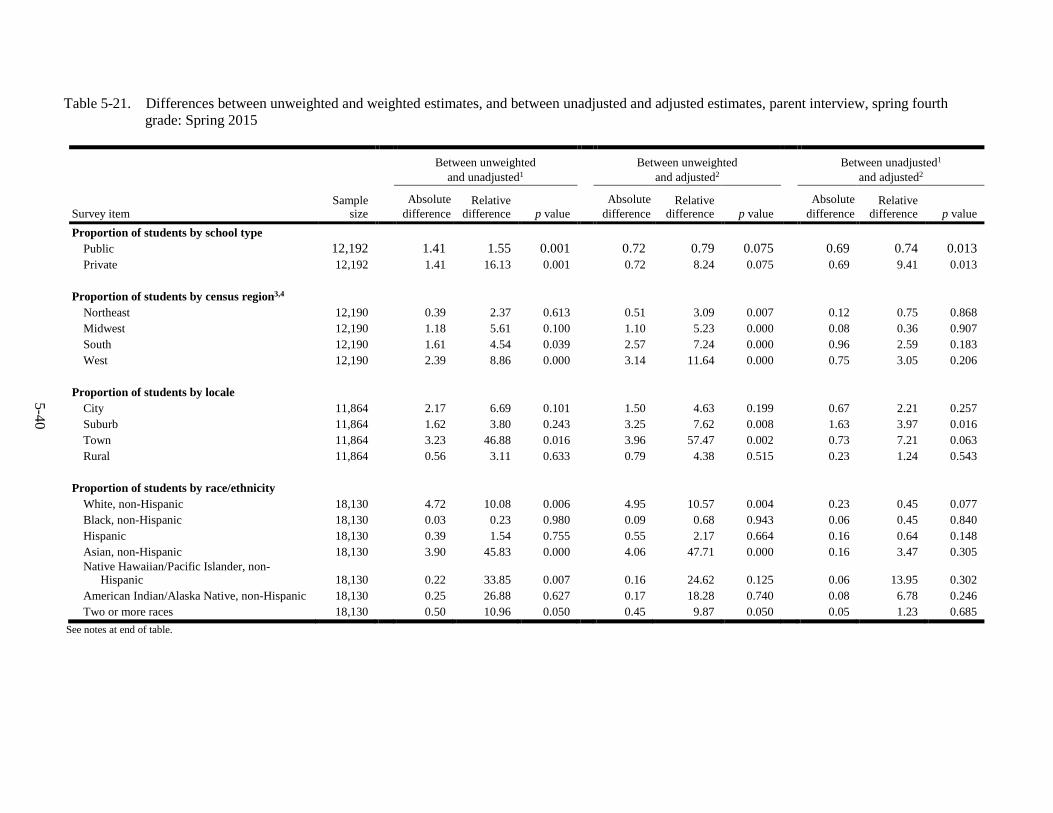
5-40
Table 5-21. Differences between unweighted and weighted estimates, and between unadjusted and adjusted estimates, parent interview, spring fourth grade: Spring 2015
Between unweighted
and unadjusted1 Between unweighted
and adjusted2 Between unadjusted1
and adjusted2
Survey item Sample
size Absolute
difference Relative
difference p value Absolute
difference Relative
difference p value Absolute
difference Relative
difference p value Proportion of students by school type
Public 12,192 1.41 1.55 0.001 0.72 0.79 0.075 0.69 0.74 0.013 Private 12,192 1.41 16.13 0.001 0.72 8.24 0.075 0.69 9.41 0.013
Proportion of students by census region3,4 Northeast 12,190 0.39 2.37 0.613 0.51 3.09 0.007 0.12 0.75 0.868 Midwest 12,190 1.18 5.61 0.100 1.10 5.23 0.000 0.08 0.36 0.907 South 12,190 1.61 4.54 0.039 2.57 7.24 0.000 0.96 2.59 0.183 West 12,190 2.39 8.86 0.000 3.14 11.64 0.000 0.75 3.05 0.206
Proportion of students by locale City 11,864 2.17 6.69 0.101 1.50 4.63 0.199 0.67 2.21 0.257 Suburb 11,864 1.62 3.80 0.243 3.25 7.62 0.008 1.63 3.97 0.016 Town 11,864 3.23 46.88 0.016 3.96 57.47 0.002 0.73 7.21 0.063 Rural 11,864 0.56 3.11 0.633 0.79 4.38 0.515 0.23 1.24 0.543
Proportion of students by race/ethnicity White, non-Hispanic 18,130 4.72 10.08 0.006 4.95 10.57 0.004 0.23 0.45 0.077 Black, non-Hispanic 18,130 0.03 0.23 0.980 0.09 0.68 0.943 0.06 0.45 0.840 Hispanic 18,130 0.39 1.54 0.755 0.55 2.17 0.664 0.16 0.64 0.148 Asian, non-Hispanic 18,130 3.90 45.83 0.000 4.06 47.71 0.000 0.16 3.47 0.305 Native Hawaiian/Pacific Islander, non-
Hispanic 18,130 0.22 33.85 0.007 0.16 24.62 0.125 0.06 13.95 0.302 American Indian/Alaska Native, non-Hispanic 18,130 0.25 26.88 0.627 0.17 18.28 0.740 0.08 6.78 0.246 Two or more races 18,130 0.50 10.96 0.050 0.45 9.87 0.050 0.05 1.23 0.685
See notes at end of table.

5-41
Table 5-21. Differences between unweighted and weighted estimates, and between unadjusted and adjusted estimates, parent interview, spring fourth grade: Spring 2015—Continued
Between unweighted and unadjusted1
Between unweighted and adjusted2
Between unadjusted1 and adjusted2
Survey item Sample
size Absolute
difference Relative
difference p value Absolute
difference Relative
difference p value Absolute
difference Relative
difference p value Proportion of students with the following
characteristics from the parent interview Parent is currently married/in civil union/in
domestic partnership 10,655 1.20 1.64 0.183 2.50 3.42 0.011 1.30 1.81 0.002 At least one parent has a high school diploma
or equivalent 10,680 1.05 1.16 0.066 1.05 1.16 0.040 0.00 0.00 0.974 Child cares for self 10,292 0.06 0.72 0.886 0.04 0.48 0.916 0.10 1.18 0.602 Child participated in organized athletic
activities 10,403 1.85 2.95 0.048 0.38 0.60 0.644 1.47 2.27 0.002 Child participated in performing arts programs 10,394 0.09 0.38 0.875 0.15 0.63 0.809 0.24 1.01 0.392 Child has art classes or lessons 10,394 0.18 1.42 0.687 0.84 6.61 0.077 0.66 5.27 0.005 Parent volunteered at school 10,654 0.43 0.88 0.718 1.80 3.67 0.108 2.23 4.51 0.000 Parent used computer to get information from
school 10,663 1.73 2.16 0.074 0.54 0.68 0.576 1.19 1.46 0.001 Often or sometimes true that parent could not
afford balanced meals in last 12 months 10,056 0.33 3.57 0.514 0.66 7.14 0.190 0.33 3.45 0.176 Household poverty index
Below poverty threshold 10,680 0.46 1.99 0.665 0.76 3.29 0.457 1.22 5.40 0.004 At or above poverty threshold but below 200
percent poverty threshold 10,680 0.52 2.33 0.416 1.85 8.27 0.008 2.37 10.85 0.000 At or above 200 percent poverty threshold 10,680 0.98 1.80 0.452 2.61 4.78 0.028 3.59 6.46 0.000
See notes at end of table.

5-42
Table 5-21. Differences between unweighted and weighted estimates, and between unadjusted and adjusted estimates, parent interview, spring fourth grade: Spring 2015—Continued
Between unweighted and unadjusted1
Between unweighted and adjusted2
Between unadjusted1 and adjusted2
Survey item Sample Absolute
difference Relative
difference p value Absolute
difference Relative
difference p value Absolute
difference Relative
difference p value Mean estimate of the following student
characteristics Total number of persons in household 10,680 0.03 0.64 0.301 0.03 0.64 0.255 0.00 0.00 0.766 Total number of siblings in household 10,680 0.01 0.62 0.624 0.00 0.00 0.867 0.01 0.61 0.491 Total number of persons in household less than
18 years of age 10,656 0.01 0.39 0.464 0.01 0.39 0.894 0.02 0.78 0.069 1 Unadjusted estimates are produced using the fourth-grade student base weight. The sample size is the count of cases with nonzero fourth-grade student base weight. 2 Adjusted estimates are produced using weight W8C28P_8A0. 3 States in each region: Northeast: Connecticut, Maine, Massachusetts, New Hampshire, New Jersey, New York, Pennsylvania, Rhode Island, and Vermont. Midwest: Illinois, Indiana, Iowa, Kansas, Michigan, Minnesota, Missouri, Nebraska, North Dakota, Ohio, South Dakota, and Wisconsin. South: Alabama, Arkansas, Delaware, Florida, Georgia, Kentucky, Louisiana, Maryland, Mississippi, North Carolina, Oklahoma, South Carolina, Tennessee, Texas, Virginia, West Virginia, and the District of Columbia. West: Alaska, Arizona, California, Colorado, Hawaii, Idaho, Montana, Nevada, New Mexico, Oregon, Utah, Washington, and Wyoming. 4 Sample sizes rounded to the nearest 10 and, therefore, may not sum to total. NOTE: The sample sizes are the number of cases with a nonzero fourth-grade base weight and a nonmissing value for the characteristic or group of characteristics. SOURCE: U.S. Department of Education, National Center for Education Statistics, Early Childhood Longitudinal Study, Kindergarten Class of 2010–11 (ECLS-K:2011), spring 2015.
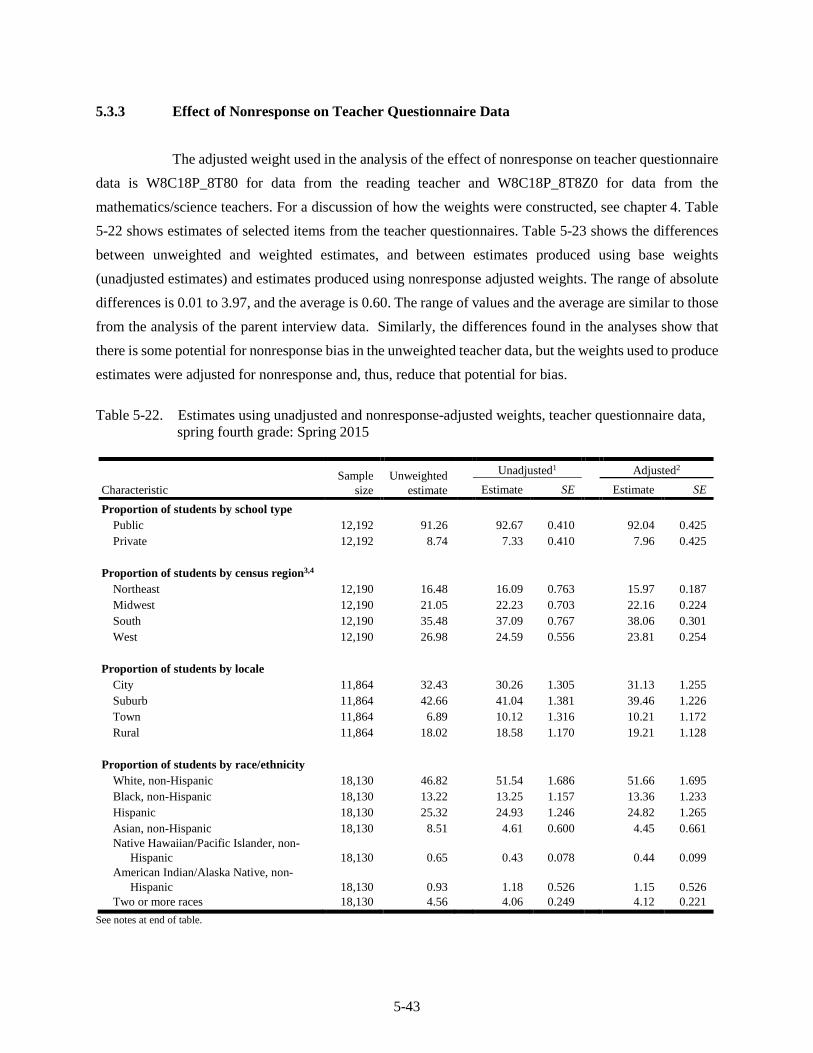
5-43
5.3.3 Effect of Nonresponse on Teacher Questionnaire Data
The adjusted weight used in the analysis of the effect of nonresponse on teacher questionnaire data is W8C18P_8T80 for data from the reading teacher and W8C18P_8T8Z0 for data from the mathematics/science teachers. For a discussion of how the weights were constructed, see chapter 4. Table 5-22 shows estimates of selected items from the teacher questionnaires. Table 5-23 shows the differences between unweighted and weighted estimates, and between estimates produced using base weights (unadjusted estimates) and estimates produced using nonresponse adjusted weights. The range of absolute differences is 0.01 to 3.97, and the average is 0.60. The range of values and the average are similar to those from the analysis of the parent interview data. Similarly, the differences found in the analyses show that there is some potential for nonresponse bias in the unweighted teacher data, but the weights used to produce estimates were adjusted for nonresponse and, thus, reduce that potential for bias.
Table 5-22. Estimates using unadjusted and nonresponse-adjusted weights, teacher questionnaire data, spring fourth grade: Spring 2015
Characteristic Sample
size Unweighted
estimate
Unadjusted1 Adjusted2 Estimate SE Estimate SE
Proportion of students by school type Public 12,192 91.26 92.67 0.410 92.04 0.425 Private 12,192 8.74 7.33 0.410 7.96 0.425
Proportion of students by census region3,4 Northeast 12,190 16.48 16.09 0.763 15.97 0.187 Midwest 12,190 21.05 22.23 0.703 22.16 0.224 South 12,190 35.48 37.09 0.767 38.06 0.301 West 12,190 26.98 24.59 0.556 23.81 0.254
Proportion of students by locale City 11,864 32.43 30.26 1.305 31.13 1.255 Suburb 11,864 42.66 41.04 1.381 39.46 1.226 Town 11,864 6.89 10.12 1.316 10.21 1.172 Rural 11,864 18.02 18.58 1.170 19.21 1.128
Proportion of students by race/ethnicity White, non-Hispanic 18,130 46.82 51.54 1.686 51.66 1.695 Black, non-Hispanic 18,130 13.22 13.25 1.157 13.36 1.233 Hispanic 18,130 25.32 24.93 1.246 24.82 1.265 Asian, non-Hispanic 18,130 8.51 4.61 0.600 4.45 0.661 Native Hawaiian/Pacific Islander, non-
Hispanic 18,130 0.65 0.43 0.078 0.44 0.099 American Indian/Alaska Native, non-
Hispanic 18,130 0.93 1.18 0.526 1.15 0.526 Two or more races 18,130 4.56 4.06 0.249 4.12 0.221
See notes at end of table.

5-44
Table 5-22. Estimates using unadjusted and nonresponse-adjusted weights, teacher questionnaire data, spring fourth grade: Spring 2015—Continued
Characteristic Sample
size Unweighted
estimate
Unadjusted1 Adjusted2
Estimate SE Estimate SE Proportion of students with the following
characteristics from the teacher data Teacher took course to address using
assessment data for teaching reading 11,057 66.52 66.98 1.203 67.16 1.266 Teacher has regular or standard state
certificate or advanced professional certificate 11,098 90.33 91.16 0.554 90.81 0.630
Teacher has bachelor’s degree or higher 11,150 99.78 99.78 0.104 99.79 0.105 Teacher agreed/strongly agreed that school
administrator was encouraging of staff 11,074 81.80 82.20 1.011 82.03 1.065 Teacher agreed/strongly agreed that child
misbehavior interfered with teaching 11,081 27.54 28.42 1.163 28.62 1.167 More than 50 percent of parents
volunteered regularly 11,056 7.86 7.83 0.667 7.45 0.609 Student reading skills were below grade
level as rated by reading teacher 11,024 27.14 26.88 0.734 25.50 0.804 Student received individual tutoring in
reading/language arts 11,014 25.98 25.98 0.734 25.65 0.859 Parent was very involved at the school 10,952 26.00 26.40 0.758 27.10 0.828 Student was in program to learn English
skills 2,203 44.94 46.75 2.688 46.01 2.716 Student usually worked to best ability in
math 5,507 49.45 50.30 0.717 49.87 0.816 Student math skills were below grade level
as rated by math teacher 5,496 26.27 26.31 0.770 22.34 0.857 Student solved math problems in small
groups almost every day 5,466 54.76 55.62 1.406 56.25 1.574 Student used computer for math almost
every day 5,467 19.66 19.21 1.157 19.56 1.289 Student usually worked to best ability in
science 5,482 52.41 53.85 0.811 53.25 0.933 Student science skills were below grade
level as rated by science teacher 5,472 18.95 18.76 0.646 15.48 0.729 Student worked with others on science
project almost every day 5,433 8.60 8.94 0.956 9.01 0.951 Student used computer for science almost
every day 5,444 3.67 3.85 0.523 4.24 0.682 1 Unadjusted estimates are produced using the fourth-grade student base weight. The sample size is the count of cases with nonzero fourth-grade student base weight. 2 Adjusted estimates are produced using weight W8C18P_8T80 for the students with reading teachers, and weight W8C18P_8T8Z0 for the students with mathematics/science teachers. 3 States in each region: Northeast: Connecticut, Maine, Massachusetts, New Hampshire, New Jersey, New York, Pennsylvania, Rhode Island, and Vermont. Midwest: Illinois, Indiana, Iowa, Kansas, Michigan, Minnesota, Missouri, Nebraska, North Dakota, Ohio, South Dakota, and Wisconsin. South: Alabama, Arkansas, Delaware, Florida, Georgia, Kentucky, Louisiana, Maryland, Mississippi, North Carolina, Oklahoma, South Carolina, Tennessee, Texas, Virginia, West Virginia, and the District of Columbia. West: Alaska, Arizona, California, Colorado, Hawaii, Idaho, Montana, Nevada, New Mexico, Oregon, Utah, Washington, and Wyoming. 4 Sample sizes rounded to the nearest 10 and, therefore, may not sum to total. NOTE: SE = standard error. The sample sizes are the number of cases with a nonzero fourth-grade base weight and a nonmissing value for the characteristic or group of characteristics. SOURCE: U.S. Department of Education, National Center for Education Statistics, Early Childhood Longitudinal Study, Kindergarten Class of 2010–11 (ECLS-K:2011), spring 2015.

5-45
Table 5-23. Differences between unweighted and weighted estimates, and between unadjusted and adjusted estimates, teacher questionnaire data, spring fourth grade: Spring 2015
Between unweighted
and unadjusted1 Between unweighted
and adjusted2 Between unadjusted1
and adjusted2
Survey item Sample
size Absolute
difference Relative
difference p value Absolute
difference Relative
difference p value Absolute
difference Relative
difference p value Proportion of students by school type
Public 12,192 1.41 1.55 0.001 0.78 0.85 0.069 0.63 0.68 0.037 Private 12,192 1.41 16.13 0.001 0.78 8.92 0.069 0.63 8.59 0.037
Proportion of students by census region3,4 Northeast 12,190 0.39 2.37 0.613 0.51 3.09 0.009 0.12 0.75 0.873 Midwest 12,190 1.18 5.61 0.100 1.11 5.27 0.000 0.07 0.31 0.913 South 12,190 1.61 4.54 0.039 2.58 7.27 0.000 0.97 2.62 0.171 West 12,190 2.39 8.86 0.000 3.17 11.75 0.000 0.78 3.17 0.186
Proportion of students by locale City 11,864 2.17 6.69 0.101 1.30 4.01 0.305 0.87 2.88 0.177 Suburb 11,864 1.62 3.80 0.243 3.20 7.50 0.011 1.58 3.85 0.019 Town 11,864 3.23 46.88 0.016 3.32 48.19 0.006 0.09 0.89 0.903 Rural 11,864 0.56 3.11 0.633 1.19 6.60 0.297 0.63 3.39 0.316
Proportion of students by race/ethnicity White, non-Hispanic 18,130 4.72 10.08 0.006 4.84 10.34 0.005 0.12 0.23 0.387 Black, non-Hispanic 18,130 0.03 0.23 0.980 0.14 1.06 0.911 0.11 0.83 0.714 Hispanic 18,130 0.39 1.54 0.755 0.50 1.97 0.696 0.11 0.44 0.371 Asian, non-Hispanic 18,130 3.90 45.83 0.000 4.06 47.71 0.000 0.16 3.47 0.303 Native Hawaiian/Pacific Islander, non-
Hispanic 18,130 0.22 33.85 0.007 0.21 32.31 0.047 0.01 2.33 0.798 American Indian/Alaska Native, non-Hispanic 18,130 0.25 26.88 0.627 0.22 23.66 0.672 0.03 2.54 0.608 Two or more races 18,130 0.50 10.96 0.050 0.44 9.65 0.050 0.06 1.48 0.675
See notes at end of table.

5-46
Table 5-23. Differences between unweighted and weighted estimates, and between unadjusted and adjusted estimates, teacher questionnaire data, spring fourth grade: Spring 2015—Continued
Between unweighted and unadjusted1
Between unweighted and adjusted2
Between unadjusted1 and adjusted2
Survey item Sample
size Absolute
difference Relative
difference p value Absolute
difference Relative
difference p value Absolute
difference Relative
difference p value Proportion of students with the following
characteristics from the teacher data Teacher took course to address using
assessment data for teaching reading 11,057 0.46 0.69 0.700 0.64 0.96 0.612 0.18 0.27 0.561 Teacher has regular or standard state
certificate or advanced professional certificate 11,098 0.83 0.92 0.138 0.48 0.53 0.446 0.35 0.38 0.140
Teacher has bachelor’s degree or higher 11,150 0.00 0.00 0.948 0.01 0.01 0.963 0.01 0.01 0.755 Teacher agreed/strongly agreed that school
administrator was encouraging of staff 11,074 0.40 0.49 0.690 0.23 0.28 0.829 0.17 0.21 0.564 Teacher agreed/strongly agreed that child
misbehavior interfered with teaching 11,081 0.88 3.20 0.455 1.08 3.92 0.359 0.20 0.70 0.587 More than 50 percent of parents volunteered
regularly 11,056 0.03 0.38 0.967 0.41 5.22 0.500 0.38 4.85 0.080 Student reading skills were below grade level
as rated by reading teacher 11,024 0.26 0.96 0.719 1.64 6.04 0.045 1.38 5.13 0.001 Student received individual tutoring in
reading/language arts 11,014 0.00 0.00 0.997 0.33 1.27 0.708 0.33 1.27 0.386 Parent was very involved at the school 10,952 0.40 1.54 0.601 1.10 4.23 0.191 0.70 2.65 0.041
See notes at end of table.

5-47
Table 5-23. Differences between unweighted and weighted estimates, and between unadjusted and adjusted estimates, teacher questionnaire data, spring fourth grade: Spring 2015—Continued
Between unweighted and unadjusted1
Between unweighted and adjusted2
Between unadjusted1 and adjusted2
Survey item Sample
size Absolute
difference Relative
difference p value Absolute
difference Relative
difference p value Absolute
difference Relative
difference p value Proportion of students with the following
characteristics from the teacher data—Continued
Parent was very involved at the school 10,952 0.40 1.54 0.601 1.10 4.23 0.191 0.70 2.65 0.041 Student was in program to learn English skills 2,203 1.81 4.03 0.501 1.07 2.38 0.694 0.74 1.58 0.508 Student usually worked to best ability in math 5,507 0.85 1.72 0.240 0.42 0.85 0.605 0.43 0.85 0.475 Student math skills were below grade level as
rated by math teacher 5,496 0.04 0.15 0.959 3.93 14.96 0.000 3.97 15.09 0.000 Student solved math problems in small groups 5,466 0.86 1.57 0.543 1.49 2.72 0.346 0.63 1.13 0.309 Student used computer for math almost every
day 5,467 0.45 2.29 0.698 0.10 0.51 0.934 0.35 1.82 0.538 Student usually worked to best ability in
science 5,482 1.44 2.75 0.079 0.84 1.60 0.372 0.60 1.11 0.234 Student science skills were below grade level
as rated by science teacher 5,472 0.19 1.00 0.763 3.47 18.31 0.000 3.28 17.48 0.000 Student worked with others on science project 5,433 0.34 3.95 0.721 0.41 4.77 0.666 0.07 0.78 0.794 Student used computer for science almost
every day 5,444 0.18 4.90 0.731 0.57 15.53 0.407 0.39 10.13 0.164 1 Unadjusted estimates are produced using the fourth-grade student base weight. The sample size is the count of cases with nonzero fourth-grade student base weight. 2 Adjusted estimates are produced using weight W8C18P_8T80 for the students with reading teachers, and weight W8C18P_8T8Z0 for the students with mathematics/science teachers. 3 States in each region: Northeast: Connecticut, Maine, Massachusetts, New Hampshire, New Jersey, New York, Pennsylvania, Rhode Island, and Vermont. Midwest: Illinois, Indiana, Iowa, Kansas, Michigan, Minnesota, Missouri, Nebraska, North Dakota, Ohio, South Dakota, and Wisconsin. South: Alabama, Arkansas, Delaware, Florida, Georgia, Kentucky, Louisiana, Maryland, Mississippi, North Carolina, Oklahoma, South Carolina, Tennessee, Texas, Virginia, West Virginia, and the District of Columbia. West: Alaska, Arizona, California, Colorado, Hawaii, Idaho, Montana, Nevada, New Mexico, Oregon, Utah, Washington, and Wyoming. 4 Sample sizes rounded to the nearest 10 and, therefore, may not sum to total. NOTE: The sample sizes are the number of cases with a nonzero fourth-grade base weight and a nonmissing value for the characteristic or group of characteristics. SOURCE: U.S. Department of Education, National Center for Education Statistics, Early Childhood Longitudinal Study, Kindergarten Class of 2010–11 (ECLS-K:2011), spring 2015.

5-48
5.3.4 Effect of Nonresponse on School Administrator Questionnaire Data
The adjusted weight used in the analysis of the effect of nonresponse on school administrator questionnaire data (SAQ) is W8C18P_8T80. For a discussion of how the weights were constructed, see chapter 4. Table 5-24 shows estimates of selected items from the SAQ. Table 5-25 shows the differences between unweighted and weighted estimates, and between estimates produced using base weights (unadjusted estimates) and estimates produced using nonresponse adjusted weights. The range of absolute differences is 0.01 to 1.58, and the average is 0.45. The range of values and the average are smaller than those from the analysis of the parent interview data and the teacher questionnaire data, but larger than for the child assessment data. The differences found in the analyses show that there is some potential for nonresponse bias in the unweighted SAQ data, but the weights used to produce estimates were adjusted for nonresponse and, thus, reduce that potential for bias.
Table 5-24. Estimates using unadjusted and nonresponse-adjusted weights, school administrator questionnaire data, spring fourth grade: Spring 2015
Characteristic Sample
size Unweighted
estimate
Unadjusted1 Adjusted2 Estimate SE Estimate SE
Proportion of students by school type Public 12,192 91.26 92.67 0.410 92.04 0.425 Private 12,192 8.74 7.33 0.410 7.96 0.425
Proportion of students by census region3,4 Northeast 12,190 16.48 16.09 0.763 15.97 0.187 Midwest 12,190 21.05 22.23 0.703 22.16 0.224 South 12,190 35.48 37.09 0.767 38.06 0.301 West 12,190 26.98 24.59 0.556 23.81 0.254
Proportion of students by locale City 11,864 32.43 30.26 1.305 31.13 1.255 Suburb 11,864 42.66 41.04 1.381 39.46 1.226 Town 11,864 6.89 10.12 1.316 10.21 1.172 Rural 11,864 18.02 18.58 1.170 19.21 1.128
See notes at end of table.

5-49
Table 5-24. Estimates using unadjusted and nonresponse-adjusted weights, school administrator questionnaire data, spring fourth grade: Spring 2015—Continued
Characteristic Sample
size Unweighted
estimate
Unadjusted1 Adjusted2
Estimate SE Estimate SE Proportion of students by race/ethnicity
White, non-Hispanic 18,130 46.82 51.54 1.686 51.66 1.695 Black, non-Hispanic 18,130 13.22 13.25 1.157 13.36 1.233 Hispanic 18,130 25.32 24.93 1.246 24.82 1.265 Asian, non-Hispanic 18,130 8.51 4.61 0.600 4.45 0.661 Native Hawaiian/Pacific Islander, non-
Hispanic 18,130 0.65 0.43 0.078 0.44 0.099 American Indian/Alaska Native, non-
Hispanic 18,130 0.93 1.18 0.526 1.15 0.526 Two or more races 18,130 4.56 4.06 0.249 4.12 0.221
Proportion of students with the following characteristics from the school administrator questionnaire
Taught classroom programs provided by school at least once a year 11,248 98.72 98.91 0.299 99.00 0.294
School had staff in computer technology 11,182 73.28 73.99 2.044 74.55 1.981 School used electronic communication
with parents several times a month 11,207 40.73 40.32 2.143 40.11 2.329 School used Response to Intervention 11,143 84.54 85.42 1.468 85.64 1.319 Received Title I funding 10,047 70.88 71.87 2.417 73.33 2.252 Bullying happened on occasion 11,215 73.53 72.08 1.326 72.77 1.318 Crime in the area of the school was
somewhat of a problem or a big problem 839 37.78 36.95 3.289 36.24 3.667
1 Unadjusted estimates are produced using the fourth-grade student base weight. The sample size is the count of cases with nonzero fourth-grade student base weight. 2 Adjusted estimates are produced using weight W8C18P_8T80. 3 States in each region: Northeast: Connecticut, Maine, Massachusetts, New Hampshire, New Jersey, New York, Pennsylvania, Rhode Island, and Vermont. Midwest: Illinois, Indiana, Iowa, Kansas, Michigan, Minnesota, Missouri, Nebraska, North Dakota, Ohio, South Dakota, and Wisconsin. South: Alabama, Arkansas, Delaware, Florida, Georgia, Kentucky, Louisiana, Maryland, Mississippi, North Carolina, Oklahoma, South Carolina, Tennessee, Texas, Virginia, West Virginia, and the District of Columbia. West: Alaska, Arizona, California, Colorado, Hawaii, Idaho, Montana, Nevada, New Mexico, Oregon, Utah, Washington, and Wyoming. 4 Sample sizes rounded to the nearest 10 and, therefore, may not sum to total. NOTE: SE = standard error. The sample sizes are the number of cases with a nonzero fourth-grade base weight and a nonmissing value for the characteristic or group of characteristics. SOURCE: U.S. Department of Education, National Center for Education Statistics, Early Childhood Longitudinal Study, Kindergarten Class of 2010–11 (ECLS-K:2011), spring 2015.

5-50
Table 5-25. Differences between unweighted and weighted estimates, and between unadjusted and adjusted estimates, school administrator questionnaire data, spring fourth grade: Spring 2015
Between unweighted
and unadjusted1 Between unweighted
and adjusted2 Between unadjusted1
and adjusted2
Survey item Sample
size Absolute
difference Relative
difference p value Absolute
difference Relative
difference p value Absolute
difference Relative
difference p value Proportion of students by school type
Public 12,192 1.41 1.55 0.001 0.78 0.85 0.069 0.63 0.68 0.037 Private 12,192 1.41 16.13 0.001 0.78 8.92 0.069 0.63 8.59 0.037
Proportion of students by census region3,4 Northeast 12,190 0.39 2.37 0.613 0.51 3.09 0.009 0.12 0.75 0.873 Midwest 12,190 1.18 5.61 0.100 1.11 5.27 0.000 0.07 0.31 0.913 South 12,190 1.61 4.54 0.039 2.58 7.27 0.000 0.97 2.62 0.171 West 12,190 2.39 8.86 0.000 3.17 11.75 0.000 0.78 3.17 0.186
Proportion of students by locale City 11,864 2.17 6.69 0.101 1.30 4.01 0.305 0.87 2.88 0.177 Suburb 11,864 1.62 3.80 0.243 3.20 7.50 0.011 1.58 3.85 0.019 Town 11,864 3.23 46.88 0.016 3.32 48.19 0.006 0.09 0.89 0.903 Rural 11,864 0.56 3.11 0.633 1.19 6.60 0.297 0.63 3.39 0.316
Proportion of students by race/ethnicity White, non-Hispanic 18,130 4.72 10.08 0.006 4.84 10.34 0.005 0.12 0.23 0.387 Black, non-Hispanic 18,130 0.03 0.23 0.980 0.14 1.06 0.911 0.11 0.83 0.714 Hispanic 18,130 0.39 1.54 0.755 0.50 1.97 0.696 0.11 0.44 0.371 Asian, non-Hispanic 18,130 3.90 45.83 0.000 4.06 47.71 0.000 0.16 3.47 0.303 Native Hawaiian/Pacific Islander, non-
Hispanic 18,130 0.22 33.85 0.007 0.21 32.31 0.047 0.01 2.33 0.798 American Indian/Alaska Native, non-Hispanic 18,130 0.25 26.88 0.627 0.22 23.66 0.672 0.03 2.54 0.608 Two or more races 18,130 0.50 10.96 0.050 0.44 9.65 0.050 0.06 1.48 0.675
See notes at end of table.

5-51
Table 5-25. Differences between unweighted and weighted estimates, and between unadjusted and adjusted estimates, school administrator questionnaire data, spring fourth grade: Spring 2015—Continued
Between unweighted and unadjusted1
Between unweighted and adjusted2
Between unadjusted1 and adjusted2
Survey item Sample
size Absolute
difference Relative
difference p value Absolute
difference Relative
difference p value Absolute
difference Relative
difference p value Proportion of students with the following
characteristics from the school administrator questionnaire
Taught classroom programs provided by school at least once a year 11,248 0.19 0.19 0.530 0.28 0.28 0.338 0.09 0.09 0.338
School had staff in computer technology 11,182 0.71 0.97 0.729 1.27 1.73 0.524 0.56 0.76 0.365 School used electronic communication with
parents several times a month 11,207 0.41 1.01 0.848 0.62 1.52 0.791 0.21 0.52 0.673 School used Response to Intervention 11,143 0.88 1.04 0.549 1.10 1.30 0.408 0.22 0.26 0.683 Received Title I funding 10,047 0.99 1.40 0.683 2.45 3.46 0.280 1.46 2.03 0.001 Bullying happened on occasion 11,215 1.45 1.97 0.280 0.76 1.03 0.566 0.69 0.96 0.129 Crime in the area of the school was somewhat
of a problem or a big problem 839 0.83 2.20 0.800 1.54 4.08 0.675 0.71 1.92 0.704 1 Unadjusted estimates are produced using the fourth-grade student base weight. The sample size is the count of cases with nonzero fourth-grade student base weight. 2 Adjusted estimates are produced using weight W8C18P_8T80. 3 States in each region: Northeast: Connecticut, Maine, Massachusetts, New Hampshire, New Jersey, New York, Pennsylvania, Rhode Island, and Vermont. Midwest: Illinois, Indiana, Iowa, Kansas, Michigan, Minnesota, Missouri, Nebraska, North Dakota, Ohio, South Dakota, and Wisconsin. South: Alabama, Arkansas, Delaware, Florida, Georgia, Kentucky, Louisiana, Maryland, Mississippi, North Carolina, Oklahoma, South Carolina, Tennessee, Texas, Virginia, West Virginia, and the District of Columbia. West: Alaska, Arizona, California, Colorado, Hawaii, Idaho, Montana, Nevada, New Mexico, Oregon, Utah, Washington, and Wyoming. 4 Sample sizes rounded to the nearest 10 and, therefore, may not sum to total. NOTE: The sample sizes are the number of cases with a nonzero fourth-grade base weight and a nonmissing value for the characteristic or group of characteristics. SOURCE: U.S. Department of Education, National Center for Education Statistics, Early Childhood Longitudinal Study, Kindergarten Class of 2010–11 (ECLS-K:2011), spring 2015.

5-52
5.3.5 Effect of Nonresponse on Characteristics from the Base Year
In this section, the effect of nonresponse is explored by comparing estimates of selected base-year characteristics between kindergarten respondents and fourth-grade respondents.3 The estimates are unadjusted estimates (i.e., they are weighted by the base weights). Base-year characteristics of the kindergarten respondents are weighted by the base-year base weight that takes into account only the selection probabilities of the sampling units. Base-year characteristics of the fourth-grade respondents are weighted by the fourth-grade base weight that takes into account the selection probabilities and the subsampling of movers to be followed.
Table 5-26 shows the differences in the unadjusted base-year estimates between the kindergarten respondents and the fourth-grade respondents. As noted above, the characteristics presented in this table are from the base year, since the purpose of this analysis is to detect large changes in the same estimates due to sample attrition between the two data collections. Because of missing values, the kindergarten sample size is smaller than 18,174, the number of base-year respondents. Similarly, the fourth-grade sample size is smaller than 12,915, the number of fourth-grade respondents. Each difference is shown as an absolute value and as a relative difference (i.e., the difference divided by the kindergarten estimate). The relative differences range from 0.08 percent to 13.55 percent, for an average of 3.38 percent. The largest relative difference is for the percentage of Black students. As in previous years, response rates for Black students are the lowest among the different race/ethnicity groups (not counting the Hawaiian Native/Pacific Islander and the American Indian/Alaska Native groups with very small sample sizes). The other relative differences that are larger than 5 percent are for students in towns (5.27 percent), students of two or more races (5.61 percent), students in the American Indian/Alaska Native group (5.71 percent), and students in households with income below the poverty threshold (7.55). Since locale and race/ethnicity are characteristics used to construct nonresponse cells for nonresponse adjustments, any potential bias would be reduced in estimates produced using weights adjusted for nonresponse.
3 A base-year respondent has child data (scoreable assessment data or height or weight measurements or was excluded from assessment due to lack of accommodation for a disability) or parent interview data from at least one round of data collection in the base year. A fourth-grade respondent has child data (scoreable assessment data, or executive function data, or child questionnaire data, or height or weight measurements or was excluded from assessment due to lack of accommodation for a disability) or parent interview data from the fourth-grade round of data collection.

5-53
Table 5-26. Differences between unadjusted base-year estimates from kindergarten respondents and unadjusted base-year estimates from fourth-grade respondents: Spring 2011 and spring 2015
Sample size Unadjusted estimates and difference between
kindergarten and fourth grade1
Survey item from the base year Kindergarten Fourth grade Kindergarten
Fourth grade
Absolute difference
Relative difference
Proportion of students by school type Public 17,791 12,819 89.07 89.24 0.17 0.19 Private 17,791 12,819 10.93 10.76 0.17 1.56
Proportion of students by census region2,3 Northeast 17,790 12,819 15.74 15.81 0.07 0.44 Midwest 17,790 12,819 21.98 22.13 0.15 0.68 South 17,790 12,819 38.23 37.55 0.68 1.78 West 17,790 12,819 24.04 24.50 0.46 1.91
Proportion of students by locale City 17,525 12,647 32.79 31.64 1.15 3.51 Suburb 17,525 12,647 33.35 34.81 1.46 4.38 Town 17,525 12,647 11.20 10.61 0.59 5.27 Rural 17,525 12,647 22.65 22.94 0.29 1.28
Proportion of students by race/ethnicity White, non-Hispanic 18,129 12,903 50.67 52.56 1.89 3.73 Black, non-Hispanic 18,129 12,903 13.73 11.87 1.86 13.55 Hispanic 18,129 12,903 25.64 25.66 0.02 0.08 Asian, non-Hispanic 18,129 12,903 4.43 4.55 0.12 2.71 Native Hawaiian/Pacific Islander, non-
Hispanic 18,129 12,903 0.37 0.38 0.01 2.70 American Indian/Alaska Native, non-
Hispanic 18,129 12,903 1.05 1.11 0.06 5.71 Two or more races 18,129 12,903 4.10 3.87 0.23 5.61
See notes at end of table.

5-54
Table 5-26. Differences between unadjusted base-year estimates from kindergarten respondents and unadjusted base-year estimates from fourth-grade respondents: Spring 2011 and spring 2015—Continued
Sample size Unadjusted estimates and difference between
kindergarten and fourth grade1
Survey item from the base year Kindergarten Fourth grade Kindergarten
Fourth grade
Absolute difference
Relative difference
Proportion of students with the following characteristics from the spring kindergarten parent interview
Parent is currently married, in civil union, or domestic partnership 13,481 10,241 72.89 75.03 2.14 2.94
Non-English language used at home 13,611 10,319 7.90 7.50 0.40 5.06 At least one parent has a high school
diploma or equivalent 16,005 11,713 90.56 91.19 0.63 0.70Household poverty index
Below poverty threshold 13,527 10,270 25.96 24.00 1.96 7.55 At or above poverty threshold but below 200 percent poverty threshold 13,527 10,270 22.41 21.99 0.42 1.87 At or above 200 percent poverty
threshold 13,481 10,241 72.89 75.03 2.14 2.94 1 Unadjusted estimates are produced using the kindergarten base weight for kindergarten and the fourth-grade base weight for fourth grade. 2 States in each region: Northeast: Connecticut, Maine, Massachusetts, New Hampshire, New Jersey, New York, Pennsylvania, Rhode Island, and Vermont. Midwest: Illinois, Indiana, Iowa, Kansas, Michigan, Minnesota, Missouri, Nebraska, North Dakota, Ohio, South Dakota, and Wisconsin. South: Alabama, Arkansas, Delaware, Florida, Georgia, Kentucky, Louisiana, Maryland, Mississippi, North Carolina, Oklahoma, South Carolina, Tennessee, Texas, Virginia, West Virginia, and the District of Columbia. West: Alaska, Arizona, California, Colorado, Hawaii, Idaho, Montana, Nevada, New Mexico, Oregon, Utah, Washington, and Wyoming. 3 Sample sizes rounded to the nearest 10 and, therefore, may not sum to total. NOTE: The sample sizes for kindergarten are the number of base-year respondents with a nonmissing value for the kindergarten characteristic or group of characteristics. The sample sizes for fourth grade are the number of fourth-grade respondents with a nonmissing value for the kindergarten characteristic or group of characteristics. SOURCE: U.S. Department of Education, National Center for Education Statistics, Early Childhood Longitudinal Study, Kindergarten Class of 2010–11 (ECLS-K:2011), spring 2011 and spring 2015.
For each group in table 5-27, the sample size is the number of records with nonzero final weights. Generally, a relative difference of more than 5 percent indicates that there may be potential bias in the fourth-grade adjusted estimate. Relative differences between the adjusted estimates for kindergarten and fourth grade range from 0.06 to 16.67, with an average of 3.33 percent. Relative differences larger than 5 percent are seen for children who are Native Hawaiian/Pacific Islander (16.67 percent), students who regularly spoke a non-English language at home during kindergarten (10.44 percent), and students in households with income below 200 percent of the poverty threshold (6.68 percent) during kindergarten. That is, even after adjusting estimates, there are proportionately more children in the fourth-grade round than in the kindergarten round who are Native Hawaiian/Pacific Islander, proportionately fewer children in the fourth-grade round than in the kindergarten round who regularly spoke a non-English language at home during kindergarten, proportionately fewer children in the fourth-grade round than in the kindergarten round in households below the poverty threshold during kindergarten, and proportionately more children in the fourth-grade round than in the kindergarten round in households at or above the poverty threshold but below 200 percent poverty during kindergarten. However, as mentioned before, the relative difference is a function

5-55
not only of the sample size but also of the prevalence of a particular characteristic. For example, only 0.42 percent of kindergartners and 0.49 percent of students in fourth grade are Native Hawaiian/Pacific Islander, only 8.24 percent of kindergartners and 7.38 percent of students in fourth grade regularly used a non-English language at home in kindergarten (representing a high relative difference), compared with 90.37 percent of kindergartners and 91.71 percent of students in fourth grade with at least one parent who had a high school degree or higher when the student was in kindergarten (representing a low relative difference).
Table 5-27. Differences between adjusted base-year estimates from kindergarten respondents and adjusted base-year estimates from fourth-grade respondents: Spring 2011 and spring 2015
Sample size Adjusted estimates and difference between
kindergarten and fourth grade1
Survey item from the base year Kindergarten Fourth grade Kindergarten
Fourth grade
Absolute difference
Relative difference
Proportion of students by school type, kindergarten year
Public 15,798 9,077 89.00 89.19 0.19 0.21 Private 15,798 9,077 11.00 10.81 0.19 1.73
Proportion of students by census region, kindergarten year2,3
Northeast 15,800 9,077 16.24 15.92 0.32 1.97 Midwest 15,800 9,077 21.77 22.08 0.31 1.42 South 15,800 9,077 37.47 37.89 0.42 1.12 West 15,800 9,077 24.52 24.11 0.41 1.67
Proportion of students by locale, kindergarten year
City 15,559 8,952 32.82 32.04 0.78 2.38 Suburb 15,559 8,952 33.81 33.79 0.02 0.06 Town 15,559 8,952 10.85 11.16 0.31 2.86 Rural 15,559 8,952 22.52 23.01 0.49 2.18
Proportion of students by race/ethnicity, kindergarten year
White, non-Hispanic 16,083 9,081 51.34 51.77 0.43 0.84 Black, non-Hispanic 16,083 9,081 13.50 13.31 0.19 1.41 Hispanic 16,083 9,081 24.75 24.77 0.02 0.08 Asian, non-Hispanic 16,083 9,081 4.60 4.45 0.15 3.26 Native Hawaiian/Pacific Islander, non-
Hispanic 16,083 9,081 0.42 0.49 0.07 16.67 American Indian/Alaska Native, non-
Hispanic 16,083 9,081 1.21 1.10 0.11 9.09 Two or more races 16,083 9,081 4.18 4.11 0.07 1.67
See notes at end of table.

5-56
Table 5-27. Differences between adjusted estimates from kindergarten and adjusted estimates from spring fourth grade: Spring 2011 and spring 2015—Continued
Sample size Adjusted estimates and difference between
kindergarten and fourth grade1
Survey item Kindergarten Fourth grade Kindergarten
Fourth grade
Absolute difference
Relative difference
Proportion of students with the following characteristics from the spring kindergarten parent interview
Parent is currently married, in civil union, or domestic partnership 13,481 8,179 72.65 74.28 1.63 2.24
Non-English language used at home 13,611 8,223 8.24 7.38 0.86 10.44 At least one parent has a high school
diploma or equivalent 16,005 9,053 90.37 91.71 1.34 1.48 Household poverty index
Below poverty threshold 13,527 8,194 26.33 24.57 1.76 6.68 At or above poverty threshold but
below 200 percent poverty threshold 13,527 8,194 22.47 23.97 1.50 6.68 At or above 200 percent poverty
threshold 13,527 8,194 51.20 51.47 0.27 0.53 1 Adjusted estimates are produced using weight W1_2P0 for kindergarten and weight W8C28P_8A0 for fourth grade. 2 States in each region: Northeast: Connecticut, Maine, Massachusetts, New Hampshire, New Jersey, New York, Pennsylvania, Rhode Island, and Vermont. Midwest: Illinois, Indiana, Iowa, Kansas, Michigan, Minnesota, Missouri, Nebraska, North Dakota, Ohio, South Dakota, and Wisconsin. South: Alabama, Arkansas, Delaware, Florida, Georgia, Kentucky, Louisiana, Maryland, Mississippi, North Carolina, Oklahoma, South Carolina, Tennessee, Texas, Virginia, West Virginia, and the District of Columbia. West: Alaska, Arizona, California, Colorado, Hawaii, Idaho, Montana, Nevada, New Mexico, Oregon, Utah, Washington, and Wyoming. 3 Sample sizes rounded to the nearest 10 and, therefore, may not sum to total. NOTE: The sample sizes for kindergarten are the number of cases with a nonzero kindergarten final weight (weight W1_2P0) and a nonmissing value for the kindergarten characteristic or group of characteristics. The sample sizes for fourth grade are the number of cases with a nonzero fourth-grade final weight (weight W8C28P_8A0) and a nonmissing value for the kindergarten characteristic or group of characteristics. SOURCE: U.S. Department of Education, National Center for Education Statistics, Early Childhood Longitudinal Study, Kindergarten Class of 2010–11 (ECLS-K:2011), spring 2011 and spring 2015.
6-1
6. DATA PREPARATION
In the fourth-grade round (spring 2015), two types of data collection instruments were again used for the Early Childhood Longitudinal Study, Kindergarten Class of 2010–11 (ECLS-K:2011): computer-assisted interviews and assessments (CAI) and self-administered paper forms (hard-copy questionnaires). As in kindergarten (i.e., the base year), first grade, second grade, and third grade, once data were collected, they were reviewed and prepared for release to analysts. The approaches used to prepare the data differed with the mode of data collection. The direct child assessments and parent interviews were conducted using CAI. Editing specifications were built into the CAI programs used by assessors or interviewers collecting these data. The teacher and school administrator hard-copy questionnaires were self-administered. When these hard-copy questionnaires were returned to the data collector’s home office, staff recorded the receipt of these forms into a project-specific forms tracking system. Data from the hard-copy questionnaires were then captured by scanning the completed forms. Before scanning, coders reviewed the questionnaires to ensure that responses were legible and had been written in appropriate response fields for transfer into an electronic format. After the data were scanned and reviewed for range and logical consistency, coding of open-ended1 “other, specify” text responses into existing or new categories was implemented.
The following sections briefly describe the data preparation activities for both modes of data
collection, focusing on the fourth-grade activities. More detailed information on these data preparation activities can be found in user’s manuals from earlier rounds, in particular the User’s Manual for the base-year.2
1 Open-ended items are those that do not provide a predetermined set of response options from which to choose. Closed-ended items are those with predetermined response categories. 2 Users should refer to the Early Childhood Longitudinal Study, Kindergarten Class of 2010–11 (ECLS-K:2011), User’s Manual for the ECLS-K:2011 Kindergarten Data File and Electronic Codebook, Public Version (NCES 2015-074) (Tourangeau et al. 2015), hereinafter referred to as the base-year User’s Manual, for information about the general study methodology and the kindergarten rounds of data collection, to the Early Childhood Longitudinal Study, Kindergarten Class of 2010–11 (ECLS-K:2011),User’s Manual for the ECLS-K:2011 Kindergarten–First Grade Data File and Electronic Codebook, Public Version (NCES 2015-078) (Tourangeau et al. 2015) for information about the first-grade rounds of data collection, to the Early Childhood Longitudinal Study, Kindergarten Class of 2010–11 (ECLS-K:2011),User’s Manual for the ECLS-K:2011 Kindergarten–Second Grade Data File and Electronic Codebook, Public Version (NCES 2017-285) (Tourangeau et al. 2017) for information about the second-grade rounds of data collection , and to the User’s Manual for the ECLS K:2011 Kindergarten–Third Grade Data File and Electronic Codebook, Public Version (NCES 2018-034) (Tourangeau et al. 2018) for information about the third-grade round of data collection.

6-2
6.1 Coding Text Responses
Additional coding was required for some of the items asked in the CAI parent interview once the data had been collected. These items included “other, specify” text responses and responses to questions asking about parent or guardian occupation, which interviewers had entered into the CAI system verbatim.
Review of “other, specify” items. As in previous rounds, for fourth grade, trained data
preparation staff reviewed respondents’ verbatim “other, specify” text responses and coded responses into existing response categories as appropriate. These staff also reviewed the “other, specify” text to identify any responses that occurred with sufficient frequency to warrant the addition of a new response category. For the fourth-grade round, no text responses required an additional category. Text responses that did not fit into any preexisting category and were not common enough to be coded into a new category were left coded as “other” in the data. There were no “other, specify” items in the child assessments.
Parent occupation coding. In the fourth-grade data collection round, specifics related to a
parent’s occupation such as job title and employer were not asked in the parent interview. Details about parent occupation coding in earlier rounds can be found in the respective User’s Manual for the round.
6.1.1 Household Roster Review
The fourth-grade parent interview included a household roster in which information on household composition was collected. Following protocols established during the previous rounds, three general types of checks were run on the household roster information to identify missing or inaccurate information that would require editing.
First, the relationship of an individual living in the household to the study child was
compared to the individual’s listed age and sex. Inconsistencies, such as a male mother, and unusual combinations of characteristics, such as a biological mother over age 65, were examined further. Information was corrected when the interview contained sufficient information to support a change.
Second, while it is possible to have more than one mother or more than one father in a household, households with more than one mother or more than one father were reviewed to ensure they were not cases of data entry error. Corrections were made whenever clear errors were identified and a clear resolution existed.
Third, the relationships of an individual in the household to both the study child and the respondent were examined, as there were cases in which the relationship of an individual to the study child conflicted with his or her status as the spouse/partner of

6-3
the respondent. For example, in a household containing a child’s grandparents but not the child’s parents, the grandmother might be designated the “mother” figure, and the grandfather thus became the “father” figure for the purposes of some questions in the interview by virtue of his marriage to the grandmother. In this example, these cases would have been examined but left unchanged. Both the original—and correct (grandfather)—relationship data and the new “parent-figure” designation (father) that had been constructed were retained. In other situations, discrepancies in the reported relationships indicated an error, and the data were edited. For example, in a household containing two mothers, if a review of the audio recording from the interview indicated the relationship of the second mother was documented incorrectly by the interviewer—that the second female identified as a mother was not actually a mother to the focal child—the relationship of the second female would have been edited (corrected) to something other than mother.
A flag on the data file (X8EDIT) identifies cases that were reviewed or edited for any of the reasons described above; the flag was set to 1 if the case was identified for review for any of these household roster checks. Note that a code of 1 does not necessarily indicate that the data were changed; if the data were reviewed and found to be as reported by the respondent or there was no clear error to be fixed, the reviewed data were left as is. There were 486 cases (4.6 percent) identified for review of the household roster from the spring of fourth grade.
6.1.2 Partially Complete Parent Interviews
Parents did not have to complete an entire interview for the data collected from them to be included in the data file. However, parent interviews did have to be completed through a specified section of the interview for those data to be included. For the fourth-grade round, the respondent had to answer all applicable questions through the majority of the section on family structure (FSQ). There were 620 partially completed spring parent interviews for which the respondent answered applicable questions in the FSQ section but did not complete the entire interview.3 All data derived from questions asked after the interview termination point for these partially completed interviews are set to -9 for “not ascertained.”
3 Note that due to skip patterns applicable to individual cases, parents did not have to answer every question up to the end of the specified section for the parent interview data to be included in the file. The last question in the FSQ section that applied to all cases was FSQ200 (marital status).

6-4
6.2 Receipt, Coding, and Editing of Hard-Copy Questionnaires
6.2.1 Receipt Control
Receipt control was managed in the same manner for fourth grade as it had been in the earlier rounds of the ECLS-K:2011. Please refer to the base-year User’s Manual for details.
6.2.2 Scanning of Hard-Copy Questionnaires
Scanning of hard-copy questionnaires was managed in the same manner for fourth grade as it had been in the earlier rounds of the ECLS-K:2011. Please refer to the base-year User’s Manual for details.
6.2.3 Coding for Hard-Copy Questionnaires
Similar to the process described for the parent interview and identical to procedures used in earlier rounds, “other, specify” text responses at the instrument level were reviewed by the data preparation staff and coded into existing response categories as appropriate. No “other, specify” text responses collected in the fourth-grade hard-copy questionnaires occurred with sufficient frequency to warrant the addition of a new response category. Text responses that did not fit into any preexisting category and were not common enough to be coded into new categories were left coded as “other” in the data.
6.2.4 Data Editing
The data editing process for hard-copy questionnaires was managed in the same manner for fourth grade as it had been in the earlier rounds of the ECLS-K:2011. The base-year User’s Manual has more detail related to editing.
As part of the editing process in fourth grade as well as in earlier rounds of the ECLS-K:2011,
skip patterns were enforced. In cases in which respondents did not follow the skip instructions and proceeded to answer the questions that were supposed to be skipped, responses for the inapplicable dependent questions generally were deleted and the data were set to -1, the inapplicable code. There was one check box on the school administrator questionnaire given to administrators in schools that were new

6-5
to the study or for which a completed school administrator questionnaire was not received in a prior data collection (i.e., SAQ-A) that was part of a skip pattern that, in certain circumstances, was not enforced:
School administrator questionnaire (SAQ-A): S*SCHPMC
If your school is a private, magnet, or charter school, please check here and SKIP TO Q A11.
When respondents marked this check box, they were directed to skip ahead in the questionnaire because a subset of subsequent, dependent questions were not applicable to them. In some cases, it was clear to the data editors that the check box was marked in error by the respondent and the responses to the dependent questions were valid, usable data. In such cases, the check box was edited (corrected) in order to retain responses to dependent questions in the data. Consequently, data for this check box may not reflect the actual responses provided by the person completing the questionnaire.

This page intentionally left blank.

7-1
7. DATA FILE CONTENT AND COMPOSITE VARIABLES
This chapter describes the contents of the Early Childhood Longitudinal Study, Kindergarten Class of 2010–11 (ECLS-K:2011) kindergarten through fourth-grade (K-4) restricted-use data file. The data are accessible through software called the Electronic Codebook (ECB). The ECB allows data users to view variable frequencies, tag variables for extraction, and create the SAS, SPSS for Windows, or Stata code needed to create an extract file for analysis. The child data file on the ECB is referred to as a “child catalog.” Instructions for installing the ECB are provided in chapter 8.
The K-4 file provides data at the child level and contains one record for each of the 18,174 children who participated, or whose parent participated, in at least one of the two kindergarten data collections. References to “parents” in this chapter include both parents and guardians. Each child record contains data from the various respondents associated with the child (i.e., the child herself or himself, a parent, one or more teachers, a school administrator, and, if applicable, a nonparental care provider); weights and imputation flags; and administrative variables from the Field Management System (FMS),1 for example, “F8SCHZIP” for the zip code of the school the child attended in the spring of 2015 (round 8). The file includes cases with either child assessment data or parent interview data from at least one round of kindergarten data collection (fall 2010 or spring 2011). Among the 18,174 participants from kindergarten, the file includes fall 2011 data for those with a child assessment or parent interview in fall 2011, spring 2012 data for those with a child assessment or parent interview in spring 2012, fall 2012 data for those with a child assessment or parent interview in fall 2012, spring 2013 data for those with a child assessment or parent interview in spring 2013, spring 2014 data for those with a child assessment or parent interview in spring 2014, and spring 2015 data for those with a child assessment or parent interview in spring 2015.
The raw data are provided in an ASCII data file named childK4.dat. To develop data files for statistical analyses, analysts should use the ECB software or the file record layout located in appendix B of the DVD. The ECB writes syntax files that must be run within a statistical software package to generate customized data files. Users should not access the ASCII data file directly, as any changes made to that file will alter the raw data obtained during data collection.
1 The Field Management System (FMS) includes information collected about the study schools, school staff, and children from available administrative records or existing data sources (such as the Common Core of Data) or from conversations between data collection staff and school staff.

7-2
This chapter focuses primarily on the composite variables that were created from information obtained during the fourth-grade data collections. Most of the variables have been computed in the same way as those that were created using information collected in the base year (i.e., kindergarten), first grade, second grade, and third grade. However, a small number of the variables differs slightly either because the same exact information available in the earlier years of the study was not available in fourth grade or because it was determined there was a better way to compute the composite after release of a previous data file. These differences are noted in the descriptions of the variables. To the extent feasible, the composite variables have also been computed in the same way as those created for the Early Childhood Longitudinal Study, Kindergarten Class of 1998-99 (ECLS-K). This results in consistency between the two studies and facilitates comparisons between the two cohorts. However, some composites were created differently in the ECLS-K:2011 than in the ECLS-K. Documentation for both studies should be consulted before conducting cross-cohort analyses using composites. The user’s manuals for kindergarten, first grade, second grade, and third grade should be consulted for detailed descriptions of the composite variables computed for rounds 1 through 7. For information on the ECLS-K, the Combined User’s Manual for the ECLS-K Eighth-Grade and K-8 Full Sample Data Files and Electronic Codebooks (NCES 2009-004) is available on the National Center for Education Statistics (NCES) website (https://nces.ed.gov/pubsearch/pubsinfo.asp?pubid=2009004), as are the round-specific manuals for each round of ECLS-K data collection (https://nces.ed.gov/pubsearch/getpubcats.asp?sid=024).
As discussed in Appendix B, the public-use file is derived from the restricted-use file and is identical in format. However, masking techniques such as re-categorization and top- and bottom-coding have been applied to some data to make them suitable for public release. As a result of masking, some variables in the public-use file may not contain the exact same categories and values described in this chapter. Please see Appendix B for information on which variables are modified in the public-use file and see the public-use codebook for the exact categories and values provided in the public data.
This chapter is divided into several sections. Sections 7.1 through 7.4 describe variable naming conventions, identification variables, missing values, and data flags. Section 7.5 provides details about the creation of composite variables, and section 7.6 focuses on the methodological variables.
7.1 Variable Naming Conventions
Variables are named according to the data source (e.g., parent interview, teacher questionnaires about the teacher and child) and the data collection round to which they pertain. With the exception of the identification variables described in section 7.2, the first two or three characters of each

7-3
variable (referred to as the variable prefix) include (1) a letter designating the source and (2) a number indicating the data collection round. For example, the number 8 is used for the data collection that took place in the spring of 2015. For the spring 2015 teacher child-level questionnaires, there are prefixes new to this round for reading (G8), mathematics (M8), and science (N8). These variable naming conventions are used consistently in the data file. The prefixes used for fourth-grade variables in the kindergarten–fourth grade data file are listed in exhibit 7-1.
Exhibit 7-1. Prefixes for fourth-grade variables
Variable prefix Source of data A8 A8…Z1
Data collected from the spring 2015 teacher-level reading questionnaire Data collected from the spring 2015 teacher-level mathematics or science questionnaire
C8 Data/scores from the spring 2015 direct child assessment D8 Data collected from the spring 2015 special education teacher-level questionnaire E8 Data collected from the spring 2015 special education child-level questionnaire F8 Data from the spring 2015 Field Management System (FMS) IF Imputation flags G8 Data collected from the spring 2015 reading teacher child-level questionnaire M8 Data collected from the spring 2015 mathematics teacher child-level questionnaire N8 Data collected from the spring 2015 science teacher child-level questionnaire P8 Data collected from the spring 2015 parent interview S8 Data collected from the spring 2015 school administrator questionnaire X_ Composite/derived variables not specific to a particular round X8 Spring 2015 composite/derived variables W Analytic weights and stratum/cluster identifiers
1 The variable names for teacher-level data from the child’s mathematics or science teacher will be the same as the variable names for teacher-level data from the child’s reading teacher, but will have the letter Z at the end of the variable name. SOURCE: U.S. Department of Education, National Center for Education Statistics, Early Childhood Longitudinal Study, Kindergarten Class of 2010–11 (ECLS-K:2011), kindergarten-fourth grade (K-4) restricted-use data file.
Some variable names end with a suffix denoting a particular feature of the variable of which users should be aware. The suffix “_R” indicates that the variable has been updated or revised since its release in a prior data file. The suffix “2” is used for composites that are based on data from different items or have new categories added relative to a prior round. The suffix “_I” indicates that missing data for the variable have been imputed or, in the case of a composite variable, that it is computed from imputed source variables. Imputation is discussed in sections 7.5.2.5 and 7.5.4.6.
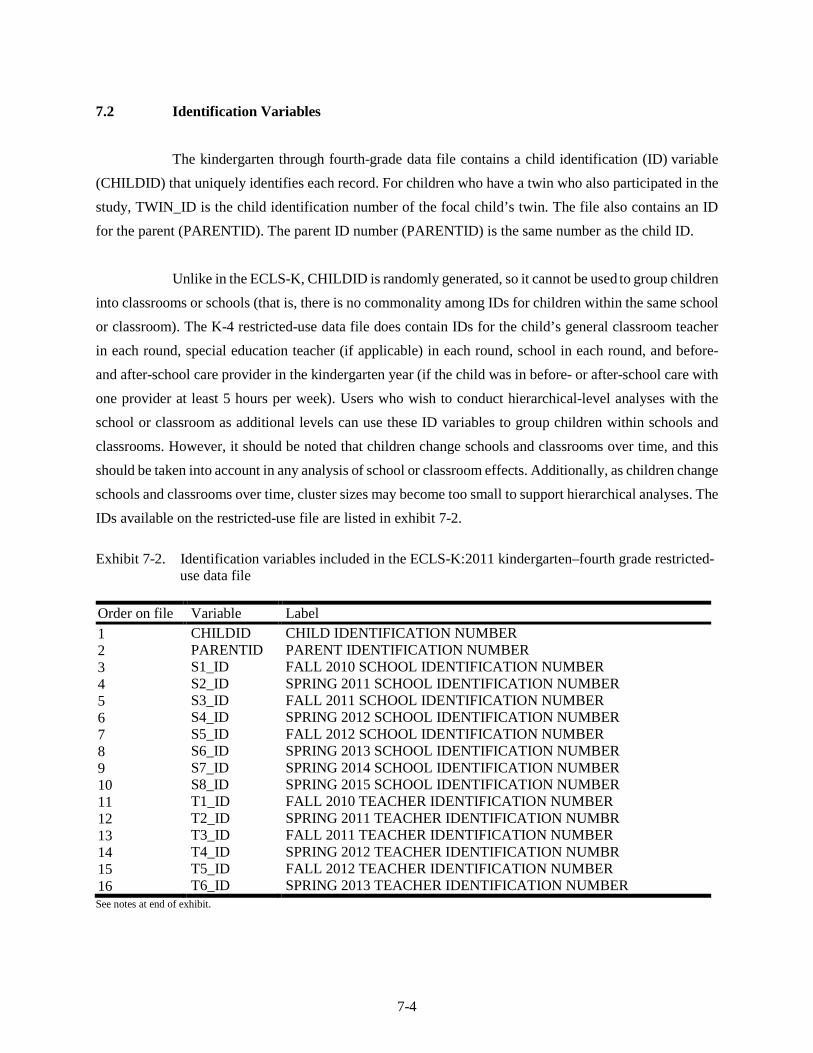
7-4
7.2 Identification Variables
The kindergarten through fourth-grade data file contains a child identification (ID) variable (CHILDID) that uniquely identifies each record. For children who have a twin who also participated in the study, TWIN_ID is the child identification number of the focal child’s twin. The file also contains an ID for the parent (PARENTID). The parent ID number (PARENTID) is the same number as the child ID.
Unlike in the ECLS-K, CHILDID is randomly generated, so it cannot be used to group children into classrooms or schools (that is, there is no commonality among IDs for children within the same school or classroom). The K-4 restricted-use data file does contain IDs for the child’s general classroom teacher in each round, special education teacher (if applicable) in each round, school in each round, and before- and after-school care provider in the kindergarten year (if the child was in before- or after-school care with one provider at least 5 hours per week). Users who wish to conduct hierarchical-level analyses with the school or classroom as additional levels can use these ID variables to group children within schools and classrooms. However, it should be noted that children change schools and classrooms over time, and this should be taken into account in any analysis of school or classroom effects. Additionally, as children change schools and classrooms over time, cluster sizes may become too small to support hierarchical analyses. The IDs available on the restricted-use file are listed in exhibit 7-2.
Exhibit 7-2. Identification variables included in the ECLS-K:2011 kindergarten–fourth grade restricted-use data file
Order on file Variable Label 1 CHILDID CHILD IDENTIFICATION NUMBER 2 PARENTID PARENT IDENTIFICATION NUMBER 3 S1_ID FALL 2010 SCHOOL IDENTIFICATION NUMBER 4 S2_ID SPRING 2011 SCHOOL IDENTIFICATION NUMBER 5 S3_ID FALL 2011 SCHOOL IDENTIFICATION NUMBER 6 S4_ID SPRING 2012 SCHOOL IDENTIFICATION NUMBER 7 S5_ID FALL 2012 SCHOOL IDENTIFICATION NUMBER 8 S6_ID SPRING 2013 SCHOOL IDENTIFICATION NUMBER 9 S7_ID SPRING 2014 SCHOOL IDENTIFICATION NUMBER 10 S8_ID SPRING 2015 SCHOOL IDENTIFICATION NUMBER 11 T1_ID FALL 2010 TEACHER IDENTIFICATION NUMBER 12 T2_ID SPRING 2011 TEACHER IDENTIFICATION NUMBR 13 T3_ID FALL 2011 TEACHER IDENTIFICATION NUMBER 14 T4_ID SPRING 2012 TEACHER IDENTIFICATION NUMBR 15 T5_ID FALL 2012 TEACHER IDENTIFICATION NUMBER 16 T6_ID SPRING 2013 TEACHER IDENTIFICATION NUMBER See notes at end of exhibit.

7-5
Exhibit 7-2. Identification variables included in the ECLS-K:2011 kindergarten–fourth grade restricted-use data file—Continued
Order on file Variable Label 17 T7_ID SPRING 2014 TEACHER IDENTIFICATION NUMBER 18 T8R_ID SPRING 2015 READING TEACHER IDENTIFICATION NUMBER 19 T8M_ID SPRING 2015 MATH TEACHER IDENTIFICATION NUMBER 20 T8S_ID SPRING 2015 SCIENCE TEACHER IDENTIFICATION NUMBER 21 D2T_ID SPRING 2011 SPECIAL ED TEACHER ID NUMBER 22 D4T_ID SPRING 2012 SPECIAL ED TEACHER ID NUMBER 23 D6T_ID SPRING 2013 SPECIAL ED TEACHER ID NUMBER 24 D7T_ID SPRING 2014 SPECIAL ED TEACHER ID NUMBER 25 D8T_ID SPRING 2015 SPECIAL ED TEACHER ID NUMBER 26 CC_ID1 CHILD CARE PROVIDER IDENTIFICATION NUM 27 TWIN_ID CHILDID FOR FOCAL CHILD’S TWIN
1 Kindergarten only. SOURCE: U.S. Department of Education, National Center for Education Statistics, Early Childhood Longitudinal Study, Kindergarten Class of 2010-11 (ECLS-K:2011), kindergarten-fourth grade (K-4) restricted-use data file.
For each study child in the spring 2015 data collection, teacher- and child-level questionnaires were given to the child’s reading teacher and either his or her mathematics or science teacher. The variable X8MSFLAG indicates whether the child was sampled for the mathematics or science domain. Children’s classroom teachers in spring 2015 are identified in the restricted-use file with the ID variables T8R_ID for reading teachers, T8M_ID for mathematics teachers, and T8S_ID for science teachers.
There are also class link variables (T8RCLASS for reading, T8MCLASS for math, and T8SCLASS for science) to identify for which class(es) a teacher answered questions. These class link variables indicate subject and time of day information for a specific class taught by a teacher. They have a three-character code that begins with a letter followed by a two digit number (e.g., R01). The letter indicates the subject taught: R for reading, M for math, S for science, and P for special education. To identify which teacher completed information for which class for a specific study child, researchers need to consider both the teacher ID variable(s) and the class ID variable(s). The teacher ID will be the same for children taught by the same teacher. However, one teacher could teach multiple classes of the same subject. The information in the class link variables distinguishes which class the child was in for children taught by the same teacher. For example, if T8_RID is the same across child-level cases, T8RCLASS could equal R01 for one child, R02 for another child, and even R03 for another child. The T8RCLASS variable indicates that these three children are in three different classes with the same teacher. Children who have the same value for a teacher ID in one of the subjects (e.g., the same value for the reading teacher ID, T8R_ID) and the same class link ID for that subject (e.g., R01 for reading) were in the same class.

7-6
A single teacher may also have taught two subjects, such as reading and math. If this is the case, for example, then T8R_ID would equal T8M_ID. Similar to when a teacher teaches multiple classes in the same subject, to identify which teacher completed information for which class for a specific study child, researchers need to consider both the teacher ID variable(s) and the class ID variable(s).
For children who had an Individualized Education Program (IEP) on record with the school that was identified as part of the process for determining accommodations for the child assessment, D8T_ID provides the identification number for their special education teacher or related service provider. For some students, a general classroom teacher was also the student’s special education teacher. However, D8T_ID does not match T8R_ID, T8M_ID, or T8S_ID for these students. The ID variable S8_ID indicates the school the child attended at the time of the spring 2015 data collection.
Each child has a school identification number for the two kindergarten data collections, the spring first-grade data collection, the spring second-grade data collection, the spring third-grade data collection, and the spring fourth-grade data collection. Children selected for the fall subsamples also have school identification numbers for the fall 2011 and fall 2012 data collections. Not all identification numbers represent specific schools. Instead, certain identification numbers have been designated to identify children who were homeschoolers (9100), moved to a nonsampled county (9997), were unlocatable (9995), moved outside the United States (9993), were movers who were not subsampled to be followed into their new schools (9998), were deceased (9994), or whose parents asked for them to be removed from the study (9999).
If a child did not have an IEP on record with the school that was identified as part of the process for determining accommodations for the child assessment, there is no special education teacher or related services provider associated with that child, and D8T_ID is missing. The D8T_ID would also be missing if the school records indicated that a child had an Individualized Family Service Plan (IFSP) when he or she was younger, but did not have an IEP at the time of data collection. If a child had an IEP identified as part of the process for determining accommodations for the child assessment and, therefore, a special education teacher associated with him or her, there is an ID provided in D8T_ID whether or not the special education teacher responded to the spring 2015 special education teacher questionnaires.
For reading, mathematics or science and special education teachers, there could be missing data for the child’s teacher-level or child-level questionnaire even though there is an assigned teacher ID (for example, if the reading, math, science, or special education teacher replied to only one of the two teacher questionnaires (i.e., child-level or teacher-level), or did not fully complete the questionnaires an ID would be present, but there would be missing data). It is left to users to determine how they would like to

7-7
set “not applicable” versus “not ascertained” codes when data for T8R_ID, T8M_ID, T8S_ID, or D8T_ID are missing. Note that if a teacher did not complete a teacher-level questionnaire, completed a child-level questionnaire for one child, and did not complete another child-level questionnaire for a different child to whom the teacher was also linked, both children would have the same teacher identification number (e.g., T8R_ID, T8M_ID, T8S_ID, for the reading, math, or science teacher, respectively, or D8T_ID for the special education teacher), but only the child for whom the teacher completed the child-level questionnaire would have data for those variables. It should also be noted that as either a mathematics questionnaire or science questionnaire, but not both, was fielded for each study child, the teacher ID will be missing for each child for the subject that was not selected for a questionnaire. For example, a study child for whom a mathematics questionnaire was fielded and not a science questionnaire will have system missing for T8S_ID and T8SCLASS.
7.3 Missing Values
Variables on the ECLS-K:2011 data file use a standard scheme for identifying missing data. Missing value codes are used to indicate item nonresponse (when a question is not answered within an otherwise completed interview or questionnaire), legitimate skips (when a question was not asked or skipped because it did not pertain to the respondent), and unit nonresponse (when a respondent did not complete any portion of an interview or questionnaire) (see exhibit 7-3).
Exhibit 7-3. Missing value codes used in the ECLS-K:2011 data file
Value Description -1 Not applicable, including legitimate skips -2 Data suppressed (public-use data file only) -4 Data suppressed due to administration error -5 Item not asked in School Administrator Questionnaire form B -7 Refused (a type of item nonresponse) -8 Don’t know (a type of item nonresponse) -9 Not ascertained (a type of item nonresponse) (blank) System missing (unit nonresponse)
SOURCE: U.S. Department of Education, National Center for Education Statistics, Early Childhood Longitudinal Study, Kindergarten Class of 2010–11 (ECLS-K: 2011), kindergarten–fourth grade (K-4) restricted-use data file.
The -1 (not applicable) code is used to indicate that a respondent did not answer a question due to skip instructions within the instrument. In the parent interview, “not applicable” is coded for questions that were not asked of the respondent because a previous answer made the question inapplicable to the particular respondent. For example, a question about a child’s sibling’s age was not asked when the
7-8
respondent has indicated that the study child has no siblings. For the teacher and school administrator self-administered instruments, “not applicable” is coded for questions that the respondent left blank because the written directions instructed him or her to skip the question due to a certain response on a previous question that made the question inapplicable to the particular respondent. One example of the use of “not applicable” is found in the spring 2015 school administrator questionnaire version A (SAQ-A) question E2. Question E1 asks whether the school received Title I funds for this school year. If the answer to question E1 is “yes,” the respondent is directed to continue to question E2 asking if the school was operating a Title I targeted assistance or schoolwide program. If the answer to question E1 is “no,” the respondent is supposed to skip to question E3, and question E2 would be coded as -1 (not applicable). If questions E1, E2, and E3 are left blank by the respondent, and the respondent did not indicate that it is a private school (S8PRVSCH 0), data for these questions are coded -9 (not ascertained), meaning the questions should have been answered but were not. If the respondent indicated that the school is private (S8PRVSCH = 1) and questions E1, E2, and E3 are left blank, data for these questions are coded -1 (not applicable) because they were supposed to be left blank given the school’s designation as private.
There are some exceptions to the standard use of -1 to indicate data are inapplicable for specific cases. For questions about the hours and minutes that the child spends playing video games, the question about the number of minutes (P8VIDMIN) could be entered by interviewers as “0” or skipped if parents did not provided a response that included minutes. If the question about the number of minutes was skipped, this variable is coded -1 (not applicable). Another exception to the standard use of -1 is that for several round 8 variables (theta scores from children’s cognitive tests in reading, X8RTHETK4, math, X8MTHETK4, and science, X8STHETK4), -1 is a valid value and should not be identified as missing data.
In order to protect the confidentiality of study participants, some data are suppressed in the public-use data file. The code -2 indicates the suppression of data for confidentiality. The suppression code -4 is used in rare instances in which there was a problem in the administration of an item that led to a high proportion of cases having missing or flawed data on the affected item, such that the data that were collected for the item were not useful and, therefore, are suppressed on the file. Although the administration error typically did not affect all cases, the -4 missing data code is assigned to all cases, including those not specifically affected by the error.
Information about a number of school characteristics that was collected in the SAQ-A (the school administrator questionnaire given to schools that were new to the study or had not previously completed an SAQ) was not collected in the SAQ-B (the school administrator questionnaire given to schools that had previously completed an SAQ). This data collection approach reduced respondent burden by eliminating questions about school characteristics that were unlikely to change from year-to-year, such

7-9
as public/private control and the grade levels taught at the school. The code -5 is a special “not applicable” code indicating that a child does not have a value for the given school characteristic variable because it was not included in the SAQ-B.
The -7 (refused) code indicates that the respondent specifically told the interviewer that he or she would not answer the question. This, along with the -8 (don’t know) code and the -9 (not ascertained) code, indicate item nonresponse. The -7 (refused) code is not used in the school or teacher data.
The -8 (don’t know) code indicates that the respondent specifically told the interviewer that he or she did not know the answer to the question. The -8 (don’t know) code is not used in the school or teacher data. For questions where “don’t know” is one of the options explicitly provided, a -8 is not coded for those who choose this option; instead the “don’t know” response is coded as indicated in the value label information for the variable associated with that question.
The -9 (not ascertained) code indicates that the respondent left a question blank that he or she should have answered (or for which it is uncertain whether the item should have been answered or legitimately skipped because the respondent also left a preceding item blank). However, if a gate question2 was left blank, but valid responses were provided to follow-up questions, the valid responses are included in the data file. For example, in the spring 2015 school administrator questionnaire version A (SAQ-A), question D1 asks, “Do any of the children in this school come from a home where a language other than English is spoken?” If the school administrator left D1 blank (i.e., unanswered), but then provided a valid response for question D2 which asks, “What percentage of children in this school are English language learners (ELL)?,” D1 is coded -9 and the information from D2 is included in the data file as reported. If a gate question and its follow-up questions were left blank, all of the questions (gate and follow-up) are coded as -9 (not ascertained).
For data that are not collected using the self-administered questionnaires (e.g., direct assessment scores), a -9 means that a value was not ascertained or could not be calculated due to nonresponse. The -9 (not ascertained) code is also used in the parent interview data when the interview ended before all applicable questions were asked. In these cases, the code of -9 is used for all variables associated with interview questions that came after the point at which the parent ended the interview. One exception to this coding scheme is the pointer variables.3 Pointer variables are not set to -9 when the interview ended before all applicable questions were asked; instead they are set to the value corresponding to the household’s parent figure(s). The -9 code is also used in the parent interview for questions that were
2 A gate question is the first question in a series with skips to one or more follow-up questions. 3 Pointer variables indicate the household roster number of a person in the household who was the subject of questions about a parent figure.

7-10
edited4 or inadvertently skipped in computer-assisted interviewing (CAI) programming. After editing, for complete interviews, the data for all questions that should have been asked but were not are coded as -9 (not ascertained), while the data for other skipped questions are coded as -1 (not applicable); codes -7 and -8 are used only when respondents stated a response of “refused” or “don’t know,” and not as a result of editing or inadvertently skipping a question as a result of CAI programming.
Missing values (-1, -7, -8, or -9) in questions that allow for more than one response are coded the same for all coding categories used for the question. For example, in the spring 2015 parent interview, if the question about subjects in which the child was tutored (HEQ290) has the answer of -8 (don’t know), then all the subject variables associated with that question (e.g., reading, math, science, and any categories that were added based on “other, specify” upcoding) are also coded as -8 (don’t know).
The “system missing” code appears as a blank when viewing codebook frequencies and in the ASCII data file. System missing codes (blanks) indicate that data for an entire instrument or assessment are missing due to unit nonresponse. For example, when a child’s parent does not participate in the parent interview, all of the data associated with questions from the parent interview are coded “system missing” (blank) for that child. These blanks may be converted to another value when the data are extracted into specific processing packages. For instance, SAS converts these blanks into periods (“.”) for numeric variables.
Codes used to identify missing values (-1, -7, -8, -9, or system missing) are not all identified as missing values by default in data analysis software. Users will need to define these as missing values in the software they are using to analyze the data. Depending on the research question being addressed, in some instances users may want to assign a valid value to cases with missing values. For example, a teacher who reported that he or she did not have any English language learners in his or her classroom in the spring of 2015 (question F10 in the reading teacher questionnaire; question C10 in the mathematics and science teacher questionnaires) skipped the next question (question F11 in the reading teacher questionnaire; question C11 in the mathematics and science teacher questionnaires) asking how many English language learners were in his or her classroom. An analyst interested in knowing the average number of English language learners in the classrooms of children in the ECLS-K:2011 may want to recode a value of -1 (not applicable) on the variable associated with question F11 or question C11 to a value of 0 (thereby indicating
4 Edits to household composition data that result in the addition or deletion of a parent or parent figure in the child’s household sometimes result in -9 (not ascertained) codes being used for variables in multiple sections of the parent interview that have questions that are asked depending on the presence of specific parents or parent figures. The affected sections in the spring 2015 parent interview are FSQ (Family Structure), DWQ (Discipline, Warmth, and Emotional Supportiveness), NRQ (Nonresident Parents), COQ (Country of Origin for Nonresident Biological Parents), PPQ (Parent’s Psychological Well-Being and Health), PEQ (Parent Education and Human Capital), and EMQ (Parent Employment). The -9 (not ascertained) code is used for both questions that are asked about specific parent/parent figures as well as those that are based on skips from those questions.

7-11
no English language learners in the classroom) in those instances where a teacher indicated in question F10/question C10 that there were no English language learners in the classroom. It is advised that users crosstabulate all gate questions and follow-up questions before proceeding with any recodes or use of the data. Additionally, data users are encouraged to closely examine the distribution of their data and value labels to determine if values that appear to be missing value codes are valid data prior to any recoding.
Composite variables may be derived using data from one or more instrument(s) in one round of data collection, from instrument data across multiple rounds, or from both instrument data and data from administrative records in one or more rounds. If a particular composite is inapplicable for a certain case, for example, as school composite variables are for children who are homeschooled, the variable is given a value of -1 (not applicable) for that case. In instances where a variable is applicable but complete information required to construct the composite is not available, the composite is given a value of -9 (not ascertained). The -7 (refused) code is not used for any of the composites except for the height and weight composites. The -8 (don’t know) code is not used for any of the composites.
There is variation in the use of system missing for composite variables. Some child demographic variables (date of birth, sex, and race/ethnicity) are considered applicable to all 18,174 children who participated in the base year and are not assigned a value of system missing for any case. For composite variables using data from both a survey instrument and other administrative or school data sources, only nonparticipants in a given round of data collection are assigned values of system missing. For composite variables using data from only one instrument, (e.g., X8PAR1AGE, parent 1’s age, is derived from the spring 2015 parent interview), a value of system missing is assigned if the instrument on which they are based was not completed; if the instrument was completed and an item used in the composite derivation was missing, the composite is assigned a value of -9 as described above.
7.4 Data Flags
7.4.1 Child Assessment Flags (X8RDGFLG, X8MTHFLG, X8SCIFLG, X8NRFLG, X8NRGEST, X8DCCSFLG, X8FLNKFLG, X8HGTFLG, X8WGTFLG, X8ASMTST, X8EXDIS)
There are many flags on the data file that indicate the presence or absence of child assessment data. X8RDGFLG denotes whether a child had scoreable reading assessment data in spring 2015, X8MTHFLG denotes whether a child had scoreable mathematics assessment data in spring 2015, and

7-12
X8SCIFLG denotes whether a child had scoreable science assessment data in spring 2015.5 If a child answered fewer than 10 questions in any direct cognitive assessment domain (reading, mathematics, or science), the assessment was not considered scoreable. Only items actually attempted by the child counted toward the scoreability threshold.6 A flag value of 1 indicates that the child responded to 10 or more questions in the assessment for that domain, and thus has the associated scores. A flag value of 0 indicates the child had fewer than 10 responses and does not have a score.
X8NRFLG indicates the presence of Numbers Reversed scores and X8DCCSFLG indicates the presence of Dimensional Change Card Sort (DCCS) scores. X8FLNKFLG indicates the presence of Flanker scores. X8HGTFLG and X8WGTFLG indicate the presence of data for height and weight in spring 2015, respectively.
For the Numbers Reversed and DCCS assessments, as long as the child started the assessment task and answered at least one test question beyond the practice items, a W-ability score (for Numbers Reversed) or a computed overall score (for DCCS) was computed. Flags for each of the scores are coded 1 if the child has a W-ability score (for Numbers Reversed) or a computed overall score (for DCCS), coded 0 if the child participated in the child assessment but does not have a score, and set to system missing if the child did not participate in the child assessment. The Numbers Reversed grade-normed scores are calculated using information about how far into the school year the assessment occurred. For some children the school year start and end dates are unavailable, so an estimate based on the mean of available data is used instead. (Information about the calculation of these grade-normed scores can be found in section 3.2.2.) The data file includes a flag that indicates whether the assessment point was estimated for the Numbers Reversed grade-normed scores (X8NRGEST). This flag is set to 0 when actual school start and end dates are known, and set to 1 when the assessment point was estimated.
The child’s assessment status for the spring of 2015 is indicated by the composite X8ASMTST. The valid values include 1 for children who have any assessment data in the data file,7 2 for those children who were excluded due to disability (and, therefore, do not have assessment data in the data file), and 3 for children who do not have assessment data in the data file and were not excluded due to disability. Note that those excluded due to disability (code 2) are considered to be participants in the data collection round even if they do not have any parent interview data either.
5 For earlier rounds of data collection, these reading and mathematics flags took into account both the English and Spanish administrations of the assessments. (The science assessment was administered only in English.) In the fall of 2012 and then in every round thereafter, all children received the reading, mathematics, and science assessments in English so no language of administration is specified here. For more information on the language of administration, see section 2.1.1. 6 See chapter 3 for a complete discussion of assessment scoreability. 7 Having child assessment data includes (1) having reading and/or mathematics and/or science scores, (2) having at least one executive function score, or (3) having a height or weight measurement.

7-13
In addition, there is a composite variable that uses FMS data to indicate whether the child was excluded from the assessment due to a disability: X8EXDIS. Study team leaders obtained information from school staff in the fall of 2014 and spring of 2015 about whether a child had an IEP on file and if any information in a child’s IEP indicated that he or she would need Braille, large print, or sign language, accommodations that were not available for the ECLS-K:2011. It was also determined whether the IEP specifically prohibited the child from participating in standardized assessments such as those conducted in the ECLS-K:2011. If so, the child was not assessed, X8EXDIS was coded 1 (child was excluded from the assessment due to a disability). Otherwise, X8EXDIS was coded 0 (child was not excluded from the assessment due to a disability). Students could have been excluded from taking the assessment for other reasons (e.g., lack of parental consent); these children are also coded 0 on X8EXDIS. The number of cases with system missing values varies across the eight XnEXDIS variables (that is, one per round), due to the sample for each round. The cases that are system missing on X1EXDIS are cases that were added to the sample in the spring of the base year and thus were not members of the sample in round 1. The cases that are system missing on X3EXDIS and X5EXDIS are those that were not selected for the fall subsample. There are no cases coded system missing on these variables in rounds 2, 4, 6, 7, and 8.
7.4.2 Parent Data Flags (X8PARDAT, X8EDIT, X8BRKFNL)
There is one flag that indicates the presence of parent interview data in spring 2015. X8PARDAT is coded as 1 if there was a fully completed or partially completed interview in spring 2015. A partially completed interview in spring 2015 was one that ended before all applicable questions were answered, but that had answers to questions through FSQ200 (variable P8CURMAR) in the Family Structure Questions (FSQ) section.
The flag X8EDIT indicates whether, for a given case, household matrix data were reviewed or edited. It is coded as 1 if a parent interview household matrix was edited (e.g., if the age of a household member was reported incorrectly and had to be updated, or a person who was added to the household in error needed to be deleted from the household) or reviewed for editing even if no data were changed (e.g., if there were data that suggested a possible problem, but after examining the case the data were left as they were reported). This flag is included to make users aware that data cleaning or review of household matrix data was necessary for a particular case. If something about the household composition or characteristics of the household members seems unusual (e.g., the child is identified as having a 34-year-old brother in the household) and this flag is set to 1, this is an indication that the unusual data were reviewed and either edited to appear as they do in the data file or left as is because it was confirmed the data were accurate or

7-14
there was no additional information indicating how the data could be edited accurately. When the flag is set to 1 and data (e.g., for the ages or relationships of household members) are corrected, the data are only changed in the variables for the round of the study to which the data flag pertains; no corrections are made to the data for the prior rounds to reflect the later corrections. Researchers who are using data about household composition from the parent interview household roster in their analyses should examine all rounds of household roster data closely, recognizing that for a limited number of cases corrected information from later rounds may need to be applied to earlier rounds. Before applying changes to earlier-round data, researchers should ensure that they are making changes for the correct household member(s). It should also be ensured that any changes noted in the relationship variables are related to the correction of errors and not to real changes in the relationship of household members to the study child.
The composite variable X8BRKFNL indicates a final breakoff from the round 8 parent interview. A final breakoff occurs when a respondent stops in the middle of the interview before answering all applicable questions. These composites identify the variable associated with the last question answered by the parent. The breakoff point is provided only for those parent interviews with a status of partially complete. Cases for which a parent completed the interview have a value of -1, indicating that the case was not a breakoff.
7.4.3 Teacher Flags (X8TQTDAT, X8TQZDAT, X8TQRDGDAT, X8TQMTHDAT, X8TQSCIDAT, X8MSFLAG, X8SETQA, X8SETQC)
In the spring fourth-grade collection, a reading teacher for each child was identified. In addition, half of the sampled children were randomly assigned to have their mathematics teacher complete questionnaires, while the other half of the sampled children were randomly assigned to have their science teacher complete questionnaires. Thus, every child has a reading teacher and either a mathematics or a science teacher identified for him or her.
These reading, mathematics, and science teachers were asked to complete two types of self-administered questionnaires, as follows:
1. The teacher-level questionnaire included questions about the teachers, such as their views on the school climate, their evaluation methods used for reporting to parents, and their background and education.
2. The child- and classroom-level questionnaire had two parts. Part 1 contained child-level questions that asked the teacher to rate the study child identified on the cover of the questionnaire on academic and social skills, school engagement, and classroom behaviors.
7-15
Part 2 contained subject matter-specific, class-level questions pertaining to the reading, mathematics, or science class of the study child. For example, teachers were asked how much time the study child’s class spends on specific skills and activities—skills aligned with the Common Core State Standards. This second section also contained questions on instruction and grading practices, classroom behavioral issues, and homework assignments.
Since one teacher could instruct multiple study children in the same class, data collection procedures were implemented to minimize teacher burden by not asking teachers to answer questions about the same class for multiple children. One “key child” was identified for each class, and the teacher only completed Part 2 (the classroom information) of the child- and classroom-level questionnaire for this key child. Information collected for the key child was then applied to all study children in the same reading, math, or science class as the key child. If a teacher taught different classes of a single subject (e.g., multiple reading classes), a key child was identified for each class, and the teacher was asked to complete the class-level questions for each section of that subject that he or she taught. Teachers linked to at least one ECLS-K:2011 child were also asked to complete the teacher-level questionnaire. Data from the teacher-level questionnaire were linked to every study child in the teacher’s class(es). The data file contains flag variables that can be used to determine whether data were obtained from a teacher.8 There are separate subject-matter flag variables corresponding to each type of teacher questionnaire (teacher-level and child-level). Two flags indicate the type of teacher that completed the teacher-level questionnaire. X8TQTDAT indicates it was a reading teacher who completed the teacher-level questionnaire. X8TQZDAT indicates it was a mathematics or science teacher who completed the teacher-level questionnaire. X8TQRDGDAT, X8TQMTHDAT, X8TQSCIDAT are flags to indicate the subject matter for the child-level questionnaires for reading, mathematics, and science, respectively. The variable X8MSFLAG indicates whether the child was sampled for the mathematics or science teacher questionnaire.
Two flags indicate the presence of data from each of the two special education teacher questionnaires for spring 2015 (X8SETQA for the teacher-level questionnaire and X8SETQC for the child-level questionnaire). Cases linked to a special education teacher who did not complete a questionnaire and cases that were not linked to a special education teacher have a value of 0 on these flags.
Users interested in information about whether special education teacher questionnaires were requested, regardless of whether special education questionnaires were completed in the spring of 2015, can use the composite variable X8SPECS, which is based on information from the FMS rather than the special education questionnaires. X8SPECS can be used with the flags for the presence of data for special education teacher questionnaires, X8SETQA and X8SETQC, to indicate whether special education questionnaires were requested and received. For example, if X8SETQA = 0 and X8SPECS = 1, this 8 An identification number is provided in the teacher ID variable T8R_ID, T8M_ID, and T8S_ID as long as a child was linked to a reading, math, or science teacher, even if the teacher did not complete any questionnaires.
7-16
indicates that the case was linked to a special education teacher who did not complete a teacher-level special education questionnaire, but special education questionnaires were requested. If X8SETQA = 0 and X8SPECS = 2, this indicates that the case was not linked to a special education teacher and special education questionnaires were not requested. X8SPECS is described further below in section 7.5.1.10.
7.4.4 School Administrator Data Flag (X8INSAQ)
There is a flag for the school administrator questionnaire (X8INSAQ) that is coded 1 if there are data from either version of the spring 2015 school administrator questionnaire (SAQ) and 0 if there are no data from the SAQ.
7.4.5 Child Destination School Flag (X8DEST)
As discussed in chapter 4, when four or more students moved from an original sampled school into the same transfer school, the transfer school is identified as a destination school. The X*DEST composites identify schools that became a destination school in a given round. Once a school has been identified as a destination school, it is not identified as a destination school again in a later round if it subsequently satisfies the conditions for being labeled a destination school because students have moved to it from the same original sample school that students had transferred to previously. However, a school may be identified as a destination school in more than one round of the study if it satisfies the conditions for being labeled a destination school based on students moving there from different original sample schools. For example, if four or more students move from school A to school B in round 4, school B is identified as a destination school in round 4. If four or more students move from school A to school B in round 6, school B is not identified as a destination school again in round 6. However, if four or more students move from school C to school B in round 6, school B is identified as a destination school again in round 6. Users can identify schools that were ever designated as destination schools by looking at whether any of the X*DEST composites = 1. Destination schools are schools for which it was determined that at least four ECLS-K:2011 children moved into them during the same round of the study and from the same original school at which they were sampled for the study. This typically happened when children attended a school that ended with a particular grade (e.g., a school that only provided education through first grade) or a school that closed. Destination schools may be new to the ECLS-K:2011 or may have participated in a past round. A school already participating in the study could be designated a destination school if four children from the same original school move into that school. The composite, X8DEST, identifies schools that became destination schools in the current round, round 8. The variable X8DEST is nonmissing for respondents in the spring

7-17
2015 round and is coded 1 if the child attended a school that became a destination school in the spring of 2015, and 0 otherwise.
7.5 Composite Variables
To facilitate analysis of the survey data, composite variables were derived and included in the data file. This section identifies the source variables and provides other details for the composite variables. Most composite variables were created using two or more variables that are also available in the data file, each of which is named in the text that explains the composite variable. Other composites, for example, X_CHSEX_R, were created using data from the Field Management System (FMS) and the sampling frame, which are not available in the data file. Note that some of these variables have been updated or revised since their release on previous data files. Such variables have an “_R” suffix in their name.
7.5.1 Child Composite Variables
There are many child-level composite variables in the child catalog. The nonassessment variables are described in further detail here. The child-level composites for the direct and indirect child assessment are described in chapter 3.
7.5.1.1 Child’s Date of Birth (X_DOBYY_R and X_DOBMM_R)
The composite variables for the child’s date of birth are based on data from previous rounds of the study and are the same as the date of birth variables released in the K–3 longitudinal data file (X_DOBMM_R, X_DOBDD_R,9 and X_DOBYY_R). The child’s date of birth was not collected in the spring 2015 interview. Information about child’s date of birth was collected from schools at the time of sampling and stored in the FMS, collected from parents in the fall kindergarten parent interview, and then collected or confirmed by parents in the spring kindergarten parent interview (parents confirmed the parent report from the fall or FMS data if the fall parent report was not obtained). Questions to collect date of birth information were only asked in the fall 2011, spring 2012, fall 2012, or spring 2013 interviews if data from the parent interview about the child’s date of birth were missing due to unit or item nonresponse. In these rounds of the study, the parent was only asked child’s date of birth if the parent had not confirmed FMS- 9.X_DOBDD_R indicates the child’s exact day of birth. This is an administrative variable that is not included in the K-4 longitudinal data file for issues related to confidentiality.

7-18
reported data (or had not reported date of birth if there were no FMS data) in a prior interview. In creating the composite, data from the most recent parent interview were given priority over data from other rounds because they were collected most recently and any data that were missing from the parent interview due to unit or item nonresponse had the potential to be updated in a subsequent data collection.
7.5.1.2 Child’s Age at Assessment and the Date of Assessment (X8AGE, X8ASMTDD, X8ASMTMM, X8ASMTYY)
The child’s age at assessment in months (X8AGE) was calculated by comparing the exact date the child completed the ECLS-K:2011 direct child assessment according to administrative data that are not included in the data file and the child’s date of birth (X_DOBDD_R [day of birth],10 X_DOBMM_R [month of birth], X_DOBYY_R [year of birth]). The calculation of age in months uses the number of days in each month and is adjusted for leap years. The child assessment date was examined to ensure it was within the field period. If the assessment date fell outside the field period, the modal assessment date for the child’s school was used to set the composite and was retained for the data file.11
Variables indicating the date of assessment (day, month, and year) in round 8 are also included in the K–4 data file. The variable for the day of assessment (X8ASMTDD) provides a range of days in a month that the child was assessed and is coded 1 (days 1 through 7); 2 (days 8 through 15); 3 (days 16 through 22); 4 (day 23 or later); or -9 (not ascertained). The exact day of the month is not provided for reasons related to confidentiality. The variable for the month of assessment (X8ASMTMM) indicates the month that the child was assessed, and the variable for the year of assessment (X8ASMTYY) indicates the year that the child was assessed.
7.5.1.3 Child’s Sex (X_CHSEX_R)
The composite variable for the child’s sex is based on data from previous rounds of the study and is the same as the variable released in the K–3 longitudinal data file (X_CHSEX_R). The child’s sex was not collected in the spring 2015 interview. Information about child’s sex was collected from schools at the time of sampling and stored in the FMS, collected from parents in the fall kindergarten parent interview,
10 X_DOBDD_R indicates the child’s exact day of birth. This is an administrative variable that is not included in the K-4 longitudinal data file for issues related to confidentiality. 11 Some assessments that were partially but not entirely completed during the field period were assigned a final status after the end of the data collection round. Thus, assessment dates after the end of the field period reflect the timing of the assignment of the final disposition, not the actual date of assessment. These cases were adjusted so that the assessment date reflects the modal date for the school.

7-19
and then collected or confirmed by parents in the spring kindergarten parent interview (parents confirmed the parent report from the fall or FMS data if the fall parent report was not obtained). Questions to collect information on the child’s sex were only asked in the fall 2011, spring 2012, fall 2012, or spring 2013 interviews if data from the parent interview about the child’s sex were missing due to unit or item nonresponse. In these rounds of the study, the parent was only asked the child’s sex if the parent had not confirmed FMS reported data (or had not reported the child’s sex if there were no FMS data) in a prior interview. In creating the composite, data from the most recent parent interview were given priority over data from other rounds because they were collected in the most recent interview and any data that were missing from the parent interview due to unit or item nonresponse had the potential to be updated in a subsequent data collection.
7.5.1.4 Race/Ethnicity (X_AMINAN_R, X_ASIAN_R, X_HAWPI_R, X_BLACK_R, X_WHITE_R, X_HISP_R, X_MULTR_R, X_RACETHP_R, X_RACETH_R)
There are three types of composite variables indicating child’s race/ethnicity in the ECLS-K:2011 file: (1) dichotomous variables for each race/ethnicity category (X_AMINAN_R, X_ASIAN_R, X_HAWPI_R, X_BLACK_R, X_WHITE_R, X_HISP_R, X_MULTR_R) derived from data collected in the parent interview; (2) a single race/ethnicity composite derived from data collected in the parent interview (X_RACETHP_R); and (3) a race/ethnicity composite that draws from either the parent-reported data about the child’s race or the FMS (X_RACETH_R), with FMS data used only if parent responses about the child’s race were missing. Parent interview responses about the races of the child’s biological parents were not used in the creation of child race composite variables. Race/ethnicity information was updated in these composite variables for about 20 to about 50 cases, depending on the specific composite, based on information collected from parents in the spring 2015 parent interviews.
Parents were asked about the child’s ethnicity in the spring of 2015 if ethnicity in the parent interview items for the child were missing due to unit or item nonresponse. Specifically, parents were asked whether or not their child was Hispanic or Latino. Parents were also asked about the child’s race in spring 2015 only if parent interview race data for the child were missing. Parents were asked to indicate to which of five race categories (White, Black or African American, Asian, Native Hawaiian or other Pacific Islander, American Indian or Alaska Native) their child belonged, and they were allowed to indicate more than one. From these responses, a series of five dichotomous race variables were created that indicate separately whether the child belonged to each of the five specified race groups. In addition, one additional

7-20
dichotomous variable was created to identify those who had indicated that their child belonged to more than one race category.12
The seven dichotomous ethnicity and race variables (X_HISP_R, X_AMINAN_R, X_ASIAN_R, X_HAWPI_R, X_BLACK_R, X_WHITE_R, X_MULTR_R) were created using parent data from spring 2015, or if those data were not asked in spring 2015 because they were asked in a previous round of the study, the dichotomous composites were set to the values of the spring 2014 dichotomous race composites that used parent data from the third grade, second grade, first grade, and base-year collections (X_HISP_R, X_AMINAN_R, X_ASIAN_R, X_HAWPI_R, X_BLACK_R, X_WHITE_R, X_MULTR_R). Otherwise, the dichotomous ethnicity and race composites were set to -9 (not ascertained).
Using the six dichotomous race variables and the Hispanic ethnicity variable, the race/ethnicity composite variables for the child (X_RACETHP_R, X_RACETH_R) were created. The categories for these variables are: White, non-Hispanic; Black or African American, non-Hispanic; Hispanic, race specified; Hispanic, no race specified; Asian, non-Hispanic; Native Hawaiian or other Pacific Islander, non-Hispanic; American Indian or Alaska Native, non-Hispanic; and more than one race specified, non-Hispanic. A child is classified as Hispanic if a parent indicated the child’s ethnicity was Hispanic or Latino regardless of whether a race was identified and what that race was. If a child is not reported to be Hispanic or Latino, the race/ethnicity categories (White, non-Hispanic; Black or African-American, non-Hispanic; Asian, non-Hispanic; Native Hawaiian or Other Pacific Islander, non-Hispanic; and American Indian or Alaska Native, non-Hispanic; More than one Race, non-Hispanic) are coded according to the child’s reported race. If the report about whether the child was Hispanic or Latino was -7 (refused) or -8 (don’t know), or if the child is not Hispanic or Latino and parent-reported race is missing, X_RACETHP_R is coded -9 (not ascertained); if the report about whether the child was Hispanic or Latino is also missing from the FMS, or if the child is not Hispanic or Latino and race is also missing from the FMS, X_RACETH_R is coded -9 (not ascertained). The difference between X_RACETHP_R and X_RACETH_R is that if race or ethnicity data are missing from the spring 2015 parent interview, X_RACETH_R is set to the value used for the spring 2014 composite, also called X_RACETH_R, which uses both parent data and FMS data, while only parent-report data were used for the variable X_RACETHP_R. Thus, there are more missing data for X_RACETHP_R than for X_RACETH_R.
About 50 cases have a value for X_RACETHP_R that is different in the K-4 longitudinal file than in the K-3 longitudinal file due to the collection of child race/ethnicity data in the spring 2015 parent interview. About 10 of these cases changed value from -9 (not ascertained) to a valid value and about 30
12 Unlike the ECLS-K, in the ECLS-K:2011 “other” was not a permitted response for the race question.

7-21
cases changed from code 4, Hispanic-no race reported, to code 3, Hispanic-race reported. About 40 cases have a changed value for X_RACETH_R due to the collection of child race/ethnicity data in the spring 2015 parent interview. Nearly all of these cases, about 30, changed from code 4, Hispanic-no race reported, to code 3, Hispanic-race reported.
The categories for X_RACETHP_R and X_RACETH_R are mutually exclusive, meaning that a child is coded as just one race/ethnicity. Users interested in the specific races of children who are identified as multiracial, or who are interested in identifying the race(s) of children who are identified as Hispanic, should use the dichotomous race variables discussed above.
7.5.1.5 Child’s Height (X8HEIGHT)
To obtain accurate measurements, each child’s height was measured twice in each data collection round. The height measurements were entered into the computer program used for the assessment, with a lower limit set at 35 inches and an upper limit set at 80 inches.
For the height composites, if the two height measurements (C8HGT1 and C8HGT2 for spring 2015) were less than 2 inches apart, the average of the two height values was computed and used as the composite value. If the two spring measurements were 2 inches or more apart, for X8HEIGHT (the child’s height in spring 2015), the measurement that was closest to 54.82 inches for boys and 54.41 inches for girls was used as the composite value. This is the 50th percentile height for children who were 10 years old (121.28 months for boys and 120.64 months for girls: the average age at assessment in spring 2015 using the composite X8AGE). The height averages come from the 2000 Centers for Disease Control and Prevention (CDC) Growth Charts (www.cdc.gov/growthcharts/html_charts/statage.htm).13 The two height measurements were 2 or more inches apart for 8 cases for X8HEIGHT.
If one value for height was missing, the other value was used for the composite. If both the first and second measurements of height were coded as -8 (don’t know), then the height composite was coded as -9 (not ascertained). Children who did not have their height measured due to a physical disability were coded as -8 (don’t know) for both height measurements and, therefore, have a code of -9 on the composite. If both the first and second measurements of height were coded as -7 (refused), then the height composite was coded as -7 (refused). If both the first and second measurements of height were coded as
13 For calculating the median height, the composite X8AGE was used to determine children’s average age at assessment. The average age at assessment in spring 2015 was 121.28 months for boys and 120.64 months for girls using the composite X8AGE. The closest value on the CDC Growth Chart was 121.5 for boys and 120.5 for girls.

7-22
-9 (not ascertained) because height data were missing as the result of a breakoff in the child assessment or the measurements had different missing values (e.g., one was -8 and the other was -9), then the height composite was coded as -9 (not ascertained).
For 214 cases, the child’s height in the spring of 2015 (X8HEIGHT) was shorter than in the spring of 2014 (X6HEIGHT). A difference of 1 inch or less (67 children) could be a function of things such as slouching versus standing upright or differences in shoes, hairstyle, thickness of socks, or a combination of these factors. However, 147 children were recorded as being more than 1 inch shorter in the spring of 2015 than in the spring of 2014, and 97 of those were recorded as being more than 2 inches shorter. These discrepancies may result from measurement error or recording error. Analysts should use their own judgment in how to use these cases in their analysis.
7.5.1.6 Child’s Weight (X8WEIGHT)
To obtain accurate measurements, each child’s weight was measured twice in each data collection round. The weight measurements were entered into the computer program used for the assessment, with a lower limit set at 30 pounds and an upper limit set at 300 pounds. Values outside the range that were documented in assessor comments as being valid measurements were included in the data file.
For the weight composites, if the two weight measurements obtained within a round (i.e., C8WGT1 and C8WGT2 for spring 2015) were less than 5 pounds apart, the average of the two weight values was computed and used as the composite value. If the two measurements were 5 or more pounds apart, for X8WEIGHT the measurement that was closest to 71.42 pounds for boys or 72.89 pounds for girls was used as the composite value. These are the median weights for children who were 10 years old (121.28 months for boys and 120.64 months for girls: the average age at assessment in spring 2015 using the composite X8AGE). The weight averages come from the 2000 CDC Growth Charts (see https://www.cdc.gov/growthcharts/html_charts/wtage.htm).14 The two weight measurements were 5 or more pounds apart in 14 cases for X8WEIGHT.
If one value for weight was missing, the other value was used for the composite. If both the first and second measurements of weight were coded as -8 (don’t know), the weight composite was coded
14 For calculating the median weight, the composite X8AGE was used to determine children’s average age at assessment. The average age at assessment in spring 2015 was 121.28 months for boys and 120.64 months for girls using the composite X8AGE. The closest value on the CDC Growth Chart was 121.5 for boys and 120.5 for girls.

7-23
as -9 (not ascertained). Children who did not have their weight measured due to a physical disability were coded as -8 (don’t know) for both weight measurements and, therefore, have a code of -9 on the composite. If both the first and second measurements of weight in the child assessment were coded as -7 (refused), then the weight composite was coded as -7 (refused). If both the first and second measurements of weight in the child assessment were coded as -9 because weight data were missing as the result of a breakoff in the child assessment or the measurements had different missing values (e.g., one was -8 and the other was -9), then the weight composite was coded as -9 (not ascertained).
There are approximately 40 children whose round 8 weights are 10 pounds or more lower than their round 7 weights; of these, about 10 of these changes are in the range of 20.5 pounds to 70.2 pounds. It is possible that some of these changes result from measurement error. Analysts may wish to review such cases and determine how to account for these weight changes in their analysis.
7.5.1.7 Child’s Body Mass Index (X8BMI)
Composite body mass index (BMI) was calculated by multiplying the composite weight in pounds by 703.0696261393 and dividing by the square of the child’s composite height in inches (Keys et al. 1972; Mei et al. 2002). Unrounded values of height and weight were used in the calculation of BMI. If either the height or weight composite was coded as -9 (not ascertained) or -7 (refused), the BMI composite was coded as not ascertained (-9). Values of “don’t know” for height and weight were coded -9 (not ascertained) in the height and weight composites and also coded -9 (not ascertained) in the BMI composite.
7.5.1.8 Child’s Disability Status (X8DISABL2, X8DISABL)
Two composite variables based on information obtained in the parent interview were created to indicate whether a child had a disability diagnosed by a professional. Note that these variables indicate either diagnosed disabilities that were identified for the first time in the round 8 parent interview or diagnoses reported in a previous interview for which the child also had a diagnosis reported in round 8. The variables must be used in conjunction with the disability composites from earlier rounds to identify the entire group of children who have ever had a disability diagnosed by a professional. Also, these two variables differ in how missing data were treated during their creation, as described below.
Questions in the spring 2015 parent interview asked about the child’s ability to be independent and take care of himself or herself, ability to pay attention and learn, coordination in moving arms and legs,

7-24
overall activity level, overall behavior and ability to relate to adults and children, emotional or psychological difficulties, ability to communicate, difficulty in hearing and understanding speech, and eyesight. If parents indicated that their child had any issues or difficulties in response to these questions, follow-up questions asked whether the child had been evaluated by a professional for that particular issue and whether a diagnosis of a problem was obtained by a professional (CHQ120, CHQ125, CHQ215, CHQ245, CHQ246, CHQ300, CHQ301). A question was also asked about current receipt of therapy services or participation in a program for children with disabilities (CHQ340).
The composite variable X8DISABL is coded 1 (yes) if the parent answered “yes” to at least one of the questions about diagnosis (indicating a diagnosis of a problem was obtained) or therapy services (indicating the child received services) (CHQ120, CHQ215, CHQ245, CHQ300, CHQ340) and the questions about the specific diagnoses (CHQ125, CHQ246, CHQ301) were not coded -7 (refused), -8 (don’t know), or -9 (not ascertained); or in the case of the vision diagnosis (CHQ301), the question was not coded as only nearsightedness (myopia), farsightedness (hyperopia), color blindness or deficiency, or astigmatism; or in the case of a hearing diagnosis (CHQ246), the question was not coded as only external ear canal ear wax.
Using these criteria to calculate X8DISABL, a child could be coded as having a disability even if data for some of the questions about diagnoses or therapy services (CHQ120, CHQ215, CHQ245, CHQ300, CHQ340) were missing. This is because a child is coded as not having a disability if there are data for at least one of the questions about diagnoses or therapy services (CHQ120, CHQ215, CHQ245, CHQ300, CHQ340), and the response was either 2 (no) or the item was -1 (inapplicable) (because the child did not have issues that indicated a question should be asked), even if data for some of these questions were missing. In addition to having “no” answers or “inapplicable” codes for the diagnoses or therapy services questions, if the child had a diagnosis, but the specific diagnosis was not reported (was refused, don’t know, or not ascertained), X8DISABL was also coded 2 (no) because there was no reported disability. The composite was coded as missing only if all of the data for the questions about diagnoses or therapy services (CHQ120, CHQ215, CHQ245, CHQ300, CHQ340) were -7 (refused), -8 (don’t know), or -9 (not ascertained), or if the items that skipped to these items were -7 (refused), -8 (don’t know), or -9 (not ascertained).
A more conservative approach when coding cases that had incomplete data for the diagnoses and services variables was used to derive the variable X8DISABL2. Whereas X8DISABL codes cases with missing data as “no” as long as all the information that was collected indicates the child does not have a diagnosed disability or receive services for a diagnosed disability, X8DISABL2 is coded -9 (not ascertained) when any of the questions about diagnoses or therapy services (CHQ120, CHQ215, CHQ245,

7-25
CHQ300, CHQ340) are -7 (refused), -8 (don’t know), or -9 (not ascertained), or the items that skipped to these items are -7 (refused), -8 (don’t know), or -9 (not ascertained). For X8DISABL2, if there are no “yes” answers for a disability, but any of the evaluation (CHQ115, CHQ210, CHQ235, CHQ290), diagnoses (CHQ120, CHQ215, CHQ245, CHQ300), or therapy questions (CHQ340) are -7 (refused), -8 (don’t know), or -9 (not ascertained),15 or if any of the evaluation, diagnosis, or therapy questions were not asked (were -1 for inapplicable) because of missing data for questions that skipped to those questions (and thus it is not known if they should have been asked), X8DISABL2 is coded -9 (not ascertained). In addition, if the parents indicated that a diagnosis had been obtained, but the specific diagnosis was coded as refused, don’t know, or not ascertained, X8DISABL2 is coded as -9 (not ascertained). This approach is more conservative because it does not assume that the response for unanswered questions was “no.” Due to these differences in coding, the number of cases identified as not having a diagnosed disability is higher for X8DISABL than it is for X8DISABL2.
7.5.1.9 Student Grade Level (X8GRDLVL)
The X8GRDLVL composite indicates the child’s grade level in the spring of 2015 as reported by the teacher or recorded in the FMS. This composite has valid values for the 12,195 cases that are respondents for round 8 (that is, the cases that have either child assessment or parent interview data). It is constructed using F8CLASS2 (child’s grade in spring 2015 from the FMS). The values include 2 for second grade, 3 for third grade, 4 for fourth grade, and 5 for fifth grade. In all other cases the value is set to -9 for not ascertained.
Note that grade level (F8CLASS2) is included for homeschooled children. For all children, their grade was known at their initial sampling in school. For homeschooled children and other assess-in-home children, the grade was incremented by 1 year each year. In spring 2011, fall 2011, spring 2012, and fall 2012, the child’s grade was confirmed with the parent for these cases. In the spring of 2013, 2014, and 2015, parents were not asked for this information. The grade level from the spring of 2014 was increased by one grade for the spring of 2015. This change was also made for cases that started homeschooling in the 2014–15 school year. If a parent volunteered new information about grade level, field team leaders updated the information in the Field Management System (FMS) and that information is reflected in the composite variable.
15 If CHQ340 was -9 (not ascertained) because the interview broke off after CHQ330, but all answers in CHQ330 and questions prior to CHQ330 indicated that CHQ340 would not have been applicable, X8DISABL and X8DISABL2 were coded 2 (no disability) because that question would not have been asked for those children.

7-26
7.5.1.10 Child Linked to a Special Education Teacher (X8SPECS)
The composite variable X8SPECS indicates whether or not children were linked to a special education teacher and special education questionnaires were requested from teachers in the spring of 2015, based on the presence or absence of a link to a special education teacher or related service provider in the FMS. The value is 1 if special education questionnaires were requested and 2 if special education questionnaires were not requested. Study team leaders asked school staff if any accommodations were required for the study children to be assessed. During that discussion about assessment accommodations, team leaders were also supposed to record whether the child had an Individualized Education Program (IEP) on file with the school but did not require any accommodations for the study assessments. The link to a special education teacher was established automatically when information indicating a child needed an accommodation, or had an IEP but did not require an accommodation, was entered in the FMS by study team leaders.
There are a few cases of a mismatch between X8SPECS and special education teacher reports about an IEP. For about 120 cases in spring 2015, there were FMS data indicating the child had an IEP on record at the school (and thus a special education teacher questionnaire was requested from the teacher and X8SPECS = 1), but the special education teacher indicated in the child-level questionnaire that the child did not have an IEP (E8RECSPE = 2).
7.5.2 Family and Household Composite Variables
Many composite variables are created to provide information about the sampled children’s family and household characteristics. It must be noted that household composition composite variables consider only those people who were household members at the time of the parent interview. If information on household composition was collected in the spring 2014, spring 2013, spring 2012, spring 2011, or fall 2010 parent interview, the parent respondent was asked to indicate whether the people living in the household in the most recent interview in which information about household composition was collected were still in the household at the time of the spring 2015 parent interview, as well as whether there were any new members of the household. Household members were accounted for in the derivation of the spring 2015 composite variables if they were still living in the household or had joined the household since the time of the last interview, as indicated in the variables P8CUR_1–P8CUR_25.
During the spring 2015 parent interview, information on age, sex, and relationship to the study child was collected for all new household members. For certain existing household members, information

7-27
was collected about whether their relationship to the study child had changed since the previous interview in which relationship data was collected. Change in relationship was asked for household members who were identified in a prior round interview as being a step- or foster mother or father, other male or female parent or guardian, boyfriend or girlfriend of the child’s parent, relative, or nonrelative. Information about race and ethnicity were collected for specific household members who were new to the household and for specific previous household members with missing race or ethnicity data.
The composite variables for parents (e.g., parent age, parent education) are for the parents who were members of the household at the time of the spring 2015 interview. The identities of household parent figures can change over time, meaning that data in a composite may not pertain to the parent figure in the household in an earlier round. For example, parent education information collected in the spring 2015 parent interview would pertain to a father figure who was in the home during that round but not necessarily to a father figure who was in the household during the kindergarten, first, second, or third grade years. Users should look at the X8IDP1 and X8IDP2 variables described in section 7.5.2.3 to determine if the household roster numbers associated with parent 1 and parent 2 in the spring of 2015 match the household roster numbers for parent 1 and parent 2 from an earlier round (e.g., X7IDP1 or X7IDP2) in order to determine if the parent figures changed.
It should be noted that in spring 2015 there are not composite variables for parent occupation or employment. In spring 2015, questions about parent occupation were not asked and questions about parent employment were asked in a single question. Data for the single question for parent 1 and parent 2 (P8EMPSIT1_I, P8EMPSIT2_I) were imputed if they were missing using either longitudinal imputation, if appropriate, or hot deck imputation.16
7.5.2.1 Household Counts (X8HTOTAL, X8NUMSIB, X8LESS18, X8OVER18)
The composite variable X8HTOTAL provides a count of the total number of household members in the spring of 2015. For households for which household roster information had been collected in a prior round, this count is the number of household members who were previously rostered and reported to still be in the household plus any new persons added after the last interview in which roster information was collected. For a small number of households that did not participate in any of the prior parent interviews 16 Longitudinal imputation was conducted using the most recent employment variable from spring 2014, P7EMPSIT*_I. If there were data available for P7EMPSIT*_I, the values of P7EMPSIT*_I were copied to P8EMPSIT*_I. If data for P7EMPSIT*_I were not available, the composite variables for employment (X6PAR*EMP_I, X4PAR*EMP_I, or X1PAR1EMP) were used. For example, if there were data available for spring 2013, if X6PAR*EMP_I = 2 (less than 35 hours per week), then P8EMPSIT*_I = 1 (working part-time). If X6PAR*EMP_I = 1 (35 hours or more per week), then P8EMPSIT*_I = 2 (working full-time). Otherwise, for parents who were not employed, the most recently collected value for P6DOW_*, P4DOW_*, or P1DOW_* was used as a boundary variable in hot deck imputation to set the value of P8EMPSIT*_I.
7-28
in which household composition information was collected (fall 2010, spring 2011, spring 2012, spring 2013, or spring 2014), X8HTOTAL is a count of the total number of persons identified by the respondent as household members in the spring 2015 parent interview.
Two composite variables take the ages of the household members into account to indicate the total numbers of (1) adults and (2) children in the household in the spring of 2015. Information about household members’ ages was collected in the household matrix, or roster, section of the parent interview. X8LESS18 indicates the total number of people in the household under age 18, including the study child, siblings, and other children, and X8OVER18 indicates the total number of people in the household age 18 or older. All household members who were 18 years old or older, as well as anyone identified as a parent or grandparent of the focal child whose age was missing, are counted in the total for X8OVER18. Households with members with missing age information who were not identified as a parent or grandparent are coded as -9 (not ascertained) on X8OVER18 and X8LESS18. X8LESS18 is created by subtracting X8OVER18 from X8HTOTAL.
The composite X8NUMSIB indicates the total number of siblings (biological, step-, adoptive, or foster) living in the household with the study child. Siblings were identified by questions in the FSQ section of the parent interview that asked about the relationship of each household member to the study child. X8NUMSIB does not count children of the parent’s boyfriend or girlfriend (identified by the code 5 in the variables associated with question FSQ180) as siblings.
7.5.2.2 Household Rosters
The ECLS-K:2011 data file includes rosters of the household members as collected in the parent interviews. The roster information appears as part of the block of Family Structure Questions (FSQ) for each round in which the FSQ section was included in the parent interview. Variable names begin with P1 for round 1 (fall kindergarten), P2 for round 2 (spring kindergarten), P4 for round 4 (spring 2012, when most children were in first grade), P6 for round 6 (spring 2013, when most children were in second grade), P7 for round 7 (spring 2014, when most children were in third grade), and P8 for round 8 (spring 2015, when most children were in the fourth grade). No FSQ section was included in the brief round 3 or round 5 parent interviews.

7-29
For each household member in each round, roster variables include the following, where * is the round number (1, 2, 4, 6, 7, or 8) and # is the household roster number (1 through 25):
P*PER_#, person type, whether the person is the focal child, respondent, or spouse/partner of the respondent;
P*AGE_#, the person’s age;
P*SEX_#, the person’s sex;
P*REL_#, how the person is related to the focal child;
P*MOM_#, if the person is the child’s mother, the type of mother;
P*DAD_#, if the person is the child’s father, the type of father;
P*SIS_#, if the person is the child’s sister, the type of sister;
P*BRO_#, if the person is the child’s brother, the type of brother;
P*UNR_#, if the person is not a relative, the type of relationship to the study child;
P*HSP_#, whether the child or parent/guardian is of Hispanic or Latino origin;
P*AIA_#, whether the child or parent/guardian is American Indian or Alaska Native;
P*ASN_#, whether the child or parent/guardian is Asian;
P*BLK_#, whether the child or parent/guardian is Black or African American;
P*HPI_#, whether the child or parent/guardian is Native Hawaiian or other Pacific Islander; and
P*WHT_#, whether the child or parent/guardian is White.
For rounds 2, 4, 6, 7, and 8 there are two additional variables:
P*CUR_#, whether the person was currently a household member at the time of the interview; and
P*REASL#, if the person left the household, the reason for doing so.

7-30
For round 2, there were two additional variables.17
P2JOI_#, the round in which the person was first enumerated as a household member; and
P2RDP_#, the round in which the person left the household.
Once a person is assigned a household roster number, he or she retains that number permanently. Thus, if there are four persons in the household and person 3 leaves the household, person 4 remains in position 4 in the roster for all rounds. Similarly, if the last person on the roster leaves the household and a new person subsequently joins the household, that new household member is assigned to the position below that of the person who left (for example, if person 6 is the last person on the roster and leaves the household, a new person joining the household would be assigned to position 7).
If there is no parent interview completed in a given round, then the roster items for that round are assigned a value of system missing. Beginning in round 4, if a person has left the household (e.g., P4CUR_# = 2, not a current household member), the roster variables for that position are assigned a value of -1 for that round and subsequent rounds in which a parent interview is completed.
In rare cases, only in rounds 4 and 6, there are roster positions for which all values are system missing or -1 across all rounds but P4CUR_# = 2 or P6CUR_# = 2 (not a current household member). This may occur because a new household member was the respondent for round 3 or 5, when there was no roster completion or confirmation in the parent interview, and that person had left the household before the next parent interview in which complete household composition information was collected.18
Determining household membership in a given round. In round 1, respondents were not asked if persons were currently household members, because that was the first household enumeration for the study and all enumerated persons were household members at that time. For rounds 2, 4, 6, 7, and 8 analysts can determine the current household membership at the time of the parent interview for the round by examining the variables P2CUR_#, P4CUR_#, P6CUR_#, P7CUR_#, and P8CUR_#, respectively. Analysts should not look for the first “empty” position in the roster series to determine the last person with roster data in the household, since, as noted above, all persons retain their household positions permanently; if person 3 leaves the household, then person 4 still remains in position 4. 17 In round 2, variables identifying in which round a person was first enumerated as a household member and in which round a person was identified as having left the household were set in the CAPI parent interview and included in the base-year data file. For later rounds, analysts can compare the P*CUR_# variables (person is currently a household member) from different rounds, where * is the round number and # is the person number, to determine in which round a person was first enumerated as a household member and in which round a person was identified as having left the household. 18 Because there was not a household roster in the fall 2011 or fall 2012 parent interviews, there are potentially other household members who were present in the fall of 2011 or the fall of 2012 and had left the household by the time of the subsequent parent interviews. There would be no record of these household members in the study.

7-31
7.5.2.3 Parent Identifiers and Type in the Household (X8IDP1, X8IDP2, X8HPAR1, X8HPAR2, X8HPARNT)
X8IDP1 and X8IDP2 indicate the positions in the household roster of the sampled child’s residential parent/parent figure(s) in the spring of 2015.19 The construction of parent identifiers and the household composition variables from the parent interview data was a multistep process. First, it was determined from household roster variables whether there was a mother (biological, adoptive, step-, or foster) and/or a father (biological, adoptive, step-, or foster) in the household. Using this information, the method described below was used to create X8IDP1 and X8IDP2 for spring 2015.
1. If there was only one mother (of any type, including unknown type) and only one father (of any type, including unknown type) in the household, the mother was identified as parent 1 (X8IDP1) and the father was identified as parent 2 (X8IDP2).
2. If there was only one mother (of any type, including unknown type) in the household and no other parent figure (of any type), the mother was identified as parent 1 and parent 2 is coded -1 (not applicable). If there was a mother and she had a male spouse/partner in the household who was not identified as a father (of any type, including unknown type), the spouse/partner was identified as parent 2.
3. If there was only one father (of any type, including unknown type) in the household and no other parent figure (of any type), the father was identified as parent 1 and parent 2 is coded -1 (not applicable). If there was a father and he had a female spouse/partner in the household who was not identified as a mother (of any type), the spouse/partner was identified as parent 1 and the father was identified as parent 2.
4. If there were two mothers (or a mother and female spouse/partner) in the household, an order of preference was used to identify one mother to be parent 1, with the order specified as biological, adoptive, step-, foster mother or female guardian, then other female parent or guardian.20 The other mother was identified as parent 2. If there were two mothers of the same type (e.g., two adoptive mothers) or there were two mothers and the type for both was -7 (refused) or -8 (don’t know), the mother with the lowest household roster number was identified as parent 1 and the other mother was identified as parent 2.
5. If there were two fathers in the household (or a father and male spouse/partner), an order of preference was used to identify one father to be parent 1, with the order specified as biological, adoptive, step-, foster father or male guardian, then other male parent or guardian. The other father was identified as parent 2. If there were two fathers of the same type (e.g., two adoptive fathers) or there were two fathers and the type for both was -7 (refused) or -8 (don’t know),
19 In the ECLS-K, the parent identifiers were P*MOMID and P*DADID and specifically identified the mother/female guardian and father/male guardians, respectively, in the household. The format of the parent identifiers was changed in the ECLS-K:2011 to allow for more accurate identification of households with two mothers/female guardians or two fathers/male guardians. 20 There were new categories in the ECLS-K:2011 parent interview for “Other female parent or guardian” in FSQ140 and “Other male parent or guardian” in FSQ150 that were not included in the ECLS-K.

7-32
the father with the lowest household roster number was identified as parent 1 and the other father was identified as parent 2.
6. If there was no one in the household identified as a mother or father, then a female respondent or the female spouse or partner of a male respondent was identified as parent 1. If the female parent figure had a male spouse or partner, the spouse/partner was identified as parent 2. If the respondent was male and had a female spouse or partner, she was designated as parent 1 and he was designated as parent 2. For example, if a child lived with his grandmother (the respondent) and grandfather, and neither his mother nor father lived in the household, then the grandmother was identified as parent 1 and the grandfather was identified as parent 2. If the grandfather lived in the household, but no grandmother or parents lived there, the grandfather respondent would be parent 1 and parent 2 would be coded -1. Demographic information such as age, race, and education was collected for these “parent figures.”
Once parents/parent figures were identified, X8HPAR1 and X8HPAR2 were created to identify the specific relationship of parent 1 and parent 2 to the study child.21 It should be noted, however, that for households in which the child lived with parent figures other than his or her mother and/or father, the parent figures identified in X8IDP1 and X8IDP2 were not defined as parents (meaning biological, step-, adoptive, or foster) for the construction of X8HPAR1 and X8HPAR2. For example, if there was a grandmother and grandfather and there were no parents listed in the household, X8HPAR1 and X8HPAR2 would be coded as category 15 (no resident parent).
X8HPARNT indicates the type(s) of parents living in the household with the study child. The values for the X8HPARNT composite are as follows:
1 = two biological/adoptive parents;
2 = one biological/adoptive parent and one other parent/partner;
3 = one biological/adoptive parent only; and
4 = one or more related or unrelated guardian(s).
When study children are living with parent figures (e.g., grandmother and grandfather), rather than biological, adoptive, step-, or foster parents, X8HPARNT is coded 4.
The composite parent identifier variables X8IDP1 and X8IDP2 are used to determine which composite variables correspond to parent 1 and parent 2, respectively. These “pointer” variables indicate the household roster number of the person who was the subject of the questions being asked. All parent composite variables that include “PAR” and the number 1 in the variable name are associated with the person designated in X8IDP1, who is parent 1. All parent composite variables that include “PAR” and the
21 These variables are a combination of P*HMOM and P*HDAD from the ECLS-K.

7-33
number 2 in the variable name are associated with the person designated in X8IDP2, who is parent 2. In the spring 2015 parent interview, there are two sets of questions that were first asked about parent 1 and then asked about parent 2 if the household contained two parents.
The first set of questions about parent 1 and parent 2 were about parent education. For parent education, there is also a second set of “pointer” variables that hold the household roster number of the person who was the subject of the education questions (P8PEQHH1 and P8PEQHH2). For the education questions, the pointer variables are applicable to up to two parents in the household. If there are two parents in the household, P8PEQHH1 and P8PEQHH2 are the roster numbers of the first and second parent, respectively. If there is only one parent in the household, P8PEQHH1 is the roster number of the first parent and P8PEQHH2 = -1 (not applicable). Since the parent education questions were asked only of parent(s) or parent figure(s) in the household, the value of parent education pointer variables is the same as the value for the composite parent identifier variables.
The second set of questions about parent 1 and parent 2 asks about parent employment. There is also a set of “pointer” variables that hold the household roster number of the person who was the subject of the employment questions (P8EMPP1 and P8EMPP2). For the employment questions, the pointer variables are applicable to up to two parents in the household. If there are two parents in the household, P8EMPP1 and P8EMPP2 are the roster numbers of the first and second parent, respectively. If there is one parent in the household, P8EMPP1 is the roster number of the first parent and P8EMPP2 = -1 (not applicable). The value of employment pointer variables is the same as the value for the composite parent identifier variables.
To illustrate how the pointer variables work, suppose there is a household with both a mother and a father who were listed as the third and fourth individuals in the household roster. According to the rules outlined above, household member #3, the mother, becomes parent 1 and X8IDP1 equals 3. All applicable pointer variables for parent 1 will subsequently take on the value 3. Similarly, household member #4, the father, becomes parent 2 and X8IDP2 equals 4. All applicable pointer variables for parent 2 will subsequently take on the value 4.
Table 7-1 identifies the PEQ and EMQ section pointer variables included in the data file along with the interview items and variables associated with those pointer variables. The pointer variables are necessary to determine which parent should be assigned the answers to items about employment. Returning to the example above, the answers to the employment questions for the mother are stored in variables that end with the suffix “1” since the mother was identified as parent 1, and her household roster number is the value in X8IDP1. For example, P8EMPSIT1_I and P8EVRACTV1 indicate the mother’s current employment situation and whether the mother has been on active duty in the military since the child was born, respectively. The answers to the employment questions for the father are stored in variables that end with the suffix “2” since the father was identified as parent 2, and his household roster number is the value in X8IDP2. For example, P8EMPSIT2_I and P8EVRACTV2 indicate the father’s current employment

7-34
situation and whether the father has been on active duty in the military since the child was born, respectively.
Table 7-1. Pointers to parent figure questions
Person pointer Variable names and labels P8PLQHH1 P8 PLQ083-090
HH PERSON POINTER 1
P8RES_1 P8 PLQ083 PERSON 1 LANGUAGE TO CHILD
P8CHL_1 P8 PLQ090 CHILD’S LANGUAGE TO PERSON 1
P8PLQHH2 P8 PLQ083-090 HH PERSON POINTER 2
P8RES_2 P8 PLQ083 PERSON 2 LANGUAGE TO CHILD
P8CHL_2 P8 PLQ090 CHILD’S LANGUAGE TO PERSON 2
P8PEQHH1 P8 PEQ020–021 PERSON 1 ROSTER NUMBER
P8HIG_1 P8 PEQ020 PERS 1 HIGHEST EDUCATION LEVEL
IFP8HIG_1 P8 IMPUTATION FLAG FOR P8HIG_1_I
P8HIS_1 P8 PEQ021 IF PERS 1 HIGH SCHOOL DIPLOMA/GED
IFP8HIS_1 P8 IMPUTATION FLAG FOR P8HIS_1_I P8PEQHH2 P8 PEQ020–021
PERSON 2 ROSTER NUMBER
P8HIG_2 P8 PEQ020 PERS 2 HIGHEST EDUCATION LEVEL
IFP8HIG_2 P8 IMPUTATION FLAG FOR P8HIG_2_I
P8HIS_2 P8 PEQ021 IF PERS 2 HIGH SCHOOL DIPLOMA/GED
IFP8HIS_2 P8 IMPUTATION FLAG FOR P8HIS_2_I P8EMPP1 P8 EMQ200-215
PERSON 1 ROSTER NUMBER
P8EMPSIT1 P8 EMQ200 PERS 1 CURR EMPLMT SITUATN
P8EVRACTV1 P8 EMQ210 PERS 1 SERVED ACTIVE DUTY
P8CURACTV1 P8 EMQ215 PERS 1 CURR ON ACTIVE DUTY
P8EMPP2 P8 EMQ200-215 PERSON 2 ROSTER NUMBER
P8EMPSIT2 P8 EMQ200 PERS 2 CURR EMPLMT SITUATN
P8EVRACTV2 P8 EMQ210 PERS 2 SERVED ACTIVE DUTY
P8CURACTV2 P8 EMQ215 PERS 2 CURR ON ACTIVE DUTY
SOURCE: U.S. Department of Education, National Center for Education Statistics, Early Childhood Longitudinal Study, Kindergarten Class of 2010–11 (ECLS-K:2011), kindergarten–fourth grade restricted-use data file.
7-35
7.5.2.4 Parent Demographic Variables (X8PAR1AGE, X8PAR2AGE, X8PAR1RAC, X8PAR2RAC)
X8PAR1AGE is a composite variable for the age of parent 1 from the household roster (the person whose roster number is indicated in X8IDP1) and X8PAR2AGE is the composite variable for the age of parent 2 from the household roster (the person whose roster number is indicated in X8IDP2).22 The ages of all household members (other than the child) who had their ages collected in the fall of 2010 or spring of 2011 were automatically incremented by four years for the spring 2015 parent interview. Age was incremented by 3 years for household members who were living in the household in the spring of 2012 and had age information collected in that interview but who were not in the household in the fall of 2010 or the spring of 2011. Age was incremented by 2 years for household members who were living in the household in the spring of 2013 and had age information collected in that interview but who were not in the household in the fall of 2010, the spring of 2011, or the spring of 2012. Age was incremented by one year for household members who were living in the household in the spring of 2014 and had age information collected in that interview but who were not in the household in the fall of 2010, the spring of 2011, the spring of 2012, or the spring of 2013. For information about how the first and second parents were selected for these and other parent variables, see section 7.5.2.3 above.
The composite variables for race/ethnicity for the parent/guardians were derived in the same way as those for the child, except that there are no variables that supplement parent-reported race/ethnicity with FMS data as was done for children. All data on parent race/ethnicity come from the parent interview. Race/ethnicity information collected for parents in the spring 2015 parent interview is provided in the data file in categorical race/ethnicity composites (X8PAR1RAC for parent 1 in the household, the person whose roster number is indicated in X8IDP1, and X8PAR2RAC for parent 2, the person whose roster number is indicated in X8IDP2). Race and ethnicity information was collected only once for each parent/guardian. If race and ethnicity information was collected in the fall of 2010, spring of 2011, spring of 2012, spring of 2013, or spring of 2014, it was not collected again in the spring of 2015. The questions about race and ethnicity were only asked in the spring 2015 parent interview to collect this information for parents/guardians who were new to the household in that round or when this information was missing for parents/guardians who lived in the household at the time of the spring 2015 interview.
Respondents were allowed to indicate that they, and the other parent figure when applicable, were Hispanic or Latino, and whether they belonged to one or more of the five race categories (White, Black or African American, American Indian or Alaska Native, Asian, Native Hawaiian or other Pacific
22 These variables are a combination of P*HDAGE and P*HMAGE in the ECLS-K.
7-36
Islander).23 From these responses, a person’s race/ethnicity was classified into eight mutually exclusive categories. A person’s race/ethnicity was classified as “more than one race, non-Hispanic” if more than one race was specified and the answer to the question about being Hispanic or Latino was 2 (no). A person’s race/ethnicity was classified as “Hispanic, race specified” if the answer to the question about being Hispanic or Latino was 1 (yes) and at least one race was indicated in the question about race. If a person was Hispanic or Latino, but a race was not indicated, that person’s race/ethnicity was classified as “Hispanic, no race specified.” The remaining race/ethnicity categories (White, non-Hispanic; Black or African-American, non-Hispanic; Asian, non-Hispanic; Native Hawaiian or Other Pacific Islander, non-Hispanic; and American Indian or Alaska Native, non-Hispanic) were coded according to the person’s reported race when the person was not Hispanic or Latino. If the answer to the question about being Hispanic or Latino was -7, -8, or -9 (refused, don’t know, or not ascertained, respectively), or if the person was not Hispanic/Latino and the answer to the question about race was -7, -8, or -9 (refused, don’t know, or not ascertained, respectively), race/ethnicity was coded -9 (not ascertained).
Parent race/ethnicity was obtained for all parents/guardians and spouses of respondent parents/guardians but may or may not have been collected for a parent’s boyfriend or girlfriend. For example, in a household with a birth mother and stepfather, the race/ethnicity of both parents was obtained. However, in a household with a birth mother and her boyfriend, the race/ethnicity of the mother was obtained but the race/ethnicity of the boyfriend was not unless he was the respondent.24
7.5.2.5 Household Income and Poverty (X8INCCAT_I, X8POVTY_I)
Household income data were collected in the spring 2015 parent interview. Parents were asked to report income by broad range ($25,000 or less or more than $25,000) and by detailed range as shown in table 7-2.25 The composite X8INCCAT_I was created using the detailed income range information. X8INCCAT_I was set to the value of P8INCLOW_I (detailed income range for those who reported the broad income range in P8HILOW_I as $25,000 or less) or P8INCHIG (detailed income range for those who reported the broad income range in P6HILOW_I as more than $25,000). When data for the broad range
23 Unlike the ECLS-K, in the ECLS-K:2011 “other” was not a permitted response for the race question. 24 In the spring of 2015, race/ethnicity information was collected for some persons who did not meet the criteria for having race and ethnicity questions asked in the spring of 2015 but did meet the criteria for having race and ethnicity collected in an earlier round of the study. Persons who have race and ethnicity on the file for spring 2015 include the study child, those with a relationship of mother/female guardian or father/male guardian in any round (P*REL_* = 1 or 2 or P*UNR = 3 or 4), those who were a respondent in any round (P*PER_* = 1), and persons who were spouse/partners of respondent parents in any round. 25 Starting at category 9 of the detailed income range, the categories for the income variable in the ECLS-K:2011 are different from those used in the ECLS-K. More narrow ranges of income were used at higher income levels in the ECLS-K:2011 in order to determine whether household income was near 200 percent of the federal poverty threshold given household size. If so, follow-up questions about exact income were asked.

7-37
variable (P8HILOW_I) or one of the detailed range variables (P8INCLOW_I, P8INCHIG_I) were missing (i.e., coded -7 (refused), -8 (don’t know), or -9 (not ascertained)), income information was imputed.
Table 7-3 shows the amount of missing data for household income. If the parent figures in the household were the same at the time of the spring 2015 parent interview as at the time of the spring 2014 parent interview, income reported in the spring of 2014 was used for longitudinal imputation. If spring 2014 income was not available, but spring 2013 income was available and the parent figures were the same in 2015 as in 2013, then income reported in the spring of 2013 was carried forward to 2015. If spring 2013 income was not available, but spring 2012 income was available and the parent figures were the same in 2015 as in 2012, then income reported in the spring of 2012 was carried forward to 2015. If spring 2012 income was not available, but spring 2011 income was available and the parent figures were the same in 2015 as in 2011, then income reported in the spring of 2011 was carried forward to 2015.26
Table 7-2. Detailed income range categories used in the parent interview: Spring 2015
Detailed income range Total household income 1 $5,000 or less 2 $5,001 to $10,000 3 $10,001 to $15,000 4 $15,001 to $20,000 5 $20,001 to $25,000 6 $25,001 to $30,000 7 $30,001 to $35,000 8 $35,001 to $40,000 9 $40,001 to $45,000 10 $45,001 to $50,000 11 $50,001 to $55,000 12 $55,001 to $60,000 13 $60,001 to $65,000 14 $65,001 to $70,000 15 $70,001 to $75,000 16 $75,001 to $100,000 17 $100,001 to $200,000 18 $200,001 or more
SOURCE: U.S. Department of Education, National Center for Education Statistics, Early Childhood Longitudinal Study, Kindergarten Class of 2010–11 (ECLS-K:2011), spring 2015.
Where longitudinal imputation was not possible, missing values were imputed using the hot deck method in which similar respondents and nonrespondents are grouped or assigned to “imputation cells,” and a respondent’s value is randomly “donated” to a nonrespondent within the same cell. Cells are defined by characteristics such as geographic region, school locale, school type, household type, age, race,
26 No adjustment was made for inflation when household income was longitudinally imputed from a prior round.

7-38
education, and income. When information used to define the imputation cells was missing for any of these variables in spring 2015, information was used from a prior round, where available. Imputation flag values for IFP8HILOW, IFP8INCLOW, and IFP8INCHIG identify cases for which longitudinal or hot deck imputation was conducted. There are no separate imputation flags for X8INCCAT_I and X8POVTY_I; imputation was done only in the source variables P8HILOW, P8INCLOW, and P8INCHIG, and is reflected in the imputation flags for those variables.
Table 7-3. Missing data for household income: Spring 2015
Variable Number missing Percent Detailed income range 1,557 14.6
SOURCE: U.S. Department of Education, National Center for Education Statistics, Early Childhood Longitudinal Study, Kindergarten Class of 2010–11 (ECLS-K:2011), kindergarten-fourth grade (K-4) restricted-use data file, spring 2015.
Reported income was used to determine household poverty status in the spring of 2015, which is provided in variable X8POVTY_I. For some households, more detailed information about household income than the ranges described above was collected. Specifically, when parent respondents reported a detailed household income range suggesting the household income was close to or lower than 200 percent of the U.S. Census Bureau poverty threshold for a household of its size, the respondents were asked to report household income to the nearest $1,000 (referred to as exact income) in order to determine household poverty status more accurately. Table 7-4 shows the reported detailed income categories for households of a given size for which respondents were asked the exact income question. For example, a respondent in a household with two people would have been asked to provide an exact income if the respondent had indicated that the household income was less than or equal to $35,000. Table 7-4 also shows how the income categories compare to the value that is 200 percent of the weighted average 2014 poverty threshold.27 The 2014 weighted poverty thresholds were used for the poverty composite because respondents in the spring of 2015 were asked about household income in the past year.
27 The CAPI program used to conduct the parent interview was programmed to only ask for exact income when parent respondents reported a detailed household income range suggesting the household income was close to or lower than 200 percent of the U.S. Census Bureau poverty threshold for a household of its size. Although the parent interview in which this information was collected was conducted in the spring of 2015, the 2013 poverty thresholds were used for instrument programming because they were the most recent thresholds available when programming was done. The question about exact income was asked for the following conditions: (NUMBER IN HH = 1 AND PAQ.110 < 6) OR (NUMBER IN HH = 2 AND PAQ.110 < 8) OR (NUMBER IN HH = 3 AND PAQ.110 < 9) OR (NUMBER IN HH = 4 AND PAQ.110 < 11) OR (NUMBER IN HH = 5 AND PAQ.110 < 13) OR (NUMBER IN HH = 6 AND PAQ.110 < 14) OR (NUMBER IN HH = 7 AND PAQ.110 < 16) OR (NUMBER IN HH = 8 AND PAQ.110 < 17) OR (NUMBER IN HH is greater than or equal to 9 AND PAQ.110 < 17)).

7-39
Table 7-4. Criteria for reporting income to the nearest $1,000 in the spring parent interview and 2014 thresholds for 200 percent of poverty: Spring 2015
Household size ECLS-K:2011 parent interview
income categories 200 percent of weighted average
thresholds for 20141, 2 Two Less than or equal to $35,000 $30,758 or less Three Less than or equal to $40,000 $37,700 or less Four Less than or equal to $50,000 $48,460 or less Five Less than or equal to $60,000 $57,390 or less Six Less than or equal to $65,000 $64,946 or less Seven Less than or equal to $75,000 $73,854 or less Eight Less than or equal to $100,000 $81,936 or less Nine or more Less than or equal to $100,000 $98,042 or less
1 U.S. Census Bureau, Current Population Survey. Poverty Thresholds for 2014 by Size of Family and Number of Related Children Under 18 Years Old, retrieved October 8, 2015 from https://www.census.gov/data/tables/time-series/demo/income-poverty/historical-poverty-thresholds.html
.
2 The 2014 weighted poverty thresholds were used for the poverty composite because respondents in the spring of 2015 were asked about household income in the past year. At the time that the spring 2015 parent interview was finalized, the most updated poverty thresholds available were the weighted 2013 poverty thresholds. Poverty thresholds for 2014 were similar to the poverty thresholds for 2013 and the income categories used in the parent interview were appropriate for the 2014 estimates. SOURCE: U.S. Department of Education, National Center for Education Statistics, Early Childhood Longitudinal Study, Kindergarten Class of 2010–11 (ECLS-K:2011), spring 2015.
When information about exact household income was available (P8TINCTH_I), it was used
in conjunction with household size (X8HTOTAL) to calculate the poverty composite. When exact income was not available because the exact income question was not asked, the midpoint of the detailed income category (X8INCCAT_I) was used in conjunction with household size (X8HTOTAL).28
Household poverty status in the spring of 2015 was determined by comparing total household
income reported in the parent interview to the weighted 2014 poverty thresholds from the U.S. Census Bureau (shown in table 7-5), which vary by household size. Although the parent interview was conducted in the spring of 2015, the 2014 weighted poverty thresholds were used in the derivation of the poverty composite because respondents were asked about household income in the past year. Exact income (P8TINCTH_I) was asked in the parent interview or imputed for all persons in categories 1 and 2 of the poverty composite. Imputation of exact income was conducted according to thresholds in the parent interview. Households with an exact income that fell below the appropriate threshold were classified as category 1, “below the poverty threshold,” in the composite variable. Households with an exact income that was at or above the poverty threshold but below 200 percent of the poverty threshold were classified as category 2, “at or above the poverty threshold, but below 200 percent of the poverty threshold,” in the composite variable. Households with a total income (either exact or the income representing the midpoint of the detailed range reported by the composite) that was at or above 200 percent of the poverty threshold
28 Because exact income information was not collected from all parents, the ECLS-K:2011 provides an approximate but not exact measure of poverty.

7-40
were classified as category 3, “at or above 200 percent of the poverty threshold,” in the composite variable.29 For example, if a household contained two members and the household income was lower than $15,379, the household was considered to be below the poverty threshold and would have a value of 1 for the composite. If a household with two members had an income of $15,379 or more, but less than $30,758 (200 percent of the poverty threshold for a household of two), the composite would have a value of 2. If a household with two members had an income of $30,758 or more, the composite would have a value of 3. Table 7-5. ECLS-K:2011 poverty composite and 2014 census poverty thresholds: Spring 2015
Household size poverty threshold
Census weighted average poverty thresholds for
2014 (X8POVTY_I = 1)1
100 percent to less than 200 percent of census weighted
average poverty thresholds for 2014 (X8POVTY_I = 2)1
Census weighted average thresholds for poverty 20141
Two Less than $15,379 $15,379 to less than $30,758 $15,379 Three Less than $18,850 $18,850 to less than $37,700 $18,850 Four Less than $24,230 $24,230 to less than $48,460 $24,230 Five Less than $28,696 $28,695 to less than $57,390 $28,695 Six Less than $32,473 $32,473 to less than $64,946 $32,473 Seven Less than $36,927 $36,927 to less than $73,854 $36,927 Eight Less than $40,968 $40,968 to less than $81,936 $40,968 Nine or more Less than $49,021 $49,021 to less than $98,042 $49,021
1 U.S. Census Bureau, Current Population Survey. Poverty Thresholds for 2014 by Size of Family and Number of Related Children Under 18 Years Old, retrieved 10/8/2015 from https://www.census.gov/data/tables/time-series/demo/income-poverty/historical-poverty-thresholds.html. SOURCE: U.S. Department of Education, National Center for Education Statistics, Early Childhood Longitudinal Study, Kindergarten Class of 2010–11 (ECLS-K:2011), spring 2015.
7.5.2.6 Creation of a Socioeconomic Status Variable
In the base year of the study and the spring of 2012, a composite variable for socioeconomic status (SES) was created that combined occupation prestige scores, income, and education. The composite for socioeconomic status was not created in the spring of 2013, 2014, or 2015 because not all data for the composite were collected (in spring 2013, parents were not asked for education information; in spring 2014 and 2015, parents were not asked for occupation information). Users who wish to create their own SES composite may take the spring 2015 education data for a case (X8PAR1ED_I and X8PAR2ED_I) and combine those data with spring 2015 household income (X8INCCAT_I) and spring 2013 variables for parent occupational prestige scores (X6PAR1SCR_I and X6PAR2SCR_I). The values of each SES component can then be normalized as z scores so that the component has a mean of 0 and a standard
29 In the ECLS-K:2011, there are three categories in the poverty composite rather than two categories for “below poverty threshold” and “at or above poverty threshold” as there were in the ECLS-K. The ECLS-K:2011 categories 2 and 3 can be combined to create a poverty composite variable comparable to the ECLS-K poverty composite variable.

7-41
deviation of 1. In this normalization step, -1 (not applicable) values would be treated as missing. For the h-th SES component, a z score zhi for the i-th household may be computed as
( )w
whihi xsd
xxz −=
,
where hix is the value of the h-th SES component for the i-th household; wx is the weighted mean of hix ; and ( )wxsd is the standard deviation of wx . Note that where h is household income, hix is the natural log of
the midpoint of the detailed income range. The weight used to compute the z score would be the spring 2015 child base weight. The spring 2015 base weight, W8CI0, should be merged by CHILDID into the data file from file K3BASEWTS in appendix D of the ECB. The SES variable for the i-th household would then be computed as
m
zSES
m
hhi
i
∑= =1
,
where m is the number of components. Note that for households with only one parent present and for parents who were retired or not currently in the labor force, not all the components would be defined. In these cases, the SES would be the average of the z scores of the available components.
7.5.2.7 Respondent ID and Relationship to Focal Child (X8RESID, X8RESREL2)
The respondent to the parent interview was a person identified as the household member who knew the most about the child’s care, education, and health. X8RESID indicates the household roster number of the spring 2015 parent interview respondent. The relationship variables (P8REL_1-P8REL_25, P8MOM_1-P8MOM_25, P8DAD_1-P8DAD_25, and P8UNR_1-P8UNR_25) associated with the respondent’s household roster number were used to code X8RESREL2. If the respondent was a biological mother or father, X8RESREL2 is coded as 1 (biological mother) or 4 (biological father), respectively. If the respondent was an adoptive, step-, or foster mother or father, or other female or male guardian, X8RESREL2 is coded as 2 (other mother type) or 5 (other father type), respectively. If the respondent was a mother or father but the type of mother (P8MOM_#) or father (P8DAD_#) was coded as -7 (refused), -8 (don’t know), or -9 (not ascertained), X8RESREL2 is coded as 3 (mother of unknown type) or 6 (father of

7-42
unknown type).30 If the respondent was a grandparent, aunt, uncle, cousin, sibling, or other relative, X8RESREL2 is coded as 7 (nonparent relative). If the respondent was a girlfriend or boyfriend of the child’s parent or guardian; a daughter or son of the child’s parent’s partner; other relative of the child’s parent’s partner; or another nonrelative, X8RESREL2 is coded as 8 (nonrelative). Otherwise, X8RESREL2 is coded as -9 (not ascertained). Because the interviewer initially asked to speak with the previous round respondent at the beginning of the spring 2015 parent interview, the respondent for previous interviews (X*RESID) was the same person for many cases.
7.5.2.8 Food Security Status
The food security status of the children’s household was determined by responses to the 10 food security questions (P8WORRFD through P8NOTEA2) asked in section FDQ of the spring 2015 parent interview. The questions measured the households’ experiences related to food insecurity and reduced food intake in the last 12 months. In spring 2011 and spring 2012, questions were asked about adults’ experiences separately from the experiences of the children in the household. In spring 2014 and 2015, to reduce respondent burden, a shorter 10-item version of this measure suggested by the United States Department of Agriculture (USDA) was used to measure adult food security. The adult food security measure can be used to predict child food security. The adult data were combined into scales using statistical methods based on the Rasch measurement model. The food security questions were developed by academic researchers using ethnographic and case-study methods with low-income women and families to identify natural language used to describe their situations and behaviors when they had difficulty obtaining enough food. The scales derived from the food security questions were validated using statistical methods based on item response theory and by comparing measured food security with other indicators of food adequacy. Composites were created that indicate the food security status of the adults (based on 10 household- and adult-referenced items).
When interpreting food security statistics, users should keep in mind that food security status
is a household-level characteristic. In most households classified as having very low food security, the children in the household were not food insecure at that level of severity. Young children in U.S. households are generally protected from disrupted diets and reduced food intake to a greater extent than are older children or adults in the same households (Nord and Hopwood 2007). Calculations of the scales indicating household adult food security were carried out in accordance with the standard methods described in Guide to Measuring Household Food Security, Revised 2000 (U.S. Department of Agriculture 2000). Analysis of 30 Categories for mothers and fathers of unknown type were new for the spring 2012 composite. Mothers and fathers of unknown type were included in the categories “other mother type” and “other father type” for the fall 2010 and spring 2011 composites, X1RESREL and X2RESREL.

7-43
the ECLS-K:2011 data using statistical methods based on the Rasch measurement model found that item severity parameters in the ECLS-K:2011 data were near enough to the standards benchmarked by the Current Population Survey Food Security Supplement that it was appropriate to use the standard benchmark household scores, which are based on the latter data source.
7.5.2.8.1 Food Security Status: Raw Scores (X8FSADRA2)
X8FSADRA2 is the adult food security raw score, which is a simple count of the number of household- and adult-referenced food security items affirmed by the parent, and ranges from 0 to 10. It is an ordinal-level measure of food insecurity. It can be used in analyses as an ordinal measure of food insecurity or to identify more severe or less severe categories of food insecurity than those identified in the categorical food security variables described in section 7.5.2.8.3. The raw score is ordinal, not interval, so it should not be used when a linear measure is required, such as for calculation of a mean. Responses to items skipped because of screening are assumed to be negative for the purpose of creating the score. For cases that have some missing data but at least some valid responses, missing responses were considered to be negatives. Cases with no valid responses to any of the 10 food security items, or those with all -7 (refused) or -8 (don’t know) answers to P8WORRFD, P8FDLAST, and P8BLMEAL, are coded as missing -9 (not ascertained). Definitions for negative and affirmed values of food security items are shown in exhibit 7-4.

7-44
Exhibit 7-4. Definitions of negative and affirmed values for the food security items in the ECLS-K:2011 kindergarten–fourth grade restricted-use data file
Question number Negative responses (coded 0) Affirmative responses (coded 1) FDQ130A 3 (never true) 1 (often true); or 2 (sometimes true) FDQ130B 3 (never true) 1 (often true); or 2 (sometimes true) FDQ130C 3 (never true) 1 (often true); or 2 (sometimes true) FDQ140 2 (no); or screened out in
previous questions 1 (yes)
FDQ150 3 (only 1 or 2 months); FDQ140 = 2; or screened out in previous questions
1 (almost every month); or 2 (some months, but not every month)
FDQ160 2 (no); or screened out in previous questions
1 (yes)
FDQ170 2 (no); or screened out in previous questions
1 (yes)
FDQ180 2 (no); or screened out in previous questions
1 (yes)
FDQ190 2 (no); or screened out in previous questions
1 (yes)
FDQ191 3 (only 1 or 2 months); FDQ190 = 2; or screened out in previous questions
1 (almost every month); or 2 (some months, but not every month)
SOURCE: U.S. Department of Education, National Center for Education Statistics, Early Childhood Longitudinal Study, Kindergarten Class of 2010-11 (ECLS-K:2011), kindergarten-fourth grade (K-4) restricted-use data file.
7.5.2.8.2 Food Security Status: Continuous Measures (X8FSADSC2)
X8FSADSC2 is the adult food security scale score. This is a measure of the severity of food insecurity experienced by adults in the household in the previous 12 months. It is a continuous, interval level measure based on the Rasch measurement model and is appropriate for linear models, such as correlation, regression, or analysis of variance. It is on the standard (logistic-unit) metric described in Guide to Measuring Household Food Security, Revised 2000 (U.S. Department of Agriculture 2000) (for households without children). Valid values range from 1.7 to 11.1, with higher values indicating more severe food deprivation. The scale score is undefined for households that affirmed no adult-referenced items and is coded -6. Under Rasch-model assumptions, the scale score for households that affirm no items (raw score = 0) is undefined. It is less than the lowest measured value, but its precise value is unknown and may vary substantially among households. For such cases, X8FSADSC2 is assigned a value of -6. These households are food secure, but the appropriate size of the interval between their score and the score of households that affirmed one item is not known and varies from household to household. If these cases (a substantial majority of all cases) are included in linear models, appropriate methods must be used. For example, if the food security scale score is a dependent variable, a selection model such as Tobit may be

7-45
appropriate. If the food security scale score is a predictor variable, a value of 0 may be assigned to cases with a raw score of 0 and a dummy variable added to identify households with a raw score of 0.
7.5.2.8.3 Food Security Status: Categorical Measures (X8FSADST2)
X8FSADST2 is a categorical measure of adults’ food security status based on the household’s adult food security raw score, X8FSADRA2. X8FSADST2 identifies households as food secure (raw scores 0–2), having low food security among adults (raw scores 3–5), or having very low food security among adults (raw scores of 6 or more). Users may combine the latter two categories as indicating food insecurity among adults. This variable is appropriate for comparing percentages of households with food insecurity among adults and very low food security among adults across subpopulations.
7.5.3 Teacher Composite Variables
In addition to the teacher data flags discussed in section 7.4.3 above, there are several composite variables on the file that use data from teachers. For example, there are composite variables about the child’s closeness and conflict with the teacher (X8CLSNSS, X8CNFLCT). These two variables are described in chapter 3, along with other variables derived from teacher reports of children’s social skills and working memory. Other variables that use teacher data are about the child’s grade level (e.g., X8GRDLVL) and are discussed above in section 7.5.1 about the child composites.
7.5.4 School Composite Variables
Variables describing children’s school characteristics were constructed using data from the teacher, the school administrator, and the sample frame. Details on how these variables were created are provided below.
A change in approach to school composite variables was implemented starting in spring 2014 and this approach was also used in spring 2015. ECLS-K:2011 data were prioritized over school master file31 data in assigning values to school composites. As a result, data from the school administrator
31 The school master file was created for the ECLS-K:2011 from the Common Core of Data (CCD) for public schools, the Private School Universe Survey (PSS) for private schools, and other data sources. It was updated regularly as new files from those surveys became available.

7-46
questionnaire were used for the current round or the most recent available prior round before using current school master file data to assign composite values.
Because many children move from one school to another over the course of the study, the construction of school composites (e.g., school type) can be challenging when current-round data are missing or when items are not asked in the current round if the school submitted an SAQ in a prior round. Using the school value for a child from a prior round can be erroneous due to children moving. As a result, many school composites are constructed by combining data across years at the school level, calculating the composite value, and then assigning that value to participating children currently enrolled in the school.
7.5.4.1 School Type (X8SCTYP)
In the spring of 2015, the questionnaire given to administrators in schools that did not have previous round school data (SAQ-A) contained a question on school type that was used in the creation of the spring school type composite (X8SCTYP). The questionnaire given to administrators in schools that had provided school data in previous rounds (SAQ-B) did not contain the question used to create the school type composite; therefore, for these schools data from the school administrator questionnaire in spring 2013, spring 2012, or spring 2011 were used. School master file data were used if school responses were not available from any ECLS-K:2011 round.
X8SCTYP was created as follows when SAQ-A was given to school administrators: If question A5 in the SAQ-A (“Which of the following characterizes your school?”) was answered as “a regular public school (not including magnet school or school of choice)” (S8REGPSK); “a public magnet school” (S8MAGSKL); or “a charter school” (S8CHRSKL); the school was coded as “public.” If the question was answered as “a Catholic school” of any type (S8CATHOL, S8DIOCSK, S8PARSKL, or S8PRVORS), the school was coded as “Catholic.” If the question was answered as “other private school, religious affiliation” (S8OTHREL), the school was coded as “other religious.” Otherwise, if the question was answered as “private school, no religious affiliation” (S8OTNAIS, S8OTHRNO), then the school was coded as “other private.”
When questionnaire SAQ-B was given to school administrators, X8SCTYP was set based on school administrator questionnaire answers about school type provided in spring 2014, spring 2013, spring 2012, or spring 2011. If data about school type were missing from the SAQ-A for the current round or prior
7-47
rounds, information about school type from the school master file (which included FMS and frame data) was used to create X8SCTYP.32
Homeschooled children have a code of -1 (not applicable) on X8SCTYP.33 Children who changed schools and were not followed and children who were not located in the spring of 2015 have a code of -9 (not ascertained) for X8SCTYP. The variable X8SCTYP is set to system missing for children who were not participants in the spring 2015 round. In addition, nonparticipants have a value of 990000000 on the variable F8CCDLEA.
7.5.4.2 Public or Private School (X8PUBPRI)
X8PUBPRI is a broad indicator of school type with only two categories—public and private. X8PUBPRI, which is derived from the more detailed school type variable X8SCTYP described above, has valid values for the 12,915 cases that have either child assessment or parent interview data in round 8.
This composite was created as follows: X8PUBPRI is coded 1 (public) if school type indicated in X8SCTYP is 4 (public). X8PUBPRI is coded 2 (private) if school type indicated in X8SCTYP is 1, 2, or 3 (Catholic, other religious, or other private). If the school identification number for spring 2015 indicates that the child was homeschooled, then X8PUBPRI is coded -1 (not applicable). X8PUBPRI is coded -9 (not ascertained) if data on school type are not available in the spring 2015 school master file. X8PUBPRI is set to system missing for children who did not participate in round 8.
7.5.4.3 School Enrollment (X8ENRLS)
There is a composite variable in the data file (X8ENRLS) that indicates total school enrollment on October 1, 2014 (or the date nearest to that date for which the school administrator had data available). This total school enrollment composite was created using the school enrollment variable from the school administrator questionnaire (S8ANUMCH). If school administrator data on total school enrollment were missing for spring 2015, enrollment data were obtained from the most recent round of the study with nonmissing school administrator data about school enrollment. If those data were missing, information from the Private School Universe Survey (PSS) for private schools and from the Common Core of Data (CCD) 32 X8SCTYP and the round 7 version of the composite, X7SCTYP, are constructed differently than previous versions of the same composite. For example, for the round 6 version of the composite, X6SCTYP, if spring 2013 school administrator data were missing, previous round composite values for school type (X4PUBPRI, X2PUBPRI) were used. If those data were missing, data from the school master file were used. 33 These children were enrolled in a school at the time of sampling in the base year, but were homeschooled during the spring of 2015.

7-48
public school universe data for public schools were used.34 In all other cases the variable is coded -9 (not ascertained).
7.5.4.4 Percent Non-White Students in the School (X8RCETH)
The composite variable X8RCETH indicates the percentage of the student population that was not White in the spring of 2015.35 The composite is derived from a question in the school administrator questionnaire (question A8 in SAQ-A) that asked the number or percentage of students in the school who were the following race/ethnicities: Hispanic/Latino of any race; American Indian or Alaska Native, not Hispanic or Latino; Asian, not Hispanic or Latino; Black or African American, not Hispanic or Latino; Native Hawaiian or other Pacific Islander, not Hispanic or Latino; White, not Hispanic or Latino; or two or more races, not Hispanic or Latino. The composite was calculated by summing the percentages for all categories except White, not Hispanic or Latino.
School administrators were allowed to report their answers to the student racial/ethnic composition questions as either numbers or percentages. All answers provided as numbers were converted to percentages using the total enrollment variable S8TOTENR as the denominator before computing the composite variable.36 The sum of the calculated percentages for each race/ethnicity category was allowed to be within +/- 5 percent of 100 percent to allow for minor reporting errors of numbers that did not add to the reported total or percentages that did not add to 100 percent. In a few cases, this procedure resulted in a total sum of percentages that was slightly over 100 percent. Totals greater than 100 percent are top-coded to 100 percent.
34 X8ENRLS and the round 7 version of the composite, X7ENRLS, are constructed differently than previous versions of the same composite. For example, for the round 6 version of the composite, X6ENRLS, if spring 2013 school administrator data were missing, X6ENRLS was set using school master file data. If those data were missing, data from previous round composites (X4KENRLS, X2KENRLS) were used. 35 This variable was S*MINOR in the ECLS-K. In the ECLS-K:2011, there is a different variable factored into the composite that indicates the percentage of students classified as “two or more races, non-Hispanic or Latino” (S*MULTPT). 36 There were five recoding rules used for data with apparent errors: 1. If answers were reported as numbers and the total number of students in the school (S8TOTENR) was missing, the total from another question about total enrollment (Q2a S8ANUMCH) was used if the difference between the summed total of students in different race/ethnicity groups and the reported Q2a total was within +/-5 percent of 100 percent (95–105 percent). For example, if the number of students in each race/ethnicity group in the school added to 501 students, but the total number of students by race (S8TOTENR) was missing, and total enrollment from S8ANUMCH was 500 students, the sum of the number of students in the race/ethnicity categories (501) would be 100.2 percent of the value of 500 reported in S8ANUMCH. The value of 100.2 percent is within the 95-105 percent range of allowed errors, so S8ANUMCH is used as the denominator for calculating the percentage of students in each race/ethnicity category. 2. If the method of reporting was mixed (some as numbers, others as percentages), the race/ethnicity percentages were coded as -9 (not ascertained). 3. If percentages were recorded, with none of the above errors, and the summed total across categories was within +/-5 percent of 100 percent (95–105 percent) of the value in S8TOTENR, any race/ethnicity categories that the school administrator left blank were recoded to 0. 4. If the summed total of students in race/ethnicity categories was not +/-5 percent of 100 percent (95–105 percent) of the sum reported in S8TOTENR or not 95–105 percent of total enrollment from another question (Q2a S8ANUMCH), the individually reported percentages and numbers were made -9 (not ascertained). 5. If numbers were reported, with none of the above errors, and the summed total across categories was within +/- 5 percent of the reported total, any race/ethnicity categories that the school administrator left blank were recoded to 0.

7-49
A flag for each individual race/ethnicity variable indicating whether the school administrator reported the information as a number or a percent is included in the data file.37 Because the composite is calculated as a percent, these flags will not be needed by users unless they are interested in examining how answers were reported. If the flag (S8ASIAFL S8HISPFL, S8BLACFL, S8WHITFL, S8AIANFL, S8HAWPFL, and S8MULTFL) for each of the race/ethnicity variables (S8ASIAPT, S8HISPPT, S8BLACPT, S8WHITPT, S8AIANPT, S8HAWPPT, and S8MULTPT) is equal to 1, that indicates the information was reported by the school administrator as a percentage, or was reported as both a number and a percentage. If the flag (S8ASIAFL, S8HISPFL, S8BLACFL, S8WHITFL, S8AIANFL, S8HAWPFL, and S8MULTFL) for each of the race/ethnicity variables (S8ASIAPT, S8HISPPT, S8BLACPT, S8WHITPT, S8AIANPT, S8HAWPPT, and S8MULTPT) is equal to 2, that indicates the information was reported by the school administrator as a number.
In some cases, the composite could not be derived from the school administrator questionnaire responses because some data used to compute it were missing or the data collected from administrators appeared to be in error (e.g., if school administrators reported both numbers and percents that were not consistent with one another and it was unclear which data were correct). If the composite could not be derived from the spring 2015 data, the percentage of non-White students in the school was obtained from school administrator questionnaire responses from spring 2014, spring 2013, spring 2012, or spring 2011.38 If those data were also missing, the percentage of non-White students in the school was obtained from the CCD (for public schools) or the PSS (for private schools). If those data were also missing, X8RCETH is coded -9 (not ascertained). If the study child was homeschooled in the spring of 2015, X8RCETH is coded -1 (not applicable).
7.5.4.5 Highest and Lowest Grade at the School (X8LOWGRD, X8HIGGRD)
Composite variables indicate the lowest grade taught at the school (X8LOWGRD) and the highest grade taught at the school (X8HIGGRD). They are derived from information collected from the school administrator during the spring 2015 data collection (for administrators in schools for which no previous SAQ has been submitted, who received questionnaire SAQ-A) or from the spring of 2014, spring of 2013, spring of 2012, or the spring of 2011 (for administrators in schools for which an SAQ had previously been submitted and who received questionnaire SAQ-B). For administrators who submitted 37 In addition to flags for race/ethnicity variables, there is another flag that indicates whether school administrators reported average daily attendance as a number or percent. The flag is S8ADAFLG (average daily attendance reported as number or percent). If school administrators reported both a number and a percent, the flag is recorded as a percent. 38 X8RCETH and the round 7 version of the composite, X7RCETH, are constructed differently than previous versions of the same composite. For example, for the round 6 version of the composite, X6RCETH, if spring 2013 school administrator data were missing, X6RCETH was set using school frame data. If those data were missing, data from previous round composites (X4RCETH, X2KRCETH) were used.

7-50
questionnaire SAQ-A, X8LOWGRD and X8HIGGRD were created by first coding answers of “ungraded” in question A4 (“Mark all grade levels included in your school”) as category 15 (ungraded) and then coding the lowest grade in the school and the highest grade in the school, respectively. The grade level for children in transitional kindergarten, kindergarten, or pre-first grade is coded as category 2 (kindergarten). For schools whose administrators received questionnaire SAQ-B, or those who received questionnaire SAQ-A and had missing data for school grade levels, the composites X8HIGGRD and X8LOWGRD were set to the values reported in previous school administrator data in spring 2014, spring 2013, spring 2012, or spring 2011. Data from the school master file were used if information about the highest and lowest grade at the school was not collected in school administrator variables for any round.39
7.5.4.6 Students Eligible for Free or Reduced-Price School Meals (X8FRMEAL_I)
The composite variable X8FRMEAL_I indicates the percent of students in the school who were approved for free or reduced-price school meals (X8FRMEAL_I). This composite has valid values for the 12,915 cases that have either child assessment or parent interview data in round 8. This composite differs from the school meal composites created for the spring of 2011 and the spring of 2012 (X2FLCH2_I, X2RLCH2_I, X4FMEAL_I, and X4RMEAL_I) because the spring 2015 school administrator questionnaire, like the spring 2014 school administrator questionnaire, did not include questions on USDA program participation or the numbers of students eligible for free and reduced priced meals (breakfast or lunch) that were used as the sources of the composite variables for spring 2011 and spring 2012. However, in the spring of 2015 and in previous rounds of the study, school administrators were asked for the percentage of children eligible for free or reduced-price lunch. This question and several other sources of information were used to create X8FRMEAL_I. Specifically, X8FRMEAL_I is derived from the percentage of children eligible for free or reduced- price lunch reported by the school administrator during the spring 2015 data collection, or imputed if the item was missing from the SAQ, using information collected from school administrators in the spring of 2014, the spring of 2013, the spring of 2012, or the spring of 2011, frame variables or hot deck imputation.40
For schools where no SAQ was received for spring 2015 (and therefore SAQ missing values were not imputed), the composite was completed by assigning, in the following order, a value from prior
39 X8LOWGRD and X8HIGGRD, and the round 7 versions of the composites, X7LOWGRD and X7HIGGRD, are constructed differently than previous versions of the same composites. For example, for the round 6 versions of the composites, X6LOWGRD and X6HIGGRD, if spring 2013 school administrator data were missing, previous round composite (X4HIGGRD and X4LOWGRD; X2HIGGRD and X2LOWGRD) values were used to set the composites. If those data were missing, data from the school master file were used. 40 Both public schools and nonprofit private schools are eligible for the National School Lunch Program.

7-51
rounds of the study, the school master file, or hot deck imputation.41 X8FRMEAL_I, based on school administrator data about children eligible for free or reduced-price lunch, was imputed with information from previous rounds about students eligible for free or reduced-price meals because children are approved for free or reduced-price meals generally, not just for lunch. Children who were homeschooled have X8FRMEAL_I set to -1.
The percent of children reported by school administrators in spring 2015 to be eligible for free or reduced-price lunch (S8PCTFLN_I) was used as the first source of data for X8FRMEAL_I. There are 8 schools that appear to have reported a number of students rather than a percentage in S8PCTFLN_I; their values were retained for the composite and a flag (X8FRMEALFLG) can be used to identify them. S8PCTFLN_I was imputed for all cases that had child assessment or parent interview data in the spring 2015 round and a completed SAQ, but for which the administrator did not provide free and reduced-price lunch information. Table 7-6 shows the level of missing data for the school administrator variable for the percent of children who were eligible for free or reduced-price lunch (S8PCTFLN) among the schools that had at least one child or parent respondent in the spring 2015 data collection.
Table 7-6. Number and percent of public and private schools and study students with missing data for the percent of children in the school eligible for free or reduced-price lunch (S8PCTFLN): Spring 2015
School meal composite Number missing
Percent missing
Number of students in these schools
Percent of students with missing values
Percent eligible for free or reduced-price meal 90 4.0 361 3.3
SOURCE: U.S. Department of Education, National Center for Education Statistics, Early Childhood Longitudinal Study, Kindergarten Class of 2010–11 (ECLS-K:2011), kindergarten-fourth grade (K-4) restricted-use data file, spring 2015.
The imputation flag IFS8PCTFLN indicates whether the school administrator questionnaire variable S8PCTFLN_I was longitudinally imputed using spring 2014, spring 2013, spring 2012, or spring 2011 data, was filled with data from the CCD, was imputed using the hot deck method, or was not imputed. For cases with missing data on S8PCTFLN, longitudinal imputation was used first, if possible, taking a value from school administrator data in a previous round for the same school in spring 2014 (S7PCTFLN_I), spring 2013 (S6PCTFLN_I), spring 2012 (S4PCTFLN), or spring 2011 (S2LUNCH). If historical survey data were not available, then data from the CCD were used to impute for these missing
41 X8FRMEAL_I and the round 7 version of the composite, X7FRMEAL_I, are constructed differently than previous versions of the same composite. For example, for the round 6 version of the composite, X6FRMEAL_I, data from the imputed spring 2013 school administrator questionnaire were used first to set the composite value, followed by variables in the following order of priority: unimputed school administrator data from the most recent previous round of the study available, data from the school master file, the sum of the spring 2012 composite for free school meals added to the spring 2012 composite for reduced-price school meals, and then the sum of the spring 2011 composite for free school meals added to the spring 2011 composite for reduced-price school meals. Finally, if X6FRMEAL_I did not have an assigned value following each of the above steps, the remaining missing values were imputed using hot deck imputation at the composite level.

7-52
S8PCTFLN_I values for public schools. The PSS does not have data on school meals that can be used to compute an imputed value for S8PCTFLN_I. If CCD data were not available, then the values of the meal composites from previous rounds were used to compute an imputed value for S8PCTFLN_I, where available, with the imputed value computed as X7FRMEAL_I, if this was available, X6FRMEAL_I, if this was available, the sum of X4FMEAL_I and X4RMEAL_I if these were available, and otherwise the sum of X2FLCH2_I and X2RLCH2_I, if available.
If S8PCTFLN_I was still missing after data from previous rounds and the CCD were used, it was imputed using the hot deck method described above in section 7.5.2.5. Hot-deck imputation was done at the school level and the imputed value was then assigned to each child in the school. In hot-deck imputation, a school with a non-missing value for a component has this value assigned or “donated” to a similar school with a missing value for the component. Schools are similar if they belong in the same imputation cell. Imputation cells were created using district poverty category (created from the district poverty variable X8DISTPOV described in section 7.5.7), census region, school type, the percentage of students in minority ethnic groups, whether the school received Title I funding, and school size (total enrollment).
Cases that did not have any data from the school administrator questionnaire in the spring of 2015 did not have a value for S8PCTFLN_I to set the value of the composite X8FRMEAL_I, so other sources were used to assign a value for the composite. X8FRMEAL_I was set to the percentage of students in the child’s current school eligible for free or reduced-price lunch reported by the school administrator in the spring of 2014 (S7PCTFLN_I), if those data were available, spring of 2013 (S6PCTFLN_I), if those data were available, or the spring of 2012 (S4PCTFLN), if those data were available. If spring 2012 data were not available but data from the spring of 2011 (S2LUNCH) were, the 2011 data were used. Otherwise, if the school master file had data for the school’s total enrollment, the number of children approved for free meals, and the number of children approved for reduced-price meals, X8FRMEAL_I was set to the percentage of children approved for free meals plus the percentage of children approved for reduced-price meals.
Finally, if X8FRMEAL_I did not have an assigned value following each of the above steps, the remaining missing values were imputed using hot deck imputation at the composite level. The imputation flag IFX8FRMEAL indicates whether X8FRMEAL_I was imputed using the hot deck method, or was not imputed.
In some cases, the children’s schools are unknown because the child was unlocatable or the child moved to a nonsampled county and was not followed into his or her new school, but a parent interview

7-53
was completed. In such cases, data were not imputed for X8FRMEAL_I because no information about the school was available (e.g., public or private control, school size, or even if the child was enrolled in a school). X8FRMEAL_I is coded as -9 for these cases.
7.5.4.7 Geographic Region and Locality of the Child’s School (X8REGION, X8LOCALE)
Composite variables indicating the geographic region (X8REGION) and locality type (X8LOCALE) of the child’s school come from the PSS for private schools and the CCD for public schools. For the spring 2015 geographic region composite, X8REGION, if the geographic region was missing in the PSS and CCD files, then the state in which the school was located was used to assign region. If those data were missing and the geographic region for the school was identified in an earlier round, the composite was set to the value from the most recent round (as reported in X7REGION, X6REGION, X4REGION, X2REGION, or X1REGION).42 Values for X8REGION are the following:
1 = Northeast: CT, ME, MA, NH, RI, VT, NJ, NY, PA;
2 = Midwest: IL, IN, MI, OH, WI, IA, KS, MN, MO, NE, ND, SD;
3 = South: DE, DC, FL, GA, MD, NC, SC, VA, WV, AL, KY, MS, TN, AR, LA, OK, TX; and
4 = West: AZ, CO, ID, MT, NV, NM, UT, WY, AK, CA, HI, OR, WA.
X8REGION is coded -9 (not ascertained) for children who were unlocatable or moved out of a sampled county and were not followed to new schools in the spring of 2015, but for whom there are parent interview data. Children who were homeschooled in the spring of 2015 have a code of -1 on X8REGION. X8REGION is set to system missing for those who did not participate in round 8.
For the spring 2015 school locality variable, X8LOCALE, the categories correspond to the 2006 NCES system for coding locale (https://nces.ed.gov/ccd/rural_locales.asp). If data are not available for the child’s school from the PSS or CCD, and locale data were available from an earlier round, the composites were set to the value from the most recent round (X7LOCALE, X6LOCALE, X4LOCALE, X2LOCALE, or X1LOCALE). Otherwise, the composites are coded -9 (not ascertained). Some -9 (not ascertained) values for X8LOCALE are associated with cases in which children who moved were
42 X8REGION and the round 7 version of the composite, X7REGION, are constructed differently from all previous versions of the same composite. Although X8REGION and X7REGION use the same data sources that were used to construct the composite in previous rounds, the order of the data sources used is different in rounds 7 and 8 than in previous rounds. For example, for the round 6 version of the composite, X6REGION, the state in which the school was located was used as a final step in assigning the composite value, if data from the CCD or PSS files and geographic location from a previous round (X4REGION, X2REGION, or X1REGION) were not available.

7-54
unlocatable or moved out of a sampled county and were not followed to new schools in spring 2015, but for whom there are parent interview data. Children who were homeschooled in spring 2015 are coded as -1 on X8LOCALE. X8LOCALE is set to system missing for those who did not participate in round 8. Values for X8LOCALE are the following:
11 - City, Large: Territory inside an urbanized area and inside a principal city with population of 250,000 or more;
12 - City, Midsize: Territory inside an urbanized area and inside a principal city with population less than 250,000 and greater than or equal to 100,000;
13 - City, Small: Territory inside an urbanized area and inside a principal city with population less than 100,000;
21 - Suburb, Large: Territory outside a principal city and inside an urbanized area with population of 250,000 or more;
22 - Suburb, Midsize: Territory outside a principal city and inside an urbanized area with population less than 250,000 and greater than or equal to 100,000;
23 - Suburb, Small: Territory outside a principal city and inside an urbanized area with population less than 100,000;
31 - Town, Fringe: Territory inside an urban cluster that is less than or equal to 10 miles from an urbanized area;
32 - Town, Distant: Territory inside an urban cluster that is more than 10 miles and less than or equal to 35 miles from an urbanized area;
33 - Town, Remote: Territory inside an urban cluster that is more than 35 miles from an urbanized area;
41 - Rural, Fringe: Census-defined rural territory that is less than or equal to 5 miles from an urbanized area, as well as rural territory that is less than or equal to 2.5 miles from an urban cluster;
42 - Rural, Distant: Census-defined rural territory that is more than 5 miles but less than or equal to 25 miles from an urbanized area, as well as rural territory that is more than 2.5 miles but less than or equal to 10 miles from an urban cluster; and
43 - Rural, Remote: Census-defined rural territory that is more than 25 miles from an urbanized area and is also more than 10 miles from an urban cluster.
Some schools have different values for X*LOCALE between the base year and subsequent rounds. The differences in values reflect changes in the PSS or CCD source data.

7-55
The classification of locale has undergone some changes since the ECLS-K study conducted with children in the kindergarten class of 1998-99. Information on these changes is available on the NCES website at https://nces.ed.gov/ccd/rural_locales.asp.
7.5.5 Field Management System (FMS) Composite Variables
Several composite variables were created from data stored in the FMS, which were obtained from frame data as well as by field staff during visits to the schools and discussions with school staff.
7.5.5.1 School Year Start and End Dates (X8SCHBDD, X8SCHBMM, X8SCHBYY, X8SCHEDD, X8SCHEMM, X8SCHEYY)
The composite variables indicating school year start and end dates, which are listed below, were derived from information contained in the FMS.
X8SCHBDD – X8 School Year Starting Date, Day;
X8SCHBMM – X8 School Year Starting Date, Month;
X8SCHBYY – X8 School Year Starting Date, Year;
X8SCHEDD – X8 School Year Ending Date, Day;
X8SCHEMM – X8 School Year Ending Date, Month; and
X8SCHEYY – X8 School Year Ending Date, Year.
The composite variables for beginning and ending school dates are derived differently in spring 2014 and spring 2015 than in previous rounds. In previous rounds of the study, the school administrator questionnaire data were used as the first source of data for creating the composites, followed by the use of FMS data if the questionnaire data were missing. In spring 2014 and spring 2015, the school administrator questionnaire did not include a question about beginning and ending school dates, so the FMS was used to derive the composites.

7-56
7.5.5.2 Year-Round Schools (X8YRRND)
The year-round school composite variable is based on information obtained from the school staff member who helps coordinate the data collection activities in the school (referred to as the school coordinator) about whether a school is a year-round school. This composite has valid values for the 12,915 cases that have child assessment or parent interview data in round 8. The values for this composite variable are 1 (year-round school) and 0 (not year-round school). If the child was homeschooled in the spring of 2015, the composite is coded as -1 (not applicable). If these data were not obtained in the spring of 2015 but information about being a year-round school was collected in an earlier round, the composite was set to the value from the most recent round (X7YRRND, X6YRRND, X4YRRND, or X12YRRND).
7.5.6 School District Poverty (X8DISTPOV)
X8DISTPOV is a district-level indicator of the percentage of children age 5–17 in a school district who are in poverty. It is derived from the 2014 Small Area Income & Poverty Estimates (SAIPE) and is computed as the estimated number of children 5–17 years old in poverty divided by the estimated population of children 5–17 years old in the district multiplied by 100 and rounded to 0 decimals. The school district boundaries were based on the 2013 school district mapping survey that included school districts as of January 1, 2014 and reflect district boundaries for the 2013–14 school year (U.S. Census Bureau n.d.). There are 108 ECLS-K:2011 public schools with a missing value for X8DISTPOV because the values were missing in the SAIPE source data.
7.6 Methodological Variables
To facilitate methodological research, variables pertaining to aspects of the data collection work were extracted from the FMS and included in the data file. These include identifiers for parent interview work area (F8PWKARE), parent interviewer identification number (F8PINTVR), the month the parent interview was conducted (F8INTVMM), the year the parent interview was conducted (F8INTVYY), child assessment work area (F8CWKARE), and child assessor identification number (F8CASSOR). A “work area” is the group of schools that each team leader was assigned. Team leaders managed a group of 1 to 4 other individuals who worked as child assessors and parent interviewers for the sampled cases in the work area. If a case was not assigned to an interviewer (e.g., a child who moved and was not followed), then F8PINTVR is system missing. Similarly, if a case was not assigned to an assessor, then F8CASSOR is system missing.

8-1
8. ELECTRONIC CODEBOOK (ECB)
8.1 Introduction
This chapter provides specific instructions for using the Early Childhood Longitudinal Study, Kindergarten Class of 2010–11 (ECLS-K:2011) Electronic Codebook (ECB). The functionality of the ECB, which is the same throughout the ECLS studies, is fully described in the Help File for the ECLS-K:2011 longitudinal kindergarten–fourth grade (K-4) ECB. The information in the ECB’s Help File provides a comprehensive tour through the ECB and addresses all of the functions and capabilities of the program. These functions allow users to access the accompanying data catalog and view the data in various ways by performing customized searches and extractions. Using the ECB, the data user can create SAS, SPSS for Windows, and Stata syntax programs that can be run to generate an extract data file from the text (ASCII) data file.
8.1.1 Hardware and Software Requirements
The ECB program is designed to run under Windows 95®, Windows 98®, Windows 2000®, Windows XP®, or Windows NT® 4.0 on a Pentium-class or higher personal computer (PC). The ECB has been successfully tested using current versions of Windows Vista and Windows 7. It has not been tested on Windows 10. The ECB is not designed for use on Apple Macintosh systems, but Mac users can create a data file using the file record layout.
The PC should have a minimum of 20 megabytes of available disk space. The program will
fit best visually on screens set to a desktop area of 1024 x 768 pixels. It will still work on other screen settings, but it may not make the best use of the available screen space. If you have a Windows NT® or earlier operating system, you can check or set your desktop area as follows:
1. Click the Windows Start button.
2. Select the Settings menu and then the Control Panel folder icon.
3. In the Control Panel window, click the Display icon.
4. Select the Settings tab.
8-2
5. Set the Desktop Area to 1024 x 768 pixels with the Desktop Area slidebar.
If you have a Windows Vista or Windows 7® operating system, you can check or set your desktop area as follows:
1. Click the Windows Start Button.
2. Select the Control Panel tab.
3. In the Control Panel window, click the Display icon.
4. Select the Change display settings tab.
5. Set the Desktop Area to 1024 x 768 pixels with the Desktop Area slidebar.
As noted above, the ECB requires approximately 20 megabytes of available disk space on your hard drive. If 20 megabytes of space is not available, you may wish to delete unnecessary files from the drive to make space for the ECB.
8.2 Installing, Starting, and Exiting the ECB
The ECB is intended to be installed and run from within the Windows 95®, Windows 98®, Windows 2000®, Windows XP®, Windows NT® 4.0, Windows Vista, or Windows 7® environment. The sections in this chapter provide you with step-by-step instructions for installing the program on your PC, starting the program, and exiting the program once you have completed your tasks.
8.2.1 Installing the ECB Program on Your Personal Computer
Program installation is initiated by running the “InstallECLSECB.exe” executable file.
How to Install the Program
1. Close all applications on your computer.
2. Run program “InstallECLSECB.exe”.

8-3
Depending on your PC’s configuration, you may encounter warning messages during installation. To respond, always keep the newer version of a file being copied and ignore any access violations that occur during file copying.
If you are installing multiple ECBs (not different versions of the same ECB) on your PC, you
may receive a message warning that Setup is about to replace pre-existing files. To respond, always opt to continue the installation although the default is to cancel the setup. When you get a follow-up message to confirm whether the installation should be continued, press Yes to continue, although the default is No.
3. The screen shown in exhibit 8-1 indicates that the setup is being prepared.
Exhibit 8-1. InstallShield Wizard
4. You will be prompted to continue with the installation in the Welcome window shown
in exhibit 8-2. Click the Next button to continue.

8-4
Exhibit 8-2. Welcome window
5. When you continue, you will be prompted to choose a destination location for the
installation in the window shown in exhibit 8-3. If you wish to change the destination location, click the Browse button to change the directory. Click the Next button when the desired destination folder is shown.
Exhibit 8-3. Choose Destination Location

8-5
6. Setup will then start installing files. Exhibit 8-4 shows the setup status.
Exhibit 8-4. Setup Status
7. Once the installation is completed, the InstallShield Wizard Complete window shown
in exhibit 8-5 will appear. Click the Finish button to finish the process and return to your PC’s desktop.
Exhibit 8-5. InstallShield Wizard Complete

8-6
8. The installation process should take about a minute, depending on the speed of the computer on which the ECB is being installed.
8.2.2 How to Start the ECB
On the desktop screen, click the ECB desktop icon (exhibit 8-6a) shown below to initiate the program. Alternatively, on the desktop screen, click the Start button and then point to Programs (exhibit 8-6b). Click the ECB title to start the program. In Windows 7, click the Start button, click on All Programs, and click the ECB title to start the program.
Exhibit 8-6a. Desktop icon
Exhibit 8-6b. Desktop screen—click start

8-7
If you are a first-time user of the ECB, exhibit 8-7 will appear and ask if you are a new user.
Exhibit 8-7. First-time user dialog box
Click Yes if you are a first-time user. The ECB splash screen shown in exhibit 8-8 will appear.
Exhibit 8-8. ECB splash screen
On the Select Catalog screen (exhibit 8-9), highlight the name of the catalog. (The ECLS-K:2011 has only one catalog.)

8-8
Exhibit 8-9. Select Catalog screen
Click OK to open the main ECB screen, shown in exhibit 8-10.
Exhibit 8-10. Main ECB screen
You are now ready to use the functions of the ECB as described in the ECB Help File.

R-1
REFERENCES
Centers for Disease Control and Prevention (CDC). (2000). Growth Charts. (Retrieved from www.cdc.gov/growthcharts/html_charts/statage.htm)
Gresham, F.M., and Elliott, S.N. (1990). Social Skills Rating System. Circle Pines, MN: American Guidance Service.
Keys, A., Fidanza, F., Karvonen, M. J., Kimura, N., Taylor, H. L. (1972). Indices of relative weight and obesity. Journal of Chronic Disease, 25: 329–343.
Mather, N., and Woodcock, R. W. (2001). Woodcock-Johnson III Tests of Achievement Examiner’s Manual: Standard and Extended Batteries. Itasca, IL: Riverside Publishing.
Mei, Z., Grummer-Strawn, L., Pietrobelli, A., Goulding, A., Goran, M., and Dietz, W. H. (2002). Validity of body mass index compared with other body-composition screening indexes for the assessment of body fatness in children and adolescents. American Journal of Clinical Nutrition, 75(6): 978–985.
Najarian, M., Tourangeau, K., Nord, C., and Wallner-Allen, K. (forthcoming). Early Childhood Longitudinal Study, Kindergarten Class of 2010–11 (ECLS-K:2011), Kindergarten Psychometric Report. National Center for Education Statistics, Institute of Education Sciences, U.S. Department of Education. Washington, DC.
Najarian, M., Tourangeau, K., Nord, C., and Wallner-Allen, K. (forthcoming). Early Childhood Longitudinal Study, Kindergarten Class of 2010–11 (ECLS-K:2011), First-Grade and Second-Grade Psychometric Report. National Center for Education Statistics, Institute of Education Sciences, U.S. Department of Education. Washington, DC.
Najarian, M., Tourangeau, K., Nord, C., and Wallner-Allen, K. (forthcoming). Early Childhood Longitudinal Study, Kindergarten Class of 2010–11 (ECLS-K:2011), Third- Through Fifth-Grade Psychometric Report. National Center for Education Statistics, Institute of Education Sciences, U.S. Department of Education. Washington, DC.
National Assessment Governing Board. (1995). Mathematics Framework for the 1996 National Assessment of Educational Progress. Washington, DC: Government Printing Office. Retrieved December 12, 2017 from https://eric.ed.gov/?id=ED404184.
National Assessment Governing Board. (2004a). Mathematics Framework for the 2005 National Assessment of Educational Progress. Washington, DC: U.S. Government Printing Office. Retrieved December 12, 2017 from https://www.nagb.gov/assets/documents/publications/frameworks/mathematics/2005-mathematics-framework/toc.html.
National Assessment Governing Board. (2004b). Science Framework for the 2005 National Assessment of Educational Progress. Washington, DC: U.S. Government Printing Office. Retrieved December 12, 2017 from https://www.nagb.gov/naep-frameworks/science/2005-science-framework.html.
National Assessment Governing Board. (2008). Reading Framework for the 2009 National Assessment of Educational Progress. Washington, DC: U.S. Government Printing Office. Retrieved December 12, 2017 from https://www.nagb.gov/assets/documents/publications/frameworks/reading/2009-reading-framework.pdf.

R-2
National Assessment Governing Board. (2010). Reading Framework for the 2011 National Assessment of Educational Progress. Washington, DC: U.S. Government Printing Office. Retrieved December 12, 2017 from https://www.nagb.gov/naep-frameworks/reading/2011-reading-framework.html.
National Assessment Governing Board. (2010). Science Framework for the 2011 National Assessment of Educational Progress. Washington, DC: U.S. Government Printing Office. Retrieved December 12, 2017 from https://www.nagb.gov/naep-frameworks/science/2011-science-framework.html.
National Council of Teachers of Mathematics. (2000). Principles and Standards for School Mathematics. (Book and E-Standards CD). Reston, VA: Author. Online version available from http://www.nctm.org/standards/content.aspx?id=16909
National Mathematics Advisory Panel. (2008). Foundations for Success: The Final Report of the National Mathematics Advisory Panel. Washington, DC: U.S. Department of Education.
Nord, M., and Hopwood, H. (2007). Recent Advances Provide Improved Tools for Measuring Children’s Food Security. Journal of Nutrition, 137(3): 533–536.
Putnam, S.P., and Rothbart, M.K. (2006). Development of Short and Very Short Forms of the Children’s Behavior Questionnaire. Journal of Personality Assessment, 87(1): 103–113.
Simonds, J., and Rothbart, M.K. (2004, October). The Temperament in Middle Childhood Questionnaire (TMCQ): A Computerized Self-Report Measure of Temperament for Ages 7-10. Poster session presented at the Occasional Temperament Conference, Athens, GA.
Slotkin, J., Kallen, M., Griffith, J., Magasi, S., Salsman, J., Nowinski, C., and Gershon, R. (2012). NIH Toolbox Technical Manual. © 2006–12 National Institutes of Health and Northwestern University. Retrieved August 20, 2014 from
NIH Toolbox Technical Manual. © 2006–12 National Institutes of Health and Northwestern University. Retrieved August 20, 2014 from http://www.nihtoolbox.org/HowDoI/TechnicalManual/ Technical%20Manual%20sections/Toolbox%20Cognition%20Battery%20Composite%20Scores%20Technical%20Manual.pdf.
Slotkin, J., Nowinski, C., Hays, R., Beaumont, J., Griffith, J., Magasi, S., Salsman, J., and Gershon, R. (2012). NIH Toolbox Scoring and Interpretation Guide. © 2006–12 National Institutes of Health and Northwestern University. Retrieved August 20, 2014 from http://www.nihtoolbox.org/ WhatAndWhy/Scoring%20Manual/NIH%20Toolbox%20Scoring%20and%20Interpretation%20Manual%209-27-12.pdf.
Tourangeau, K., Nord, C., Lê, T., Sorongon, A. G., and Najarian, M. (2009). Early Childhood Longitudinal Study, Kindergarten Class of 1998–99 (ECLS-K), Combined User’s Manual for the ECLS-K Eighth-Grade and K–8 Full Sample Data Files and Electronic Codebooks (NCES 2009–004). National Center for Education Statistics, Institute of Education Sciences, U.S. Department of Education. Washington, DC.
Tourangeau, K., Lê, T., Daly, P. and Themann, C. (2017). Early Childhood Longitudinal Study, Kindergarten Class of 2010–11 (ECLS-K:2011), User’s Manual for the Third-Grade Hearing Evaluations Component Data File (NCES 2018-090). National Center for Education Statistics, Institute of Education Sciences, U.S. Department of Education. Washington, DC.

R-3
Tourangeau, K., Nord, C., Lê, T., Sorongon, A.G., Hagedorn, M.C., Daly, P., and Najarian, M. (2015). Early Childhood Longitudinal Study, Kindergarten Class of 2010–11 (ECLS-K:2011), User’s Manual for the ECLS-K:2011 Kindergarten Data File and Electronic Codebook, Public Version (NCES 2015-074). National Center for Education Statistics, Institute of Education Sciences, U.S. Department of Education. Washington, DC
Tourangeau, K., Nord, C., Lê, T., Wallner-Allen, K., Hagedorn, M.C., Leggitt, J., and Najarian, M. (2015). Early Childhood Longitudinal Study, Kindergarten Class of 2010–11 (ECLS-K:2011), User’s Manual for the ECLS-K:2011 Kindergarten–First Grade Data File and Electronic Codebook , Public Version (NCES 2015-078). National Center for Education Statistics, Institute of Education Sciences, U.S. Department of Education. Washington, DC.
Tourangeau, K., Nord, C., Lê, T., Wallner-Allen, K., Vaden-Kiernan, N., Blaker, L. and Najarian, M. (2017). Early Childhood Longitudinal Study, Kindergarten Class of 2010–11 (ECLS-K:2011) User’s Manual for the ECLS-K:2011 Kindergarten–Second Grade Data File and Electronic Codebook, Public Version (NCES 2017-285). National Center for Education Statistics, Institute of Education Sciences, U.S. Department of Education. Washington, DC.
Tourangeau, K., Nord, C., Lê, T., Wallner-Allen, K., Vaden-Kiernan, N., Blaker, L. and Najarian, M. (2018). Early Childhood Longitudinal Study, Kindergarten Class of 2010–11 (ECLS-K:2011) User’s Manual for the ECLS-K:2011 Kindergarten–Third Grade Data File and Electronic Codebook, Public Version (NCES 2018-034). U.S. Department of Education. Washington, DC: National Center for Education Statistics.
Tourangeau, K., Nord, C., Lê, T., Wallner-Allen, K., Vaden-Kiernan, N., Blaker, L. and Najarian, M. (2018). Early Childhood Longitudinal Study, Kindergarten Class of 2010–11 (ECLS-K:2011) User’s Manual for the ECLS-K:2011 Kindergarten–Fourth Grade Data File and Electronic Codebook, Restricted Version (NCES 2018-082). National Center for Education Statistics, Institute of Education Sciences, U.S. Department of Education. Washington, DC.
U.S. Census Bureau, Current Population Survey. Poverty Thresholds for 2012 by Size of Family and Number of Related Children Under 18 Years Old, retrieved December 8, 2014 from http://www.census.gov/hhes/www/poverty/data/threshld/index.html.
U.S. Department of Agriculture, Food and Nutrition Service. (2000). Guide to Measuring Household Food Security, Revised 2000. Alexandria, VA: Author.
Woodcock, R. W., McGrew, K. S., and Mather, N. (2001). Woodcock-Johnson III Tests of Cognitive Ablities. Itasca, IL: Riverside Publishing.
Zelazo, P.D. (2006). The Dimensional Change Card Sort (DCCS): A Method of Assessing Executive Function in Children. Nature Protocols, 1:297–301.
Zelazo, P.D., Anderson, J.E., Richler, J., Wallner-Allen, K., Beaumont, J.L., and Weintraub, S. (2013). NIH Toolbox Cognition Battery (CB): Measuring executive function and attention. In P.D. Zelazo and P.J. Bauer (Eds.), National Institutes of Health Toolbox Cognition Battery (NIH Toolbox CB): Validation for Children Between 3 and 15 Years. Monographs of the Society for Research in Child Development.

This page intentionally left blank.

A-1
APPENDIX A
DATA ADDENDA, ANOMALIES, ERRATA, AND DATA CONSIDERATIONS
INTRODUCTION This appendix provides information on data addenda, anomalies, errata, and data
considerations. Addenda are meant to provide additional detail for issues discussed in previously released documentation that has no applicability to the manual’s focal round of data collection. Anomalies and errata listed here were identified during the editing and review of the data and are those known at the time this manual was prepared. Other anomalies and errata may exist in the data.
The information presented here will be more easily understood, and is most useful, after the
survey items or variables to be used in analyses have been identified. Each anomaly, error, or data consideration is associated with a specific survey question or variable in the data file (or both). Rather than read through this entire appendix, users may find it easier to identify any issues associated with their data of interest by searching for the survey question number, variable name, or keyword in this appendix. For example, an analyst who is interested in information about children’s diagnoses of attention deficit hyperactivity disorder (ADHD) could search (1) CHQ125, which is the number of the question in which this information was asked in the parent interview; (2) P8ADHA, which is the name of the variable in which data from CHQ125 about ADHD are stored; and (3) “Attention Deficit Hyperactivity Disorder” or “ADHD.”
These anomalies, errors, and considerations are noted so that users are aware these issues with
the data exist. Leaving the anomalous or erroneous data as they are will not significantly affect most analyses, because the number of cases affected is generally very small. However, analyses focused on a small subpopulation or examining rare characteristics could be significantly affected by data issues with even a small number of cases. Therefore, analysts doing such analyses should consider the impact these data issues may have on their results.
This appendix is organized into sections as shown on the following page:

A-2
CONTENTS
INTRODUCTION ........................................................................................................................... A-1 ADDENDA........................................................................................................................................ A-3
Kindergarten and First-Grade Language Screener ................................................................. A-3 PARENT INTERVIEW ................................................................................................................. A-4
Spring 2015 Anomalies and Errata .......................................................................................... A-4 Spring 2015 Errors in the CAI Programming ......................................................................... A-5 Spring 2015 Data Considerations ............................................................................................ A-6
CHILD ASSESSMENT .................................................................................................................. A-6
Spring 2015 Error in Administration ....................................................................................... A-6
HARD-COPY QUESTIONNAIRES .............................................................................................. A-6
School Administrator Questionnaire: Spring 2015 Data Considerations ................................ A-7 Teacher Questionnaires: Spring 2015 Anomalies ................................................................... A-7
COMPOSITE VARIABLE ANOMALIES, ERRATA, AND CONSIDERATIONS ................. A-9 ELECTRONIC CODEBOOK (ECB) VALUE LABELS ............................................................. A-13

A-3
ADDENDA Kindergarten and First-Grade Language Screener
In the kindergarten rounds of data collection, the components of the ECLS-K:2011 assessment
that were administered to children who spoke a language other than English at home depended on the children’s performance on a language screener used in the fall and spring data collections. In first grade, the screener was administered only to children who spoke a language other than English at home who had not passed the screener in the most recent round in which they were assessed. For example, children who spoke a language other than English at home who were assessed most recently in the spring of kindergarten and did not pass the language screener at that time were administered the screener the next time they were assessed.
The screener consisted of two tasks from the Preschool Language Assessment Scale (preLAS
2000).1 The “Simon Says” task required children to follow simple, direct instructions given by the assessor in English. The “Art Show” task was a picture vocabulary assessment that tested children’s expressive vocabulary. The preLAS publishers recommended using a cut score of 16; that is, children had to achieve a score of 16 or higher to be routed through all of the ECLS-K:2011 assessments in English.
The data file contains raw number-right scores for “Simon Says” and “Art Show,” which
provide information on children’s basic English proficiency. These scores were derived from the 10 items administered in the “Simon Says” subtask and the 10 items administered in the “Art Show” subtask. Athough these data file scores range from 0 to 20, routing decisions were made based on a routing cut score that ranged from 0 to 30. The routing cut score was derived by weighting the number of items the child answered correctly for “Simon Says” by a factor of 2 and adding the number of items the child answered correctly for Art Show: (Simon Says * 2) + Art Show. For this reason, children whose data file raw number-right scores for “Simon Says” and “Art Show” sum to 16 or higher were not necessarily routed into the full ECLS-K:2011 assessment battery in English. Analysts should use the variables X1FLSCRN, X2FLSCRN, X3FLSCRN, and X4FLSCRN to determine routing based on the child’s home language and performance on the English language screener.
1 Duncan, S. E., and De Avila, E. A. (1998). preLAS 2000 Cue Picture Book English Form C. Monterey, CA: CTB/McGraw-Hill Companies, Inc.

A-4
PARENT INTERVIEW Spring 2015 Anomalies and Errata
Some cases have household data about family members that were edited (e.g., if the age of a household member was reported incorrectly and had to be updated, or a person who was added to the household roster in error needed to be deleted from the household roster). These data were changed in the current round of the study, but not in previous rounds of the study. Researchers who are using family structure data in their analyses should consider the household roster data from the most recent round of the study to be the most accurate. Age changes were made to the following cases: for person 1 in the household, age changes were made to CHILDID = 10011903, 10015698; for person 3 in the household, age changes were made to CHILDID = 10012238, 10009726, 10016420; for person 4 in the household, age changes were made to CHILDID = 10016306; for person 7 in the household, age changes were made to CHILDID = 10000430; for person 10 in the household, age changes were made to CHILDID = 10011711 (the age was changed to -9 for “not ascertained”). Changes to a household member’s sex and relationship to the child were made to the following cases: for person 1 in the household, CHILDID = 10010356, 10015543, 10002529; for person 3 in the household CHILDID = 10010100, 10017814, 10000456, 10009024, 10011324; for person 4 in the household CHILDID = 10007077; for person 5 in the household CHILDID = 10003359, 10003415, 10002727, 10014103; for person 6 in the household CHILDID = 10002727, 10017219, 10001691; for person 7 in the household CHILDID = 10017219; for person 10 in the household CHILDID = 10011711. Changes to a household member’s sex were made to the following cases: for the focal child (person 2) CHILDID = 3382002P; for person 5 in the household CHILDID = 10003415.
In five cases (CHILDID = 10009428, 10009306, 10002216, 10000099, 10009939), P8CHGSPSPREL = 1, there was a change in the relationship of the spouse or partner to the child; however, the relationship coded during the interview was the same as the relationship coded in the previous round interview.
There is one case where a person had a reason for leaving the household even though this person was not listed in the household roster in a previous round. This person was a new respondent for the fall 2012 parent interview, which did not include a household roster; there was no completed parent interview in the spring of 2013 or 2014; and this person left the household by the time of the spring 2015 parent interview.
In one case (CHILDID = 10008937), there was an interviewer and editing error in round 2 that produced a missing record for the fifth person in the household roster. The fifth person in the household is recorded as person 9. This issue is present in all rounds of the study since round 2.
In two cases (CHILDID = 10010775, 10005612), the brother type is missing due to interviewer error.
There were four cases with errors in recording the respondent to the parent interview (CHILDID = 10002812, 10012710, 10014046, 10017168) during the interview, which affected the questions that were asked. In the data file, the respondent information was edited to identify the correct respondent. However, because of these respondent identification errors during administration, some items in sections DWQ and PPQ were

A-5
not asked during the interview for these four cases. Data for these items were set to -9 (not ascertained).
There are cases with missing ethnicity and race because stepfathers (for whom ethnicity and race would be collected) were coded as nonrelatives (for whom ethnicity and race would not be collected) during the parent interview. This is true for the following cases: for person 4 in the household CHILDID = 10016510; for person 5 in the household CHILDID = 10010570, 10013778, 10003780, 10001917; for person 6 in the household CHILDID = 10014429; for person 7 in the household CHILDID = 10005959, 10001575; for person 8 in the household CHILDID = 10010743, 10004449.
There are cases that have a disability diagnosis for the focal child and have follow-up questions about that diagnosis recorded in variables other than those used for the child’s specific diagnosis. In the parent interview, respondents were asked to provide the diagnosis of the child’s disability, if applicable, in question CHQ125 (P8LRNDIS-P8OTHDIA). If a diagnosis did not fit one of the categories in the parent interview specifications, the diagnosis was entered as “other.” Follow-up questions about age at diagnosis and medication taken for a particular diagnosis (CHQ130-CHQ173) were asked about the diagnosis entered as “other.” During data editing and review of “other” responses conducted after the parent interview was completed, it was determined that some answers in the “other” category fit within existing codes that were available in the interview and were assigned codes for those existing categories. For example, in a situation in which the parent report was initially coded as an “other” diagnosis in CHQ125 but was later determined to be depression, the diagnosis was recategorized from “other” to depression (P8DEPRESS = 1), but the information collected in follow-up questions about age at diagnosis and medication taken for a particular diagnosis (CHQ130-CHQ173) remain in the variables pertaining to the “other” category. If the category for depression was already chosen in CHQ125, the follow-up questions about age at diagnosis and medication taken for a particular diagnosis (CHQ130-CHQ173) would be both in the variables pertaining to depression and in the variables pertaining to the “other” category. There are 2 cases (CHILDID = 10002867, 10015420) that indicated a hearing diagnosis had been given (P8DIFFH3 = 1), but who have -9 (not ascertained) for the diagnosis because the answer given in the “other, specify” field was not a diagnosis.
Spring 2015 Errors in the CAI Programming
Parent education composites are generally based on information collected in the first round of the study in which the education questions were asked. If the first question in the parent education section (which asks about the highest grade or year of school that was completed) was asked for a parent in an earlier round of the study, it was not asked again for that parent in a later round. However, if that question had missing data from a previous round, education questions were asked again. In spring 2015, there were errors in the preloaded data used to determine which questions about education should be asked, given information collected in prior-round interviews. As a result, there are cases for which the data collected are inconsistent with the skip patterns documented in the interview specifications. These errors caused education questions to be asked again for cases that already had education questions asked in an earlier round of the study and for which new education data should not have been collected. For parent 1, there are 8 cases that were asked education again in round 8 when they had education data from a previous round of the study (10004766, 10006586, 10016809, 10002190, 10011599,

A-6
10009558, 10002978, 10006559). For parent 2, there are 22 cases (10000238, 10001690, 10001966. 10002329, 10002750, 10006013, 10006133, 10006559, 10006586, 10006586, 10007707, 10008936, 10009558, 10010482, 10011022, 10011599, 10013275, 10014239, 10015084, 10015543, 10016417, 10017495) that were asked education again in round 8 but had education data from a previous round of the study. The round 8 education data have been kept on the file for these cases, along with the education data from previous rounds.
Spring 2015 Data Considerations
The nonresident parent section of the parent interview (NRQ) was designed to ask about biological and adoptive parents who were not in the household. If there was one adoptive parent in the household, questions were asked about contact the child might have had with another adoptive parent who was not in the household. Questions in this section were asked about a nonresident adoptive parent who was the opposite sex of the adoptive parent in the household. Questions were not asked about a nonresident adoptive parent who was the same sex as the other adoptive parent in the household.
CHILD ASSESSMENT Spring 2015 Error in Administration
For case 10007245, there was an administration error for the Numbers Reversed portion of the assessment. Paper and a pencil from the previous mathematics section of the assessment were erroneously not taken away from the child at the beginning of the Numbers Reversed section. At the beginning of the Numbers Reversed section, the child wrote down the numbers that were dictated and used the written numbers to answer the questions. The Numbers Reversed task requires the child to use memory to answer the questions rather than numbers recorded on paper. The paper and pencil were taken away after question N4120 (variable C8NMRV22). All data for the Numbers Reversed task have been set to -9 (not ascertained) for this case because of this administration error.
HARD-COPY QUESTIONNAIRES
For the hard-copy instruments (school administrator questionnaires, teacher-level teacher questionnaire, and teacher child-level questionnaire), both range and consistency checks were performed.
Range checks include logical soft checks for continuous variables.
Consistency checks include logical soft comparisons between related variables within a form to check for inconsistencies.
When data were identified during quality control (QC) processes as possibly in error, the original questionnaire returned by the respondent was reviewed to determine whether the response was incorrectly captured during the questionnaire scanning process. For those cases listed as anomalies, data reviewers confirmed that the data matched the form and reasonable correction(s) could not be ascertained. Therefore, the data were left as reported.

A-7
Data considerations and anomalies for the hard-copy instruments are described below.
School Administrator Questionnaire (SAQ): Spring 2015 Data Considerations
The labels for the variables S8NUMDAY, S7NUMDAY, and S6NUMDAY were changed to “Number of instructional days” to reflect the question wording of “How many instructional days will this school provide during this academic year?” In earlier rounds of the study, the label was “Number of days must attend” to reflect the question wording of “How many days are children required to attend school this academic year?” The variable name is the same across rounds because the underlying data are the same.
Teacher Questionnaires: Spring 2015 Anomalies
Some data collected from the spring 2015 teacher-level questionnaires did not match the child-level questionnaires. For example, there are 90 cases in which the reading teacher reported that he or she did not teach reading (A8TREADG = 2); however, the respondent was the reading teacher linked to the child. Also, there are 58 cases in which the mathematics teacher reported that he or she did not teach mathematics (A8TRMATHZ = 2); however, the respondent was the mathematics teacher linked to the child. Similarly, there are 188 cases in which the science teacher reported that he or she did not teach science (A8TSCIENZ = 2); however, the respondent was the science teacher linked to the child.
Additionally, there are 318 discrepancies between whether or not the identified reading teacher reported teaching reading this year (A8TREADG) on the teacher-level reading questionnaire and whether that teacher was the child’s primary reading teacher (G8TCRD) indicated on the reading teacher child-level questionnaire. Also, there are 140 discrepancies between whether or not the identified mathematics teacher reported teaching mathematics this year (A8TMATHZ) on the teacher-level mathematics questionnaire and whether that teacher was the child’s primary mathematics teacher (M8TCMTH) indicated on the mathematics teacher child-level questionnaire. Finally, there are 211 discrepancies between whether or not the identified science teacher reported teaching science this year (A8TSCIENZ) on the teacher-level science questionnaire and whether that teacher was the child’s primary science teacher (N8TCSCI) on the science teacher child-level questionnaire.
The data for the discrepancies were reviewed and verified. The wording of the questions could explain the discrepancies because G8TCRD, M8TCMTH, and N8TCSCI refer to the “primary teacher” whereas A8TREADG, A8TMATHZ, and A8TSCIENZ do not. For A8TREADG, A8TMATHZ, and A8TSCIENZ, the question is: “Which of the following subjects do you teach during this school year?” whereas for G8TCRD, M8TCMTH, and N8TCSCI, the question is “Are you this child’s primary teacher in the following subject areas?”
As described in chapter 2, in the fourth-grade data collection, children’s reading teacher and either their mathematics or science teachers received a questionnaire collecting information about the teacher (teacher-level) and a different questionnaire (child-level)

A-8
collecting information about both the child and classroom. The teacher child-level questionnaire consisted of two parts, one with child-specific questions and one with classroom-specific questions. Teachers were only asked to complete the classroom-level questions in the questionnaire pertaining to a “key child,” and that information was copied to the record of children in the same class as the key child.
For each distinct reading, mathematics, and science class that had a study student in it, the teacher child-level questionnaires were reviewed to confirm that one and only one questionnaire had classroom-level items completed for that class (i.e., there was only one key child per class and that the teacher had only completed the classroom-level items for the key child and not other children in the same class, as requested). During data review, it was noted that in some instances, the classroom-level items had been completed for more than one child in the same class.
Data managers investigated instances in which more than one classroom-level portion of the questionnaire was returned for a class, as well as instances in which the classroom-level portion of the questionnaire was not completed for any child in a given class (e.g., no data were reported for the key child in a class).
- When more than one classroom-level portion of the questionnaire was returned for a class, data were reviewed to determine the correct key child for the class; only the class-level data collected in the questionnaire for the correct key child were retained.
- When the classroom-level portion of the questionnaire was not completed for any child in a given class, questionnaires for all children in that class were reviewed to determine if class-level data had been included on a non-key child’s questionnaire. There were no classes, however, for which key child class-level data were collected in one of the non-key child questionnaires.
After these issues were handled, if classroom-level data were available from the key child classroom-level portion of the questionnaire, it was copied to the records for all other study children in the same subject matter class.
The CHILDIDs in the following table belong to children who have teacher-reported child-level data but no classroom-level data. For these children, classroom-level data were not available for two reasons: (1) the teacher completed child-level surveys for the study children, but not the classroom-level portion of the key child’s, or (2) operational error resulted in a key child not being indicated for a class (i.e., no survey contained the red dot to indicate the questionnaire belonged to the “key child”), so the teacher had no questionnaire for which he or she was asked to complete the classroom-level items for the class.

A-9
Reading Mathematics Science 10000756 10001546 10002680 10003116 10003983 10004018 10004416 10007412 10008862 10009087 10009277 10009532 10010219 10010396
10011308 10012028 10012055 10012432 10012575 10013246 10014177 10014193 10015539 10015798 10016928 10017089 10017780
10012001 10002970 10004463 10008803 10009392 10012028 10017583
10001546 10008550 10009087 10010219 10011502 10011999 10012055
10012432
10015539
10015798
10017089
COMPOSITE VARIABLE ANOMALIES, ERRATA, AND CONSIDERATIONS
Chapter 7 of this manual provides detailed information about the composite variables that were created and included in the data file. In this section, errors and data considerations related to the composite variables are described. Analysts are encouraged to carefully review the descriptions of the composite measures of interest to them in chapter 7.
One case (CHILDID = 10015142) has a value for X2RSCALK4 on the K-4 data file,
but did not have a score for this variable in previous data files. The value shown for this case on the K-4 data file is correct. The reading data flag, X2RDGFLG, for this case should be “true” but is incorrect on the K-4 data file. The other reading variables, X2RTHETK4 and X2RSETHK4, were incorrectly set to -9 for this case on the K-4 data file. The K-5 data file will be corrected for this case.
There were inconsistencies in the reporting of school type in the school administrator questionnaires. In two schools (school ID = 5482, 5555), respondents chose inconsistent responses in the school administrator questionnaire (SAQ), e.g., checking both Catholic and other religious, or checking both a public type (e.g., charter school) and a private type. In five schools (school ID = 1360, 4102, 5081, 5482, 5555), the SAQ was inconsistent with the school master file information on the school type. Each case was investigated using information in the field management system and/or the school website. Values for the composites X8SCTYP and X8PUBPRI were set based on the results of these investigations. Original SAQ responses were not altered, so information reported by the school administrator may conflict with information in the school type composites.
There is variation in the value of X*LOCALE (school locale) across rounds for some schools (that is, cases for which the value of X8LOCALE does not match the value of one or more X*LOCALE composites for that school from a prior round). In each round,

A-10
the X*LOCALE composite values were confirmed against the school master file current at the time of file creation for that round. Differences in values may reflect growth of a community, correction to the source data, or other causes of changes in the school master file values.
Data from the questionnaire given to administrators in schools that had provided school data in previous rounds (SAQ-B) were inadvertently overlooked in the construction of the composite variables X*ENRLS (total school enrollment) and X*RCETH (percent nonwhite students in school) causing the composites to reflect the data collected from the questionnaire given to administrators in schools that did not have previous round school data (SAQ-A). This has been corrected for the fourth-grade variables, X8ENRLS and X8RCETH, in the K-4 data file and will be corrected for the third-grade variables, X7ENRLS and X7RCETH, in the K-5 data file.
In chapter 7, it is noted in the description of X8FRMEAL_I (Students Eligible for Free or Reduced-Price School Meals) that there are some schools for which is appears data were reported by administrators as number of students eligible, rather than as a percent. All such cases are coded in the highest category of X8FRMEAL_I on the public-use file. Data users are encouraged to use X8FRMEALFLG to identify these cases, evaluate whether their inclusion has an impact on analyses, and make statistical adjustments, if needed, that best serve the analysis goals.
ELECTRONIC CODEBOOOK (ECB) VALUE LABELS
There is a small set of minor issues with the value labels for some variables in the electronic codebook.
G8TMEENG: The label for category 7 shoud say “3 hours or more (8).”
G8TMEOTH: The label for category 2 should say “2. LESS THAN 1/2 HOUR TO 3 HOURS OR MORE.”
S8RPTCRD: The labels should be as follows: “1: 3 OR FEWER TIMES A YEAR,” “2: 4 TO 6 TIMES A YEAR,” and “3: 7 OR MORE TIMES A YEAR.”
P8BMCNTC and P8BDCNTC: The label for category 4 should indicate this includes cases where the nonresident parent is deceased.
X7RCETH and X7FRMEAL_I: The labels should be as follows: “1: 0 TO LESS THAN 25,” “2: 25 TO LESS THAN 50,” “3: 50 TO LESS THAN 75,” and “4: 75 OR HIGHER.”
X8HIGGRD: The label for category 6 should say "6: 9TH TO 12TH GRADE, UNGRADED (11, 12, 13, 14, 15)."

B-1
APPENDIX B
SUPPLEMENTAL GUIDE FOR THE KINDERGARTEN-FOURTH GRADE
PUBLIC-USE DATA FILE
1 Introduction
This guide provides information specific to the Early Childhood Longitudinal Study, Kindergarten Class of 2010-11 (ECLS-K:2011) kindergarten–fourth grade public-use data file, referred to hereinafter as the K-4 PUF, which includes data from the base-year (kindergarten) through fourth-grade data collections. This guide is a supplemental document that describes the edits made to the restricted-use file in order to produce the public-use file. This guide focuses on the variables associated with the fourth-grade data collection. Users should refer to the supplemental appendices in the Early Childhood Longitudinal Study, Kindergarten Class of 2010–11 (ECLS-K:2011), User’s Manual for the ECLS-K:2011 Kindergarten Data File and Electronic Codebook, Public Version (NCES 2015-074) (Tourangeau et al. 2015) for information about variables associated with the kindergarten rounds of data collection, to the Early Childhood Longitudinal Study, Kindergarten Class of 2010–11 (ECLS-K:2011), User’s Manual for the ECLS-K:2011 Kindergarten–First Grade Data File and Electronic Codebook, Public Version (NCES 2015-078) (Tourangeau et al. 2015) for information about the variables associated with the first-grade rounds of data collection, to the Early Childhood Longitudinal Study, Kindergarten Class of 2010–11 (ECLS-K:2011), User’s Manual for the ECLS-K:2011 Kindergarten–Second Grade Data File and Electronic Codebook, Public Version (NCES 2017-285) (Tourangeau et al. 2017) for information about the variables associated with the second-grade rounds of data collection, and to the Early Childhood Longitudinal Study, Kindergarten Class of 2010–11 (ECLS-K:2011), User’s Manual for the ECLS-K:2011 Kindergarten–Third Grade Data File and Electronic Codebook, Public Version (NCES 2018-034) (Tourangeau et al. 2018) for information about the variables associated with the fourth-grade rounds of data collection.
The K-4 PUF is derived from the K-4 restricted-use file, or RUF, and is identical in format. All the variables from the K-4 restricted-use file are included in the same order on the K-4 public-use file. Like the RUF, the PUF is a child-level file that contains assessment data and parent, teacher, and school information collected for all 18,174 study children who are considered base-year respondents. Data masking techniques were applied to variables in the K-4 RUF to make it suitable for release to researchers without a restricted-use license. These masking techniques, which are described further in the next section, include suppression
B-2
of sensitive data or variables that apply to only a small subset of study participants, collapsing variable categories, top- or bottom-coding values that are unusually low or unusually high, converting continuous variables to categorical variables and adding noise to school information from the study that is also present in the school sampling frame. These techniques are applied to the data to minimize the risk that any study participant can be identified using the information provided in the data file about them.
2 Masked Variables
As noted above, the masking techniques used to produce the ECLS-K:2011 public-use data file include variable recoding and suppression. The purpose of masking is to provide data in a format that minimizes the potential for a respondent to be identified because of that respondent’s characteristics or a unique combination of characteristics. For example, there is potential for the principal of a school to be identified if the zip code of that school, the number of students in the school, and the age and race/ethnicity of that principal are all provided in the data file. To guard against this potential disclosure, zip code and principal race/ethnicity are suppressed (i.e., not provided) in the PUF, and the number of students in the school and principal age are provided in categories rather than as exact values. There are several types of modifications to variables in the K-4 PUF, as described below.
Outliers (that is, unusually high or unusually low values) are top- or bottom-coded to
prevent identification of unique schools, teachers, parents, and children without affecting overall data quality. The category value labels for variables that are top- and bottom-coded in the PUF are edited versions of the RUF category labels and reflect the new highest and lowest categories.
Some continuous variables are converted into categorical variables, and some categorical variables have their categories collapsed in the K-4 PUF. Category value labels are provided for continuous variables that are converted into categorical variables.
Variables with too few cases and/or a sparse distribution are suppressed in the K-4 PUF. The values for these variables are set to -2 and labeled “suppressed” in the Electronic Codebook (ECB). The value -2 means that the data for this variable are suppressed to protect the respondent’s confidentiality.
Variables that provide a particularly identifying characteristic, such as a specific disability, or information that could be matched against external data sources to obtain a specific identifying characteristic, such as exact date of marriage or divorce, are also suppressed. The values for these variables are set to -2.

B-3
The variables from kindergarten through second grade are masked identically in the K-4 PUF as they were in the K-2 PUF. To the greatest extent possible, third- and fourth-grade variables have been masked to be consistent with the masking for similar kindergarten through second-grade variables.
Variables with information that could be found in the school sampling frame have noise added to them unless they were already masked using any of the methods above. This is only for a small number of records that might be identified using these and other frame variables.
There is a comment field in the variable frequency distribution view screen of the ECB that displays a comment for each masked variable indicating whether the variable from the restricted-use file has been recoded or suppressed in the K-4 PUF.
Exhibits B-1 to B-8 present the lists of masked variables for fourth grade. The exhibits display
the variable name, variable label, and a comment indicating whether the variable was recoded or suppressed, and the reason for suppression. See section 7.1 of this manual for the variable naming conventions.
All variables from the special education teacher questionnaire part A (i.e., all variables with
the prefix D8) and from the special education teacher questionnaire part B (i.e., all variables with the prefix E8) are suppressed on the K-4 PUF. For brevity, these variables are not included in the exhibits.

B-4
Exhibit B-1. ECLS-K:2011 masked variables, spring 2015 child assessment
Variable name Variable description Comments
C8HGT1 C8 ACQ005 HEIGHT MEASUREMENT 1 Data recoded for respondent confidentiality C8WGT1 C8 ACQ010 WEIGHT MEASUREMENT 1 Data recoded for respondent confidentiality C8HGT2 C8 ACQ015 HEIGHT MEASUREMENT 2 Data recoded for respondent confidentiality C8WGT2 C8 ACQ020 WEIGHT MEASUREMENT 2 Data recoded for respondent confidentiality C8FRDRILL C8 ACQ030 INTERRUPTION - FIRE DRILL Data suppressed for respondent confidentiality C8BMBTHR C8 ACQ030 INTERRUPTION - BOMB THREAT Data suppressed for respondent confidentiality C8SPECAC C8 ACQ045 SPECIAL ACCOMMODATION LISTED Data suppressed for respondent confidentiality C8ACCOM C8 ONE OF LISTED ACCOMMODATIONS PROVIDED Data suppressed for respondent confidentiality C8SETTNG C8 ACQ055 ACCMMDTNS PROVIDED - SETTING Data suppressed for respondent confidentiality C8SCHEDL C8 ACQ055 ACCMMDTNS PROVIDED - SCHEDULE Data suppressed for respondent confidentiality C8AIDE C8 ACQ055 ACCMMDTNS PROVIDED - AIDE Data suppressed for respondent confidentiality C8DEVICE C8 ACQ055 ACCMMDTNS PROVIDED - DEVICE Data suppressed for respondent confidentiality C8IEPPRO C8 ACQ055 ACCMMDTNS PROVIDED - IEP Data suppressed for respondent confidentiality C8BREAKS C8 ACQ055 ACCMMDTNS PROVIDED - BREAKS Data suppressed for respondent confidentiality C8EXTTIM C8 ACQ055 ACCMMDTNS PROVIDED - EXT TIME Data suppressed for respondent confidentiality C8STAFF C8 ACQ055 ACCMMDTNS PROVIDED - STAFF Data suppressed for respondent confidentiality C8BRKRES C8 REASON FOR THE BREAKOFF Data suppressed for respondent confidentiality C8LIMITX C8 ACQ041 PHYS LIMITN AFFECT DCCS/FLANKR Data suppressed for respondent confidentiality
SOURCE: U.S. Department of Education, National Center for Education Statistics, Early Childhood Longitudinal Study, Kindergarten Class of 2010–11 (ECLS-K:2011) kindergarten–fourth grade (K-4) public-use data file.

B-5
Exhibit B-2. ECLS-K:2011 masked variables, spring 2015 parent interview
Variable name Variable description Comments
P8CENTRC P8 HOME CENSUS TRACT CODE Data suppressed for respondent confidentiality P8HOMZIP P8 HOME ZIP CODE Data suppressed for respondent confidentiality P8BTHPLC P8 INQ300 CHILD BORN IN THIS COUNTRY Data suppressed for respondent confidentiality P8CNTRYB P8 INQ310 CHILD COUNTRY OF BIRTH Data suppressed for respondent confidentiality P8YRCOME P8 INQ320 YEAR CHILD CAME TO UNITED STATES Data suppressed for respondent confidentiality P8CITIZN P8 INQ330 CHILD A U.S. CITIZEN Data suppressed for respondent confidentiality P8REASL1 P8 FSQ015 REASON LEFT - PERS 1 Data suppressed for respondent confidentiality P8REASL2 P8 FSQ015 REASON LEFT - PERS 2 Data suppressed for respondent confidentiality P8REASL3 P8 FSQ015 REASON LEFT - PERS 3 Data suppressed for respondent confidentiality P8REASL4 P8 FSQ015 REASON LEFT - PERS 4 Data suppressed for respondent confidentiality P8REASL5 P8 FSQ015 REASON LEFT - PERS 5 Data suppressed for respondent confidentiality P8REASL6 P8 FSQ015 REASON LEFT - PERS 6 Data suppressed for respondent confidentiality P8REASL7 P8 FSQ015 REASON LEFT - PERS 7 Data suppressed for respondent confidentiality P8REASL8 P8 FSQ015 REASON LEFT - PERS 8 Data suppressed for respondent confidentiality P8REASL9 P8 FSQ015 REASON LEFT - PERS 9 Data suppressed for respondent confidentiality P8REASL10 P8 FSQ015 REASON LEFT - PERS 10 Data suppressed for respondent confidentiality P8REASL11 P8 FSQ015 REASON LEFT - PERS 11 Data suppressed for respondent confidentiality P8REASL12 P8 FSQ015 REASON LEFT - PERS 12 Data suppressed for respondent confidentiality P8REASL13 P8 FSQ015 REASON LEFT - PERS 13 Data suppressed for respondent confidentiality P8REASL14 P8 FSQ015 REASON LEFT - PERS 14 Data suppressed for respondent confidentiality P8REASL15 P8 FSQ015 REASON LEFT - PERS 15 Data suppressed for respondent confidentiality P8REASL16 P8 FSQ015 REASON LEFT - PERS 16 Data suppressed for respondent confidentiality P8REASL17 P8 FSQ015 REASON LEFT - PERS 17 Data suppressed for respondent confidentiality P8REASL18 P8 FSQ015 REASON LEFT - PERS 18 Data suppressed for respondent confidentiality P8REASL19 P8 FSQ015 REASON LEFT - PERS 19 Data suppressed for respondent confidentiality P8REASL20 P8 FSQ015 REASON LEFT - PERS 20 Data suppressed for respondent confidentiality P8REASL21 P8 FSQ015 REASON LEFT - PERS 21 Data suppressed for respondent confidentiality P8REASL22 P8 FSQ015 REASON LEFT - PERS 22 Data suppressed for respondent confidentiality P8REASL23 P8 FSQ015 REASON LEFT - PERS 23 Data suppressed for respondent confidentiality P8REASL24 P8 FSQ015 REASON LEFT - PERS 24 Data suppressed for respondent confidentiality P8REASL25 P8 FSQ015 REASON LEFT - PERS 25 Data suppressed for respondent confidentiality P8CURMAR P8 FSQ200 CURRENT MARITAL STATUS Data recoded for respondent confidentiality P8SCHRWK P8 CCQ377 HR/WK CHILD CARES FOR SELF Data recoded for respondent confidentiality P8BMCNTC P8 NRQ040 TIME FROM LAST CONTACT-BIOMOM Data recoded for respondent confidentiality P8AMCNTC P8 NRQ040 TIME FROM LAST CONTACT-ADPMOM Data suppressed for respondent confidentiality P8AMPHEM P8 NRQ123 #TIMES PHONE/CALL/EMAIL/TEXT Data suppressed for respondent confidentiality P8BDCNTC P8 NRQ040 TIME FROM LAST CONTACT-BIODAD Data recoded for respondent confidentiality P8ADCNTC P8 NRQ040 TIME FROM LAST CONTACT-ADPDAD Data suppressed for respondent confidentiality P8ADPHEM P8 NRQ123 #TIMES PHONE/CALL/EMAIL/TEXT Data suppressed for respondent confidentiality
See note at end of exhibit.
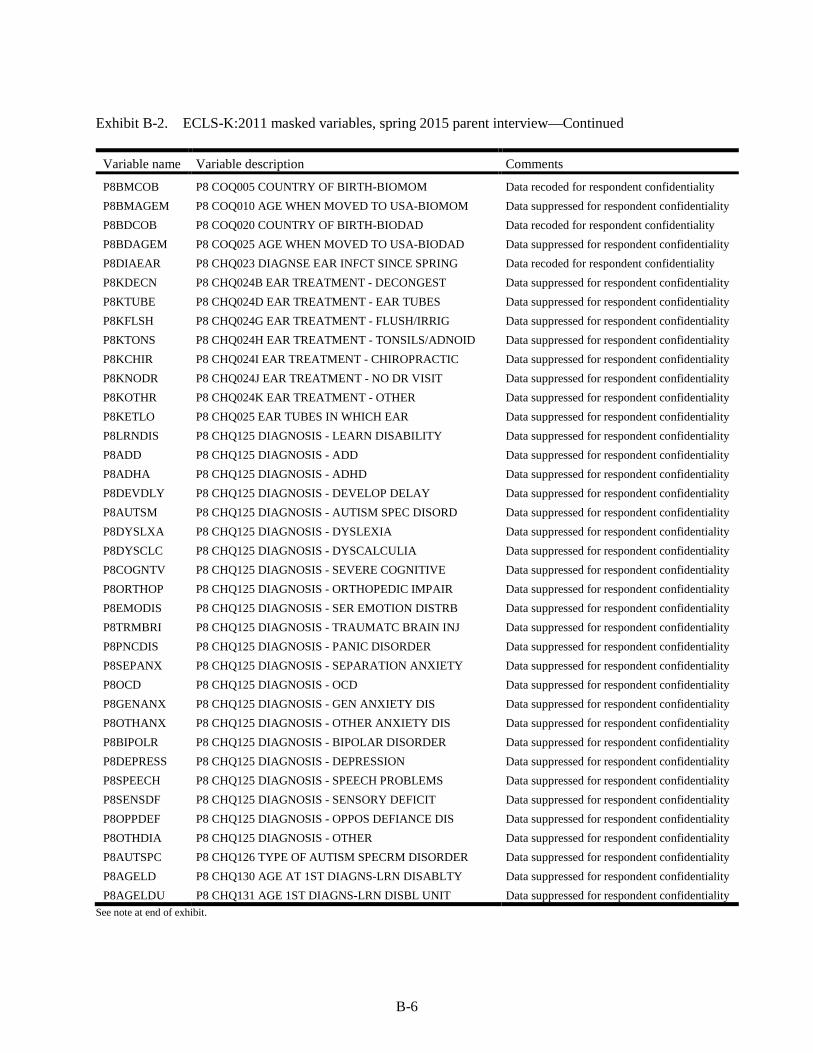
B-6
Exhibit B-2. ECLS-K:2011 masked variables, spring 2015 parent interview—Continued
Variable name Variable description Comments
P8BMCOB P8 COQ005 COUNTRY OF BIRTH-BIOMOM Data recoded for respondent confidentiality P8BMAGEM P8 COQ010 AGE WHEN MOVED TO USA-BIOMOM Data suppressed for respondent confidentiality P8BDCOB P8 COQ020 COUNTRY OF BIRTH-BIODAD Data recoded for respondent confidentiality P8BDAGEM P8 COQ025 AGE WHEN MOVED TO USA-BIODAD Data suppressed for respondent confidentiality P8DIAEAR P8 CHQ023 DIAGNSE EAR INFCT SINCE SPRING Data recoded for respondent confidentiality P8KDECN P8 CHQ024B EAR TREATMENT - DECONGEST Data suppressed for respondent confidentiality P8KTUBE P8 CHQ024D EAR TREATMENT - EAR TUBES Data suppressed for respondent confidentiality P8KFLSH P8 CHQ024G EAR TREATMENT - FLUSH/IRRIG Data suppressed for respondent confidentiality P8KTONS P8 CHQ024H EAR TREATMENT - TONSILS/ADNOID Data suppressed for respondent confidentiality P8KCHIR P8 CHQ024I EAR TREATMENT - CHIROPRACTIC Data suppressed for respondent confidentiality P8KNODR P8 CHQ024J EAR TREATMENT - NO DR VISIT Data suppressed for respondent confidentiality P8KOTHR P8 CHQ024K EAR TREATMENT - OTHER Data suppressed for respondent confidentiality P8KETLO P8 CHQ025 EAR TUBES IN WHICH EAR Data suppressed for respondent confidentiality P8LRNDIS P8 CHQ125 DIAGNOSIS - LEARN DISABILITY Data suppressed for respondent confidentiality P8ADD P8 CHQ125 DIAGNOSIS - ADD Data suppressed for respondent confidentiality P8ADHA P8 CHQ125 DIAGNOSIS - ADHD Data suppressed for respondent confidentiality P8DEVDLY P8 CHQ125 DIAGNOSIS - DEVELOP DELAY Data suppressed for respondent confidentiality P8AUTSM P8 CHQ125 DIAGNOSIS - AUTISM SPEC DISORD Data suppressed for respondent confidentiality P8DYSLXA P8 CHQ125 DIAGNOSIS - DYSLEXIA Data suppressed for respondent confidentiality P8DYSCLC P8 CHQ125 DIAGNOSIS - DYSCALCULIA Data suppressed for respondent confidentiality P8COGNTV P8 CHQ125 DIAGNOSIS - SEVERE COGNITIVE Data suppressed for respondent confidentiality P8ORTHOP P8 CHQ125 DIAGNOSIS - ORTHOPEDIC IMPAIR Data suppressed for respondent confidentiality P8EMODIS P8 CHQ125 DIAGNOSIS - SER EMOTION DISTRB Data suppressed for respondent confidentiality P8TRMBRI P8 CHQ125 DIAGNOSIS - TRAUMATC BRAIN INJ Data suppressed for respondent confidentiality P8PNCDIS P8 CHQ125 DIAGNOSIS - PANIC DISORDER Data suppressed for respondent confidentiality P8SEPANX P8 CHQ125 DIAGNOSIS - SEPARATION ANXIETY Data suppressed for respondent confidentiality P8OCD P8 CHQ125 DIAGNOSIS - OCD Data suppressed for respondent confidentiality P8GENANX P8 CHQ125 DIAGNOSIS - GEN ANXIETY DIS Data suppressed for respondent confidentiality P8OTHANX P8 CHQ125 DIAGNOSIS - OTHER ANXIETY DIS Data suppressed for respondent confidentiality P8BIPOLR P8 CHQ125 DIAGNOSIS - BIPOLAR DISORDER Data suppressed for respondent confidentiality P8DEPRESS P8 CHQ125 DIAGNOSIS - DEPRESSION Data suppressed for respondent confidentiality P8SPEECH P8 CHQ125 DIAGNOSIS - SPEECH PROBLEMS Data suppressed for respondent confidentiality P8SENSDF P8 CHQ125 DIAGNOSIS - SENSORY DEFICIT Data suppressed for respondent confidentiality P8OPPDEF P8 CHQ125 DIAGNOSIS - OPPOS DEFIANCE DIS Data suppressed for respondent confidentiality P8OTHDIA P8 CHQ125 DIAGNOSIS - OTHER Data suppressed for respondent confidentiality P8AUTSPC P8 CHQ126 TYPE OF AUTISM SPECRM DISORDER Data suppressed for respondent confidentiality P8AGELD P8 CHQ130 AGE AT 1ST DIAGNS-LRN DISABLTY Data suppressed for respondent confidentiality P8AGELDU P8 CHQ131 AGE 1ST DIAGNS-LRN DISBL UNIT Data suppressed for respondent confidentiality
See note at end of exhibit.

B-7
Exhibit B-2. ECLS-K:2011 masked variables, spring 2015 parent interview—Continued
Variable name Variable description Comments
P8AGELDM P8 CHQ135A AGE 1ST DIAGNS-LRN DIS MONTH Data suppressed for respondent confidentiality P8AGELDY P8 CHQ135B AGE 1ST DIAGNS-LRN DIS YEAR Data suppressed for respondent confidentiality P8MEDLD P8 CHQ140 TAKE PRESCRIPTION FOR LRN DIS Data suppressed for respondent confidentiality P8MEDLDL P8 CHQ173 HOW LONG TAKING MED - LRN DIS Data suppressed for respondent confidentiality P8AGEADD P8 CHQ130 AGE AT 1ST DIAGNS-ADD Data suppressed for respondent confidentiality P8AGEADU P8 CHQ131 AGE 1ST DIAGNS-ADD UNIT Data suppressed for respondent confidentiality P8AGEADM P8 CHQ135A AGE 1ST DIAGNS-ADD MONTH Data suppressed for respondent confidentiality P8AGEADY P8 CHQ135B AGE 1ST DIAGNS-ADD YEAR Data suppressed for respondent confidentiality P8MEDAD P8 CHQ140 TAKING PRESCRIPTION FOR ADD Data suppressed for respondent confidentiality P8LOCMED1 P8 CHQ155 LOCATION TAKING RX -ADD Data suppressed for respondent confidentiality P8MEDLAD P8 CHQ173 HOW LONG TAKING MED - ADD Data suppressed for respondent confidentiality P8AGEAHD P8 CHQ130 AGE AT 1ST DIAGNS-ADHD Data suppressed for respondent confidentiality P8AGEHDU P8 CHQ131 AGE 1ST DIAGNS-ADHD UNIT Data suppressed for respondent confidentiality P8AGEHDM P8 CHQ135A AGE 1ST DIAGNS-ADHD MONTH Data suppressed for respondent confidentiality P8AGEHDY P8 CHQ135B AGE 1ST DIAGNS-ADHD YEAR Data suppressed for respondent confidentiality P8MEDHD P8 CHQ140 TAKE PRESCRIPTION FOR ADHD Data suppressed for respondent confidentiality P8LOCMED2 P8 CHQ155 LOCATION TAKING RX-ADHD Data suppressed for respondent confidentiality P8MEDLHD P8 CHQ173 HOW LONG TAKING MED - ADHD Data suppressed for respondent confidentiality P8AGEDV P8 CHQ130 AGE AT 1ST DIAGNS-DEV DELAY Data suppressed for respondent confidentiality P8AGEDVU P8 CHQ131 AGE 1ST DIAGNS-DEV DEL UNIT Data suppressed for respondent confidentiality P8AGEDVM P8 CHQ135A AGE 1ST DIAGNS-DEV DEL MONTH Data suppressed for respondent confidentiality P8AGEDVY P8 CHQ135B AGE 1ST DIAGNS-DEV DEL YEAR Data suppressed for respondent confidentiality P8MEDDV P8 CHQ140 TAKE PRESCRIPTION FOR DEV DEL Data suppressed for respondent confidentiality P8MEDDVL P8 CHQ173 HOW LONG TAKING MED - DEV DEL Data suppressed for respondent confidentiality P8AGEAU P8 CHQ130 AGE AT 1ST DIAGNS-AUTISM SD Data suppressed for respondent confidentiality P8AGEAUU P8 CHQ131 AGE 1ST DIAGNS-AUTISM SD UNIT Data suppressed for respondent confidentiality P8AGEAUM P8 CHQ135A AGE 1ST DIAGNS-AUTISM SD MNTH Data suppressed for respondent confidentiality P8AGEAUY P8 CHQ135B AGE 1ST DIAGNS-AUTISM SD YEAR Data suppressed for respondent confidentiality P8MEDAU P8 CHQ140 TAKE PRESCRIPTION AUTISM SD Data suppressed for respondent confidentiality P8MEDAUL P8 CHQ173 HOW LONG TAKING MED -AUTISM SD Data suppressed for respondent confidentiality P8AGEDL P8 CHQ130 AGE AT 1ST DIAGNS-DYSLXIA Data suppressed for respondent confidentiality P8AGEDLU P8 CHQ131 AGE 1ST DIAGNS-DYSLXIA UNIT Data suppressed for respondent confidentiality P8AGEDLM P8 CHQ135A AGE 1ST DIAGNS-DYSLXIA MONTH Data suppressed for respondent confidentiality P8AGEDLY P8 CHQ135B AGE 1ST DIAGNS-DYSLXIA YEAR Data suppressed for respondent confidentiality P8MEDDL P8 CHQ140 TAKE PRESCRIPTION FOR DYSLXIA Data suppressed for respondent confidentiality P8MEDDLL P8 CHQ173 HOW LONG TAKING MED - DYSLXIA Data suppressed for respondent confidentiality P8AGEDC P8 CHQ130 AGE AT 1ST DIAGNS-DYSCALCULIA Data suppressed for respondent confidentiality P8AGEDCU P8 CHQ131 AGE 1ST DIAGNS-DYSCLC UNIT Data suppressed for respondent confidentiality
See note at end of exhibit.
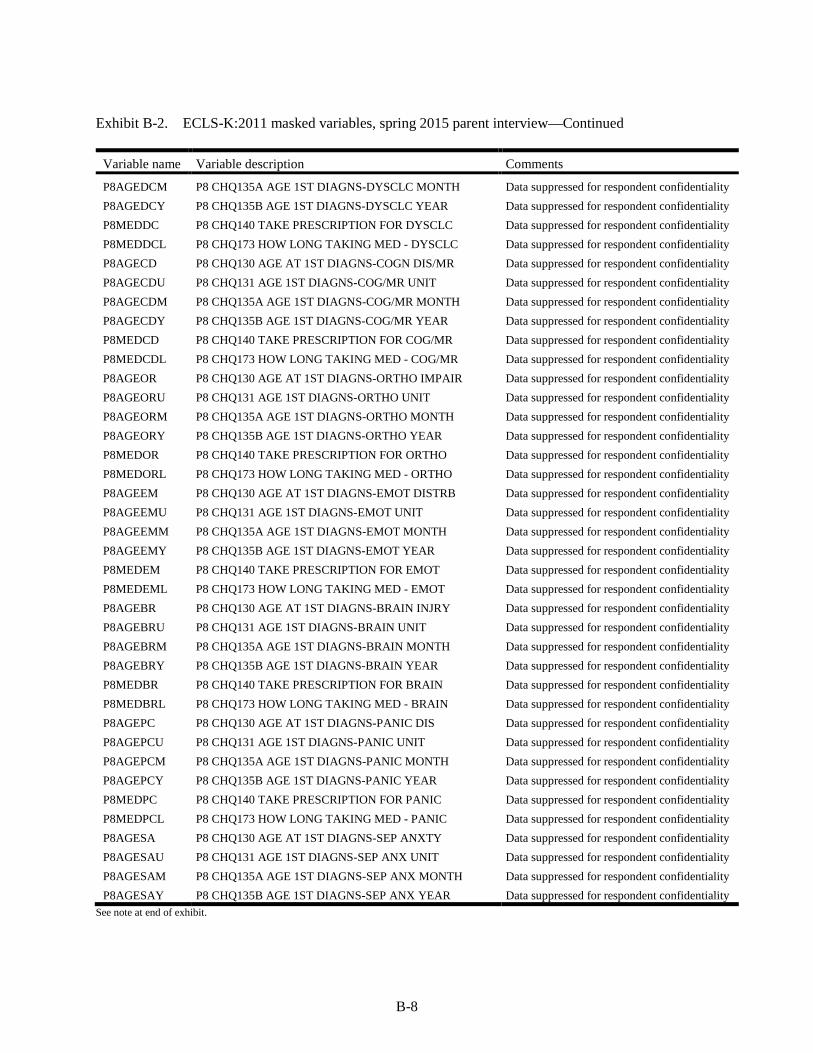
B-8
Exhibit B-2. ECLS-K:2011 masked variables, spring 2015 parent interview—Continued
Variable name Variable description Comments
P8AGEDCM P8 CHQ135A AGE 1ST DIAGNS-DYSCLC MONTH Data suppressed for respondent confidentiality P8AGEDCY P8 CHQ135B AGE 1ST DIAGNS-DYSCLC YEAR Data suppressed for respondent confidentiality P8MEDDC P8 CHQ140 TAKE PRESCRIPTION FOR DYSCLC Data suppressed for respondent confidentiality P8MEDDCL P8 CHQ173 HOW LONG TAKING MED - DYSCLC Data suppressed for respondent confidentiality P8AGECD P8 CHQ130 AGE AT 1ST DIAGNS-COGN DIS/MR Data suppressed for respondent confidentiality P8AGECDU P8 CHQ131 AGE 1ST DIAGNS-COG/MR UNIT Data suppressed for respondent confidentiality P8AGECDM P8 CHQ135A AGE 1ST DIAGNS-COG/MR MONTH Data suppressed for respondent confidentiality P8AGECDY P8 CHQ135B AGE 1ST DIAGNS-COG/MR YEAR Data suppressed for respondent confidentiality P8MEDCD P8 CHQ140 TAKE PRESCRIPTION FOR COG/MR Data suppressed for respondent confidentiality P8MEDCDL P8 CHQ173 HOW LONG TAKING MED - COG/MR Data suppressed for respondent confidentiality P8AGEOR P8 CHQ130 AGE AT 1ST DIAGNS-ORTHO IMPAIR Data suppressed for respondent confidentiality P8AGEORU P8 CHQ131 AGE 1ST DIAGNS-ORTHO UNIT Data suppressed for respondent confidentiality P8AGEORM P8 CHQ135A AGE 1ST DIAGNS-ORTHO MONTH Data suppressed for respondent confidentiality P8AGEORY P8 CHQ135B AGE 1ST DIAGNS-ORTHO YEAR Data suppressed for respondent confidentiality P8MEDOR P8 CHQ140 TAKE PRESCRIPTION FOR ORTHO Data suppressed for respondent confidentiality P8MEDORL P8 CHQ173 HOW LONG TAKING MED - ORTHO Data suppressed for respondent confidentiality P8AGEEM P8 CHQ130 AGE AT 1ST DIAGNS-EMOT DISTRB Data suppressed for respondent confidentiality P8AGEEMU P8 CHQ131 AGE 1ST DIAGNS-EMOT UNIT Data suppressed for respondent confidentiality P8AGEEMM P8 CHQ135A AGE 1ST DIAGNS-EMOT MONTH Data suppressed for respondent confidentiality P8AGEEMY P8 CHQ135B AGE 1ST DIAGNS-EMOT YEAR Data suppressed for respondent confidentiality P8MEDEM P8 CHQ140 TAKE PRESCRIPTION FOR EMOT Data suppressed for respondent confidentiality P8MEDEML P8 CHQ173 HOW LONG TAKING MED - EMOT Data suppressed for respondent confidentiality P8AGEBR P8 CHQ130 AGE AT 1ST DIAGNS-BRAIN INJRY Data suppressed for respondent confidentiality P8AGEBRU P8 CHQ131 AGE 1ST DIAGNS-BRAIN UNIT Data suppressed for respondent confidentiality P8AGEBRM P8 CHQ135A AGE 1ST DIAGNS-BRAIN MONTH Data suppressed for respondent confidentiality P8AGEBRY P8 CHQ135B AGE 1ST DIAGNS-BRAIN YEAR Data suppressed for respondent confidentiality P8MEDBR P8 CHQ140 TAKE PRESCRIPTION FOR BRAIN Data suppressed for respondent confidentiality P8MEDBRL P8 CHQ173 HOW LONG TAKING MED - BRAIN Data suppressed for respondent confidentiality P8AGEPC P8 CHQ130 AGE AT 1ST DIAGNS-PANIC DIS Data suppressed for respondent confidentiality P8AGEPCU P8 CHQ131 AGE 1ST DIAGNS-PANIC UNIT Data suppressed for respondent confidentiality P8AGEPCM P8 CHQ135A AGE 1ST DIAGNS-PANIC MONTH Data suppressed for respondent confidentiality P8AGEPCY P8 CHQ135B AGE 1ST DIAGNS-PANIC YEAR Data suppressed for respondent confidentiality P8MEDPC P8 CHQ140 TAKE PRESCRIPTION FOR PANIC Data suppressed for respondent confidentiality P8MEDPCL P8 CHQ173 HOW LONG TAKING MED - PANIC Data suppressed for respondent confidentiality P8AGESA P8 CHQ130 AGE AT 1ST DIAGNS-SEP ANXTY Data suppressed for respondent confidentiality P8AGESAU P8 CHQ131 AGE 1ST DIAGNS-SEP ANX UNIT Data suppressed for respondent confidentiality P8AGESAM P8 CHQ135A AGE 1ST DIAGNS-SEP ANX MONTH Data suppressed for respondent confidentiality P8AGESAY P8 CHQ135B AGE 1ST DIAGNS-SEP ANX YEAR Data suppressed for respondent confidentiality
See note at end of exhibit.

B-9
Exhibit B-2. ECLS-K:2011 masked variables, spring 2015 parent interview—Continued
Variable name Variable description Comments
P8MEDSA P8 CHQ140 TAKE PRESCRIPTION FOR SEP ANX Data suppressed for respondent confidentiality P8MEDSAL P8 CHQ173 HOW LONG TAKING MED - SEP ANX Data suppressed for respondent confidentiality P8AGEOC P8 CHQ130 AGE AT 1ST DIAGNS-OCD Data suppressed for respondent confidentiality P8AGEOCU P8 CHQ131 AGE 1ST DIAGNS-OCD UNIT Data suppressed for respondent confidentiality P8AGEOCM P8 CHQ135A AGE 1ST DIAGNS-OCD MONTH Data suppressed for respondent confidentiality P8AGEOCY P8 CHQ135B AGE 1ST DIAGNS-OCD YEAR Data suppressed for respondent confidentiality P8MEDOC P8 CHQ140 TAKE PRESCRIPTION FOR OCD Data suppressed for respondent confidentiality P8MEDOCL P8 CHQ173 HOW LONG TAKING MED - OCD Data suppressed for respondent confidentiality P8AGEGA P8 CHQ130 AGE AT 1ST DIAGNS-GAD Data suppressed for respondent confidentiality P8AGEGAU P8 CHQ131 AGE 1ST DIAGNS-GAD UNIT Data suppressed for respondent confidentiality P8AGEGAM P8 CHQ135A AGE 1ST DIAGNS-GAD MONTH Data suppressed for respondent confidentiality P8AGEGAY P8 CHQ135B AGE 1ST DIAGNS-GAD YEAR Data suppressed for respondent confidentiality P8MEDGA P8 CHQ140 TAKE PRESCRIPTION FOR GAD Data suppressed for respondent confidentiality P8MEDGAL P8 CHQ173 HOW LONG TAKING MED - GAD Data suppressed for respondent confidentiality P8AGEAN P8 CHQ130 AGE AT 1ST DIAGNS-OTH ANXTY DS Data suppressed for respondent confidentiality P8AGEANU P8 CHQ131 AGE 1ST DIAGNS-ANXTY UNIT Data suppressed for respondent confidentiality P8AGEANM P8 CHQ135A AGE 1ST DIAGNS-ANXTY MONTH Data suppressed for respondent confidentiality P8AGEANY P8 CHQ135B AGE 1ST DIAGNS-ANXTY YEAR Data suppressed for respondent confidentiality P8MEDAN P8 CHQ140 TAKE PRESCRIPTION FOR ANXTY Data suppressed for respondent confidentiality P8MEDANL P8 CHQ173 HOW LONG TAKING MED - ANXTY Data suppressed for respondent confidentiality P8AGEBI P8 CHQ130 AGE AT 1ST DIAGNS-BIPOLAR Data suppressed for respondent confidentiality P8AGEBIU P8 CHQ131 AGE 1ST DIAGNS-BIPLR UNIT Data suppressed for respondent confidentiality P8AGEBIM P8 CHQ135A AGE 1ST DIAGNS-BIPLR MONTH Data suppressed for respondent confidentiality P8AGEBIY P8 CHQ135B AGE 1ST DIAGNS-BIPLR YEAR Data suppressed for respondent confidentiality P8MEDBI P8 CHQ140 TAKE PRESCRIPTION FOR BIPLR Data suppressed for respondent confidentiality P8MEDBIL P8 CHQ173 HOW LONG TAKING MED - BIPLR Data suppressed for respondent confidentiality P8AGEDE P8 CHQ130 AGE AT 1ST DIAGNS-DEPRSSION Data suppressed for respondent confidentiality P8AGEDEU P8 CHQ131 AGE 1ST DIAGNS-DEPRSS UNIT Data suppressed for respondent confidentiality P8AGEDEM P8 CHQ135A AGE 1ST DIAGNS-DEPRSS MONTH Data suppressed for respondent confidentiality P8AGEDEY P8 CHQ135B AGE 1ST DIAGNS-DEPRSS YEAR Data suppressed for respondent confidentiality P8MEDDE P8 CHQ140 TAKE PRESCRIPTION FOR DEPRSS Data suppressed for respondent confidentiality P8MEDDEL P8 CHQ173 HOW LONG TAKING MED - DEPRSS Data suppressed for respondent confidentiality P8AGESPC P8 CHQ130 AGE AT 1ST DIAGNS-SPEECH Data suppressed for respondent confidentiality P8AGESPU P8 CHQ131 AGE 1ST DIAGNS-SPEECH UNIT Data suppressed for respondent confidentiality P8AGESPM P8 CHQ135A AGE 1ST DIAGNS-SPEECH MONTH Data suppressed for respondent confidentiality P8AGESPY P8 CHQ135B AGE 1ST DIAGNS-SPEECH YEAR Data suppressed for respondent confidentiality P8MEDSPC P8 CHQ140 TAKE PRESCRIPTION FOR SPEECH Data suppressed for respondent confidentiality P8MEDSPL P8 CHQ173 HOW LONG TAKING MED - SPEECH Data suppressed for respondent confidentiality
See note at end of exhibit.

B-10
Exhibit B-2. ECLS-K:2011 masked variables, spring 2015 parent interview—Continued
Variable name Variable description Comments
P8AGESDF P8 CHQ130 AGE AT 1ST DIAGNS-SENS DEF Data suppressed for respondent confidentiality P8AGESDU P8 CHQ131 AGE 1ST DIAGNS-SENS DEF UNIT Data suppressed for respondent confidentiality P8AGESDM P8 CHQ135A AGE 1ST DIAGNS-SENS DEF MONTH Data suppressed for respondent confidentiality P8AGESDY P8 CHQ135B AGE 1ST DIAGNS-SENS DEF YEAR Data suppressed for respondent confidentiality P8MEDSDF P8 CHQ140 TAKE PRESCRIPTION FOR SENS DEF Data suppressed for respondent confidentiality P8MEDSDL P8 CHQ173 HOW LONG TAKING MED-OPP DEF Data suppressed for respondent confidentiality P8AGEODF P8 CHQ130 AGE AT 1ST DIAGNS-OPP DEF Data suppressed for respondent confidentiality P8AGEODU P8 CHQ131 AGE 1ST DIAGNS-OPP DEF UNIT Data suppressed for respondent confidentiality P8AGEODM P8 CHQ135A AGE 1ST DIAGNS-OPP DEF MONTH Data suppressed for respondent confidentiality P8AGEODY P8 CHQ135B AGE 1ST DIAGNS-OPP DEF YEAR Data suppressed for respondent confidentiality P8MEDODF P8 CHQ140 TAKE PRESCRIPTION FOR OPP DEF Data suppressed for respondent confidentiality P8MEDODL P8 CHQ173 HOW LONG TAKING MED - OPP DEF Data suppressed for respondent confidentiality P8AGEOT P8 CHQ130 AGE AT 1ST DIAGNS-OTHER Data suppressed for respondent confidentiality P8AGEOTU P8 CHQ131 AGE 1ST DIAGNS-OTH UNIT Data suppressed for respondent confidentiality P8AGEOTM P8 CHQ135A AGE 1ST DIAGNS-OTH MONTH Data suppressed for respondent confidentiality P8AGEOTY P8 CHQ135B AGE 1ST DIAGNS-OTH YEAR Data suppressed for respondent confidentiality P8MEDOT P8 CHQ140 TAKE PRESCRIPTION FOR OTH Data suppressed for respondent confidentiality P8MEDOTL P8 CHQ173 HOW LONG TAKING MED - OTH Data suppressed for respondent confidentiality P8DEHEAR P8 CHQ216 DESCRIBE HEARING Data recoded for respondent confidentiality P8HEARWH P8 CHQ217 HEAR WHISPER IN QUIET ROOM Data suppressed for respondent confidentiality P8HEARNO P8 CHQ218 HEAR NORMAL IN QUIET ROOM Data suppressed for respondent confidentiality P8HEARQT P8 CHQ219 HEAR SHOUT IN QUIET ROOM Data suppressed for respondent confidentiality P8HEARYL P8 CHQ220 HEAR IF SPEAKS LOUDLY IN EAR Data suppressed for respondent confidentiality P8DESCHR P8 CHQ222 DESCRIBES HEARING IN WORSE EAR Data suppressed for respondent confidentiality P8EARWX P8 CHQ246 HEARING DIAGNOSIS-EAR WAX Data suppressed for respondent confidentiality P8CLDFRM P8 CHQ246 HEARING DIAGNOSIS-CANAL DEFORM Data suppressed for respondent confidentiality P8EARSCK P8 CHQ246 HEARING DIAGNOSIS-EAR INFECTN Data suppressed for respondent confidentiality P8FLDNER P8 CHQ246 HEARING DIAGNOSIS-FLUID IN EAR Data suppressed for respondent confidentiality P8EARDRM P8 CHQ246 HEARING DIAGNOSIS-EAR DRUM PRB Data suppressed for respondent confidentiality P8ILLNES P8 CHQ246 HEARING DIAGNOSIS-ILLNESS Data suppressed for respondent confidentiality P8CMV P8 CHQ246 HEARING DIAGNOSIS-CMV Data suppressed for respondent confidentiality P8OTOTXC P8 CHQ246 HEARING DIAGNOSIS-OTOTOXIC Data suppressed for respondent confidentiality P8NOISE P8 CHQ246 HEARING DIAGNOSIS-NOISE EXP Data suppressed for respondent confidentiality P8GENES P8 CHQ246 HEARING DIAGNOSIS-GENETIC Data suppressed for respondent confidentiality P8HDINJY P8 CHQ246 HEARING DIAGNOSIS-HEAD INJURY Data suppressed for respondent confidentiality P8SURGRY P8 CHQ246 HEARING DIAGNOSIS-SURGERY Data suppressed for respondent confidentiality P8NRVDF P8 CHQ246 HEARING DIAGNOSIS-NERVE DEAF Data suppressed for respondent confidentiality P8CAPDIS P8 CHQ246 HEARING DIAGNOSIS-CAP DISORDER Data suppressed for respondent confidentiality
See note at end of exhibit.

B-11
Exhibit B-2. ECLS-K:2011 masked variables, spring 2015 parent interview—Continued
Variable name Variable description Comments P8DEAF P8 CHQ246 HEARING DIAGNOSIS-DEAF Data suppressed for respondent confidentiality P8HRLSDK P8 CHQ246 HEARING DIAGNOSIS-CAUSE UNKNWN Data suppressed for respondent confidentiality P8AWAIT P8 CHQ246 HEARING DIAGNOSIS-AWAITING EVAL Data suppressed for respondent confidentiality P8HROTHR P8 CHQ246 HEARING DIAGNOSIS-OTHER Data suppressed for respondent confidentiality P8AGHCU1 P8 CHQ250A AGE 1ST DIAGNS-HEARNG/COM UNT Data suppressed for respondent confidentiality P8AGHCM1 P8 CHQ250B AGE 1ST DIAGNS-HEARNG/COM MO Data suppressed for respondent confidentiality P8AGHCY1 P8 CHQ250C AGE 1ST DIAGNS-HEARNG/COM YR Data suppressed for respondent confidentiality P8DTHCM1 P8 CHQ255A L1 COMMUN DIAG DATE - MONTH Data suppressed for respondent confidentiality P8DTHCY1 P8 CHQ255B L1 COMMUN DIAG DATE - YEAR Data suppressed for respondent confidentiality P8AGHCU2 P8 CHQ250A AGE 1ST DIAGNS-HEARNG/COM UNT Data suppressed for respondent confidentiality P8AGHCM2 P8 CHQ250B AGE 1ST DIAGNS-HEARNG/COM MO Data suppressed for respondent confidentiality P8AGHCY2 P8 CHQ250C AGE 1ST DIAGNS-HEARNG/COM YR Data suppressed for respondent confidentiality P8DTHCM2 P8 CHQ255A L2 HEARING DIAG DATE - MONTH Data suppressed for respondent confidentiality P8DTHCY2 P8 CHQ255B L2 HEARING DIAG DATE - YEAR Data suppressed for respondent confidentiality P8SLIHRA P8 CHQ256A SINCE LAST INTVW-HEARING AID Data suppressed for respondent confidentiality P8EVRHRA P8 CHQ256A CHILD EVER WORE HEARING AID Data suppressed for respondent confidentiality P81REHAU P8 CHQ257A 1ST RECOMMEND HEARING AID-UNT Data suppressed for respondent confidentiality P81REHAM P8 CHQ257B 1ST RECOMMEND HEARING AID-MTH Data suppressed for respondent confidentiality P81REHAY P8 CHQ257C 1ST RECOMMEND HEARING AID -YR Data suppressed for respondent confidentiality P8AIDSCH P8 CHQ258 HOW OFTEN HEAR AID IN SCHOOL Data suppressed for respondent confidentiality P8AIDWHS P8 CHQ259 HEAR WHISPER IN QUIET RM W/AID Data suppressed for respondent confidentiality P8AIDREG P8 CHQ260 HEAR NORMAL IN QUIET RM W/AID Data suppressed for respondent confidentiality P8AIDSHT P8 CHQ261 HEAR SHOUT IN QUIET RM W/AID Data suppressed for respondent confidentiality P8AIDEAR P8 CHQ262 HEAR SPEAKS LOUDLY EAR W/AID Data suppressed for respondent confidentiality P8DRREHA P8 CHQ263 DOCTOR RECOMMEND HEAR AID Data suppressed for respondent confidentiality P8DR1REU P8 CHQ264B DOCTOR 1ST RECOM AID - UNIT Data suppressed for respondent confidentiality P8DR1REM P8 CHQ264A DOCTOR 1ST RECOM AID - MONTH Data suppressed for respondent confidentiality P8DR1REY P8 CHQ264C DOCTOR 1ST RECOM AID - YEAR Data suppressed for respondent confidentiality P8COCHLE P8 CHQ270 CHILD HAS COCHLEAR IMPLANT Data suppressed for respondent confidentiality P8IMPLNT P8 CHQ271 YEAR OF IMPLANT Data suppressed for respondent confidentiality P8COAGEU P8 CHQ272A AGE AT IMPLANT - UNIT Data suppressed for respondent confidentiality P8COAGEM P8 CHQ272B AGE AT IMPLANT - MONTH Data suppressed for respondent confidentiality P8COAGEY P8 CHQ272C AGE AT IMPLANT - YEAR Data suppressed for respondent confidentiality P8LIMPYR P8 CHQ273 LEFT EAR IMPLANT YEAR Data suppressed for respondent confidentiality P8RIMPYR P8 CHQ274 RIGHT EAR IMPLANT YEAR Data suppressed for respondent confidentiality P8ALIMPU P8 CHQ275A AGE L IMPLANT - UNIT Data suppressed for respondent confidentiality P8ALIMPM P8 CHQ275B AGE L IMPLANT - MONTH Data suppressed for respondent confidentiality P8ALIMPY P8 CHQ275C AGE L IMPLANT - YEAR Data suppressed for respondent confidentiality
See note at end of exhibit.

B-12
Exhibit B-2. ECLS-K:2011 masked variables, spring 2015 parent interview—Continued
Variable name Variable description Comments
P8ARIMPU P8 CHQ276A AGE R IMPLANT - UNIT Data suppressed for respondent confidentiality P8ARIMPM P8 CHQ276B AGE R IMPLANT - MONTH Data suppressed for respondent confidentiality P8ARIMPY P8 CHQ276C AGE R IMPLANT - YEAR Data suppressed for respondent confidentiality P8COCHWH P8 CHQ277 HR WHISPER IN QUIET RM W/COCH Data suppressed for respondent confidentiality P8COCHRG P8 CHQ278 HEAR NORMAL IN QUIET RM W/COCH Data suppressed for respondent confidentiality P8COCHSH P8 CHQ279 HEAR SHOUT IN QUIET RM W/COCH Data suppressed for respondent confidentiality P8COCHER P8 CHQ280 HEAR SPEAKS LOUDLY EAR W/COCH Data suppressed for respondent confidentiality P8VISCLR P8 CHQ301 VISION DIAGNOSIS - COLOR BLIND Data suppressed for respondent confidentiality P8VISCRS P8 CHQ301 VISION DIAGNOSIS - CROSS EYED Data suppressed for respondent confidentiality P8VISRET P8 CHQ301 VISION DIAGNOSIS - RETINOPATHY Data suppressed for respondent confidentiality P8VISBLN P8 CHQ301 VISION DIAGNOSIS - BLINDNESS Data suppressed for respondent confidentiality P8AWAITG P8 CHQ301 VISION DIAGNOSIS - AWAITING EVAL Data suppressed for respondent confidentiality P8AGVIU1 P8 CHQ305A AGE 1ST DIAGNS-VISION UNIT Data suppressed for respondent confidentiality P8AGVIM1 P8 CHQ305B AGE 1ST DIAGNS-VISION MONTH Data suppressed for respondent confidentiality P8AGVIY1 P8 CHQ305C AGE 1ST DIAGNS-VISION YEAR Data suppressed for respondent confidentiality P8VISMO P8 CHQ310A MONTH 1ST DIAGNS-VISION Data suppressed for respondent confidentiality P8VISYR P8 CHQ310B YEAR 1ST DIAGNS-VISION Data suppressed for respondent confidentiality P8OFTLEN P8 CHQ312 HOW OFTEN CHD WEAR GLASS/LENS Data recoded for respondent confidentiality P8HVELEN P8 CHQ313 DOES CHILD HAVE GLASSES/LENS Data suppressed for respondent confidentiality P8HSCALE P8 CHQ330 1-5 SCALE OF CHILD'S HEALTH Data recoded for respondent confidentiality P8CHPUERTR P8 FSQ196B2 CHILD PUERTO RICAN Data suppressed for respondent confidentiality P8CHCUBAN P8 FSQ196B3 CHILD CUBAN Data suppressed for respondent confidentiality P8CHOTHHSP P8 FSQ196B4 CHILD OTHER SPAN/HISP/LATINO Data suppressed for respondent confidentiality P8CHASIND P8 FSQ197B1 CHILD ASIAN INDIAN Data suppressed for respondent confidentiality P8CHCHIN P8 FSQ197B2 CHILD CHINESE Data suppressed for respondent confidentiality P8CHFILIP P8 FSQ197B3 CHILD FILIPINO Data suppressed for respondent confidentiality P8CHJAPN P8 FSQ197B4 CHILD JAPANESE Data suppressed for respondent confidentiality P8CHKORN P8 FSQ197B5 CHILD KOREAN Data suppressed for respondent confidentiality P8CHVIETN P8 FSQ197B6 CHILD VIETNAMESE Data suppressed for respondent confidentiality P8CHHMNG P8 FSQ197B7 CHILD HMONG Data suppressed for respondent confidentiality P8CHOTHASN P8 FSQ197B8 CHILD OTHER ASIAN Data suppressed for respondent confidentiality P8CHPACISL P8 FSQ198A CHILD MEMBER PACIFIC ISLANDER Data suppressed for respondent confidentiality P8CHHAWIAN P8 FSQ198B1 CHILD NATIVE HAWAIIAN Data suppressed for respondent confidentiality P8CHGUAMCH P8 FSQ198B2 CHILD GUAMANIAN OR CHAMORRO Data suppressed for respondent confidentiality P8CHSOMOAN P8 FSQ198B3 CHILD SAMOAN Data suppressed for respondent confidentiality P8CHOTHPAC P8 FSQ198B4 CHILD OTHER PACIFIC ISLANDER Data suppressed for respondent confidentiality P8EVRACTV1 P8 EMQ210 PERS 1 SERVED ACTIVE DUTY Data suppressed for respondent confidentiality
See note at end of exhibit.

B-13
Exhibit B-2. ECLS-K:2011 masked variables, spring 2015 parent interview—Continued
Variable name Variable description Comments
P8HIG_1_I P8 PEQ020 PERS 1 HIGHEST EDUCATION LEVEL Data recoded for respondent confidentiality P8HIG_2_I P8 PEQ020 PERS 2 HIGHEST EDUCATION LEVEL Data recoded for respondent confidentiality P8CURACTV1 P8 EMQ215 PERS 1 CURR ON ACTIVE DUTY Data suppressed for respondent confidentiality P8CURACTV2 P8 EMQ215 PERS 2 CURR ON ACTIVE DUTY Data suppressed for respondent confidentiality P8TINCTH_I P8 PAQ120 TOTAL HOUSEHOLD INCOME ($-LOW) Data suppressed for respondent confidentiality P8HOUSIT P8 PAQ140 CURRENT HOUSING SITUATION Data recoded for respondent confidentiality P8BTRSCH P8 CMQ020 WHY MOVED-BETTER SCHOOL Data suppressed for respondent confidentiality P8SAFER P8 CMQ020 WHY MOVED-SAFER AREA Data suppressed for respondent confidentiality P8FORCLS P8 CMQ020 WHY MOVED-BANK FORECLOSED Data suppressed for respondent confidentiality P8EVICT P8 CMQ020 WHY MOVED-EVICTED Data suppressed for respondent confidentiality P8DAMAGE P8 CMQ020 WHY MOVED-DAMAGED HOUSE Data suppressed for respondent confidentiality P8HSSOLD P8 CMQ020 WHY MOVED-HOUSE SOLD/NO NEW Data suppressed for respondent confidentiality
P8NOLEAS P8 CMQ020 WHY MOVED-LEASE UP/OWNER WANTED BACK Data suppressed for respondent confidentiality
P8LEFTRL P8 CMQ020 WHY MOVED-LEFT RELATV'S HOME Data suppressed for respondent confidentiality P8CLSFAM P8 CMQ020 WHY MOVED-BE CLOSER TO FAM Data suppressed for respondent confidentiality P8LANGUA P8 CMQ690 LANGUAGE INTERVIEW CONDUCTED Data recoded for respondent confidentiality
SOURCE: U.S. Department of Education, National Center for Education Statistics, Early Childhood Longitudinal Study, Kindergarten Class of 2010–11 (ECLS-K:2011) ) kindergarten–fourth grade (K-4) public-use data file.

B-14
Exhibit B-3. ECLS-K:2011 masked variables, spring 2015 teacher-level reading teacher questionnaire
Variable name Variable description Comments
A8TXMUS A8 A3E TIME FOR MUSIC Data recoded for respondent confidentiality A8TXART A8 A3F TIME FOR ART Data recoded for respondent confidentiality A8TXDAN A8 A3H TIME FOR DANCE Data recoded for respondent confidentiality A8TXTHTR A8 A3I TIME FOR THEATER Data recoded for respondent confidentiality A8YRBORN A8 C2 TEACHER'S YEAR OF BIRTH Data recoded for respondent confidentiality A8HISP A8 C3 HISPANIC OR LATINO (ANY RACE) Data suppressed for respondent confidentiality A8AMINAN A8 C4 AMER IND/ALASKA NAT Data suppressed for respondent confidentiality A8ASIAN A8 C4 ASIAN Data suppressed for respondent confidentiality A8BLACK A8 C4 BLACK/AFRICAN AMERICAN Data suppressed for respondent confidentiality A8HAWPI A8 C4 NATIVE HAWAIIAN/PAC ISL Data suppressed for respondent confidentiality A8WHITE A8 C4 WHITE Data suppressed for respondent confidentiality A8HGHSTD A8 C8 HIGHEST ED LEVEL TEACHER ACHIEVED Data recoded for respondent confidentiality A8YRSPRK A8 C5A YRS TAUGHT PRESCHL/KINDRGTN Data suppressed for respondent confidentiality A8YRSFST A8 C5B YRS TEACHER TAUGHT FIRST GRADE Data suppressed for respondent confidentiality A8YRS2ND A8 C5C YRS TEACHER TAUGHT SECOND GRADE Data suppressed for respondent confidentiality A8YRS3RD A8 C5D YRS TEACHER TAUGHT THIRD GRADE Data suppressed for respondent confidentiality A8YRS4TH A8 C5E YRS TEACHER TAUGHT FOURTH GRADE Data suppressed for respondent confidentiality A8YRS5TH A8 C5F YRS TEACHER TAUGHT FIFTH GRADE Data suppressed for respondent confidentiality A8YRS6PL A8 C5G YRS TEACHER TAUGHT 6 GRADE OR UP Data suppressed for respondent confidentiality A8YRSEBD A8 C5H YRS TAUGHT ESL/BILING/DUAL LANG Data suppressed for respondent confidentiality A8YRSSPE A8 C5I YRS TEACHER TAUGHT SPECIAL ED Data suppressed for respondent confidentiality A8YRSGFT A8 C5J YRS TEACHER TAUGHT GIFTED ED Data suppressed for respondent confidentiality A8YRSTCH A8 C6 NUMBER YEARS BEEN SCHOOL TEACHER Data recoded for respondent confidentiality A8DEGERL A8 C9A UNDER GRAD/EARLY CHILDHOOD ED Data suppressed for respondent confidentiality A8DEGELM A8 C9B UNDER GRAD/ELEMENTARY ED Data suppressed for respondent confidentiality A8DEGENG A8 C9C UNDER GRAD/ ENGLISH Data suppressed for respondent confidentiality A8DEGRED A8 C9D UNDER GRAD/ READING/LANG ART Data suppressed for respondent confidentiality A8DEGCUR A8 C9E UNDER GRAD/ CURRICULUM INS Data suppressed for respondent confidentiality A8DEGMTE A8 C9F UNDER GRAD/ MATH EDUCATION Data suppressed for respondent confidentiality A8DEGMTH A8 C9G UNDER GRAD/ MATHEMATICS Data suppressed for respondent confidentiality A8DEGSCE A8 C9H UNDER GRAD/ SCIENCE EDU Data suppressed for respondent confidentiality A8DEGLSC A8 C9I UNDER GRAD/ LIFE SCIENCE Data suppressed for respondent confidentiality A8DEGPSC A8 C9J UNDER GRAD/ PHYSICAL SCIENCE Data suppressed for respondent confidentiality A8DEGESC A8 C9K UNDER GRAD/ EARTH SCIENCE Data suppressed for respondent confidentiality A8DEGSPE A8 C9L UNDER GRAD/SPECIAL ED Data suppressed for respondent confidentiality A8DEGOTH A8 C9M UNDER GRAD/OTHER ED MAJOR Data suppressed for respondent confidentiality A8DEGNON A8 C9N UNDER GRAD/NON ED MAJOR Data suppressed for respondent confidentiality A8GRDERL A8 C10A GRAD DEG/EARLY CHILDHOOD ED Data suppressed for respondent confidentiality
See note at end of exhibit.

B-15
Exhibit B-3. ECLS-K:2011 masked variables, spring 2015 teacher-level reading teacher questionnaire— Continued
Variable name Variable description Comments
A8GRDELM A8 C10B GRAD DEG/ELEMENTARY ED Data suppressed for respondent confidentiality A8GRDENG A8 C10C GRAD DEG/ ENGLISH Data suppressed for respondent confidentiality A8GRDRED A8 C10D GRAD DEG/ READING/LANG ART Data suppressed for respondent confidentiality A8GRDCUR A8 C10E GRAD DEG/ CURRICULUM INS Data suppressed for respondent confidentiality A8GRDMTE A8 C10F GRAD DEG/ MATH EDUCATION Data suppressed for respondent confidentiality A8GRDMTH A8 C10G GRAD DEG/ MATHEMATICS Data suppressed for respondent confidentiality A8GRDSCE A8 C10H GRAD DEG/ SCIENCE EDU Data suppressed for respondent confidentiality A8GRDLSC A8 C10I GRAD DEG/ LIFE SCIENCE Data suppressed for respondent confidentiality A8GRDPSC A8 C10J GRAD DEG/ PHYSICAL SCIENCE Data suppressed for respondent confidentiality A8GRDESC A8 C10K GRAD DEG/ EARTH SCIENCE Data suppressed for respondent confidentiality A8GRDSPE A8 C10L GRAD DEG/SPECIAL ED Data suppressed for respondent confidentiality A8GRDOTH A8 C10M GRAD DEG/OTHER ED MAJOR Data suppressed for respondent confidentiality A8GRDNON A8 C10N GRAD DEG/NON ED MAJOR Data suppressed for respondent confidentiality
SOURCE: U.S. Department of Education, National Center for Education Statistics, Early Childhood Longitudinal Study, Kindergarten Class of 2010–11 (ECLS-K:2011) kindergarten–fourth grade (K-4) public-use data file.

B-16
Exhibit B-4. ECLS-K:2011 masked variables, spring 2015 teacher-level mathematics/science teacher questionnaire
Variable name Variable description Comments
A8TXMUSZ A8 A3E TIME FOR MUSIC Data recoded for respondent confidentiality A8TXARTZ A8 A3F TIME FOR ART Data recoded for respondent confidentiality A8TXDANZ A8 A3H TIME FOR DANCE Data recoded for respondent confidentiality A8TXTHTRZ A8 A3I TIME FOR THEATER Data recoded for respondent confidentiality A8YRBORNZ A8 C2 TEACHER'S YEAR OF BIRTH Data recoded for respondent confidentiality A8HISPZ A8 C3 HISPANIC OR LATINO (ANY RACE) Data suppressed for respondent confidentiality A8AMINANZ A8 C4 AMER IND/ALASKA NAT Data suppressed for respondent confidentiality A8ASIANZ A8 C4 ASIAN Data suppressed for respondent confidentiality A8BLACKZ A8 C4 BLACK/AFRICAN AMERICAN Data suppressed for respondent confidentiality A8HAWPIZ A8 C4 NATIVE HAWAIIAN/PAC ISL Data suppressed for respondent confidentiality A8WHITEZ A8 C4 WHITE Data suppressed for respondent confidentiality A8HGHSTDZ A8 C8 HIGHEST ED LEVEL TEACHER ACHIEVED Data recoded for respondent confidentiality A8YRSPRKZ A8 C5A YRS TAUGHT PRESCHL/KINDRGTN Data suppressed for respondent confidentiality A8YRSFSTZ A8 C5B YRS TEACHER TAUGHT FIRST GRADE Data suppressed for respondent confidentiality A8YRS2NDZ A8 C5C YRS TEACHER TAUGHT SECOND GRADE Data suppressed for respondent confidentiality A8YRS3RDZ A8 C5D YRS TEACHER TAUGHT THIRD GRADE Data suppressed for respondent confidentiality A8YRS4THZ A8 C5E YRS TEACHER TAUGHT FOURTH GRADE Data suppressed for respondent confidentiality A8YRS5THZ A8 C5F YRS TEACHER TAUGHT FIFTH GRADE Data suppressed for respondent confidentiality A8YRS6PLZ A8 C5G YRS TEACHER TAUGHT 6 GRADE OR UP Data suppressed for respondent confidentiality A8YRSEBDZ A8 C5H YRS TAUGHT ESL/BILING/DUAL LANG Data suppressed for respondent confidentiality A8YRSGFTZ A8 C5J YRS TEACHER TAUGHT GIFTED ED Data suppressed for respondent confidentiality A8YRSSPEZ A8 C5I YRS TEACHER TAUGHT SPECIAL ED Data suppressed for respondent confidentiality A8YRSTCHZ A8 C6 NUMBER YEARS BEEN SCHOOL TEACHER Data recoded for respondent confidentiality A8DEGERLZ A8 C9A UNDER GRAD/EARLY CHILDHOOD ED Data suppressed for respondent confidentiality A8DEGELMZ A8 C9B UNDER GRAD/ELEMENTARY ED Data suppressed for respondent confidentiality A8DEGENGZ A8 C9C UNDER GRAD/ ENGLISH Data suppressed for respondent confidentiality A8DEGREDZ A8 C9D UNDER GRAD/ READING/LANG ART Data suppressed for respondent confidentiality A8DEGCURZ A8 C9E UNDER GRAD/ CURRICULUM INS Data suppressed for respondent confidentiality A8DEGMTEZ A8 C9F UNDER GRAD/ MATH EDUCATION Data suppressed for respondent confidentiality A8DEGMTHZ A8 C9G UNDER GRAD/ MATHEMATICS Data suppressed for respondent confidentiality A8DEGSCEZ A8 C9H UNDER GRAD/ SCIENCE EDU Data suppressed for respondent confidentiality A8DEGLSCZ A8 C9I UNDER GRAD/ LIFE SCIENCE Data suppressed for respondent confidentiality A8DEGPSCZ A8 C9J UNDER GRAD/ PHYSICAL SCIENCE Data suppressed for respondent confidentiality A8DEGESCZ A8 C9K UNDER GRAD/ EARTH SCIENCE Data suppressed for respondent confidentiality A8DEGSPEZ A8 C9L UNDER GRAD/SPECIAL ED Data suppressed for respondent confidentiality A8DEGOTHZ A8 C9M UNDER GRAD/OTHER ED MAJOR Data suppressed for respondent confidentiality A8DEGNONZ A8 C9N UNDER GRAD/NON ED MAJOR Data suppressed for respondent confidentiality A8GRDERLZ A8 C10A GRAD DEG/EARLY CHILDHOOD ED Data suppressed for respondent confidentiality
See note at end of exhibit.
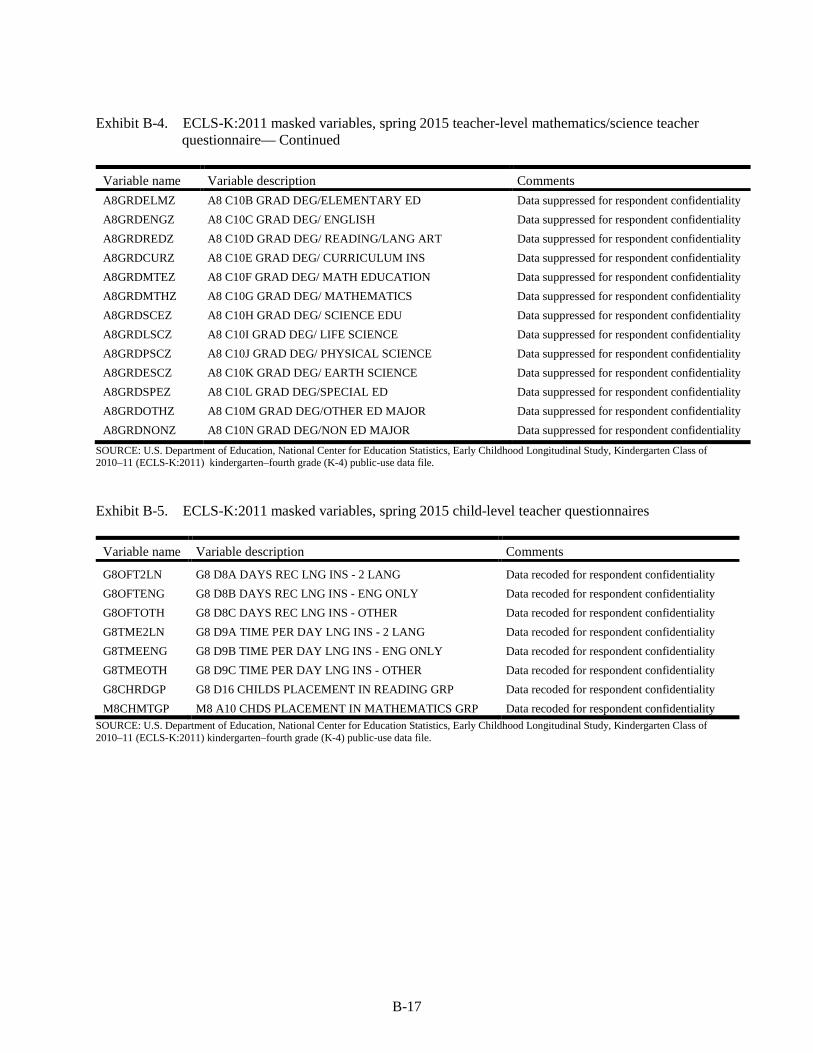
B-17
Exhibit B-4. ECLS-K:2011 masked variables, spring 2015 teacher-level mathematics/science teacher questionnaire— Continued
Variable name Variable description Comments A8GRDELMZ A8 C10B GRAD DEG/ELEMENTARY ED Data suppressed for respondent confidentiality A8GRDENGZ A8 C10C GRAD DEG/ ENGLISH Data suppressed for respondent confidentiality A8GRDREDZ A8 C10D GRAD DEG/ READING/LANG ART Data suppressed for respondent confidentiality A8GRDCURZ A8 C10E GRAD DEG/ CURRICULUM INS Data suppressed for respondent confidentiality A8GRDMTEZ A8 C10F GRAD DEG/ MATH EDUCATION Data suppressed for respondent confidentiality A8GRDMTHZ A8 C10G GRAD DEG/ MATHEMATICS Data suppressed for respondent confidentiality A8GRDSCEZ A8 C10H GRAD DEG/ SCIENCE EDU Data suppressed for respondent confidentiality A8GRDLSCZ A8 C10I GRAD DEG/ LIFE SCIENCE Data suppressed for respondent confidentiality A8GRDPSCZ A8 C10J GRAD DEG/ PHYSICAL SCIENCE Data suppressed for respondent confidentiality A8GRDESCZ A8 C10K GRAD DEG/ EARTH SCIENCE Data suppressed for respondent confidentiality A8GRDSPEZ A8 C10L GRAD DEG/SPECIAL ED Data suppressed for respondent confidentiality A8GRDOTHZ A8 C10M GRAD DEG/OTHER ED MAJOR Data suppressed for respondent confidentiality A8GRDNONZ A8 C10N GRAD DEG/NON ED MAJOR Data suppressed for respondent confidentiality
SOURCE: U.S. Department of Education, National Center for Education Statistics, Early Childhood Longitudinal Study, Kindergarten Class of 2010–11 (ECLS-K:2011) kindergarten–fourth grade (K-4) public-use data file. Exhibit B-5. ECLS-K:2011 masked variables, spring 2015 child-level teacher questionnaires
Variable name Variable description Comments
G8OFT2LN G8 D8A DAYS REC LNG INS - 2 LANG Data recoded for respondent confidentiality G8OFTENG G8 D8B DAYS REC LNG INS - ENG ONLY Data recoded for respondent confidentiality G8OFTOTH G8 D8C DAYS REC LNG INS - OTHER Data recoded for respondent confidentiality G8TME2LN G8 D9A TIME PER DAY LNG INS - 2 LANG Data recoded for respondent confidentiality G8TMEENG G8 D9B TIME PER DAY LNG INS - ENG ONLY Data recoded for respondent confidentiality G8TMEOTH G8 D9C TIME PER DAY LNG INS - OTHER Data recoded for respondent confidentiality G8CHRDGP G8 D16 CHILDS PLACEMENT IN READING GRP Data recoded for respondent confidentiality M8CHMTGP M8 A10 CHDS PLACEMENT IN MATHEMATICS GRP Data recoded for respondent confidentiality
SOURCE: U.S. Department of Education, National Center for Education Statistics, Early Childhood Longitudinal Study, Kindergarten Class of 2010–11 (ECLS-K:2011) kindergarten–fourth grade (K-4) public-use data file.
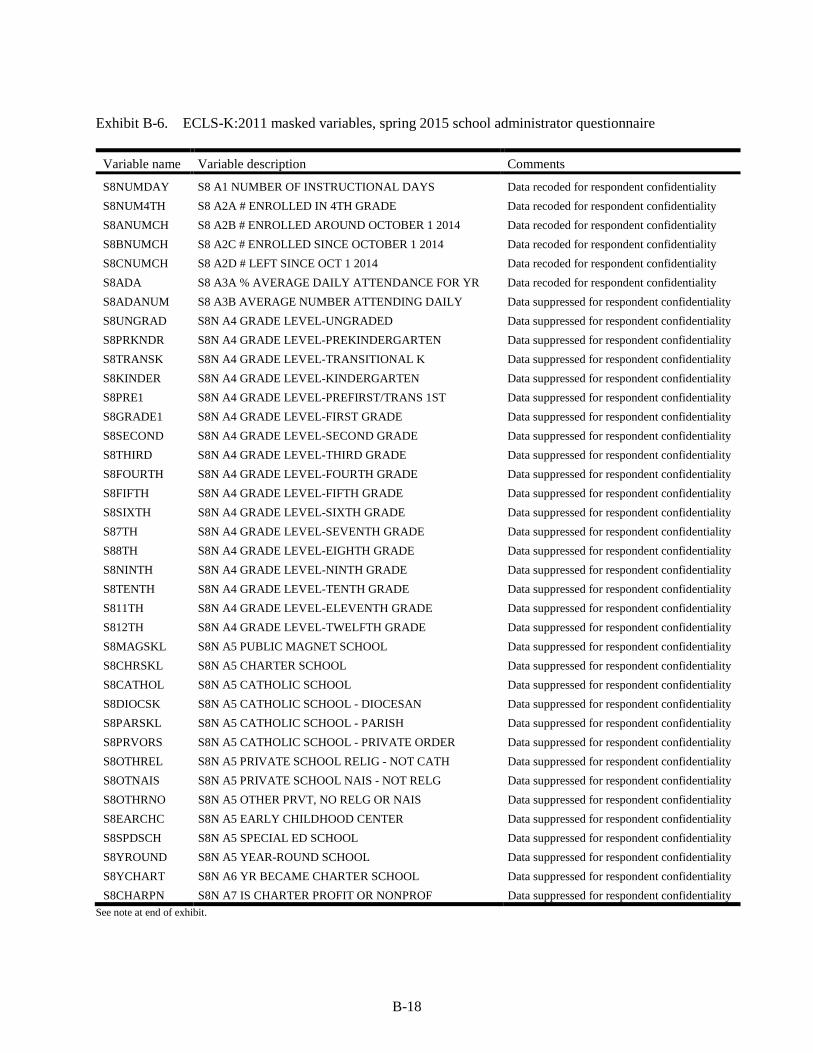
B-18
Exhibit B-6. ECLS-K:2011 masked variables, spring 2015 school administrator questionnaire
Variable name Variable description Comments
S8NUMDAY S8 A1 NUMBER OF INSTRUCTIONAL DAYS Data recoded for respondent confidentiality S8NUM4TH S8 A2A # ENROLLED IN 4TH GRADE Data recoded for respondent confidentiality S8ANUMCH S8 A2B # ENROLLED AROUND OCTOBER 1 2014 Data recoded for respondent confidentiality S8BNUMCH S8 A2C # ENROLLED SINCE OCTOBER 1 2014 Data recoded for respondent confidentiality S8CNUMCH S8 A2D # LEFT SINCE OCT 1 2014 Data recoded for respondent confidentiality S8ADA S8 A3A % AVERAGE DAILY ATTENDANCE FOR YR Data recoded for respondent confidentiality S8ADANUM S8 A3B AVERAGE NUMBER ATTENDING DAILY Data suppressed for respondent confidentiality S8UNGRAD S8N A4 GRADE LEVEL-UNGRADED Data suppressed for respondent confidentiality S8PRKNDR S8N A4 GRADE LEVEL-PREKINDERGARTEN Data suppressed for respondent confidentiality S8TRANSK S8N A4 GRADE LEVEL-TRANSITIONAL K Data suppressed for respondent confidentiality S8KINDER S8N A4 GRADE LEVEL-KINDERGARTEN Data suppressed for respondent confidentiality S8PRE1 S8N A4 GRADE LEVEL-PREFIRST/TRANS 1ST Data suppressed for respondent confidentiality S8GRADE1 S8N A4 GRADE LEVEL-FIRST GRADE Data suppressed for respondent confidentiality S8SECOND S8N A4 GRADE LEVEL-SECOND GRADE Data suppressed for respondent confidentiality S8THIRD S8N A4 GRADE LEVEL-THIRD GRADE Data suppressed for respondent confidentiality S8FOURTH S8N A4 GRADE LEVEL-FOURTH GRADE Data suppressed for respondent confidentiality S8FIFTH S8N A4 GRADE LEVEL-FIFTH GRADE Data suppressed for respondent confidentiality S8SIXTH S8N A4 GRADE LEVEL-SIXTH GRADE Data suppressed for respondent confidentiality S87TH S8N A4 GRADE LEVEL-SEVENTH GRADE Data suppressed for respondent confidentiality S88TH S8N A4 GRADE LEVEL-EIGHTH GRADE Data suppressed for respondent confidentiality S8NINTH S8N A4 GRADE LEVEL-NINTH GRADE Data suppressed for respondent confidentiality S8TENTH S8N A4 GRADE LEVEL-TENTH GRADE Data suppressed for respondent confidentiality S811TH S8N A4 GRADE LEVEL-ELEVENTH GRADE Data suppressed for respondent confidentiality S812TH S8N A4 GRADE LEVEL-TWELFTH GRADE Data suppressed for respondent confidentiality S8MAGSKL S8N A5 PUBLIC MAGNET SCHOOL Data suppressed for respondent confidentiality S8CHRSKL S8N A5 CHARTER SCHOOL Data suppressed for respondent confidentiality S8CATHOL S8N A5 CATHOLIC SCHOOL Data suppressed for respondent confidentiality S8DIOCSK S8N A5 CATHOLIC SCHOOL - DIOCESAN Data suppressed for respondent confidentiality S8PARSKL S8N A5 CATHOLIC SCHOOL - PARISH Data suppressed for respondent confidentiality S8PRVORS S8N A5 CATHOLIC SCHOOL - PRIVATE ORDER Data suppressed for respondent confidentiality S8OTHREL S8N A5 PRIVATE SCHOOL RELIG - NOT CATH Data suppressed for respondent confidentiality S8OTNAIS S8N A5 PRIVATE SCHOOL NAIS - NOT RELG Data suppressed for respondent confidentiality S8OTHRNO S8N A5 OTHER PRVT, NO RELG OR NAIS Data suppressed for respondent confidentiality S8EARCHC S8N A5 EARLY CHILDHOOD CENTER Data suppressed for respondent confidentiality S8SPDSCH S8N A5 SPECIAL ED SCHOOL Data suppressed for respondent confidentiality S8YROUND S8N A5 YEAR-ROUND SCHOOL Data suppressed for respondent confidentiality S8YCHART S8N A6 YR BECAME CHARTER SCHOOL Data suppressed for respondent confidentiality S8CHARPN S8N A7 IS CHARTER PROFIT OR NONPROF Data suppressed for respondent confidentiality
See note at end of exhibit.

B-19
Exhibit B-6. ECLS-K:2011 masked variables, spring 2015 school administrator questionnaire— Continued
Variable name Variable description Comments S8HISPNM S8N A8A # HISPANIC/LATINO Data suppressed for respondent confidentiality S8AIANNM S8N A8B # AMER IND/ALASKA NAT Data suppressed for respondent confidentiality S8AIANPT S8N A8B % AMER IND/ALASKA NAT Data recoded for respondent confidentiality S8ASIANM S8N A8C # ASIAN Data suppressed for respondent confidentiality S8ASIAPT S8N A8C % ASIAN Data recoded for respondent confidentiality S8BLACNM S8N A8D # BLACK/AFRICAN AMERICAN Data suppressed for respondent confidentiality S8BLACPT S8N A8D % BLACK/AFRICAN AMERICAN Data recoded for respondent confidentiality S8HAWPNM S8N A8E # HAWAIIAN/PAC ISL Data suppressed for respondent confidentiality S8HAWPPT S8N A8E % HAWAIIAN/PAC ISL Data recoded for respondent confidentiality S8WHITNM S8N A8F # WHITE Data suppressed for respondent confidentiality S8MULTNM S8N A8G # TWO OR MORE RACE Data suppressed for respondent confidentiality S8MULTPT S8N A8G % TWO OR MORE RACE Data recoded for respondent confidentiality S8TOTENR S8N A8H RPTD TOTAL SCHOOL ENROLLMENT Data recoded for respondent confidentiality S8OTNEED S8N A10A PERCENT SENT W/SPECIAL NEED Data recoded for respondent confidentiality S8PTRAYP S8N A10B PCT PREV SCH NOT MEET AYP Data recoded for respondent confidentiality S8PUBCHO S8N A10C PCT ATTEND UNDER PUB SCH CHOICE Data recoded for respondent confidentiality S8PCTFLN_I S8 A11 PERCENT ELG FOR FREE/RED LUNCH Data recoded for respondent confidentiality S8RPTCRD S8 B1B FREQ OF REPORT CARDS Data recoded for respondent confidentiality S8PTCONF S8 B1D FREQ OF PARENT-TCHR CONFERENCE Data recoded for respondent confidentiality S8INVITE S8 B1E FREQ OF PERFORMANCES FOR PARENTS Data recoded for respondent confidentiality S8DETECT S8 B8C SCHOOL METAL DETECTORS Data suppressed for respondent confidentiality S8NMRET3 S8 C1 NUMBER RETAINED GRADE3 Data recoded for respondent confidentiality S8TOTELL S8 D2 PCT OF STUDENTS WHO ARE ELL Data recoded for respondent confidentiality S8NEIEPY S8 D5 NEW EVAL FOR IEP THIS YEAR Data recoded for respondent confidentiality S8NEEIEP S8 D6 NEW EVAL ELIGIBLE FOR IEP Data recoded for respondent confidentiality S8SPDPCT S8 D8A1 % STUDENTS IN SPECIAL ED 4TH GR Data recoded for respondent confidentiality S8504STU S8 D8B1 % STUDENTS W/ 504 PLAN 4TH GRADE Data recoded for respondent confidentiality S8RDIPCT S8 D8C1 % STUDNT GETTING INSTRUCTION RDG Data recoded for respondent confidentiality S8MTIPCT S8 D8D1 % STUDNT GETTING INSTRUCTION MTH Data recoded for respondent confidentiality S8GIFPCT S8 D8E1 % STUDENTS IN G/T PROGRAM 4TH GR Data recoded for respondent confidentiality S8RGTCHF S8 F1A1 # REG CLASSROOM TCHR-FULL Data recoded for respondent confidentiality S8RGTCHP S8 F1A2 # REG CLASSROOM TCHR-PART Data recoded for respondent confidentiality S8ESLF S8 F1B1 # ESL/BILINGUAL TCHR-FULL Data recoded for respondent confidentiality S8ESLP S8 F1B2 # ESL/BILINGUAL TCHR-PART Data recoded for respondent confidentiality S8ARTSTF S8 F1C1 # DRAMA MUSIC ART TCHR-FULL Data recoded for respondent confidentiality S8ARTSTP S8 F1C2 # DRAMA MUSIC ART TCHR-PART Data recoded for respondent confidentiality S8GYMTF S8 F1D1 # GYM/HEALTH TEACHER-FULL Data recoded for respondent confidentiality S8GYMTP S8 F1D2 # GYM/HEALTH TEACHER-PART Data recoded for respondent confidentiality
See note at end of exhibit.
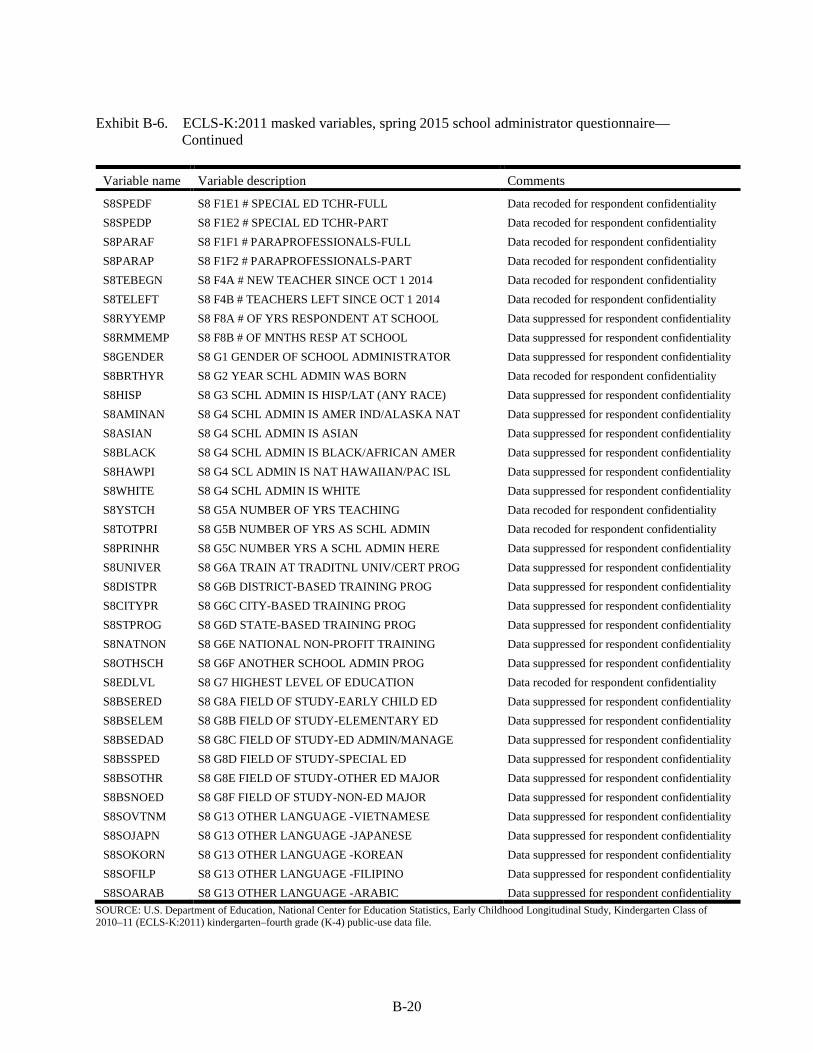
B-20
Exhibit B-6. ECLS-K:2011 masked variables, spring 2015 school administrator questionnaire— Continued
Variable name Variable description Comments
S8SPEDF S8 F1E1 # SPECIAL ED TCHR-FULL Data recoded for respondent confidentiality S8SPEDP S8 F1E2 # SPECIAL ED TCHR-PART Data recoded for respondent confidentiality S8PARAF S8 F1F1 # PARAPROFESSIONALS-FULL Data recoded for respondent confidentiality S8PARAP S8 F1F2 # PARAPROFESSIONALS-PART Data recoded for respondent confidentiality S8TEBEGN S8 F4A # NEW TEACHER SINCE OCT 1 2014 Data recoded for respondent confidentiality S8TELEFT S8 F4B # TEACHERS LEFT SINCE OCT 1 2014 Data recoded for respondent confidentiality S8RYYEMP S8 F8A # OF YRS RESPONDENT AT SCHOOL Data suppressed for respondent confidentiality S8RMMEMP S8 F8B # OF MNTHS RESP AT SCHOOL Data suppressed for respondent confidentiality S8GENDER S8 G1 GENDER OF SCHOOL ADMINISTRATOR Data suppressed for respondent confidentiality S8BRTHYR S8 G2 YEAR SCHL ADMIN WAS BORN Data recoded for respondent confidentiality S8HISP S8 G3 SCHL ADMIN IS HISP/LAT (ANY RACE) Data suppressed for respondent confidentiality S8AMINAN S8 G4 SCHL ADMIN IS AMER IND/ALASKA NAT Data suppressed for respondent confidentiality S8ASIAN S8 G4 SCHL ADMIN IS ASIAN Data suppressed for respondent confidentiality S8BLACK S8 G4 SCHL ADMIN IS BLACK/AFRICAN AMER Data suppressed for respondent confidentiality S8HAWPI S8 G4 SCL ADMIN IS NAT HAWAIIAN/PAC ISL Data suppressed for respondent confidentiality S8WHITE S8 G4 SCHL ADMIN IS WHITE Data suppressed for respondent confidentiality S8YSTCH S8 G5A NUMBER OF YRS TEACHING Data recoded for respondent confidentiality S8TOTPRI S8 G5B NUMBER OF YRS AS SCHL ADMIN Data recoded for respondent confidentiality S8PRINHR S8 G5C NUMBER YRS A SCHL ADMIN HERE Data suppressed for respondent confidentiality S8UNIVER S8 G6A TRAIN AT TRADITNL UNIV/CERT PROG Data suppressed for respondent confidentiality S8DISTPR S8 G6B DISTRICT-BASED TRAINING PROG Data suppressed for respondent confidentiality S8CITYPR S8 G6C CITY-BASED TRAINING PROG Data suppressed for respondent confidentiality S8STPROG S8 G6D STATE-BASED TRAINING PROG Data suppressed for respondent confidentiality S8NATNON S8 G6E NATIONAL NON-PROFIT TRAINING Data suppressed for respondent confidentiality S8OTHSCH S8 G6F ANOTHER SCHOOL ADMIN PROG Data suppressed for respondent confidentiality S8EDLVL S8 G7 HIGHEST LEVEL OF EDUCATION Data recoded for respondent confidentiality S8BSERED S8 G8A FIELD OF STUDY-EARLY CHILD ED Data suppressed for respondent confidentiality S8BSELEM S8 G8B FIELD OF STUDY-ELEMENTARY ED Data suppressed for respondent confidentiality S8BSEDAD S8 G8C FIELD OF STUDY-ED ADMIN/MANAGE Data suppressed for respondent confidentiality S8BSSPED S8 G8D FIELD OF STUDY-SPECIAL ED Data suppressed for respondent confidentiality S8BSOTHR S8 G8E FIELD OF STUDY-OTHER ED MAJOR Data suppressed for respondent confidentiality S8BSNOED S8 G8F FIELD OF STUDY-NON-ED MAJOR Data suppressed for respondent confidentiality S8SOVTNM S8 G13 OTHER LANGUAGE -VIETNAMESE Data suppressed for respondent confidentiality S8SOJAPN S8 G13 OTHER LANGUAGE -JAPANESE Data suppressed for respondent confidentiality S8SOKORN S8 G13 OTHER LANGUAGE -KOREAN Data suppressed for respondent confidentiality S8SOFILP S8 G13 OTHER LANGUAGE -FILIPINO Data suppressed for respondent confidentiality S8SOARAB S8 G13 OTHER LANGUAGE -ARABIC Data suppressed for respondent confidentiality
SOURCE: U.S. Department of Education, National Center for Education Statistics, Early Childhood Longitudinal Study, Kindergarten Class of 2010–11 (ECLS-K:2011) kindergarten–fourth grade (K-4) public-use data file.

B-21
Exhibit B-7. ECLS-K:2011 masked variables, spring 2015 composite variables
Variable name Variable description Comments X_DOBYY_R CHILD COMPOSITE DOB YEAR - REVISED Data recoded for respondent confidentiality X8EXDIS X8 CHILD NOT ASSESSED - DISAB EXCLUSION Data suppressed for respondent confidentiality X8HEIGHT X8 CHILD COMPOSITE HGT (INCHES) Data recoded for respondent confidentiality X8WEIGHT X8 CHILD COMPOSITE WGT (POUNDS) Data recoded for respondent confidentiality X8GRDLVL X8 CHILD GRADE LEVEL Data recoded for respondent confidentiality X8LOCALE X8 LOCATION TYPE OF SCHOOL Data recoded for respondent confidentiality X8REGION X8 CENSUS REGION OF SCHOOL Data suppressed for respondent confidentiality X8PAR1ED_I X8 PARENT 1 EDUCATION LEVEL (IMPUTED) Data recoded for respondent confidentiality X8PAR2ED_I X8 PARENT 2 EDUCATION LEVEL (IMPUTED) Data recoded for respondent confidentiality X8YRRND X8 YEAR ROUND SCHOOL Data suppressed for respondent confidentiality X8LOWGRD X8 LOWEST GRADE AT THE SCHOOL Data recoded for respondent confidentiality X8HIGGRD X8 HIGHEST GRADE AT THE SCHOOL Data recoded for respondent confidentiality X8SCHBDD X8 SCHOOL YEAR BEGINNING DATE DAY Data suppressed for respondent confidentiality X8SCHEDD X8 SCHOOL YEAR ENDING DATE DAY Data suppressed for respondent confidentiality X8ASMTST X8 ASSESSMENT STATUS SPRING 2015 Data recoded for respondent confidentiality X8RCETH X8 PERCENT NONWHITE STUDENTS IN SCHOOL Data recoded for respondent confidentiality X8FRMEAL_I X8 PCT FREE RED MEAL ELIG STUDENTS (IMP) Data recoded for respondent confidentiality X8ASMTDD X8 CHILD ASSESSMENT DAY OF THE MONTH Data suppressed for respondent confidentiality
SOURCE: U.S. Department of Education, National Center for Education Statistics, Early Childhood Longitudinal Study, Kindergarten Class of 2010–11 (ECLS-K:2011) kindergarten–fourth grade (K-4) public-use data file.

B-22
Exhibit B-8. ECLS-K:2011 masked variables, spring 2015 field management system and identification variables
Variable name Variable description Comments
F8CADISP F8 CHILD ASSESSMENT DISPOSITION CODE Data suppressed for respondent confidentiality F8PIDISP F8 PARENT INTERVIEW DISPOSITION CODE Data suppressed for respondent confidentiality F8CLASS2 F8 CHILD CLASS TYPE FROM FMS SPRING 2015 Data recoded for respondent confidentiality F8CCDLEA F8 CCD LEA/SCHOOL DIST ID (PUBLIC) Data suppressed for respondent confidentiality F8CCDSID F8 CCD SCHOOL ID (PUBLIC) Data suppressed for respondent confidentiality F8CENTRC F8 SCHOOL CENSUS TRACT CODE Data suppressed for respondent confidentiality F8FIPSCT F8 SCHOOL FIPS COUNTY CODE Data suppressed for respondent confidentiality F8FIPSST F8 SCHOOL FIPS STATE CODE Data suppressed for respondent confidentiality F8SCHPIN F8 SCHOOL PIN (PRIVATE/PSS) Data suppressed for respondent confidentiality F8SCHZIP F8 SCHOOL ZIP CODE Data suppressed for respondent confidentiality PSUID ORIGINAL SAMPLED PSU ID Data suppressed for respondent confidentiality
T8M_ID SPRING 2015 MATH TEACHER IDENTIFICATION NUMBER Data suppressed for respondent confidentiality
T8R_ID SPRING 2015 READING TEACHER IDENTIFICATION NUMBER Data suppressed for respondent confidentiality
T8S_ID SPRING 2015 SCIENCE TEACHER IDENTIFICATION NUMBER Data suppressed for respondent confidentiality
IFS8PCTFLN S8 IMPUTATION FLAG FOR S8PCTFLN Data recoded for respondent confidentiality IFX8FRMEAL X8 IMPUTATION FLAG FOR X8FRMEAL_I Data recoded for respondent confidentiality
SOURCE: U.S. Department of Education, National Center for Education Statistics, Early Childhood Longitudinal Study, Kindergarten Class of 2010–11 (ECLS-K:2011) kindergarten–fourth grade (K-4) public-use data file.

B-23
This page intentionally left blank.