early child human capital investment: “pay for success” finance institute for child success...
TRANSCRIPT

Early Child Human Capital Investment: “Pay for Success” Finance
Institute for Child Success
Robert H. DuggerCo-Chair, ReadyNation
June 26, 2013

2
First a word about ReadyNation…
ReadyNation Social Impact Finance Portfolio of Work
Convene national work group on early childhood SIBs: A “Five Year Vision” for pay-for-success assets
Working papers on early childhood social impact finance structure and contracts
Hub of working documents from state and local initiatives
EC Social Impact Performance Advisors, funded by the Pritzker Foundation: Collaboration and training consultancy for senior investment, legal and public finance experts
Join the EC SIB listserv at www.ReadyNation.org/SIB

3
Education is the key: The US used to be first. Now we’re just average…

4
To produce globally competitive young adults..
…you must first produce school-ready five year olds.
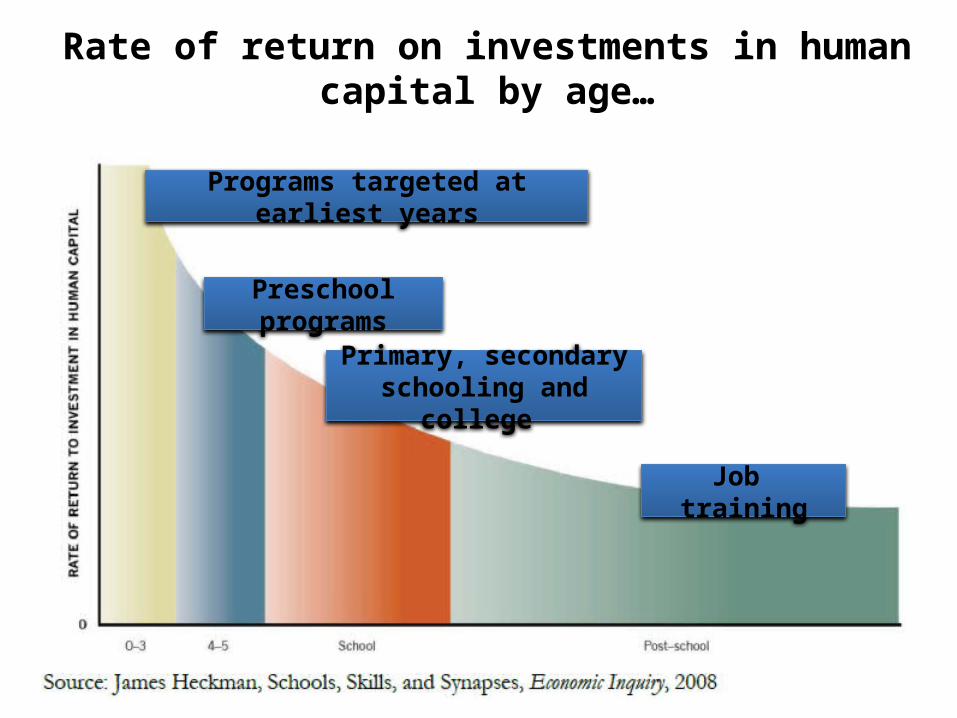
Rate of return on investments in human capital by age…
5
Programs targeted at earliest years
Preschool programs
Primary, secondary schooling and college
Job training

6
“Pay for Success” Social Impact Finance
“Pay for Success” refers to performance-based contracting between government and providers of social services arranged by an intermediary or lead contractor. Government pays only when results are achieved.
“Success” has two meanings –
“Cost avoidance” actual reductions in governments operating costs that are the result of an intervention
“Outcome improvement” measured changes in outcomes in desired directions that are the result of an intervention

7
Step 1: Organizers study Feasibility
Research and decide whether to move
forward
Early Health or Education Service
Providers
Government Health or Education
Agency
Third Party Feasibility Research
Private, Philanthropic, Government & Provider
PFS OrganizersThird Party PFS Project Evaluation
and Certification
Early Childhood Pay for Success
Investment Intermediary
Main Participants in a Pay for Success Project

8
4. Success Payment for
Outcome Improvement
or Cost Avoidance
5. Intermediary Issuer repays
investors
2. Operating funds paid
to to Service
Providers
1. Investors acquire PFS assets and
provide working capital
Early Health or Education Service
Providers
Government Health or Education
Agency
Third Party Feasibility
Study
Private, Philanthropic and Government PFS
InvestorsThird Party PFS Project Evaluation
and Certification
Early Childhood Pay for Success
Investment Intermediary
3. Cost Avoidance or Outcome Improvement Achieved
Flow of Funds in a Pay for Success Project (arrows)

9
Early Health or Education Service
Providers
Government Health or Education
Agency
State PFS Social Impact Finance
Law and Regulations
Private, Philanthropic and Government PFS
Investors
Third Party PFS Project Evaluation
and Certification
Early Childhood Pay for Success
Investment Intermediary
Pay for Success Statute and Contract Agreements (ovals)
Intermediary Government
Agency Contract
Intermediary and Service
Provider Contract
Investors
Evaluator Contract with Government, Intermediary & Provider
PFS Asset Investor Terms &
Conditions

10
4. Part of Government savings paid
to Intermediary
5. Intermediary Issuer repays
investors
2. Operating funds paid
to to Service
Providers
1. Investors acquire PFS assets and
provide working capital
Early Health or Education Service
Providers
Government Health or Education
Agency
Intermediary Government
Agency Contract
Intermediary and Service
Provider Contract
Third Party Feasibility
Study
State PFS Social Impact Finance
Law and Regulations
Private, Philanthropic and Government PFS
InvestorsThird Party PFS Project Evaluation
and Certification
Early Childhood Pay for Success
Investment Intermediary
3. Cost Avoidance or Outcome Improvement Achieved
Putting it all together -- A Pay for Success Project
PFS Asset Investor Terms &
ConditionsEvaluator Contract with Government, Intermediary & Provider

11
“Success Payment”
“Success Payment” is the portion of the government operating cost reduction paid to the Intermediary for successfully reducing the operating costs of the Government, or a payment for achieving specific outcome improvements
Intermediary uses the success payments to
pay interest and principle to investorspay bonuses to providers who exceed
expected performance levels
12
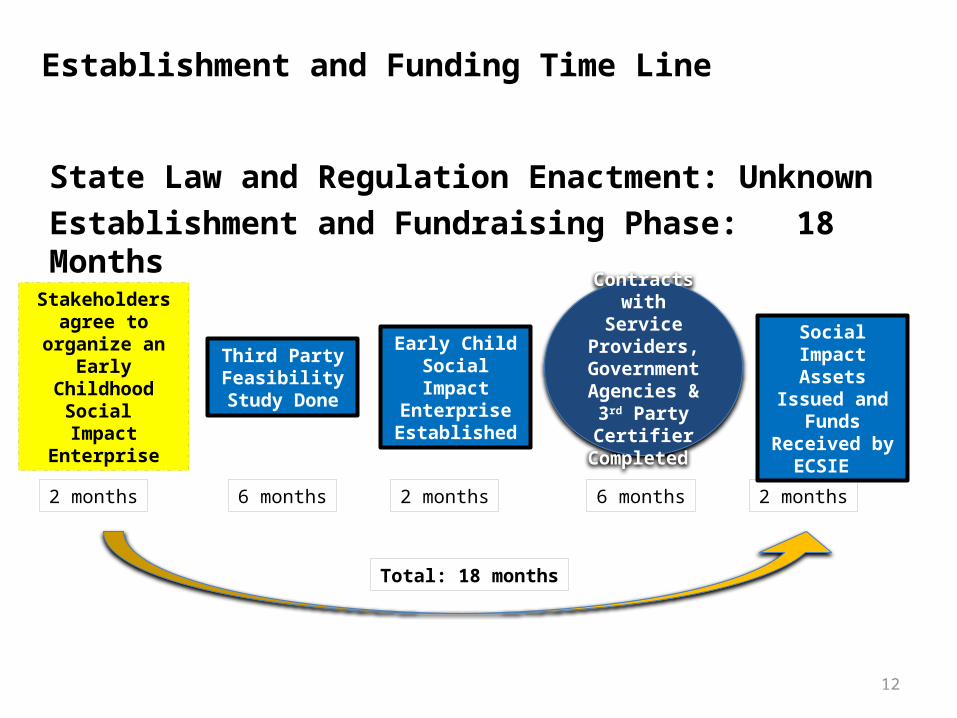
Establishment and Funding Time Line
Early Child Social Impact
Enterprise Established
Stakeholders agree to organize an
Early Childhood Social Impact
Enterprise
Third Party Feasibility Study
Done
Social Impact Assets Issued
and Funds Received by
ECSIE
Contracts with Service
Providers, Government
Agencies & 3rd Party Certifier
Completed
2 months 6 months 2 months 6 months 2 months
State Law and Regulation Enactment: UnknownEstablishment and Fundraising Phase: 18 Months
Total: 18 months

13
Intervention Service and Investment Success Time Line
Intermediary repays investors
Early Health or Education
Service Provided
Government Health or
Education Agency pays large portion
of savings to Intermediary
3td Party Evaluator Certifies Savings to
Government Agency, Intermediary &
Service Providers
Cost savings generated and confirmed by
initial evidence
Operating funds paid to to
Service Providers
Intervention Service Delivery and Initial Success Indication 8 months for prenatal (5 mo average prenatal + 3 mo postpartum) 60 months for pre-k (2 yrs pre-k, 3 yrs k-2nd grade when 90% of special-ed assignments completed)
5 months for prenatal health
2 years for pre-k
3 months for prenatal
health 3 years for
pre-k
1 month 1 month
10 to 62 months total

14
Why do investors invest?
Private Individuals and Funds – Invest to obtain interest earnings and return of principle
Philanthropic Institutions –
Make PRI investments for interest earnings and principle repayment if possible (first-loss tranche)
Make grants to obtain the benefits of long-term all-in outcome improvements that come from interventions such quality prenatal counseling or prekindergarten
Local Governments – Invest to obtain more efficient near-term operations and to obtain long-term all-in outcome improvements
State and Federal Governments – Invest to obtain long-term all-in outcome improvements and stronger economic and per capita income growth

15
Longer-Term All-In Outcome Improvement Benefits
Government and philanthropic investment in PFS pre-k projects should be viewed in the context of the all-in benefits of to the public sector. For pre-k these benefits include everything from lower special-ed costs to higher tax revenues from higher-earning employment. Many studies have looked at the cost/benefit question. Estimated returns on quality pre-k range from 7% to 18% per year.Monetizable and Non-monetizable Benefits
Monetizable benefits are ones that can be accurately measured and captured in workable contracts within investable timeframes from twelve months to ten years. Non-monetizable benefits may be extremely valuable to individuals and society, but they are difficult to measure and capture in workable contracts. Such returns also often take more than ten years to realize.
Near-term special-ed and infant intensive care cost reductions are monetizable, that is, the cost avoidance can be measured accurately and a portion of it can be paid as a “success payment”

16
PFS Fundamental Relationships
Cost Ratio - The ratio of intervention cost to remediation cost.
The higher the cost of remediation is relative to the cost of intervention, the higher the possible cost avoidance will be, other things equal. For example, the more special-ed costs relative to pre-k, the less pre-k needs to reduce special-ed assignment rates in order to achieve threshold feasibility.
Effect Ratio - The ratio of intervention effect to non-intervention effect.
The more the intervention achieves the desired outcome, the more cost avoidance is achievable. For example, the more pre-k reduces special-ed assignment rates, the less difference there needs to be between the cost of pre-k and the cost of special-ed.
Investor Ratio – The ratio of investor capital to philanthropic and government capital.
The more philanthropic and government capital there is in a PFS project , other things equal, the better will be the risk and return profile of the project for investors.

17
Two Examples: Prekindergarten Returns and Benchmark Prekindergarten Programs
Granite School District Preschool ProgramCost Ratio: Pre-k/Special-Ed = 47%Effect Ratio: 30% of 737 at-risk children potentially
eligible for Special Education at 4 years old; 1.5% assigned to Special Education through elementary school
Bethlehem Area School District Preschool ProgramCost Ratio: Pre-k/Special-Ed = 65%Effect Ratio: 18% assignment rate for low income
students without pre-k to 2.5% with pre-k

18
Prekindergarten: 500 At-Risk Students in PFS Pre-k and K-12
Series10
100
200
300
400
500
600
PFS graduates in k-12 gradesChildren in PFS pre-k
PFS Project Students and Graduates in K-12
PFS Project Year
Nu
mb
er o
f C
hil
dre
n
Source: "Financing Human Capital Development for Economically Disadvantaged Children: Applying Pay for Success Social Impact Finance to Early Child Development." J A Dubno, R H Dugger, and M R Smith. ReadyNation Working Paper, June 10, 2013
19
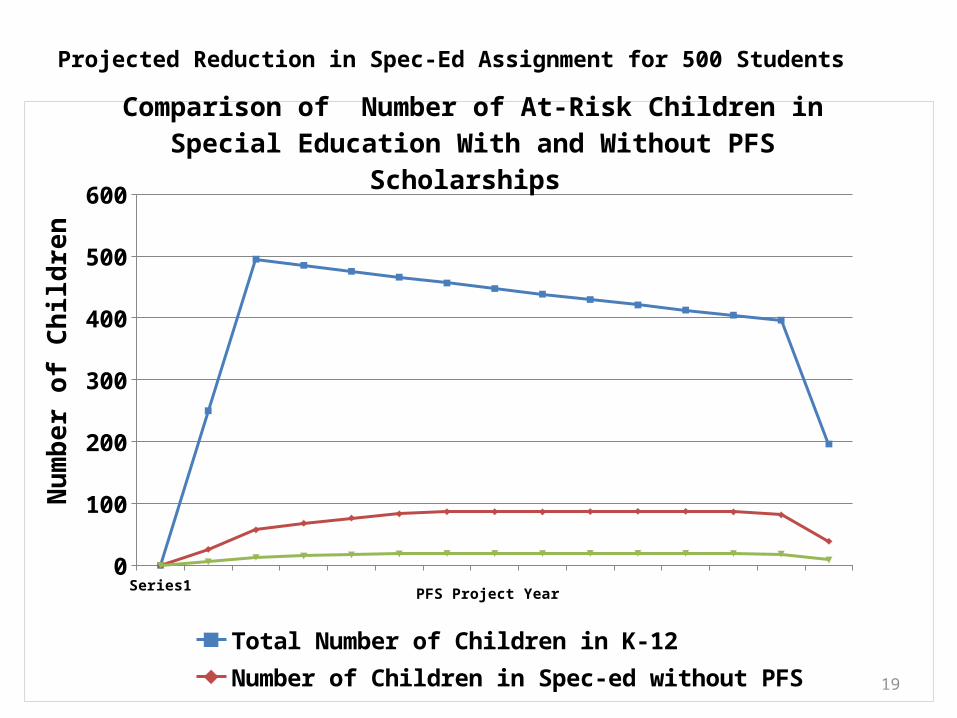
Projected Reduction in Spec-Ed Assignment for 500 Students
Se-ries1
0
100
200
300
400
500
600
Total Number of Children in K-12Number of Children in Spec-ed without PFSNumber of Children in Spec-ed with PFS
Comparison of Number of At-Risk Children in Special Education With and Without PFS Scholarships
PFS Project Year
Num
ber o
f Chi
ldre
n

20
Projected Spec-Ed Cost Avoidance for 500 Students
Series1$0
$200,000
$400,000
$600,000
$800,000
$1,000,000
$1,200,000
Special Education Cost Without PFS ProjectSpecial Education Cost With PFS Project
Comparison of Special Education Cost With and Without PFS Project
PFS Project Year

21
Description of the Financing Model: Fixed-Debt
a. Investors receive fixed interest and principal payments on a loan or bond with a given maturity, such as five or ten years.
b. Investor funds are used to provide “scholarships” that pay for prekindergarten education services.
c. Success Payments after interest expense accrues in a reserve account to be available for later payments of principal. Any amount in the reserve account after PRI investments are repaid are paid to the state.
d. The timely payment of fixed-debt interest and principle is guaranteed by philanthropic foundation PRI investment commitments to cover periods of negative cash flow -- expected in the first few years when operating expenses exceed Success Payments, and when large payments need to be made to repay debt principle.

22
Fixed Debt Structure
1 2 3 4 5 6 7 8 9 10 11 12 13 14 15$0
$500,000
$1,000,000
$1,500,000
$2,000,000
$2,500,000
$3,000,000
$3,500,000
Regional Philanthropy State GovernmentPFS asset Investors Philanthropic PRIs
Sources of PFS Project Funds -- One Round of Financing for One Cohort of Children
PFS Project Year

23
Fixed Debt Structure
1 2 3 4 5 6 7 8 9 10 11 12 13 14 15
-$1,000,000
$0
$1,000,000
$2,000,000
$3,000,000
$4,000,000
$5,000,000
$6,000,000
$7,000,000
$8,000,000
Cumulative PFS special-ed cost avoidancePFS fixed-debt repaymentFunds available for state budget or project expansionPhilanthropic PRIs
Cumulative PFS Success Payments, Fixed-Debt Repayment, and Reserve Account Balance Available for Distribution to State
or for Future Rounds of Pre-k Financing
PFS Project Year

24
Description of the Financing Model: Fixed-Debt
PFS Project Results:
PV of special-ed cost without PFS project $ 8,053,880
PV of special-ed cost with PFS project $ 1,342,313
PV of special-ed cost avoidance (budget savings) $ 6,516,084
Cost avoidance as a percent of special-ed cost without PFS 81%
PV of Success Payments to the Intermediary $ 5,864,476
Success Payments as percent of special-ed cost without PFS 73% Funding Source Amounts:
PV of philanthropic grants $ 1,420,789
PV of philanthropic PRIs $ 334,123
PV of state government investment $ 1,415,131
PV of federal government investment $ -
PV of private source investments $ 4,245,393
PV of project funding from all sources $ 7,415,436

25
Results of the Financing Model: Fixed-Debt
Investor Results:
PV of Intermediary fixed-debt obligations acquired by Investors $ 4,245,393 PV of principle and interest payments to Investors $ 4,615,610
IRR to Investors (Yield to Maturity, not Coupon)) 4.17% Philanthropic PRI Results:
PV of Intermediary PRI obligations acquired by philanthropies $ 334,123
PV of principle and interest payments to philanthropies $ 295,932
IRR to PRI investors 1.29% Government Results:
PV of Government investment $ 1,415,131
PV of payments to Government less PRI for gen’l budget or more pre-k $ 1,121,823
IRR to State Government (incl inv inc & assuming PRI repay in 15th yr) 1.26%

26
Description of the Financing Model: Pass-through
a. Investors receive annual payments consisting of a percentage of the Success Payments.
b. These payments constitute interest payments and principle repayment. The actual yield on the Pass-Through depends on the amount and timing of the Success Payments.
c. Pass-Through payments may vary from year to year because they depend directly on the amount of Success Payments actually earned.
d. In the Pass-Through structure, the debt instrument stands on its own – neither payments nor a given return on investment are assured by philanthropic PRI investment commitments.
e. Pass-Through obligations have higher investment risk than fixed-debt obligations.
f. The state receives the success payments not paid to support the Pass-through in the year in which it occurs.

27
Description of the Financing Model: Pass-Through
PFS Project Results:
PV of special-ed cost without PFS project $ 8,053,880
PV of special-ed cost with PFS project $ 1,342,313
PV of special-ed cost avoidance (budget savings) $ 6,516,084
Cost avoidance as a percent of special-ed cost without PFS 81%
PV of Success Payments to the Intermediary $ 5,864,476
Success Payments as percent of special-ed cost without PFS 73% Funding Source Amounts:
PV of philanthropic grants $ 1,420,789
PV of philanthropic PRIs $ -
PV of state government investment $ 1,415,131
PV of federal government investment $ -
PV of private source investments $ 4,245,393
PV of project funding from all sources $ 7,081,313

28
Results of the Financing Model: Pass-Through
Investor Results:
PV of Intermediary fixed-debt obligations acquired by Investors $ 4,245,393
PV of pass-throughs to Investors $ 5,181,264
IRR to Investors 6.0%
(Percentage of Success Payments to Investors that Results in Requried IRR) 88.35%
Philanthropic PRI Results:
PV of Intermediary PRI obligations acquired by philanthropies $ -
PV of principle and interest payments to philanthropies $ -
IRR to PRI investors 0.00% Government Results:
PV of Government investment $ 1,415,131
PV of pass throughs to Government $ 683,211
IRR to State Government (continuous payment) -6.27%

29
Financial Model Projection Results VariationsVariation A: Funding Source: 75% Investor, 10% state, 15% federal Fixed-Debt Structure Pass-through Structure
88.35% of Success Payments paid to Investor to reach Target Return
IRR to the Investor 4.17% 6.00%IRR to PRI 1.29% 0%IRR to the State 8.28% 5.82% Variation B: Funding Source: 50% Investor, 50% state Fixed-Debt Structure Pass-through Structure
58.9% of Success Payments paid to Investor to reach Target Return
IRR to the Investor 4.17% 6.00%IRR to PRI 1.39% 0%IRR to the State 2.14% 0.75% Variation C: Funding Source: 50% Investor, 25% state, 25% Federal Fixed-Debt Structure Pass-through Structure
58.9% of Success Payments paid to Investor to reach Target Return
IRR to the Investor 4.17% 6.00%IRR to PRI 1.39% 0%IRR to the State 7.45% 11.63%
30
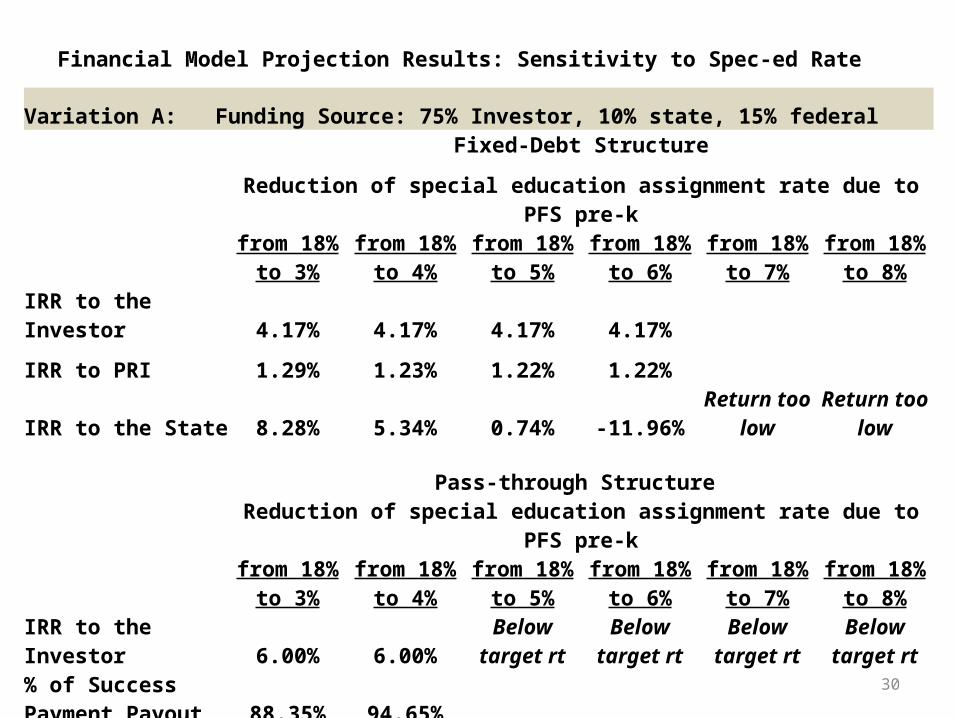
Financial Model Projection Results: Sensitivity to Spec-ed Rate
Variation A: Funding Source: 75% Investor, 10% state, 15% federal
Fixed-Debt Structure
Reduction of special education assignment rate due to PFS pre-k
from 18% to
3%from 18% to
4%from 18% to
5%from 18% to
6%from 18% to
7%from 18% to
8%
IRR to the Investor 4.17% 4.17% 4.17% 4.17%
IRR to PRI 1.29% 1.23% 1.22% 1.22%
IRR to the State 8.28% 5.34% 0.74% -11.96%Return too
lowReturn too
low
Pass-through Structure
Reduction of special education assignment rate due to PFS pre-k
from 18% to
3%from 18% to
4%from 18% to
5%from 18% to
6%from 18% to
7%from 18% to
8%
IRR to the Investor 6.00% 6.00%Below target
rtBelow target
rtBelow target
rtBelow target
rt% of Success Payment Payout 88.35% 94.65%
IRR to the State 5.82% -5.48%Return too
lowReturn too
lowReturn too
lowReturn too
low

31
Financial Model Projection Results Sensitivity Analysis
Variation C: Funding Source: 50% Investor, 25% state, 25% Federal
Fixed-Debt Structure
Reduction of special education assignment rate due to PFS pre-k
from 18% to
3%from 18% to
4%from 18% to
5%from 18% to
6%from 18% to
7%from 18% to
8%
IRR to the Investor 4.17% 4.17% 4.17% 4.17% 4.17% 4.17%
IRR to PRI 1.39% 1.39% 1.39% 1.39% 1.39% 1.29%
IRR to the State 7.45% 6.26% 4.88% 3.22% 1.13% -1.70%
Pass-through Structure
Reduction of special education assignment rate due to PFS pre-k
from 18% to
3%from 18% to
4%from 18% to
5%from 18% to
6%from 18% to
7%from 18% to
8%
IRR to the Investor 6.00% 6.00% 6.00% 6.00% 6.00% 6.00%
% of Success Payment Payout 58.90% 63.10% 67.95% 73.65% 80.35% 88.35%
IRR to the State 11.63% 8.54% 5.09% 1.10% -3.79% -10.59%

32
Conclusions and Future Research
Implementing operational PFS projects will be helped if future research focuses on at least five areas of PFS finance:
1. Standard error estimates of the distribution of returns on PFS assets.
2. PFS project capital structures, risk, subordination and loss absorption.
3. Sensitivity analysis of returns to variations in parameter values and financial structures.
4. Pre, concurrent and post intervention data needed to evaluate near-term financial returns and longer-term all-in outcome improvements.
5. Research methodologies to use when needed data are limited.

33
Pay for Success Reading and Resource List -- ww.ReadyNation.org/SIB
Working Papers for Discussion and Comment"
Early Childhood Pay for Success Social Impact Finance: Organizational Steps, Memorandum of Understanding and Contract Outlines." Report of the ReadyNation Working Group on contracts in Early Childhood Social Impact Finance, ReadyNation Working Paper, June 10, 2013.
"Financing Human Capital Development for Economically Disadvantaged Children: Applying Pay for Success Social Impact Finance to Early Child Development." Janis A. Dubno, Robert H. Dugger, and Michelle R. Smith. ReadyNation Working Paper, June 10, 2013
Click here to access the PFS Social Impact Finance SpreadsheetRecommended General Reading"Social Impact Bonds: A Guide for State and Local Governments." Social Impact Bond Technical Assistance Lab
(SIB Lab), Harvard Kennedy School. June 2013."Pay for Success Financing." Community Development Investment Review 9 (1). Federal Reserve Bank of San
Francisco. April 2013. "Case Study: Preparing for a Pay for Success Opportunity." Third Sector Capital Partners. April 2013.Megan Golden. "Developing a Social Impact Bond: Lessons from a Provider." The Children's Aid Society.
January 2013.Laura Callanan, Jonathan Law, and Lenny Mendonca. "
From Potential to Action: Bringing Social Impact Bonds to the U.S." McKinsey & Company. May 2012.“What Is Pay for Success?” Third Sector Capital Partners. October 2012."
A New Tool for Scaling Impact: How Social Impact Bonds Can Mobilize Private Capital to Advance Social Good."Social Finance. October 2012.
Michael Bloomberg, City of New York, "Bringing Social Impact Bonds to New York City" August 2012.Jeffrey Liebman. "
Social Impact Bonds: A Promising New Financing Model to Accelerate Social Innovation and Improve Government Performance." Center for American Progress. February 2011.