eamta keynote 2014
TRANSCRIPT

Quantum Dot Solar Cells:
A Simulation Approach
Ing. Ariel Cedola
GEMyDE, Departamento de Electrotecnia, Facultad de Ingeniería, Universidad Nacional de La Plata
Calle 48 y 116, 1er Piso, La Plata, 1900, Buenos Aires, Argentina
&
Dipartimento di Elettronica e Telecomunicazioni, Politecnico di Torino
Corso Duca degli Abruzzi 24, 10129, Torino, Italia
2014

Ing. Ariel Cedola – UNLP & POLITO
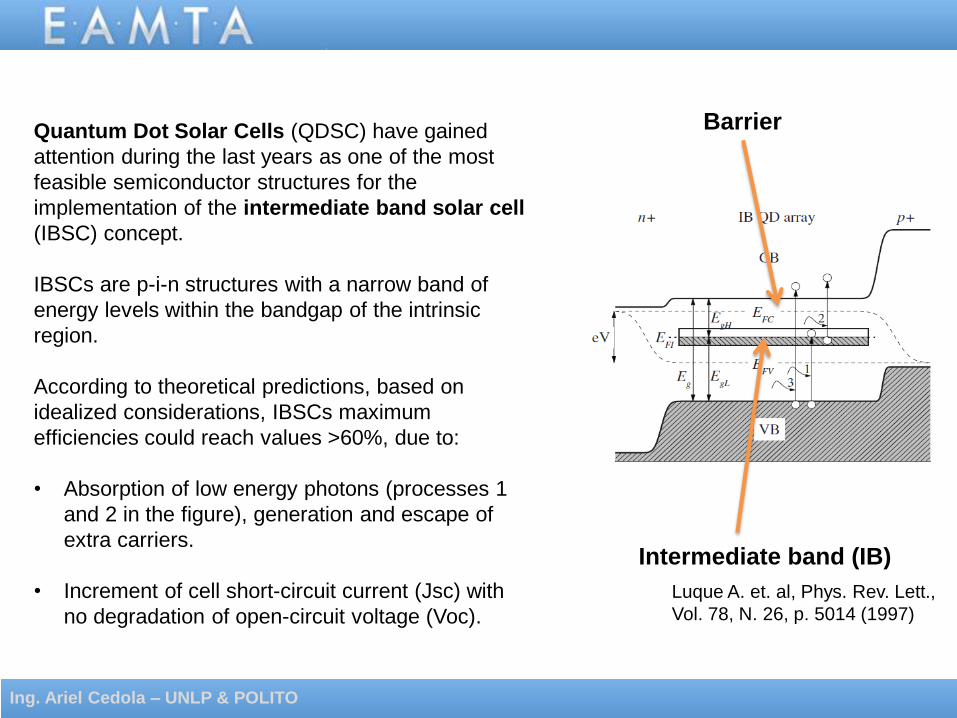
Quantum Dot Solar Cells (QDSC) have gained
attention during the last years as one of the most
feasible semiconductor structures for the
implementation of the intermediate band solar cell
(IBSC) concept.
IBSCs are p-i-n structures with a narrow band of
energy levels within the bandgap of the intrinsic
region.
According to theoretical predictions, based on
idealized considerations, IBSCs maximum
efficiencies could reach values >60%, due to:
• Absorption of low energy photons (processes 1
and 2 in the figure), generation and escape of
extra carriers.
• Increment of cell short-circuit current (Jsc) with
no degradation of open-circuit voltage (Voc).
Intermediate band (IB)
Barrier
Luque A. et. al, Phys. Rev. Lett.,
Vol. 78, N. 26, p. 5014 (1997)
Ing. Ariel Cedola – UNLP & POLITO
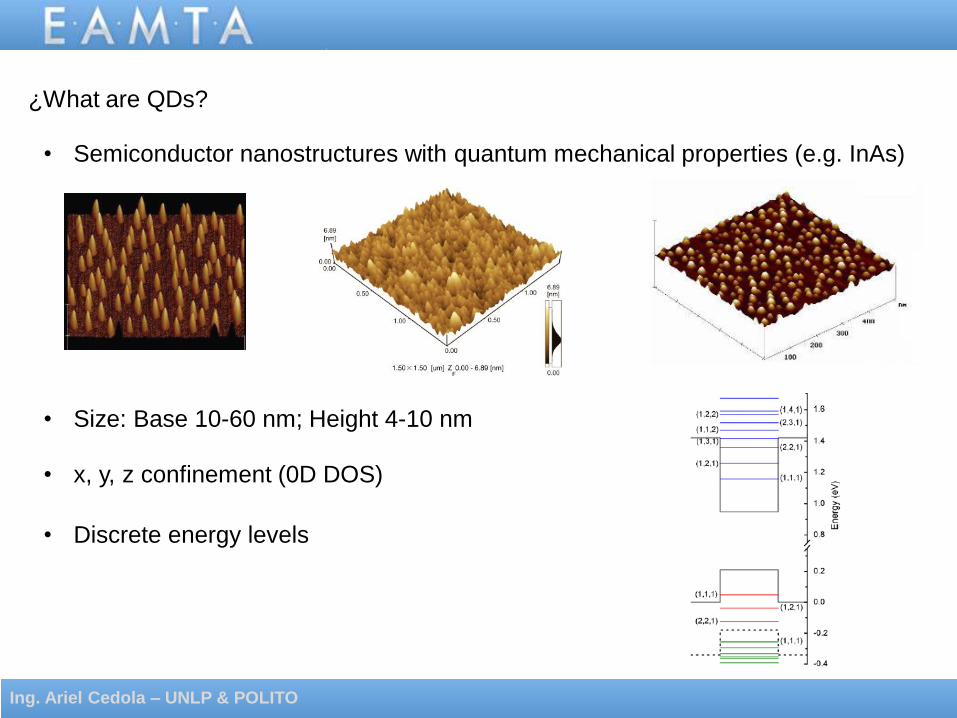
• Semiconductor nanostructures with quantum mechanical properties (e.g. InAs)
¿What are QDs?
• Size: Base 10-60 nm; Height 4-10 nm
• x, y, z confinement (0D DOS)
• Discrete energy levels
Ing. Ariel Cedola – UNLP & POLITO

• Bandgap and absorption spectrum depend on materials, sizes and shapes
• Non uniformity: absorption spectrum broadening
4 nm
9 nm
8 nm
InAs/GaAs InAs/GaAs GaN QDs
Ing. Ariel Cedola – UNLP & POLITO

QDs fabrication
• Stranski-Krastanow method
• QDs layer stacking ND = 1010 – 1011 cm-2
Ing. Ariel Cedola – UNLP & POLITO

EQE
Quantum efficiency of solar cells with embedded QDs layers
Without QDs
QDs (x, ND)
QDs (x, ND)
QDs (x, ND)
Ing. Ariel Cedola – UNLP & POLITO

InAs/GaAs Quantum Dot Solar Cells (QDSCs)
InAs QDs
layers
p GaAs n GaAs
i GaAs
Energ
ía [
eV
]
0
-1.5
1.5
x
Energy bands diagram
Ing. Ariel Cedola – UNLP & POLITO

Ing. Ariel Cedola – UNLP & POLITO
InAs QDs
layers
InAs/GaAs Quantum Dot Solar Cells (QDSCs)

< 900 nm
Efot > EG GaAs
Photogeneration
Recombination
Ing. Ariel Cedola – UNLP & POLITO
InAs/GaAs Quantum Dot Solar Cells (QDSCs)

> 900 nm
Efot < EG GaAs
Photogeneration
Recombination
Escape
Capture
JQD (EscWLB – CapBWL)
Ing. Ariel Cedola – UNLP & POLITO
InAs/GaAs Quantum Dot Solar Cells (QDSCs)

Jolley 2012 Prog. Photovolt.
Guimard 2010 APL Bailey 2011 APL
Yang 2013 SEM&SC
Ing. Ariel Cedola – UNLP & POLITO
InAs/GaAs QDSCs: Experimental IV curves
Ing. Ariel Cedola – UNLP & POLITO
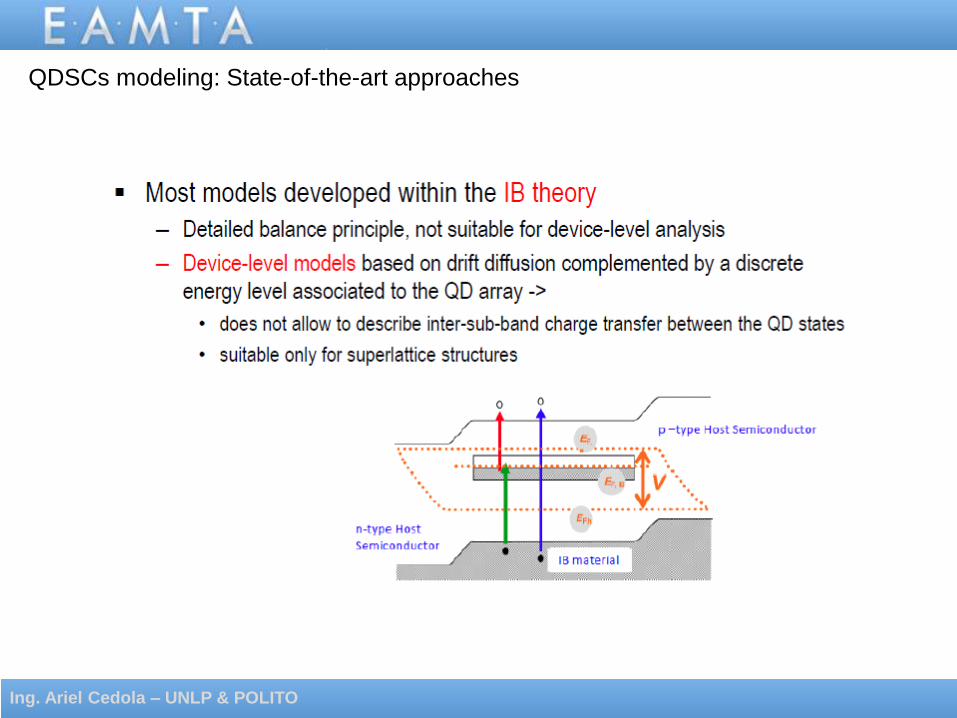
QDSCs modeling: State-of-the-art approaches

Our work: Drift-Diffusion + QDs carrier dynamics modeling
2
2 i i i i i id a WL WL ES ES GS GS
i
V qp n N N p n p n p n
x
1
i iWL B B WLnB B nESC nCAP
i
JnR G R R
t q x
1
i ip WL B B WL
B B pESC pCAP
i
JpR G R R
t q x
n n n
V nJ q n qD
x x
p p p
V pJ q p qD
x x
• Poisson equation
• Continuity equations for holes and electrons
Drift-diffusion transport model
i = QDs layer
Ing. Ariel Cedola – UNLP & POLITO

i i i i i i i
i i
WL B WL WL B WL ES ES WL
nCAP nESC nCAP nESC WL WL
nR R R R R G
t
i i i i i i i i i
i i
ES WL ES ES WL ES GS GS ES
nCAP nESC nCAP nESC ES ES
nR R R R R G
t
i i i i i
i i
GS ES GS GS ES
nCAP nESC GS GS
nR R R G
t
( )
( )
( )( )1n p ESC
n p ESC
n pn pR
DOS
( )
( )
( ) ( )1n p CAP
n p CAP
n p n pR
DOS
=WL, ES, GS; =B, WL, ES
• Rate equations for electrons at each energy level at each QD layer
• Escape and capture rates for electrons (holes)
fe(h)i
fe(h)i
Ing. Ariel Cedola – UNLP & POLITO
QDSCs modeling
i = QDs layer
• Recombination rates

ddxffffxGi
WLiWLiWLiWLii
x
heWLGAMheWLWL
0
5.1 ',,exp,,,
ddxffffxGi
ESiESiESiESii
x
heESGAMheESES
0
5.1 ',,exp,,,
ddxffffxGi
GSiGSiGSiGSii
x
heGSGAMheGSGS
0
5.1 ',,exp,,,
• Photogeneration rates at each QD energy level
0.2 0.4 0.6 0.8 1 1.2 1.40
0.2
0.4
0.6
0.8
1
1.2
1.4
1.6
1.8
Wavelength [nm]
AM1.
5G S
pect
ral I
rradi
ance
[kW
/m2/
um]
GaAs InAs
IEEE ARGENCON 2014
Ing. Ariel Cedola – UNLP & POLITO
QDSCs modeling
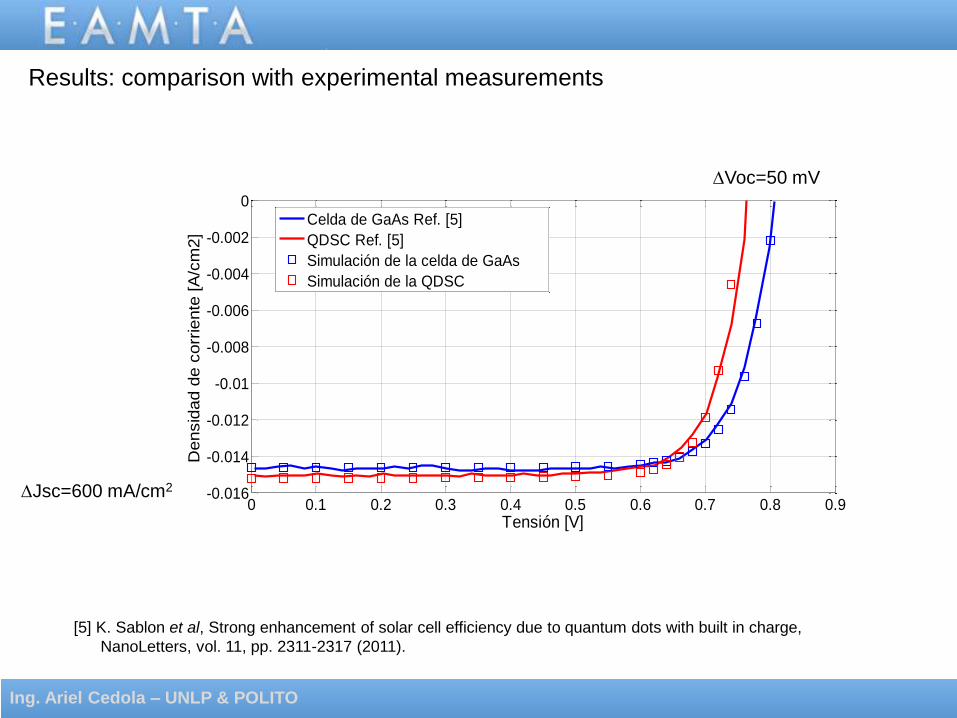
Results: comparison with experimental measurements
0 0.1 0.2 0.3 0.4 0.5 0.6 0.7 0.8 0.9-0.016
-0.014
-0.012
-0.01
-0.008
-0.006
-0.004
-0.002
0
Tensión [V]
Densid
ad d
e c
orr
iente
[A
/cm
2]
Celda de GaAs Ref. [5]
QDSC Ref. [5]
Simulación de la celda de GaAs
Simulación de la QDSC
[5] K. Sablon et al, Strong enhancement of solar cell efficiency due to quantum dots with built in charge,
NanoLetters, vol. 11, pp. 2311-2317 (2011).
Voc=50 mV
Jsc=600 mA/cm2
Ing. Ariel Cedola – UNLP & POLITO

300 400 500 600 700 800 900 1000 1100 120010
0
101
102
103
104
105
Longitud de onda [nm]
Respuesta
espectr
al [a
.u.]
Celda de GaAs Ref. [5]
QDSC Ref. [5]
Simulación de la celda de GaAs
Simulación de la QDSC
[5] K. Sablon et al, Strong enhancement of solar cell efficiency due to quantum dots with built in charge,
NanoLetters, vol. 11, pp. 2311-2317 (2011).
Ing. Ariel Cedola – UNLP & POLITO
Results: comparison with experimental measurements (cont.)

Results: Dependence of I-V curves with number of QD layers and density
0 0.1 0.2 0.3 0.4 0.5 0.6 0.7 0.8 0.9
-0.025
-0.02
-0.015
-0.01
-0.005
0
Tensión [V]
Densid
ad d
e c
orr
iente
[A
/cm
-2]
ND = 1.2e10 cm-2
ND = 4e10 cm-2
ND = 1e11 cm-2
20x
100x
Ing. Ariel Cedola – UNLP & POLITO
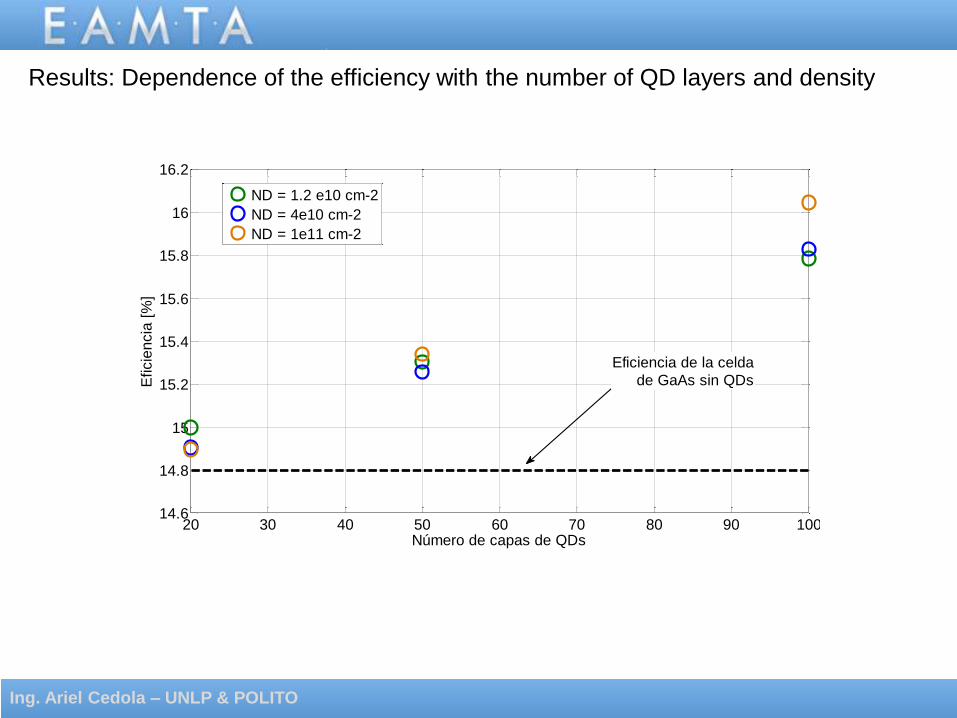
20 30 40 50 60 70 80 90 10014.6
14.8
15
15.2
15.4
15.6
15.8
16
16.2
Número de capas de QDs
Eficie
ncia
[%
]
ND = 1.2 e10 cm-2
ND = 4e10 cm-2
ND = 1e11 cm-2
Eficiencia de la celda
de GaAs sin QDs
Results: Dependence of the efficiency with the number of QD layers and density
Ing. Ariel Cedola – UNLP & POLITO

Results: Doping effects
80 nm (NA = 1018 cm-3)
70 nm (NA = 3x1017 cm-3)
600 nm (intr.)
300 nm (ND = 1018 cm-3)
10x
EB-WL
EWL-ES
EES-GS
EB-WL
EWL-ES
EES-GS
1420 meV
Parámetros QDSC-A QDSC-B
Capa p+ GaAs (1018 cm-3) [nm] 80 80
Capa p- GaAs (3x1017 cm-3) [nm] 70 70
Capa i GaAs [nm] 600 600
Capa n+ GaAs (1018 cm-3) [nm] 300 300
ND = Densidad sup. de QDs [cm-2] 6x10¹⁰ 6x10¹⁰
Número de capas de QDs 10 10
Rango de captura de los QDs [nm] 5 5
n: EB-WL, EWL-ES, EES-GS [meV] 140, 62, 70 220, 40, 30
p: EB-WL, EWL-ES, EES-GS [meV] 28, 16, 16 140, 15, 15
n-capWL, n-capES, n-capGS [ps] 0.3, 1, 1 0.3, 1, 1
p-capWL, p-capES, p-capGS [ps] 0.1, 0.1, 0.1 0.1, 0.1, 0.1
rWL, rES, rGS [ns] 1, 1, 1 1, 1, 1
Ing. Ariel Cedola – UNLP & POLITO

Results: Doping effects (cont.)
Ing. Ariel Cedola – UNLP & POLITO

Ing. Ariel Cedola – UNLP & POLITO
Results: Doping effects (cont.)

Ing. Ariel Cedola – UNLP & POLITO
Results: Doping effects (cont.)

Ing. Ariel Cedola – UNLP & POLITO
Results: Non-linear (additive) behavior & QD dynamics
Full solar spectrum illumination > 900 nm
K. Sablon et al, NanoLetters, vol. 11, pp. 2311-2317 (2011)
0 0.2 0.4 0.6 0.8-30
-25
-20
-15
-10
-5
0
X: 0.001
Y: -8.607
Voltage (V)
Curr
ent
density (
mA c
m-2
)
X: 0
Y: -20.74
X: 0
Y: -29.34
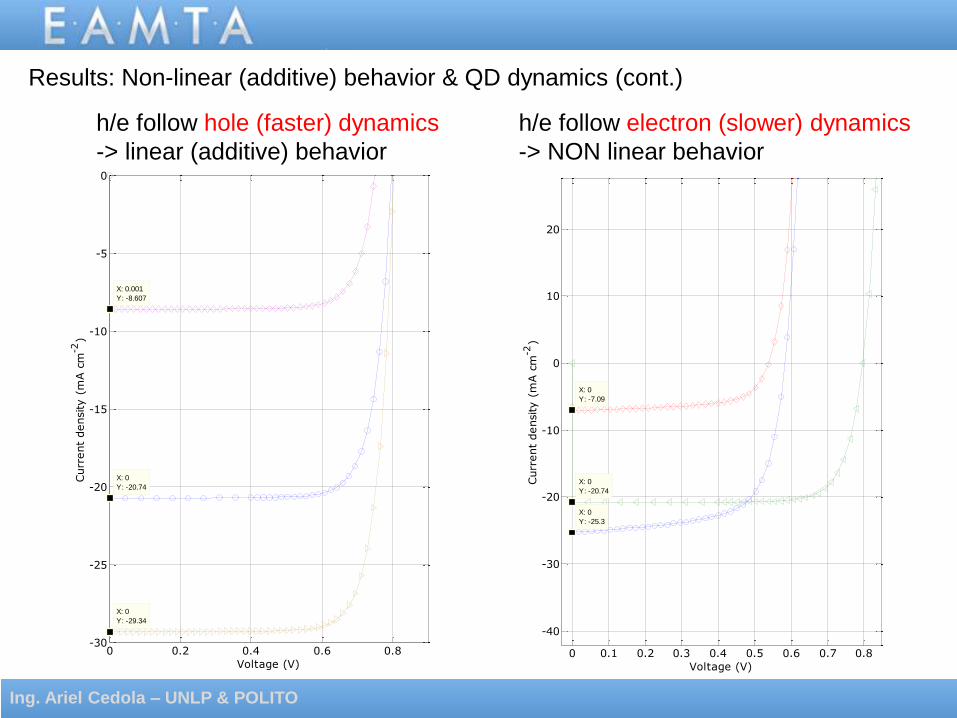
h/e follow hole (faster) dynamics
-> linear (additive) behavior
h/e follow electron (slower) dynamics
-> NON linear behavior
Ing. Ariel Cedola – UNLP & POLITO
Results: Non-linear (additive) behavior & QD dynamics (cont.)
0 0.1 0.2 0.3 0.4 0.5 0.6 0.7 0.8
-40
-30
-20
-10
0
10
20
X: 0
Y: -7.09
Voltage (V)
Curr
ent
density (
mA c
m-2
)
X: 0
Y: -20.74
X: 0
Y: -25.3

Ing. Ariel Cedola – UNLP & POLITO
Results: Non-linear (additive) behavior & QD dynamics (cont.)
010E+12
1,000E+12
010E+16
1,000E+16
010E+20
1,000E+20
010E+24
1,000E+24
010E+28
1,000E+28
0 5 10 15 20
Rat
e [c
m-3
s-1]
# QD layer
GS
tasa_cap_n_GS
tasa_esc_n_GS
tasa_cap_p_GS
tasa_esc_p_GS
g_sol_qd_gs
tasa_rec_GS
abs(net_cap_n_GS)
abs(net_cap_p_GS)
0 5 10 15 20
GS
Full solar spectrum illumination > 900 nm

Ing. Ariel Cedola – UNLP & POLITO
Results: Non-linear (additive) behavior & QD dynamics (cont.)
100E-12
1,000E-12
001E-08
010E-08
100E-08
1,000E-08
001E-04
010E-04
100E-04
1,000E-04
001E+00
0 5 10 15 20
Ocup. factors
0 5 10 15 20
Ocup. factors
GS ES WL GS ES WL
Full solar spectrum illumination > 900 nm

Ing. Ariel Cedola – UNLP & POLITO
Results: Non-linear (additive) behavior & QD dynamics (cont.)
Full solar spectrum illumination > 900 nm
-200E+20
-150E+20
-100E+20
-050E+20
0,000E+00
050E+20
100E+20
1 2 3 4 5 6 7 8 9 10 11 12 13 14 15 16 17 18 19 20
NET ESCAPE
GS->ES ES->WL WL->Barrier
-060E+20
-040E+20
-020E+20
0,000E+00
020E+20
040E+20
060E+20
1 2 3 4 5 6 7 8 9 10 11 12 13 14 15 16 17 18 19 20
NET ESCAPE

Conclusions
• A device-level model including QD intersubband carrier dynamics and transport has been developed
for simulation of QDSCs.
• Preliminary results agree very well with experimental data.
• Effects of doping and non-additive behavior of the QD photocurrent have been investigated.
• QD Photocurrent can be increased with optimal n-uniform doping, althoug the Voc degradation is still
a factor to investigate.
• Non-linearities can be associated to the de-synchronization of QD dynamics
Ing. Ariel Cedola – UNLP & POLITO
