eagle lake management plan · eagle lake management plan willmar minnesota photo courtesy of glen...
TRANSCRIPT

1
Eagle Lake Management Plan Willmar Minnesota
Photo Courtesy of Glen Simons
February 29th, 2012
Prepared for:
Eagle Lake Improvement Association
PO Box 1653
Willmar, MN 56201
Prepared by:
Stephanie Klamm
Hawk Creek Watershed Project
500 E. DePue Ave.
Olivia, MN 56277
2
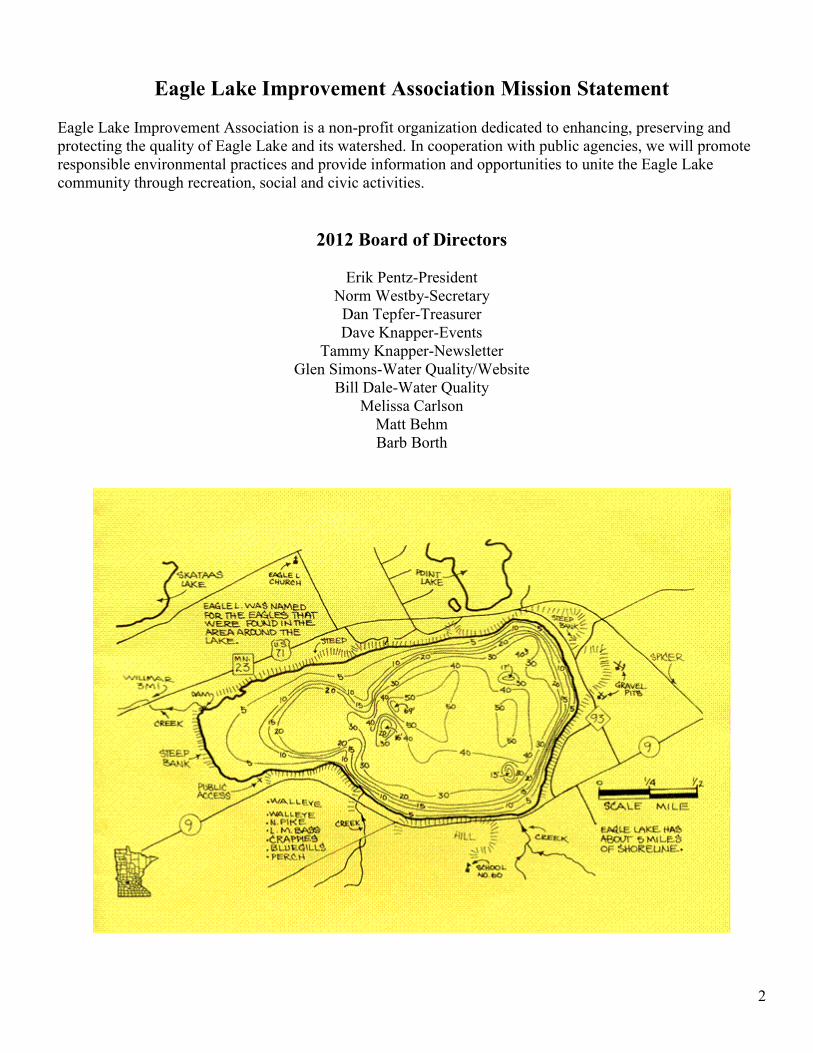
Eagle Lake Improvement Association Mission Statement
Eagle Lake Improvement Association is a non-profit organization dedicated to enhancing, preserving and
protecting the quality of Eagle Lake and its watershed. In cooperation with public agencies, we will promote
responsible environmental practices and provide information and opportunities to unite the Eagle Lake
community through recreation, social and civic activities.
2012 Board of Directors
Erik Pentz-President
Norm Westby-Secretary
Dan Tepfer-Treasurer
Dave Knapper-Events
Tammy Knapper-Newsletter
Glen Simons-Water Quality/Website
Bill Dale-Water Quality
Melissa Carlson
Matt Behm
Barb Borth

3
MANAGEMENT PLAN FOR EAGLE LAKE
TABLE OF CONTENTS
Lake and Watershed Description 5
Eagle Lake Improvement Association 5
Precipitation and Response to Events 6
Figure 1. 2009 Eagle Lake Water Level Response 6
Figure 2. 2010 Eagle Lake Water Level Response 7
Figure 3. 2011 Eagle Lake Water Level Response 7
Presettlement Vegetation 9
Current Landuse 9
Water Level Management 10
Watershed/Lake Acreage Ratio 11
Soil Types 11
Aquifers and Watercourses 11
Aquifers 11
Groundwater Recharge 11
Watercourses 12
Public Access 12
Fisheries Management 12
Past Management 13
Present Management 13
Figure 4. Past Historical Fishery Surveys 13
Synposis of 2009 MN DNR Fisheries Survey 13
Figure 5. Fish Stocking Activity on Eagle Lake 14
Aquatic Invasive Species 15
Aquatic Invasive Species 15
Non-Native Aquatic Species 15
Aquatic Vegetation 16
Aquatic Vegetation in Eagle Lake 16
Figure 6. Complete Plant list for Eagle Lake 16
Non-Native Aquatic Plants 16

4
Historical and Present Day Monitoring Data 17
Figure 7. Carlson’s Trophic Status Index and Water Quality 18
Figure 8. Comparison of trophic state indices and values on ecoregions of Minnesota 19
Figure 9. TP, Secchi and Chlorophyll-a averages for all lakes in Kandiyohi County 19
Figure 10. Eagle Lake TSI in 1994 20
Figure 11. 2000-2011 Eagle Lake TSI 20
Figure 12. Average Annual Chlorophyll-a in Eagle Lake 21
Figure 13. Average Annual Secchi Disk in Eagle Lake 21
Figure 14. Average Annual Total Phosphorus in Eagle Lake 22
Figure 15. User Perception vs. Secchi Readings 22
Figure 16. Total Phosphorus Comparisons by site (southern portion) 23
Figure 17. Total Phosphorus Comparisons by site (northern portion) 23
Eagle Lake Improvement Association Management Goals 24
Appendix of Maps 31
Map 1. Hawk Creek Watershed Project Area 32
Map 2. Hawk Creek Subwatersheds 33
Map 3. Eagle Lake Presettlement Vegetation 34
Map 4. Eagle Lake Landuse (2009) 35
Map 5. Kandiyohi County Planning and Zoning 36
Map 6. Eagle Lake CRP (2009) 37
Map 7. Eagle Lake Restorable Wetlands 38
Map 8. Eagle Lake Feedlots (2011) 39
Map 9. Eagle Lake MPCA/CLMP Monitoring Sites (1994) 40
Map 10. Eagle Lake Monitoring Sites (2011) 41
Figure 18. Recorded Water Levels 1939-2011 42
References 43

5
Eagle Lake, Kandiyohi County, MN
Lake size: 891 acres
Littoral zone: 274 acres
LAKE AND WATERSHED DESCRIPTION Named for the eagles that were found around the area of the lake; Eagle Lake is located in Kandiyohi
County, about one mile north of Willmar, Minnesota. It is classified by the Minnesota Department of Natural
Resources (MN DNR) as a Class 27 lake. Lakes in Class 27 are relatively large productive, hard water lakes.
(MPCA LAP, 1994). The lake identification number of Eagle Lake is 34-0171. Eagle Lake is split between
two townships; Dovre and Green Lake. Its legal description is Kandiyohi County, Township 120 North, Range
35 West, Sections 24 and 25, and Township 120 North, Range 34 West, Sections 19 and 30. In 1967 there
were 62 seasonal residences, and 110 permanent residences for a total of 172 residences. In 1982 there were
62 seasonal residences, and 216 permanents residences for a total of 278 residences. As of 1995, residential
development of 275 homes/cabins had occurred around the entire shoreline area with the exception of the
northeast portion of the lake. There are currently approximately 283 homes as of 2012 on Eagle Lake.
A watershed can be defined as an area of land above a specific location from which all water drains to
that location. Eagle Lake lies within the larger Hawk Creek watershed. Where the specific location of the
receiving waters is a lake, the watershed is sometimes referred to as a lakeshed. The lakeshed of Eagle Lake is
11,737 total acres including the 891 acres of Eagle Lake. The average depth of the lake is 25 feet, with a
maximum depth of 67 feet. The littoral area, (15 feet or less in depth of Eagle Lake), is 274 acres, which is
33% of the total lake. Eagle Lakes fetch is approximately two miles. Eagle Lake has approximately 5 miles of
shoreline and there are two lakes and numerous wetlands within the watershed area of Eagle Lake. The
estimated average water residence time of the lake is four to five years. There are three primary inlets to Eagle
Lake and only one outlet, which is the start of Hawk Creek. Both inlets on the eastern side run through a
series of wetlands.
Eagle Lake is near the beginning or headwaters of the Hawk Creek Watershed, the lakes outlet is the
beginning of Hawk Creek. The Hawk Creek Watershed is characterized by a gently twisting till
plain formed during the advance of the Des Moines Lobe. Elevations generally range from 1,070 to 1,130 feet
above sea level within the watershed. The lowest point within Kandiyohi County is found near the area where
Chetomba Creek exits the County to the south. The elevation of this point within the watershed is 1,060 feet
above sea level (Kandiyohi County Water Plan, 2003).
Map 1 in the appendix shows the general location of Hawk Creek, major lakes, roads, municipalities,
and the legal boundaries of the Hawk Creek Watershed. Major subwatersheds of the Hawk Creek watershed
are shown in Map 2 in the appendix.
EAGLE LAKE IMPROVEMENT ASSOCIATION
The Eagle Lake Improvement Association originally was formed because of concerns over declining
water quality. The Eagle Lake Improvement Association by-laws were adopted on July 7, 1966. In December
of 1968 the Eagle Lake Association lead the discussion on a centralized sanitary sewer around the lake with
Kandiyohi County. By October 20, 1969 Kandiyohi County commissioners approved Eagle Lake’s
centralized sewage system, and in 1973 the peripheral sewage collection line was in place around Eagle Lake.
It was the first of its type constructed in out state Minnesota. Three sediment basins were also constructed in
the watershed; they were designed to reduce the sediment and nutrients delivered to the lake from its
predominantly agricultural watershed (Simons, 2011) and (Wright, 1995).
The Eagle Lake Improvement Association requested a lake management plan update in December
2011 to re-assess the water quality, aquatic life and aquatic plant communities in Eagle Lake, as well as
evaluate the watershed conditions and then prepare lake management ideas.
Eagle Lake Statistics: Maximum depth (feet): 67 feet
Mean depth (feet): 25 feet
Watershed acres: 11,737 acres
Watershed to Lake Ratio: 13.1:1
Clarity in 2011 (feet): 8.3 feet
Phosphorus in 2011 (ug/l): 45
Chlorophyll-a in 2011 (ug/l): 21

6
PRECIPTATION AND RESPONSE TO EVENTS In 1995, based on Minnesota Climatology records, precipitation averaged 23-26 inches annually in this
part of the state. Water-year precipitation near Eagle Lake was near normal (24-28 inches) based on
Minnesota Climatology Office records (MPCA LAP, 1994). In 2010, based on State Climatology records,
precipitation averaged 36-40 inches annually and water-year precipitation was above normal (40-44 inches).
From 1990 to 2010, Kandiyohi County averaged 30-34 inches of precipitation, which is an increase from the
1950-1980s.
The response of Eagle Lake to precipitation events was observed using lake level data during the 2009-
2011 open water periods based on volunteer observed levels. This period was used due to a high number of
readings throughout the course of the open water season that is not present throughout the previous period of
record, allowing for higher resolution in determining peak water level fluctuation following an event.
Precipitation data for 2009-2011 in the Willmar area was obtained from the Minnesota Climatology Working
Group (MCWG).
In 2009, four precipitation events that exceeded 1.5 inches were observed (Figure 1; 7/21, 8/9, 8/16,
10/2). Measurements within one day of the first three events showed corresponding instantaneous increases in
lake level equal to or less than the precipitation amount (0.08’, 0.16’, and 0.3’, respectively). The increases
noted on 7/21 and 8/9 (0.08’and 0.16’) were followed by sharply decreasing levels within 3-4 days. The event
on 8/16 (0.3’) was followed by a period of 4-5 days in which the lake continued to rise, followed by a period
of little change that include two more rain events of less than 0.50” respectively before beginning to fall again.
This was most likely in response to the two large events in close succession. The pattern changed, however,
following the 10/2 event, during which the lake levels continued to rise well beyond the expected levels, even
including the four smaller event anteceding it. The observed total increase of ~0.6’ is well over the observed
rainfall during this period. The events early and late in the growing season seemed to correspond to greater
lake level increases than those observed during the summer months. All in all, the total precipitation received
in 2009 (31.05”) is near average for the period of record (MCWG).
Figure 1. Eagle Lake Water Level Response to Precipitation in 2009.
In 2010, the pattern of lake level fluctuation observed in 2010 is similar to that observed in 2009. Six
precipitation events of 1.5 inches or greater were noted (Figure 2, 6/11, 6/23, 7/11, 8/13, 8/31, and 9/16). The
6/11 precipitation event (3.12”) caused an immediate 0.2’ increase in lake levels, followed by an additional
0.2’ increase over the next week. The following events on 6/23, 7/11, 8/13, and 8/31 caused similar increases
initially, but resulted in smaller overall increases in lake level. The subsequent large events in August (3.15”
and 2.97”) resulted in similar lake level increases individually (0.25’ and 0.28’ respectively) as did a 1.03”
event on 5/11 (0.23’ increase). It should also be noted that 3.52” of rain fell in 3 events from 9/16-9/24 and

7
caused a water level increase of ~0.5’, roughly equivalent to the rise associated with 6.12”of precipitation in
August events. Once again, it is evident that the events in the early spring and fall have more dramatic effect
on water levels than those during the midst of the growing season. 2010 was considered one of the wetter
years on record, with 41.75” of precipitation received.
Figure 2. Eagle Lake Water Level Response to Precipitation in 2010.
Once again, the patterns reflected in the 2011 data (Figure 3) are similar to those seen the previous
years. Large successive events compounded to rapidly increase water levels early in the summer, and large
events throughout July caused additional water level rises. Intervals of little precipitation (typically longer
than 5 days) resulted in falling lake levels, fluctuation. However, following August 17, only one precipitation
event exceeding 0.50” occurred. As such, the lake levels trended downward for most of the late summer and
fall. While the largest precipitation events observed in 2011 were not as large as those in the previous two
years, with none exceeding 2.0 inches, but the number events that exceeded 0.50 inches was similar (13 in
2009, 12 in 2010, 13 in 2011). Therefore, even with the relatively dry fall, precipitation for the year was near
average at 31.05” received.
Figure 3. Eagle Lake Water Level Response to Precipitation in 2011.

8
To summarize the information above; through this analysis, a wide range of conditions have been
assessed. Response during the wet periods of 2009-2010 is observed and the gradual decline of lake levels
during the dry late summer and early fall of 2011 is noted, as well as lake response to a wide range of
precipitation events. While the lake level fluctuations were not extreme, a number of patterns were evident in
the data.
The first noticeable pattern is the varied response of the basin to precipitation events throughout the
year. Generally, the size of the event necessary to cause significant lake level fluctuations decreases in May
and October compared to the summer months, this is demonstrated in both 2009 (Fig 1) and 2010 (Fig 2),
when relatively small events (<1”) in October caused lake level increases of ~0.3 feet, nearly equivalent to the
increases observed following rain events of 2.5” or greater during July and August of each year, respectively.
This is indicative of altered hydrology within the watershed that is concentrating water during the non-
growing season and allowing it to flow more quickly downstream.
This trend is also noticeable when comparing outflow from the watershed into the basin over the
course of the year. It is important to note that the vast majority of rainfall in the watershed is not received as
runoff into the lake. Using a basic volume calculation, the precipitation received within the watershed during
an event can be compared to water level fluctuations in the lake associated with that event. For instance,
during the large July and August events with >1.5” of precipitation in all three years used in this comparison,
only 5-9% of the rain volume across the watershed reaches the lake and causes volume increases. However,
during the months of May and October, this percentage rises to 12-17%. This is also indicative to some
degree of the alteration of flow entering the lake, as the amount of flow entering the lake increases when the
land is not in production. In an unaltered setting, the percentage of precipitation reaching the basin should not
vary too drastically based on the time of year. The vegetation in the watershed when not growing, will
promote infiltration of precipitation where it falls rather than promoting runoff. While not extreme, this trend
is noticeable.
Another possible contributing factor for varied response to precipitation events relates to
evapotranspiration (ET) and vegetative uptake during the growing season. Uptake and ET related to active
plant growth, especially in agricultural areas may have a major impact on water delivery to the lake from the
surrounding watershed. In addition, this pattern may belay the changes in land use that have taken place in the
watershed. During the active growing season, vegetation is a large factor in limiting runoff not only from
uptake, but also promoting infiltration but during the non-growing season months. With a lack of perennial
vegetation or storage areas, more precipitation is directed to drainage systems, which in turn is directed into
downstream receiving waters, which, in this case, is Eagle Lake.
While vegetative uptake does limit flow during the growing season, storage of water on the landscape
during the non-growing season is one of the most effective ways to limit additional flow to downstream areas.
While a number of wetland restorations and water impoundment structures have already been implemented in
addition to the land purchased and removed from production by the USFWS and DNR Wildlife, there are
approximately 800 of wetlands various sizes that could be restored to aid in buffering flows reaching Eagle
Lake (Map 6). In addition to flow attenuation, restoration of storage basins also has positive implications for
water quality in downstream waters. While there are a number of restored wetlands in the area, there is
excellent potential for more.
Another trend noted in the data was the quick rise and gradual decrease of water levels within the lake
in response to the events. In general, the water levels in basin responded quickly to a large precipitation event,
usually displaying the majority of water level increases within one day. Periods with successive events did
show increases that continued for several days following before gradually beginning to decrease. This is
indicative of a watershed where there is a degree of alteration, but not to an extreme. Relatively unaltered
systems typically show gradual increases and gradual decreases as flow is discharged over time in response to
events, where as highly altered system will increase rapidly and fall rapidly as flow is concentrated and
discharged quickly. The watershed discharge gradually decreases between precipitation events, instead of
decreasing quickly over a shorter period of time as would be expected in a highly altered system.
9
It is also evident that successive events have cumulative effects on lake levels, and the smaller events
(<1.5”) have more effect following these larger events than when occurring separately, or spaced at longer
intervals. This is most likely directly related to high soil moisture limiting infiltration during successive
events, leading to additional contributions to either sub-surface drainage systems or surficial runoff.
Successive events like these outline the importance of buffers strips along waterways and drainage flow paths.
When the soil is saturated, more precipitation from subsequent events is transmitted to waterways as surface
runoff, and, especially during the non-growing season when surface vegetation in agricultural areas is at a
minimum, has the capacity to entrain sediments and nutrients and convey them downstream to receiving
waters.
It is important to note that, while the water levels in Eagle Lake do fluctuate frequently, the overall
range of fluctuations over the course of the year do not vary by more than 1.1 feet. Downstream Foot Lake
showed only slightly larger variations in levels over the same time period varying by up to 1.3 feet in the
recent period of record. However, there are much larger implications for water quality based on the larger
watershed.
One point to note is that this comparison only takes into account the apparent rise in water levels
between measuring points, and does not take outflow from the basin into account. This may only be addressed
by advanced modeling. However, without additional data on runout volumes and advanced modeling, this
calculation is what can be addressed. The outlet elevation of Eagle Lake is 1124.7’ (NGVD 1929), and
outflow is occurring throughout the period of record except for a portion of 2009. This may affectively
decrease the total overall lake level fluctuation by buffering rising levels following a precipitation event,
however, the relative comparison between events throughout the year remains valid, as all events referenced
have outflow to some degree. In addition, it is difficult to quantify the groundwater contributions to this basin.
While groundwater may play a significant role in the water level fluctuations of Eagle Lake, we currently have
now way to accurately quantify or expressly measure it at this point. (Jenzen, 2012).
PRE-SETTLEMENT VEGETATION The MN DNR has inventoried the original vegetation of Minnesota through their Pre-settlement
Vegetation Database in 2006. According to the Pre-settlement Vegetation Database, the Eagle Lake
watershed was a mixture of forest and prairie prior to settlement, along with large “wet prairie” areas in the
middle of the watershed. There is more of a forested affect towards the western portion of the watershed
around Point Lake, and more prairie around Eagle Lake during the pre-settlement era. The wooded area
around Point Lake was a mixed hardwood forest with oak, maple, basswoods and hickory. “Big Bluestem and
Indian Grass occupied the deep soils of the moist uplands, and Little Bluestem and Side Oats Grama covered
the thin soils of the dry uplands. Throughout the prairie, numerous wetland communities were dominated by
sedges and rushes. These wetlands are known today as “prairie potholes.” (Kandiyohi Country Water Plan,
2003). Map 3 in the appendix shows the pre-settlement vegetation in the Eagle Lake watershed.
CURRENT LANDUSE The current Eagle Lake watershed can be characterized by a mix of land uses including cultivated, pastured,
urban and some forest and wetlands. Point Lake and Burr Lake along with several wetlands are also located in
this watershed. In 1994, MPCA LAP study showed that water and “prairie potholes” account for 24% of the
land use, forested areas account for only 5%, while cultivated land is 34%, with soybean and corn crops being
the dominant crops. Pasture is roughly 30% of the land use, and urban lands including homes, roadways,
lawns, etc. accounts for 7% of the watershed, with most of the urban being in the near-shore area of the lake
(MPCA LAP 1994). In 2011, Kandiyohi SWCD assessed the Eagle Lake watershed and found that water and
“prairie potholes” account for 24% of the land use, forested areas accounts for only 5%, while cultivated land
increased 4% (now 38%), pasture/alfalfa is roughly 4% of the land use, and urban lands including homes,
roadways, lawns, etc. increased up to 9% of the watershed, with most of the urban being in the near-shore area
of the lake. Map 4 in the appendix shows the current land use in the Eagle Lake watershed, as of 2009. Map
5 in the appendix shows the Kandiyohi County Planning and Zoning areas in the Eagle Lake Watershed.

10
As stated previously, row crop agriculture represents the dominate land use in the watershed.
Interconnected open channel ditches and tile lines located throughout the watershed convey runoff from
watershed to lake. Many areas in the watershed that once contained landlocked “prairie potholes” are now
drained and have been converted to farmland. With the introduction of the Conservation Reserve Program
(CRP), many landowners who have highly erodible soils have converted their farmland into permanent grass
cover. Map 6 in the appendix show the areas that have CRP or retired farmland in the Eagle Lake watershed
as of 2009, without the most current data some CRP may have be taken out and put back in to production
since 2009 or farmland may have enrolled into the CRP program since 2009. According to the Kandiyohi
SWCD the CRP acres enrolled in the Eagle Lake watershed is approximately 2,147acres; a decrease of 296
acres since the 1994 LAP study was completed. There is also 205 acres of alfalfa in the watershed, which is
also a decrease of 322 acres since the LAP study was completed.
Along with CRP, organizations such as the US Fish and Wildlife Service (USFWS) have actively
restored wetlands within the watershed. Map 7 in the appendix shows the restorable wetlands within the Eagle
Lake watershed. The efforts of the local landowners and agencies have has a positive effect on the water
quality of Eagle Lake. A large gravel pit is located in close proximity to the north side of the lake, but there
has not been an impact study to see the affects of the gravel pit on the watershed.
There were several small dairy and feeder operations with approximately 600 head of cattle in the
watershed, based on the 1994 LAP study based on information from the Kandiyohi County SWCD.
According to the Kandiyohi County Feedlot Officer in 2011, there are 13 registered livestock operations,
(9 with livestock on their property (a total of 220 animal units)). The majority of the livestock on the feedlots
are beef and dairy cattle. There is one turkey barn in the far northern portion of the watershed that is owned
by Willmar Poultry Company and is registered and regulated by the MPCA. Map 8 in the appendix show the
feedlots in the Eagle Lake Watershed. Most of the feedlots in the watershed are located on the eastern portion
and are near some of the major tributaries to Eagle Lake. Depending on how the animal waste is managed,
these operations can be a potential source of nutrients to the lake.
WATER LEVEL MANAGEMENT Eagle Lake is approximately 11,737 acres including the lake. The majority of the watershed is east of
the lake with some additional draining from the west and north via Point Lake. There are two inlets and one
outlet for Eagle Lake. Highway 23/71 drainage into the lake occurs along the west side. Agricultural row crop
drainage into the lake occurs via several inlets/tiles along east and south locations of the lake.
A project connecting Point Lake to Eagle Lake via a culvert under US Highway 71 increased the
watershed to the west. It was constructed by Kandiyohi County in the mid-1980s to provide a high water
outlet for Point Lake. The culvert is opened on a seasonal basis under the supervision of the county engineer.
In 1991 an earthen dam with a variable crest water level control structure was constructed at the major
inlet of Eagle Lake. The structure is located on the northeast side of the lake, at the outlet of a 60-acre marsh
referred to as the “Halverson Slough”. Land contributing runoff to this slough represents approximately three-
fourths of the lakes watershed. (Wright, 1995). Eagle Lake outlets in the southwest corner of the lake; draining into a small channel called Hawk
Creek through a series of lakes and on to the Minnesota River. Eagle Lake water levels are controlled by a
fixed crest concrete dam at the outlet of Eagle Lake. The dam contains three 11.2 foot wide bays with a total
spillway length of 33.6 feet. Water flows over the dam at an elevation of 1124.7. The crest of the dam is 1.5
feet higher then the sill. Current run out conditions match the elevation established by the Kandiyohi County
board in 1931 prior to the construction of the first dam. A third dam was built in 1941 by the Works Progress
Administration. The first and second dams were built in 1931 and 1935 respectively. Originally, the existing
dam was built and operated as a variable crest control structure with six bays containing stop logs. The stop
logs were only operated for six years when they were ordered in place in 1947 by the MN DNR Division of
Waters policy. Due to ice jacking on the dam in 1964, a concrete crest replaced the wooden stop logs.
(Wright, 1995).

11
Eagle Lakes ordinary high water level (OHW) is 1126.3, which determines the MN Department of
Natural Resources jurisdictional boundary of the lake.
The lake level response of Eagle Lake is important to evaluate, as it is a valid assessment of the nature
of the surface and subsurface hydrology within the lake watershed. Generally, lake level response to a
precipitation event can change based on several variables, including time of year, land use, drainage pattern,
storage, degree of insipient soil moisture and degree of overall land alteration within the watershed. This
comparison can also help to determine if there are additional drainage issues within the watershed that are
affecting the basin, leading to excessive response. This can aid in the assessment of the need for water storage
projects on the land surface.
WATERSHED/LAKE ACREAGE RATIO Watershed: lake acreage ratio is a calculation that is; in general, basins with lower watershed: lake
acreage ratio displays low overall impacts due to flow from the surrounding watershed. However as
contributing watershed size increases, basins typically experiences greater influx of flow from upstream areas
following precipitation events, with greater possible impacts in terms of lake level fluctuations, shoreline
erosion, and increased nutrient loading. Therefore, a basin located in the headwaters of a watershed should
experience lower overall water fluctuations from a precipitation event that a basin with a larger contributing
watershed. However, watershed soil type, drainage pattern and form, and storage capacity also play a large
role in affecting incoming volume and water quality.
Eagle Lake has a total watershed size of 11,737 acres, and the basin itself totals 891 acres. Based on
these figures the ratio of watershed to lake acreage for Eagle Lake is 13.1:1. While this is not the lowest
watershed: lake ratio in the area, it is relatively low. In comparison, Foot Lake downstream of Eagle Lake has
a watershed/lake ratio of 39.3:1. Therefore, based on the watershed/lake ratio, Eagle Lake, a headwaters basin
should show fewer effects related to lake level fluctuations and water quality issues than downstream Foot
Lake.
SOIL TYPES The majority of the soils in the Eagle Lake watershed are classified as loamy. There are three soil
associations in the watershed: Wadenill-Sunburg-Delft, Guckeen-Marna, and Ves-Normania-Webster
(Kandiyohi County Water Plan 2003). According to the United States Department of Agricultural Soil Survey
for Kandiyohi County, Wadenill-Sunburg-Delft is a loam soil and found primarily in the northern portion of
Kandiyohi County. This soil type is located in western portion and northern corner of the Eagle Lake
watershed. The Guckeen-Marna is a loam and clay loam soil and found primarily in the central portion of
Kandiyohi County, This soil type is located in the east central part of the Eagle Lake watershed.
The Ves-Normania-Webster soils are classified as a loam and silt loam soil and found primarily in the eastern
half of Kandiyohi County. This soil type is located in the southeast corner of the Eagle Lake watershed. All
three soils types have a common landform setting of moraines and till plains with an infiltration range of good
to poor. The soils in the Eagle Lake watershed are both wind blown and water erosive soils. The Guckeen-
Marna soils are more prone to water erosion then the Wadenill-Sunburg-Delft and Ves Normania-Webster,
which are more likely to be wind eroded. Most of the soils in the Hawk Creek Watershed portion of
Kandiyohi County are both wind and water eroded soils. (Kandiyohi County Water Plan, 2003).
AQUIFERS AND WATERCOURSES Aquifers
Aquifers are defined as water-bearing porous soil or rock strata that yield significant amounts of
water to wells. An aquifer must have the following two properties: 1. the aquifer formation must be porous,
such as sand and gravel or cracks and fractures in more solid rock, and 2. water must be able to flow through
and out of the formation in quantities large enough to be significant.
There are two principal aquifers around Eagle Lake: outwash and bedrock. Outwash aquifers are
composed of sand and gravel deposits. These aquifers have well depths ranging from 30-500 feet deep, with

12
yields ranging from 25-500 gallons per minute. The water is generally of good quality, but can have high
concentrations of iron and manganese in areas. Nitrate contamination along with concentrations of sulfate and
chloride can be present in some areas. In the Eagle Lake watershed, the majority of the outwash aquifers are
located on the western portion.
The majority of Kandiyohi County is described as being made up of bedrocks aquifers. There are two
types in Kandiyohi County: Cretaceous aquifers and Precambrian igneous and metamorphic aquifers.
Cretaceous aquifers are made up of sandstone and shale. The water associated with these aquifers is confined
and generally hard. Large sulfate, chloride and dissolved solids concentrations exist in many areas.
Precambrian igneous and metamorphic aquifers are not typically aquifers, except in faults and fractures. These
aquifers can yield water from interflow sediments and from joints and fractures in basalt. The depth to
bedrock in Kandiyohi County is at least 200 feet; as a result, bedrock wells must be at least 200 feet deep.
According to the Minnesota Geological Survey’s (MGS) well records for Kandiyohi County, Cretaceous
aquifers typically have well depths between 200 to 450, with yields of 10 to 250 gallons per minute.
Most of the aquifers around Eagle Lake are bedrock aquifers especially the eastern portion of the watershed.
(Kandiyohi County Water Plan 2003).
Groundwater Recharge
Most of Kandiyohi County is considered a recharge area. This is where surficial sands and gravel
deposits receive and hold relatively large amounts of precipitation, slowly releasing it throughout the year into
streams and other water features. Till deposits receive the same amount of precipitation, but have a lower
recharge rate because their higher clay content makes them less permeable to infiltration. In areas of till
deposits, most of the precipitation runs off overland into streams and lakes. Shallow groundwater in surficial
aquifers flows toward and discharges into streams and rivers. Regionally, groundwater flow is usually parallel
to the flow direction of major rivers. Watersheds and groundwater movement are interrelated in flow
direction. In the Hawk Creek Watershed; which is in the southwestern portion of Kandiyohi County,
groundwater generally flows southwestward in movement. Cretaceous sandstone aquifers are present over
most of this area, but yields in many places are minimal. Aquifers are generally less than ten feet thick.
(Kandiyohi County Water Plan, 2003).
A hydrologic budget was prepared for Eagle Lake by the USGS in 1980. Ground water inflow to the
lake was estimated to account for 22% of all water entering the lake. Additional inputs were surface water at
45% and precipitation at 33%. Primary areas of ground water recharge/inflow occur through sand and gravel
layers located at the north end of the lake (Wright. 1995).
Watercourses
Watercourses within the Eagle Lake watershed include streams, lakes, wetlands, drainage ditches and
tile lines. The Hawk Creek watershed has extensive drainage ditch systems equaling 232.5 miles, with most
drainage ditches and tile lines in the southern portion of Kandiyohi County. Fine textured soils, with low to
moderate infiltration rates, are found throughout the area, making drainage critical to agricultural production.
(Kandiyohi County Water Plan, 2003). Eagle Lake watershed has a very small ditch located in the
northeastern portion of the watershed, but the majority of the watershed is streams, wetlands and lakes.
PUBLIC ACCESS There is one public access on Eagle Lake. A concrete public access is located on the southeast shore
off Kandiyohi County Road 9. This public access is owned and maintained by the MN DNR. No other public
accesses are on the lake.
FISHERIES MANAGEMENT
According to the MNDNR in 1968; Eagle Lake is managed as a centrarchid-walleye lake. It is a
typical bass-panfish-walleye lake which has large expanses of open wind-swept water, weedy bays and
shorelines well suited to nest-spawning bass, sunfish, and crappies. Centrarchid-Walleye lakes are usually
medium to large sized, consisting of many ecologically different bays or sections, some being natural walleye
habitat, others more suitable to pan fish species.

13
This type of management is designed to furnish a walleye fishery of moderate size, without displacing
largemouth or smallmouth bass or pan fish populations. (Kandiyohi County Water Plan, 2003). Bass-panfish-
walleye lakes are typically hard (high in carbonates) fertile waters and are especially common in the north-
central and west-central parts of the state (MPCA LAP, 1994).
Past Management
The MNDNR, Division of Fish and Wildlife records indicate that lake surveys were done in 1941 and
1954. Eagle Lake was resurveyed in 1970, 1978, 1988, 1990, 1992, 1994, 1995, and in 2009. A creel survey
occurred in 1982-1983, and a population assessment in 1983. Natural reproduction checks occurred in 1952,
1959, 1976, 1977, 1980, and 1986. Eagle Lake has always been managed as a centrarchid-walleye lake.
Present Management
Current fish management activities on Eagle Lake include monitoring the fish population on a periodic
basis, protecting aquatic vegetation through the permit process, participating in local watershed initiatives, and
stocking various fish species as warranted. The Eagle Lake fishery will be surveyed in the 2014 summer for
all fish species. Eagle Lake is managed primarily for walleye, northern pike, black crappie, and bluegill.
Past Historical Fishery Surveys
Net Type
1954
Number
per set
1970
Number
per set
1978
Number
per set
1983
Number
per set
1988
Number
per set
1990
Number
per set
1992
Number
per set
1995
Number
per set
2009
Number
per Set
Regional
Average
Northern Pike
Gill
Trap
3.30
0.10
5.80
0.27
2.33
0.10
1.83
0.30
0.30
0.10
2.33
--
0.38
0.08
2.80
0.30
1.25
0.09
2.80-9.00
NA
Walleye
Gill
Trap
14.70
--
9.00
0.27
11.50
0.20
7.50
1.00
16.50
1.70
10.83
0.50
4.00
0.83
25.50
0.80
15.50
1.27
3.30-8.80
0.20-0.80
Largemouth Bass
Gill
Trap
0.20
--
0.40
0.27
--
1.40
--
0.50
--
0.30
--
1.00
--
0.08
--
--
--
0.09 --
Rock Bass
Gill
Trap
5.40
3.80
1.40
0.18
--
--
--
--
--
--
--
--
--
--
--
--
--
-- --
Yellow Perch
Gill
Trap
152.40
15.90
49.40
3.45
152.17
15.70
20.66
2.20
12.20
1.10
60.67
6.00
52.00
4.50
37.20
12.80
22.50
1.00
7.00-46.30
0.60-3.50
Black Crappie
Gill
Trap
0.20
0.30
3.20
0.36
1.33
0.50
2.16
1.90
--
0.10
--
0.60
--
-- trace
0.25
0.36 0.40-2.30
Hybrid Sunfish Trap -- 0.64 5.10 0.80 -- -- 10.08 -- 2.82 --
Green Sunfish Trap -- 0.36 0.10 -- -- -- 1.00 -- 1.18 --
Bluegill
Gill
Trap
--
--
5.40
13.00
--
116.70
2.30
94.60
0.50
19.90
0.33
76.70
--
34.58
0.20
0.60
0.25
5.91
NA
4.40-49.00
Pumpkinseed
Gill
Trap
--
0.20
0.80
7.06
--
7.20
0.17
15.10
--
3.20
0.33
13.00
--
0.25
--
--
--
0.36 --
Black Bullhead
Gill
Trap
0.40
0.50
3.40
0.36
1.17
0.40
19.33
24.60
17.70
0.10
11.00
10.30
--
4.25
0.20
0.40
0.25
0.82
0.60-6.80
0.30-2.60
Yellow Bullhead
Gill
Trap
0.60
0.90
10.40
0.18
20.50
14.20
2.00
4.90
--
1.20
--
1.40
--
0.33
--
--
0.75
2.91 --
Freshwater Drum
Gill
Trap
--
--
--
--
--
--
--
--
--
--
3.83
0.10
2.13
0.25
24.20
0.20
2.75
0.18 0.30-2.40
Bigmouth Buffalo
Gill
Trap
0.08
--
--
--
--
--
--
--
--
--
--
--
--
2.50
2.20
0.20 0.18
0.10-0.10
0.10-0.80
White Sucker
Gill
Trap
4.90
--
2.80
2.08
1.33
--
5.50
0.10
10.00
0.60
3.83
0.50
2.63
0.25
1.30
0.20 2.50
0.90-4.00
0.20-1.10
Carp
Gill
Trap
--
2.00
--
0.09
--
0.50
--
0.20
1.30
0.70
1.17
0.10
0.13
1.00
1.50
2.00 0.36
0.20-1.00
0.20-1.00 Normal Ranges represent typical catches for lakes with similar physical and chemical characteristics.
Figure 4. Figure 4 shows the gill and trap net surveys from 1954 to 2009 on Eagle Lake. The dashed lines mean that no
fish were caught using that equipment. Looks like in the 1950s and early 1970’s rock bass were found in the lake, while
the common carp was not providently found during those years.
Synopsis of 2009 MN DNR Fisheries Survey
A resurvey of Eagle Lake was conducted in July of 2009. Water levels were low during the summer,
but normal by the fall of 2009. Emergent vegetation (cattails) was sparse in Eagle Lake during 2009.
Submergent vegetation densities within the lake were moderate with clasping-leaf pondweed, muskgrass,
water moss, sago pondweed, coontail and filamentous algae present in 2009. Submergent vegetation densities
were the highest along the extended shallow shelves of the near shore areas. Shoal water substrates were
mostly sand, gravel, rubble, and silt in the 2009 transects. Water clarity (secchi = 6.5 feet) and nutrient levels
(total phosphorus = 0.042 ppm) were moderate in 2009. Dissolved oxygen levels were below 3.0 ppm at 21

14
feet and deeper during mid July of 2009. Intense algae blooms can occur in Eagle during the late summer
months, but these were minimal during the unseasonably cool 2009 summer.
Black crappie, Northern pike, Bluegill and Black bullhead numbers were low compared to similar
lakes and historical catches. Yellow perch numbers were low compared to historical catches but moderate
when compared to similar lakes. Walleye numbers were abundant and Freshwater Drum numbers were
moderate to similar lakes and historical catches.
The 2009 Black crappie average size was moderate to large; young of the year “YOY” crappie
numbers were low. Northern pike average size was moderate, the 2004-2005 year classes each comprised
33% of the 2009 catch on Eagle Lake. Yellow perch average size was moderate; the 2006 year class
comprised 67% of the 2009 catch. YOY perch numbers were abundant in the shoreline seine hauls. The 2009
walleye average size was moderate but smaller then historical average. The walleye population in Eagle Lake
is due primarily to stocking, but limited walleye natural reproduction has been documented by past surveys.
The 2007 walleye year class (natural reproduction) comprised 30% of the walleye catch in the 2009 re-survey.
The 2008 walleye year class (fingerling stocked year) comprised 28% of the walleye catch in the 2009 re-
survey. Eagle Lake was recently stocked with walleye in 2002, 2004, 2006 and 2008. The 2009 bluegill
average size was moderate and greater than the historical average. The 2007 year class comprised 52% of the
2009 bluegill re-survey catch. YOY bluegill numbers were low in the 2009 shoreline seine hauls. The 2009
average size of black bullhead and freshwater drum were large. (MN DNR Fisheries, 2009). To see the
full report for 2009 visit: http://www.dnr.state.mn.us/lakefind/showreport.html?downum=34017100
Year Sp ec ie s S ize N um ber Pound s
2 01 0 W al l e y e f in g e r l in gs 1 7 ,5 6 2 1,1 04 .0 0
2 00 8 W a ll ey e* f in g e r l in gs 4 6 ,6 1 0 1,0 98 .0 0
2 00 6 W al l e y e a du lt s 2 1 26 .0 0
W al l e y e f in g e r l in gs 2 7 ,1 5 9 1,0 64 .0 0
W al l e y e ye a rl in g s 4 2 .0 0
2 00 4
N o rt he r n
P i ke a du lt s 27 4 2 7 4. 0 0
W al l e y e ye a rl in g s 1, 19 4 1 9 9. 0 0
W al l e y e f in g e r l in gs 1 7 ,3 6 9 5 9 8. 6 0
W al l e y e a du lt s 37 9 3 1 1. 0 0
2 00 2
B la c k
C r a p p ie a du lt s 50 0 2 5 0. 0 0
W al l e y e ye a rl in g s 2 6 ,6 3 1 1,0 32 .0 0
W al l e y e a du lt s 1, 56 2 1 4 2. 0 0
2 00 1
B la c k
C r a p p ie a du lt s 9 6 24 .0 0
N o rt he r n
P i ke a du lt s 5 7 63 .2 0 Figure 5. Fish Stocking Activity on Eagle Lake; walleye stockings (primarily fingerlings) are scheduled for every other
year in Eagle Lake.

15
AQUATIC INVASIVE SPECIES Aquatic Invasive Species
Aquatic Invasive Species are species that have been introduced or moved, by human activities to a
location where they do not naturally occur are termed exotic or non-native. When a non-native species invades
lands or waters, they causing ecological or economic problems, it is termed invasive. A number of invasive
plants and animal species have been agents of habitat alteration and degradation, and competition for native
species. Invasive species are the major cause of biological diversity loss, they often rapidly increase allowing
them to disrupt native plant communities and crowd out native species. Exotic species can cause problems for
those who use natural resources for recreational use of land and water, and industrial use of public waters.
Once established, invasive species rarely can be eliminated.
Many invasive species introductions are unintentional. Species are carried on barges, boats and trailers,
animals, vehicles, commercial goods, packing materials, produce, footwear or clothing, and in ballast water of
ships. Ships take on ballast water in other countries for stability during the ocean crossing. This water is
pumped out when the ships pick up their loads in Great Lakes ports. Many of the species, such as zebra
mussel, ruffe, and spiny water flea arrived in the Great Lakes this way. But they are now being spread
throughout the continent's interior in and on boats and through other recreational activities.
Invasive species costs landowners, resource management agencies, and others millions of dollars each
year. Herbicides, labor, and research top the bill in fighting against plants which threaten to clog waterways,
ruin fisheries, turn pasture to wasteland, compete with agricultural crops, shade out forest regeneration, and
overrun natural areas. For many aquatic invasive species there is no known selective control, so the problems
they cause continue indefinitely.
Non-Native Aquatic Species
Invasive aquatic species can dramatically change the ecology of a lake and here is a list of species that are
of concern to the State of Minnesota and Kandiyohi County.
1. *Bighead and silver carp Hypophthalmichthys nobilis & H. molitrix
2. *Round goby Neogobius melanostomus
3. *Ruffe Gymnocephalus cernuus
4. *Zebra mussel Dreissena polymorpha
5. *Spiny water flea Bythotrephes longimanus
6. *Rusty crayfish Orconectes rusticus
7. *Faucet Snail Bithynia tentaculata
* Have not been reported in Kandiyohi County but have been located in other parts of the state.
Additional information on these invasive aquatic plants can be found on the link below.
http://www.dnr.state.mn.us/invasives/aquaticanimals/index.html (Eisterhold, 2011). Currently, no aquatic
invasive species have been found in Eagle Lake through the MN DNR surveys but since invasive species have
been found in surrounding counties, it will be only a matter of time before the spread of these species could
impact Eagle Lake and its watershed.
An Aquatic Invasive Species Action Plan could look like this:
Zebra Mussel Prevention
1. Educate property owners on the risk of spreading zebra mussels through docks, boat lifts, anchors,
water trampolines, and other water-related equipment. In addition, property owners should provide this
information to their guests that stay on the lake.
2. Take advantage of the watercraft inspection program and apply for DNR grants. Currently, the DNR
does put preference on lakes that are infested with zebra mussels.
3. Educate the public on the pull your drain plug law on the lake and within Kandiyohi County.
4. Produce material that can be used to get the word out to “Stop Aquatic Hitchhikers.”

16
5. Apply for a DNR Public Awareness Grant to produce additional materials to educate the public to slow
the spread of invasive species.
Actions to Monitor for Zebra Mussels
1. In the fall of the year, all property owners should look very closely to their docks, boats lifts, pontoons,
boats, and all water-related equipment that has been sitting in the lake for an extended period of time.
2. Zebra mussel identification training.
3. Report suspicious water-related equipment to Regional Invasive Species Specialist at 507-359-6079. If
possible take some photos of the water-related equipment in question.
4. Inspect channel markers, buoys, and etc. that have been in the water all summer long for evidence of
zebra mussels.
5. If someone steps on something sharp and cuts themselves be sure to identify what actually did the cut.
AQUATIC VEGETATION Aquatic Vegetation in Eagle Lake
Vegetation surveys were completed in 1954, 1970, 1978, 1988, 1990, 2000, and 2009. According to
the MNDNR Vegetation Surveys from 2000 and 2009 a total of 18 species was described in Eagle Lake.
Reed Canary Grass Phalaris arundinacea was the only non-native plant recorded in Eagle Lake.
The typical survey work was completed in mid to late summer which is typically July and August. Common Name Scientific Name Type Abundance Rating
Bushy pondweed Najas flexilis Submergent Rare
Cattail spp. Typha spp. Emergent Rare
Clasping-leaf pondweed Potamogeton perfoliatus Submergent Common
Coontail Ceratophyllum demersum Submergent Rare
Filamentous algae Submergent Rare
Flat-stem pondweed Potamogeton zosteriformis Submergent Rare
Muskgrass Chara spp. Submergent Common
Northern water milfoil Myriophyllum sibirica Submergent Rare
Sago pondweed Stuckenia pectinata Submergent Rare
Water Moss Group Submergent Common
Three-way sedge Dulichium arundinaceum Emergent Rare
Blue-green algae Submergent Rare
Leafy pondweed Potamogeton foliosus Submergent Rare
Spiny Naiad Najas marina Submergent Rare
Hardstem bulrush Schoenoplectus acutus Emergent Rare
Reed canary grass Phalaris arundinacea Emergent Rare
Water smartweed Polyganum amphibium Emergent Rare
Straight-leaf pondweed Potamogeton strictifolius Submergent Rare
Figure 6. Complete plant list of aquatic vegetation from the 2000 and 2009 transect surveys completed by the MNDNR.
Non-Native Aquatic Plants
Invasive aquatic plants can dramatically change the ecology of a lake and here is a list of additional
species that are of concern to the State of Minnesota and may have populations within Kandiyohi County.
1. Flowering rush Butomus umbellatus
2. Curly-leaf pondweed Potamogeton crispus
3. Eurasian watermilfoil Myriophyllum spicatum
4. Purple loosestrife Lythrum salicaria
5. Yellow iris Iris pseudacorus
6. *Non-native waterlilies Nymphaea spp.
7. *Brazilian elodea Egeria densa
8. *Brittle naiad Najas minor
* Have not been reported in Kandiyohi County but have been located in other parts of the state.

17
Additional information on these invasive aquatic plants can be found on the link below.
http://www.dnr.state.mn.us/invasives/aquaticplants/index.html (Eisterhold, 2011). Currently, no invasive
species have been found in Eagle Lake through the MN DNR aquatic vegetation surveys but since invasive
species have been found in surrounding lakes, it will be only a matter of time before the spread of these
species could impact Eagle Lake and its watershed.
Pre-treatment and Post-treatment surveys and monitoring of aquatic invasive vegetation
If an invasive aquatic species is found in the lake, it will be important to collect pre-treatment data
prior to any treatment of any invasive species. This may delay treatment a year but will give base data and
with adequate mapping provide all areas that may need to be treated the following open water season.
The surveys prior to treatment can be delineations of the invasive plant or using the point-intercept
method. Delineation is mapping only the invasive plant present prior to treatment. The point-intercept method
is more intricate because it provides a data set on all vegetation in a lake. The point-intercept method will not
provide up to date data of the entire area the invasive species takes up. This method will however, provide
data on native plant species and is a very valuable survey for post-treatment of an invasive species. In some
cases, it is wise to collect both delineation data and point-intercept data. It is important to maintain, plant,
restore native vegetation to Eagle Lake in the unfortunate case where an invasive species has been recorded
and treatment has taken place. Monitoring for other invasive aquatic plants and other species is important so
that an early detection and response plan can be implemented soon after detection. Post-treatments monitoring
should be carried out for a few years after the treatment is complete to insure that the invasive species has
been removed.
A treatment plan for aquatic invasive vegetation could look like this:
Alternatives for Treatment of Curly-Leaf Pondweed and Eurasian Water milfoil*
Alternative 1: Early detection and response to a new infestation by spot spraying with herbicide or hand
removal of the invasive plant.
Alternative 2: Mechanical removal of curly-leaf pondweed by cutting and removal prior to turion production.
Mechanical removal of Eurasian water milfoil once plant surfaces by cutting and removal of plant parts in the
lake.
Alternative 3: Chemical treatment of infested area with MNDNR approved herbicide treatment for curly-leaf
pondweed prior to turion production. Chemical treatment of infested area with a MNDNR approved herbicide
to treat Eurasian water milfoil.
Alternative 4: Chemical treatment on a whole-lake basis. If invasive plants get to extremely high densities a
whole-lake treatment may be considered. Whole-lake chemical treatments would be considered on a year by
year case based on spring/summer delineation of either curly-leaf pondweed or Eurasian water milfoil.
Alternative 5: No treatment
* Curly-leaf pondweed and Eurasian water milfoil have different timing and herbicide regimes but the concept
for treatment are similar. (Eisterhold, 2011).
HISTORICAL AND PRESENT DAY MONITORING DATA The United State Environmental Protection Agency (EPA) has distinguished the major ecoregions of
the United States based on soils, landform, potential natural vegetations, and land use (EPA, 2008).
The entire watershed of Eagle Lakes falls within the North Central Hardwood Forests ecoregion.
Water quality standards have been established for lakes and rivers within each ecoregion.
The Eagle Lake watershed has a significant impact on the lake itself. The Eagle Lake Improvement
Association established a plan to sample watershed streams at a number of locations along with in-lake
samples. By sampling the water entering and leaving a subwatershed, the association can gain insight to
determine if subwatershed is adding excessive nutrients into the lake. Eagle Lake has been collecting and
recording monitoring data since in 1998, and will continue to monitoring lakes and streams within the

18
watershed to date. All data collected in entered into the MPCA EQuIS/STORET database housed with the
MPCA. In-lake samples of secchi disk transparency, chlorophyll-a, total phosphorus, lake recreational
suitability and lake physical condition are taking monthly from ice out to late fall, stream samples are also
taken monthly for transparency, total phosphorus, ortho phosphorus, stream physical condition and stream
recreational suitability.
Before 1998, limited data was reported to the MPCAs EQuIS/STORET database. A Lake Assessment
Program (LAP) was completed by the MPCA, Kandiyohi Soil and Water Conservation District and citizens
from the Eagle Lake Association in 1994. Water quality data was collected during the summer months along
with background information on landuse, vegetation, fisheries, aquatic vegetation and lake level information.
Total phosphorus, chlorophyll-a, and secchi disk transparency readings were used to characterized the trophic
status of the lake. The term “trophic status” refers to the level of productivity in a lake.
Carlson’s Trophic State Index (TSI) is a common way to characterize a lake’s trophic status (overall
health or productivity). Comparing phosphorus, chlorophyll-a and secchi transparency on Carlson’s Trophic
State Index scale can establish current trophic status and establish interrelationships between these three
variables. It is assumed that secchi is a good estimator of trophic status for a lake and comparing these
variables on the scale will help to confirm this assumption.
Individual TSI values can be calculated from the following equations:
Total phosphorus TSI (TSIP) = 14.42*[ln(TP average)] + 4.15
Chlorophyll-a TSI (TSIC) = 9.81*[ln(Chlorophyll-a average)] + 30.6
Secchi disk TSI (TSIS) = 60 - (14.41*[ln(Secchi average)])
Total phosphorus and chlorophyll-a are measured in micrograms per liter (µg/L) and Secchi disk
transparency is measured in meters (3.281 feet per meter). The ln function in these equations is the “natural
log.” (The ln key is found next to the log key on most calculators.) The TSI scale ranges from 0 (“ultra-
oligotrophic” or nutrient poor) to 100 (“hypereutrophic” or nutrient rich). Low trophic values (oligotrophic)
are often associated with very clean and clear lakes such as those found in the Boundary Waters Canoe Area.
High and/or increasing trophic status values indicate more eutrophic (greener, less healthy) conditions.
(MPCA CLMP Handbook, 2008).
TSI (Carlson
1977) CARLSON’S TROPHIC STATUS INDEX & WATER QUALITY
< 30 Oligotrophic; clear water, high DO throughout the year in the entire hypolimnion
30-40 Oligotrophic; clear water, possible periods of limited hypolimnetic anoxia (DO = 0)
40-50 Moderately clear water; increasing chance of hypolimnetic anoxia in summer,
fully supportive of all swimmable/aesthetic uses
50-60 Mildly eutrophic; decreased transparency; anoxic hypolimnion; macrophyte problems; warm-water fisheries only; supportive of all swimmable/aesthetic uses but "threatened"
60-70 Blue-green algae dominance; scums possible; extensive macrophyte problems
70-80 Heavy algal blooms possible throughout summer; dense macrophyte beds; hypereutrophic
> 80 Algal scums; summer fish kills; few macrophytes due to algal shading; rough fish
dominance Figure 7. Figure 7 is Carlson’s TSI characteristics and scores.

19
Standard
Criteria**
NLF
NCHF
WCP
NGP
** The standard criteria represent median values calculated from six review papers
*** from Carlson, R. E. 1977. A trophic state index for lakes. Limnol. Oceanogr. 22:361-269.
0.3-1.0 67-73
O = Oligotrophic M = Mesotrophic E = Eutrophic
1.5-3.2 49-66
67-770.5-1.0
23-50
65-150
130-250 30-55
30-80
5-22
< 35 40-50 > 55
14-27 < 10 2.4-4.6 41-52
TROPHIC
STATUS
< 11 11-24 >24 < 3.0 3.0-7.0 > 7.0 > 4.0 2.2-4.0 < 2.2
O M E O M E O M E O M E
TP (ug/L) Chl-a (ug/L) Secchi (meters) Carlson TSI***
Comparison of trophic state indices and values from the various ecoregions of Minnesota
NLF= Northern Lakes and Forests
NCHF = North Central Hardwood Forest
WCBP = Western Corn Belt Plains
NGP = Northern Glaciated Plains
Figure 8. Comparison of ecoregions in Minnesota, Eagle Lake is in the North Central Hardwood Forest
ecoregion and scores on the TSI should be within the NCHF ranges for total phosphorus, secchi disk transparency
and chlorophyll-a.
Lake Name TP (ppb) Carlson TP Chla (ppb) Carlson Chla SD (m) Carlson SD
Elkhorn 13 42 3 4 3.9 40George 14 42 4 45 3.7 41
Henderson 14 42 4 43 3.7 41
Green 16 44 5 46 3.7 41
Long (North) 19 47 5 47 4.1 40
Carrie 20 48 6 49 1.2 57Florida 20 47 6 48 2.7 46
Andrew 21 48 6 48 2.7 46
Games 27 52 9 52 2.5 47
Point 27 52 6 48 3.1 44
Calhoun 32 54 11 54 1.3 56Camp 35 56 18 59 1.7 52.1
Eagle 38 57 12 55 2.2 49
Koronis 41 58 17 58 2.3 48
Nest 44 59 20 60 1.8 52
Mud 52 61 8 51 0.6 67Rice 61 63 29 64 1.6 53
Foot 65 64 15 57 0.8 64
Middle 65 64 38 66 0.5 70
Norway 67 65 26 63 1 59Diamond 72 66 34 65 1.7 53
Monson 84 68 40 67 1.3 57
East Solomon 85 68 26 62 0.6 67
Elizabeth 89 69 23 61 0.6 67
Willmar 97 70 27 63 0.7 66Lillian 101 71 54 70 1.3 57
Schoolgrove 105 71 43 68 0.5 70
Swenson 108 72 76 73 0.5 70
Ringo 114 73 48 69 0.4 75
Long (South) 127 74 13 56 1.9 51Wood 132 75 50 69 0.4 73
Cottonwood 165 78 136 79 0.6 69
Big Kandiyohi 168 78 20 60 1.2 58
Wakanda 176 79 153 80 0.3 76Lady Slipper 206 81 70 72 0.4 72
Minnetaga 270 85 38 66 0.3 76 Figure 9. Chart of total phosphorus, secchi readings and chlorophyll-a averages and Carlson scores for all lakes in
Kandiyohi County
Five in-lake samples were collected at each site in the summer months on Eagle Lake in 1994 to get an
idea of the TSI. Two sites were used primarily on Eagle Lake (site 101 near point of maximum depth, and site
102 in the southern portion of the lake). Lake surface samples were taken with an integrated sampler (PVC
pipe that is 6.6 feet in length or 2 meters), and near bottom samples were collected at site 101 with a two-liter

20
PVC Kemmerer. Map 9 and 10 in the appendix show the 1994 sampling sites on Eagle Lake and the current
monitoring locations for the Eagle Lake Association.
Figure 10. Eagle Lake TSI in 1994. Based on the 1994 LAP study, Eagle Lake’s in-lake water quality indicated that the
lake was eutrophic
Based on the consecutive water quality data from 2000 to 2011 on Eagle Lake, the trophic status is
slightly eutrophic, but more within the range that the 1998 management plan would have liked to see the lake.
The TSI score below is based on 10 years of data versus only one year of data during the LAP study in 1994.
Based on the chart below the total TSI score has improved slightly in the past 16 years, the transparency has
increased slightly in the lake along with a decrease in the level of chlorophyll-a, but the total phosphorus has
increased slightly since 1994.
Figure 11. 2000-2011 TSI combination score for Eagle Lake
An eutrophic body of water, commonly a lake or pond, has high primary productivity due to excessive
nutrients and is subject to algal blooms resulting in poor water quality. The bottom waters of such bodies are
commonly deficient in oxygen, ranging from hypoxic to anoxic. Eutrophic waters commonly lack fish species
like trout, which require cold, well-oxygenated water. This oxygen deficiency is most apparent in shallow
lakes, owing to the smaller hypolimnetic volume. The process of eutrophication may occur naturally or be the
result of anthropogenic influences.

21
Parameters that Eagle Lake Improvement Association has been consecutively monitoring since 1998
include secchi disk, chlorophyll and total phosphorus. The following three graphs illustrate the trends in Eagle
Lake from 1998 through 2010.
Figure 12. Figure 12 shows the average annual chlorophyll level in Eagle Lake for consecutive years
beginning in 2000 and ending in 2011. Chlorophyll is measured in micrograms of chlorophyll per liter of
water. The n values, or the number of chlorophyll readings per year, are also indicated in Figure 8.
The ecoregion average for the North Central Hardwood Forests for chlorophyll is 5-22 micrograms per liter.
All of the averages in Figure12 are within the ecoregion average.
Figure 13. Figure 13 shows the annual average secchi disk readings for Eagle Lake for consecutive years
beginning in 2000 and ending in 2011. Secchi disk readings are measured in feet. The n values, the
number of secchi disk readings per year, are also indicated in Figure 10. The ecoregion average for secchi
disk is 4.9-10.5 feet. Only 2 out of the 10 years have secchi disk readings below the 4.9 feet.
Average Annual Chlorophyll-a in Eagle Lake
0
5
10
15
20
25
2000 2001 2002 2003 2004 2005 2006 2007 2008 2009 2010 2011
Year
Avera
ge C
hlo
rophyll-a
(ug/l)
Chlorophyll-a
Year-n value:
2000= 4
2001= 4
2002= 4
2003= 4
2004= 5
2005= 4
2006= 5
2007= 6
2008= 4
2009= 9
2010= 10
2011= 5
Ecoregion
average is
5-22 ug/l
Average Annual Secchi Disk Readings for Eagle Lake
0.00
2.00
4.00
6.00
8.00
10.00
12.00
1998 1999 2000 2001 2002 2003 2004 2005 2006 2007 2008 2009 2010
Year
Avera
ge s
ecchi dis
k r
eadin
gs (ft)
Secchi Disk Readings
Year-n value
1998-6
1999-14
2000-18
2001-13
2002-18
2003-20
2004-24
2005-20
2006-22
2007-19
2008-14
2009-18
2010-17
Eco region
average is
4.9-10.5 ft

22
Figure 14. Figure 14 shows the average annual total phosphorus level in Eagle Lake for consecutive years
beginning in 2000 and ending in 2011. Total phosphorus is measured in micrograms of total phosphorus
per liter of water. The n values, or the number of total phosphorus readings per year, are also indicated in
Figure 14. The ecoregion average of the North Central Hardwood Forest for total phosphorus is 23-50
micrograms per liter. Only 2 out of the last 11 years have the total phosphorus averages exceeded the
50 ug/L, yet Eagle Lakes total phosphorus averages are on the higher end of the ecoregion.
User Preception vs. Secchi readings (monthly)
-10
-8
-6
-4
-2
0
2
April May June July August September October
Year
User
Perc
eption/S
ecchi re
adin
gs
Secchi Disk Readings
Avg. Phys
Avg. Rec. Figure 15. Figure15 shows the user perception of the lake and recreational suitability versus the secchi disk
readings. As the secchi readings increase the user perception of the lake and recreational suitability usually
increase. In this case user perception and recreation suitability is consistent for each month.
Average Annual Total Phosphorus in Eagle Lake
0.00
10.00
20.00
30.00
40.00
50.00
60.00
70.00
2000 2001 2002 2003 2004 2005 2006 2007 2008 2009 2010 2011
Year
Avera
ge tota
l phosphoru
s (ug/l)
Total Phosphorus
Year-n value
2000-5
2001-4
2002-4
2003-4
2004-5
2005-5
2006-4
2007-5
2008-5
2009-9
2010-10
2011-5
Eco region
average is
23-50 ug/l

23
Total Phosphorus comparisons by site
0
0.2
0.4
0.6
0.8
1
1.2
1.4
1.6
1.8
2
2.2
2.4
2.6
2.8
3
5/10
/00
7/12
/00
5/31
/01
4/17
/02
6/3/
02
6/21
/02
7/24
/02
9/8/
02
5/15
/03
7/9/
03
5/25
/04
9/9/
04
6/7/
05
5/12
/06
4/23
/07
5/29
/07
4/29
/08
4/5/
09
5/11
/09
4/18
/10
6/15
/10
4/17
/11
7/24
/11
Date
Phosphoru
s (to
tal) m
g/L
Lawler siteSE Slough on 47th Ave.SE Slough
Figure 16. Figure 16 shows the total phosphorus concentrations at each of the monitoring sites that enter
Eagle Lake on the southeast portion of the lake, all sites enter into Lawler wetland before entering the
lake. Based on the monitoring data that has been collected since 2000, Lawler wetland removes
phosphorus before the water enters the lake. Wetlands are a good way to reduce the amount of nutrients
coming off a landscape before entering a water body.
Total Phosphorus comparisons by site
0
0.1
0.2
0.3
0.4
0.5
0.6
0.7
0.8
0.9
1
1.1
1.2
5/10
/00
7/12
/00
5/31
/01
7/25
/01
5/23
/02
6/11
/02
7/9/
02
8/21
/02
4/22
/03
6/17
/03
8/11
/03
5/17
/04
8/23
/04
5/10
/05
6/7/
05
8/28
/05
5/13
/06
4/23
/07
5/29
/07
9/23
/07
6/11
/08
5/6/
09
4/5/
10
5/16
/10
7/21
/10
4/17
/11
7/11
/11
Date
Phosphoru
s (to
tal) m
g/L
Halverson SloughInlet (south) HalversonInlet (north) HalversonSwanson WPA
Figure 17. Figure 17 shows the total phosphorus at each monitoring site that enter into the northeastern portion
of Eagle Lake through Halverson Slough. Based on the data that has been collected since 2000,
Halverson Slough removes phosphorus before the water reaches Eagle Lake. The inlets to Halverson slough
have the highest concentrations of phosphorus along with Swenson WPA. More data on this inlet to Eagle Lake
might help pinpoint a “hot spot” and where Best Management Practices could be used.

24
EAGLE LAKE IMPROVEMENT ASSOCIATION MANAGEMENT GOALS In the 1994 LAP study recommendations were made to the Eagle Lake Association. The
recommendations were as follows: 1. Continue to participate in the Citizen Lake Monitoring Program
(CLMP), 2. Continue to provide educational materials to homeowners and businesses with respect to lawn
maintenance and shoreline protection, 3. Further development in the lake’s watershed should occur in a
manner that minimized water quality impacts to the lake, 4. A more detailed examination of landuse practices
in the watershed and identification of the possible nutrient sources such as agricultural runoff, lawn fertilizer,
and the effects of ditching and draining of wetlands, etc., may aid the Association in determining areas where
best management practices may be needed..
In 1998, a Lake Management Plan was prepared for the Eagle Lake Improvement Association. The
management plan listed out nine “projects” that the Eagle Lake Improvement Association would be working
on, with a cost and priority associated with each goal and objective.
1998 Eagle Lake Management Plan
Projects Cost Priority
1. Watershed Projects
A. Set-up a watershed monitoring program to pinpoint excess nutrient hot spots. Then work with state and federal programs to make improvements. $ 1,000 High
B. If sloughs in the watershed are a source, alum application may be necessary. $ 30,000 Low
C. Homeowner projects: lakescaping and buffer strips for lake residences. $ 1,800 Low
2. Sanitary System Management
A. Review emergency Sanitary District operating procedures with the state. $ - High
3. Land Use and Zoning
A. Get a copy of the current shore land regulations and prepare an information brochure for distribution to lake residents. $ 800 Low 4. Wildlife and Waterfowl
A. Control cormorant activity by harassment rather than by removal. $ - Medium
5. Fish Management
A. Set-up the southeast slough as a northern pike spawning site. $ 600 Medium
B. Continue to maintain the carp trap. $ - High
6. Aquatic Plant Management
A. Discontinue copper sulfate treatment except for emergency nuisance conditions. $ - High
B. Filamentous algae control with modified nets. $ 600 High
C. Custom cuts for nuisance submerged plants. $ 600 High
D. 2-foot drawdown to enhance bulrush reestablishment. $ 800 Low
7. Exotic Species
A. Prepare a lake soil fertility map for Eagle Lake to gage potential nuisance milfoil distribution. $ 1,000 Medium
B. Set up an Eurasian water milfoil contingency plan; spot treat for pioneer infestations. $ 400 Medium
8. Surface Water Use and Public Access
A. Adopt existing rules and regulations $ - Medium
9. Lake Monitoring and Evaluation
A. Continue to monitor water chemistry of Eagle Lake and the aquatic plants and prepare status report. $ 1,200 High
COSTS FOR HIGH PRIORITY PROJECTS $ 5,200 High
COSTS FOR MEDIUM PRIORITY PROJECTS $ 2,000 Medium
COSTS FOR LOW PRIORITY PROJECTS $ 30,800 Low

25
The following 2012 Management Plan identifies the goals, objectives and initiatives that will guide the Eagle
Lake Improvement Association in water resource management.
Goals, Objectives and Initiatives Defined:
The management plan consists of goals, objectives and initiatives that were developed with the input
from the public, governmental units/agencies and the Eagle Lake Improvement Association. The
following provides a definition of each of these plan components:
Goal: A goal is an idealistic statement intended to be attained at some undetermined future date. Goals
are purposely general in nature.
Objective: An objective is an action-oriented statement that supports the completion of a goal. There
may be more then one objective per goal.
Initiative: An initiative is a specific action that will be taken in order to achieve a goal and objective.
Goal 1: Watershed Projects/Water Quality. Restore surface water quality using sound research and
monitoring, and Best Management Practices (BMPs). Eagle Lake should attempt to meet water quality goals
for secchi disk, chlorophyll-a, and total phosphorus for Northern Central Hardwood Forest ecoregion.
Objective A. Identify, prioritize, restore and protect, and enhance wetland areas that improve surface
water and promote ground water recharge.
Actions:
1. Identify and prioritize areas in the watershed where there are sites with the potential for improving
water quality and water storage.
2. Support efforts by property owners and the resources agencies to restore wetlands in high priority
areas.
3. Support efforts by the local government units to protect wetlands in the watershed.
Objective B. Promote and education lakeshore and landowners on the use of BMPs relating to surface
water for all land uses and activities in the watershed. Develop an educational program to inform
watershed residents on BMPs to improve water quality.
Actions:
1. Support efforts of HCWP, Kandiyohi SWCD, state and federal agencies and landowners to
implement BMPs on shoreland areas including lakes, rivers and stream through planning and
zoning permits and other government approvals.
2. Support efforts of HCWP, Kandiyohi SWCD, state and federal agencies and landowners to
implement BMPs on agricultural lands including conservation tillage, erosion control practices,
runoff management, buffers, waste management along with other practices.
3. Support efforts by Kandiyohi County as well as townships in the watershed to apply BMPs for
storm water management on road construction and land development projects.
4. Include at the annual meeting a water quality educational topic such as rain gardens, lawn care,
aquatic plant identification, etc. Invite guest speakers to present on current topics and information
that will benefit lakeshore and agricultural lands.
5. Periodically gather, organize and distribute literature on BMPs to property owners and other land
and water uses.

26
Objective C. Support and assist in the collection of water monitoring data in lake and streams entering
the lake.
Actions:
1. Continue to work with HCWP and the MPCA through the Citizen Stream Monitoring Program
(CSMP) and Citizen Lake Monitoring Program (CLMP) to monitor and document water quality
data for Eagle Lake and its tributaries.
2. Work with MN DNR Waters to monitor and record lake levels
3. Work with HCWP to monitor precipitation and the CSMP to monitor transparency of streams
entering and leaving the lake.
Objective D. Partner with local agencies, groups and property owners to identify pollution problems
and establish priority areas within the watershed.
Actions:
1. Partner to diagnose monitoring data generated by HCWP, MPCA, Eagle Lake Improvement
Association and other agencies to prioritize which drainage area in the watershed are contributing
the greatest amount of pollution to Eagle Lake.
2. Support the development of storm water management plans by Kandiyohi County officials.
Address snow removal and dumping and their impacts on water quality.
3. Support efforts to require storm water management plans for any new subdivisions in the
watershed so the post development runoff show not exceed predevelopment runoff conditions.
4. Support efforts to inventory all culverts in the watershed. Inventory the items such as culvert size,
elevations, flow direction, maximum capacity, flow conditions, etc.
5. Conduct an annual assessment/implementation meeting with agencies working in the Eagle Lake
watershed to develop a list of pollution areas and prioritize said areas and start to develop
implementation plans on how to address there areas.
6. Work with partners to develop corrective option to address the priority areas and solicit funding to
complete projects.
7. Work with HCWP to monitor water quality trends in relation to the project and programs
implemented through partnerships and assess the effectiveness of corrective actions taken.
Goal 2: Aquatic Vegetation. Restore desirable native aquatic vegetation in Eagle Lake. Prevent the spread
and presence of invasive aquatic vegetation species
Objective A. Develop monitoring strategies and prevention measures to prevent aquatic invasive
species from entering the lake
Actions:
1. Develop an education program for lake residents and lake users to address the benefits of native
vegetation and the importance of preventing invasive species from entering the lake.
2. Develop a detailed plan that outlines actions to help prevent the spread of invasive species and a
list of actions that should be taken if exotic species are found in the lake. Eagle Lake Improvement
Association and its partners should work together with the MN DNR and MPCA aquatic specialist
to draft an action plan for invasive aquatic vegetation and species.
3. Document and report any invasion of exotic species to the MN DNR, HCWP and the lake
association on a periodic basis.
Objective B. Plant, restore and maintain native aquatic vegetation in Eagle Lake
Actions:
1. Continue to work with the MN DNR to inventory aquatic vegetation in Eagle Lake.
2. Partner with the MN DNR to indentify and inventory critical habitat areas in Eagle Lake.

27
3. Support the maintenance and replanting of native species where appropriate in critical areas of the
lake. Provide volunteer labor to assist the MN DNR in installing and maintaining vegetation in the
critical areas.
4. Support efforts by private landowners to plant, restore and maintain native vegetation species along
shore land areas adjacent to their properties.
5. Obtain and distribute literature from resource agencies that describe the benefits and importance of
native vegetation, and ways to better manage activities on the lake.
6. Conduct a workshop for lakeshore residents on aquatic vegetation identification and how to restore
their shoreline. MN DNR individuals that can assist in presenting information in a workshop.
Objective C. Support efforts by permitting and enforcing agencies to protect native aquatic vegetation
in Eagle Lake
Actions:
1. Support the introduction and continuation of aerial photography of the lake to inventory aquatic
vegetation patterns and any changes or disruption to the existing vegetative patterns.
2. Work with the MN DNR and Kandiyohi County Planning and Zoning officials to administer the
permitting process. The lake association should maintain a list of sites permitted for aquatic
vegetation removal as well as persons at the MN DNR to contact for permit applications.
Review and comment on permit applications that impact critical aquatic habitat areas.
Goal 3: Development: Promote wise and sustainable development and land management in the watershed.
Objective A. Support the adopting and administration of Kandiyohi County comprehensive water plan
and policies including subdivision regulations and zoning ordinances that are based on water and land
related resources principals.
Actions:
1. Support efforts of Kandiyohi County to review and revise their zoning ordinances and subdivision
regulations in ways to protect water resources in the watershed and promote sustainable land
development.
2. Work with local regulatory agencies to identify critical watershed areas such as wetlands, etc.
Support the protection and restoration of such critical areas.
3. Develop a program to establish the protection of agricultural land and open space in the watershed.
Goal 4: Erosion: Promote and encourage land use activities that prevent or minimize soil erosion.
Objective A. Identify and prioritize soil erosion areas.
Actions:
1. Conduct an inventory of existing erosion areas within the watershed to determine highest priority
areas where erosion is occurring and identify and prioritize areas for erosion control projects.
2. Work with the Kandiyohi County SWCD to develop an inventory of the buffers in the watershed.
Objective B. Work with resource agencies to implement incentive program and projects on private and
public lands that improve water quality in Eagle Lake
Actions:
1. Support projects being developed by landowners and the resource agencies in the watershed that
increase the amount of buffers.
2. Support practices by landowners in the watershed that increase the amount of crop residue and
decrease soil erosion.
3. Increase awareness by landowners of the effects of drainage systems and the benefits of retention
on water quality.
4. Encourage and support construction erosion control measures for all lakeshore residents during
home construction, new land and building development. Support and encourage construction

28
erosion control measures and impacts on water quality from road construction and maintenance.
Work with landscape contractors to construct landscaping improvements that minimized soil
erosion and storm water runoff impacts on the water resources.
Goal 5: Livestock. Promote and encourage the raising of livestock while balancing the need to protect water
and land resources.
Objective A. Promote efforts by resource agencies to assist feedlot operators and livestock producers to
use Best Management Practices (BMPs) related to livestock operations in the watershed.
Actions:
1. Support efforts by the Kandiyohi County to enforce the current feedlot regulations.
2. Support efforts by landowners and agencies to make corrective actions and improvements to
feedlots within the watershed.
3. Support the installation of fencing through programs sponsored by resource agencies that keep
livestock out of critical riparian areas.
Goal 6: Fisheries Resources. Protect and enhance the fish resources in the watershed.
Objective A. Promote efforts by the MN DNR to plan fisheries and habitat management efforts in the
watershed.
Actions:
1. Provide support to the MN DNR to conduct fish population surveys, creel surveys and other
methods of inventorying fishing activities.
2. Provide local input to the MN DNR in regards to fishing management topics such as desired fish,
stocking rates, management practices and other fishing regulations.
3. Support efforts to increase awareness for the need to protect and enhance aquatic vegetation and
its value as cover and a food source for the fisheries.
4. Encourage the shore land management practices that protect the water quality of Eagle Lake.
Work with the MN DNR to identify and preserve sensitive shore land areas for aquatic
management purposes.
Goal 7: Surface Water Use Management. Promote the safe and wise use of the surface waters in the
watershed for multiple recreational uses.
Objective A. Promote and coordinate education efforts on the safe and wise use of surface waters in the
watershed.
Actions:
1. Support and inform the public of existing programs that train youth and adults on the proper use
and laws regarding boats, personal watercrafts, snowmobiles, and ATVs.
2. Distribute literatures and publish reminders in the newsletter and on the website on the safe use of
lakes for winter activities (ice thickness, fish house safety, trash).
3. Provide information to property owners through newsletters, website, signage, and other methods
of current regulations regarding boating and recreational use of surface waters in the watershed.
4. Distribute information and publish reminders on Aquatic Invasive Species (AIS) rules and
regulations to eliminate or control the spread of aquatic invasive species such as zebra mussels.
Work with MN DNR personnel to conduct workshops on AIS issues.
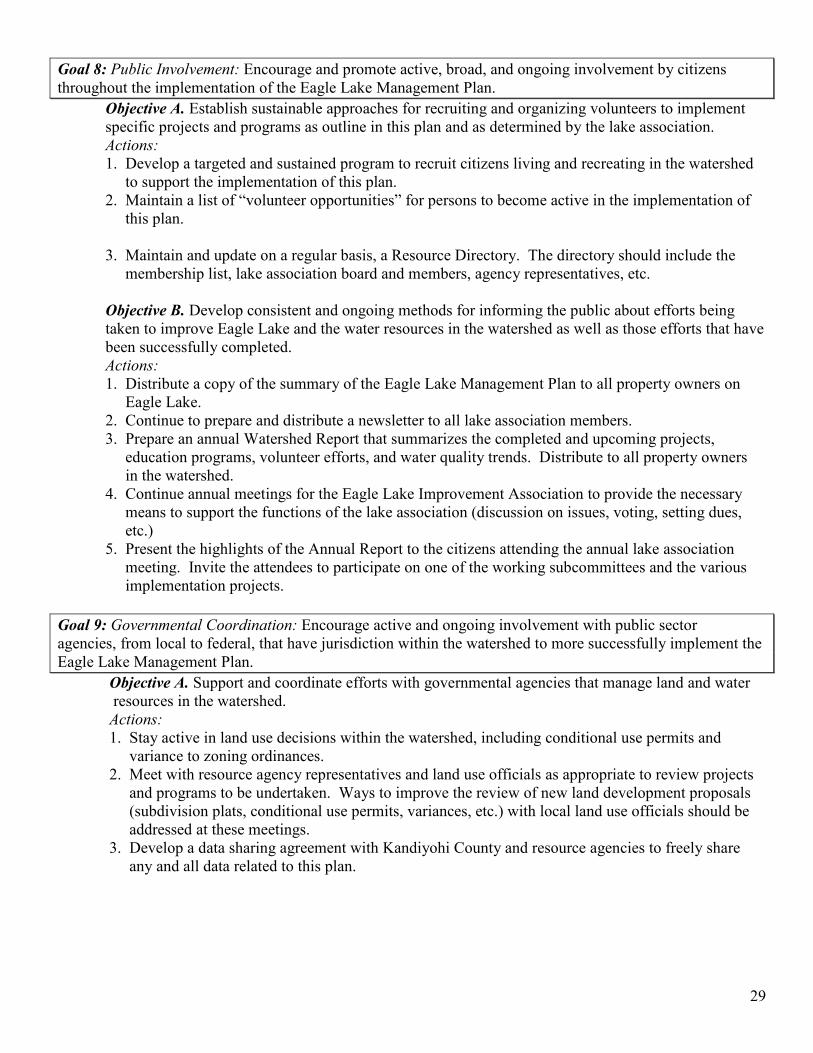
29
Goal 8: Public Involvement: Encourage and promote active, broad, and ongoing involvement by citizens
throughout the implementation of the Eagle Lake Management Plan.
Objective A. Establish sustainable approaches for recruiting and organizing volunteers to implement
specific projects and programs as outline in this plan and as determined by the lake association.
Actions:
1. Develop a targeted and sustained program to recruit citizens living and recreating in the watershed
to support the implementation of this plan.
2. Maintain a list of “volunteer opportunities” for persons to become active in the implementation of
this plan.
3. Maintain and update on a regular basis, a Resource Directory. The directory should include the
membership list, lake association board and members, agency representatives, etc.
Objective B. Develop consistent and ongoing methods for informing the public about efforts being
taken to improve Eagle Lake and the water resources in the watershed as well as those efforts that have
been successfully completed.
Actions:
1. Distribute a copy of the summary of the Eagle Lake Management Plan to all property owners on
Eagle Lake.
2. Continue to prepare and distribute a newsletter to all lake association members.
3. Prepare an annual Watershed Report that summarizes the completed and upcoming projects,
education programs, volunteer efforts, and water quality trends. Distribute to all property owners
in the watershed.
4. Continue annual meetings for the Eagle Lake Improvement Association to provide the necessary
means to support the functions of the lake association (discussion on issues, voting, setting dues,
etc.)
5. Present the highlights of the Annual Report to the citizens attending the annual lake association
meeting. Invite the attendees to participate on one of the working subcommittees and the various
implementation projects.
Goal 9: Governmental Coordination: Encourage active and ongoing involvement with public sector
agencies, from local to federal, that have jurisdiction within the watershed to more successfully implement the
Eagle Lake Management Plan.
Objective A. Support and coordinate efforts with governmental agencies that manage land and water
resources in the watershed.
Actions:
1. Stay active in land use decisions within the watershed, including conditional use permits and
variance to zoning ordinances.
2. Meet with resource agency representatives and land use officials as appropriate to review projects
and programs to be undertaken. Ways to improve the review of new land development proposals
(subdivision plats, conditional use permits, variances, etc.) with local land use officials should be
addressed at these meetings.
3. Develop a data sharing agreement with Kandiyohi County and resource agencies to freely share
any and all data related to this plan.

30
Goal 10: Fiscal Management: Promote the implementation of the Eagle Lake Management Plan in a fair and
fiscally responsible manner.
Objective A. Maintain and update an inventory of funding resources for implementing the Eagle
Lake Management Plan including local, state federal, non-profit foundation and private sources.
Actions:
1. Explore the use of financing tools provided through Kandiyohi County Water Plan, Kandiyohi
SWCD, HCWP, and state and federal agencies including US Natural Resources Conservation
Service (NRCS). Some of the water protection programs include CRP, RIM, EQIP, WRP, etc.
Objective B. Develop an annual budget for the Eagle Lake Improvement Association
Actions:
1. Solicit public input on the proposed budget at the annual meeting
2. Prepare an annual budget for the implementation of the Eagle Lake Management Plan.

31
Appendix
Maps
Eagle Lake Management Plan
February 2012

32
Map 1. Map 1 shows the proximity of the Hawk Creek Watershed in reference to the State of Minnesota, along with major
highways and municipalities and majors rivers and lakes.
33
Map 2. Map 2 shows the subwatersheds for the Hawk Creek Watershed, there are fifteen subwatersheds in the three
counties. Hawk Creek and Chetomba Creek are the largest.

34
Map 3. Map 3 shows the pre-settlement vegetation for Eagle Lake. The vast majority of the vegetation was prairie with
some wet prairie in the center of the watershed. All the “woods” was around Point Lake at this time.
Eagle Lake looks to have grown from pre-settlement times to now, as the map shows the lake being much narrower.

35
Map 4. Map 4 shows the current land use in the Eagle Lake Watershed as of 2009. Most of the land use to the east of the
lake is agricultural with a mix of forests, pasture/hay and wetlands. Land use to the west of Eagle Lake is a mix of forests
and urban development, as in the land right next to the lake.

36
Map 5. Map 5 shows the Kandiyohi County Planning and Zoning areas in the Eagle Lake Watershed.
All of the adjacent around Eagle and Point lakes are shore land residential.

37
Map 6. Map 6 shows the areas with retired farmland or CRP, there are large blocks of land that are enrolled in this program
in 2009. Areas of CRP can be taken out after the contract expires. The acres in this map could be less or more since the 2009
data was published.

38
Map 7. Map 7 shows all the restorable wetlands within the Eagle Lake Watershed, many of these wetlands have existing
CRP or retired grasslands surrounding them.

39
Map 8. Map 8 shows the feedlots in the Eagle Lake Watershed during the 2011 year. All feedlots are located in the
eastern portion of the watershed and near some of the major tributaries to the lake.

40
Map 9. Map 9 shows the Eagle Lake Bathymetric MPCA and CLMP Monitoring Sites
(100 series = MPCA sites, 200 series = CLMP sites)
102 /203
101 /202
201

41
Map 10. Map10 shows the current monitoring sites sampled by the Eagle Lake Improvement Association. There are other
sites not shown on the map that have been sampled in the past or are being sampled by other organization such as Hawk
Creek Watershed Project.

42
Fig
ure
18
. F
igure
18
sho
ws
the
reco
rded
wat
er l
evel
s o
n E
agle
Lak
e fr
om
19
39
to
20
10
. T
he
red
lin
e is
the
ord
inar
y h
igh w
ate
r le
vel
(O
HM
),
wh
ich i
s 1
12
6.3
, w
hic
h d
eter
min
es t
he
MN
DN
R’s
juri
sdic
tio
nal
bo
und
ary o
f th
e la
ke.
O
rdin
ary H
igh W
ater
Level
mea
ns
that
an
y w
ork
that
nee
d t
o b
e d
one
at
the
elev
ati
on w
ill
nee
d a
per
mit
fro
m t
he
DN
R.
The
pin
k l
ine
is t
he
run o
ut
elevat
ion,
whic
h i
s 1
12
4.7
, th
e le
vel
at
whic
h t
he
wat
er l
eaver
s th
e la
ke
thro
ug
h t
he
dam
on t
he
south
ern s
ide.
Ord
inary
Hig
h W
ater (O
HM
) 1126.3
Run out 1124.7

43
REFERENCES
Eagle Lake Improvement Association (2011). Retrieved December 18, 2011 from website:
http://www.eaglelakewillmar.com
Eisterhold, J. (2011 December). Minnesota Department of Natural Resources, Invasive Species Specialist.
Personal communication via email/phone.
Hilbert, R. (2011 December). Kandiyohi County Feedlot Officer. Personal communication via email.
Jenzen, E. (2012 February). Minnesota Department of Natural Resources, Area Hydrologist, Spicer.
Personal communication via email.
Kandiyohi County & Mid-Minnesota Development Commission (2003). The Kandiyohi County
Comprehensive Local Water Plan. Retrieved December 28, 2011 from website:
http://www.co.kandiyohi.mn.us/docs/EnvSvcs/WaterPlan/Kandiyohi_WaterPlan2003_2012.pdf
McComas, S., Stuckert, J., Blue Water Science. Eagle Lake Management Plan. Retrieved December 2011
from Steve McComas.
Minnesota Department of Natural Resources-Division of Fisheries. Lake Information Report (2009).
Retrieved December 21, 2011 from website: http://www.dnr.state.mn.us/lakefinder/showreport.html.
Minnesota Department of Natural Resources-Division of Forestry. Presettlement Vegetation.
Retrieved December 19, 2011 from website: http://deli.dnr.state.mn.us/metadata/pveg_mrschpy1.html
Minnesota Pollution Control Agency (2008 February). Citizen Lake Monitoring Program Instruction
Manual. Retrieved December 29, 2011 from website: http://www.pca.state.mn.us/index.php/view-
document.html?gid=6198
Minnesota Pollution Control Agency (1995 September). Lake Assessment Program-Eagle Lake. Retrieved
from Steve Heikary, MPCA-St. Paul.
Simons, G (January 2012). Eagle Lake Improvement Association. Personal communication via email.
University of Minnesota, State Climatology Office. Annual Precipitation Maps and Water-Year Maps.
Retrieved December 29, 2011 from website: http://climate.umn.edu/doc/annual_pre_maps.htm
Wright, S (1995 March). Eagle Lake: Water Levels & Historical Watershed Information. Minnesota
Department of Natural Resources. Retrieved December 2011 from Ethan Jenzen, MN DNR Area
Hydrologist Spicer.