e1 water conditioning
TRANSCRIPT

7/27/2019 E1 Water Conditioning
http://slidepdf.com/reader/full/e1-water-conditioning 1/15
Name: Chryzl D. Suobiron Date performed:Jan. 12,2013Course/yr: BS ChE - IV Date submitted:Jan. 21,2013
Experiment #1 Water Hardness and Conditioning
I. Introduction:
Water may look pure and refreshing, but the truth isthat water contains many chemicals and impurities. Whenwater evaporates from the earth, it rises into theatmosphere and forms into cloud formations. Undercertain conditions, it then returns to earth in the formof rain, snow, sleet or hail and may also appear as dewor fog. As moisture falls from the sky, it can pick up
minerals, gasses, solids and chemicals, and bacteria. Asit runs over the ground, it picks up additional organiccontaminates from the earth's surface. As the waterseeps into the ground, it then picks up othercontaminates, such as calcium, iron, magnesium andhydrogen sulfide. As the water dissolves mineraldeposits in the stratus of the earth leaving excessivelevels of calcium and magnesium the water becomes hardchemically.
Hard water can produce a rock-like scale that builds up in pipes,mixers, heaters, machines and otherequipment especially in chemicalprocessing industries. This scale canalso reduce water flow and clogvalves and pipes to createmaintenance problems and reduce thelife of equipment. Hard water reducesthe ability of soap to clean andproduce suds, leaving a residue orprecipitates. It does not only attackindustries but even homes. Hard water
is more abrasive than soft water. The mineral particles
combine with soap used at home to become little piecesof rock pounding away at clothing fibers and fragileglassware. Glasses become etched and the life ofclothing is reduced. Skin and hair are affected by hardwater as well. A greater amount of shampoo and soap isneeded to clean, and hard water doesn't rinse off aswell as soft water. That means soap residues remain,

7/27/2019 E1 Water Conditioning
http://slidepdf.com/reader/full/e1-water-conditioning 2/15
leaving skin susceptible to blemishes and hair lessshiny.
Water hardness is the most common of all waterproblems. The presence of calcium and magnesium saltscause water to be hard proportional to the quantity of
the heavy metals that are present. The most commonmethod of designating the degree of hardness of a given
water supply is in grains per gallon (GPG).Here is what an analysis in grains per gallon means
to you, according to the U.S. Department of the Interiorand Water Quality Association Standards:
Water softening or conditioning, on the other hand,will solve your hard water problem. Water is softened orconditioned by replacing hardness ions such as calcium
and magnesium with softer sodium or potassium ions asthe most effective and common conditioning. Watersofteners must be regenerated regularly with a brinesolution, renewing their ability to remove hardness fromwater. The hard water is passed through a tankcontaining resin beads coated with sodium ions orpotassium ions. The calcium and magnesium ions areexchanged for the sodium ions, thus conditioning thewater. When the beads have trapped all the hardness theycan hold, the unit is regenerated with salt brine toreplace the hardness ions with sodium ions. The unit is
then ready to condition water again.
Two Types of Water Hardness
1. Temporary hardness
-Also known as carbonate, this type of hardness iscaused by bicarbonates of calcium and magnesium.
2. Permanent Hardness
GRAINS PER GALLON DEGREE OF HARDNESS
Less than 1.0 Soft
1.0 to 3.5 Slightly Hard
3.5 to 7.0 Moderately Hard
7.0 to 10.5 Hard
10.5 and Higher Very Hard

7/27/2019 E1 Water Conditioning
http://slidepdf.com/reader/full/e1-water-conditioning 3/15
-Known as noncarbonate, this type of hardness isdue to the sulfates and chlorides of calcium andmagnesium.
Water Conductivity
Conductivity is a measure of the ability of water topass an electrical current. Conductivity in water isaffected by the presence of inorganic dissolved solidssuch as chloride, nitrate, sulfate, and phosphate anions(ions that carry a negative charge) or sodium,magnesium, calcium, iron, and aluminum cations (ionsthat carry a positive charge). Since the presence ofsalts such as calcium and magnesium triggers theelectrical current to pass, it follows that the harderthe water it is more conductive. Conductivity is alsoaffected by temperature: the warmer the water, the
higher the conductivity. For this reason, conductivityis reported as conductivity at 25 degrees Celsius (25C).
Conductivity in streams and rivers is affectedprimarily by the geology of the area through which thewater flows. Streams that run through areas with granitebedrock tend to have lower conductivity because graniteis composed of more inert materials that do not ionize(dissolve into ionic components) when washed into thewater. On the other hand, streams that run through areaswith clay soils tend to have higher conductivity becauseof the presence of materials that ionize when washed
into the water. Ground water inflows can have the sameeffects depending on the bedrock they flow through.
The basic unit of measurement of conductivity is themho or siemens. Conductivity is measured in micromhosper centimeter (µmhos/cm) or microsiemens per centimeter(µs/cm). According to Environmental Protection Agency(EPA), Pure or purified water is not a good conductor ofelectricity so its conductivity is expected to be theleast among others. Distilled water has conductivity inthe range of 0.5 to 3 µmhos/cm. The conductivity ofrivers in the generally ranges from 50 to 1500 µmhos/cm.
Studies of inland fresh waters indicate that streamssupporting good mixed fisheries have a range between 150and 500 µhos/cm. Conductivity outside this range couldindicate that the water is not suitable for certainspecies of fish or macroinvertebrates. Industrial waterscan range as high as 10,000 µmhos/cm. Sea water can have50000 µmhos/cm
7/27/2019 E1 Water Conditioning
http://slidepdf.com/reader/full/e1-water-conditioning 4/15
Soap Test
The volumes of soap solution needed give a measureof the relative hardness of the water. With more ablegroups, it might be worth considering that pure water iscompletely soft, so that the volume of soap required
here is just the amount required to get a lather, not toovercome hardness. The volume obtained should besubtracted from the other volumes before the relativehardnesses are compared.
Hard water contains dissolved calcium (or magnesium)salts that react with soap solution to form an insolublescum that should be seen as a white cloudiness in thetubes:
calcium salt(aq) + sodium stearate (soap)(aq)
calcium stearate(scum)(s) + sodium salt(aq)
Only when all the calcium ions have beenprecipitated out as scum will the water lather. Thus thevolume of soap solution measures the amount of hardnessand it implies that the harder the water the moreprecipitated calcium ions will form. In hard water,soaps exchange their cations for the hard water cations,and the resulting complex is insoluble, precipitatingfrom the water. That means that it will not work tolower the water's surface tension because the soap nolonger has a hydrophilic head.
Detergent Test
Detergent has a special substance in it calledsodium zeolite A which takes the calcium and magnesiumions out of hard water. These ions prevent the soap inthe water from bubbling. In the hard water, thedetergent should bubble better than the soap. One candetermine if a tap water is hard or not by seeing howwell soap bubbles in it.
Heating Method
Heating can be done only in water with temporaryhardness and not for those permanent ones. Temporarilyhard water is defined as that which can be softened byboiling.
On boiling, the reaction in softening the water:
Ca(HCO3)2(aq) → CaCO3(s) + CO2(g) + H2O(l)
7/27/2019 E1 Water Conditioning
http://slidepdf.com/reader/full/e1-water-conditioning 5/15
Permanently hard water contains calcium or magnesiumsalts other than the hydrogen carbonates. These areunaffected by boiling.
As shown in the reaction of hydrogen carbonates it
is just but the reverse of boiling.CaCO3(s) + CO2(g) + H2O(l) → Ca(HCO3)2(aq)
(Calcium hydrogen carbonate)
Cold-lime Method
Precipitation softening accomplished at ambienttemperatures is referred to as cold lime softening. Whenhydrated lime, Ca(OH)2, is added to the water beingtreated, the following reactions occur:
CO2 +Ca(OH)2 =CaCO3 ¯+H2O
Ca(HCO3)2+Ca(OH)2 =2CaCO3 ¯ +2H2O
Mg(HCO3)2+2Ca(OH)= Mg(OH)2 ¯ +2CaCO3 ¯+2H2O
If the proper chemical control is maintained on limefeed, the calcium hardness may be reduced to 35-50 ppm.Magnesium reduction is a function of the amount ofhydroxyl (OH-) alkalinity excess maintained.Noncarbonate or permanent calcium hardness, if present,is not affected by treatment with lime alone. Ifnoncarbonate magnesium hardness is present in an amount
greater than 70 ppm and an excess hydroxyl alkalinity ofabout 5 ppm is maintained, the magnesium will be reducedto about 70 ppm, but the calcium will increase inproportion to the magnesium reduction.
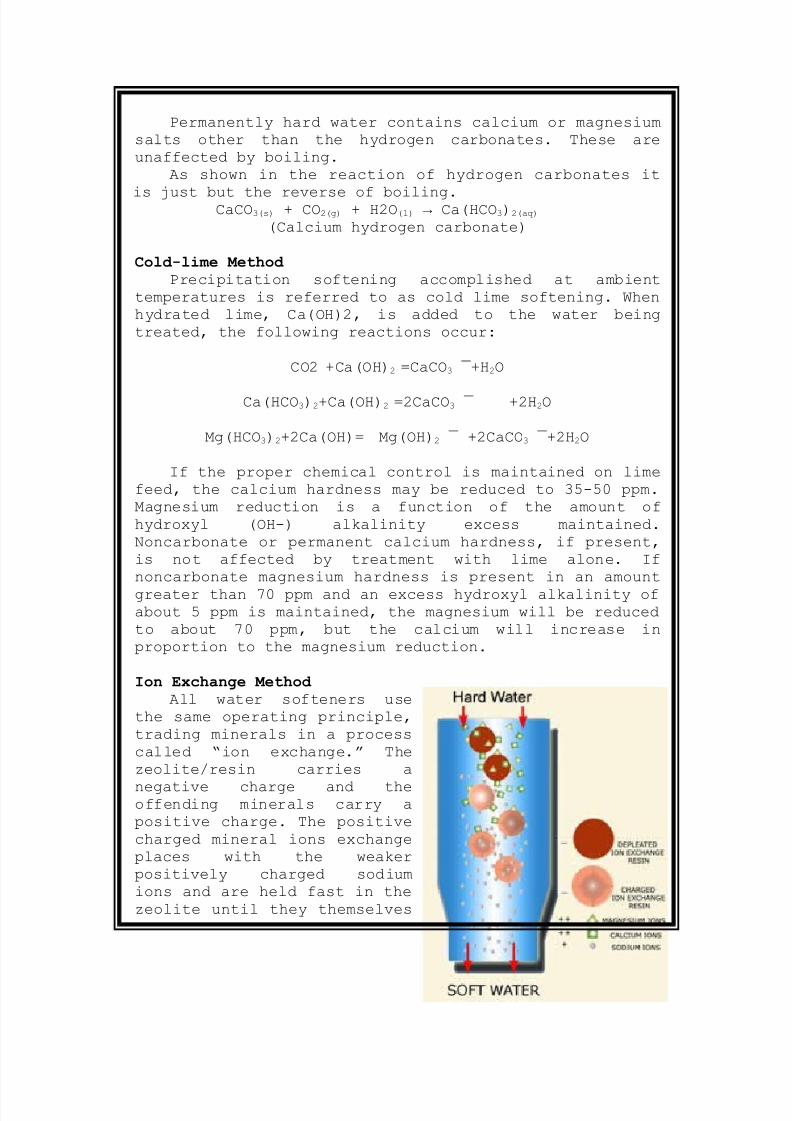
Ion Exchange Method
All water softeners usethe same operating principle,trading minerals in a processcalled “ion exchange.” Thezeolite/resin carries a
negative charge and theoffending minerals carry apositive charge. The positivecharged mineral ions exchangeplaces with the weakerpositively charged sodiumions and are held fast in thezeolite until they themselves
7/27/2019 E1 Water Conditioning
http://slidepdf.com/reader/full/e1-water-conditioning 6/15
are knocked off during the recharge cycle. Afterrecharging, the zeolite is cleaned of the bad mineralsand reunited with its slightly positive friend thesodium ion and ready to attract more minerals in thewater stream.
The essential part of a water softener is themineral tank that holds the negatively chargedresin/zeolite beads. Calcium, magnesium and sodium (theminerals that make your water hard) carry positivecharges with sodium holding the weaker charge of thethree. As the water moves through the tank, the mineralswill displace the weaker charged sodium ions and becomeentrapped in the zeolite. If all is working correctly,after the zeolite bed is completely saturated, the unitwill recharge itself with a strong brine (salt)solution. The force and strength of the solution knocks
the minerals off the beads and reseats the sodium ionsback into the zeolite beads.
Other Softening Processes
Other processes can be used to soften water, butthey are generally expensive and only used in rarecircumstances. These alternative processes are listedbelow.
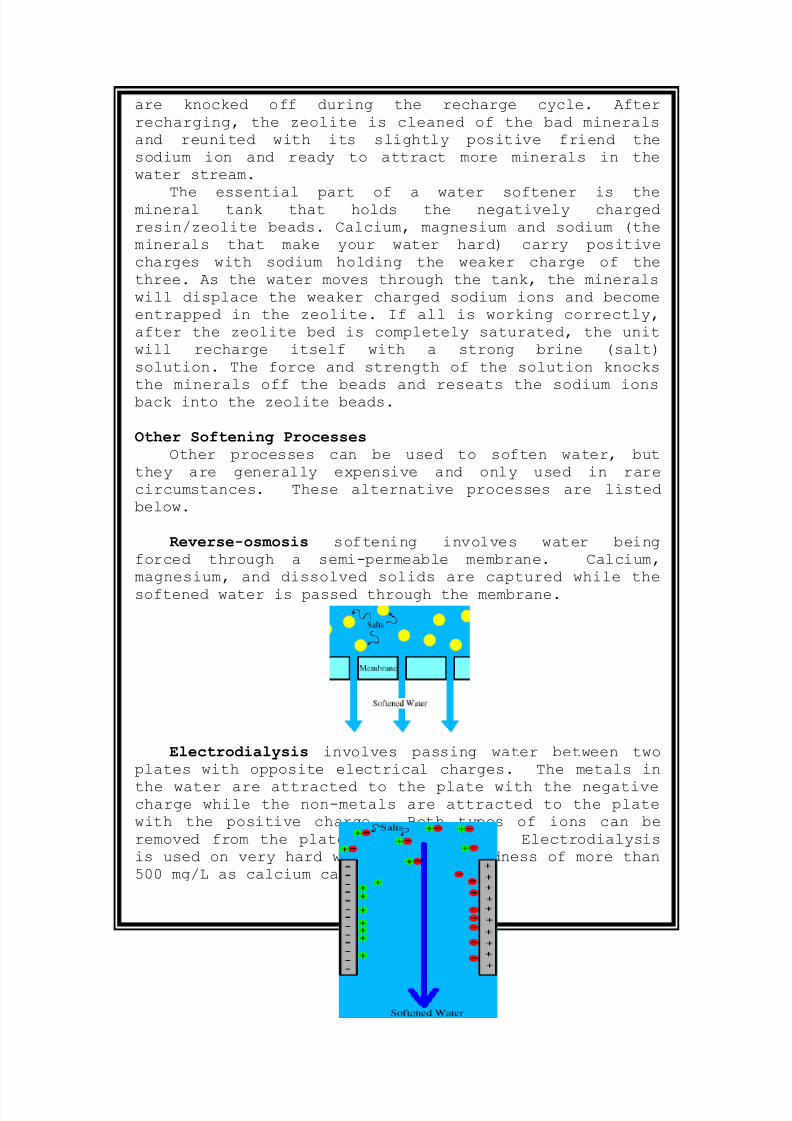
Reverse-osmosis softening involves water being
forced through a semi-permeable membrane. Calcium,magnesium, and dissolved solids are captured while the
softened water is passed through the membrane.
Electrodialysis involves passing water between twoplates with opposite electrical charges. The metals in
the water are attracted to the plate with the negativecharge while the non-metals are attracted to the platewith the positive charge. Both types of ions can beremoved from the plates and discarded. Electrodialysisis used on very hard water, with a hardness of more than500 mg/L as calcium carbonate.
7/27/2019 E1 Water Conditioning
http://slidepdf.com/reader/full/e1-water-conditioning 7/15
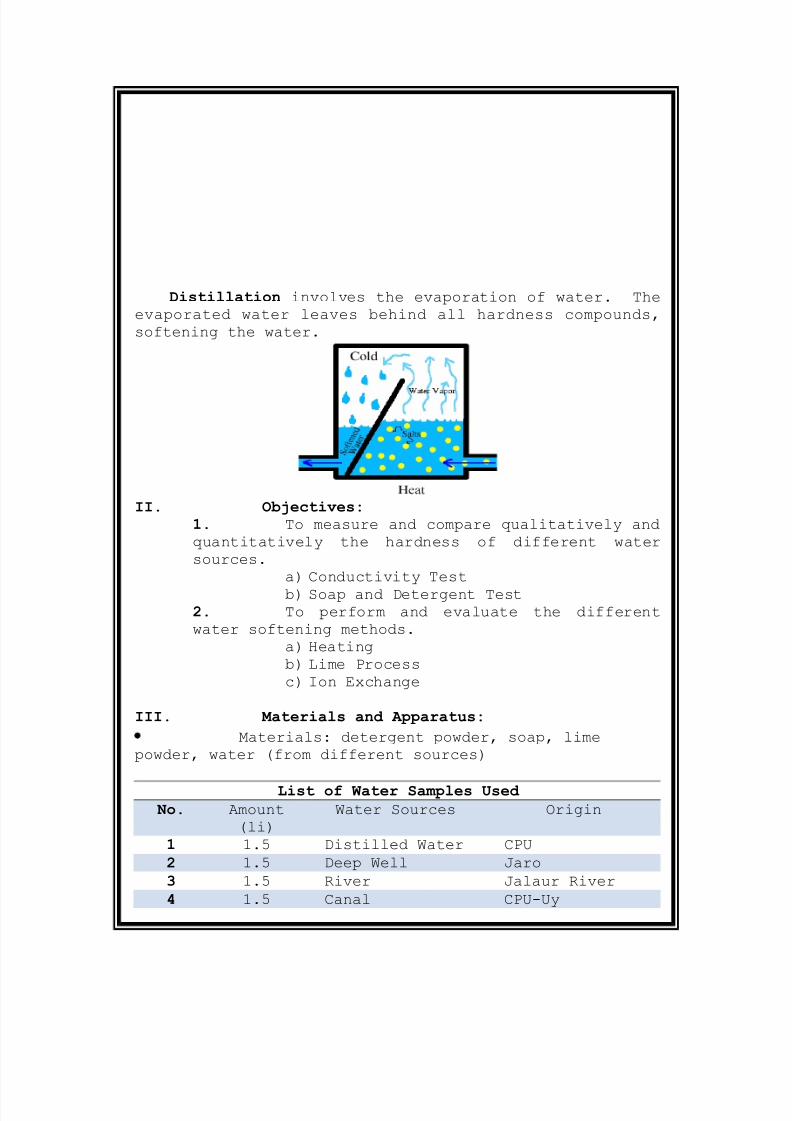
Distillation involves the evaporation of water. Theevaporated water leaves behind all hardness compounds,softening the water.
II. Objectives: 1. To measure and compare qualitatively andquantitatively the hardness of different watersources.
a) Conductivity Test
b) Soap and Detergent Test2. To perform and evaluate the differentwater softening methods.
a) Heatingb) Lime Processc) Ion Exchange
III. Materials and Apparatus:
• Materials: detergent powder, soap, limepowder, water (from different sources)
List of Water Samples Used
No. Amount(li)
Water Sources Origin
1 1.5 Distilled Water CPU2 1.5 Deep Well Jaro3 1.5 River Jalaur River4 1.5 Canal CPU-Uy

7/27/2019 E1 Water Conditioning
http://slidepdf.com/reader/full/e1-water-conditioning 8/15
5 1.5 Deep Well Sta. Barbara6 1.5 Creek Lambunao7 6 Seawater Guimaras Strait8 1.5 Brackish Dumangas9 1.5 Purified Water Rain Dew
10 1.5 Rainwater Jaro11 1.5 Tap Water CPU-Engineering
Table 1 – List of water sources and their origin,including the amount (li) used in theexperiment.
• Apparatus: beakers (8), glass stirring rod,graduated cylinder, conductivity meter, hot plate,Erlenmeyer flask, mortar and pestle, stop watch, spatula
IV. Procedure:
Each student was tasked to bring water samples from
different water sources as shown in Table 1. A 200mlwater sample was put into a container (preferably abeaker or an Erlenmeyer flask) that was taken from theprepared 1.5li of different water sources. After allmaterials were ready for the said experiment, thestudents started the different tests which included: themeasure of hardness (quantitative and qualitative) –conductivity test, soap test and detergent test, thesoftening methods –heating, cold-lime process and ionexchange.
For quantitative test, the conductivity of each
water sample from different water sources was recordedusing a conductivity meter for future comparisons and aswell as a basis of the hardness of the different samplesin the different following tests.
For soap test, a 200ml of water from different watersources was placed in their respectivebeakers/Erlenmeyer flasks. An equal amount of soap usinga spatula was placed in each beaker and was stirred for2 minutes at the same time. After stirring the mixturewas left to settle any precipitates formed. After awhile the students were then asked to observe the
mixtures according to its appearance and texture thatwould indicate their individual hardness compared toothers.
In a different beaker, another 250ml of differentwater sources was prepared for the detergent test. Equalamount of detergent powder using a spatula was placed ineach beaker. Using the stirring rod, the mixture wasstirred for two minutes and was observed. The intensity

7/27/2019 E1 Water Conditioning
http://slidepdf.com/reader/full/e1-water-conditioning 9/15
of stirring as much as possible should be the same.Since there were only small significant differencesfound in each mixture, another spatula of detergentpowder was placed for visible results. It was againstirred for two minutes and let the precipitates settle.
All observations in the appearance and texture werecarefully recorded.After measuring the hardness of water quantitatively
and qualitatively, the test for softening the waterfollowed. The first test was heating the water sample.500ml from each water sample was placed into abeaker/Erlenmeyer flask and was heated in a hot plateuntil precipitates was formed. This method was donebefore any other tests since it required enough time toboil and form the precipitates that would indicate theminerals present in the sample contributing to water
hardness.The next test was the cold-lime softening whichrequires the addition of lime powder in the water. Onlythree water sources were picked to undergo this test. Inthree different beakers an amount 420ml of deep wellwater (Jaro), 450ml of brackish water (Dumangas) and 450ml of seawater (Guimaras Straight) was poured. Onespatula of lime powder was poured into each beaker.Using a stirring rod, the mixture was stirred at thesame time with the same intensity until the limedissolved in the water. Observations were then recordedafter the test.
The last test performed was the ion-exchangesoftening which was done only for the water samplecoming from the deep well (Sta. Barbara) since the colorof the water was yellowish brown. 400ml of the saidwater sample was prepared for the test. Before the test,the ion-exchange apparatus was cleaned by pouring theremaining seawater or the brine solution available fromthe top of the apparatus until the cation resin wascolored light brown. After that the water sample to beused was poured the same manner as the brine. Theeffluent of the ion exchange apparatus was then observed
and tested further.After performing the tests, all materials and
apparatus used was carefully cleaned and stored. Allwater samples were disposed properly.
V. Observations, Result and Analysis:
Water Conductivity

7/27/2019 E1 Water Conditioning
http://slidepdf.com/reader/full/e1-water-conditioning 10/15
Water Sources Origin Conductivity
( )
Temperature
(◦C)
Rainwater Jaro 44.1 26.5Purified Water Raindew 85.6 27.3
Distilled water CPU 87 26.7
River Jala-ur River 610 26.8Deep well Jaro 1043 27
Creek Lambunao 1055 27Canal CPU-Uy 1105 27.5Tap Water CPU-Engineering 1247 27.4Deep well Sta. Barbara 1769 27.1Brackish water Dumangas 47,700 27.1Seawater Guimaras Strait 49,600 26.9
Table 2 – Water conductivity of the water samples fromdifferent water sources at 26-28◦C arranged from least tomost conductive.
The table above shows the conductivity of different
water sources arranged from the least to the mostconductive at certain temperatures. It can be observethat the rainwater is the least conductive having a
conductivity of 44.1 compared to the seawater as the
most conductive with 49,600 . As stated in the
theoretical framework, according to EPA purified water
should be the least conductive however for sea water it
is true that it should have the highest conductivity. It
can also be observed that brackish water conductivity is
near to seawater since according to their strategiclocations brackish water was just an extension of the
sea. Pure and distilled water also have almost the same
conductivity since one way of purifying water is through
distillation also.
Soap Test
Water Sources Origin Appearance Texture
Rainwater JaroVery cloudy, w/ large amount
of bubble formation Smooth
Purified Water RaindewCloudy,w/ small amount ofbubble formation Smooth
Distilled water CPUCloudy, no bubble formations
Smooth
River Jala-ur RiverCloudy, no bubble formations
Smooth
Deep well Jarocloudy no bubble formations
Smooth
Creek Lambunao Less cloudy, w/ undissolved Smooth
7/27/2019 E1 Water Conditioning
http://slidepdf.com/reader/full/e1-water-conditioning 11/15
soaps but no bubble
formations
Canal CPU-Uy
Less Cloudy, w/ undissolved
soaps but no bubble
formationsSmooth
Tap WaterCPU-Engineering
Less Cloudy, w/ undissolved
soaps but no bubble
formationsSmooth
Deep well Sta. BarbaraNo visible effects,undissolved soap
Not sosmooth
Brackish water DumangasNo visible effects,undissolved soap
Not sosmooth
SeawaterGuimarasStrait
No visible effects,undissolved soap
Not sosmooth
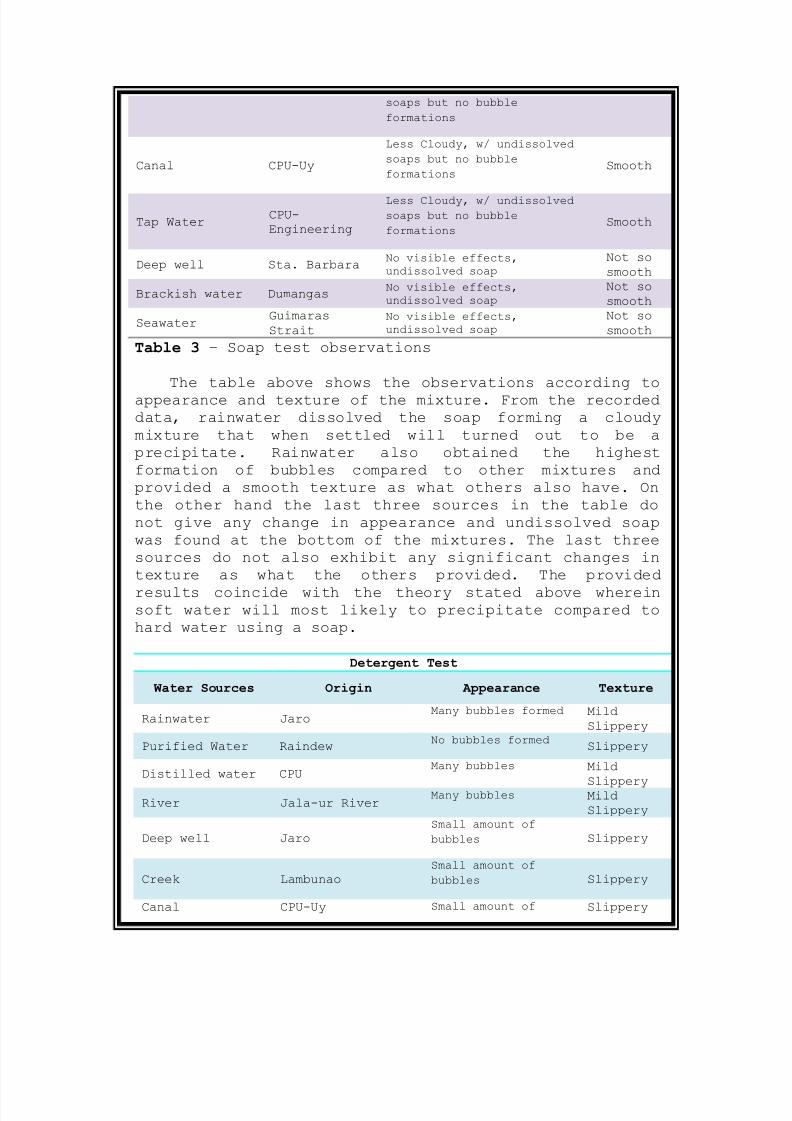
Table 3 – Soap test observations
The table above shows the observations according toappearance and texture of the mixture. From the recordeddata, rainwater dissolved the soap forming a cloudymixture that when settled will turned out to be aprecipitate. Rainwater also obtained the highestformation of bubbles compared to other mixtures andprovided a smooth texture as what others also have. Onthe other hand the last three sources in the table donot give any change in appearance and undissolved soapwas found at the bottom of the mixtures. The last threesources do not also exhibit any significant changes intexture as what the others provided. The provided
results coincide with the theory stated above whereinsoft water will most likely to precipitate compared tohard water using a soap.
Detergent Test
Water Sources Origin Appearance Texture
Rainwater JaroMany bubbles formed Mild
Slippery
Purified Water RaindewNo bubbles formed
Slippery
Distilled water CPUMany bubbles Mild
SlipperyRiver Jala-ur River
Many bubbles MildSlippery
Deep well JaroSmall amount of
bubbles Slippery
Creek LambunaoSmall amount of
bubbles Slippery
Canal CPU-Uy Small amount of Slippery
7/27/2019 E1 Water Conditioning
http://slidepdf.com/reader/full/e1-water-conditioning 12/15
bubbles
Tap Water CPU-EngineeringSmall amount of
bubbles Slippery
Deep well Sta. BarbaraNo bubbles
Slippery
Brackish water Dumangas Many bubbles VerySlippery
Seawater Guimaras StraitMany bubbles Very
Slippery
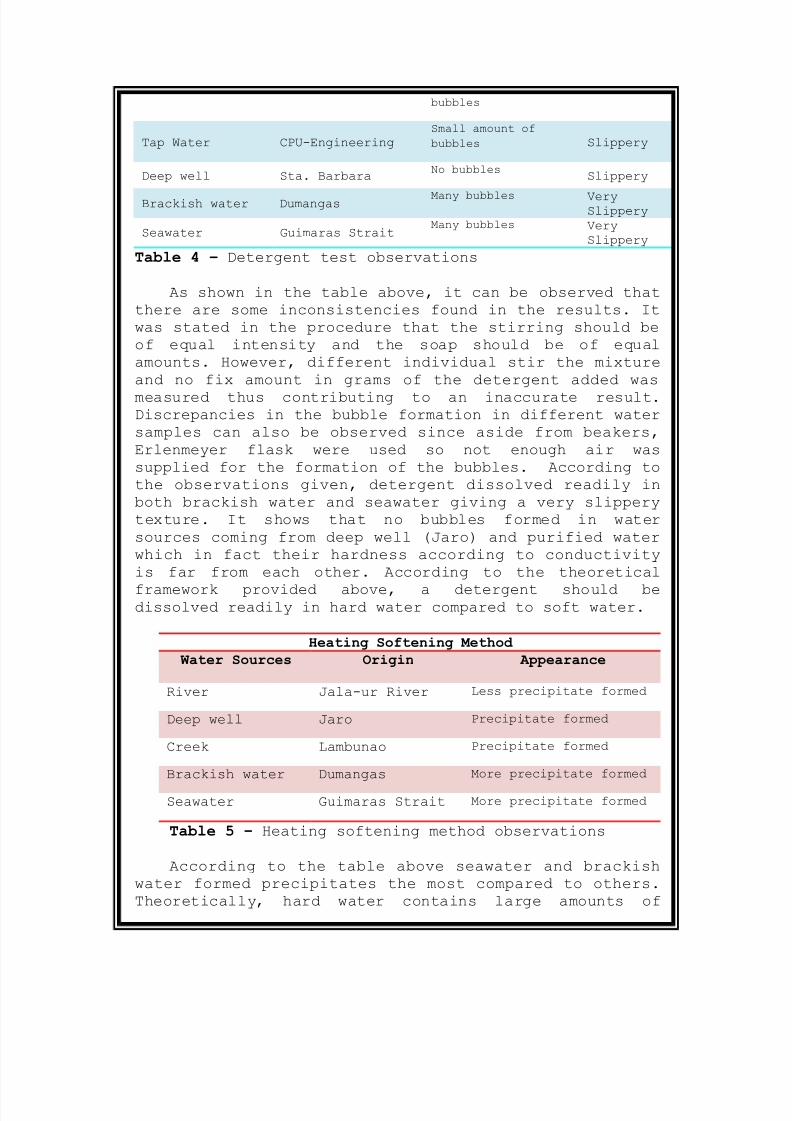
Table 4 – Detergent test observations
As shown in the table above, it can be observed thatthere are some inconsistencies found in the results. Itwas stated in the procedure that the stirring should beof equal intensity and the soap should be of equalamounts. However, different individual stir the mixtureand no fix amount in grams of the detergent added was
measured thus contributing to an inaccurate result.Discrepancies in the bubble formation in different watersamples can also be observed since aside from beakers,Erlenmeyer flask were used so not enough air wassupplied for the formation of the bubbles. According tothe observations given, detergent dissolved readily inboth brackish water and seawater giving a very slipperytexture. It shows that no bubbles formed in watersources coming from deep well (Jaro) and purified waterwhich in fact their hardness according to conductivityis far from each other. According to the theoretical
framework provided above, a detergent should bedissolved readily in hard water compared to soft water.
Heating Softening Method
Water Sources Origin Appearance
River Jala-ur River Less precipitate formed
Deep well Jaro Precipitate formed
Creek Lambunao Precipitate formed
Brackish water Dumangas More precipitate formed
Seawater Guimaras Strait More precipitate formed
Table 5 – Heating softening method observations
According to the table above seawater and brackishwater formed precipitates the most compared to others.Theoretically, hard water contains large amounts of

7/27/2019 E1 Water Conditioning
http://slidepdf.com/reader/full/e1-water-conditioning 13/15
salts that when heated forms precipitate at the bottomof the container. These precipitates were the saltscontained in a hard water, thus once it is removed thesaid water will most likely become soft. Theobservations above followed the said principle on
heating hard water.
Cold-lime Softening Method
Water Sources Origin Appearance
Deep well Jaro Less clear withundissolved solids
Brackish water Dumangas Clear with undissolvedsolids
Seawater Guimaras Strait Clear with undissolvedsolids
Table 6 – Cold-lime softening method observations
According to the table above, all water samplesbecomes clearer compared to the original samples howeverthere were still some solid particles found at thebottom of the container since there were no fix amountin grams of lime added in each container. The removal ofturbidity in water samples implies softer water sincethe salts are captures in limewater upon the addition oflime in the water.
Ion-Exchange Softening Method
Water Sources Origin Appearance Conductivity( )
Deep well Sta. Barbara Before:yellowishbrownAfter:Colorless
Before: 1760
(at 27.4◦C)
After: 2220(at 27.8 ◦C)
Table 7 – Ion-exchange softening method observations
As shown in the table about ion-exchange methodresults shows that the appearance and conductivity,before and after the softening process produced asignificant difference. The yellowish-brown appearance
of the water before was turned into colorless whichimplies the removal of metals that contribute to thecolor of the water. There was also a significantdifference in conductivities since it becomes higherafter the softening method. The according to thetheories provided above, the conductivity should belower than the original. Discrepancy in conductivity wasactually due to the brine solution that was used to

7/27/2019 E1 Water Conditioning
http://slidepdf.com/reader/full/e1-water-conditioning 14/15
clean the ion-exchange apparatus. There were probablyremaining salts in the apparatus that was carried awayby the sample water during the test resulting to ahigher conductivity.
VI. Conclusions and Recommendations:The hardness of water from different water sources
can be measure and compare qualitatively and
quantitatively was using conductivity test, and soap and
detergent test. Using the conductivity test, it shows
that the higher the conductivity, the harder will be the
water. On the other hand using the soap test, it implies
that the softer the water the more it readily reacts
with the soap forming precipitates. However, using the
detergent test, hard water performs best.
Different softening methods such as heating, lime
process and ion-exchange method can be applied for
hardness removal. Heating method which works best for
water with temporary hardness is a convenient way of
softening hard water by precipitating out salts through
boiling. Lime process works best by dissolving out salts
using lime in a homogeneous solution. The ion-exchange
method would be a good softening method especially in
decolorization of water.
The use of other softening methods available such as
reverse osmosis, electrosialysis, and distillation would
be highly recommended in future experiments regarding
hard water for comparison. It would also be best if
other methods in determining water hardness such as EDTA
or Ethylenediaminetetraacetic acid to form CaEDTA or
MgEDTA. The end point of EDTA titration shall determine
how much of the Ca and Mg ions are being reacted thus
the amount of hardness can be calculated. Materials used
should also be of fix amount especially in addition of
lime, soap and detergent.
VII. References:
Online:(Retrieved: Jan. 20, 13)
7/27/2019 E1 Water Conditioning
http://slidepdf.com/reader/full/e1-water-conditioning 15/15
1. http://www.ecowaterusa.com/faqs.php2. http://www.stevenswater.com/water_qualit
y_sensors/conductivity_info.html3. http://www.lenntech.com/applications/ult
rapure/conductivity/water-conductivity.htm
4. http://water.epa.gov/type/rsl/monitoring/vms59.cfm5. http://www.nuffieldfoundation.org/practi
cal-chemistry/testing-hardness-water
6. www.mrsec.psu.edu7. people.cedarville.edu8. http://www.gewater.com/handbook/ext_trea
tment/ch_7_precipitation.jsp#Cold lime softening
Book: (Retrieved: Jan 19,13)1. Austin, G. T. (1984). Shreve’s
Chemical Process Industries, 5th ed.McGraw-HillCompany. Singapore.