e-view-alation–alarge-scaleevaluationstudyof
TRANSCRIPT

E-VIEW-alation – a Large-scale Evaluation Study ofAssociation Measures for Collocation Identification
Stefan Evert1, Peter Uhrig1, Sabine Bartsch2, Thomas Proisl11Friedrich-Alexander-Universität Erlangen-Nürnberg
2Technische Universität DarmstadtE-mail: [email protected], [email protected], [email protected], [email protected]
AbstractStatistical association measures (AM) play an important role in the automatic extraction of collocations andmultiword expressions from corpora, but many parameters governing their performance are still poorly understood.Systematic evaluation studies have produced conflicting recommendations for an optimal AM, and little attentionhas been paid to other parameters such as the underlying corpus, the size of the co-occurrence context, or theapplication of a frequency threshold.Our paper presents the results of a large-scale evaluation study covering 13 corpora, eight context sizes, fourfrequency thresholds, and 20 AMs against two different gold standards of lexical collocations. While the optimalchoice of an AM depends strongly on the particular gold standard used, other parameters prove much morerobust: (i) small co-occurrence contexts are better than larger spans, and the best results are usually obtainedfrom syntactic dependencies; (ii) corpus quality is more important than sheer size, but large Web corpora proveto be a valid substitute for the British National Corpus; (iii) frequency thresholds seem to be unnecessary inmost situations, as the statistical AMs successfully weed out rare and unreliable candidates; (iv) there is littleinteraction between the choice of AM and the other parameters.In order to provide complete evidence for our observations to readers, we created an interactive Web-basedapplication that allows users to manipulate all evaluation parameters and dynamically updates evaluation graphsand summaries.
Keywords: collocations; association measures; evaluation; multiword expressions; visualization
1. Introduction
Traditionally, the identification of collocations and other types of lexicalized multiwordexpressions (MWE) has been based on co-occurrence data quantified by statistical associ-ation measures (AM). A typical extraction pipeline obtains co-occurrence counts (withina span of n words, within a sentence, or in a direct syntactic dependency relation) froma given source corpus. Candidates are then ranked according to their association scores,optionally filtered by various criteria, and finally presented to lexicographers or domainexperts for manual validation (Evert, 2008).
Recent work has focused on complementing AMs with other indicators for the non-compositionality (Katz & Giesbrecht, 2006; Kiela & Clark, 2013; Yazdani et al., 2015),non-modifiability (Villada Moirón, 2005; Nissim & Zaninello, 2013; Squillante, 2014)or non-substitutability (Pearce, 2001; Farahmand & Henderson, 2016) of candidate ex-pressions; on combining different information sources using machine learning techniques(Ramisch et al., 2010; Tsvetkov & Wintner, 2014); or on the extraction of a specificsubtype of MWE (Baldwin, 2005; Tu & Roth, 2011; Smith, 2014).
Statistical association remains an important component in virtually all of these ap-proaches, but our understanding of the properties of different AMs and of other parameterssuch as the size of the co-occurrence context is still incomplete. Previous evaluation stud-ies on collocation identification (cf. Section 3) leave a number of important gaps: (i) moststudies evaluate only a small range of AMs (except for Pecina, 2005); (ii) the evaluationtypically focuses on a specific subtype of MWE, so that different studies often reportcontradictory results; (iii) to date there has been no systematic analysis of the influenceof source corpus, co-occurrence context and frequency threshold.
531

In this paper, we present the results of a large-scale evaluation study aiming to fill thesegaps. Since we believe that AMs should not be tuned to a particular subtype of MWE,but rather capture a general “attraction” between words that may then be combinedwith more specific indicators such as syntactic flexibility, our gold standard is based onthe broad and intuitive notion of lexical collocations (see Section 2). We draw on twodifferent English collocation dictionaries in order to assess the robustness of evaluationresults. We evaluate 20 association measures, 13 corpora, eight co-occurrence contextsand four frequency thresholds against the two collocation dictionaries. In order to be ableto deal with the complexity of 20× 13× 8× 4× 2 = 16,640 parameter combinations, weintroduce an interactive Web-based viewer for evaluation graphs.1
2. Lexical collocations
Lexical collocations – salient co-occurrences of two lexical items (for a full definition andliterature review, see Bartsch, 2004) – form a subtype of the larger family of lexicalizedMWE and are notoriously difficult to delineate due to the fuzzy nature of the linguis-tic relation between their constituent words (which is sometimes described as a “habit-ual” combination, or simply defined mechanistically in terms of recurrence; e. g. Firth,1957; Sinclair, 1966). In contrast to many other types of MWEs, lexical collocations aremore susceptible to regular syntactic alternations. They are, furthermore, semanticallytransparent to a large degree, although many collocations carry additional, often domain-specific meanings. Examples of lexical collocations are argue + plausibly, attempt + thwartand measure(s) + coercive.
Our evaluation operationalizes lexical collocations as combinations of two lexical words.We assume that larger combinations such as in a certain measure can easily be recognizedbased on a two-word nucleus (measure + certain) by a lexicographer working with acorpus-based list of candidates, or generated by an automatic MWE extraction pipelinefrom the same nucleus.
Since the early days (Sinclair, 1966), the automatic identification of lexical collocationshas relied primarily on the co-occurrence frequency of the words in question within a givencontext window. This window is typically defined as a surface span of 3 to 5 words tothe left and right, but other span sizes have been employed in collocation studies rangingfrom one-word spans to entire sentences. Some authors define lexical collocations as asyntactic phenomenon (Bartsch, 2004), which suggests a co-occurrence context based ondirect syntactic dependency relations, requiring a parsed corpus. After data extraction,researchers often apply a frequency threshold (e. g. f ≥ 5) to filter the co-occurrence data.Finally, candidates are ranked according to a statistical association measure based on thejoint and marginal frequencies of each word pair; more than 50 different measures havealready been proposed in the literature (Pecina, 2005).
3. Related work
A typical approach to assessing the quality of a collocation extraction method is to ex-tract a ranked list of collocation candidates and to manually identify the number of true
1 Since some parameter combinations are not feasible (e. g. because a high frequency threshold does notleave enough candidates for the evaluation), the actual number of evaluation settings in our experimentsand in the viewer is 12,860.
532

collocations among the n highest ranking candidates. This methodology is adopted, forexample, by Seretan & Wehrli (2008) who compare their syntax-based extraction methodwith a window-based approach by manually annotating 250 candidates taken from thetop 0%, 1%, 3%, 5% and 10% of the candidate lists for each of the four languages and twoapproaches they are looking at. Disadvantages of this evaluation methodology are that itis impossible to determine recall and that it is difficult to add new approaches or associa-tion measures to the evaluation since that would require additional manual annotation ofthe new candidate lists (consequently, Seretan & Wehrli, 2008 only report precision andfocus on a single association measure, log-likelihood).
Another approach, introduced by Evert & Krenn (2001), focuses on a fixed set of truecollocations and on the one hand allows us to determine precision and recall for arbitrarilylarge n-best lists of candidates and on the other hand makes it easy to add new associationmeasures or extraction strategies to the evaluation. Results for this approach to evaluationof collocation extraction are usually given in the form of precision-recall curves. This isthe approach taken, for example, by Pearce (2002) whose evaluation is based on 4,152multiwords from the New Oxford Dictionary of English or by Pecina (2005) who evaluatesa wide range of AMs based on more than 2,500 collocational dependency bigrams. Pecina& Schlesinger (2006) and Pecina (2010) also calculate the mean average precision forrecall values between 0.1 and 0.9 to arrive at a single evaluation score. Kilgarriff et al.(2014) do not use precision-recall curves but report precision, recall and F5-scores (givingmore weight to recall) for different combinations of parameter settings such as AM, sizeof the n-best candidate lists or frequency thresholds based on 5,327 collocations for 102headwords for English and 4,854 collocations for 100 headwords for Czech.
A related approach to evaluation treats collocation extraction as a classification task anduses a test set consisting of true collocations and non-collocations, reporting the usualmetrics of precision, recall and F -score. This is the approach taken, for example, byKaran et al. (2012) who evaluate machine learning models for collocation extraction forCroatian based on a test set of 84 collocations and 450 non-collocations.
Finally, there are also approaches that focus on a qualitative evaluation instead of aquantitative one. Wermter & Hahn (2006), for example, compare ranked candidate listsby looking at the true positives and true negatives in the upper and lower half of thecandidate lists.
Most of these studies focus on a particular system for collocation or MWE identification,on the comparison of different AMs and the effect of linguistic filters, or on optimizingextraction quality with the help of machine learning. To our knowledge, no systematiccomparative study of the influence of source corpus and co-occurrence context has beenpublished so far.
4. Data and methods4.1 Gold standard
We adopt the evaluation methodology of Evert & Krenn (2001) and Pecina (2005), usingprecision-recall graphs in order to visualize and compare the distribution of true pos-itives in candidate lists ranked according to different AMs. As has been explained inSection 2, lexical collocations are operationalized as pairs of lexical words (nouns, verbs,
533

adjectives and adverbs). Since most such collocations are combinations of lexemes ratherthan specific word forms, all word pairs are lemmatized. We do not distinguish betweenhomographs with different parts of speech (e. g. the noun attempt vs. verb to attempt)because one of the two sources for our gold standard does not provide POS information.2
Because of the wide scope of our study and the large number of parameter combinationsto be considered, manual annotation of candidate sets extracted from the corpus – asrecommended by Evert & Krenn (2001) – is not feasible. Instead, we follow Pearce (2002)in using a fixed set of known collocations as a gold standard. We obtained this goldstandard from two specialized collocation dictionaries:
BBI = The BBI Combinatory Dictionary of English (Benson et al., 1986);OCD = Oxford Collocations Dictionary for students of English, 2nd edition (McIntosh
et al., 2009).
Since BBI is not available in machine-readable form, we selected a set of 203 node wordsbased on various criteria (words sampled from different frequency bands, words known tohave interesting collocational patterns, at least 4 collocates in the two dictionaries). Foreach of the 203 nodes, all lexical words were manually transcribed from the correspondingentries in BBI and lemmatized.
Figure 1: BBI entries corresponding to the node lemma measure in our gold standard
Consider the lemma measure as an example. Since we do not distinguish between differentPOS categories, collocates are collected from three entries in the BBI dictionary (for thenoun measure, the verb measure and the plural noun measures), as shown in Figure 1. Ourannotators identified 26 lemmas of lexical words in these entries, yielding the followingcollocates ofmeasure in the BBI gold standard: carry, certain, coercive, compulsory, cubic,draconian, drastic, dry, emergency, extreme, good, harsh, liquid, make, metric, preventive,prophylactic, radical, safety, security, stern, stopgap, stringent, take, tape, temporary.
The corresponding OCD collocations were extracted from an electronic version of thedictionary, using the same strategy as Uhrig & Proisl (2012). In this way, we found a totalof 2,845 lexical collocations for our 203 node lemmas in the BBI, and 18,545 in the OCD.We refer to these sets as the BBI and OCD gold standard below.
2 A second reason is that the Web1T5 n-gram database does not include POS tagging; application ofan off-the-shelf tagger is impossible because the underlying text corpus is not publicly available.
534

BBI was selected in a previous study (Bartsch & Evert, 2014) as a dictionary dating fromthe pre-corpus age. Unlike more recent collocation dictionaries, it can safely be assumedto be free of any bias in favour of a particular corpus or collocation extraction method.There are some limitations – due to the time of its compilation, its relatively small size andscope, as well as the heterogeneity of entries3 – which have to be taken into considerationwhen interpreting the evaluation results.
4.2 Corpus data and parameters
We extracted co-occurrence data from the 13 corpora listed in Table 1, ranging in sizefrom small, relatively clean corpora such as the British National Corpus (BNC) of 100million words to huge Web corpora of up to 16 billion words (joint Web corpus = ENCOW+ WebBase + ukWaC + Wackypedia). The corpora cover a wide diversity of text types:a balanced sample (BNC), movie subtitles (DESC), newspaper data (Gigaword), ency-clopaedia articles (Wackypedia), Web corpora (ukWaC, WebBase, UKCOW, ENCOW).In addition, we included n-gram databases derived from Web text (Web1T5) and scannedbooks (Google Books), which can also be used to obtain co-occurrence data (Evert, 2010).All corpora except for Web1T5 include POS tagging and lemmatization.
Corpus SizeBritish National Corpus (BNC) 0.1 GEnglish movie subtitles (DESC) 0.1 GWackypedia subset (WP500) 0.2 GWackypedia (Wiki) 1 GukWaC 2 GGigaword newspaper corpus 2 GWebBase 3 GUKCOW 4 GENCOW 10 GJoint Web 16 GGoogle Books BrE 50 GGoogle Books 500 GGoogle Web 1T5 1000 G
Table 1: Source corpora for the evaluation study. Sizes are specified in billion tokens
We extracted candidate collocations for the 203 node words using different co-occurrencecontexts:
• direct syntactic relations;• surface span of 1, 2, 3, 5 and 10 words;4• sentence context.
We used the efficient and robust C&C parser (Clark & Curran, 2004) to extract syntac-tic dependencies from all corpora. For Google Books, we used the dependency bigrams
3 In addition to lexical collocations proper, the BBI entries include phenomena ranging from fixedmultiword units to combinations that might rather be described as colligations.
4 Following Evert (2008), we denote these spans as L1/R1, L2/R2, etc. For example, a L2/R2 spanincludes two words to the left and two words to the right of each occurrence of the node word.
535

included in the database; syntactic context is not available for the Web1T5 n-grams. Forsurface spans, care was taken to obtain valid co-occurrrence counts and marginal frequen-cies as mandated by Evert (2008), using the UCS toolkit.5 Note that 5- and 10-wordspans are not available for the Google Books and Web 1T5 n-grams. In order to keepthe amount of data manageable, potential collocates were restricted to a set of 37,437general English words.6 Even so, sets of up to five million candidate pairs were obtainedfor the 203 node lemmas, depending on corpus and context size (cf. Table 2). Optionally,frequency thresholds were used to pre-filter the candidates.
Candidate sets were then ranked according to 20 different association measures. In ad-dition to measures recommended by Evert (2008), we included the asymmetric ∆P thathas recently become popular in the corpus linguistics community (Gries, 2013). We eval-uated the “forward” ∆P2|1 and the “backward” ∆P1|2 version of the measure, as wellas two symmetrical variants. See Appendix A for a complete listing with equations andreferences.
4.3 Evaluation methodology
Like Evert & Krenn (2001) and Pecina (2005), we pool the candidate collocations ex-tracted for all 203 nodes into a single set (for a given combination of corpus, co-occurrencecontext and frequency threshold), which is then ranked according to one of the 20 AMs.In addition, candidates are marked as true positives (TP) or false positives (FP) by com-parison with either the BBI or the OCD gold standard.
After setting a cutoff threshold to obtain an n-best list of highest-ranked candidates, wecompute precision (P , the percentage of TPs among the n candidates) and recall (R,the percentage of all TPs in the gold standard found in the n-best list) as quantitativeevaluation criteria. The number n of candidates is chosen arbitrarily to trade off betweenhigh precision (short n-best lists) and high recall (long n-best lists). As proposed by Evert& Krenn (2001), we visualize this trade-off by plotting precision against recall for allpossible n. An example can be seen in Figure 2 for the BNC corpus, syntactic context,and BBI as gold standard. Such P/R graphs allow a direct and detailed comparison ofdifferent AMs. For example, the solid blue line in Figure 2 shows that a ranking accordingto t-score (t) achieves a recall of 10% of the BBI gold standard (i. e. 285 of the 2,845 BBIcollocations have been found) at a precision of 20% (i. e. one in five candidates in then-best list is a true positive). The coverage of 91.6% shown at the top of the plot is theproportion of BBI collocations found among the full set of 374,239 candidates extractedfrom the BNC; this coverage corresponds to the highest recall value that can be reachedon this data set.
The “higher” a P/R graph is located in the plot, the better the ranking achieved by thecorresponding association measure. However, sometimes P/R graphs of different measuresintersect (e. g. ∆P2|1 and log-likelihood G2 in Figure 2), making it difficult to determinean unambiguous ranking. A related problem of P/R graphs is that they allow a straight-forward comparison of different association measures, but not of other parameters such
5 http://www.collocations.de/software.html6 This word list comprises the lexical nodes and collocates found in BBI and OCD entries as well as alllexical words from the CUVplus dictionary (http://ota.ox.ac.uk/headers/2469.xml). Inflected formswere lemmatised using a heuristic mapping derived from the British National Corpus.
536

0 10 20 30 40 50
010
2030
4050
60
British National Corpus [100M] | syntactic relation | gold: BBI
recall (%)
prec
isio
n (%
)
baseline = 0.70%
coverage: 91.6%
G2
MItMI2
X2
f∆P2|1
Dice
Figure 2: Precision-recall graphs for selected association measures evaluated against the BBI gold standard (BritishNational Corpus, syntactic co-occurrence context, f ≥ 1)
as source corpus and co-occurrence context (unless a single fixed association measure ischosen a priori).
For these reasons, it is desirable to introduce a composite evaluation criterion that summa-rizes the complete P/R graph into a single score. Following Pecina & Schlesinger (2006),we use average precision – corresponding to the area under a P/R graph – as a compositemeasure. Since recall points above 50% can only be achieved with unrealistically longn-best lists, we average precision values only up to 50% recall and refer to this compositemeasure as AP50.
5. ResultsFigure 2 shows striking differences between association measures. Neither log-likelihood(G2), which is popular in computational linguistics, nor t-score (t), which is popular incomputational lexicography, achieve convincing performance. Mutual Information (MI)can only be described as abysmal, partly due to the lack of a frequency threshold for thisdata set.7 The best – and almost indistinguishable – results are obtained by Pearson’schi-squared test (X2), a heuristic variant of Mutual Information (MI2) and the Dice coef-ficient.8 In the composite ranking of association measures, X2 takes first place with AP50= 24.2%, followed by Dice with 24.0%. This is particularly surprising given the widely-accepted claim that G2 is vastly superior to X2 for collocation identification (Dunning,1993).
A second striking observation is how much the evaluation results depend on which colloca-tion dictionary is used as a gold standard, even though both are targeted at the same type
7 As we will see below, frequency thresholds have little impact on the best-performing AMs, so it makessense to present the basic findings here without a frequency threshold (i. e. f ≥ 1).
8 This is particularly relevant for users of the SketchEngine (Kilgarriff et al., 2004) which uses (a rescaledversion of) the Dice coefficient for word sketches (Rychlý, 2008).
537

0 10 20 30 40 50
020
4060
80
British National Corpus [100M] | syntactic relation | gold: OCD
recall (%)
prec
isio
n (%
)
baseline = 4.66%
coverage: 94.0%
G2
MItMI2X2
f∆P2|1Dice
Figure 3: Precision-recall graphs for selected association measures evaluated against OCD gold standard (BNC,syntactic context, f ≥ 1)
of users, i. e. foreign and second language learners. Figure 3 shows an entirely differentranking of the association measures, even though corpus and co-occurrence context are thesame as in Figure 2: best results are now obtained by log-likelihood (G2, AP50 = 56.8%)and t-score (t, AP50 = 52.5%).9 These differences presumably reflect the more focusednotion of lexical collocations underlying OCD, but also its bias towards the particularassociation measures used in the compilation of the dictionary.
Using AP50 as a composite evaluation criterion, we can now study the effects of the otherparameters. For every combination of source corpus, co-occurrence context and frequencythreshold, we selected the best performing association measure and used its AP50 value asan overall score. The left-hand panel of Figure 4 compares different co-occurrence contextson the British National Corpus (f ≥ 1). For both gold standards, smaller contexts achieveconsiderably better performance, and the best results are achieved if candidate pairsmust occur in a direct syntactic relation. Similar plots for other corpora and frequencythresholds (not shown for reasons of space) reveal the same pattern, except for minimaldifferences (e. g. L1/R1 might be slightly better than L2/R2 if a frequency threshold isapplied).
The right-hand panel of Figure 4 compares results obtained on different source corpora forthe same two-word co-occurrence span (which is available for all 13 corpora), again withoutfrequency threshold (f ≥ 1). This chart shows a more intricate pattern. Summarizing, wefind that:
1. Size matters: larger corpora of the same kind (WP500 vs. full Wiki; Web corpora)perform better. However, the corpus size has to be scaled up by a factor of 10 inorder to achieve a notable improvement.
9 AP50 values are also much higher overall for OCD than for BBI. This is to be expected, though, simplybecause of the much larger number of TPs in the OCD gold standard (6.5× as many as in BBI).
538

AP 50 | f >= 1A
P50
(%
)
synt
actic
L1 /
R1
L2 /
R2
L3 /
R3
L4 /
R4
L5 /
R5
L10
/ R10
sent
ence
010
2030
4050
6070
●● ●
●●
●
●
●
● OCDBBI
AP 50 | L2/R2 span
AP
50 (
%)
BN
C
DE
SC
Gig
awor
d
WP
500
Wik
i
UK
WA
C
WE
BB
AS
E
UK
CO
W
EN
CO
W
JOIN
T
WE
B1T
5
Boo
ksG
Bm
od
Boo
ksE
Nm
od
010
2030
4050
6070
●
●
● ● ●●
●
●● ●
●
● ●
● OCDBBI
Figure 4: Left panel: Best AP50 scores achieved on the British National Corpus for different co-occurrence contexts.Right panel: Best AP50 scores achieved on different corpora with two-word co-occurrence span (L2/R2). In eachcase, the optimal AM has been selected
2. Clean, balanced samples (BNC) are better than large, messy Web corpora of thesame size. The biggest Web corpora outperform the BNC, but this requires almost100 times as much data (ENCOW: 10G words vs. BNC: 100M).
3. Movie subtitles (DESC), which are closer to spoken language and match psycholin-guistic observations (New et al., 2007), perform better than the BNC against theBBI gold standard, but much worse when evaluated against OCD.10
4. Even though n-gram databases have been compiled from huge corpora (from 50billion words for British GoogleBooks to 1 trillion words for Web1T5), they appearto be unsuitable for collocation identification.
5. There are some differences between the two gold standards, but the main observa-tions hold equally well for BBI and OCD.
Again, similar plots for other co-occurrence contexts and frequency thresholds (not shown)always reveal the same pattern.
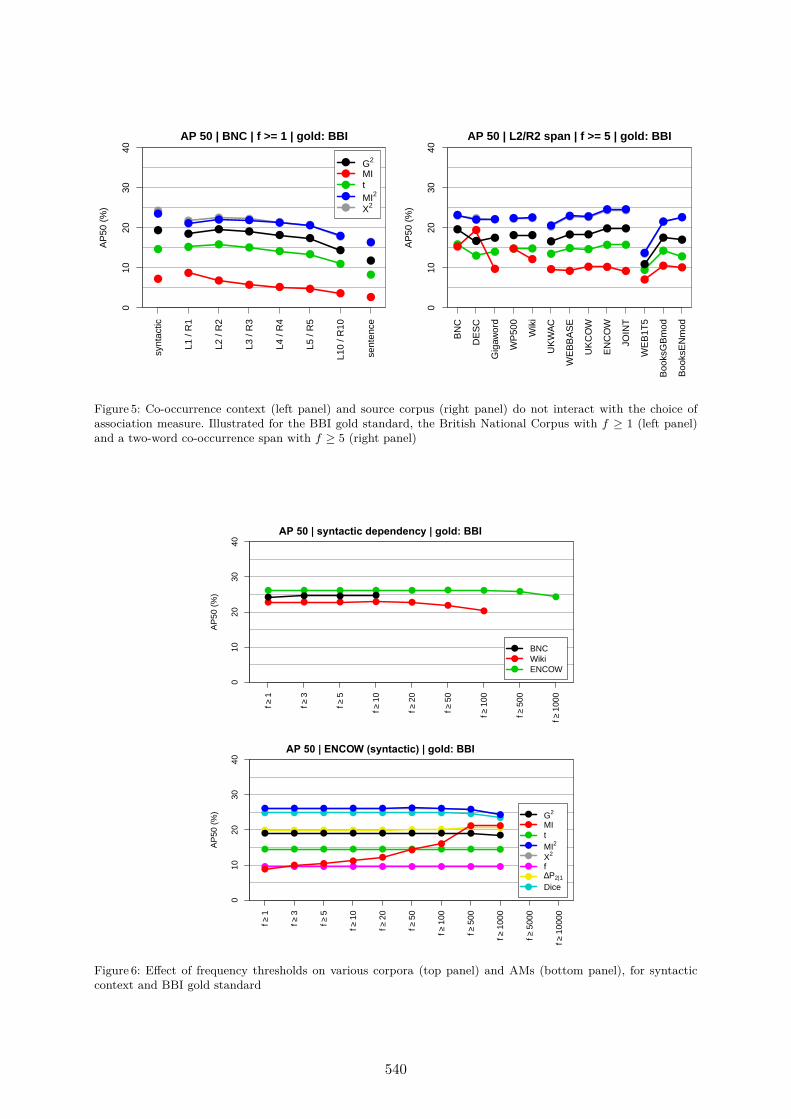
Figure 5 shows that there is virtually no interaction between the choice of AM and theother parameters (co-occurrence context and source corpus); similar patterns hold for theOCD gold standard and the other 15 AMs. The only exception is the combination of afrequency threshold with a small corpus, which improves the performance of MI (rightpanel). This has little practical relevance, though, because MI never comes close to thebest-performing measures.
One of the most surprising results of our evaluation is the negligible impact of fre-quency thresholds: apparently, the statistical measures successfully weed out unreliablelow-frequency candidates. Figure 6 compares a wide range of frequency thresholds on theBBI gold standard. The top panel shows that thresholds up to f ≥ 10 only lead to a tiny10 One possibility is that OCD in particular is focused on British English as represented in the BNC,
which provided the empirical basis for the first edition of the dictionary. British films account for only10% of the DESC corpus and the subtitle files consistently use American spelling. This would alsoexplain the lower performance of Gigaword (mostly U.S. newspapers) and WebBase (a Web corpuscompiled in the U.S., while ukWaC and UKCOW only include Web pages from .uk domains).
539
AP 50 | BNC | f >= 1 | gold: BBI
AP
50 (
%)
synt
actic
L1 /
R1
L2 /
R2
L3 /
R3
L4 /
R4
L5 /
R5
L10
/ R10
sent
ence
010
2030
40
●●
●
●
●
●● ●
●●
●
●● ● ● ●
●
● ●●
●●
●
●
●● ● ●
●
●● ●
●●
●
●●
●
●
●
●
●
●
●
●
G2
MItMI2
X2
AP 50 | L2/R2 span | f >= 5 | gold: BBI
AP
50 (
%)
BN
C
DE
SC
Gig
awor
d
WP
500
Wik
i
UK
WA
C
WE
BB
AS
E
UK
CO
W
EN
CO
W
JOIN
T
WE
B1T
5
Boo
ksG
Bm
od
Boo
ksE
Nm
od
010
2030
40
●● ●
●● ●
●
●●
●
●
●
●
●●
● ●● ●
● ●●
●
● ●
●
● ●
● ●
●
● ●
● ●
●● ●
● ●
● ●● ●
●
●
● ●● ●
●
●●
●
●●
●
●●
●
● ●●
● ●
Figure 5: Co-occurrence context (left panel) and source corpus (right panel) do not interact with the choice ofassociation measure. Illustrated for the BBI gold standard, the British National Corpus with f ≥ 1 (left panel)and a two-word co-occurrence span with f ≥ 5 (right panel)
AP 50 | syntactic dependency | gold: BBI
AP
50 (
%)
f≥1
f≥3
f≥5
f≥10
f≥20
f≥50
f≥10
0
f≥50
0
f≥10
00
010
2030
40
● ● ● ● ● ● ● ●●
● ● ● ● ●●
●
● ● ● ●
●
●
●
BNCWikiENCOW
AP 50 | ENCOW (syntactic) | gold: BBI
AP
50 (
%)
f≥1
f≥3
f≥5
f≥10
f≥20
f≥50
f≥10
0
f≥50
0
f≥10
00
f≥50
00
f≥10
000
010
2030
40
● ● ● ● ● ● ● ●●
● ● ● ● ● ● ● ● ●
● ● ● ● ● ● ● ● ●
● ● ● ● ● ● ● ●●
● ● ● ● ● ● ● ●●
● ● ● ● ● ● ● ● ●
●● ●
●●
●
●
● ●
● ● ● ● ● ● ● ● ●
●
●
●
●
●
●
●
●
G2
MItMI2
X2
f∆P2|1
Dice
Figure 6: Effect of frequency thresholds on various corpora (top panel) and AMs (bottom panel), for syntacticcontext and BBI gold standard
540
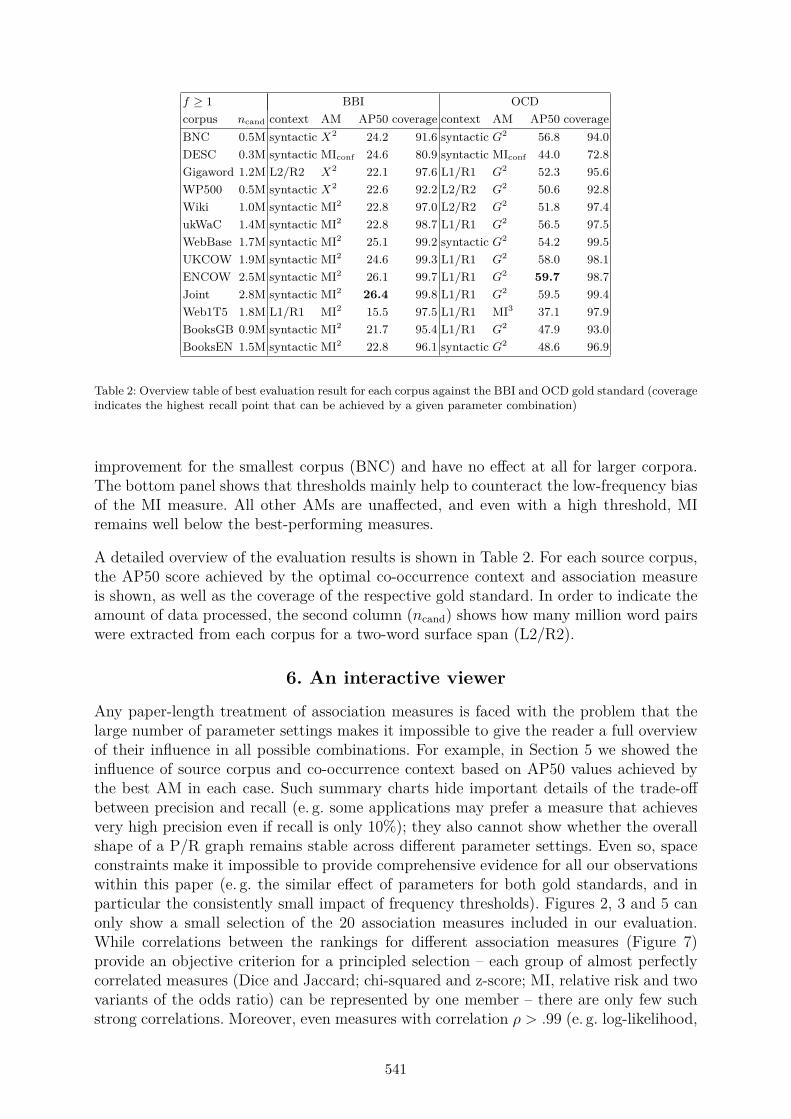
f ≥ 1 BBI OCDcorpus ncand context AM AP50 coverage context AM AP50 coverageBNC 0.5M syntactic X2 24.2 91.6 syntactic G2 56.8 94.0DESC 0.3M syntactic MIconf 24.6 80.9 syntactic MIconf 44.0 72.8Gigaword 1.2M L2/R2 X2 22.1 97.6 L1/R1 G2 52.3 95.6WP500 0.5M syntactic X2 22.6 92.2 L2/R2 G2 50.6 92.8Wiki 1.0M syntactic MI2 22.8 97.0 L2/R2 G2 51.8 97.4ukWaC 1.4M syntactic MI2 22.8 98.7 L1/R1 G2 56.5 97.5WebBase 1.7M syntactic MI2 25.1 99.2 syntactic G2 54.2 99.5UKCOW 1.9M syntactic MI2 24.6 99.3 L1/R1 G2 58.0 98.1ENCOW 2.5M syntactic MI2 26.1 99.7 L1/R1 G2 59.7 98.7Joint 2.8M syntactic MI2 26.4 99.8 L1/R1 G2 59.5 99.4Web1T5 1.8M L1/R1 MI2 15.5 97.5 L1/R1 MI3 37.1 97.9BooksGB 0.9M syntactic MI2 21.7 95.4 L1/R1 G2 47.9 93.0BooksEN 1.5M syntactic MI2 22.8 96.1 syntactic G2 48.6 96.9
Table 2: Overview table of best evaluation result for each corpus against the BBI and OCD gold standard (coverageindicates the highest recall point that can be achieved by a given parameter combination)
improvement for the smallest corpus (BNC) and have no effect at all for larger corpora.The bottom panel shows that thresholds mainly help to counteract the low-frequency biasof the MI measure. All other AMs are unaffected, and even with a high threshold, MIremains well below the best-performing measures.
A detailed overview of the evaluation results is shown in Table 2. For each source corpus,the AP50 score achieved by the optimal co-occurrence context and association measureis shown, as well as the coverage of the respective gold standard. In order to indicate theamount of data processed, the second column (ncand) shows how many million word pairswere extracted from each corpus for a two-word surface span (L2/R2).
6. An interactive viewer
Any paper-length treatment of association measures is faced with the problem that thelarge number of parameter settings makes it impossible to give the reader a full overviewof their influence in all possible combinations. For example, in Section 5 we showed theinfluence of source corpus and co-occurrence context based on AP50 values achieved bythe best AM in each case. Such summary charts hide important details of the trade-offbetween precision and recall (e. g. some applications may prefer a measure that achievesvery high precision even if recall is only 10%); they also cannot show whether the overallshape of a P/R graph remains stable across different parameter settings. Even so, spaceconstraints make it impossible to provide comprehensive evidence for all our observationswithin this paper (e. g. the similar effect of parameters for both gold standards, and inparticular the consistently small impact of frequency thresholds). Figures 2, 3 and 5 canonly show a small selection of the 20 association measures included in our evaluation.While correlations between the rankings for different association measures (Figure 7)provide an objective criterion for a principled selection – each group of almost perfectlycorrelated measures (Dice and Jaccard; chi-squared and z-score; MI, relative risk and twovariants of the odds ratio) can be represented by one member – there are only few suchstrong correlations. Moreover, even measures with correlation ρ > .99 (e. g. log-likelihood,
541

t-score and chi-squared) sometimes achieve substantially different results in the evaluation(cf. Figures 2 and 3) and should not be grouped together.11
frequ
ency
MI.c
onfM
I2M
I4M
I3 MSDice
Jacc
ard
DP.max
DP.min
DP.fwd
DP.bwd
t.sco
re
log.lik
eliho
od
chi.s
quar
ed.co
rr
z.sco
re.co
rr
odds
.ratio
.disc
odds
.ratio M
I
relat
ive.ri
sk
frequency
MI.conf
MI2
MI4
MI3
MS
Dice
Jaccard
DP.max
DP.min
DP.fwd
DP.bwd
t.score
log.likelihood
chi.squared.corr
z.score.corr
odds.ratio.disc
odds.ratio
MI
relative.risk
mean rank correlation for all conditions
0.8 0.9 1
rank correlation
Figure 7: Spearman rank correlation of different association measures, averaged over all experimental conditions
In order to remedy these problems, an interactive viewer was created to complement thepresent paper and allow the reader to explore the influence of the parameters discussedabove as well as their interactions.
Since the extraction of collocations candidates from large corpora is a very time-consumingprocess,12 all evaluation graphs have been pre-computed using the statistical software Rand exported as a set of JSON files. These files are processed further, filtered and servedthrough a REST API with the help of Perl scripts. The front-end of the viewer is writtenin JavaScript and provides a set of sliders and buttons to modify the following parameters:
1. gold standard (BBI vs. OCD2);2. corpus (see Section 4);3. co-occurrence context (syntactic relation, various spans, whole sentence);4. frequency threshold (f ≥ 1, 5, 50, 1000);13
5. association measures (select measures to be displayed at the same time).11 We believe that this surprising observation is connected to the fact that rank correlations were com-
puted over very large data sets comprising a million candidate pairs and more. Crucial differencesbetween the rankings of the relatively small number of TPs, which affect the evaluation scores directly,are lost among the rankings of many irrelevant FPs. This example shows clearly how difficult andcounter-intuitive the interpretation of correlation coefficients can be.
12 The extraction procedure ran for several weeks on a high-end server (16 cores and 256 GiB RAM).13 Since the sizes of the corpora used in this study vary by several orders of magnitude, the range of
thresholds is quite wide. Keep in mind that a threshold of f ≥ 5 in the BNC (100M words) correspondsto a threshold of f ≥ 500 in UKCOW (10G words). It might be profitable to explore thresholds relativeto corpus size in future work.
542

The full P/R graphs for the chosen parameter settings are displayed to the user and dy-namically updated as the sliders are moved. Additionally, coverage and composite AP50scores are shown. The viewer software will be made available under an open-source li-cense, including the R code for exporting suitable JSON data. An online version for theevaluation reported here can be accessed at http://www.collocations.de/eviewalation/.
7. Conclusion
The systematic evaluation of different association measures, source corpora, co-occurrencecontexts and frequency thresholds in a collocation extraction tasks fills important gaps inthe current state of research into AMs and MWE identification.
We were able to show that the carefully sampled British National Corpus is superior tocomparably-sized messy Web corpora for the identification of lexical collocations. How-ever, sufficiently large Web corpora (close to 10 billion words) achieve similarly good oreven better results than the BNC. Concerning the co-occurrence context, it was shownthat small spans deliver more accurate information than larger contexts and the mostrestricted context, i. e. syntatic dependency, is almost always the best choice. Contrary towidespread assumptions, frequency thresholds have very little effect except to counteractthe low-frequency bias of the MI measure.
The choice of an optimal AM is a more intricate problem, which depends not only on thetype of MWE to be identified (lexical collocations in our case) but also on the specificdefinition of this MWE type, embodied by the two different collocation dictionaries (BBIand OCD) in our study. For BBI, Pearson’s chi-squared statistic (X2) and MI2 yield thebest results; for OCD, log-likelihood (G2) is the optimal AM. Fortunately, performancedifferences between AMs do not interact with the other parameters: in all cases, very largeWeb corpora and small co-occurrence contexts produce the best results. It is thus validto optimize AMs independently of these parameters in future research.
Since the present evaluation builds entirely on English data, no conclusions regardingother languages can be drawn and further research is required. Nonetheless, it is to beexpected that collocation extraction for languages with a richer morphology and/or afreer word order, e. g. German or Russian, will benefit from larger window sizes and inparticular from dependency parsing. This would be in line with the results by Ivanovaet al. (2008) and Ambati et al. (2012).
8. References
Ambati, B.R., Reddy, S. & Kilgarriff, A. (2012). Word Sketches for Turkish. In N. Cal-zolari, K. Choukri, T. Declerck, M.U. Doğan, B. Maegaard, J. Mariani, A. Moreno,J. Odijk & S. Piperidis (eds.) Proceedings of the Eighth International Conference onLanguage Resources and Evaluation (LREC’12). Istanbul, TR: European LanguageResources Association, pp. 2945–2950. URL http://www.lrec-conf.org/proceedings/lrec2012/pdf/585_Paper.pdf.
Baldwin, T. (2005). Deep lexical acquisition of verb-particle constructions. ComputerSpeech and Language, 19, pp. 398–414.
Bartsch, S. (2004). Structural and Functional Properties of Collocations in English. Tübin-gen: Narr.
543

Bartsch, S. & Evert, S. (2014). Towards a Firthian Notion of Collocation. In A. Abel& L. Lemnitzer (eds.) Vernetzungsstrategien, Zugriffsstrukturen und automatischermittelte Angaben in Internetwörterbüchern, number 2/2014 in OPAL – Onlinepublizierte Arbeiten zur Linguistik. Mannheim: Institut für Deutsche Sprache, pp.48–61. URL http://ids-pub.bsz-bw.de/frontdoor/index/index/docId/2402.
Benson, M., Benson, E. & Ilson, R. (1986). The BBI Combinatory Dictionary of English:A Guide to Word Combinations. Amsterdam, New York: John Benjamins.
Church, K., Gale, W.A., Hanks, P. & Hindle, D. (1991). Using Statistics in Lexical Anal-ysis. In Lexical Acquisition: Using On-line Resources to Build a Lexicon. LawrenceErlbaum, pp. 115–164.
Church, K.W. & Hanks, P. (1990). Word Association Norms, Mutual Information, andLexicography. Computational Linguistics, 16(1), pp. 22–29.
Clark, S. & Curran, J.R. (2004). Parsing the WSJ using CCG and Log-Linear Models.In Proceedings of the 42nd Annual Meeting of the Association for ComputationalLinguistics (ACL-04). Barceona, Spain, pp. 104–111.
Daille, B. (1994). Approche mixte pour l’extraction automatique de terminologie: statis-tiques lexicales et filtres linguistiques. Ph.D. thesis, Université Paris 7.
Dunning, T.E. (1993). Accurate Methods for the Statistics of Surprise and Coincidence.Computational Linguistics, 19(1), pp. 61–74.
Evert, S. (2008). Corpora and collocations. In A. Lüdeling & M. Kytö (eds.) CorpusLinguistics. An International Handbook, chapter 58. Berlin, New York: Mouton deGruyter, pp. 1212–1248.
Evert, S. (2010). Google Web 1T5 N-Grams Made Easy (but not for the computer). InProceedings of the 6th Web as Corpus Workshop (WAC-6). Los Angeles, CA, pp.32–40.
Evert, S. & Krenn, B. (2001). Methods for the Qualitative Evaluation of Lexical As-sociation Measures. In Proceedings of the 39th Annual Meeting of the Associ-ation for Computational Linguistics. Toulouse, France, pp. 188–195. URL http://www.aclweb.org/anthology/P01-1025.
Farahmand, M. & Henderson, J. (2016). Modeling the Non-Substitutability of MultiwordExpressions with Distributional Semantics and a Log-Linear Model. In Proceedingsof the 12th Workshop on Multiword Expressions. Berlin, Germany, pp. 61–66.
Firth, J.R. (1957). A synopsis of linguistic theory 1930–55. In Studies in linguisticanalysis. Oxford: The Philological Society, pp. 1–32.
Gries, S.T. (2013). 50-something years of work on collocations: What is or should be next. . . . International Journal of Corpus Linguistics, 18(1), pp. 137–165.
Ivanova, K., Heid, U., Schulte im Walde, S., Kilgarriff, A. & Pomikalek, J. (2008). Evalu-ating a German Sketch Grammar: A Case Study on Noun Phrase Case. In N. Calzo-lari, K. Choukri, B. Maegaard, J. Mariani, J. Odijk, S. Piperidis & D. Tapias (eds.)Proceedings of the Sixth International Conference on Language Resources and Evalu-ation (LREC’08). Marrakech, MA: European Language Resources Association, pp.2101–2107. URL http://www.lrec-conf.org/proceedings/lrec2008/pdf/537_paper.pdf.
Johnson, M. (1999). Confidence intervals on likelihood estimates for estimating associationstrengths. Unpublished technical report.
Karan, M., Snajder, J. & Basic, B.D. (2012). Evaluation of Classification Algorithmsand Features for Collocation Extraction in Croatian. In Proceedings of the EighthInternational Conference on Language Resources and Evaluation (LREC-2012), Is-
544

tanbul, Turkey, May 23-25, 2012. pp. 657–662. URL http://www.lrec-conf.org/proceedings/lrec2012/summaries/796.html.
Katz, G. & Giesbrecht, E. (2006). Automatic Identification of Non-Compositional Multi-Word Expressions using Latent Semantic Analysis. In Proceedings of the ACL Work-shop on Multiword Expressions: Identifying and Exploiting Underlying Properties(MWE 2006). Sydney, Australia: Association for Computational Linguistics, pp.12–19.
Kiela, D. & Clark, S. (2013). Detecting Compositionality of Multi-Word Expressions usingNearest Neighbours in Vector Space Models. In Proceedings of the 2013 Conferenceon Empirical Methods in Natural Language Processing (EMNLP 2013). Seattle, WA,pp. 1427–1432.
Kilgarriff, A., Rychlý, P., Jakubícek, M., Kovár, V., Baisa, V. & Kocincová, L. (2014).Extrinsic Corpus Evaluation with a Collocation Dictionary Task. In Proceed-ings of the Ninth International Conference on Language Resources and Evalu-ation (LREC-2014), Reykjavik, Iceland, May 26-31, 2014. pp. 545–552. URLhttp://www.lrec-conf.org/proceedings/lrec2014/summaries/52.html.
Kilgarriff, A., Rychlý, P., Smrz, P. & Tugwell, D. (2004). The Sketch Engine. InG. Williams & S. Vessier (eds.) Proceedings of the 11th EURALEX InternationalCongress. Lorient, FR: Université de Bretagne-Sud, Faculté des lettres et des sci-ences humaines, pp. 105–115.
McIntosh, C., Francis, B. & Poole, R. (eds.) (2009). Oxford Collocations Dictionary forstudents of English. Oxford University Press, 2nd edition.
New, B., Brysbaert, M., Véronis, J. & Pallier, C. (2007). The use of film subtitles toestimate word frequencies. Applied Psycholinguistics, 28, pp. 661–667.
Nissim, M. & Zaninello, A. (2013). Modeling the Internal Variability of Multiword Expres-sions Through a Pattern-based Method. ACM Transactions on Speech and LanguageProcessing, 10(2), pp. 7:1–7:26.
Pearce, D. (2001). Synonymy in Collocation Extraction. In Proceedings of the NAACLWorkshop on WordNet and Other Lexical Resources. Pittsburgh, PA.
Pearce, D. (2002). A Comparative Evaluation of Collocation Extraction Techniques.In Proceedings of the Third International Conference on Language Resources andEvaluation, LREC 2002, May 29-31, 2002, Las Palmas, Canary Islands, Spain.URL http://www.lrec-conf.org/proceedings/lrec2002/pdf/169.pdf.
Pecina, P. (2005). An Extensive Empirical Study of Collocation Extraction Methods. InProceedings of the ACL Student Research Workshop. Ann Arbor, MI, pp. 13–18.
Pecina, P. (2010). Lexical association measures and collocation extraction. LanguageResources and Evaluation, 44(1–2), pp. 137–158. URL http://dx.doi.org/10.1007/s10579-009-9101-4.
Pecina, P. & Schlesinger, P. (2006). Combining Association Measures for CollocationExtraction. In Proceedings of the 21st International Conference on ComputationalLinguistics and 44th Annual Meeting of the Association for Computational Linguis-tics (COLING/ACL 2006), Poster Sessions. Sydney, Australia: ACL, pp. 651–658.
Pedersen, T. & Bruce, R. (1996). What to Infer from a Description. Technical Report96-CSE-04, Southern Methodist University, Dallas, TX.
Ramisch, C., Villavicencio, A. & Boitet, C. (2010). mwetoolkit: a Framework for Multi-word Expression Identification. In Proceedings of the Seventh International Confer-ence on Language Resources and Evaluation (LREC 2010). Valetta, Malta: Euro-pean Language Resources Association.
545

Rychlý, P. (2008). A Lexicographer-Friendly Association Score. In P. Sojka & A. Horák(eds.) Proceedings of Recent Advances in Slavonic Natural Language Processing(RASLAN 2008). Brno: Masaryk University, pp. 6–9.
Seretan, V. & Wehrli, E. (2008). Multilingual collocation extraction with a syntacticparser. Language Resources and Evaluation, 43(1), pp. 71–85. URL http://dx.doi.org/10.1007/s10579-008-9075-7.
Sinclair, J.M. (1966). Beginning the Study of Lexis. In C.E. Bazell, J.C. Catford, M.A.K.Halliday & R.H. Robins (eds.) In Memory of J. R. Firth. London: Longmans, pp.410–430.
Smith, A. (2014). Breaking Bad: Extraction of Verb-Particle Constructions from a ParallelSubtitles Corpus. In Proceedings of the 10th Workshop on Multiword Expressions(MWE). Gothenburg, Sweden, pp. 1–9.
Squillante, L. (2014). Towards an Empirical Subcategorization of Multiword Expressions.In Proceedings of the 10th Workshop on Multiword Expressions (MWE). Gothenburg,Sweden, pp. 77–81.
Tsvetkov, Y. & Wintner, S. (2014). Identification of Multiword Expressions by CombiningMultiple Linguistic Information Sources. Computational Linguistics, 40(2), pp. 449–468.
Tu, Y. & Roth, D. (2011). Learning English Light Verb Constructions: Contextual orStatistical. In Proceedings of the ACL 2011 Workshop on Multiword Expressions:From Parsing and Generation to the Real World. Portland, OR.
Uhrig, P. & Proisl, T. (2012). Less hay, more needles – using dependency-annotatedcorpora to provide lexicographers with more accurate lists of collocation candidates.Lexicographica, 28(1), pp. 141–180.
Villada Moirón, M.B. (2005). Data-driven identification of fixed expressions and theirmodifiability. Ph.D. thesis, Rijksuniversiteit Groningen.
Wermter, J. & Hahn, U. (2006). You Can’t Beat Frequency (Unless You Use Linguis-tic Knowledge) – A Qualitative Evaluation of Association Measures for Collocationand Term Extraction. In ACL 2006, 21st International Conference on Computa-tional Linguistics and 44th Annual Meeting of the Association for ComputationalLinguistics. Sydney, Australia. URL http://aclweb.org/anthology/P06-1099.
Yates, F. (1934). Contingency tables involving small numbers and the χ2 test. Supplementto the Journal of the Royal Statistical Society, 1, pp. 217–235.
Yazdani, M., Farahmand, M. & Henderson, J. (2015). Learning Semantic Composition toDetect Non-compositionality of Multiword Expressions. In Proceedings of the 2015Conference on Empirical Methods in Natural Language Processing (EMNLP 2015).Lisbon, Portugal, pp. 1733–1742.
A. Association measures
The listing below details the complete list of statistical association measures included inour evaluation. Equations are specified using the notation of Evert (2008):
546

expected frequencies observed frequencies
collocate ¬collocate collocate ¬collocate
node E11 = R1C1
NE12 = R1C2
Nnode O11 O12 = R1
¬node E21 = R2C1
NE22 = R2C2
N¬node O21 O22 = R2
= C1 = C2 = N
Oij = contingency table of observed frequenciesO11 = observed co-occurrence frequencyEij = contingency table of expected frequenciesE11 = expected co-occurrence frequencyRi = row sums of the contingency tableR1 = marginal frequency of nodeCj = column sums of the contingency tableC1 = marginal frequency of collocateN = sample size
• log-likelihood (Dunning, 1993)
G2 = 2∑ij
Oij log Oij
Eij
• chi-squared test (with Yates’s correction)
X2 =N(|O11O22 −O12O21| − N
2
)2
R1R2C1C2
• t-score (Church et al., 1991)
t = O11 − E11√O11
• z-score (with Yates’s (1934) correction)
z =O11 − E11 ± 1
2√E11
• co-occurrence frequencyf = O11
547

• mutual information (Church & Hanks, 1990)
MI = log2O11
E11
• MIk (Daille, 1994)
Mk = log2(O11)kE11
for k = 2, 3, 4
• conservative MI (Johnson, 1999)
MIconf, α = log2 min {µ > 0
∣∣∣ e−µE11∞∑
k=O11
(µE11)kk! ≥ 10−5
}
• Dice coefficientDice = 2O11
R1 + C1
• Jaccard coefficientJaccard = O11
O11 +O12 +O21
• minimum sensitivity (Pedersen & Bruce, 1996)
MS = min{O11
R1,O11
C1
}• log odds ratio (with optional discounting)
log θ = log O11O22
O12O21
log θdisc = log(O11 + 1
2)(O22 + 12)
(O12 + 12)(O21 + 1
2)
• log relative riskr = log O11C2
O12C1
• forward or backward Delta P (Gries, 2013)
∆P2|1 = O11
R!− O21
R2
∆P1|2 = O11
C!− O12
C2
• symmetrical Delta P
∆Pmin = min{∆P2|1, ∆P1|2
}∆Pmax = max
{∆P2|1, ∆P1|2
}
548

B. Set of node lemmas
The following 203 lemmas were used as node words in our evaluation experiments: abor-tion, accountant, achievement, act, advantage, affair, allocation, amusement, appetite,argue, art, artery, assault, attempt, authority, back, bag, balance, ban, basket, battery, bat-tle, beach, bean, beat, beef, beg, bend, bent, biology, blast, bomb, bone, boot, break, broth,brother, bulb, bulletin, burst, cancer, carbon, care, cell, chain, chance, change, charac-ter, check, chess, chief, child, citizen, claim, clean, cleaner, cliff, close, cold, collabora-tion, commitment, confinement, consequence, cooking, cord, cotton, crime, criminal, cry,cupboard, cut, decision, deny, diet, director, door, draft, dressing, drunk, earth, elbow,enforce, environment, error, examination, executive, fee, feedback, fellowship, fever, fin,finger, fist, fitness, flow, fly, force, forgive, foundation, fund, funeral, garlic, gas, gender,gene, get, go, goal, gown, harm, havoc, head, health, heater, heating, heaven, heed, her-nia, high, hotel, humanity, hygiene, injury, inmate, insight, intercourse, jam, juice, kick,know, lapse, letter, light, line, majority, malice, maniac, measure, measurement, meat,mechanic, membrane, minister, mother, move, nail, negligence, open, paint, pan, par-don, pay, pie, pipe, place, plague, plant, plantation, plead, pool, power, prime, problem,progress, query, question, quilt, race, radio, range, remark, representation, resuscitation,right, sauce, say, sentence, set, shake, shotgun, shoulder, soda, spirit, state, steel, storm,syllable, take, thirst, time, toss, trample, trial, triangle, tune, ulcer, universal, vacuum,vein, way, weapon, wiper, wire
This work is licensed under the Creative Commons Attribution ShareAlike 4.0 Interna-tional License.
http://creativecommons.org/licenses/by-sa/4.0/
549