e-training on compilation of sut in africa
TRANSCRIPT

E-TRAINING ON COMPILATION OF SUT IN AFRICA
ACS/ESNA2017
Session 1: Overview of 2008 SNA

Economic Commission for Africa
www.uneca.org
Content of the presentation
1. The 2008 SNA
• What is SNA
• SNA general principles
• The purposes of national accounts
• Uses of national accounts
• Towards the 2008 SNA
• The era of international guidelines
• Structure of SNA
• Boundaries of SNA
2. Accounts
3. Supply and use tables
4. Main changes of 2008 SNA

Economic Commission for Africa
www.uneca.org
What is SNADefinition:
• SNA is the internationally agreed standard set of recommendations on how to compile measures of economic activity in accordance with established accounting conventions based on economic principles.
• The accounting framework of the SNA allows economic data to be compiled and presented in a format that is designed for purposes of economic analysis, decision taking and policymaking
What are National Accounts
• Much beyond GDP
• A set of macroeconomic accounts that provides a comprehensive view of a country’s economy
– production, income and expenditure activities of the institutional sectors (government, corporations and households) of the nation, as also their relations with the external sector
Compilation document
• System of National Accounts, 1993 and 2008

Economic Commission for Africa
www.uneca.org
SNA: General Principles
• SNA: General Principles
– Comprehensive -all designated activities are covered and a great mass of detailed information lays “beneath”;
– Consistent - the same values are used for recording all sides of a single action;
– Integrated, because all consequences of single action are captured in the accounts and balance sheets, in such a way that together they constitute a closed system
Opening balance sheet + Transactions + Changes due to revaluation + Other changes in the volume of assets = Closing balance sheet

Economic Commission for Africa
www.uneca.org
The purposes of national accounts
• The SNA is the central statistical framework that must be used as the coordinating framework for all other statistics so as to obtain consistent definitions, and hence data.
• Various purposes:
– Business cycle analysis
– Economic structure and productivity
– Is the framework used for economic forecasting
– Fiscal policy
– Welfare
– International comparisons

Examples of uses of national accounts for economic policy
NATIONAL ACCOUNTS INDICATORS POLICY USES
Agricultural accounts with data on farmer income
Agriculture policy
Growth of particular types of manufacturing or service industries using the input-output tables or data on value added by type of activity
Industrial policies
Government deficit and debt as a percentage of GDP
Monetary policy and public finance
Economic growth, expenditure on Research and Development as percentage of GDP
Productivity and growth policy
Expenditure on defense as a percentage of GDP
Defense policy
Social protection statistics closely linked to national accounts concepts
Social policy
Regional gross value added (GVA ) per capita; regional households consumption per capita
Regional policy for granting regional funds
GDP per capita Used to identify countries that need development funds and to establish measurements for poverty reduction
Satellite accounts: health, tourism, environments
Economic policy in the specific domain

Economic Commission for Africa
www.uneca.org
Towards the 2008 SNA
The roles and uses of the national accounts have developed over time and have been stimulated by major events, like the economic crisis in the thirties, the Second World War and European unification.
Answers to the questions:
• Production and/or distribution matters?
• Does government produce?
• Are services relevant?
• What production and income arises from financial activities?
• How to show changes over time? How to compare over nations?
• Can national accounts say something about wellbeing (environment, natural resources, sustainability…)?

Economic Commission for Africa
www.uneca.org
The era of the international guidelines (1950- ...)
Year Event 1947 Technical report by the UN containing recommendations; including
the famous annex by Stone: the first detailed and fully worked national accounting system
1951-1953 First generation of international guidelines: OEEC guidelines of 1951 and 1952; UN guideline of 1953 (SNA53); very simple tables and accounts
1968-1970 Second generation of international guidelines: UN guideline of 1968 (SNA68), the European guideline of 1970 (ESA70) and the Material Product System of 1969 (MPS69) for communist countries
1993-1995 Third generation of international guidelines: joint guideline of 1993 by the international organizations (SNA93 by UN, IMF, World Bank, OECD and EC) and the European guideline of 1995 (ESA95)
2008-2010 Fourth generation of international guidelines: updates of the joint and European guidelines (SNA08 and ESA10)

Economic Commission for Africa
www.uneca.org
Structure of SNA
• The SNA can broadly be summarised under:
a) categories, classifications and accounting rules (tools of SNA)
b) central framework (the accounts)
c) volume measures and measures in real terms; population and employment tables, and
d) Flexibility
• SNA answers to:
• Who takes action in the economy?
• What do they do?
• Why do they take action?
• How are the actions known?
9

QUESTION
EXPLANATION
THE 2008 SNA CONCEPTS
Who?
Refers to the economic agents (institutions, firms, individuals) that perform activities in the economy.
Institutional units Institutional sectors Total economy and the rest of the world
What?
Refers to the transactions and other flows and stocks, which are the objects of the economy.
Transactions and other flows Assets and liabilities Products and producing units
Why?
Refers to the reason why an economic agent takes an action
Classifications by purposes of expenditure
How?
Refers to the recording of who, what and why.
Accounting rules: – recording – time of recording – valuation – consolidation and netting

Economic Commission for Africa
www.uneca.org
Who: Economic Units (1/6)
• National economy consists of all the economic units which are resident in the economic territory of a country.
• National accounts comprise all transactions within a time period between the economic agents of the economy and their stocks
– Residency principle decides which economic agents belong to the economy
• Institutional units with center of economic interest in the economic territory of the country
• Center of economic interest is indicated by place of production activity for a long period of time, generally over one year
• Economic territory is the geographic area under the effective control of a single government
11

Economic Commission for Africa
www.uneca.org
Who: Economic Units (2/6)
• Institutional Unit—Definition
– Capable of owning goods and assets,
– Incurring liabilities,
– Engaging in economic activities and transactions with other units
– In its own right
• Types of Institutional Units
– Legal entities
• Corporations
• Non-profit institutions
• Government units
– Households

Economic Commission for Africa
www.uneca.org
Who: Economic Units (3/6)• S1: Total economy
– S11: Financial corporations, principally engaged in
• financial intermediation and auxiliary financial activities
– S12: Non-financial corporations, principally engaged in
• production of market goods and non-financial services
– S13: General government, principally engaged in
• production of non-market products and in redistribution of income and wealth
– S14: Households, consists of
• all physical persons in the economy. Principal economic functions are laboursupply, final consumption, and production of selected market products
– S15: Non-profit institutions serving households, principally engaged in
• production of non-market services for households. Main resources are voluntary contributions from households.
• S2: Rest of the world
– Not a real sector. The rest of the world account presents all transactions between residents and non-residents

Economic Commission for Africa
www.uneca.org
WHO? : Institutional sectors (4/6)
The allocation of a unit to an institutional sector is based on the following questions:
– Is the unit resident?
– Is it a household, institutional household (ex. a hospital) or a legal unit?
– Is the unit a non-market or market producer?
– Is the unit controlled by the government?
– Does the unit provide financial services?
– Is the unit foreign-controlled?

Economic Commission for Africa
www.uneca.org
Who ?: Enterprise (5/6)
• An enterprise is the view of an institutional unit as a producer of goods and services .
• It can be a :
- corporation,
- a quasi-corporation,
- a non-profit institution or
- an unincorporated enterprise
• Enterprise
- With different activities : kind of activity unit (KAU)
- With different locations : local unit (LU)
- Establishment : combination of KAU and Lu is LKAU.

Economic Commission for Africa
www.uneca.org
WHO ?: Industry and main activity of enterprise (6/6)
• A group of establishments engaged in the same, or similar, kinds of activity are classified into one industry according to ISIC, Rev. 4.;
• The enterprise is the main unit for NA because it represents the institutional unit for which production accounts are prepared and value added is estimated;
• Classified based on their main activity.
• Establishing the principal activity of one enterprise engaged in two or more activities for which the output serves a market is based on the so called “top-down” method. The method operates according to the following rules:
• In case one activity accounts for more than 50% of value added, this activity determines the classification
• Activity is determined according to the ISIC class with the largest share of value added from top to bottom:
– First determine the highest classification level (1-digit)
– Then the lower (2- and 3-digit) levels
– Finally the class (4-digit level)

Economic Commission for Africa
www.uneca.org
WHAT?: Flows and stocks (1/2)• The aim of SNA accounts is to register in monetary terms the economic actions or
events that take place within a given period of time and the effect of these events on the stocks of assets and liabilities at the beginning and end of that period .
Flows
• Creation, transformation, exchange, transfer, extinction of economic value due to transactions and other events
– Refer to a period of time
– Are recorded in the accounts
– Transactions can be
• Supply (domestic production and imports)
• Use (consumption, capital formation and exports)
• Distributive (e.g. compensation of employees, interest, dividends)
• Redistributive (e.g. taxes on income and wealth, social security payments)
• Financial (e.g. deposits, shares, loans)
– Other flows that do not derive from transactions
• Volume (e.g. economic appearance of assets, catastrophic losses)
• Prices (e.g. nominal holding gains or losses)
17

Economic Commission for Africa
www.uneca.org
WHAT?: Flows and stocks (2/2)Stocks
• Positions in, or holdings of assets and liabilities, Refer to a point of time
• Recorded in balance sheets
Relationship between flows and stocks
• Stock end of period = stock at start of period + flows during period
• Flows can be:
– Transactions
– Changes in value due to changes in prices (revaluations)
– Other changes in the volume of assets
18

Economic Commission for Africa
www.uneca.org
WHY? :Purposes
For what purpose ?
The aim of a transaction or group of transactions - to satisfy a certain need.
SNA recommends using the following classifications for functional analysis :
• COICOP- Classification of the individual consumption according to purpose
• COFOG- Classification of the function of the government
• COPNI- Classification of the purposes of NPISHs
• COPP –Classification of the outlays of producers

Economic Commission for Africa
www.uneca.org
HOW? (1/4): Accounting Rules • Rules (how) of what, for whom to record and why to record.
• Accounting rules– What: Transactions and stocks that are included (boundaries, types
of transactions, classifications)
• Production boundary
• Asset boundary
– Includes holdings that are owned and from which economic benefits are derived by using or holding them over a period of time
– How: Techniques of business accounting, notably the principle of double entry; recording of transactions on an accrual basis
• Purposes: Classification of certain transactions by purpose or
function (final consumption expenditure by households, government expenditure)
20

Economic Commission for Africa
www.uneca.org
How ? (2/4): The accounting model 1.Two- side presentation
– The left side of a ‘T’ business account is called debit and the right side credit;
– In NA , the following terms are used:
– Resources for transactions which add to the amount of economic value of a unit or a sector are presented on the right side of the account;
– Uses for transactions that reduce the amount of economic value of a unit or sector are shown on the left side of the current account.
2. Double - entry principle
- ‘horizontal’ double entry :a resource in the account of one unit is the use in the account of another unit;
- ‘vertical’ double – entry: each transaction is recorded twice, as a resource and as a use. The total of resources and total of uses of an institutional unit is equal.

Economic Commission for Africa
www.uneca.org
HOW? (3/4): Time of recording
• Flows are recorded over a certain period of time; Stocks are recorded at a certain point of time.
• There are three moments when flows can take place, each of them defining a basis for the timing:• ‘Cash basis’ records cash flows at the time these payments occur;• ‘Due for payment basis’ records flows at the time they are due to be
paid;• ‘Accrual basis’ records flows at the time economic value is created,
transformed, exchanged, transferred or extinguished.• Some issues of the time of recording for the main transactions :
• The acquisition of goods are recorded when the economic ownership of those goods changes hands.
• Imports and exports of goods are recorded when change of ownership occurs – moment when they cross the border.
• Services are recorded when they are provided.

Economic Commission for Africa
www.uneca.org
How ? (4/4): Valuation
• Transactions are valued at the actual price agreed upon by the economic agents .
• The basic reference for valuation in the SNA is current market prices.
• Transaction valuation methods used in the SNA are based on more than one set of prices depending upon how taxes and subsidies on products, and also transport charges, are recorded
BASIC PRICE
+ Taxes on products excluding invoiced VAT
- Subsidies on products
= PRODUCER’S PRICE
+ VAT not deductible by the purchaser
+ Separately invoiced transport charges
+ Wholesalers’ and retailers’ margins
= PURCHASER’S PRICES

Economic Commission for Africa
www.uneca.org
Boundaries of SNA: Production boundaryProduction boundary includes the following: (a) Goods
(i) Production of goods for supply to units other than their producers; and (ii)Own-account production that is retained by their producers for own
final consumption or gross fixed capital formation; and (b) Services
(i) Individual and collective services intended to be supplied to units other than their producers,
(ii)The own-account production of knowledge-capturing products that are retained by their producers for their own final consumption or gross capital formation but excluding (by convention) such products produced by households for their own use;
(iii)Own-account production of housing services by owner-occupiers, and (iv)Domestic and personal services provided by employing paid staff.

25
Boundaries of SNA: Asset boundary
• Asset boundary is the line between those products that are retained in the economy and are used for consumption and those products that are used for capital formation.
• The asset boundary for fixed assets consists of goods and services thatare used in production for more than one year. Exclusions are (i) consumer durables and (ii) hand tools and other small and inexpensivegoods which may otherwise meet the criteria of fixed assets.
• Major improvements to existing assets (which improve their performance, increase their capacity or prolong their expected working lives) and the cost of ownership transfer of assets are included in assetboundary.
• Ordinary maintenance and repairs undertaken by enterprises to keep fixed assets in good working order are treated as intermediate consumption.

Economic Commission for Africa
www.uneca.org
Accounts: Basic Information to be Addressed in Accounts
• Who?
– Institutional units grouped into sectors, establishments, and industries
• Does what?
– Three economic activities (production, consumption, accumulation)
– Transactions/other flows
• Concerning what?
– Products
– Assets/Liabilities
• With whom?
– Counterparts
• For what purpose?
– Function/purpose
• When?
– Time of recording
• How to measure?
– Valuation, accounts in volume terms
• How does this affect stocks?
– Non-financial assets, financial assets/liabilities

Economic Commission for Africa
www.uneca.org
The Framework and structure of Accounts
Framework of accounts
– The SNA is designed to provide information about the behavior of institutional units and their activities (production, consumption and accumulation of assets)
– Each account describes a specific economic process or aspect of economic behavior
– An account is a tool which records, for a given aspect of economic life, the uses and resources or the changes in assets and the changes in liabilities and/or the stock of assets and liabilities existing at a certain time
Main structure of accounts
– Goods and services
– Sequence of accounts
• Current accounts
• Accumulation accounts
• Balance sheets
– Other accounts
• Supply and use tables
• Accounts in volume terms

Economic Commission for Africa
www.uneca.org
Goods and services account• Shows total supply and uses of goods and services in the economy at purchasers’ prices.
– Supply gross output from domestic production + imports + taxes less subsidies on products
= Uses intermediate consumption + final consumption + gross capital formation + exports
• Gross Domestic Product can be obtained from both production and expenditure approaches by shifting and subtracting intermediate consumption and imports to the other sides of supply-use balance.
Resources UsesP.1 Output 504 P.2 Intermediate consumption 284
P.11 Market output 482 P.3/P.4 Final consumption expenditure/Actual final consumption
141
P.12 Output for own use (35, 42) 7 P.31 Household final consumption expenditure 126P.13 Other non-market output (GFCE) 15 P.32 Government final consumption expenditure 15
D.21 Taxes on products 7 P.41 Actual Individual consumption (health and education)
1
D.31 Subsidies on products 0 P.42 Actual collective consumption 14
P.7 Imports of goods and services 43 P.5 Gross capital formation 0
P.71 Imports of goods 37 P.51 Gross fixed capital formation 87
P.72 Imports of services 6 P.52 Changes in inventories 3P.6 Exports of goods and services 39
P.61 Exports of goods 30P.62 Exports of services 8
Total resources 554 Total uses 554

Economic Commission for Africa
www.uneca.org
Goods and services account
• External account of goods and services
Uses Resources P.6 Exports of goods and services 39 P.7 Imports of goods and services 43
P.61 Exports of goods 30 P.71 Imports of goods 37P.62 Exports of services 8 P.72 Imports of services 6
B.11External balance of goods and services 4Total uses 43 Total resources 43

Economic Commission for Africa
www.uneca.org
Sequence of Accounts• Sequence of accounts consist
– flow accounts on production, generation, distribution, redistribution and use of income
– balance sheets record the values of stocks of assets & liabilities
• Presentation convention
– Resources on the right hand side; uses on the left
– Balancing item on the left-hand side as resources less uses
– Balancing item is carried forward as resource to next account
– Balancing items are accounting constructs of analytical interest – GDP, GNI, balance of disposable income, saving
– Balancing items can be expressed gross or net
– The difference being the consumption of fixed capital.
– Conceptually, net balancing items are much more meaningful (SNA 2.80).
– However, gross concepts, specifically gross aggregates, are widely used and
– Gross accounts are often estimated more easily, accurately and promptly than the net ones.
– In order to accommodate both solutions and to ease the integrated presentation a double presentation of balancing items is allowed
30

Economic Commission for Africa
www.uneca.org
Diagram: Integrated Accounts
Production
Opening stock• Other changes in volume of assets account
Generation, allocation, distribution, and use of
income
Closing stock
Accumulation
• Non-financial Assets • Financial assets • Liabilities • Net worth
• Net acquisitions of non-financial assets • Net acquisitions of financial assets • Net incurrence of liabilities
• Reevaluation account
• Non-financial Assets • Financial assets • Liabilities • Net worth

Economic Commission for Africa
www.uneca.org
Current Accounts
• Current accounts deal with
– Production
– Generation, distribution and
– Use of income
– Each account after the first starts with the balancing item of the previous one recorded as resources
– The last balancing item is saving - that part of income originating in production, domestically or abroad that is not used for final consumption)

Economic Commission for Africa
www.uneca.org
Accumulation accounts
• Presentation convention
– Changes in liabilities and net worth on the right-hand side, changes in assets on the left
– Balancing item on the left-hand side of capital account and on the right side of the rest of accumulation accounts
– Balancing item for both capital and financial account is net lending (+)/net borrowing (-)
– Balancing items for other accumulation accounts are analytical constructs measuring changes in net worth
• Accumulation accounts cover
– changes in assets and liabilities and changes in net worth (the difference for any institutional unit or group of units between its assets and liabilities).
– These accounts are
• capital account
• financial account
• other changes in the volume of assets account
• revaluation account
• The accumulation accounts show all changes that occur between two balance sheets.
33

Economic Commission for Africa
www.uneca.org
Balance sheets
• Reflect the levels of stocks at the beginning and at the end of the accounting period, for three categories
– financial assets and liabilities
– physical assets (fixed capital goods and inventories)
– non-financial non-physical assets (such as goodwill)
– Balance sheets present stocks of assets and liabilities and net worth
Full set of accounts including balance sheets can be compiled only for institutional units and sectors, and for the rest of the world
• For establishments and industries only production and generation of income accounts can be compiled
34

Economic Commission for Africa
www.uneca.org35
Table 1: List of integrated economic accounts Number and name of accounts Balancing item
Transaction accounts
0 Goods and services account
Full sequence of accounts for institutional sectors
Current accounts
I Production account B.1 Value added
II.1.1 Generation of income account B.2/3 Operating surplus / mixed income
II.1.2 Allocation of primary income account B.5 Balance of primary incomes
II.2 Secondary distribution of income account B.6 Disposable income
II.3 Redistribution of income in kind account B.7 Adjusted disposable income
II.4.1 Use of disposable income account B.8 Saving
II.4.2 Use of adjusted disposable income account B.8 Saving
Accumulation accounts
III.1 Capital account B.9 Net lending / net borrowing
III.2 Financial account B.9 Net lending / net borrowing
III.3 Other changes in assets account B.10 Other changes in net worth
Balance sheets
IV.1 Opening balance sheet B.90 Net worth
IV.2 Changes in balance sheet B.10 Total changes in net worth
IV.3 Closing balance sheets B.90 Net worth
Rest of the world accounts
Current accounts
V.I External account of goods and services B.11 External balance of goods and services
V.II External account of primary income and
current transfers
B.12 Current external balance
Accumulation accounts
V.III.1 External capital account B.9 Net lending/net borrowing of the nation
V.III.2 External financial account B.9 Net lending/net borrowing of the nation
V.III.3 External account for other changes in assets
Balance sheets
V.IV.3 External opening balance sheets B.90 Net external financial position of the
nation
IV.2 External changes in balance sheet B.10 Changes in net external financial
position of the nation
V.IV.3 External closing balance sheets B.90 Net external financial position of the
nation
Economic Commission for Africa
www.uneca.org
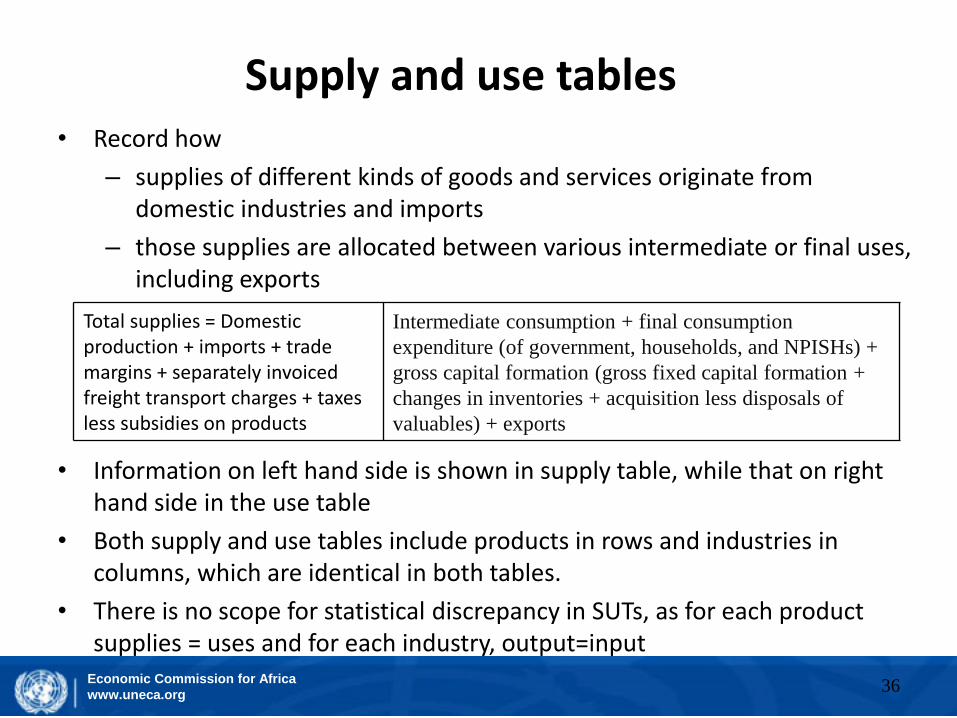
Supply and use tables• Record how
– supplies of different kinds of goods and services originate from domestic industries and imports
– those supplies are allocated between various intermediate or final uses, including exports
• Information on left hand side is shown in supply table, while that on right hand side in the use table
• Both supply and use tables include products in rows and industries in columns, which are identical in both tables.
• There is no scope for statistical discrepancy in SUTs, as for each product supplies = uses and for each industry, output=input
36
Total supplies = Domestic production + imports + trade margins + separately invoiced freight transport charges + taxes less subsidies on products
Intermediate consumption + final consumption
expenditure (of government, households, and NPISHs) +
gross capital formation (gross fixed capital formation +
changes in inventories + acquisition less disposals of
valuables) + exports

Economic Commission for Africa
www.uneca.org
Figure 1. Illustrative Supply and Use Table.
SUPPLY USES
Agr
icu
ltu
re
Min
g,M
anf,
uti
litie
s,co
nst
rn
Serv
ice
s
Tota
ld
om
.su
pp
ly
Imp
.c.i.
f.
c.i.f
./f.
o.b
.ad
just
men
t
Tota
lsu
pp
lyat
BP
Tran
spo
rtco
stan
dtr
ade
mar
gin
s
Taxe
sle
sssu
bsi
die
so
np
rod
uct
s
Tota
lsu
pp
lyat
PP
Agr
icu
ltu
re
Min
g,M
anf,
uti
litie
s,co
nst
rn
Serv
ice
s
Tota
lin
ter-
ind
ust
ryu
se
Exp
ort
s,f.
o.b
.
HFC
E/N
PIS
H
GFC
E
GC
F
Tota
luse
atP
P
(to
talf
.o.b
.)(1) (2) (3) (4)
(5)=(2)+(3)+
(4)(6)
(7)
(8)=(5)+(6)+(
7)(9) (10)
(11)=(8)+(9)+(
10)(12) (13) (14)
(15)=(12)+ (13)+
(14)
(16) (17)(18
)(19)
(20)=(15)+(16)+(17)+(18)+(1
9)
1. Agrl 3245 3245 23 3268 30 10 3308 400 450 130 980 57 2229 15 27 3308
2. Ming,Manf,utilities,constrn
5163 5163 850 6013 100 -115 5998 160205
01000 3210 513 1271 130 874 5998
3. Servs 6594 6594 94-10
6678-
130885 7433 242
1217
1362 2821 275 2456 817 1064 7433
4. c.i.f./f.o.b. dj.
-1010
0 0
5. PRA 10 10 10 10 10
6.PNRDM
-20 -20
7. Total 3245 5163 65941500
2967 0 15969 0 780 16749 802
3717
2492 7011 865 5946 962 1965 16749
37

Economic Commission for Africa
www.uneca.org
Illustrative Supply and Use Table.
SUPPLY Table
Agr
icu
ltu
re
Min
g, M
anf,
uti
litie
s,
con
strn
Serv
ices
Tota
ld
om
.su
pp
ly
Imp
.c.i.
f.
c.i.f
./f.o
.b.a
dju
stm
ent
Tota
lsu
pp
lyat
BP
Tran
spo
rtco
stan
dtr
ade
mar
gin
s
Taxe
sle
sssu
bsi
die
so
np
rod
uct
s
Tota
lsu
pp
lyat
PP
(to
tal
f.o.b
.)
(1) (2) (3) (4)(5)=(2)+(3)+(
4)(6) (7)
(8)=(5)+(6)+(7)
(9) (10)(11)=(8)+(9)
+(10)
1. Agriculture 3245 3245 23 3268 30 10 3308
2.Ming, Manf, utilities,constrn
5163 5163 850 6013 100 -115 5998
3. Services 6594 6594 94 -10 6678 -130 885 7433
4. c.i.f./ f.o.b. adj. -10 10 0 0
5. Purchases of residents abroad
10 10 10
6. Non-residents’ purchases in the economy
7. Total 3245 5163 6594 15002 967 0 15969 0 780 16749
38

Economic Commission for Africa
www.uneca.org
Illustrative Supply and Use Table.
USE table
Ag
ricu
lture
Min
g, M
anf,
uti
litie
s,
con
strn
Ser
vic
es
To
tal
in
ter-
ind
ust
ry u
se
Ex
po
rts,
f.o
.b.
Co
nsu
mp
tio
n
exp
end
iture
of
house
hold
s/N
PI
SH
Go
vt.
fin
al
con
sum
pti
on
exp
end
iture
Gro
ssca
pit
al
form
atio
n
To
tal
use
at
pu
rch
aser
s’
pri
ces
(1) (12) (13) (14)(15)=(12)+
(13)+(14)(16) (17) (18) (19)
(20)=(15)+(16)+(
17) +(18)+(19)
1. Agriculture 400 450 130 980 57 2229 15 27 3308
2. Ming, Manf, utilities,constrn
160 2050 1000 3210 513 1271 130 874 5998
3. Services 242 1217 1362 2821 275 2456 817 1064 7433
4. c.i.f./ f.o.b. adj.
5. Purchases of residents
abroad10 10
6. Non-residents’
purchases in economy-20 -20
7. IC/final use PP 802 3717 2492 7011 865 5946 962 1965 16749
8.Gross output BP 3245 5163 6594 15002
BP: basic prices;
PP: purchasers’ prices
CFC: consumption of fixed capital
NOS: net operating surplus
MI: mixed income
9. GVA at BP 2443 1446 4102 7991
Compensation of emp. 1000 700 2000 3700
Taxes less subs. on prodn. 0
CFC 240 140 410 790
NOS/MI 1203 606 1692 3501
Employment 294.2 133.8 107 535
39
Economic Commission for Africa
www.uneca.org
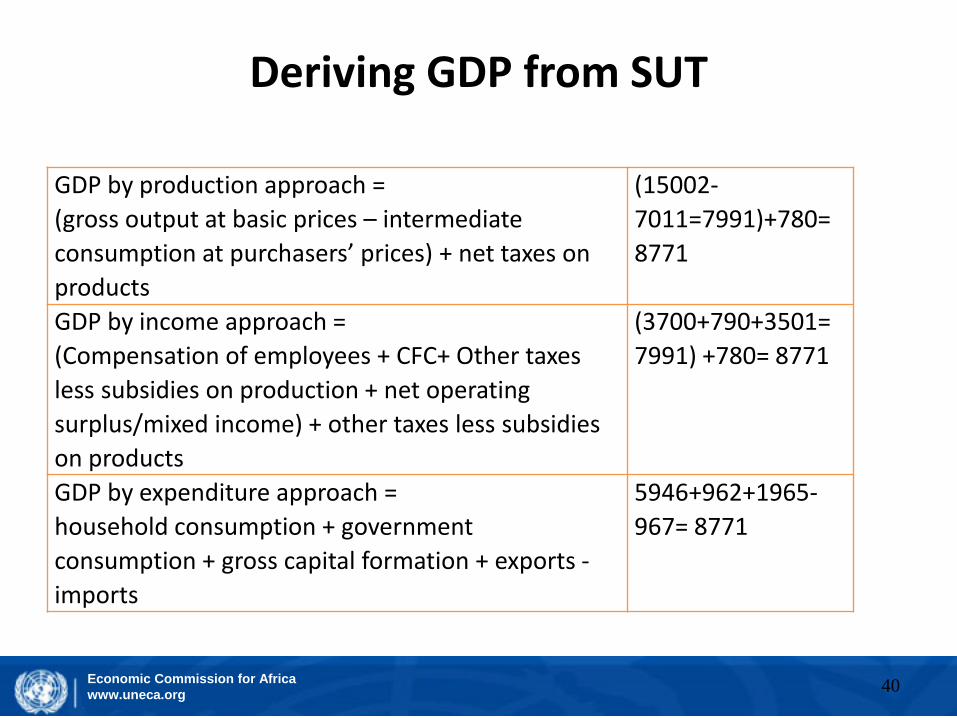
Deriving GDP from SUT
GDP by production approach =
(gross output at basic prices – intermediate
consumption at purchasers’ prices) + net taxes on
products
(15002-
7011=7991)+780=
8771
GDP by income approach =
(Compensation of employees + CFC+ Other taxes
less subsidies on production + net operating
surplus/mixed income) + other taxes less subsidies
on products
(3700+790+3501=
7991) +780= 8771
GDP by expenditure approach =
household consumption + government
consumption + gross capital formation + exports -
imports
5946+962+1965-
967= 8771
40

Economic Commission for Africa
www.uneca.org
Main changes of 2008 SNA: Changes affecting GDP
• The 2008 SNA changes that affect GDP are :
• Capitalization of Research and Development.
• Valuation of output for own final use by households and corporations to include a return to capital.
• Capitalization of expenditure on weapon systems.
• Refined Method for Calculating Financial Intermediation Services Indirectly (FISIM).
• Changes in recording of pension entitlements
41

Economic Commission for Africa
www.uneca.org42
RESEARCH AND DEVELOPMENT
• R&D is recognised as a produced asset
• In 1993 SNA acquisition or disposal of these was treated as non produced, nonfinancial assets
• Sum of costs if there is no market value
• Expenditures are no more IC
• Output of R&D capitalized as “intellectual property products”
• If it gives no economic benefit to its owner, it is treated as IC
• No more an ancillary activity, a separate unit to be established

Economic Commission for Africa
www.uneca.org43
WEAPONS SYSTEMS
• Military weapons systems such as vehicles, warships etc used continuously in the production of defence (and deterrence) services are recognised as fixed assets
• 1993 SNA recorded these as fixed assets only if they had dual civilian use and as intermediate consumption otherwise
• Some single-use items such as certain types of ballistic missiles with a highly destructive capability, but which provide on-going deterrence services, are also recognised as fixed assets in the 2008 SNA
• GDP will increase to the extent of CFC on new items included as fixed assets, because it is a government activity
Economic Commission for Africa
www.uneca.org
DATABASES
• 1993 SNA asset category “computer software” now includes databases as a sub-category in 2008 SNA
• 2008 SNA recommends treating all databases holding data with a useful life of more than one year as fixed assets
• Both databases created on own account and those for sale should be included if they meet this criterion
• Computer software and databases purchased on the market should be valued at purchasers’ prices
• Those developed in-house should be valued at their estimated basic price or at their costs of production
• 1993 SNA only “large” databases were recognized as assets.
44

Economic Commission for Africa
www.uneca.org45
CAPITAL SERVICES AND VALUATION OF OUTPUT FOR OWN FINAL USE
• Capital services for assets used in market production were implicitly included within the 1993 SNA but were not separately identified.
• Given the importance of identifying them for productivity measurement and other analysis, a new chapter has been added in the 2008 SNA explaining the role of capital services and their appearance in the accounts. Details can be presented in a supplementary table for market producers, bringing into the SNA the advances in research in recent decades in the fields of growth and productivity and helping to satisfy the analytical needs of many users.
• Valuation of output for own final use: The 2008 SNA recommends that estimates of output for own final use should include a component for the return to capital as part of the sum of costs approach when comparable market prices are not available. However no return to capital should be included for non-market producers
Economic Commission for Africa
www.uneca.org46
FISIM
• All loans and deposits included – money lending from own funds
• Output of FISIM = (rL - rr) yL + (rr - rD) yD
– loans (yL), deposits (yD), reference rate (rr), interest rates on loans and deposits rL and rD respectively
• Rate prevailing for inter-bank borrowing and lending may be a suitable choice as a reference rate
• No more a notional industry, should be allocated to user industries as intermediate consumption by enterprises or as final consumption or exports for final users
Economic Commission for Africa
www.uneca.org47
(PENSIONS) DEFINED BENEFIT SCHEMES
• 1993 SNA stated that actual social contributions by employers and employees should reflect the amounts actually paid
• 2008 SNA differs, recognising that the amounts actually set aside may not match the liability to the employees
• Therefore, recommends that the employer's contribution should reflect the increase in the net present value of the pension entitlement plus costs charged by the pension fund minus the employee's own contributions
• This change will result in a shift of income between gross operating surplus and compensation of employees and between institutional sectors (corporations/government and households)

Economic Commission for Africa
www.uneca.org
COSTS OF OWNERSHIP TRANSFER
• 1993 SNA recommended that these costs (treated as GFCF in the accounts) should be written off over the life of the related asset
• 2008 SNA instead recommends that these costs be written off over the period the asset is expected to be held by the purchaser
• Affects non-market producers’ GDP
• Only in net income for others
48
Economic Commission for Africa
www.uneca.org49
OUPUT OF N-L INSURANCE SERVICES
• Presently it is indirectly estimated as the balance of premiums, premium supplements, and claims, not suitable in cases of catastrophic losses
• 2008 SNA recommends (i) expectation, (ii) accounting and (iii) cost apps.
• Expectation approach is ex ante, Output is equal to premiums plus expected premium supplements minus expected claims
• Accounting approach: actual premiums earned plus premium supplements less adjusted claims incurred. Adjusted claims are determined by using claims due plus changes in equalization provisions and, if necessary, changes to own funds
• Cost approach is sum of costs (including intermediate costs, labour and capital costs) plus an allowance for “normal profit”
• The 2008 SNA recommends that exceptionally large claims, following a catastrophe, are recorded as capital, rather than current, transfers

Economic Commission for Africa
www.uneca.org50
OUTPUT OF CENTRAL BANKS
• Services produced by central bank are (i) financial intermediation, (ii) monetary policy services and (iii) supervisory services overseeing financial corporations.
• 2008 SNA recommends identifying separate establishments for these if they are significant, to separate them as market and non-market
• Where Central Banks lend or borrow at rates above or below the effective market lending/borrowing rate,
– A tax or subsidy from the counterpart lender/borrower to/from government to reflect the difference between the two rates should be recorded
– Correspondingly a current transfer (the counterpart to the tax/subsidy) is recorded between government and the Central Bank

Economic Commission for Africa
www.uneca.org51
GOODS SENT ABROAD FOR REPROCESSING
• 2008 SNA recommends that imports and exports are recorded on a strict ownership basis
• This means that the values of a flow of goods moving from one country (that retains ownership of the goods) to another providing processing services should not be recorded
• Only the charge for the processing service should be recorded in the trade statistics
• 1993 SNA imputed an effective change of ownership

Economic Commission for Africa
www.uneca.org
Merchanting
• Merchanting is defined as the purchase of a good by a resident (of the compiling economy) from a non-resident and the subsequent resale of the good to another non-resident, without the good entering the merchant’s economy
• 2008 SNA recommends that goods acquired by global manufactures, wholesalers and retailers and those cases of commodity dealing being settled in the commodity should be recorded as negative exports on acquisition and positive exports on disposal
• The difference between the two appears in exports of goods but appears as the production of a service in the merchant’s economy, analogous to trade margins applied to domestically traded goods
52

Economic Commission for Africa
www.uneca.org
Suggested reading material
The 2008 SNA, European Commission, IMF, OECD, UN, World Bank, 2009;
• Chapter 1: Introduction
• Chapter 2: Overview
• Annex 3: Changes from the 1993 System of National Accounts
Presentation files
– Session 1_reading material_GDP by three approaches
– Session 1_reading material_Sequence of accounts

THANKS / MERCI