e stimating the value of partner co projects “blue … · e stimating the value of partner co ......
TRANSCRIPT

1
E stimating the Value of Partner Co
ntributions to Flood Mapping
Projects “Blue Book”
Version 4.1 April 18, 2017

Blue Book|2
Contents
1. Document Revision History ........................................................................................................ 3
2. Blue Book Background and History ............................................................................................ 4
2.1 Updates to the Pricing Methodology ........................................................................................ 5
3. Overview of Pricing Approach .................................................................................................... 5
3.1 Estimating Partner Leverage ................................................................................................... 5
3.2 Understanding Unit Costs ........................................................................................................ 6
3.3 Pricing Assumptions ................................................................................................................ 7
3.4 Federal Matching Programs ..................................................................................................... 7
3.5 Blue Book Project Elements .................................................................................................... 8
4. Unit Cost Tables ......................................................................................................................... 8
Table 1. Data Leverage Table ....................................................................................................... 9
Table 2: In-Kind Services Table .................................................................................................. 18
5. Definitions ................................................................................................................................ 23
6. Acronym List ............................................................................................................................. 32

Blue Book|3
1. Document Revision History
Document Location Location Will be on FEMA.gov and the CTP Collaboration Center
Revision History Version Number Version Date Summary of Changes Team/Author 1.0 August 2006 Draft Beth Norton 1.1 November 2006 Final Beth Norton 2.0 January 2009 Draft Necolle Maccherone 2.0 January 2009 Final Necolle Maccherone 3.0 June 2011 Draft RAMPP 3.0 September 2011 Final DRAFT RAMPP 4.0 March 2017 Final DRAFT Laura Algeo 4.1 April 2017 FINAL
Approvals This document requires the approval of the following persons:
Role Name Title (CLIN/RMC) Review Date
Approved Date
Tech Review Laura Algeo CTP National Coordinator February 2017
March7, 2017
Client Distribution Name Title/Organization Location Laura Algeo CTP National Coordinator, FEMA HQ Atlanta, GA

Blue Book|4
2. Blue Book Background and HistoryIn 1999, the Federal Emergency Management Agency (FEMA) starting making strides in an effort to eliminate the backlog of outdated Flood Insurance Rate Maps. One of FEMA’s key goals was to increase local involvement in the development and long-term maintenance of its flood hazard maps. To meet this long-standing objective, FEMA created the Cooperating Technical Partners (CTP) program.
The CTP program allows state agencies, regional organizations, tribal nations, local communities, universities, and national non-profits that have the interest and capability to become active partners in FEMA’s flood hazard mapping effort. To date, over 246 partners have entered into formal agreements with FEMA to provide specific contributions to the flood hazard mapping effort for their communities. Through these partnerships, local knowledge and expertise are incorporated into the process to identify and assess flood hazards and risks in communities, and partners’ contributions are maximized to leverage Federal funding to the fullest extent possible, while consistently maintaining national standards.
To leverage further enhance the usability and value of flood hazard mapping, FEMA developed the Risk Mapping, Assessment, and Planning (Risk MAP) program. Risk MAP combines flood hazard mapping, risk assessment tools, and mitigation planning into one seamless program. The intent of this integrated program is to encourage beneficial partnerships and innovative uses of flood hazard and risk assessment data to maximize flood loss reduction. As FEMA moves forward with the Risk MAP implementation, the CTP program continues to be an essential component.
FEMA has been tracking the extent to which its mapping funds have been leveraged through the CTP program since the first partnership agreements were signed in 1999. The Blue Book, first published in 2002, is a living document. Because of changing conditions in technologies, processes, and the economy, this publication will be evaluated on a regular basis to see if updates or amendments are needed. In 2016, FEMA reviewed a range of tasks, grouping like items to create a series of unit costs by level of effort to help FEMA estimate each partner’s contribution to ongoing activities, that are indicative of the cost savings FEMA might see in production of flood hazard products (Flood Insurance Rate Map FIRM, FIRM Database, Flood Insurance Study (FIS) Report), flood risk products (Flood Risk Map, Flood Risk Database, Flood Risk Report),community outreach initiatives, and associated activities. Although the leverage of studies is generally associated with the CTP program, other partners who are not members of the CTP program can provide FEMA with flood risk and hazard-related data and thus leverage their engagement. How to Use the Blue Book FEMA’s Blue Book is a tool CTPs can use for better understanding of the value of their mapping activities contributed for Risk MAP Projects. The unit-cost approach described in this document is a normalized average from across the nation used to determine the value of a partner’s contribution. Because the actual costs associated with individual projects may vary significantly, under no circumstances should these unit costs be used to estimate the cost of individual projects. These values are very high level aggregations of multiple sources of information to be able to make a like comparison from one partner to the next as to the level of effort and resources being provided to a project. To help partners, Resources are available through FEMA’s Regional Offices to assist in estimating the cost of individual projects. Please contact the

Blue Book|5
appropriate FEMA CTP Regional Coordinator for more information (https://www.fema.gov/cooperating-technical-partners-program-key-contacts).
2.1 Updates to the Pricing Methodology Pricing was adjusted as follows:
• In 2003, unit costs were adjusted for inflation. An inflation rate of 2.2 percent was assumed andused to update the unit costs.
• In 2006, unit costs were adjusted based on the availability of additional cost data, and theupdate was not merely an adjustment for inflation.
• In 2009, new unit costs were developed for the Topographic Data Development and PerformCoastal Analysis mapping project elements.
• In 2011, input on new units and the corresponding costs was collected from FEMAHeadquarters, 10 FEMA Regional offices, FEMA’s Program Management contractor, and theProduction and Technical Services contractors. Each entity provided updates to cost data thattook into account changes in guidance applicable to the Risk MAP Program, changes intechnology, and inflation. FEMA obtained consensus from all contributors before proceedingwith the release of this document.
The 2016 update includes: • Alignment of project elements to the Project Planning and Purchasing Portal (P4) Tool,
https://p4.msc.fema.gov/• Addition of elements that are part of the flood hazard mapping process and were not previously
included• Subtraction of elements which are redundant• Separation of leverage elements based on type. Two tables are included: one for data leverage
and one for in-kind services.• Unit price data informed by updated market rates
3. Overview of Pricing Approach3.1 Estimating Partner Leverage and In-Kind Services In this update FEMA has separated the potential leverage items that a mapping partner may bring forward. The Blue Book has been updated to include two leverage tables:
Table 1 – Data Leverage Table Table 1 (Data Leverage) identifies a series of data elements and provides a range of leverage values data availability will save FEMA in the update and revision of the National Flood Hazard Inventory. The data table should be used to determine the value of data that is primarily readily available and has been prepared at local expense. CTPs should review potential leverage data using the current Guidance and Standards for Flood Risk Analysis and Mapping and assumptions included in Table 1 prior to submittal of a Mapping Activities Statement (MAS) that includes this data as leverage.

Blue Book|6
Table 2 – In-Kind Services Table The In-Kind Services Table provides a value of CTP staff and services provided in support of a project. The table includes a suggested range of values based on anticipated effort and is intended to allow CTPs to review services their staff will provide as in-kind services. CTPs should review the services performed by CTP staff in support of the project to identify the level of effort and value of in kind services using both the assumptions and range of effort identified in the right hand columns of Table 2.
This table follows the historic approach for evaluating partner contributions, originally developed for the CTP program by way of leveraged activity. This approach includes estimates of each partner’s contribution to ongoing mapping activities and the overall value of the partner’s efforts relative to FEMA’s investment in these mapping activities. The methodology uses a series of unit costs based on level of effort and applies them to the number of work units (i.e., linear miles of study) to estimate the value of various project elements in the map-production process.
Once again, the normalized cost values included in these tables should not be used for budget estimation of projects by CTPs.
3.2 Understanding Unit Costs FEMA developed the unit costs shown in Table 1 to ensure that the value of each map product reflects only the costs and efforts typically incurred by FEMA to produce engineering data, flood risk datasets and regulatory products prepared by the Risk MAP program. Partners may choose to incur costs above and beyond what FEMA would normally expend for the same activity, and these additional costs should not skew the estimate of the project’s value to FEMA. For example, a partner that plans to use the topographic data for additional purposes may choose to purchase additional data collection or processing tasks that are over and above the data and information that FEMA would normally acquire. Accordingly, the cost to collect and process such data should not be considered when evaluating the value of the topographic data.
Moreover, by using uniform unit costs, the value of partnering with communities, tribal nations, regional agencies, universities, non-profits, and State agencies can be estimated at any stage of a mapping project. FEMA can determine the extent to which it is leveraging Federal funds while projects are ongoing. This would not be the case if actual costs were used, because the full costs would not be known until the project is complete. For example, although a preliminary FIRM may have already been produced by a partner, the costs incurred will likely change as a result of appeals and/or protests.
FEMA uses the unit-cost approach (or this Blue Book) to estimate those partner contributions that will assess current flood hazard information, lead to the production of new or updated FIRMs, or other flood risk datasets. To be used and given credit, products submitted by partners must meet the requirements of FEMA’s current Guidelines and Standards for Flood Risk Analysis and Mapping (https://www.fema.gov/guidelines-and-standards-flood-risk-analysis-and-mapping). If data are submitted that do not meet the requirements of FEMA’s current Guidelines and Standards for Flood Risk Analysis and Mapping, the contribution may be devalued based on additional costs incurred by FEMA to bring those data up to specifications.
Blue Book|7
3.3 Pricing Assumptions Given the variability of unit costs across varying project complexities, the unit cost table has been setup to capture additional detail about the complexity of the project and the data being delivered. Additionally, the In-Kind Services Table has been included to breakout services that do not directly translate to a tangible data deliverable.
Each project element in the Data Leverage Table has been setup to capture a range of leverage contribution depending on the project variables. Please note the descriptions associated with the variable range along with the project element assumption when using this table to calculate leverage contributions.
All data elements for a given project may not contribute leverage at the same level. It is permissible to count leverage at the high end of the range for some elements and at the low end of the range for other elements within the same project.
The unit costs provided in the Table 1 are based on assumptions that reflect “typical” study conditions and may not accurately represent actual site-specific conditions. Under no circumstance should these unit costs be used by CTPs to estimate the cost of individual projects, nor should these tables be used to inform cost information in any MAS. These figures are intended to provide an estimate of the value of the contributions to FEMA versus incurring the actual cost incurred for the activity.
FEMA is aware that the unit costs within the table may vary across the country due to regional variability and resources constraints. For this reason, mapping partners who have historic cost information may submit to FEMA additional data for consideration in the calculation of leverage cost. Any questions about these or other unit costs should be presented to FEMA for consideration. If the inclusion of additional unit costs is warranted, FEMA will update the document. Suggestions and the associated data should be presented to FEMA for future versions of this document.
3.4 Federal Matching Programs The Federal government has several matching grant programs available to partners in which the government and the partner each agree to fund a certain percentage of the total cost of a given project. In some cases a mapping partner may request leverage credit for flood risk data prepared with other Federal funding. If a CTP submits data that were previously prepared with other federal funding, the partner will not receive 100 percent of the credit for that task, unless the task was completely non-federally funded. For example, a Federal agency and the partner may participate in an 80/20 grant program, where the Federal agency funds 80 percent of the project and the partner funds 20 percent of the project. In this example, the project entails completing field surveys for X miles. FEMA would consider the partner’s leverage to be 20 percent of the unit cost for X miles of the field-survey activity. For the purposes of the CTP program and leverage calculations for all mapping partners, only the 20 percent match would be credited for leverage.

Blue Book|8
3.5 Blue Book Project Elements Unit costs have been developed for the following mapping project elements:
• Flood Risk Project Management• Discovery Task• Discovery Outreach• Mitigation and Community Outreach• Risk Review and Resilience Outreach• Post-Prelim Outreach• DD*-Basemap• DD-Survey• DD-Topographic• DD-Terrain
• DD-Hydrology• DD-Hydraulics• DD-Coastal• DD-Levee• DD-Floodplain Mapping• Draft FIRM Database• DD-Preliminary FIRM Issuance• Post-Preliminary Processing• DD-Flood Risk Products (FRP)• Coordinated Needs Management
Strategy (CNMS) Update
4. Unit Cost TableIn this section we provide two tables for CTPs. The Data Leverage Table and the In-Kind Services Table. The cost values included in the tables below should be used for cost estimation of projects by CTPs. CTPs should be using historical costs to prepare a cost estimate for data being prepared by contractors on their behalf. Resources are available through FEMA’s Regional Offices to assist in estimating the cost of individual projects. Please contact the appropriate FEMA CTP Regional Coordinator for more information (http://www.fema.gov/plan/prevent/fhm/ctp_key.shtm)Table 1. Data Leverage Table: Indicates the value of data that is readily available and has been prepared at community/state or partner expense. Data should be reviewed at CTP expense to ensure the CTP has an adequate grasp of the data available and its agreement with the current Guidance and Standards for Flood Risk Analysis and Mapping. The table identifies the suggested range of values based on the data available and the level of effort it will save FEMA in the update and revision of the National Flood Hazard Inventory.1If a CTP wants credit for the data they are submitting, it should support a FIRM update. Data should meet standards and be readily usable if it is being submitted. Submitted costs should provide adequate back up data to determine the value for a FIRM update.
Coastal Guidance: If there is coastal Floodplain Mapping analysis that is leverage, the user should not enter it under the Floodplain Mapping purchase but in the coastal purchase.
This will make for easier reporting of miles. Any miles captured under the coastal purchase will be coastal miles and any miles captured under non-coastal purchase (e.g., floodplain Mapping) would be counted as riverine.
1 Note that prices listed are industry averages
*DD is Data Development

Blue Book|9
Table 1. Data Leverage Table Leverage
Type Project Phase
Project Element Assumptions Unit <<More Effort Less Effort>>
Data Discovery Task
Discovery
Existing data mined or previously prepared at community/state expense meets requirements for community data collection in Discovery effort. Data should provide adequate information for CTP to perform needs assessment for data development and capacity building project identification outlined in Standards for Flood Risk Analysis and Mapping (SID29).
Community
Unmapped/ Unmodernized Communities
Mix of Modernized/
Unmodernized Modernized
$1,250 $1,000 $750
Data DD-
Base Map Base Map
Base map data prepared at local/partner’s expense and (1) meets accuracy requirements outlined in Standards for Flood Risk Analysis and Mapping, (2) matches or exceeds base map information shown on the current effective FIRM, (3) is more up to date than that readily available through NAIP or TIGER data sources, (4) must be available for free distribution in support of FIRM release (no release constraints). Square Miles are computed by areas within printed panels and county/parish boundaries for update areas only.
Square Mile
Urban (Not Modernized)
Urban (Modernized)
Rural (Not Modernized)
Rural (Modernized)
$12-20 $10 $7-12 $5
Data DD- Survey
Riverine Structure
Field Survey
Field survey data for structures along flooding sources prepared at local/partner’s expense and (1) meet accuracy requirements for field survey and positional accuracy outlined in Standards for Flood Risk Analysis and Mapping, (2) match or exceed base map information shown on the current effective FIRM.
Structure
Full Field Survey meeting
requirements outlined in Technical Reference
Limited Field Survey for
Stream Crossing (Top of road, stream invert, culvert or
bridge)
As-Built Drawings or
Field Measurements/Drawings for
structures
$1,750 $1,250 $350
Data DD- Survey
Riverine Channel Field
Survey
Field survey data prepared at local/partner’s expense and (1) meet accuracy requirements for field survey and positional accuracy outlined in Standards for Flood Risk Analysis and Mapping, (2) match or exceed base map information shown on the current effective FIRM,
Cross-Section
Major Flooding Source2
Moderate Flooding Source*
Minor Flooding Source*
$1,800 $1,100 $350
2 Please refer to the Definitions Section and look at the definition for Major, Moderate and Minor Flooding Sources in Riverine Channel Field Survey

Blue Book|10
Leverage Type
Project Phase
Project Element Assumptions Unit <<More Effort Less Effort>>
and (3) include field collection of parameters needed for study (structure dimensions, photos, and sketches)
Data DD- Survey
Coastal Structure Field
Survey
Coastal structure survey data prepared at local/partner’s expense and (1) meet accuracy requirements for field survey and positional accuracy outlined in Standards for Flood Risk Analysis and Mapping, (2) match or exceed base map information shown on the current effective FIRM.
Structure
Field Survey meeting
requirements outline in Technical Reference
Field Measures (Certified by PE
or PLS)
Desktop Analysis using
As-Built Drawings
$1,750 $500 $300
Data DD- Field Survey
Coastal Transect Field
Survey
Field survey for transects prepared at local/partner’s expense and (1) meet accuracy requirements for field survey and positional accuracy outlined in Standards for Flood Risk Analysis and Mapping, (2) match or exceed base map information shown on the current effective FIRM, and (3) includes field collection of parameters needed for study (structure dimensions, photos, and sketches).
Transect
Transect Collection in Urbanized
Setting
Transect Collection in Rural Setting
Transect Collection in National or State Park
areas
$850 $500 $300
Data
DD- Topographic
Point Cloud
Leverage for either Point Cloud OR Bare Earth Digital Elevation model may be used (each of the data sets identified are equivalent starting point). Data prepared at local/partner’s expense and (1) meet accuracy requirements for field survey and positional accuracy (QL1 or QL2) outlined in Standards for Flood Risk Analysis and Mapping, and (2) QA/QC document sighting positional accuracy within the requirements outlined in the Standards for Flood Risk Analysis and Mapping must be available.
Square Mile
Rolling to Hilly Terrain Flat Terrain
$160 $135
Data
Bare Earth Digital
Elevation Model
Available
Square Mile
Rolling to Hilly Terrain Flat Terrain
$170 $90
Data DD-
Topographic
Breaklines Leverage for either Breaklines OR Checkpoint Surveys may be used (each of the data sets identified are equivalent starting point). Data prepared at local/partner’s expense and (1) meet accuracy requirements for field survey and positional accuracy outlined in Standards for Flood Risk Analysis and Mapping and (2) QA/QC document sighting positional
Square Mile
Rolling to Hilly Terrain Flat Terrain
$40 $35
Data Check Point Surveys Structure Independent of
Terrain

Blue Book|11
Leverage Type
Project Phase
Project Element Assumptions Unit <<More Effort Less Effort>>
accuracy within the requirements outlined in the Standards for Flood Risk Analysis and Mapping must be available.
$175
Data DD-
Terrain
Contours
Leverage for either Contours OR Hydroflattened DEMs may be used (each of the data sets identified are equivalent starting point). Data prepared at local/partner’s expense and (1) meet requirements outlined in Standards for Flood Risk Analysis and Mapping and (2) QA/QC should be performed by the CTP to assure that the leverage data is readily available and meets specifications.
Square Mile
Rolling to Hilly Terrain (1-2 ft.
contours)
Rolling to Hilly Terrain (3-5 ft.
contours)
Flat Terrain (1-2 ft.
contours)
$40 $35 $30
Data Hydroflattened DEMs
Square Mile
Rolling to Hilly Terrain Flat Terrain
$20 $15
Data DD- Hydrology
Statistical/ Historical Analysis
Hydro data should (1) use engineering approaches outlined in Standards for Flood Risk Analysis and Mapping, (2) use software on the approved model list, (3) match or exceed current hydrologic approach as outlined in the effective Flood Insurance Study text (4) be available for the five events outlined in SID84
Gage
Bulletin 17B (Statistical/ Historical Analysis)
All 5 events
Bulletin 17B (Statistical/ Historical Analysis)
1% and 0.2% available
$2,150 $1,290
Data DD- Hydrology
Analysis for 5 recurrence intervals
Hydro data should (1) use engineering approaches outlined in Standards for Flood Risk Analysis and Mapping, (2) use software on the approved model list, (3) match or exceed current hydrologic approach as outlined in the effective Flood Insurance Study text (4) be available for the five events outlined in SID84
Linear Mile
Rainfall Run-Off
Methodologies All 5 events
Regression Equations with Gage Analysis
All 5 events
2D Hydrology with Large
Scale Economy
1D Hydrology with Large
Scale Economy
$1,800 $500 $20 $15
Data DD- Hydrology
Analysis for 2 recurrence intervals
Hydrology analysis should (1) use engineering approaches outlined in Standards for Flood Risk Analysis and Mapping, (2) use software on the approved model list, (3) match or exceed current hydrologic approach as outlined in the effective Flood Insurance Study text (4) be available for a minimum of the 1% and 0.2% annual chance events.
Linear Mile
Rainfall Run-Off
Methodologies 1% and 0.2%
available
Regression Equations w/
Gage Analysis 1% and 0.2%
available
$1,080/linear mile $350/linear mile

Blue Book|12
Leverage Type
Project Phase
Project Element Assumptions Unit <<More Effort Less Effort>>
Data DD- Hydrology
Hydrograph Development
Uses standard engineering approaches to develop peak flow utilizing unit hydrograph methodologies. This cost may be submitted in addition to gage or regression analysis as they are utilized in a combined manner to determine peak flow rates along streams of interest. Leverage request should be based on the existence of a unit hydrograph that is readily available for use.
Hydrograph
Independent of Approach
$1,000
Data DD- Hydraulics
Large Scale Engineering
Large Scale Base Level Engineering (Zone A): Hydraulic and Hydrologic Data should (1) use standard engineering approaches (2) meet requirements outlined in Standards for Flood Risk Analysis and Mapping (3) use software on the approved model list, (4) match or exceed current Zone designation on the effective FIRM, and (5) have been prepared at local/partner’s expense.
Large Scale Automated Engineering Riverine: Hydraulic and Hydrologic Data collected for validation purposes and not of a quality to provide an A zone on a FIRM shall (1) uses standard engineering approaches and (2) uses software on the approved model list. No modeling refinement required.
Linear Mile
Zone A BLE Analysis (1D)
Zone A BLE Analysis (2D)
Automated LSAE Riverine,
1D
Automated LSAE
Riverine, 2D
$45 $35 $30 $25
Zone A BLE (1D) with cross sections added
$85
Data DD- Hydraulics
Steady State (1D)
Zone A
Hydraulic Data should (1) use standard engineering approaches (2) meet requirements outlined in Standards for Flood Risk Analysis and Mapping (3) use software on the approved model list, (4) match or exceed current Zone designation on the effective FIRM, and (5) have been prepared at the local/partner’s expense. Well defined channels with gradually varied flow.
Linear Mile Zone A3 Analysis
$250
3 “Zone A Analysis” would be used for a smaller number of miles at a time.

Blue Book|13
Leverage Type
Project Phase
Project Element Assumptions Unit <<More Effort Less Effort>>
Data DD- Hydraulics
Steady State (1D)
Zone AE
Hydraulic Data should (1) use standard engineering approaches (2) meet requirements outlined in Standards for Flood Risk Analysis and Mapping (3) use software on the approved model list, (4) match or exceed current Zone designation on the effective FIRM, and (5) have been prepared at local/partner’s expense .
Linear Mile Zone AE (with floodway and field survey)
Zone AE (no floodway and
with field survey)
Zone AE (without floodway and with field measurements)
$4,000 $3,250 $1,750
Data DD- Hydraulics
Unsteady State
Scenarios Zone AE
Hydraulic Data should (1) use standard engineering approaches (2) meet requirements outlined in Standards for Flood Risk Analysis and Mapping (3) use software on the approved model list, (4) match or exceed current Zone designation on the effective FIRM, and (5) have been developed at local/partner’s expense. Flow analysis where depth of flow and/or velocity vary based on time.
Square Mile
2D Unsteady Analysis
(Square Mile)
1D Unsteady Analysis
(Square mile)
$6,500 $5,250
Data DD- Hydraulics
Joint Probability Analysis
Data available will provide combined probability calculations based on riverine and coastal/levee derived statistical water surface elevations for the 10%, 2%, 1%, and 0.2% events and provide a calculated joint probability elevation.
Linear Mile Coastal/Levee Coastal/
Riverine Levee/
Riverine Levee or
Flood Control Structure
$1,750 $1,500 $1,250 $1,000
Data DD- Coastal
Coastal Wave Hazard
Analysis & Erosion
Coastal Data should (1) input data and parameters shall meet NFIP standards (2) use standard engineering approaches (3) meet requirements outlined in Standards for Flood Risk Analysis and Mapping (4) use software on the approved model list, and (5) match or exceed current Zone designation on the effective FIRM. Values at the right are based on geographic location and regional guidelines for conducting the coastal analysis.
Linear (Coastal)
Mile
Pacific Great Lakes Northern Atlantic
Southern Atlantic & Gulf Coast
$9,500 $6,000 $1,400 $1,400
Data DD- Coastal
Other Coastal Hazard Analysis
Coastal Data should (1) input data and parameters shall meet NFIP standards (2) use standard engineering approaches (3) meet requirements outlined in Standards for Flood Risk Analysis and Mapping (4) use software on the approved model list, and (5) match or exceed current Zone designation on the effective FIRM.
Linear (Coastal)
Mile
Tsunami Modeling
Wave Hindcast Data
$8,500 $7,900
Gage Tidal Frequency Analysis
$3,500
Blue Book|14
Leverage Type
Project Phase
Project Element Assumptions Unit <<More Effort Less Effort>>
Data DD- Hydraulics
Alluvial Fan Determination
& Analysis
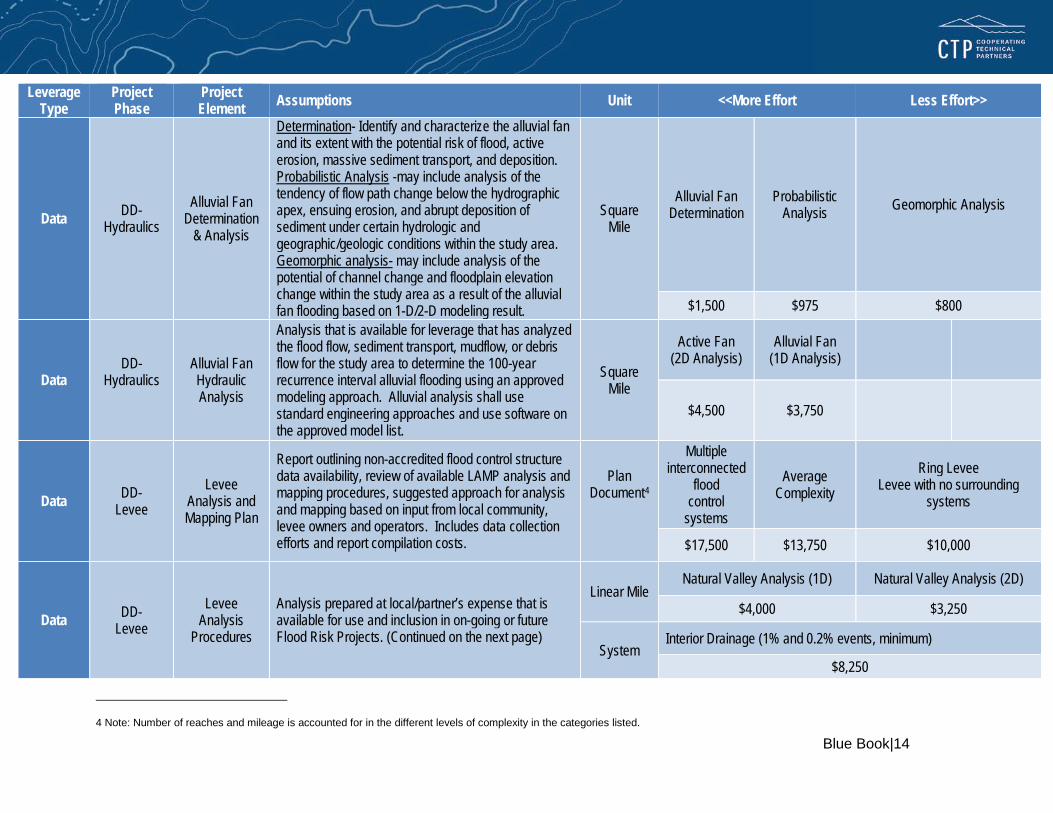
Determination- Identify and characterize the alluvial fan and its extent with the potential risk of flood, active erosion, massive sediment transport, and deposition. Probabilistic Analysis -may include analysis of the tendency of flow path change below the hydrographic apex, ensuing erosion, and abrupt deposition of sediment under certain hydrologic and geographic/geologic conditions within the study area. Geomorphic analysis- may include analysis of the potential of channel change and floodplain elevation change within the study area as a result of the alluvial fan flooding based on 1-D/2-D modeling result.
Square Mile
Alluvial Fan Determination
Probabilistic Analysis Geomorphic Analysis
$1,500 $975 $800
Data DD-
Hydraulics Alluvial Fan Hydraulic Analysis
Analysis that is available for leverage that has analyzed the flood flow, sediment transport, mudflow, or debris flow for the study area to determine the 100-year recurrence interval alluvial flooding using an approved modeling approach. Alluvial analysis shall use standard engineering approaches and use software on the approved model list.
Square Mile
Active Fan (2D Analysis)
Alluvial Fan (1D Analysis)
$4,500 $3,750
Data DD- Levee
Levee Analysis and Mapping Plan
Report outlining non-accredited flood control structure data availability, review of available LAMP analysis and mapping procedures, suggested approach for analysis and mapping based on input from local community, levee owners and operators. Includes data collection efforts and report compilation costs.
Plan Document4
Multiple interconnected
flood control
systems
Average Complexity
Ring Levee Levee with no surrounding
systems
$17,500 $13,750 $10,000
Data DD- Levee
Levee Analysis
Procedures
Analysis prepared at local/partner’s expense that is available for use and inclusion in on-going or future Flood Risk Projects. (Continued on the next page)
Linear Mile Natural Valley Analysis (1D) Natural Valley Analysis (2D)
$4,000 $3,250
System Interior Drainage (1% and 0.2% events, minimum)
$8,250
4 Note: Number of reaches and mileage is accounted for in the different levels of complexity in the categories listed.

Blue Book|15
Leverage Type
Project Phase
Project Element Assumptions Unit <<More Effort Less Effort>>
Reach Review Sound
Reach Review
Freeboard Deficient
$/reach $/reach
Linear Mile Overtopping Procedure
Structural Based
Inundation5 $8,250 $4,000
Data DD-
Floodplain Mapping
Floodplain Mapping
Floodplain mapping at local/partner’s expense for use and inclusion in Flood Risk Projects. Linear Mile
Levee Coastal
(includes LiMWA)
Riverine6
$1,750/ Linear Mile x #
of LAMP Approaches7
$700/ linear mile*
Data DD-
Floodplain Mapping
Floodplain Mapping: AE Redelineation
Floodplain mapping of effective data on updated topographic information Linear Mile $900
Data DD-Preliminary
Prepare DFIRM
Database
Prepared and compiled the DFIRM Database (2013 or newer version) at local/partner’s expense. Compiled DFIRM database is being used for leverage. DFIRM database passes QR1 and QR3 and is able to produce prelim FIRMs.
County $3,250 Independent of Approach
Data DD-Preliminary
FIRM Panel Preparation
Prepared and compiled the FIRM panel at local/partner’s expense. Compiled DFIRM database is being used for leverage. Includes printing and mailing as needed.
Panel $350
Independent of Approach
Data Post-Prelim Revised Preliminary
Develop revised preliminary products as needed. Includes mailing of revised products to communities. Includes DB, FIS, panels and delivery, as well as
Panel $700 Revised Preliminary
5 FEMA traditionally pays for this service. 6 Riverine floodplain mapping of new hydraulic analysis is included in the associated riverine hydraulic task 7 Multiply the number of linear miles by the number of LAMP approaches used for the levee system to develop the floodplain mapping cost.

Blue Book|16
Leverage Type
Project Phase
Project Element Assumptions Unit <<More Effort Less Effort>>
QA/QC. Assumes 4 panels and mailing to 2 communities.
Data DD-Preliminary
Flood Insurance
Study (FIS) Text
Prepared and compiled the FIS text at local/partner’s expense. Compiled FIS text is being used for leverage. Volume
$1,500 Independent of
Approach
Data DD-FRP Areas of
Mitigation Interest
Flood Risk or other datasets highlighting mitigation opportunities or concerns that are prepared in support of an on-going watershed or other Flood Risk Study.
Community $1,250
Independent of Approach
Data DD-FRP Changes Since Last FIRM
Changes Since Last FIRM coverage dataset prepared a at local/partner’s expense that are prepared in support of an on-going watershed or other Flood Risk Study.
Linear Mile8
Unmodernized Study Area
Modernized Study Area
$8 $6
Data DD-FRP Flood Risk Depth and
Analysis Grids
Flood Risk datasets prepared at local/partner’s expense that are prepared in support of an on-going watershed or other Flood Risk Study.
Linear Mile
Flood Depth & Water Surface Elevation Grids
(Multi-frequency)
Flood Depth & Water Surface Elevation Grids
(Single-frequency)
Percent Annual Chance & 30-Year Chance Rasters
$7,500 $2,250 $750
Data DD-FRP Other Datasets Other types of Flood Risk datasets for coastal, dam, levee or riverine situations developed according to FEMA guidance.
Linear Mile Enhanced Datasets
$50
Data DD-FRP Multi-Hazard
and Flood Risk Assessment
Flood Risk Assessment prepared at local/partner’s expense that are prepared in support of an on-going watershed or other Flood Risk Study.
Structure Structure Based
Flood Risk Assessment Enhanced
(Updated Aggregate Census Blocks)
$15 $5
Project Multi-Hazard Default Census Block
$2,500 $1,250
8 The end user would apply unmodernized rate to those miles, and modernized rate to those miles. Additional cost for having a mix would likely be negligible.

Blue Book|17
Leverage Type
Project Phase
Project Element Assumptions Unit <<More Effort Less Effort>>
Data DD-FRP Flood Risk Products
Flood Risk Products prepared a at local/partner’s expense in support of a Flood Risk Study. Project
Flood Risk Report Flood Risk Map
Flood Risk Database
(w/ Flood Risk Assessment)
Flood Risk Database (NO Flood
Risk Assessment)
$5,000 $3,000 $2,500 $1,500
Data CNMS Update
CNMS Updates
Updates to CNMS mileage in order to ensure the proper maintenance of datasets at the given timestep shown to the right.
Project9 Discovery Data
Development Preliminary Issuance
Effective Issuance
$650 $650 $650 $650
9 CNMS updates are done at the project level. Therefore, “Project” is the best unit to use for the CNMS touchpoint updates. CNMS is updated at the study level so the
same Level of Effort (LOE) is required, regardless if the study is 1 mile or 10 miles.

Blue Book|18
Table 2: In-Kind Services The leverage table below indicates the value of CTP staff and services rendered in support of a Risk MAP Project. The table identifies a suggested range of values based on effort expected and is intended to allow CTPs to review the services their staff will provide as in-kind services. CTPs should review the services that they will perform in support of a Risk MAP Project and evaluate both the assumptions and the range of efforts identified in the right hand columns to identify their level of effort and value of in kind services to be performed by CTP. The services in the table below SHOULD NOT be used for cost estimation of projects by CTPs.
Leverage Type
Project Phase
Project Element Assumptions Unit <<More Effort Less Effort>>
In Kind Services
Discovery Task
Discovery Task10
Perform coordination of local meeting location, signage for meeting location, and sign in materials, develop invite language, coordinate invitations and RSVPs, market meeting, and any surveying materials in support of a Discovery meeting. Other tasks include: developing contact list, engagement plan, pre-discovery interviews scheduling of interviews. Develop Community Summary Sheets, develop and refine presentation, facilitator and note taker assignments.
Community
Enhanced level of engagement
Previous interaction litigious,
contentious, or unknown
Typical level of engagement
Previous interactions met with moderate level of interest
and participation
Mature Community
Eengagement11
$2,000 $1,680 $1,520
In Kind Services
Mitigation and
Community Outreach
Mitigation and Community
Outreach (not associate with
a specific Risk MAP meeting)
This task is relevant to communication touchpoints outside of required meetings throughout the Risk MAP Project. Continued coordination effort with local communities on follow up items, collection and review of local data identified or shared at any Risk MAP
Community
Enhanced level of engagement
Previous interaction litigious,
contentious, or unknown
Typical level of engagement
Previous interactions met with moderate level of interest
and participation
Mature Community
Engagement6
10 Assumes one Discovery meeting will be held for each communities. No travel costs are not included in this assumption. 11 Previous interactions recent and with mature community who has consistent and frequent two-way communication.

Blue Book|19
Leverage Type
Project Phase
Project Element Assumptions Unit <<More Effort Less Effort>>
Project meeting. Examples include: project-specific outreach or technical assistance.12 $375 $300 $225
In Kind Services
DD- Base Map
Independent QA/QC
Quality review of submittals for the base mapping task County
Highly Urbanized (Modernized)
Mix of Modernized/
Unmodernized
Unmapped/ Unmodernized Communities
$1,400 $1,200 $1,000
In Kind Services
DD- Topographic
Independent QA/QC
Rolling to Hilly Terrain
Quality review of submittals for the rolling or hilly terrain elevation/terrain task. Square Miles
Point Cloud Checkpoint Surveys
Bare Earth Processing Breaklines
$170 $160 $150 $50
In Kind Services
DD- Topographic
Independent QA/QC
Flat Terrain Quality review of submittals for the flat elevation/terrain task. Square Miles
Point Cloud Checkpoint Surveys
Bare Earth Processing Breaklines
$20 $15 $10 $5
In Kind Services
DD- Survey
Independent QA/QC
Quality review of submittals for the field survey task. See Units
Transect Coastal Structures
Riverine Structures
Channel Survey
$125/Transect13 $90/Structure $90/Structure $45/Cross Section
In Kind Services
DD- Hydrology
Independent QA/QC
Quality review of submittals for the hydrology task.
Linear Mile Rainfall Run-Off Methodologies
Regression Equations with Gage Analysis
$180 $125
Gage Bulletin 17B (Statistical/
Historical Analysis) $215
In Kind Services
DD- Hydraulics
Independent QA/QC
Quality review of submittals for the hydraulics task.
Linear Mile (or Stream)
Zone AE (with floodway)
Zone AE (no floodway) Zone A
$75 $50 $25
12 Continued coordination effort with local communities on follow up items, collection and review of local data identified or shared at any Risk MAP Project meeting. 13 NOTE: Team to double check cost PTS submitted QA/QC as a percentage. Since actual survey cost of transect is less than riverine channel survey, QA/QC for transect should be less than or equal to channel survey. PTS can follow up with SMEs if needed.

Blue Book|20
Leverage Type
Project Phase
Project Element Assumptions Unit <<More Effort Less Effort>>
In Kind Services
DD- Hydraulics LSAE/BLE
Independent QA/QC
Quality review of submittals large scale hydraulics data collection. Linear Mile
Base Level Engineering,
1D/2D LSAE - Riverine,
1D LSAE - Riverine,
2D
$5 $3 $2
In Kind Services
DD- Hydraulics (Unsteady)
Independent QA/QC
Quality review of submittals for the unsteady hydraulics task. Linear Mile
2D Unsteady Analysis
1D Unsteady Analysis
$650 $525
In Kind Services
Data Development
Joint Probability Analysis
Independent QA/QC
Quality review of submittals for the joint probably analysis task. Linear Mile Coastal/Levee Coastal/Riverine Levee/
Riverine
Levee or Flood
Control Structure
$175 $150 $125 $100
In Kind Services
DD- Coastal
Wave Hazard Analysis &
Erosion Quality review of submittals for the coastal task. Linear Mile Pacific Great Lakes Northern Atlantic
Southern Atlantic & Gulf Coast
$950 $600 $140 $140
In Kind Services DD-Levee Levee Data
Review Quality review of submittals for the levee task. Levee Reach 65.10 Review Sound Reach Submittals
Freeboard Deficient
Submittals $4,000 $3,750 $3,250
In Kind Services
DD- Floodplain Mapping
Floodplain Mapping
Quality review of submittals for the floodplain mapping task.
Linear Mile (Riverine or
Coastal Mile)
Levee Coastal (includes LiMWA) Riverine
$175/ Linear Mile x # of
LAMP Approaches14
$70 $15
14 Multiply the number of linear miles by the number of LAMP approaches used for the levee system to develop the floodplain mapping cost.

Blue Book|21
Leverage Type
Project Phase
Project Element Assumptions Unit <<More Effort Less Effort>>
In Kind Services
Risk Review and
Resilience Outreach
Meeting Logistics Support
All meeting support associated with preparing for a Resilience Meeting. CTP staff will perform coordination of local meeting location, signage for meeting location, and sign-in materials. They will also develop invite language, coordinate invitations and RSVPs, market the meeting in coordination FEMA’s External Affairs team, and provide any surveying materials in support of a Flood Risk Review meeting.
Community Enhanced level of engagement
Previous interaction litigious,
contentious, or unknown
Typical level of engagement
Previous interactions met with moderate level of interest
and participation
Mature Community
Engagement15
$3,000 $2,500 $1,750
In Kind Services
DD-Preliminary
Independent QAQC Review
Quality Review of submittals for the FIS report, FIRM panels and DFIRM database at the county level.
County $2,000 Independent of Approach
In Kind Services
Post-Prelim Outreach
Meeting Logistics
CCO/PDCC Meeting
CTP staff will perform coordination of local meeting location, signage for meeting location, sign in materials and any surveying materials in support of a CCO meeting. Leverage cannot be double counted if FEMA Community Assistance Program (CAP) funds are used by CTP to support CCO/PDCC meeting. Value available for up to one meeting per community or less if fewer meetings occurred.
Meeting
Unmapped/ Unmodernized Communities
Mix of Modernized/
Unmodernized Highly
Urbanized
$3,750 $3,150 $2,850
In Kind Services
Post-Prelim Outreach
Meeting Attendance/
Support CCO/PDCC
Meeting
Includes preparation and attendance associated with a Flood Risk Review meeting. Leverage not available if FEMA Community Assistance Program (CAP) funds are used by CTP to support CCO/PDCC meeting.
Meeting (price per staff member)
Unmapped/ Unmodernized Communities
Mix of Modernized/
Unmodernized Highly Urbanized
$625 $425 $285
In Kind Services
Post-Prelim Initiate Appeal Period
CTP will populate Flood Hazard Determination (FHD) on the Web, complete QR4 Part 1, publish Federal Register proposed notice and initiate local printings required to initiate appeal Period. Tasks also include the preparation and submit Appeal Start
Community $450
15 Previous interactions recent and with mature community who has consistent and frequent two-way communication.

Blue Book|22
Leverage Type
Project Phase
Project Element Assumptions Unit <<More Effort Less Effort>>
documents and complete QR4 - Part 2. Includes mailing approved appeal letters with tracking. Assumes 5 communities.
In Kind Services
Post-Prelim Capture Appeals and Comments
Compile all appeals and comments, work with FEMA Region to resolve, mail acknowledgement and resolution letters. Assumes 4 hours per inquiry.
Community $650
In Kind Services Post-Prelim Final Map
Production
Submittal and completion of all elements related to QR5, QR7 and QR8. Includes all revisions and submittals to receive a pass for each QR step.
Panel $750
In Kind Services Post-Prelim Final SOMA
and LFD Tasks required to complete QR6. Assumes 10 LOMCs for review in a community. Community $300
In Kind Services Post-Prelim Revalidation
Letter
Prepare and submit revalidation letters for review. Address revalidation letter comments. Includes mailing of all letters. Assumes 10 LOMCs for review in a community.
Community $225
In Kind Services Post-Prelim Final TSDN
and Archiving Completion of the TSDN checklist and upload to MIP of all final study-related materials. County $1,250

Blue Book|23
5. Definitions
The definitions below describe some of the project elements in the MIP in more detail. There are also supplemental projects tasks listed in the definitions below which are important for CTPs to be aware of.
Leverage County Includes all communities included in a FEMA Flood Insurance Rate Map (FIRM) which are released by that county. Discovery Task – Discovery Information Readily Available This project element includes leveraging existing data or previously prepared data that meets the requirements for community data collection of the Discovery Task. This data was previously prepared at community or state expense and provides adequate information for CTP to perform needs assessment for data development and capacity building project identification outlined in Standards for Flood Risk Analysis and Mapping (SID29).
Basemap Data Development This project element includes the collection of geo-spatial information in support of a flood risk project. FEMA does not typically spend money on the acquisition of base maps. However, because partners often have a level of effort to prepare the base map data, credit will be given for completing the following within the project areas: obtaining digital files of the base map, securing necessary permissions from the map source to allow FEMA’s use and distribution of hardcopy and digital map products using the digital base map free of charge, reviewing and supplementing the content of the acquired base map to comply with the requirements of FEMA’s Guidelines and Standards for Flood Risk Analysis and Mapping, converting of the base map data to the format required in FEMA’s Guidelines and Standards for Flood Risk Analysis and Mapping, and certifying that the digital data meets the minimum standards and specifications that FEMA requires for FIRM production. Products should meet the requirements of FEMA’s Guidelines and Standards for Flood Risk Analysis and Mapping, and should follow the Geospatial Data Coordination Implementation Guide.
Raster Base Data Collection and Processing
For this sub-element, the base data source will generally fall into one of the following two categories when producing Raster Base FIRMs.
1. National/Regional Ortho-imagery Source: Typically low resolution publicallyavailable data. This category assumes there will be minimal processing required.
2. Local Ortho-imagery Source (or combination): This may be a combination ofsources. At least one high resolution local data source. This category assumesthere will be more processing and data management time required.

Blue Book|24
Vector Base Data Collection and Processing
For this sub-element, select one of the four categories below that best describe the project area. All studies require vector base data. Urban/Rural definition is based on the percentage of the project area covered by the Census Bureau's decennial urban-rural classification polygon shape file. For example, if greater than 50% of the project area is classified as urban by the Census, then select one of the urban categories; if less than 50% of the project area is classified as urban by the Census, then select one of the rural categories.
1. Urban/Modernized: Vector base data preparation for urban area. Effective data forthe project area is modernized in quad-based countywide format, present in NFHLdataset.
2. Rural/Modernized: Vector base data preparation for rural area. Effective data forthe project area is modernized in quad-based countywide format, present in NFHLdataset.
3. Urban/Not Modernized: Vector base data preparation for urban area. Effectivedata for the project area is not in quad-based countywide format, and not present inNFHL dataset.
4. Rural/Not Modernized: Vector base data preparation for rural area. Effective datafor the project area is not in quad-based countywide format, and not present in NFHLdataset.
Survey Data Development This project element includes data collection of structural information within an area of study, which may include conditions along floodplain, types and numbers of hydraulic, and/or flood-control structures, apparent maintenance or lack thereof of existing hydraulic structures, data along cross sections, and other parameters needed for the hydrologic and hydraulic analyses.
RIVERINE CHANNEL FIELD SURVEY Level of effort for major to minor is based on channel depth, flow speed, and survey equipment required. A minor flooding source would likely be less than 3’ of channel depth and have low flow speed conditions. A moderate flooding source would likely exceed 3’ of channel depth, have moderate flow speed, and require a boat and depth rod. A major flooding source would likely exceed 3’ of channel depth and have high flow conditions, requiring a powered boat and sonar.
Topographic Data Development This project element includes the generation of new topographic data for areas where the floodplains are being updated as part of the mapping project. Topographic data includes the collection and processing of data developed from light detecting and ranging (LiDAR), processing of the data to create a fully classified LAS point cloud (including LAS Class 2 – bare earth), extraction of breaklines, and collection of field surveyed calibration points and vertical accuracy checkpoints. All data must meet or exceed standards set forth by FEMA, and the FEMA Guidance for Flood Risk Analysis and Mapping - Elevation Guidance. Leveraged datasets must follow the guidelines set forth in the Elevation Guidance document to determine appropriateness of the data.

Blue Book|25
Terrain Data Development This project element is the generation of derivative products such as the hydro-enforced digital elevation model (DEM) and contours using topographic data. Terrain data development project element items are products that are produced using previously acquired topographic data, simply described here as derivative products. These derivative products, such as DEMs or contours, used for floodplain development must meet or exceed standards set forth by FEMA and the FEMA Guidance for Flood Risk Analysis and Mapping – Elevation Guidance.
Hydrology Data Development This project element includes the selection and application of appropriate methodology analysis to develop peak discharges for the 10-, 4-, 2-, 1-, and 0.2-percent-annual-chance events. Development of peak discharges may include delineation of drainage areas; detailed hydrologic analyses; preparation of draft Flood Insurance Study (FIS) text; internal quality review; and addressing comments from independent quality reviewer. Hydrologic analysis used for floodplain development should meet the requirements of FEMA’s Guidelines and Standards for Flood Risk Analysis and Mapping. Sub-elements of Hydrologic Data Development may include the following.
RAINFALL RUNOFF ANALYSIS This sub-element is defined as numerical watershed modeling in order to determine runoff volume and peak discharge and hydrographs for the required annual-chance events. Tasks will include but are not limited to the development of land use and rainfall frequency data, computation of excess precipitation, determination of overland and channel routing, and flow routing through detention structures.
STATISTICAL ANALYSIS OF GAGE DATA This sub-element is defined as the determination of peak discharges for the required annual-chance events by statistical frequency analysis of peak flow records at stream gages. This analysis can also include transposing results of gage frequency analyses to ungaged locations on the same stream.
REGRESSION ANALYSIS This sub-element is defined as the use of regional regression analysis to determine peak discharges for the required annual-chance events. This typically involves the use of existing regional regression equations; development of new regional regression analyses is a more involved and computationally intensive process. The application of regional regression equations may involve statistical gage analysis in order to adjust the regression results for gaged streams.
HYDROGRAPH DEVELOPMENT This sub-element is defined as development of hydrographs of the peak discharges for the required annual-chance events, using unit hydrograph methods or the application of other regional hydrograph methods. Hydrograph development is required for unsteady or 2D hydraulic modeling.

Blue Book|26
Hydraulics Data Development This project element includes the selection and application of appropriate methodology analysis to estimate peak water surface elevations for the 10-, 4-, 2-, 1-, and 0.2-percent-annual-chance events. Estimation of peak water surface elevations may include field visits to verify roughness coefficient and verify structural details (inlet types, conditions, etc.); integrate field survey data into modeling; prepare digital profiles of the 10-, 4-, 2-, 1-, and 0.2-percent-annual-chance events; prepare a floodway model; calibrate/validate models; delineate floodplains and floodway boundaries; prepare draft FIS text; prepare floodway data tables; prepare FIS profile; prepare workmaps; perform internal quality review; and incorporate comments from independent quality reviewer. Special considerations should be made when processing 2D hydraulic analysis as compared to 1D steady-state hydraulic analysis. Hydraulic analysis used for floodplain development should meet the requirements of FEMA’s Guidelines and Standards for Flood Risk Analysis and Mapping. Sub-elements of Hydrologic Data Development may include the following.
LARGE SCALE (AUTOMATED) ENGINEERING This sub-element is defined as mass quantities of highly automated estimates of potential flood hazard boundaries that are not intended to be ready for regulatory use.
STEADY STATE ZONE A ANALYSIS This sub-element is defined as Zone A analysis which typically does not include the incorporation of hydraulic structures.
STEADY STATE ZONE A AUTOMATED MODELING This sub-element is defined as the Zone A analysis produced with automated techniques to simplify parameter estimation and development of models which may include the incorporation of hydraulic structures by desktop methods, manual adjustments, or no adjustments.
STEADY STATE ZONE AE ANALYSIS This sub-element is defined as the Hydraulic analyses that include detailed survey data for hydraulics structures, with or without floodway analysis using 1D Steady State Analysis modeling techniques.
STEADY STATE ZONE AE ENHANCED ANALYSIS This sub-element is defined as the Zone AE analysis without floodway determination, and may or may not include field surveyed hydraulic structures, or field surveyed channel cross sections.
UNSTEADY STATE SCENARIOS ZONE AE
This sub-element is defined as the Hydraulic analyses that include detailed survey data for hydraulics structures, with or without floodway analysis using 1-dimensional (1D), 2-dimensional (2D), or a combination of both 1D and 2D modeling techniques and unsteady state flow methodologies.
JOINT PROBABILITY ANALYSIS
This sub-element includes the application of a methodology that combines the frequency analysis of riverine, coastal, or flood control structure probability for a specific area of study.

Blue Book|27
Coastal Data Development This project element includes the delineation of the 1- and 0.2-percent-annual-chance floodplain boundaries, VE and AE Zones, Primary Frontal Dune, Limit of Moderate Wave Action, and base flood elevations, as well as any other applicable elements for the flooding sources for which detailed coastal analyses were performed. Incorporate all new or revised coastal modeling and use the topographic data acquired under the Topographic Data Development project element to delineate the floodplain boundaries, VE and AE Zones, Primary Frontal Dune, Limit of Moderate Wave Action, and base flood elevations and any other applicable elements on a digital work map.
Hydraulics Data Development Alluvial Fan Analysis Identify and characterize the alluvial fan and its extent with the potential risk of flood, active erosion, massive sediment transport, and deposition. See FEMA’s guidance for flood risk analysis and mapping – alluvial fans (November, 2016) for more detailed alluvial fan flood definitions and analyticalprocedures.
ALLUVIAL FAN DETERMINATION
Analyze the study area to identify which portions of the area are characterized or subject to alluvial fan flooding.
PROBABILISTIC ANALYSIS FOR ALLUVIAL FAN FLOOD
Analyze, using either a 1-D or 2-D modeling approach, the probability and spatial variation of alluvial fan flood for the study area by considering the geologic and hydrologic randomness and uncertainties in the region. GEOMORPHIC ANALYSIS FOR ALLUVIAL FAN FLOOD Analyze, using either a 1-D or 2-D modeling approach, the potential change in terrain along the flowpath due to sediment erosion and accretion by mudflows. The geologic structures and soil types will need to be considered for the potential erodibility and sediment deposit. ALLUVIAL FAN HYDRAULIC ANALYSIS
Analyze the flood flow, sediment transport, mudflow or debris flow for the study area to determine the 100-year recurrence interval alluvial flooding by either a 1-D or 2-D modeling approach.
Levee Data Development This project element includes review and evaluation of all available data to determine status of levees and the appropriate mapping of the flood risks associated with the levee. Evaluation and study options differ depending on whether the levee is non-accredited or accredited.
LEVEE ANALYSIS AND MAPPING PLAN
Levee Analysis and Mapping Plan This sub-element is defined as the initial data review of available levee information and existing studies to determine available options and the development of a report presenting outcomes of the LLPT meeting, including recommendations for analysis procedures and mapping.

Blue Book|28
LEVEE ANALYSIS PROCEDURES
Natural Valley (Zone D) This sub-element is defined as the levee analysis procedure of the entire levee system that considers conveyance on the landward side of the levee. This analysis may use the initial data analysis as a starting point. The results of the system-wide Natural Valley will be used either as the Zone D or as SFHA, if a Natural Valley approach is selected.
Interior Drainage This sub-element is defined as the analysis of flooding of interior drainage systems on the landward side of the levee. This includes evaluation of flooding sources and mapping, where required.
Review Sound Reach This sub-element is defined as the review of the data and documentation to determine if a levee reach meets the requirements of CFR 65.10. The mapping will be based on the system-wide natural valley analysis to define the Zone D boundary and overlaid with the interior drainage analysis as SFHA, as applicable.
Review Freeboard Deficient This sub-element is defined as the review of the data and documentation to determine if a levee reach meets the requirements of CFR 65.10, except for freeboard. The mapping will be based on the system-wide natural valley analysis to define the Zone D boundary and overlaid with the interior drainage analysis as SFHA, as applicable.
Overtopping Procedure This sub-element is defined as the review of the data and documentation to determine if a levee reach meets the requirements of CFR 65.10, except that the levee is overtopped by the base flood. Additionally, the review includes a check that documentation and calculations include certification by a professional engineer the levee can withstand overtopping. This Sub-element includes the analysis procedure to calculate the quantity of flow overtopping the levee to result in a base flood elevation and inundation boundary landward of the levee. The composite mapping will be based on the system-wide natural valley analysis to define the Zone D boundary and overtopping results for SFHA landward of the levee, with interior drainage analysis overlain as additional SFHA, as applicable.
Structural-Based Inundation This sub-element is defined as performing the analysis procedure applied to one or more reaches that do not meet CFR 65.10 standards. This Sub-element includes the review data and documentation of operation and maintenance plans. The mapping will use system-wide natural valley analysis to define the Zone D boundary, overlain with the results of the structural-based inundation areas as SFHA and any interior drainage mapping as SFHA, as appropriate.

Blue Book|29
MISCELLANEOUS LEVEE TECHNICAL SUPPORT Initial Stakeholder Engagement This sub-element is defined as the initial meeting to inform affected communities of existing levee status and overview of the analysis and mapping of non-accredited levees approach. This step commonly signifies the beginning of a LAMP project
Local Levee Partnership Team This sub-element is defined as the stakeholder coordination meetings to acquire and evaluate levee information and identify appropriate analysis procedures. This includes initial data analysis of LAMP approaches to discuss with LLPT members.
65.10 Review This sub-element is defined as the FEMA review of CFR 65.10 certification packages for completeness. This includes coordination with the submitter to request any necessary additional data.
PAL Meetings or Other Levee Outreach This sub-element is defined as miscellaneous levee outreach conducted outside of the normal production study workflow, including PAL discussions and other miscellaneous levee outreach.
Levee Pre-Scoping This sub-element is defined as evaluation of levees with a mapping need to correct the FIRM representation of accreditation status.
Floodplain Mapping Data Development This project element is defined as the delineation the 1- and 0.2-percent-annual-chance floodplain boundaries and the regulatory floodway boundaries (if required), as well as any other applicable elements for the flooding sources for which detailed hydrologic, hydraulic, alluvial, coastal, and/or levee analyses were performed, for which effective data is redelineated using updated topographic information, or where conversion of SFHA information from hard copy maps to georeferenced digital vector data has been performed. Prepare the database files relevant to the Floodplain Mapping submittal, and related metadata file, in accordance with FEMA’s Guidelines and Standards for Flood Risk Analysis and Mapping for upload to the Mapping Information Platform. Prepare the Floodplain Mapping layers in a manner to assure all DVT review requirements are met. Perform a Floodplain Boundary Standard (FBS) certification and documentation. Address comments resulting from the Independent QA/QC process.
Preliminary Data Development -Prepare DFIRM Database This project element is defined as the incorporation all new or revised hydrologic, hydraulic, alluvial, coastal, and/or levee modeling, redelineation, and/or SFHA conversion data, and use the topographic data acquired to delineate the floodplain and regulatory floodway boundaries on a digital work map. The preparation of the database files relevant to the Draft DFIRM Database submittal, and related metadata file, in accordance with FEMA’s Guidelines and Standards for Flood Risk Analysis and Mapping for upload to the Mapping Information Platform. The preparation of the FIRM Database layers in a manner to assure all DVT review requirements are met. The coordination with appropriate mapping partners, as necessary, to resolve any problems that are identified during development of the Draft FIRM Database. Distribute Provisional Data (digitally, via the FEMA GeoPlatform, or other appropriate

Blue Book|30
format) per FEMA’s Guidelines and Standards for Flood Risk Analysis and Mapping, KSS Working Standard #621. Address and/or make final disposition of comments resulting from the Independent QA/QC process.
Preliminary Data Development – FIRM Panel Preparation and FIS Text This project element is defined as the development of preliminary FIRM panels by applying the necessary FIRM graphic and FIRM Database specifications to FIRM files produced under the previous Data Development activities in accordance with FEMA’s Guidelines and Standards for Flood Risk Analysis and Mapping. Develop or update FIS volumes as needed, including all associated data tables, figures, and flood profiles to document the Flood Risk Project(s)/Flood Study(ies). The coordination with appropriate mapping partners, as necessary, to resolve any problems that are identified during development of the Preliminary FIRM Database. The incorporation of relevant LOMRs, and addressing and/or resolving all comments resulting from the Independent QA/QC and FEMA QR processes. The distribution preliminary data and products, printed and/or digital as appropriate, including preliminary FIRM panels, FIRM database, FIS report, and Preliminary SOMAs for all affected communities as necessary, per FEMA’s Guidelines and Standards for Flood Risk Analysis and Mapping.
Post Preliminary This project element includes all processing and production steps that occur after the Preliminary Period. These steps will include population of Flood Hazard Determination (FHD) (QR4 Part 1) and Appeal Start Initiation (QR4 Part 2), the capture of Appeals and Comments, produce revised Preliminary Products, Final Map production, prepare and submit Summary of Map Action (SOMA) and Letter of Final Determination (LFD), prepare and submit revalidation Letter, completion of final Technical Support Data Notebook (TSDN), and archiving of all study-related materials.
Flood Risk Product Data Development This project element is defined as the development and finalization of the following Flood Risk Products and Datasets: Flood Risk Map, Flood Risk Report, and Flood Risk Database, which is comprised of the Changes Since Last FIRM, Flood Depth and Analysis Grids, Flood Risk Assessment, and Areas of Mitigation Interest datasets. Other enhanced datasets may be developed as well. Mapping Partners should reference FEMA’s Guidelines and Standards for Flood Risk Analysis and Mapping for the development of these products and datasets.
AREAS OF MITIGATION INTEREST This sub-element dataset provides information about local mitigation successes, integrates available data relevant to mitigation, and adds key mitigation-related findings. It is intended to provide a more holistic picture of flood risk-related issues that may impact them and allows a more systematic approach to address potential flood risk.
CHANGES SINCE LAST FIRM This sub-element dataset depicts the changes in spatial extents between the previous and newly revised FIRMS.
FLOOD DEPTH AND ANALYSIS GRIDS These sub-element raster datasets depict flood elevations, depths, and percent chance of flooding in order to communicate potential risk.

Blue Book|31
MULTI-HAZARD AND FLOOD RISK ASSESSMENT This sub-element dataset reflects the potential loss estimates (damages) resulting from multi hazards or floods of various magnitudes. The losses can be derived at the individual building/structure level or aggregated to the US Census block areas.
CNMS Updates This project element is defined as the updating of the CNMS Regional File Geodatabase at the Discovery, Preliminary and/or LFD flood risk project phases to reflect needs, requests, or changes to the existing CNMS inventory in study extents and attributes. The updates take place at each phase of a flood risk project as necessary and cost should be based upon each phase required.
In-Kind Services Discovery Task This project element includes review and evaluation of the project area to determine if a Risk MAP project is appropriate. The following activities may be included in this task: watershed stakeholder engagement, data analysis, discovery meeting and follow-up, and scope refinement as defined in the Mapping Activity Statement and outlined in FEMA’s Guidelines and Standards for Flood Risk Analysis and Mapping.
Discovery Outreach This project element is defined as outreach activities during the Discovery phase of the Flood Risk Project. Tasks that occur as part of Discovery Outreach fall into in-kind services and include meeting logistics, data mining, meeting attendance, and pre- and post-meeting coordination.
Activities that occur as part of these tasks may include: Pre-Discovery Meeting activities (Project Kickoff Meeting; Developing Project Plan; Stakeholder identification; Key Influencer Assessment, Coordinate consolidation of spatial datasets; Hazard Mitigation Plan Collection and Review; Action Identification and Planning; Community Interview; Calls to encourage interview submission; Determine meeting logistics; Develop and disseminate invitations and track RSVPs; Calls to encourage attendance; Meeting material preparation; Develop Mitigation/Resiliency Plan Action Matrix; Review Draft Discovery Maps; Develop draft Discovery Report), Discovery Meeting activities (Meeting Attendance and Facilitation, Meeting Notes), and Post-Discovery Meeting activities (Database update; and Post Meeting Coordination; Project close out and Risk MAP project planning; Finalize Discovery Report and Maps; 508 Compliance coordination.) Please note that this is not an exhaustive list of activities.
Outputs for Discovery Outreach may include:
• Meeting Agenda• Stakeholder’s Contact List• Meeting Invitations/Save the Date
Emails• Community Identification and Outreach• Community Interview document• Conduct calls to communities to
encourage participation
• Community Information Profiles,Discovery Meeting Agenda
• Meeting/PowerPoint• Outreach Materials, Meeting Summary• Conduct and draft summary report of
stakeholder interviews and communityneeds survey
• List of Attendees
Blue Book|32
• Discovery Report
Please note that this is not an exhaustive list of outputs.
Mitigation and Community Outreach This project element is defined as overarching project community engagement, rather than Risk MAP meeting specific engagement, and activities may include Homeowner Engagement, Public Event Logistical Support, Public Event Execution Support, LOMC-Related Communication and Outreach. Note: Element activities must be demonstrated over the course of the project as opposed to single demonstrations.
Risk MAP Meeting Outreach (Flood Risk Review, Resilience, CCO/PDCC only.) This project element is defined as outreach activities during the phases of a Flood Risk Project that include the Resilience Meeting, the CCO Meeting, the Flood Risk Open House, and the Flood Risk Review Meeting. See previous definition for Discovery.
Activities may include: Attend meeting, Meeting notes and after action items, Pre-meeting coordination such as contact list development, mitigation data mining, invitation preparation, outreach phone calls, or meeting materials preparation (presentation, maps, figures, and digital data); meeting facilitation; and post meeting deliverables such as minutes, action compilation, or updated/final dataset delivery. Develop networks with local officials for future needs in public and other meetings, Review past community actions and correspondence, Secure meeting venue, prepare meeting invitations, Identify/Engage Stakeholders, Community Meetings, After Action/Post Meeting Actions, Create PowerPoint Presentation, Advertisement Materials, Meeting Coordination, Attend Open Houses, Operate Virtual Town Hall, After Action/Post Meeting Actions, Develop/Execute Outreach Strategy, Community Assessment, Review Community Mapping, Materials Audit, Development of New Materials, Stakeholder Engagement, Stakeholder Meeting for Revised Prelim Rollout, Stakeholder Engagement Strategy, Coordination calls/meetings. Please note that this is not an exhaustive list of activities.
Outputs may include:
Customized outreach materials for local community use, Customized talking points for local officials to use when opening the meetings, Background logistical information for the Regional Project Team, Creation of PowerPoint presentation, Sign in sheets, Meeting Notes. Please note that this is not an exhaustive list of outputs.
6. Acronym List
BLE – Base Level Engineering
CCO – Community Coordination and Outreach
CNMS – Coordinated Needs Management Strategy
CTP – Cooperating Technical Partners
DD – Data Development

Blue Book|33
DEM – Digital Elevation Model
DFIRM – Digital Flood Insurance Rate Map
DVT – DFIRM Verification Tool
FEMA – Federal Emergency Management Agency
FBS – Floodplain Boundary Standard
FHD – Flood Hazard Determination
FIRM – Flood Insurance Rate Map
FIS – Flood Insurance Study
FRP – Flood Risk Products
H&H – Hydrologic & Hydraulics
HUC – Hydrologic Unit Code
KSS – Knowledge Sharing Site
LAMP – Levee Analysis and Mapping Plan
LAS – Log ASCII Standard
LFD – Letter of Final Determination
LiDAR – Light Detecting and Ranging
LiMWA – Limit of Moderate Wave Action
LLPT – Local Levee Partnership Team
LOMC – Letter of Map Changes
LOMR – Letter of Mapping Review
LSAE – Large-scale Automated Engineering
MAS – Mapping Activity Statement
MIP – Mapping Information Platform
NAIP – National Agriculture Imagery Program
NFIP – National Flood Insurance Program
NFHL – National Flood Hazard Layer
P4 Tool – Project Planning and Purchasing Tool
PAL – Provisionally Accredited Levees
PE – Professional Engineer
PLS – Professional Land Surveyor
PTS – Production and Technical Services

Blue Book|34
QA/QC – Quality Assurance/Quality Control
QL – Quality Level
QR – Quality Review
Risk MAP – Risk Mapping, Assessment and Planning
SFHA – Special Flood Hazard Area
SOMA – Summary of Map Actions
TIGER – Topologically Integrated Geographic Encoding and Referencing
TSDN – Technical Support Data Notebook
WSEL – Water Surface Elevation