e ploring etfs - global x funds ploring etfs chief investment office jon maier, ... currency, as...
TRANSCRIPT

0
e ploring ETFs Chief Investment Office Jon Maier, CIO [email protected] Jay Jacobs, Director of Research [email protected] Rohan Reddy, Research Associate [email protected]
Q4 2017
© GLOBAL X MANAGEMENT COMPANY LLC. All numbers are approximate.

1
Table of Contents
ETFs: The Basics
ETFs: Market Size & Assets Under Management (AUM)
ETFs: Key Comparisons to Mutual Funds
ETFs: Index Investing & Its Popularity
ETFs: Purposes & Potential Uses
ETFs: Deeper Dive – Thematic Investing
ETFs: Proliferation & Market Complexity
ETFs: Deeper Dive – Diversification, Concentration Risk & Factor Investing
ETFs: Relationship to Capital Markets
ETFs: Total Cost of Ownership (TCO)
ETFs: Deeper Dive – ETFs & Tax Efficiency
ETFs: Securities Lending
2
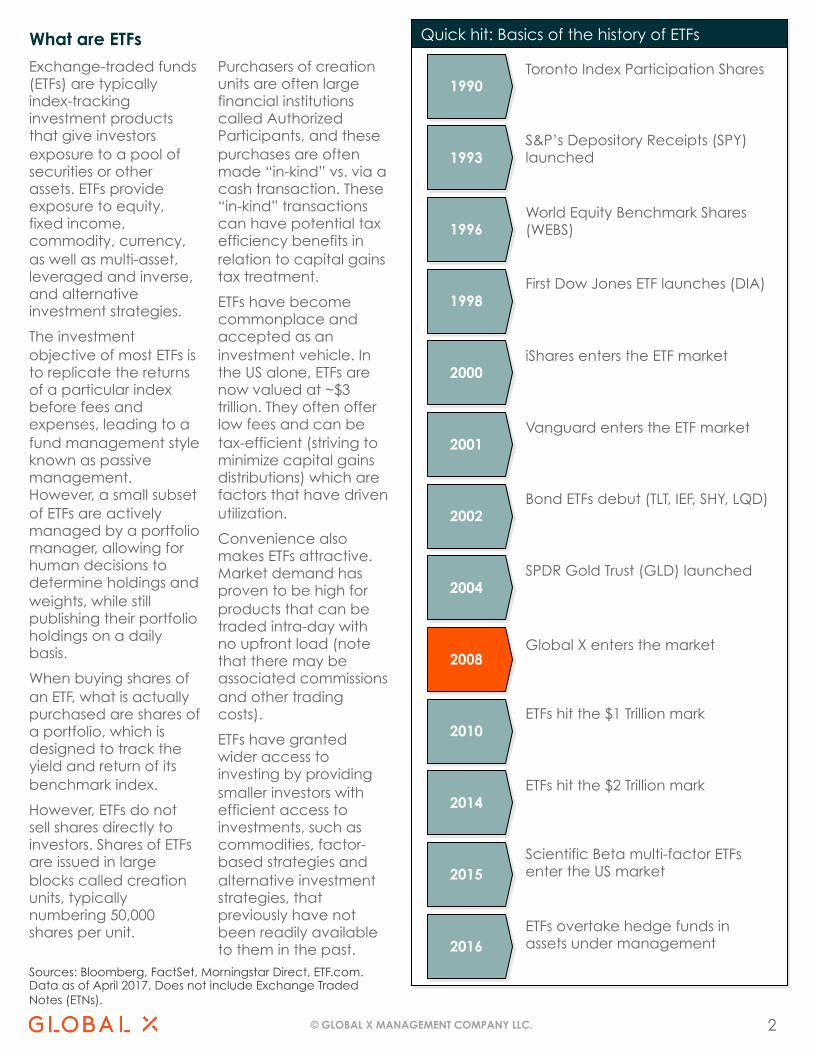
Quick hit: Basics of the history of ETFs
© GLOBAL X MANAGEMENT COMPANY LLC.
What are ETFs
Exchange-traded funds (ETFs) are typically index-tracking investment products that give investors exposure to a pool of securities or other assets. ETFs provide exposure to equity, fixed income, commodity, currency, as well as multi-asset, leveraged and inverse, and alternative investment strategies.
The investment objective of most ETFs is to replicate the returns of a particular index before fees and expenses, leading to a fund management style known as passive management. However, a small subset of ETFs are actively managed by a portfolio manager, allowing for human decisions to determine holdings and weights, while still publishing their portfolio holdings on a daily basis.
When buying shares of an ETF, what is actually purchased are shares of a portfolio, which is designed to track the yield and return of its benchmark index.
However, ETFs do not sell shares directly to investors. Shares of ETFs are issued in large blocks called creation units, typically numbering 50,000 shares per unit.
Purchasers of creation units are often large financial institutions called Authorized Participants, and these purchases are often made “in-kind” vs. via a cash transaction. These “in-kind” transactions can have potential tax efficiency benefits in relation to capital gains tax treatment.
ETFs have become commonplace and accepted as an investment vehicle. In the US alone, ETFs are now valued at ~$3 trillion. They often offer low fees and can be tax-efficient (striving to minimize capital gains distributions) which are factors that have driven utilization.
Convenience also makes ETFs attractive. Market demand has proven to be high for products that can be traded intra-day with no upfront load (note that there may be associated commissions and other trading costs).
ETFs have granted wider access to investing by providing smaller investors with efficient access to investments, such as commodities, factor-based strategies and alternative investment strategies, that previously have not been readily available to them in the past.
Sources: Bloomberg, FactSet, Morningstar Direct, ETF.com. Data as of April 2017. Does not include Exchange Traded Notes (ETNs).
Toronto Index Participation Shares 1990
S&P’s Depository Receipts (SPY) launched 1993
World Equity Benchmark Shares (WEBS) 1996
First Dow Jones ETF launches (DIA) 1998
iShares enters the ETF market 2000
Vanguard enters the ETF market 2001
Bond ETFs debut (TLT, IEF, SHY, LQD) 2002
SPDR Gold Trust (GLD) launched 2004
Global X enters the market 2008
Scientific Beta multi-factor ETFs enter the US market 2015
ETFs hit the $1 Trillion mark 2010
ETFs hit the $2 Trillion mark 2014
ETFs overtake hedge funds in assets under management 2016

3 © GLOBAL X MANAGEMENT COMPANY LLC.
ETFs: Market Size & Assets Under Management (AUM)
There are several key drivers that have led to the growth of ETF assets under management. These key drivers can include the unique characteristics of ETFs, the exposure ETFs provide to previously inaccessible markets and the increased use of asset allocation models and strategies.
The unique characteristics that distinguish ETFs from traditional mutual funds, including: intra-market-day fund liquidity, full transparency of holdings and ability to be created or redeemed by certain investors in large units via in-kind trading vs. via cash.
ETFs have in some ways truly democratized investing
as they allow small and large investors access to previously inaccessible or cost-prohibitive markets domestically or abroad.
As access to markets has expanded, the already complicated business of investing has only grown more complex. The growing use of asset allocation models, which incorporate a combination of investment products can help to streamline some of this complexity, and adoption by advisors as an integral part of their practice has become quite widespread.
All in all, ETFs have seen rapid adoption (see chart below), especially in the US, and the forecast for growth continues to look robust.
1 CAGR = Compound Annual Growth Rate: The mean annual growth rate of an investment over a specified period of time longer than one year Sources: Bloomberg, Morningstar, Statista; data as of March 31, 2017
Worldwide ETF Assets Under Management (USD, billions)
$-
$500
$1,000
$1,500
$2,000
$2,500
$3,000
$3,500
$4,000
2003 2004 2005 2006 2007 2008 2009 2010 2011 2012 2013 2014 2015 2016
Rest of world
US
24% CAGR1

4 © GLOBAL X MANAGEMENT COMPANY LLC.
ETFs: Market Size & Assets Under Management (AUM)
When examining global market share, ETF assets can be split apart by asset class, economic development and region. Developed markets largely represented by the US often represent a large portion of the total number of ETF assets under management no matter how market share is split.
By Asset Class
ETFs that track indexes that are equity based make up the majority (~78%) of all ETF AUM. Fixed Income ETFs are also a very material portion of the market (~17% market share).
By Category
It is probably no surprise that US Equities and the indexes that track them have the highest notional value, at ~44% of total AUM, when splitting apart ETFs across Equities, Fixed Income, and Alternatives.
# of ETFs
ETFs tracking International Equities have the highest number of funds in the ETF universe right now. Equities in general make up nearly 60% of the ETF fund universe.
Source: Morningstar Direct. Data as of August 25, 2017
Asset Class Assets ($M) Market Share (%) # of ETFs
Equity $ 2,394,156 78% 1219
Fixed Income $ 518,698 17% 260
Commodity $ 63,410 2% 123
Alternative $ 47,410 2% 358
Tax Preferred $ 27,634 1% 37
Asset Allocation $ 7,273 0% 48
Convertibles $ 4,429 0% 3
Total $ 3,063,011 100% 2048
Category Breakdown Assets ($M) Market Share (%) # of ETFs
US Equity $ 1,362,150 44% 396
International Equity $ 649,245 21% 461
Taxable Bond $ 518,698 17% 262
Sector Equity $ 382,762 12% 362
Commodities $ 63,410 2% 122
Alternative $ 47,410 2% 359
Municipal Bond $ 27,634 1% 37
Asset Allocation $ 11,702 0% 51
Total $ 3,063,011 100% 2050

5 © GLOBAL X MANAGEMENT COMPANY LLC.
ETFs: Key Comparisons to Actively Managed Mutual Funds
Comparing Potential Benefits & Risks ETFs Actively Managed Mutual Funds1. Portfolio Disclosure • Required to disclose their holdings daily
• Typically disclose portfolio items quarterly
but only required 2x/year
2. Secondary Market Trading • Trade on an exchange throughout the day
• ETF price generally trades close to net asset values (though can deviate from NAV)
• Mutual fund shares are purchased or redeemed at the end of the trading day, and at NAV directly from the fund
• NAV is calculated once per day based on the closing market prices of the securities in the fund, as they do not trade on an exchange
3. Share Creations & Redemptions
• Depending on exposure, typically done through an in-kind transfer of securities process with an authorized participant
• Only Authorized Participants may create and redeem shares from the fund and do so at NAV
• While most ETFs handle creations and redemptions via in-kind transfers, some do so via cash transaction.
• Typically done for cash
• Investors buy and redeem directly from the fund
4. Tax Efficiency • The in-kind creation and redemption feature of ETFs’ typically triggers fewer taxable gains vs. actively managed mutual funds
5. Targeted Exposure • Generally, because of the actively-managed nature of mutual funds, they can exhibit more flexibility in sector and industry diversification, style, capitalization and geography
6. Fees • Tend to have lower fees, particularly for market-cap weighted index funds
• As with stock trading, investors may be charged a commission when trading ETFs
• Tend to have higher fees
• Can include sales load or 12b-1 (sales & marketing expense) fees built in
There are six key dimensions on which to compare ETFs and Actively Managed Mutual Funds: Portfolio Disclosure, Secondary Market Trading, Share Creations & Redemptions, Tax Efficiency, Targeted Exposure and Fees (see chart below for discussion on potential benefits and risks for ETFs and Actively Managed Mutual Funds).
Across these six dimensions some of the benefits, namely transparency of holdings, ease of trading and generally lower fees, of ETFs may shine through. Some areas where actively managed mutual funds may shine over ETFs include, but are not limited to, the flexibility to achieve a targeted exposure (see #5 below). Also, a more thorough
discussion of ETFs’ in-kind share redemption and creation process follows later in this document.
Often when looking at ETFs, it is important to think about the value of index investing (see next page for “Index Investing & Its Popularity”) and on the transparent precision of ETFs (i.e., systematic, published methods), which can eliminate manager drift and are available to every investor in the ETF in question.
While Active Mutual Funds remain a larger business at this point, in terms of AUM, the rapid growth of ETFs does show the potential for ETFs to continue to take market share from Actively Mutual Funds, especially as investors become increasingly aware of ETFs and weigh their potential benefits and risks.
Investment comparisons are for illustrative purposes only. To better understand the similarities and differences between investments, including investment objectives, risks, fees and expenses, it is important to read the products' prospectuses.

6 © GLOBAL X MANAGEMENT COMPANY LLC.
ETFs: Index Investing & Its Popularity
The move away from higher-cost, actively managed products has been increasing over time (see column graph below).
Index investing has gained popularity due to many potential factors, which include greater investor demand for beta vs. alpha,1 especially in periods of volatility, underperformance by active managers,
asset management industry’s emphasis on asset allocation vs. individual stock picking.
Passively-managed ETFs track indexes and the gaining popularity of index investing has, in turn, triggered a proliferation of ETFs in the market, which is reflected in increased trading volumes (see line graph below).
1 Definitions: Beta measures how an asset moves versus an index. Alpha is a historical measure of an asset's return on investment compared to the risk adjusted expected return 2 Source: Morningstar; Note: Does not include money market funds 3 Sources: data as of June 2017, Nasdaq Equities Market Share Stats, as of June 2017; Note: Does not include money market funds
10.0%
32.1%
0%
50%
Market Share in US ETFs ETF Market Share
ETF volume as a percent of total US equity market volume3
Passive vs. Actively Managed Equity Assets: Net flows of U.S. stock mutual and exchange-traded funds2
$Billions $200
$150
$100
$50
-$50
-$100
-$150
-$200 1993 2016
Years
Passively Managed
Actively Managed
7
Market & Thematic Access
• Gaining market access/exposure is a common reason investors employ ETFs
• Markets accessed can include: Global Equity, Metals, Mining & Natural Resources, Currency, and Bonds
• Also, exposure to investment themes such as real assets and dividend yield can be explored
Core w/Satellite & Beta+ Portfolio Strategies
• ETF’s Intraday liquidity and transparency of portfolio holdings has led to adoption by Registered Investment Advisors, Financial Advisors and individual investors in portfolios.
• Core w/Satellite Portfolio: o Core: Anchor often provided by broad exposure
ETFs
o Satellite: Individual security positions can seek to provide alpha
• Beta+: o Invest only in ETFs; easy access to different risk
factors o Can track large sectors & the sub-sectors within
(ETF transparency of holdings and access to exposure to different risk factors, sectors, sub-sectors can combine to allow investors to seek alpha via a portfolio of beta investment products)
Interim Beta & Cash Equalization
• The liquidity that ETFs can provide can help to minimize “cash drag” on a portfolio (i.e., allowing a portfolio manager to gain index beta exposure rather than keeping cash on the books)
• When potential investors have new money to put to work, ETFs can offer a intraday-traded market-based solution
• “Sitting in cash” can become a strategic choice vs. a necessary one
Directional Views, Leverage & Hedging
• Sophisticated investors utilize ETFs for leverage and hedging (short exposure) as it’s more flexible for them in positioning on shorter-term market movements
In Comparison/Contrast to Futures
• Movements in futures contracts are often mirrored by ETF trading patterns. Though, if a foreign market is outside its open trading hours, an ETF may continue to trade in the US. When outside trading hours of the underlying index, market perceptions on how the underlying components may trade for the next day can be priced into the stock price of an ETF based on knowledge of the current events surrounding the underlying index that an ETF tracks.
• ETFs are more broadly available to clients because they do not involve a role from clearinghouses or meeting margin requirements
© GLOBAL X MANAGEMENT COMPANY LLC.
ETFs: Purposes, Potential Uses & Trading
Trading ETFs – Revisiting Some Basics
Trading on the open or close of the market can result in increased volatility early and very late in the trading day. The spread in an ETF’s price and net asset value (NAV) can be the widest at the market’s open and close. At the open, pricing differences can persist until all the underlying components that comprise the ETF begin to trade.
Towards the market close, market makers begin to balance their books which can trigger wider spreads and potentially increased volatility. Restricting ETF purchases or sales to 30 minutes after the market’s open or 30 minutes before the market’s close may help to alleviate spreads and pricing discrepancies. It is possible to have more orders at the open or close, which can lead to
purchasing an ETF with an unintended premium. Explore using marketable limit orders instead of “market” orders.
A limit order is a price set at or above the bid/ask when buying and at or below when selling, this provides some price protection over a market order. As per the SEC, “A limit order is an order to buy or sell a stock at a specific price or better. A buy limit order can only be executed at the limit price or lower, and a sell limit order can only be executed at the limit price or higher. A limit order is not guaranteed to execute.”
Therefore, using a limit order may help to avoid paying an unintended premium.
With short sales, you risk paying more for a security than you received from its sale. Short sales losses are potentially unlimited and the expenses involved may negatively impact your portfolio. Leverage may increase volatility and decrease returns.

8
4 Examples of Themes
1 Towers Watson, “Thematic Investing,” March 2012 2 Merrill Lynch, “A Transforming World,” July 2014. 3 UBS, “House View. 2016 and Beyond,” 2016. 4 Bloomberg, “Planning for the Future Through Thematic Investing,” April 15, 2015.
Defining Thematic Investing
Thematic investing refers to the process of identifying powerful macro-level trends and the underlying investments that stand to benefit from the materialization of those trends. Many investors already apply principles of thematic investing, such as identifying investments that could benefit in a rising interest rate regime, in their portfolios.
But, thematic investing extends far beyond economic policies, and can potentially be most effective when used to identify opportunities in areas, such as (box at right), people’s changing demographics, evolving consumer behaviors, innovative technologies, and the availability of natural resources
Using Thematic Investing
Investors who apply a thematic investment approach are often returns-focused, either seeking to beat a relative benchmark (e.g., the S&P 500) or an absolute return benchmark over the long term.
According to a recent report from UBS, “Investors who are willing to follow the insights of such long-
term themes over multiple business cycles can benefit from potential mispricing created by the typically shorter-term focus of financial markets.”3
Beyond serving merely as a growth play, themes can also be utilized to relate investing to an end-client, as some prefer making allocation decisions based on things they know and can observe. According to Merrill Lynch, three-quarters of US Millennials list long term thematic issues as one of their top three determining factors when making an investment decision.4
Some sophisticated institutional investors have used thematic strategies as a form of hedging risk, such as a pension fund with high exposure to oil prices investing in companies in the renewable energy space, which could succeed at oil’s expense.
“Looking forward, we believe that thematic investing can outperform in the brave, new, post-QE world; that early, contrarian theme adopters can benefit from its low frequency investment style; and that capital flows are increasingly theme driven.”
–Merrill Lynch2
ETFs: Deeper Dive into Thematic Investing
© GLOBAL X MANAGEMENT COMPANY LLC.
“Thematic investing is about capitalizing on future trends. Its forward-looking nature stands in clear contrast to the more widely used market capitalization approach [which] assumes that past winners will continue to win out… Why is thematic investing a good idea? In a rapidly changing business environment, the winners will be those that anticipate trends and take advantage of new opportunities.”
–Towers Watson1

9
An Unconstrained Approach
Given thematic investing’s agnostic approach to geographies and sectors, it can have low correlations to other portfolio strategies, which can be particularly useful for investment managers seeking to diversify sources of growth.
Unlocking Thematic Investing with ETFs
A key potential benefit to using thematic ETFs is the ability to access dozens of companies around the world with a single trade.
Traditionally, thematic investing has been limited to
more sophisticated institutional investors due to the research required to pinpoint companies with high exposure to a theme and the need to access a variety of international markets for themes that are global in nature.
Passive thematic ETFs (i.e., ETFs that track indexes that) take care of the security selection process and can provide access to a broad set of companies around the world with exposure to a particular theme.
Potential Keys to Success
• Correctly identifying structural shifts
• Finding companies with high exposure to those shifts
• Entering before earnings and forecasts are fully priced in the theme’s potential
“Investors should assess the high-level attractiveness of the theme and make sure there are… companies whose businesses are heavily exposed to the theme… (An investor must then monitor the theme) over time to find the right entry (and exit) points.”
–McKinsey2
ETFs: Deeper Dive into Thematic Investing
© GLOBAL X MANAGEMENT COMPANY LLC.
“Thematic investing ignores geographical boundaries, style biases and market capitalization, and it transects traditional sector classifications. This provides investors with a distinctive strategic advantage: The ability to look across all geographies to identify emergent and potentially rewarding investment trends.”
–RBC1
1 Global Megatrends. Capitalizing on Tomorrow’s Trends Today. 2 From Indexes to Insights. The rise of Thematic Investing.
Characteristics Stronger Approach Weaker Approach
Conviction High, due to observable structural changes in demographics, technology, behavior or politics/regulations
Limited, due to conjecture and low likelihood of theme materializing
Investability Broad group of publicly traded companies, with high liquidity, that provide targeted exposure to the theme
Narrow group of companies with low liquidity, and only tangential exposure to the theme
Time Frame Medium to long term, making market timing less of a factor
Shorter term, placing greater importance on timing
Characteristics & Approaches to Thematic Investing

10 © GLOBAL X MANAGEMENT COMPANY LLC.
ETFs: Proliferation & Market Complexity
The number of ETFs in the market has grown substantially over the years and now is approaching 2,000 in total. ETFs have a number of most-common types and three of them – Equity ETFs, Non-market cap weighted ETFs, and Commodity ETFs – bear more discussion here.
Equity ETFs
• Most assets of all ETFs when grouped by asset class exposure: o ~1,219 equity ETFs o >$2.4 trillion in assets
o ~78% AUM market share • Track a diverse set of benchmarks, including: o Global equity indexes o Thematic indexes (e.g., Robotics, Social Media)
• Differences among equity ETFs can vary by (see callout box, bottom right): o Synthetically Replicated o Physically Replicated
• Fund structure and the way in which funds are replicated do have implications for: o Tax efficiency o Tracking Error o Fund Expenses o Premiums/Discounts
Non-market cap weighted ETFs
• Excluding single asset ETFs like those that invest in gold or silver, non-market cap weighted ETFs: o Number >700 ETFs o >$600 billion in assets
o ~20% AUM market share • Market evolution has pushed into weighting
methodologies based on alternative strategies: o Based on fundamentals v Can be based on company-specific metrics
(e.g., revenues, cash flows, dividends, book value), and has the potential to provide a more accurate picture of economic reality if one believes market prices of securities can stray from fair market values
v Can lead to, by design, a value bias (i.e., might overweight value stocks vs. growth stocks, vs. market cap weighting)
o Equal weighting: Weights are evenly spread among all included index components (i.e., typically smaller-cap stocks have greater presence vs. a market cap weighted index)
Quick hits: Facts on select types of ETFs1
0 500 1000 1500
Number
Equity ETFs Non-market cap weighted ETFs Commodity ETFs
$0 $1,000 $2,000 $3,000
AUM ($B)
0% 50% 100%
Mkt Share
Quick hits: Physical vs. Synthetic ETFs
Physical ETFs Synthetic ETFs
Underlying Holdings
Securities of the Index
Swaps and Collateral
Transparency Fully transparent Historically low transparency
Counterparty Risk
Limited Existent (higher than physical ETFs)
Costs Transaction costs, management fees
Swap costs, management fees
Source: Bloomberg, FactSet, Morningstar Direct, CIO GPS. Data as of August 25, 2017. Does not include Exchange Traded Notes (ETNs) 1 Note: “Non-market cap weighted ETFs” are also included in “Equity ETFs” in each graph

11 © GLOBAL X MANAGEMENT COMPANY LLC.
ETFs: Proliferation & Market Complexity
Category Type Features
Physical ownership
Direct physical gold ownership
• Most direct exposure to gold prices, but can have high storage, insurance and transaction costs
• Physical gold ownership is taxed at the collectibles rate, currently capped at a rate of 28%
Physical gold ETFs
• Offer greater liquidity vs. direct physical ownership and handles storage and insurance aspects, but incurs a management. fee
• Similar to direct physical gold ownership, physical gold ETFs are taxed at the collectibles rate
Derivatives Options & Futures
• Can give investors exposure to the price changes of gold with small or lower capital commitments
• May offer more liquidity than direct ownership and the opportunity to employ leverage, but can suffer from contango2 and less advantageous taxation
Gold Equities Gold mining stocks
• Provide indirect exposure to the gold market by investing in companies involved across the supply chain
• Can be highly leveraged to the price of gold • Expose investors to the operational risks of individual mining
companies
• Taxed, as an equity, at short- or long-term capital gains rates
Gold mining ETFs
• Offer exposure to a broad basket of companies involved in the gold supply chain
• Can come in a variety of flavors for more targeted exposures (e.g., ETFs focused on the broad mining space, gold exploration companies, small-cap / “junior” miners)
• Can be heavily leveraged to the price of gold and have fund fees
• Taxed, as an equity, at short- or long-term capital gains rates
Commodity ETFs1 (example below)
• Quick breakdown of current commodity ETFs in market: o 123 commodity ETFs o >$63 billion in assets
o 2% AUM market share
• Many are focused on Energy, Agriculture, Metals, Mining, etc.
• Provide easy access (vs. direct investment in futures or asset-backed contracts) to many commodity markets
• May be taxed differently vs. other ETFs
Methods for Gaining Exposure to Commodities: Example - Gold
1 Source: Morningstar, data as of 8/25/17 2 Contango is a situation where the futures price of a commodity is above the expected future spot price.

12 © GLOBAL X MANAGEMENT COMPANY LLC.
Much of the attention around smart beta or factor-based investment strategies has focused on the potential for outsized returns by accessing historically well-rewarded factors such as value, momentum, low volatility, and size. However, an equally important part of the equation when analyzing these strategies is their risks and how they (may or may not) seek to mitigate those risks through diversification. Diversification is useful because when properly implemented it can reduce risks without necessarily sacrificing returns. Scientific Beta, the indexing arm of the EDHEC-Risk Institute, has taken a unique approach to smart beta by focusing equally on harvesting outperformance from well-rewarded factors, while maintaining a well-diversified portfolio to potentially improve risk-adjusted returns.
It’s easy for ETF users to take diversification for granted. After all, one of the core benefits of ETFs is that they allow investors to access a portfolio of hundreds or even thousands of securities in a single trade. But while market cap weighted ETFs, such as ones that provide exposure to the S&P 500, are significantly more diversified than buying a single stock, they can still suffer from concentration issues. For example, the top 10 holdings in the S&P 500 make up nearly 19% of the portfolio’s weight.1 The smallest 304 stocks in the S&P 500 make up just 13% of the weighting, which poses an important question: although a broad market cap weighted index can provide access to hundreds of stocks, is it an optimally diversified portfolio if it is so top-heavy?
Academics often address this question by calculating the effective number of stocks in a portfolio, based on the Herfindahl Index’s2 measure of concentration. The effective number of
stocks equates a particular index’s concentration to that of an equal weighted index. For example, the S&P 500, despite holding 500 companies, has an effective number of stocks of 142.3 This means that the S&P 500 has the same level of concentration as an equal weighted index with 142 components. Therefore according to this measure the diversification, 358 stocks, or over 70% of the index, are wasted due to the top heavy weighting scheme. (Refer to Figure 1, below)
In addition to the concentration issues related to cap-weighted indexes, there is a potential performance setback as well: market cap weighted indexes inherently provide more exposure to large cap companies and growth stocks, since these companies tend to have higher market capitalizations than small caps or value companies. Fama and French, in their seminal factor research, however, showed that small caps and value companies tend to outperform large caps and growth companies. Therefore constructing an index that has better diversification characteristics not only holds the potential to reduce concentration risks, but also improve performance by moving away from the concentrated large cap growth names in a market cap weighted benchmark. The S&P 500 Equal Weight Index demonstrates this effect: by equal-weighting its components it takes a simple approach of de-concentration and shifts its exposures away from the large cap growth names that dominate the regular market cap-weighted S&P 500 index. Since 2006, the equal weight index has outperformed the regular S&P 500 by an annualized 112 basis points, largely attributable to the inherent size and value tilt of the index.4
1 Source: S&P, Global X Research. Data as of 9/26/2017. 2 The Herfindahl Index is the sum of squared weights of each index component.. The Herfindahl Index is also used by anti-trust regulators in the United States to determine the impact of M&A of major corporations on the competitiveness of an industry. 3 Source: S&P, Global X Research, 2017. 4 Source: Bloomberg: 2/28/2006 to 9/26/2017.
Diversification may not protect against market risk.
ETFs: Deeper Dive – Diversification, Concentration Risk & Factor Investing
Top 10 holdings in the S&P 500
Bottom 300 holdings in the S&P 500
= ~19% of the S&P 500’s weight1
~19% of the S&P 500’s weight1
Figure 1 While market cap weighted ETFs, such as ones that provide exposure to the S&P 500, are significantly more diversified than buying a single stock, they can still suffer from concentration issues
=
13 © GLOBAL X MANAGEMENT COMPANY LLC.
Unfortunately, many smart beta or factor indexes are more focused on maximizing factor exposures and reaping their potential rewards than diversifying away idiosyncratic risks associated with concentration. In some instances, this can ultimately lead to even greater concentration issues than a cap weighted benchmark. For example, while the S&P 500 has 19% of its weight in the top 10 holdings, the S&P 500 Value Index, by nature of being a smaller subset of its parent index, has over 26% of its weight in the top 10 holdings and less than 100 effective components.1
Scientific Beta believes that chasing factor performance at the expense of increasing the idiosyncratic risks in a portfolio is not a worthy tradeoff. Instead, they believe that a well-constructed smart beta strategy should both filter for stocks that exhibit well-rewarded factors while improving upon the concentration issues of a cap weighted index, ideally resulting in a much improved Sharpe ratio.2
To incorporate this risk-adjusted approach into their index construction process, they developed a methodology grounded on a few key principles:
Select stocks based on their factor exposures, but use weighting schemes to effectively diversify the components
While there are a variety of weighting schemes that can achieve enhanced diversification over a cap-weighted benchmark, each has inherent model-specific risks, such as relying on historical data or assumptions. They may also have incidental factor tilts or sector biases.
Therefore, incorporating multiple weighting strategies simultaneously is necessary in order to both properly diversify stocks as well as to effectively mitigate the individual risks and biases associated with each weighting scheme.
While it may seem excessive to depend on five different weighting schemes (see callout box on upper right of this page), consider the drawbacks of using only one approach. The Efficient Minimum Volatility strategy, for example, over-weights stocks with lower volatility and low correlations to the rest of the portfolio. In order to do so, it depends on historical estimates which could change in the future which introduces model risks into the methodology (i.e., historical
volatility and correlations may not continue in the future). The strategy also results in a tilt towards the low volatility factor, which can reduce the overall portfolio’s factor-level diversification. Last, it often suffers from sector concentration in certain stocks like utilities. Therefore combining Efficient Minimum Volatility with other strategies, which have their own model risks, factor tilts, and sector biases, may ultimately mitigate the risks and biases inherent in each weighting scheme.
1 Source: S&P, Global X Research. Data as of 9/20/2017. 2 Sharpe ratio is calculated as the strategy’s returns minus the risk free rate and divided by the return volatility. A
higher Sharpe ratio indicates higher returns per unit of risk.
ETFs: Deeper Dive – Diversification, Concentration Risk & Factor Investing
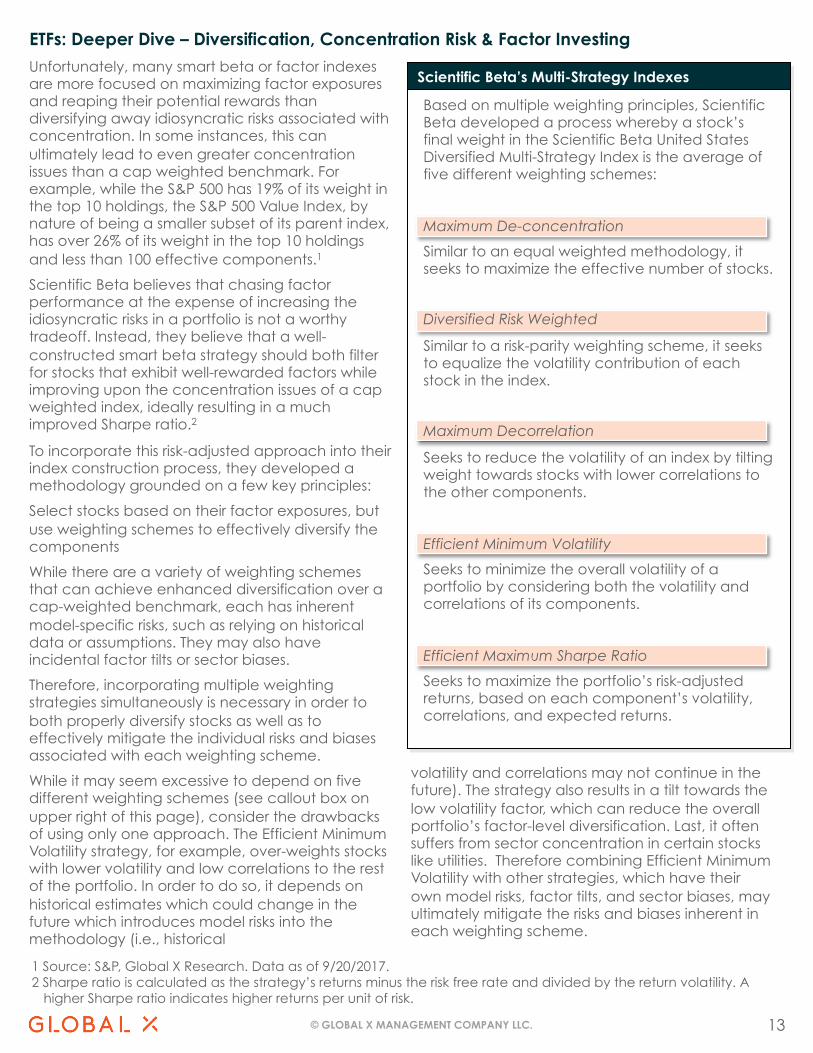
Scientific Beta’s Multi-Strategy Indexes
Based on multiple weighting principles, Scientific Beta developed a process whereby a stock’s final weight in the Scientific Beta United States Diversified Multi-Strategy Index is the average of five different weighting schemes:
Maximum De-concentration
Similar to an equal weighted methodology, it seeks to maximize the effective number of stocks.
Diversified Risk Weighted
Similar to a risk-parity weighting scheme, it seeks to equalize the volatility contribution of each stock in the index.
Maximum Decorrelation
Seeks to reduce the volatility of an index by tilting weight towards stocks with lower correlations to the other components.
Efficient Minimum Volatility
Seeks to minimize the overall volatility of a portfolio by considering both the volatility and correlations of its components.
Efficient Maximum Sharpe Ratio
Seeks to maximize the portfolio’s risk-adjusted returns, based on each component’s volatility, correlations, and expected returns.

14 © GLOBAL X MANAGEMENT COMPANY LLC.
1 Capital Asset Pricing Model (CAPM) is a single factor model that holds that a stock’s expected returns are a function of its market beta and the risk free rate Source: EDHEC Risk-Institute, Global X.
ETFs: Deeper Dive – Diversification, Concentration Risk & Factor Investing
Quick hit: History of Factor Investing
Benjamin Graham writes “The Intelligent Investor” on Value investing
1940s
CAPM Model introduced focused on Market factor 1960s
Morningstar ‘Style Box’ introduced with Value & Size factors
Early 1990s
Single factor ETFs become available 2000s
Multi-factor ETFs become available 2010s
Factor investing has been around for decades in academia and active management, but only recently has become more broadly available through single & multi-factor ETFs
A factor is a characteristic that helps explain a broad group of stocks’ behavior and returns.
Old Approach
• There is only one factor, the “market factor” that can explain stock behavior and returns
• Stock performance and behavior depends on its sensitivity (beta) to the market factor
• Capital Asset Pricing Model (CAPM)1 used to explain stock returns
New Approach
• There are many other factors, that can explain stock behavior and returns: e.g. Value, Size, Momentum, Volatility
• Stock performance and behavior depends on sensitivities to each of these factors
• Multi-factor models from academics such as Fama/French, Carhart, & Frazzini/Pedersen seek to explain stock returns (see Figure 2)
Figure 2 Stocks that exhibit sensitivities to certain factors have historically been rewarded by the market with a premium
Academics seek to explain the existence of factor premiums with risk-based ‘economic’ arguments as well as investor behavioral biases (see next page)
Mid 1990s
Late 1990s
Fama and French introduce 3-factor model (Market, Size, Value)
Carhart introduces 4-factor model to include Momentum factor
French & Fama Carhart Frazzini & Pedersen
Growth LargerHigh
Momentum
Value Smaller LowMomentum
HighVolat ility
LowVolatility
Growth Size Momentum Volatility
Examples of historically rewarded factors (in Orange)

15 © GLOBAL X MANAGEMENT COMPANY LLC.
ETFs: Deeper Dive – Diversification, Concentration Risk & Factor Investing
1 Bloomberg, ERI Scientific Beta, S&P, Q2 2017. Since common inception (12/20/2013) through 6/30/2017. Source: EDHEC Risk-Institute. Factor information as of Jun 2017
Diversification may not protect against market risk. Past performance is not a guarantee of future results.
Since 2013, the diversification-focused Scientific Beta United States Diversified Multi-Strategy has outperformed the S&P 500 by 105 basis points and with 59 basis points lower volatility, showing that diversification can potentially both enhance performance by reducing large cap growth concentrations while reducing volatility. Adding a multi-factor stock selection element to this weighting strategy further increased returns by an
additional 99 basis points, for a total of 206 basis points of outperformance versus the S&P. These results demonstrate the additional return potential from factor-based investing.1 We believe that Scientific Beta’s approach, which marries a diversification-minded weighting scheme with factor-based stock selection, is a superior smart beta strategy for core equity allocations because of its focus on improving risk-adjusted returns.
Four Academic Factors with Risk-based & Behavioral Explanations
Academic Factors
Risk-based Explanation
Behavioral Explanation
Value • Fixed assets are costly to scale down in economic slowdowns, resulting in high sensitivity to economic shocks in bad times
• Investors overreact to bad news and extrapolate recent events to the future, leading to under-pricing below intrinsic value
Momentum • Firms with high growth expectations are more sensitive to shocks in expected growth
• Investors are overconfident and subject to self-attribution bias, leading to return continuation in the short term
Low Volatility • Liquidity-constrained investors have to sell leveraged positions in low risk assets in bad times when liquidity constraints become binding
• Investors disagree about higher risk stocks but short sale constraints leads to overpricing above a stock’s intrinsic value
Size • Smaller companies have lower liquidity, higher distress and greater downside risks
• Smaller stocks receive less attention from investors and are under-priced

16 © GLOBAL X MANAGEMENT COMPANY LLC.
ETFs: Relationship to Capital Markets
Basics of the Relationship – ETFs to Capital Markets
As previously discussed, ETFs do not sell shares directly to investors. Shares of ETFs are issued in large blocks called creation units, typically numbering 50,000 shares per unit.
Purchasers of creation units are often large financial institutions, called authorized participants (APs), and these purchases are often made “in-kind” vs. via a cash transaction.
These “in-kind” transactions can have potential tax efficiency benefits in relation to capital gains tax treatment.
The ETF share creation and redemption process facilitates trading on the secondary market at prices that are generally in line with funds’ Net Asset Values (NAVs), although ETF shares can trade at a premium or discount to NAV.
This process requires that portfolio holdings be disclosed daily.
Profile: The Authorized participants (APs)
• Most often, are sizeable financial institutions, including:
o Market Makers
o Specialists
• Obtain and dispense the underlying assets of an ETF to make the In kind share creation and redemption process possible
• Receive ETF shares for inventory to meet requests in the market or from a specific customer
• Can profit from the difference between the value of the fund’s underlying holdings vs. the price at which the fund trades on an exchange
Sources: SEC.gov, Nasdaq, NYSE
A
B
C
D
AP purchases securities in secondary market
AP delivers securities to Fund or Trust
Fund or Trust provides ETF shares to AP
AP sells ETF shares in secondary market
Fund or Trust
Authorized Participant (AP)
Secondary Market
A
B C
D
Figure 3 The In-kind Creation Process & The Players
B C
A D

17 © GLOBAL X MANAGEMENT COMPANY LLC.
ETFs: Total Cost of Ownership (TCO)
1 If applicable
Annual Expense Ratio x Holding Period (years)
Bid
-Ask
Sp
rea
d
Total Cost of Ownership
Tra
din
g C
om
miss
ion
1
Annualized Tracking Error x Holding Period (years)
a
a b
b
c
c
d
d
Total Cost of Ownership
Figure 4
TCO Illustration Sum the
components
The total cost of owning an ETF may extend beyond its listed management fee.
Other potential ETF costs can be thought of across four verticals (see Figure 4): Expense Ratios, Bid-Ask Spread, Trading Commission1 and Tracking Error.
Once considering all four of these verticals, it is possible that an ETF with a higher expense ratio could have a lower total cost than one with only a lower expense ratio
a. Expense Ratios
• A fund adviser’s charge for managing the ETF, and other expenses such as transaction costs, commissions, etc.
• Often lower for ETFs vs. traditional mutual funds
• Tend to be higher for more difficult to manage funds (e.g., commodity, emerging markets)
b. Bid-Ask Spread
• The difference between the cost to purchase an ETF on an exchange vs. to sell it.
• Often smaller with domestic, large cap securities and larger for smaller cap or international securities
• ETFs with more assets under management tend to trade more frequently and have smaller bid-ask spreads
c. Trading Commission1
• A fee paid to a broker to execute a trade
• Based on a number of shares and/or their value
d. Tracking Error
• How closely the price of an ETF matches its benchmark
• An indication of a fund’s capacity to produce returns in keeping with the underlying index
• Complexity of markets (e.g., emerging markets) can lead to increased tracking error
It is important to note that the expense ratio can change over time, which would change
the TCO accordingly
a
b c
d

18 © GLOBAL X MANAGEMENT COMPANY LLC.
1 There can be significant differences between traditional mutual funds and ETFs. ETFs trade on an exchange, providing intra-day liquidity, but can result in investors paying additional transaction fees. The majority of ETFs in the US are passively managed. Traditional mutual funds do not trade on an exchange, and investors therefore often transact directly with a mutual fund sponsor to buy or sell shares. Many mutual funds are actively managed, which can result in higher fees and turnover.
2 Gains become ‘realized’ when an investment is sold at a price that is higher than its cost basis. Gains are ‘unrealized’ if the investment has a market value higher than its basis, but the position has not been sold.
3 Short term capital gains tax typically applies when a fund or investor held a position for less than one year. Short term capital gains taxes are equal to ordinary income rates, which currently tops out at 43.4%
4 Long term capital gains tax typically applies when a fund or investor held a position for longer than one year. Long term capital gains taxes are usually taxed at a more advantageous tax rate than short term capital gains, and currently tops out at 23.8%
5 Source: Morningstar, 12/30/2016
ETFs: Deeper Dive – ETFs & Tax Efficiency
2016 Capital Gains Distributions (%)5
47%
10%
53%
90%
0% 10% 20% 30% 40% 50% 60% 70% 80% 90%
100%
US Mutual Funds US ETFs
Did Not Distribute Cap Gains Distributed Cap Gains
Compared to traditional mutual funds, ETFs may be more tax efficient because they have a unique method of conducting transactions that provides fund managers an additional tool to help minimize the distributions of capital gains to investors.1 This is one of a handful of reasons that have been driving investment flows from traditional mutual funds to ETFs.
In this section, we will explore three questions:
• What are capital gains taxes?
• How can ETFs be more tax efficient than traditional mutual funds?
• What are some other tax considerations?
Quick look: What are capital gains taxes?
Funds can incur capital gains taxes by selling a holding for a realized gain.2
If at the end of the year the fund has net realized gains (the difference of realized gains and realized losses), this amount is distributed to the fund’s shareholders as a capital gains distribution.
Shareholders holding the fund in a taxable account are on the hook to pay taxes on this distribution at either short term or long term capital gains rates, depending on how long the fund held the securities for.3,4
Broadly speaking, investors would prefer that funds distribute less or no capital gains as it defers tax payments and allows one’s initial investment in the fund to continue to grow on a pre-tax basis (see graph below).
The bottom line with capital gains is that when a mutual fund or ETF is sold there is a gain on the investment (or loss) unless the seller is an institutional investor receiving the underlying components of the ETF. Otherwise, there isn’t much to be done to mitigate gains.

19 © GLOBAL X MANAGEMENT COMPANY LLC.
ETFs: Deeper Dive – ETFs & Tax Efficiency
Figure 5
Why can ETFs be more tax efficient vs. Traditional Mutual Funds?
In 2016, only 10% of ETFs in the US made capital gains distributions, compared to 57% of mutual funds. In 2016, only 2 of Global X’s 55 ETFs made a capital gains distribution.
ETFs tend to be more tax efficient than mutual funds because they can transact on an in-kind basis, rather than in cash, which has resulted in less frequent capital gains distributions to investors. To understand this, we must first explore how mutual funds incur capital gains.
Mutual funds can generate capital gains in two ways: 1) Redemptions made by fund shareholders; and 2) Regular turnover of the fund’s holdings. Mutual fund transactions are made in cash, meaning that if an investor redeems shares, the manager may be forced to sell fund holdings in order to make cash available to deliver to the redeeming investor (see Figure 5). This can result in capital gains, if the manager is forced to sell holdings at a higher price than their cost basis to raise the necessary cash. In addition, whenever a fund manager wants to modify a fund’s exposures, the manager generally must sell shares of certain securities to raise the cash to buy others. This process of selling an existing security for cash can result in capital gains if the securities are sold for an amount higher than their cost basis.
Mutual fund managers may implement a few strategies to potentially reduce capital gains, including holding a higher percentage of the fund’s assets in cash to meet daily redemptions, or employ
tax-lot management, which means selling shares with the highest cost basis first.
In many instances, ETFs can avoid generating capital gains even if investors redeem their shares of the fund or if the fund has high turnover. This is because ETFs often have the ability to transact on an in-kind basis, rather than in cash.
For example, investors looking to sell shares of an ETF do not receive cash from the ETF sponsor, rather they sell the ETF though an authorized participant (AP) who aggregates ETF shares in large lots called creation units and delivers those shares to the ETF sponsor. In return, the ETF sponsor delivers securities positions held by the fund equal to the value of the creation unit.
This in-kind exchange of securities means that the fund is not selling securities for cash and therefore capital gains are not incurred (see Figure 6).
Similarly, consider an ETF portfolio manager who is rebalancing a fund and needs to sell a position that has appreciated significantly since it was originally purchased. Rather than selling that security for cash and incurring capital gains, the portfolio manager can offload those shares to an AP in a process called a custom in-kind redemption.
The AP then buys the shares that the ETF portfolio manager wants to own and returns them to the fund via an in-kind creation. Now, the fund owns the correct securities, but avoided a cash transaction of selling shares for cash.
In addition to this custom in-kind redemption tool, ETF portfolio managers can also use tax-lot management to minimize capital gains distributions.
Past distributions are not indicative of future distributions.

20 © GLOBAL X MANAGEMENT COMPANY LLC.
ETFs: Deeper Dive – ETFs & Tax Efficiency
Figure 6
1 This information is not intended to be individual or personalized investment or tax advice. Please consult a financial advisor or tax professional for more information regarding your tax situation.
2 It is important for investors to consult a tax adviser to avoid a potential wash sale, which means selling a security at a loss and then buying the same or a substantially identical security within 30 days.
Some additional tax strategies to consider?1
Aside from using ETF-based portfolios, investors concerned with minimizing taxes may also want to consider other strategies, such as tax loss harvesting and gaining exposure to asset classes with advantageous taxation.
In tax loss harvesting, an investor can potentially reduce capital gains taxes by selling positions that are trading below their cost basis to offset positions that have been sold above their cost basis. Since investors are ultimately taxed on their net capital gains at the end of the year, selling positions at a loss can help reduce this amount. In addition, savvy investors can maintain similar portfolio exposures by selling a position at a loss and entering into a new position with a high correlation to the security that was sold.2
Another tax strategy is to consider securities that have advantageous taxation compared to other similar investment options. For example, the income distributed by ETFs with exposure to bonds is typically taxed at ordinary income rates, which currently are as high as 43.4%.
Preferred stock, however, is often taxed at the qualified dividend income rate, which is currently a maximum of 23.8%. Therefore, investors could
consider reducing an allocation to bond ETFs and increasing their exposure to ETFs that invest in preferreds.
MLP ETFs are another investment that can receive favorable taxation of their distributions because the distributions are often treated as return of capital. Last year, 98% of the Global X MLP ETF (MLPA) distributions were considered return of capital, which means the distributions reduced an investor’s cost basis. For example, if an investor had a cost basis of $15 and received $0.50 of return of capital distributions, the investor’s new cost basis would be $14.50. Since the distributions reduced the investor’s basis, taxes are deferred until the investor sells his or her position in the fund or their basis falls to zero.
Conclusion
ETFs can be a useful tool for helping investors manage their taxes. ETFs tend to be more tax efficient than mutual funds given their ability to transact on an in-kind basis rather than in cash. In addition, investors can use ETFs for tax loss harvesting and to gain exposure to asset classes with favorable tax treatment.

21 © GLOBAL X MANAGEMENT COMPANY LLC.
ETFs: Securities Lending
Securities lending is the process by which ETFs loan their holdings to other market participants (see Figure 7).
Fees earned from securities lending can (up to the discretion of the provider) help reduce management fees.
To borrow securities from an ETF, borrowers are required to put up collateral, such as cash or government securities, of equal or greater value than the loaned securities.
However, ETF investors should be aware of counterparty risk (the risk that one party will not meet their contractual obligation). Earnings from securities lending can lower tracking error.
Some fund providers allow all revenue generated by securities lending to be retained by the fund, while others allocate a portion of the revenue to the fund provider itself; for those funds that permit securities lending, Global X allows all revenue generated by securities lending to be retained by the fund.
Figure 7 Securities Lending
1
2
3
4
5
6
Source: Pershing
To register for a securities lending program, the
fund, advisor and borrower sign a loan
agreement that covers the terms of the
program
Eligible securities held by the ETF are loaded
automatically into a lending system.
Securities in the system can be borrowed at
any time When the securities are
borrowed, the ETF’s portfolio manager can still see them listed in the account, with a
notation that they are on loan
Once the borrower returns the securities,
the “on loan” notation is removed
A percentage of the loan fee for the
securities borrowed, and potentially a
portion of the interest earned on the cash
collateral, is deposited to the investor’s1
brokerage account
The remainder of the loan fee is shared with the lending agent and
the fund (the fund generally receives a larger percentage)
A Hypothetical Example:
How Securities Lending Works
1 In ETFs’ case, the funds are the “investor” / beneficiary
2
5
6
1 3
4

22 © GLOBAL X MANAGEMENT COMPANY LLC.
This information is not an offer to sell or a solicitation of an offer to buy shares of any Fund to any person in any jurisdiction in which an offer, solicitation, purchase or sale would be unlawful under the securities laws of such jurisdiction.
Shares of ETFs are bought and sold at market price (not NAV) and are not individually redeemed from the Fund. Brokerage commissions will reduce returns.
Carefully consider the Funds’ investment objectives, risk factors, charges and expenses before investing. This and additional information can be found in the Funds’ full or summary prospectus, which may be obtained by calling 1-888-GX-FUND-1 (1.888.493.8631), or by visiting globalxfunds.com. Read the prospectus carefully before investing.
Global X Management Company LLC serves as an advisor to Global X Funds. The Funds are distributed by SEI Investments Distribution Co. (SIDCO), which is not affiliated with Global X Management Company LLC. Global X Funds are not sponsored, endorsed, issued, sold or promoted by Solactive AG, FTSE, Standard & Poors, NASDAQ, Indxx, or MSCI nor do these companies make any representations regarding the advisability of investing in the Global X Funds. Neither SIDCO nor Global X is affiliated with Solactive AG, FTSE, Standard & Poors, NASDAQ, Indxx, or MSCI.
Indexes are unmanaged and it is not possible to invest directly in an index.
Investing involves risk, including the possible loss of principal. International investments may involve risk of capital loss from unfavorable fluctuation in currency values, from differences in generally accepted accounting principles, or from economic or political instability in other nations. Narrowly focused investments may be subject to higher volatility. There are additional risks associated with investing in Gold and the Gold exploration industry.
Preferred stock is subject to many of the risks associated with debt securities, including interest rate risk. In addition, preferred stock may not pay a dividend, an issuer may suspend payment of dividends on preferred stock at any time, and in certain situations an issuer may call or redeem its preferred stock or convert it to common stock. High yielding stocks are often speculative, high risk investments. These companies can be paying out more than they can support and may reduce their dividends or stop paying dividends at any time, which could have a material adverse effect on the stock price of these companies and the Fund’s performance.
Investments in securities of MLPs involve risk that differ from investments in common stock including risks related to limited control and limited rights to vote on matters affecting the MLP. MLP common units and other equity securities can be affected by macro-economic and other factors affecting the stock market in general, expectations of interest rates, investor sentiment towards MLPs or the energy sector, changes in a particular issuer’s financial condition, or unfavorable or unanticipated poor performance of a particular issuer (in the case of MLPs, generally measured in terms of distributable cash flow). MLPA invests in the energy industry, which entails significant risk and volatility. The Fund is non-diversified. The Fund invests in small and mid-capitalization companies, which pose greater risks than large companies. The Fund has a different and more complex tax structure than traditional ETFs and investors should consider carefully the significant tax implications of an investment in the Fund.
MLPA is taxed as a regular corporation for federal income tax purposes, which differs from most investment companies. Due to its investment in MLPs, the fund will be obligated to pay applicable federal and state corporate income taxes on its taxable income, as opposed to most other investment companies. The fund expects that a portion of the distributions it receives from MLPs may be treated as tax-deferred return of capital. The amount of taxes currently paid by the fund will vary depending on the amount of income and gains derived from MLP interests and such taxes will reduce an investor’s return. The fund will accrue deferred income taxes for any future tax liability associated certain MLP interests. Upon the sale of an MLP security, the fund may be liable for previously deferred taxes which may increase expenses and lower the fund’s NAV.
The potential tax benefits from investing in MLPs depend on them being treated as partnerships for federal income tax purposes. If the MLP is deemed to be a corporation then its income would be subject to federal taxation at the entity level, reducing the amount of cash available for distribution to the fund which could result in a reduction of the fund’s value.
This information is not intended to be individual or personalized investment or tax advice. Please consult a financial advisor or tax professional for more information regarding your situation. Neither SIDCO nor Global X provide tax advice. Please note that (i) any discussion of U.S. tax matters contained in this communication cannot be used by you for the purpose of avoiding tax penalties; (ii) this communication was written to support the promotion or marketing of the matters addressed herein; and (iii) you should seek advice based on your particular circumstances from an independent tax advisor.