e-logistics implementation among logistics service
TRANSCRIPT

UNIVERSITY OF NAIROBI
COLLEGE OF BIOLOGICAL & PHYSICAL SCIENCES
SCHOOL OF COMPUTING & INFORMATICS
E-logistics implementation among logistics
service providers in Kenya
Morris Musyoki Mutisya
P56/61449/2016
SUPERVISOR: MR. CHRISTOPHER MOTURI
A project report submitted in partial fulfillment of the requirements for the award of Master
of Science in Information Systems of the University of Nairobi.
October 2016

ii
Declaration
I declare that this project report is my original work except where due references are cited. To
the best of my knowledge, this it has not been submitted for any other award in any
University. Data from other sources has been acknowledged.
Sign___________________________________Date________________________________
Morris Musyoki Mutisya
P56/61449/2013
SUPERVISOR
This project report has been submitted in partial fulfilment of the requirement of the Master
of Science Degree in Information Systems of the University of Nairobi with my approval as
the University supervisor.
Sign_________________________ Date: _____________________________
MR. CHRISTOPHER MOTURI

iii
Dedication
I dedicate my research project to my family and friends. A special appreciation to my loving
parents, Peter and Laxa for their support during my studies at the University.

iv
Acknowledgement
I would like to thank the Almighty God for keeping me in good health as well as providence
of school fees and other provisions for developing this project. I would like to express my
sincere gratitude to my supervisor Mr. Christopher Moturi for his valuable support in my
graduate studies and in the research project. His guidance helped me all the time of my
research and in the writing of this report. I would also like to thank Prof. Peter Waiganjo, Dr.
Daniel Orwa and Dr. Samuel Ruhiu for their valuable input in improving the content of this
research. Last but not least, I would like to thank my parents and siblings for their support
and blessings in my formative years.
v
Abstract
New business technologies have been in use for a number of years now with nearly every
sector involved in selling or products and services implementing technology as part of their
processes where customers are able to interact with sellers online. Technology has been used
as competitive tool to again competitive edge against competition and in most instances
redesigning the sales process. With these developments, efficiency in service delivery has
been key in pushing many organisations towards implementation of computer systems. E-
logistics where logistics service providers implement various logistics systems is one of the
technologies implemented towards improving service delivery. In Kenya, there has been slow
uptake of e-logistics by logistics companies particularly on the side of customer business
interaction. In most instances, this interaction is manual with payment and customers have to
visit or contact these companies by phone or email to get services. The purpose if this
research was to understand factors affecting implementation of e-logistics by logistics service
providers in Kenya. This research was guided by TOE model in identifying factors
determining e-logistics implementation by logistics companies. Our research design was
cross functional survey on logistics firms in Kenya with an aim of identifying the factors that
may influence or inhibit implementation of e-logistics systems by logistics companies and
also come up with a working logistics system prototype. The study samples 23 logistics
companies active in business in Nairobi. The results revealed that very few logistics firms
have implemented logistics systems. On the side of customer interactions, existing systems
lacked payment modules on service request. A working logistics system prototype was
developed complete with a payment module which can be implemented by any logistics
company. This research concludes a need for logistics companies to further understand the
importance of e-logistics and how it can shape their operations towards improving service
delivery. Important areas to note are need for staff training on new technologies.
Key Word
Logistics, E-logistics, Logistics Service Providers, TOE
vi
List of abbreviations
CSS - Cascading Style Sheets
DFD - Data Flow Diagram
DOI - diffusion on innovation
EDI – Electronic Data Interchange
ERD – Entity Relationship Diagram
ICT – Information Communication Technology
IOSs - Inter-Organizational Systems
IT – Information Technology
OOD - Object Oriented Design
SCM – Supply Chain Management
TAM - technology acceptance model
TOE – technology, organization, and environment
TPB - Theory of Planned Behaviour
UTAUT - Unified Theory of Acceptance and Use of Technology
UI – User Interface

vii
List of figures
Figure 1: Historical developments of e-logistics. ................................................................... 6
Figure 2: CA couriers data .................................................................................................... 9
Figure 3: Diffusion of innovations (Rogers 1995) ................................................................ 12
Figure 4: Technology, organization, and environment framework (Tornatzky and Fleischer
1990) .................................................................................................................................. 13
Figure 5: Iacovou et al. (1995) model .................................................................................. 15
Figure 6: use case diagram .................................................................................................. 18
Figure 7: System design model ............................................................................................ 19
Figure 8: Dataflow diagram ................................................................................................. 23
Figure 9: Context Diagram .................................................................................................. 24
Figure 10: Level 0 Diagram showing the decomposition of the Context Diagram ................ 25
Figure 11: Level 1 Diagram showing the decomposition of process 2.0 of level 0 diagram .. 25
Figure 12: Level 2 Diagram showing the decomposition of process 2.3 of level 1 diagram .. 26
Figure 13: Distribution by e-logistics implementation ......................................................... 30
Figure 14: Distribution by level of education ....................................................................... 32
Figure 15: Login screen ....................................................................................................... 37
Figure 16: Landing Page ..................................................................................................... 37
Figure 17: Countries screen ................................................................................................. 38
Figure 18: Adding new country ........................................................................................... 38
Figure 19: Managing tariff zones ......................................................................................... 39
Figure 20: Adding new tariff ............................................................................................... 39
Figure 21: Adding countries to a zone ................................................................................. 40
Figure 22: Customer home screen ....................................................................................... 41
Figure 23: Requesting for a quote ........................................................................................ 41
Figure 24: Filling delivery details ........................................................................................ 42
Figure 25: Payment options screen ...................................................................................... 42
Figure 26: Collection requests ............................................................................................. 43
Figure 27: Payment merchant screen ................................................................................... 43

viii
List of tables
Table 1: Past research based on DOI. .................................................................................. 12
Table 3: Operation Area of the Organization ....................................................................... 30
Table 4: Age of the Respondents ......................................................................................... 31
Table 5: Distribution by department .................................................................................... 31
Table 6: Revenue Turn Over ............................................................................................... 32
Table 7: Operational Duration ............................................................................................. 33
Table 8: Number of Employees ........................................................................................... 34
Table 9: e-logistics Description of the Organization ............................................................ 35
Table 10: Implementing factors ........................................................................................... 35
Table 11: Future Implementation ........................................................................................ 36

ix
Table of Contents
Declaration............................................................................................................................ ii
Dedication ............................................................................................................................ iii
Acknowledgement ............................................................................................................... iv
Table of Contents ................................................................................................................. ix
CHAPTER ONE ................................................................................................................... 1
1.1 Overview ..................................................................................................................... 1
1.2 Background ................................................................................................................. 1
1.3 Problem statement ....................................................................................................... 2
1.4 Research outcomes and justification of the study ......................................................... 2
1.5Objectives of this research ............................................................................................ 3
1.6 Overview of questions and areas of study ..................................................................... 3
1.7 Assumptions and limitations of the research................................................................. 3
1.8 Definition of terms ....................................................................................................... 4
CHAPTER TWO .................................................................................................................. 5
LITERATURE SURVEY .................................................................................................. 5
2.0 Introduction ................................................................................................................. 5
2.1 Electronic Logistics ..................................................................................................... 5
2.3 E-logistics Benefits ...................................................................................................... 7
2.4 E-logistics challenges .................................................................................................. 7
E-logistics implementation ............................................................................................. 8
2.7 Logistics industry in Kenya.......................................................................................... 8
2.8 E-logistics systems development .................................................................................. 9
2.9 Review of Technology adoption models and frameworks ........................................... 10
2.9.1. Diffusion on Innovation theory-DOI ................................................................... 10
2.9.2 Technology, organization, and environment framework (TOE Framework) ......... 13
2.9.3 Theories in support of TOE Framework............................................................... 14
2.10 Conclusions ............................................................................................................. 15
CHAPTER 3 ....................................................................................................................... 16
RESEARCH METHODOLOGY ........................................................................................ 16
3.1 Research Design ................................................................................................... 16
3.2.1 Data gathering and sources .................................................................................. 16
3.2.2 Population sampling ............................................................................................ 17
x
3.2.3 Data Analysis and Justification ............................................................................ 17
4.4. Prototype development ............................................................................................. 17
CHAPTER FOUR ............................................................................................................... 29
RESULTS AND DISCUSSIONS ........................................................................................ 29
4.0 Introduction ............................................................................................................... 29
4.1.1 Testing and evaluation of the questionnaire ............................................................. 29
4.1.2 Analysis of response rate ........................................................................................ 29
4.1.6 Distribution by age bracket of staff who responded to survey .............................. 31
4.1.7 Distribution by department .................................................................................. 31
4.1.8 Distribution by revenue turnover ......................................................................... 32
4.1.10 Distribution by number of years in operation ..................................................... 33
4.1.11 Distribution by number of employees ................................................................ 34
4.3.10 Distribution by implementation of logistics e-logistics systems ......................... 34
4.3.11 Reasons for e-logistics implementation .............................................................. 35
4.3.12 Reasons for planned implementation in future ................................................... 36
4.2 Prototype: Parcel Masters Logistics Ecommerce system ................................................ 36
Login .................................................................................................................................. 36
Manage countries ............................................................................................................ 38
Manage Tariff Zones ....................................................................................................... 39
Adding Countries to a Zone ............................................................................................. 40
Requesting a Quote and Paying for Delivery .................................................................... 40
Requesting a Quote .......................................................................................................... 41
Paying for Delivery ......................................................................................................... 42
Checking for Delivery Requests ...................................................................................... 43
Viewing Payments at Merchant Portal ............................................................................. 43
CHAPTER 5 ....................................................................................................................... 45
CONCLUSION AND SUGGESTIONS FOR FURTHER RESEARCH .............................. 45
APPENDIX 1: INTRODUCTORY LETTER ...................................................................... 50
APPENDIX 2: QUESTIONNAIRE..................................................................................... 51

1
CHAPTER ONE
INTRODUCTION
1.1 Overview
This chapter gives background information on logistics and gives an overview of e-logistics.
The chapter also explains the research problem, the research objectives, study justifications
and study limitations.
1.2 Background
According to Vitasek (2013) logistics is the aspect of planning, implementing and control of
efficient and effective movement of goods and services and associated information from one
place to another in order to meet consumer requirements. The dynamism in markets and
competition in service and product provision has forced many businesses to look for
innovative ways of delivering to their customers and revolutionizing the way business is done
(Tiid et al., (2001). With continuous improvements and innovation of new technologies,
technology has become important in the service industry driving growth and a major
competition tool (Metcalfe & Miles, 2000).
Most companies involved in sale of products and services where there is consumer
interaction, have introduced Information Communication and Technology (ICT) into their
operations tapping into the many advantages of engaging customer over the great World
Wide Web. Many Logistics companies in Kenya however have not realized the need to
employ technology in their operations and haven’t implemented information and
communication technologies and aligned their strategies with the changes in technology.
Lack of proper technology in place has led to most companies experiencing problems
hindering their growth and expansion. Other problems and difficulties experienced by
organizations in logistics business are poor service delivery, reporting and notification,
administration headaches and escalating overheads (Brown, 2006). Many logistics companies
do not have notification systems in place to notify their clients about the status of their
deliveries. For instance, whenever shipping with most logistics companies, tracking is not
available and often delivery details are delivered manually through available channels of
communication where else there is a chance of providing that information in a real time
manner. With the current operations in most logistics companies across the country, it is very
difficult to manage manual records and monitor delivery effectively. This is particularly
serious where the logistics company operates from multiple offices across the country. Some

2
of the challenges faced by logistics service providers include, managing the parcel records, in
terms of duplication of data entered in to the system, difficulty in monitoring the riders,
messengers, drivers and delivery activities and locations because of the myriads of variables
involved such as delays traffic, lack of parking, difficulties in identifying customer location
and waiting time for shipment pick up as well as effects of motor vehicle breakdowns (Peter,
2003). These challenges have been extended to customers where they have to call or visit
these logistics companies whenever they have an item to be moved. Most customers often
have to abandon their normal activities and create time to visit or call these companies. This
research was aimed at finding out the factors affecting implementation of e-logistics by
logistics services providers in Kenya with a survey of logistics companies within Nairobi and
come with an e-logistics prototype which can be implemented by logistics companies
therefore taking logistics service to the customers door step.
1.3Problem statement
In Kenya, customers seeking the services of a logistics company have to call or visit, receive
a quote and decide whether to use the service or not. While there has been increased access to
internet and technology implementation by various sectors, the logistics industry has been
slow in this uptake and customers have to call or visit to receive service while there is a
chance of processing all this remotely. This research project was aimed at establishing if
there are any e-logistics logistics applications in Kenya which are currently in use and also
suggest a working logistics e-logistics prototype which can be used to enable customers
transact with logistics companies from their homes or offices.
1.4 Research outcomes and justification of the study
The main research outcome for this project was a working e-logistics application prototype
which can be adopted by logistics companies and individuals interested in coming up with
logistics companies. In addition to this, this research activity did generate information which
was useful to the following:
Through this study, certain e-logistics problems facing logistics companies were identified;
the researcher did go an extra mile and came up with possible solutions to the problems.
This created insights into problems facing logistics companies forcing them not to implement
logistics systems and suggested solutions to some of them. The e-logistics prototype
generated here can also be advanced further and adopted to offer e-logistics services.

3
This research creates additional source of literature review and those researchers who would
wish to proceed with the research may do so or those who would wish to consult it can have a
chance.
This research gives application developers insights into e-logistics penetration among
logistics companies and gives them needed information to develop advanced e-logistics
applications for logistics.
1.5 Objectives of this research
a) To determine the factors those affect the implementation of e-logistics by various
logistics companies in Kenya.
b) Determine level e-logistics implementation by logistics service providers.
c) To demonstrate the role of e-logistics in supporting business consumer interactions.
d) Develop an e-logistics prototype for logistics companies which exhibit all
functionalities of an e-logistics system.
1.6 Overview of questions and areas of study
1. What are the factors affecting implementation of e-logistics?
1. What are the organisational and environmental drivers and inhibitors and of e-
logistics implementation?
2. What e-logistics platforms are currently in use?
3. What are the challenges facing e-logistics platforms in use at the moment?
4. What are available technologies for development and implementation of e-logistics
platforms?
1.7 Assumptions and limitations of the research
This research assumed that it is the desire of every logistics company to have an e-logistics
platform which can be used to sell logistics services to customers. The research also
assumed a sizeable number of customers would want a company which has an e-logistics
platform where they can contact business without necessarily visiting the company facility or
calling. In addition to the above, this research assumed there is a functional information
technology department in every logistics company which can handle e-logistics among other
technology related services.

4
There are various limitations to this research and mostly on the area of generalization of the
research outcome. This is because various logistics companies have different focus areas with
different clientele. Generalizing the outcomes based on survey on a number may be a
limitation.
1.8 Definition of terms
E-logistics – E-logistics in this research project shall refer to electronic logistics.
Logistics – shall refer to the movement of items from one place to another. It’s the core
function of companies targeted by this research.

5
CHAPTER TWO
LITERATURE SURVEY
2.0 Introduction
This chapter looks at past studies on e-logistics on the area of implementation with a
particularly factors affecting its implementation. It also looks at theories and models of
adoption of computer systems and lastly the requirements for developing an e-logistics
system
2.1 Electronic Logistics
Computer Systems have been evolving since 1950s with new technologies and practices
being embedded leading to new developments. (Crosstie, 2012). Business processes have
since grown from manual to electronic with e-logistics taking a huge chunk by converting
many business processes and practices from manual to electronic. To gain a competitive
advantage in business, e-logistics has been adopted by many companies and particularly
logistics companies in gaining a competitive edge. Logistics companies are therefore
increasing implementation of e-logistics in providing efficient services to customers.
According to Joseph, Laura and Srinivas (2004), e-logistics is used interchangeably with
internet enabled logistics or e-business where it supports the delivery of goods and services
through utilisation of Information Communication Technology (ICT) as part of the business
activities and in execution of various logistics activities (Daly and Gui, 2003).
Historically, the use of e-business systems began around early 1960s with systems such as as
materials requirements planning (MRP) as well as inventory managements systems (IMS)
and distributed resource planning systems among others. (Wang, Y., & Pettit, S. (Eds.).
(2016). these were functional based systems and continued to evolve in 1970s but as
independent systems not communicating with one another (Wang, Y., & Pettit, S. (Eds.).
(2016). There has been continues development as shown in the table below.

6
Figure 1: Historical developments of e-logistics.
Source: Wang, Y., & Pettit, S. (Eds.). (2016)
Due to the rising levels of competition in both local and international markets coupled by
utilization of effective competitive advantage areas, many companies have shaped
technological changes with innovation becoming part of running businesses as part of
improving competitiveness. This has revolutionized the interaction and operations between
companies and customers. (Tidd et al., 2001). For a long time, Information Communication
and Technology (ICT) is seen as driver to efficiency in both manufacturing and service
offering sectors. Recently, information communication technology has taken greater
appreciation and advantage in many sectors leading to growth by giving organizations critical
competitive leverage with regards to customer interactions (Metcalfe and Miles, 2000).
Innovation works on acceptance of such innovations and is strongly part of high output in
companies (Cainelli et al., 2004).
According to Kelly (1998), information communication technology has impacted companies
and their areas of operations leading to formation of “network economy”. This has driven
effective productivity in firms operations thereby accelerating innovation and adding great
value to companies (Porter and Millar, 1985). This has been witnessed in logistics where ICT
impacts this companies at all levels of operation whether internal or external.
7
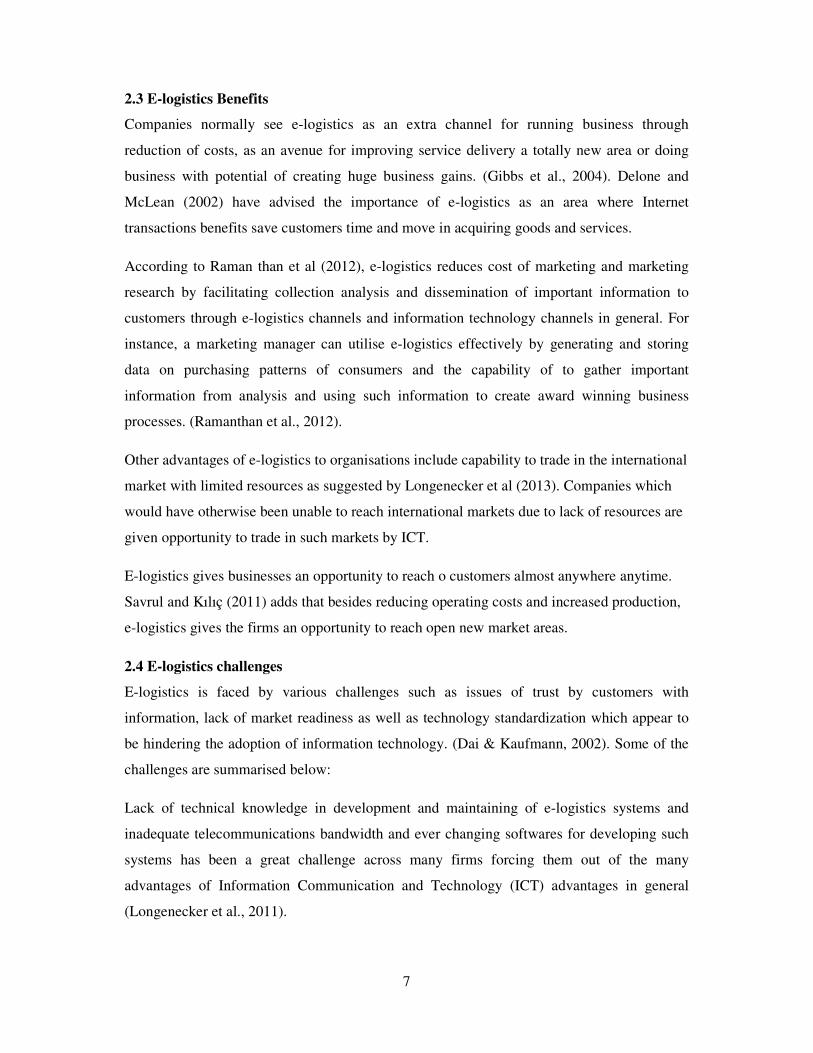
2.3 E-logistics Benefits
Companies normally see e-logistics as an extra channel for running business through
reduction of costs, as an avenue for improving service delivery a totally new area or doing
business with potential of creating huge business gains. (Gibbs et al., 2004). Delone and
McLean (2002) have advised the importance of e-logistics as an area where Internet
transactions benefits save customers time and move in acquiring goods and services.
According to Raman than et al (2012), e-logistics reduces cost of marketing and marketing
research by facilitating collection analysis and dissemination of important information to
customers through e-logistics channels and information technology channels in general. For
instance, a marketing manager can utilise e-logistics effectively by generating and storing
data on purchasing patterns of consumers and the capability of to gather important
information from analysis and using such information to create award winning business
processes. (Ramanthan et al., 2012).
Other advantages of e-logistics to organisations include capability to trade in the international
market with limited resources as suggested by Longenecker et al (2013). Companies which
would have otherwise been unable to reach international markets due to lack of resources are
given opportunity to trade in such markets by ICT.
E-logistics gives businesses an opportunity to reach o customers almost anywhere anytime.
Savrul and Kılıç (2011) adds that besides reducing operating costs and increased production,
e-logistics gives the firms an opportunity to reach open new market areas.
2.4 E-logistics challenges
E-logistics is faced by various challenges such as issues of trust by customers with
information, lack of market readiness as well as technology standardization which appear to
be hindering the adoption of information technology. (Dai & Kaufmann, 2002). Some of the
challenges are summarised below:
Lack of technical knowledge in development and maintaining of e-logistics systems and
inadequate telecommunications bandwidth and ever changing softwares for developing such
systems has been a great challenge across many firms forcing them out of the many
advantages of Information Communication and Technology (ICT) advantages in general
(Longenecker et al., 2011).

8
According to Kim et al. (2009), trust issues have always come into play whenever customers
are interacting with companies. In most instances, crucial information such personal phone
numbers may be required and some customers may not be willing to share such. This is a
draw back as many customers would rather get services without sharing such information.
E-logistics is capable of linking different cultures across the globe where customers,
companies as well as countries are interacting. Unfortunately adoption of this platform
among other technology platforms is affected by readiness of such markets to utilise them.
For instance Molla and Licker (2005) have advised that in third world countries on a
developing scale, effective implementation of e-logistics strategy in a company is largely
depended on e-readiness at strategic, environmental and organizational contexts of such
companies. Reduced level of technology distribution in an economy can also inhibit the level
of e-logistics knowledge, an attribute often taken by policy makers in developed countries.
E-logistics implementation
Companies and particularly logistics service providers should be able to understand drivers of
e-logistics implementation which are translated to objectives in line with the companies goal
and objectives. Drivers of e-logistics implementation are in line with the reasons for the
company to implement e-logistics. The drivers of implementation can be reactive or see to be
proactive depending on company’s strategy. Some organisations are involved in e-logistics
because their sector is active online (Stockdale & Standing, 2004). A number of small
medium enterprises follow their customer interactions through web transactions in order to
retain and enhance business interactions.
2.7 Logistics industry in Kenya
Most logistics companies in Kenya however have not realized the need to employ technology
in their delivery operation. Most logistics service providers have not aligned their strategies
with the changes in information communication technology.

9
Lack of proper technology in place has led to most companies experiencing problems
hindering their growth and expansion. Other problems and difficulties experienced by
organizations in logistics business are poor delivery, reporting and notification,
Administration headaches and escalating Overheads. Brown, (2006) Logistics companies do
not have notification systems in place to notify their clients about the status of their
deliveries. With the current operations in most logistics companies across the country, it is
very difficult to manage manual records and monitor employees effectively.
The logistics industry in Kenya is growing very fast and is attracting more and more
investors. The logistics industry contributes a lot to the economy of the country and the key
players in this market include the Postal Corporation of Kenya, international logistics
companies, local logistics companies, Security firms and bus companies.
Below is a summary of logistics and courier companies operating in Kenya according to
CAK (Communications Authority of Kenya) the main regulator.
Figure 2: Courier data, CA 2015
2.8 E-logistics systems development
According to Zhang (2010), an e-logistics system is web based and comprises of three layers
namely UIlayer, a business logic layer and Database layer. Various technologies and tools are
used as outlined below:
WAMP I

10
The WAMP is a web development Platform used in development of web based applications.
Its multi tired enterprise application supporting programming, database and business logic
tiers. It’s used to develop dynamic websites, websites or separate programs (Guan, 2011).
MySQL
MySQL is a relational database management system normally liked due to its efficiency and
stability in supporting applications and databases. It supports various web applications by
such as C, C++, PHP and JAVA among others by providing an application programming
interface.
PHP
PHP is a Hypertext Pre-processor webpage programming language usable in development of
dynamic web sites a key component of e-logistics applications. During development, PHP
code is normally included in html source file with PHP tags and processed by a web server to
provide the backend operations.
2.9 Review of Technology adoption models and frameworks
In order to enhance the competitiveness of many firms, ICT is considered a major driving
force. ICT innovations in different industries have played a key role in improving productivity
and increasing efficiency. In our research we therefore sought to establish the determinants of
information technology adoption by reviewing some of the adoption frameworks and
theoretical models. We specifically reviewed various theories on technology implementation
at the firm level with the technology in Logistics companies in mind. We looked at DOI, TOE
and adopted this two theories because many studies on technology adoption at organisation
level are based on these theories (Chong et al. 2009).
In our theoretical foundation we reviewed TPB by Ajzen (1991), UTAUT by Venkatesh et al.
(2003), TAM by Davis (1986), DOI (Rogers 1995) and TOE framework by Tornatzky and
Fleischer (1990). For the purposes and scope of our study we however fully expounded on
only the DOI and TOE framework. This is based on the fact that they are the look at
technology implementation at the organisational level.
2.9.1. Diffusion on Innovation theory-DOI
DOI theory addresses the issue on how, why while at the same time looking at the rate that
new thoughts and innovation extent through various economies at the individual and
organisational levels. DOI theory describes innovations as being passed via definite Medias

11
within set social systems (Rogers 1995). In DOI individuals appear as possessing varying
levels of acceptance to absorb new developments thus the portion of the population
implementing the innovations is approximately normally distributed over time (Rogers 1995).
If you break into segments of normal distribution the result is a division of individuals into
five groups of innovativeness (from earliest to latest adopters): innovators, early adopters,
early majority, late majority, laggards (Rogers 1995). This becomes even more complex in
organization with a number of individuals supporting and others opposing the innovation or
new idea yet both play a vital role in innovation decisions.
According to Rogers (1995), applying DOI model theory at company level, innovativeness
may be equated to such independent variables as individual (leader) characteristics, internal
firm structural attributes, and external attributes of the organization as shown in the figure
below. Individual attributes define the leader approach or attitude toward change. On the other
hand internal attributes of the firms structure comprises observations. According to Rogers
(1995) whereby: “centralization is the extent to which power and control in a system are more
in the hands of few individuals”; “complexity is the extent to which a firm staff have a high
level of knowhow and understanding”; “formalization is the extent to where a firm encourages
its members’ following guidelines and regulations”; “interconnectedness is the extent to which
the units in a cultural setting are linked by interpersonal networks”; “firms slack is the degree
to which uncommitted resources are available to a firm”; “size is the number of employees of
the firm”. External characteristics of organizational talk about the system openness.

Figure 3: Diffusion of innovations (Rogers 1995)
Over many years of DOI application to
implemented in certain ways as shown below
Table 1: Past research based on DOI
In the same regard this theory can also implemented in automation of logistics companies.
12
: Diffusion of innovations (Rogers 1995)
Over many years of DOI application to technology research, the theory has been
shown below.
: Past research based on DOI
In the same regard this theory can also implemented in automation of logistics companies.
research, the theory has been used and
In the same regard this theory can also implemented in automation of logistics companies.

2.9.2 Technology, organization, and environment
TOE framework was development
shows three aspects of an enterprise's context that impact the
adopts a technological innovation. These aspects ar
environmental as shown in the figure below. Organizational
measures about the organization such as scope, size, and managerial structure. Technological
context comprises a description of bot
firm which include current practices and equipment internal to the firm (Starbuck 1976), in
addition to the set of available technologies external to the firm (Thompson 1967,
Khandwalla 1970, Hage 1980). Environmental context refers to the arena in which a firm
runs its business which includes
authorities (Tornatzky and Fleischer 1990).
Figure 4: Technology, organization, and environment framework (Tornatzky and Fleischer
1990)
The TOE framework shows a useful analytical framework that can be
the implementation and assimilation of different types of IT innovation including adoption of
e-logistics logistic systems in by logistics companies. TOE framework is consistent with the
DOI theory, in which Rogers (1995) emphasized individual characteristics, and both the
13
2.9.2 Technology, organization, and environment framework (TOE Framework)
TOE framework was development in 1990 (Tornatzky and Fleischer, 1990). This framework
three aspects of an enterprise's context that impact the rate by which it embraces and
a technological innovation. These aspects are organizational, technological and
environmental as shown in the figure below. Organizational content refers to descriptive
measures about the organization such as scope, size, and managerial structure. Technological
context comprises a description of both the external and internal technologies related to the
firm which include current practices and equipment internal to the firm (Starbuck 1976), in
addition to the set of available technologies external to the firm (Thompson 1967,
0). Environmental context refers to the arena in which a firm
es industry, competitors, and dealings with the
(Tornatzky and Fleischer 1990).
organization, and environment framework (Tornatzky and Fleischer
a useful analytical framework that can be utilised
and assimilation of different types of IT innovation including adoption of
logistic systems in by logistics companies. TOE framework is consistent with the
DOI theory, in which Rogers (1995) emphasized individual characteristics, and both the
framework (TOE Framework)
his framework
by which it embraces and
e organizational, technological and
refers to descriptive
measures about the organization such as scope, size, and managerial structure. Technological
h the external and internal technologies related to the
firm which include current practices and equipment internal to the firm (Starbuck 1976), in
addition to the set of available technologies external to the firm (Thompson 1967,
0). Environmental context refers to the arena in which a firm
industry, competitors, and dealings with the regulatory
organization, and environment framework (Tornatzky and Fleischer
utilised for studying
and assimilation of different types of IT innovation including adoption of
logistic systems in by logistics companies. TOE framework is consistent with the
DOI theory, in which Rogers (1995) emphasized individual characteristics, and both the

14
internal and external characteristics of the firm, as drivers for firms’ innovativeness. These
are same to the technology and organization context of the TOE framework, but the TOE
framework includes the environment context. The environment context presents both
opportunities and constraints for technological innovation. The TOE framework makes
Rogers’ innovation diffusion theory better able to explain intra-firm innovation diffusion
(Hsu et al. 2006). The next Section analyses the studies leading to our choice of adopting
TOE framework in this research.
2.9.3 Theories in support of TOE Framework
2.9.3.1 Institutional theory
Institutional theory says that an organisational environment is important in determining firm’s
structure and actions (Scott and Christensen 1995, Scott 2001). According to the institutional
theory, “firm’s decisions are not driven purely by rational goals of efficiency, but also by
social and cultural factors and concerns for legitimacy”. According to this theory firms are
moved by cultures, structures, and routines and operate at various levels. The theory adds that
companies become more identical due to isomorphic pressures and pressures for legitimacy
(Dimaggio and Powell 1983). The result is that companies in the same field tend to become
homologous with time, as competition and customer pressures inspire them to copy market
leaders. The institutional theory thus adds to the environmental context of the TOE framework
external pressures, which include pressure from competitors and pressure exerted by trading
parties.
2.9.3.2 Iacovou et al. (1995) model
Iacovou et al. (1995) analysed inter-organizational systems (IOSs) attributes that affect firms
to implement IT developments in the context of EDI implementation. Their framework
explains technology implementation based on three factors namely known benefits,
organizational preparedness and external forces as shown in the figure below. An apparent
benefit is a different attributes from the TOE framework, whereas organizational readiness is a
combination of the technology and organization context of the TOE framework. IT resources
are therefore be equated to technology context and a financial resource is similar to
organizational context. The external pressure in the Iacovou et al. (1995) model adds the
trading parties to the external task environmental context of the TOE framework as a critical
role of IOSs adoptions.

Figure 5: Iacovou et al. (1995) model
2.10 Conclusions
Our study focused on studies on
at company level with many researches
theory. Our preferred choice for implementing the Parcel Masters
is however the TOE model framework
(which is not part of DOI model
firm innovation implementation
support, solid consistent empirical theoretical basis, and th
information technology adoption.
15
: Iacovou et al. (1995) model
literature on information technology implementation
researches being done from the TOE framework and DOI
theory. Our preferred choice for implementing the Parcel Masters Logistics System
model framework because it encompasses the environment
odel theory), making it superior and capable of explain
implementation. Additionally, TOE framework has a consistent empirical
support, solid consistent empirical theoretical basis, and the potential of application to
echnology adoption.
information technology implementation models
from the TOE framework and DOI
Logistics System prototype
the environmental context
explaining intra-
. Additionally, TOE framework has a consistent empirical
e potential of application to

16
CHAPTER 3
RESEARCH METHODOLOGY
3.0 Overview
This chapter covers the methodology utilized in carrying out the research. It comprises of the
research design, target population, sample size, sampling techniques, research instruments,
data collection, data analysis and prototype development.
3.1 Research Design
Qualitative research that is explanatory in nature has been deemed appropriate as the main
research objective for this research paper was assessing e-logistics implementation by
logistics companies thereby explaining clearly the reason behind its implementation. The
research targeted 30 logistics companies’ active in business.
In this research activity questions were carefully developed and designed to fit logistics
companies - the people who usually utilise these services and E-logistics system or are
charged with determining whether e-logistics should be in use. Design for the questionnaire
was done as per below:
Gender – This allowed us understand which gender prefers e-logistics; Age group, which
gave us age group where E-logistics is implemented and why as well and the relationship that
exists among these groups; and by
E-logistics platforms - This enabled us to have a clearer view if users have interacted with e-
logistics systems and technologies before.
3.2.1 Data gathering and sources
Data was gathered through a questionnaire which was sent to key decision makers in logistics
companies and divided into various sections. Questionnaires have been effectively utilised in
qualitative research. Kinuthia (2014) notes that questionnaire is an efficient objective oriented
option and a quicker means to get information. They also noted that questionnaire is an
effective means of picking information coming from a big population. Because of limited
resources and time, we did utilise the questionnaire as a means of data collection. The
research questionnaire was divided into six sections and was distributed to various staff
members in logistics companies in Nairobi. Open ended and closed questions were used in
this questionnaire.
a. Profile under demographic data section.

17
b. Guide to which section to proceed with.
c. Matrix to determine implementation of e-logistics systems
d. Inhibitory factors to implementation.
e. Knowledge on e-logistics system development softwares.
3.2.2 Population sampling
In this research project, a total of 30 logistics companies operating in Nairobi were selected
with key respondents being staff in commercial and information technology departments in
such companies. The 30 logistics companies comprised of logistics service providers in the
courier industry actively available in business. Data on this companies was extracted by
picking data currently available from courier companies regulator; Communications authority
of Kenya. Staffs in these companies were contacted by phone and a questionnaire forwarded
to them for filling. This was done to ensure the objectivity and confidentiality of this activity
is well cascaded to the respondents to avert any fears.
3.2.3 Data Analysis and Justification
Completed questionnaires forms were checked for uniformity and completeness before
commencing the data analysis process. The data collected from the respondents was then
coded for easier analysis and responses grouped in themes for specificity in classification and
clarity in reporting. Data was entered into SPSS clearly showing the coded information
shared by respondents for further analysis. From this analysis, data was described by use of
measures like the mode, median, frequency and mean to analyze the nature and the profile of
logistics companies which formed the study.
4.4. Prototype development
The last objectives of this research project was development of e-logistics prototype.
4.4.1 Use case diagrams
The e-logistics prototype shall be accessible online and shall give users shipping rates by
entering shipment origin country, destination country and shipping weight. Third party
country operations shall not be allowed where shipper or receiver is not the payer. The
prototype works on basis that shipper or receiver is payer.
A customer enters origin country, destination country and shipment weight where the system
generates a service quote. If customer is in agreement with quote generated, they shall

18
proceed to declare shipment details, shipper details and receive details. The system shall then
push the customer to a payment module supported by Pesapal. As soon as payment details are
received, a receipt shall be generated and an email message forwarded to the logistics
company to arrange completion of this service.
Use case diagram for administrator and customer
Figure 6: use case diagram
4.4.4 System design tools and methodology
This prototype was developed using Object Oriented Design (OOD) methodology. It
involved identification of functional requirements from which use case artefacts were
developed. Thereafter the dynamic and static behaviour of the system was analyzed and
modelled. The modelling of static behaviours was done through identification of objects and
classes which are represented using case diagrams. The dynamic aspects of the system were
modelled using sequence, interactive, state diagrams and collaboration diagrams.
Set up
access
Add and
delete
Create tariff
zones and
View service
reports
Check audit
Content
manager
Open system
Request
quotes
Enter customer
data
Customer

19
4.4.5 System design model
Figure 7: System design model
4.4.6 Front end system components
The front end module interacts with customers and fetches parcel details, shipper and receiver
details and then generates a quote for the desired service. The module also directs the
customer to the Pesapal payment module for payment processing and generates a receipt after
successful completion of the service.
4.4.7 Backend system components.
The backend module shall be used to define products and services for logistics. The same
shall also be used for updates. It shall comprise of products category management which
includes add, delete, update and shall cover prices for different destinations against weights.
4.4.8 System design and methodology
The development of this prototype comprises of three-tier architecture. This includes a user
interface layer to send requests to a business layer through a unified interface. The business
layer does database operations after processing based embedded logic rule and then
encapsulate the information which is sent back from the database into class format and
presented to the user interface layer. This makes the user interface layer unknown the
database, the user interface layer is used to run the interface to the business layer. Case
diagrams have been used for visual modelling to show system description, visualization and
documentation.
20
4.4.9 Analysis of system requirements
To ensure we fulfil the objectives of this system, requirements analysis were carried out to
ensure maximum productivity. There was focus on the tasks of the system to ensure that the
system meets customer and organizational needs.
To ensure requirements analysis is carried out properly, requirements engineering was
employed which is a major process for providing the ways for establishing customer and user
preferences, understanding specific wants, feasibility assessment and explaining the best
possible solution. It comprises of seven tasks namely inception, elicitation, elaboration,
negotiation, specification, validation, and management. These activities occur at the same
time and all are utilised to the wants of the project. At project start the administrators find out
basic knowledge of the problem, the users who desire a solution and the type of solution that
is expected. The process comprises of finding vision and scope of the project. During
requirement elicitations, tasks are carried out to develop the goals for the system, activities to
be done, how the system or product fits into the wants of the company and how the system is
to be utilised. Requirements gathering combine parts of problem solving, elaboration,
negotiation and specification. Requirements analysis deals with understanding of basic
requirements established of the system during the inception, elicitation and negotiation tasks.
System requirements are based on their roles and can be grouped into functions which
explain system roles or services and non-functional requirements which show system
properties and constraints (e.g. reliability, response time and storage requirements).
Requirements elicitation is done using interview, questionnaires, observation, document
analysis, studying similar companies and systems as well as prototyping. This research
concerns with business requirements that will be used in designing user requirements and the
business rules that will be included in the use-case document, brief descriptions are provided
for the three as follows:
(a) Organisational requirements
They show high-level objectives of the firm or consumer who requests the system.
They show why the firm is adopting the system (the objectives the organization hopes
to achieve).
(b) User requirements
It shows user goals or tasks that the users must be able to carry out with the system.

21
(c) Business rules: These are operations in the firm that affect the system, which include
organisational policies, policy regulations, market standards, business practices, and
computational processes.
4.5.0 System Development Methodology
The e-logistics application prototype was created using waterfall system development life
cycle which comprises of steps followed by developers. This was organized based on
research outcomes which shall depicted the user and customer requirements and provided an
application prototype suitable for implementation. This application development
methodology was adopted because of its procedural nature which captures all user
requirements, consideration for key issues before design and its capability to ensure controls
through creation of proper documentation which can help other developers in advancing the
application.
4.5.1 System Development Life Cycle Stages:
The waterfall system development lifecycle comprises of the following steps:
1. Conceptual Planning: It’s the first stage where need to have an application is identified.
A feasibility study is done; roles and responsibilities are assigned to various parties.
2. Planning and Requirements Definition: This involves definition of resources required
for the project and validation of functional, training and support functions.
3. Design: This is where the deliverables of stage two are converted into preliminary and
comprehensive designs and functional requirements for the system are identified.
4. Development and Testing: At this stage, the system is developed based on specifications
and tested for optimal performance to ensure it meets its indented function.
5. Implementation: This is where the system is put into utilization and adopted as part of the
processes for the organization. It’s here where manual work is automated and users trained on
how to utilize the system
6. Operations and Maintenance: This is a phase where the application is fully operational
and it continues serving. Breakdowns are handled here. This is the phase in which the system
becomes operational.
7. Disposition: This is the final stage of the system and normally where the system useful
time is over. The system is normally shut down and replaced with another.
4.5.2 Requirements gathering tools
Requirements elicitation was done using interviews which are common with data gathering as
well questionnaires. Observation and document analysis of similar e-logistics systems was

22
done. This process has been utilized in numerous occasions and ensures systems development
meet requirements.
4.4.2 Data movement within the system
Data movement within the system is demonstrated using a Data Flow Diagram (DFD) to
show how data flows within the system. This is done using the following dataflow
components:
a) External entities which show the start of data as input to the prototype. They are
shown using.
b) Data stores that represent stores of data within the system for instance system files or
databases. An open-ended box shows data, which shows store data at rest or a data
store.
c) Processes which are shown activities in which data is processed by being stored or
retrieved or transferred in some way. Circles stand for a process that converts data
into information.
d) Data flow shows the movement of data from one part to the other. An arrow (→)
identifies movement, i.e. data in motion. Data flows are generally shown as one-way
only.

23
4.4.3 Data Flow diagram for using the system
Figure 8: Dataflow diagram
Y
Y
Start
Enter Parcel
details, shipper
country and
Quote
generate
d?
NO
Has
customer
accepted
NO
Enter shipper and
receiver physical
address, parcel details
Has
customer
Parcel collected
End
NO

4.5.3 Context diagram
Figure 9: Context Diagram
24
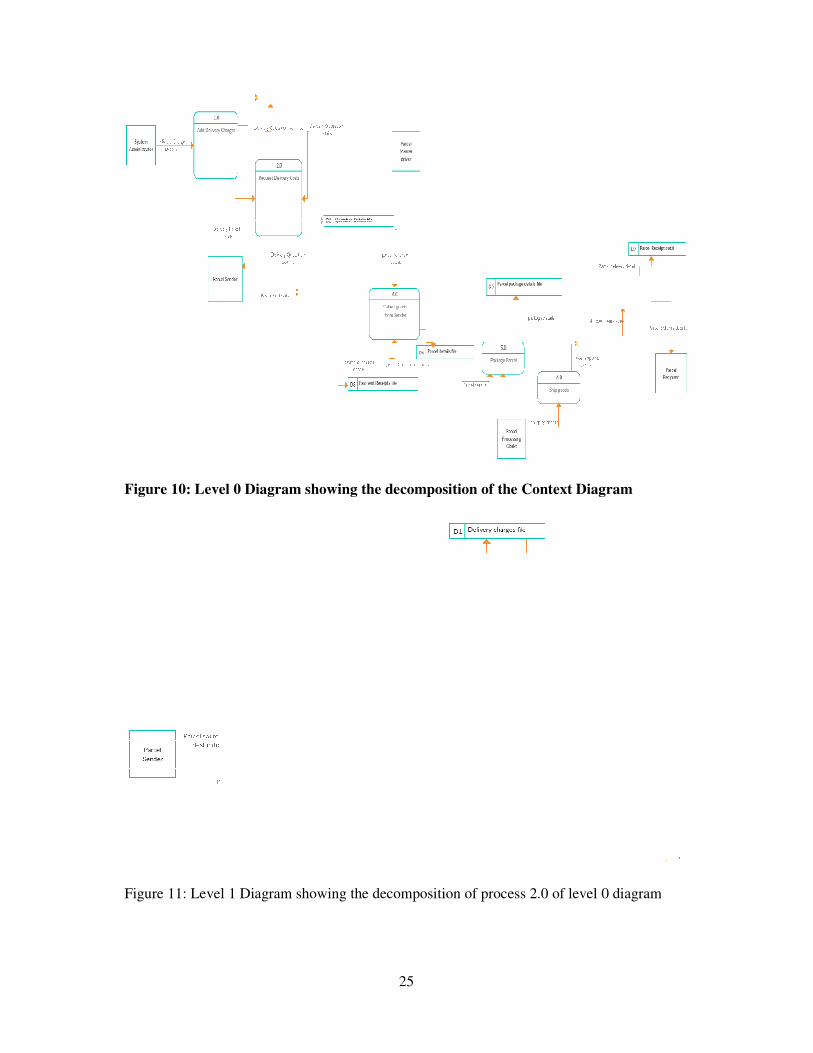
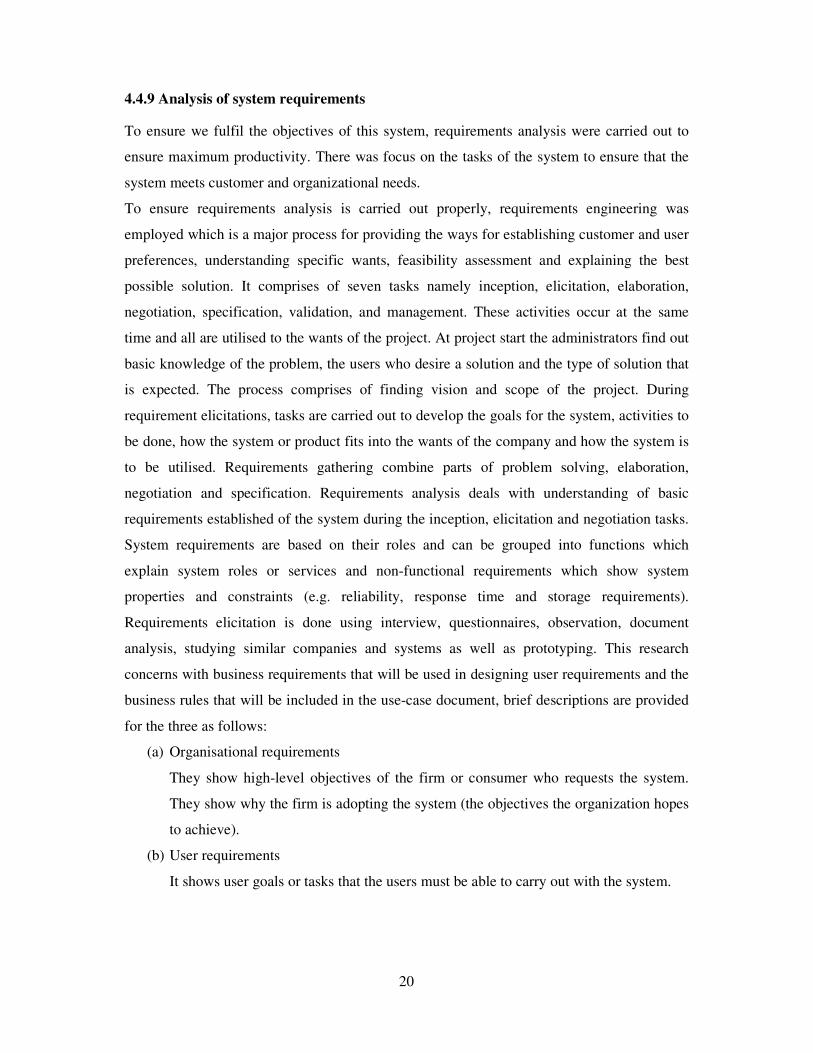
Figure 10: Level 0 Diagram showing the decomposition of the Context Diagram
Figure 11: Level 1 Diagram showing the decomposition of process 2.0 of
25
0 Diagram showing the decomposition of the Context Diagram
: Level 1 Diagram showing the decomposition of process 2.0 of level 0 diagram
0 Diagram showing the decomposition of the Context Diagram
level 0 diagram

Figure 12: Level 2 Diagram Showing The Decomposition Of Process 2.3 Of Level 1
Diagram
4.5. 6 Database design
This was represented using entity relationship diagrams. The role of an ER was to capture the
conceptual model of the data to be managed in a database in regard to what there is and how
it is connected. Entity relationship diagrams normally comprise of thr
but all interconnected as per below:
a) Entity- refers to an object,
rectangle shape.
b) Attribute- it is used to demonstrate a
instance, Name, mobile number, email etc can be
in this system. They are presented with an eclipse.
c) A Relationship shows relations between
diamond shape.
4.5.7 System testing methodologies
After completion, the system was tested as follows:
26
Showing The Decomposition Of Process 2.3 Of Level 1
This was represented using entity relationship diagrams. The role of an ER was to capture the
conceptual model of the data to be managed in a database in regard to what there is and how
Entity relationship diagrams normally comprise of three distinct components
but all interconnected as per below:
object, a place, a person or class. This is presented using a
it is used to demonstrate a property or characteristic of an entity. For
Name, mobile number, email etc can be associated with a mobile phone user
They are presented with an eclipse.
relations between various entities and is represented by a
4.5.7 System testing methodologies
After completion, the system was tested as follows:
Showing The Decomposition Of Process 2.3 Of Level 1
This was represented using entity relationship diagrams. The role of an ER was to capture the
conceptual model of the data to be managed in a database in regard to what there is and how
ee distinct components
This is presented using a
property or characteristic of an entity. For
mobile phone user
and is represented by a

27
Sub testing – This was carried on the user module, back end module and the database to
ensure it was working well.
Program testing – It was carried out to ensure the system generates correct quotes based on
shipment weight and destination.
Acceptance testing – Acceptance testing was carried out by giving selected individuals of
various companies an opportunity to interact with the prototype.
4.5.8 Database Management System
The database was developed putting into consideration issues with security and integrity of
data. To avoid data redundancies, we implemented a primary key and created relationships
between entities by use of foreign keys. MySQL version 5.0database management system
was utilized to design the database. MySQL holds huge sizes of data and responds fast to
queries; it’s good in control of security, concurrency and its open source database software.
4.5.9 Interface Design Technologies
The front end and backend module were developed using PHP5 to provide a link between the
backend and front end modules access to the databases. PHP5 provides an integrated
development environment easy to utilize with basic knowledge of Hypertext Markup
language knowledge and its support for object oriented designs.
HTML
HTML refers to Hypertext markup language and was used to create tables, forms and form
objects for interacting with the database by running functionalities such as querying, deleting
and manipulation of data.
Adobe fireworks and Cascading Style Sheets (CSS)
An adobe firework is a graphics design tool. It was used to develop the templates for the front
end and back end modules. Cascading Style Sheets (CSS) was used to develop layout and
presentation.
JavaScript
JavaScript was used to create dynamic and interactive web pages for user interactions with
form items which included fields, buttons, text areas and selection lists and hyper text.

28
System security and access control
To ensure secure access of the system and protect it from attacks, an access matrix was
created where users access the system based on rights. The customers have normal read and
query generation capability while the administrator has modification capability. The system
also keeps an audit trail.
System back up
The prototype is hosted in a remote service with access controlled through password. There is
a scheduled daily back up of the system kept at a remote facility.

29
CHAPTER FOUR
RESULTS AND DISCUSSIONS
4.0 Introduction
This chapter provides findings of the research activity as outlined previously. Data analysed
here was collected via online questionnaires as it was convenient for most of the respondents.
Information was gathered from staff members of various logistics companies operating from
Nairobi. The findings of this chapter include frequencies, means, standard deviations analyses
which have been interpreted.
4.1 Results
4.1.1 Testing and evaluation of the questionnaire
Before the questionnaire was released to the actual respondents, it was tested through five
friends and they responded full. On actual survey, the questionnaires were checked and it was
confirmed respondents had answered the questions fully.
4.1.2 Analysis of response rate
Out of a population of around 2,000 logistics companies operating in Kenya, we identified 35
active logistics companies and out of this we 23 respondents replied to our questionnaire fully
giving us a response rate of 65.71%. Respondents were introduced to the survey through an
introductory letter from the university explaining the reasons behind the survey. Most of the
respondents were known to the researcher and contact achieved through email, visits,
personal interactions, telephone calls and visits to client premises. The summary of response
is shown in table 4.1.
4.1.3 Demographics
This part analyses various classification of staff members surveyed in this research.
4. 1.4 Organisational Operational Focus
The survey looked at companies area of operational focus categorised in to local logistics,
international logistics or both and the outcome was as per table 4.2. It was noted that a big
number of logistics companies in Kenya were operating both locally and in the international
arena as well.

30
Table 2: Operation Area of the Organization
Frequency Percent Valid Percent
Cumulative
Percent
Valid Local 2 8.7 8.7 8.7
International 1 4.3 4.3 13.0
Both 20 87.0 87.0 100.0
Total 23 100.0 100.0
4.1.5 Categorisation of logistics companies by implementation of logistics e-logistics
To understand logistics companies in Kenya and their area of operation, logistics companies
were categorised to domestic only, international only and both. This was aimed at identifying
if implementation of logistics e-logistics system could be driven by their area of focus. From
our findings, 40.9% had no intention of implementing a logistics e-logistics system and this
was the majority of the respondents. 27.3% had already implemented an e-logistics logistics
system while 31.8% planned to implement in the future. This indicated that a number e-
logistics was not fully in use and there was manual work going on especially on the area of
customer interactions and payments.
Figure 13: Distribution by e-logistics implementation

31
4.1.6 Distribution by age bracket of staff who responded to survey
The researcher did survey various staff members age to undertstand if age could be a
contributing factor. Most of the staff surveyed were aged between 30 and 39years of
age.Technlogies changes were deemed as a contributing factor to implimentation of e-
logistics with where a company could shy away from implimentation due to lack of
knowledge.
Table 3: Age of the Respondents
Frequency Percent
Valid
Percent
Cumulative
Percent
Valid 0-19 years 1 4.3 4.3 4.3
20-29 Years 6 26.1 26.1 30.4
30-39 years 10 43.5 43.5 73.9
40-49 Years 6 26.1 26.1 100.0
Total 23 100.0 100.0
4.1.7 Distribution by department
The survey did look at individuals in various departments and most of those surveyed were in
the technological section of the company. It was noted that the was slow uptake of e-logitics
by companies with lean information technology departments.
Table 4: Distribution by department
Frequency Percent Valid Percent
Cumulative
Percent
Valid Operations Department 7 30.4 30.4 30.4
IT Department 10 43.5 43.5 73.9
Commercial Department 3 13.0 13.0 87.0
Management Department 1 4.3 4.3 91.3
Finance Department 2 8.7 8.7 100.0
Total 23 100.0 100.0

32
4.1.8 Distribution by revenue turnover
Revenue turnover is a key factor in determining if a company can implement an e-logistics
system by allocating finances to meet costs of running the same. There was even distribution
of companies’ revenue turnover across with companies with low revenue turnover not
implementing e-logistics systems. Revenue turn offer was key with companies with low
revenue turnovers not implementing e-logistics systems particularly due to lack of skill and
budget for the same.
Table 5: Revenue Turn Over
Frequency Percent
Valid
Percent
Cumulative
Percent
Valid Less than 500 000 1 4.3 4.3 4.3
500 001 - 1000 000 7 30.4 30.4 34.8
1000 001 - 5000 000 11 47.8 47.8 82.6
10 000 000 and
Above
4 17.4 17.4 100.0
Total 23 100.0 100.0
4.1.9 Distribution by level of education
Figure 14: Distribution by level of education

33
Out of the surveyed respondents, nearly all of them had an understanding on e-logistics
systems with most of them having attained the level of undergraduate. It was however noted
that companies with low level educated staff had not taken up e-logistics as part of their
operations.
4.1.10 Distribution by number of years in operation
Table 6: Operational Duration
Frequency Percent Valid Percent Cumulative Percent
Valid Less than a Year 1 4.3 4.3 4.3
1 - 5 Years 4 17.4 17.4 21.7
6 - 10 Years 8 34.8 34.8 56.5
11 - 15 Years 5 21.7 21.7 78.3
16 - 20 Years 1 4.3 4.3 82.6
21 and Above 4 17.4 17.4 100.0
Total 23 100.0 100.0
From the companies surveyed, years of operation were evenly distributed across with 18.2%
having been in operation for over 21years. Majority of the companies surveyed had been in
operation between 5 to 10 years. Companies which had been in operation for long contributed
more to e-logistics uptake with companies which have moved in to business recently in the
initial stages of planning e-logistics implementation.

34
4.1.11 Distribution by number of employees
Table 7: Number of Employees
Frequency Percent Valid Percent Cumulative Percent
Valid 0-50 Employees 17 73.9 73.9 73.9
51 - 100 Employees 2 8.7 8.7 82.6
101 - 200 Employees 1 4.3 4.3 87.0
201 and Above 3 13.0 13.0 100.0
Total 23 100.0 100.0
Out the companies surveyed, majority were small medium enterprises with employees less
than 50 in number which formed 72.7% of all customers surveyed. Companies with low
employees’ numbers had not implemented e-logistics systems compared to companies which
had been in business for an extended period.
4.3.10 Distribution by implementation of logistics e-logistics systems
Out of the companies surveyed, only 26.1% had implemented a logistics e-logistics system
while 34.8% had planned to implement in the future while 39.1% did not plan to implement.
None of the companies which had implemented an e-logistics system were running some
form of payments on the system therefore clients had to pay on the side to get services.
Implementation of e-logistics systems was mostly driven by management perception as well
as revenue turnover, number of employees and skill.

35
Table 8: e-logistics Description of the Organization
Frequency Percent Valid Percent
Cumulative
Percent
Valid e-logistics Implemented 6 26.1 26.1 26.1
Future Implementation of e-
logistics
8 34.8 34.8 60.9
No planned Implementation 9 39.1 39.1 100.0
Total 23 100.0 100.0
4.3.11 Reasons for e-logistics implementation
Out of the 26.1% who had already implemented the system, we did find out reasons for
implementation and below were our findings. 50% implemented due to process change
request while 33.3% implemented due to competitor activities and 16.7% implemented due to
internal needs.
Table 9: Implementing factors
Frequency Percent Valid Percent Cumulative Percent
Valid Competition 2 8.7 33.3 33.3
Business Process Re-
engineering
3 13.0 50.0 83.3
Internal staff request 1 4.3 16.7 100.0
Total 6 26.1 100.0

36
4.3.12 Reasons for planned implementation in future
Table 10: Future Implementation
Frequency Percent Valid Percent Cumulative Percent
Valid Less than 5
Years
5 21.7 55.6 55.6
6-10 years 4 17.4 44.4 100.0
Total 9 39.1 100.0
Missing System 14 60.9
Total 23 100.0
Future Implementation
Out of the 34.8% who planned to implement the system in future, 44.4% saw technological
changes as a challenge posing need to wait while 44.4% did not budget for a logistics e-
logistics system and 11.1% lacked the technical knowledge to handle e-logistics systems.
Table 11: Reasons for future implementation
Frequency Percent Valid Percent Cumulative Percent
Valid Financial 4 17.4 44.4 44.4
Technological changes 4 17.4 44.4 88.9
Lack of Man Power 1 4.3 11.1 100.0
Total 9 39.1 100.0
Missing System 14 60.9
Total 23 100.0
4.2 Prototype: Parcel Masters Logistics Ecommerce system
This prototype was developed to how e-logistics can be used to handle most of logistics’
processes on the side of customer and business interaction.
Login
Log-in to the Parcel Masters Logistics system using the Administrator
account that you created. Type the url of the system into the browser as
follows http://localhost/Parcelmasters
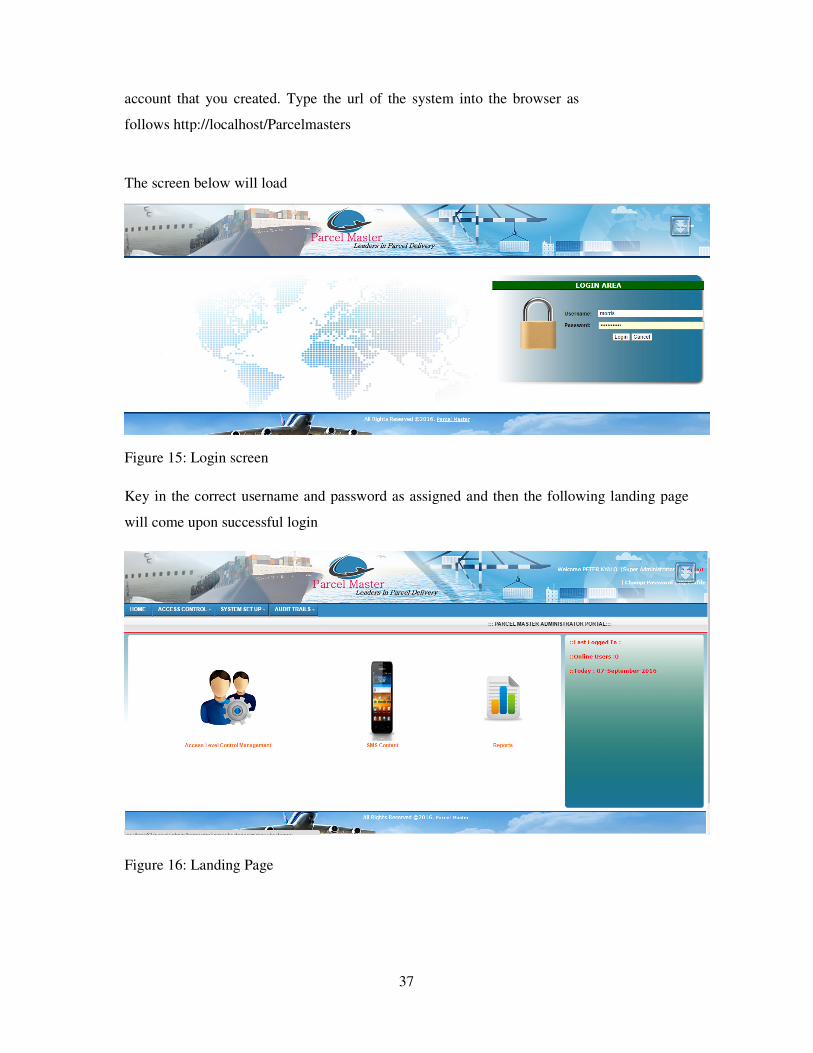
The screen below will load
Figure 15: Login screen
Key in the correct username and password as assigned and then the following landing page
will come upon successful login
Figure 16: Landing Page
37
ccount that you created. Type the url of the system into the browser as
follows http://localhost/Parcelmasters
Key in the correct username and password as assigned and then the following landing page
Key in the correct username and password as assigned and then the following landing page

Manage countries
The core business of parcel masters is to transport parcels from one country to another. It is
therefore important that all countries are managed in the system. To add/delete/edit/view
countries go to the top menu then SYSTEM SET UP
will appear with the existing countries
Figure 17: Countries screen
From the list grid you can use the respective icons to delete or edit a country.
To add a new country from the sub menu above the grid click
Figure 18: Adding new country
38
The core business of parcel masters is to transport parcels from one country to another. It is
therefore important that all countries are managed in the system. To add/delete/edit/view
countries go to the top menu then SYSTEM SET UP->Manage Countries the
will appear with the existing countries
From the list grid you can use the respective icons to delete or edit a country.
To add a new country from the sub menu above the grid click on “Add a Country”
The core business of parcel masters is to transport parcels from one country to another. It is
therefore important that all countries are managed in the system. To add/delete/edit/view
screen below
on “Add a Country”

Manage Tariff Zones
Transfer of parcels from one country to another is charged. For purposes of charging these
countries are grouped into what is called
charged differently. The figure below shows
Figure 19: Managing tariff zones
To add new Tariff Zones click on the “Add New Zone” link above the grid displaying
existing tariffs.
Figure 20: Adding new tariff
39
Transfer of parcels from one country to another is charged. For purposes of charging these
countries are grouped into what is called Tariff zones. Incoming and outgoing transfers are
charged differently. The figure below shows Tariff
: Managing tariff zones
Zones click on the “Add New Zone” link above the grid displaying
Transfer of parcels from one country to another is charged. For purposes of charging these
outgoing transfers are
Tariff zones.
Zones click on the “Add New Zone” link above the grid displaying

Adding Countries to a Zone
To associate a country to a zone goes
screen below will appear. All you need is to select a zone and then check all the countries you
want to belong to that zone and then click on the save button.
Figure 21: Adding countries to a zone
Requesting a Quote and Paying for Delivery
This system has a front end which is
between parcel masters and their clients. The front end is available on the link
http://www.parcelmasters.co.ke/
40
a country to a zone goes to SYSTEM SET UP-> Add Country to Zone. The
screen below will appear. All you need is to select a zone and then check all the countries you
belong to that zone and then click on the save button.
: Adding countries to a zone
Requesting a Quote and Paying for Delivery
This system has a front end which is modelled as a website. It forms the interaction point
between parcel masters and their clients. The front end is available on the link
> Add Country to Zone. The
screen below will appear. All you need is to select a zone and then check all the countries you
as a website. It forms the interaction point
between parcel masters and their clients. The front end is available on the link

Figure 22: Customer home screen
Requesting a Quote
To request a quote fill in the form on front page and click on the button Quote Me
Figure 23: Requesting for a quote
Once you request a quote the screen below comes. Proceed to fill the remaining part
form if you want to pay for the service
41
screen
To request a quote fill in the form on front page and click on the button Quote Me
: Requesting for a quote
Once you request a quote the screen below comes. Proceed to fill the remaining part
form if you want to pay for the service
To request a quote fill in the form on front page and click on the button Quote Me
Once you request a quote the screen below comes. Proceed to fill the remaining part of the

Figure 24: Filling delivery details
Paying for Delivery
Once you have added delivery details click on “Make Payment” button so that you can be
redirected to the payment portal. At t
proceed to pay with your preferred channel
Figure 25: Payment options screen
42
: Filling delivery details
Once you have added delivery details click on “Make Payment” button so that you can be
redirected to the payment portal. At the payment portal many options are given and you can
proceed to pay with your preferred channel
: Payment options screen
Once you have added delivery details click on “Make Payment” button so that you can be
he payment portal many options are given and you can

Checking for Delivery Requests
Once a delivery has been paid for by the client it can be located
administration portal under SYSTEM SET UP
below
Figure 26: Collection requests
Viewing Payments at Merchant Portal
The integrator Pesapal has a portal where payments
Figure 27: Payment merchant screen
43
Checking for Delivery Requests
Once a delivery has been paid for by the client it can be located and found at the
administration portal under SYSTEM SET UP-> Delivery Requests as shown in the figure
Viewing Payments at Merchant Portal
The integrator Pesapal has a portal where payments can be tracked see the figure below
: Payment merchant screen
and found at the
> Delivery Requests as shown in the figure
the figure below

44
4.3 Discussions
This research indicates that the overall level of technology expenditure particularly on
computer systems in comparison with overall organizational budget is low. The research
noted that there is low rate of Information Technology and Communication (ICT) investment
as a low number of surveyed firms has a structured innovation development arrangements.
This discovery is based on direction taken by many firms in to implementation of e-logistics
where there is no known budgetary allocation or the companies have a low revenue turnover.
Haug et al. (2011) advised that those organizations which have adopted planned initiatives to
improve customer service delivery improvements tend to use technology as per of this
improvement. In this context, companies with a long term view of using technology as
leverage in competitiveness need to invest more in their technology departments.
On the other side, the research noted that a number of companies especially those operating
locally do not appreciate what new technologies can do to improve on their business delivery
arrangements and technology is not seen as crucial.
Firms focused on the growth of business in both local and international businesses have a
higher level of e-logistics implementation strategies aimed at enhancing the firm’s ability to
offer services both locally and internationally. Lack of technical knowledge or low level of
education in the staff and also decision makers is a major constraint both on e-logistics
implementation. Managers of logistics service providers must devote more resources to staff
training so as to embrace e-logistics uptake. With regards to barriers of e-logistics
implementation, high costs and lack of sufficient staff investments in learning new
technologies and lack of knowledge of the ICT advantages was found to be barriers of e-
logistics implementation.

45
CHAPTER 5
CONCLUSION AND SUGGESTIONS FOR FURTHER RESEARCH
5.1 Achievements
Objective1: To determine the factors that influences the implementation of e-logistics by
various logistics companies in Kenya.
From this research, we noted that various factors come into play at different levels affecting
the manner in which information technology and particularly e-logistics systems are adopted.
Lack of knowledge on how to develop and run such systems, budgetary constrains associated
with cost of development, implementing and maintaining such systems contributed by a huge
margin forcing many of the companies surveyed to run systems manually.
Objective 2: Determine level e-logistics implementation by logistics service providers.
We noted that there low level of e-logistics implementation and implementation was skewed
towards companies in the international market where they move goods and services across
countries. We however noted that none of these companies had an active online payment
portal where customers could directly complete a purchase.
Objective 3: To demonstrate the critical role of e-logistics can play in supporting business
operations.
Most of the surveyed staff and particularly those on operational side showed great interest in
e-logistics where several services such as quotes and payments could be automated. This
would reduce delays in response to customers and improve on service delivery. Overall, there
would be increased customer satisfaction which could translate to increased sales and a great
competition tool.
Objective 4: Develop an e-logistics prototype for logistics companies which exhibit all
functionalities of an e-logistics system.
Out of the available systems surveyed, none could generate an instant quote or provide means
of payment. As one of the objectives of this research, we developed a prototype
(http://www.parcelmasters.co.ke/ ) and ran it through a number of users who accepted it after
finding it useful in running some of their business processes.

46
5.2 Conclusion
The results presented in this research point out issues of interest to decision makers in
logistics service providers and innovators in both hardware and software technologies. For
instance this research demonstrates the strategic importance e-logistics in improving service
delivery. Results show that firms working on the growth of their product portfolio including
service delivery base show an aggressive rate of technological implementation. The
implication is that e-logistics is important in expansion and the diversification of product
portfolio.
Limitations
The research was exploratory by design which means that there are some limitations. For
instance, the selected sample size for the questionnaire was small and a larger sample could
be more effective. In addition to this, data related to technology expenditure is not easy to
get. Systems costs are often part of wider and bigger organizational costs and not easy to tell
exactly which expense is budgeted for information technology. This research studies
logistics companies in Nairobi only and findings were meant to apply to all logistics
companies in Kenya posing a challenge too.
5.3 Further Research
A number of areas have been identified which may require extensive studies. For instance
this research is based on the current e-logistics implementation practices and but it does not
go further to look at technologies used in implementation of e-logistics and comparison of the
same. By carrying out research which incorporates customers and the companies as well, the
impact of information technology implementation and particularly e-logistics can be traced
and its effects student in length. Such information would also be crucial in policy making
and recommendations to both government and the private sector too as it incorporates
customer opinions too.
47
REFERENCES
1. Brown, I., & Jayakody, R. (2008). B2C e-commerce success: A test and validation of
a revised conceptual model. The Electronic Journal Information Systems
Evaluation, 11(3), 167-184.
2. Cainelli, Giulio, Rinaldo Evangelista, and Maria Savona. "The impact of innovation
on economic performance in services." The Service Industries Journal 24.1 (2004):
116-130.
3. Chang, C. H., Lu, C. W., Chu, W. C., Hsueh, N. L., & Koong, C. S. (2009, March). A
case study of pattern-based software framework to improve the quality of software
development. In Proceedings of the 2009 ACM symposium on Applied
Computing (pp. 443-447). ACM.
4. Constantinides, E. (2004). Influencing the online consumer's behaviour: the Web
experience. Internet research, 14(2), 111-126.
4 Dai, Q., & Kauffman, R. J. (2002). B2B e-commerce revisited: Leading perspectives
on the key issues and research directions. Electronic Markets,12(2), 67-83.
5 Daly, Shawn P., and Lindsay X. Cui. "E-logistics in China: basic problems,
manageable concerns and intractable solutions." Industrial Marketing Management
32.3 (2003): 235-242.
6 DeLone, W. H., & McLean, E. R. (2002, January). Information systems success
revisited. In System Sciences, 2002. HICSS. Proceedings of the 35th Annual Hawaii
International Conference on (pp. 2966-2976). IEEE.
7 Evangelista, P., McKinnon, A. & Sweeney, E. (2013) Technology adoption in small
and medium-sized logistics providers, Industrial Management & Data Systems,
113(7), pp.967 - 989. DOI 10.1108/IMDS-10-2012-0374
8 Gibbs, J. L., & Kraemer, K. L. (2004). A cross‐country investigation of the
determinants of scope of e‐commerce use: An institutional approach. Electronic
markets, 14(2), 124-137.
9 Good, N., & Brown, A. (2006, March). Multi-objective concept design of an
advanced logistics delivery system ship (ALDV). In ASNE Joint Sea Basing
Symposium, Arlington, VA.
10 Guan, C. (2011). Design and Implementation of Assistant System for Online Library.
11 Haug, A., Pedersen, S.G., Arlbjørn, J.S., 2011. IT readiness in small and medium-
sized enterprises. Industrial Management & Data Systems, 111(4), 490-508.
12 Helo, Petri, and Bulcsu Szekely. "Logistics information systems: an analysis of
software solutions for supply chain co-ordination." Industrial Management & Data
Systems 105.1 (2005): 5-18.

48
13 Kelly, Frank P., Aman K. Maulloo, and David KH Tan. "Rate control for
communication networks: shadow prices, proportional fairness and stability." Journal
of the Operational Research society 49.3 (1998): 237-252.
14 Kim, D. J., Ferrin, D. L., & Rao, H. R. (2009). Trust and satisfaction, two stepping
stones for successful e-commerce relationships: A longitudinal
exploration. Information systems research, 20(2), 237-257.
15 Kinuthia, J. N., & Akinnusi, D. M. (2014). The magnitude of barriers facing e-
commerce businesses in Kenya. Journal of Internet and Information Systems, 4(1),
12-27.
16 Krogstie, J. (2012). Model-based development and evolution of information systems:
A Quality Approach. Springer Science & Business Media.
17 Laudon, K. C., & Traver, C. G. (2007). E-commerce. Pearson / Addison Wesley.
18 Longenecker, J., Petty, J., Palich, L., & Hoy, F. (2013). Small business management.
Nelson Education.
19 Metcalfe, J.S., Miles, I., 2000. Innovation Systems in the Service Economy. Dordrecht,
Kluwer Academic Publishers.
20 McPherson, S. (2000). JavaServer Pages: A Developer's Perspective. Sun
Microsystems. Web: http://java. sun.
com/developer/technicalArticles/Programming/jsp.
21 Molla, A., & Licker, P. S. (2005). Perceived e-readiness factors in e-ecommerce
adoption: An empirical investigation in a developing country. International Journal of
Electronic Commerce, 10(1), 83-110.
22 Murach, J., & Harris, R. (2010). Murach's PHP and MySQL. Mike Murach &
Associates, Inc..
23 Mutua, J., Oteyo, I. N., & Njeru, A. W. (2013). The extent of e-commerce adoption
among small and medium enterprises in Nairobi, Kenya. International Journal of
Business and Social Science, 4(9).
24 "Peter Kariuki, CCK speech, CTO Workshop on Telecommunications Competition
and privatization, 5 March 2003". Retrieved March 16, 2006
25 Ramanathan, R., Ramanathan, U., & Hsiao, H. L. (2012). The impact of e-commerce
on Taiwanese SMEs: Marketing and operations effects. International Journal of
Production Economics, 140(2), 934-943.
26 Sarkis, Joseph, Laura M. Meade, and Srinivas Talluri. "E-logistics and the natural
environment." Supply Chain Management: An International Journal 9.4 (2004): 303-
312.

49
27 Savrul, M., & Kılıç, C. (2011). E-commerce as an alternative strategy in recovery
from the recession. Procedia-Social and Behavioral Sciences, 24, 247-259.
28 Stockdale, R., & Standing, C. (2004). Benefits and barriers of electronic marketplace
participation: an SME perspective. Journal of Enterprise Information
Management, 17(4), 301-311.
29 Tidd, Joseph, Keith Pavitt, and John Bessant. Managing innovation. Vol. 3.
Chichester: Wiley, 2001.
30 Vitasek, K. (2013). Supply Chain Management Terms and Glossary.
31 Wang, Y., & Pettit, S. (Eds.). (2016). E-logistics: Managing Your Digital Supply
Chains for Competitive Advantage. Kogan Page Publishers.
32 Welsh, M., Culler, D., & Brewer, E. (2001). SEDA: an architecture for well-
conditioned, scalable internet services. ACM SIGOPS Operating Systems
Review, 35(5), 230-243.
33 Zhang, Jie. Development of E-ecommerce Web Application Using WAMP. Diss. San
Diego State University, 2010.
34 Zhu, K., Kraemer, K., & Xu, S. (2003). Electronic business adoption by European
firms: a cross-country assessment of the facilitators and inhibitors. European Journal
of Information Systems, 12(4), 251-268.

50
APPENDIX 1: INTRODUCTORY LETTER

51
APPENDIX 2: QUESTIONNAIRE
E-logistics implementation among logistics service providers in Kenya
This questionnaire is targeted to information technology, commerce and management
sections of logistics companies operating in Nairobi or any staff with the capacity of making
decisions on implementation of e-logistics in offering logistics services. The questionnaire
should take around 10 minutes and is easy to answer.
SECTION A
Demographic data
1. What is your age bracket?
a. 0 – 19 years [ ]
b. 20 – 29 years [ ]
c. 30- 39 years [ ]
d. 40 – 49 years [ ]
e. 50 years and above [ ]
2. What is your department?
a. Operations [ ]
b. Information Technology [ ]
c. Commercial [ ]
d. Management [ ]
e. Finance [ ]
3. What is your highest level of education
a. Primary [ ]
b. Secondary [ ]
c. Degree [ ]
d. Masters [ ]
e. PhD [ ]
f. Professional qualifications in IT [ ]
g. Other – Please specify
4. Which of the following best describes your organization
a. Local logistics company (Domestic) [ ]
b. International Logistics Company [ ]
c. Both [ ]
5. What is the annual estimated annual revenue for your organization in Kenyan
shillings
a. Less than 500,000.00
b. 500,001 to 1,000,000.00

52
c. 1,000,001 to 5,000,000.00
d. 5,000,001.00 to 10,000,000.00
e. Over 10,000,001.00
f. Unknown
6. What is your firms information technology but as a percentage of revenue?
a. Less than 5%
b. 5 – 10%
c. 10 – 20%
d. Unknown
7. How long has the company been operational
a. Less than one year
b. 1 – 5 years
c. 6 – 10 years
d. 11- 15 years
e. 16- 20 years
f. Over 21 years
8. How many employees does the company have?
a. 0 – 50
b. 50 -100
c. 100 – 200
d. 201 – 300
e. 301 and above
SECTION B
This section is aimed at directing you to other sections. Please select the appropriate
answer and proceed as instructed further down.
9. Select the option which best describes your company
a. Our company has already implemented a logistics ecommerce system.
b. Our company intends to implement a logistics ecommerce system in future.
c. Our firm does not intent to have a commerce logistics system.
If your answer to question 9 (a) is true proceed to section C
If your answer to question 9 (b) is true proceed to section D
If your answer to question 9 (c) is true proceed to section E
SECTION C
Answer this section if you selected (a) in question 9 of section B
53
10. Which of the following was a key factor which influenced decision to implement a
logistics ecommerce system
a. Competition activity [ ]
b. Customer request [ ]
c. Business process change request [ ]
d. Internal staff request (marketing, commercial, customer service) [ ]
e. Other (please specify)
11. On a scale from 1 (strongly disagree) to 5 (strongly agree) rate to what extent you
would agree or disagree with the following views regarding implementation of
logistics ecommerce system for your organization.
Strongly
Disagree
Disagree Neutral Agree Strongly
Agree
The ecommerce platform enables our
customers request for services easily.
Ecommerce system improves an
organisations visibility to customers
Ecommerce system increases profitability by
increasing sales
Ecommerce system allows greater customer
interaction
There is enough security in interacting with
customers through the ecommerce system
Top management fully supports the
utilization of the ecommerce system
The top management is aware of the benefits
of utilizing logistics system
Many of our competitors have implemented
ecommerce systems.
Our competitors who have implemented
ecommerce systems are benefiting greatly
Our competitors who have implemented
ecommerce systems are perceived favourable
by customers.
SECTION D
Answer this section if you selected b in question 9 of section B
12. If your firm intends to implement a logistics ecommerce system in the future, how
soon do you think your company will implement the system?
a. Less than 5 years

54
b. 6 – 10 years
c. 10 – 20 years
d. I do not know
13. Why does your company intent to implement an ecommerce system in the future?
a. Financial capability.
b. Technological charges necessitating need to wait.
c. Lack of manpower to manage the system.
d. Other (Please specify)
SECTION E
Answer this section if you selected (c) in question 9 of section B
14. If your company does not intent to implement an ecommerce system, on a scale from
1 (strongly disagree) to 5 (strongly agree) rate to what extent you would agree or
disagree with the following views regarding implementation of logistics ecommerce
system for your organization.
Strongly
Disagree
Disagree Neutral Agree Strongly
Agree
Ecommerce system is an unnecessary cost to
our company
An ecommerce system will expose our
company information
We do not have the necessary skill to
implement an ecommerce system
Our management does not understand the
impact of an ecommerce system to our
business operations