e cc2ta r studies of the diffusive separation … · e cc2ta r (1 eam studies of the diffusive...
TRANSCRIPT

E CC2TA R (1 EAM STUDIES OF THE DIFFUSIVE SEPARATION OF HELIUM-ARGON
MIXTURES IN FREE JETS AND SHOCK WAVES
by
Dietmar E. Rothe
C LE AARI HG H 0USE rv D DFOR FETYERAL S;CIENTIIC AND U ~W
TECHN!Ct~ NVO!~MA1ONAUG 3,,Hardeopy4 irfCj
UT ASQ
.TTITVUTIAS REPORT NO. 114

I
DISCLAIMER NOTICE
THIS DOCUMENT IS BEST
QUALITY AVAILABLE. THE COPY
FURNISHED TO DTIC CONTAINED
A SIGNIFICANT NUMBER OF
PAGES WHICH DO NOT
REPRODUCE LEGIBLY.
~ElgCTROk BAAM STUDIES, OF1 THE ,DIFFUSIVE SEPARAT~ION OF HItJM-ARGON
'MIXURES IN FREE JETS AND .SHOCi WAVES
by
Die6tmAr E. Rthe7
Mansc,- ptreceivedMy16
JULY 1966 UTIAS REPORT NO. 114

ACKNOWLGWTS,
My personal thanks are expressed to Dr. G. N. Patterson,who provided the opportunity and the facilities for carrying out thisresearch, and to Dr. J. H. de Leeuw, who suggested the problem in the firstplace and who contributed to this work through many enIightening discussions.
The assistance received from Mr. PiV. Marrone during the ex-periments is most gratefully acknowledged'.
Thanks are-also-due to Mr. J.L. Bradbury of the Institute's.shop staff for the care and precision applied to the construction of -theelectron gun system.
I am maost grateful to my wife, Gerda, for preparing some ofthe figures of this report and for her continued encouragement-.
This research was supported by the Defence Research Board ofCanada under Grant No. 9551-O2 and by the United States Air Force Office ofScientific Research under Grant No. AF-AFOSR-276-65.
ii
SUMMARY
•A narrow electron beam was used- to selectively determine thecomponent densities in rarefied helium-argon flows- by spectrally analyzingthe beam's luminescence. After a -systematic study of the electron beamfluorescence in helium and argon had been made in a series of preliminaryexperiments, point-by-point measurements were made along and off the axes ofunderexpanded free jets and through normal shock waves produced by shockholders placed in the jets. Various argon mole -fractions were used-, andthe jet- Reynolds numbers ranged from 100 to 1O,000. The argon enrichment foundalong the jet axis agrees well with a theory recently proposed by F. Si Sher-man. -Off axis tests show an argon deficiency .near the jet -boundary. Theexperimental shock -profiles agree only qualitatively with one-dimensionaltheories. Radial diffusion destroyed the otherwise 'approximate one-dimen-sionality of the shock waves, resulting in a significant argon enrichmentinside the partially stagnated shock holder.
iii
TABLE OF CONTENTSage
-NOTATION
•I.. INTRODUCTION 1
ITHEORETICAL TEDICTIONS 3
III. THE ELECTRON: BEAM DENSITY PROBE 7
I,. DESCRIFJION OF APPARATUS 8
4.1 The- Low Dehsity Tunnel 84g2 The Electron Gun 9
4.3 The Optical Analyzer 114.4. Nozzles And Shock Holder 13
V. PRELIMINARY TESTS 14
5.1 Static Calibration Using. Pure Gases 145.2 Electron Beam Excited- Spectra in Helium and Argon 165.3 Optical Profiles of the Electron Beam in a High
Speed Gas Flow 225.4 Axial Density Measurements in Pure Gas Jets 235.5 Shock Profiles in Pure Gases 235.6 Static Calibration of Gas Mixtures With the Aid of
a Mas sSpedtrometer 24
VI. DISCUSSION OF sYSTEMATIC- ERRORS 27
VII. FREE JET RESULTS (Helium-Argon Mixtures) 29
VIII. SHOCK WAVE RESULTS (Helium-Argon Mixtures) 32
IX. CONCLUSIONS 34
REFERENCES 37
FIGURES
APPENDIX A - Analysis of the Bottled Gas Mixtures
APPENDIX B - Equilibrium Value of fo in the Stagnation Chamber
APPENDIX C - Relative Thickness of the Mach Disc in a Pure Gas
iv

NOTATIONe
a speed of sound
C correction coefficient in-the viscosity law (defined by Eq. 8)
D orifice diameter
D12 binary diffusion coefficient
E-Sherman's diffusion parameter (defined by Eq. 7)
f mole fraction of the heavy species
Ib electron beam current
Iph anode current of photomultiplier
m atomic or molecular mass
M -Mach number
n number density of atoms or molecules
p gas pressure
r radial distance measured from the axis of -a free jet
R radius of a hemisph'erical surface centered at the orifice
Reo Reynolds number based on the orifice diameter and the stagna-tion chamber properties of the gas
Rer Reynolds number based on the radius of shock curvature and thefree stream properties of the gas
s distance along a streamline
s unit vector pointing in the streamline direction
S continuous surface everywhere normal to the streamlines
Sco Schmidt number based on the stagnation chamber properties ofthe gas (Sco = iJ o D12 )
T gas temperature (absolute)-
u center of mass velocity of an element of gas
vI diffusion velocity of the heavy species (defined by Eq. 3)
4volumetric pumping speed of the tunnel
x distance along the axis of a free jet measured from the centerof the sonic orifice
v

I
x6 location of hypothetical -source of the free jet expansion
xM axial distance to the center of the Mach disc
'Xi- distance normal to shock waVe measured from center of shock
athermal diffusion factor
7 ratio of specific heats of a gas,
6 shock thickness
6 shock thickness based on the -maximum slope of the densitySprofile
E ratio of the pressure behind the, Mach disc to the ambient pressure
wave length of light
"Molecular mean free path" ahead of the shock (defined by Eq.14)
viscosity of the gas
p mass density of the gas
molecular number flux fraction of the heavy species (defined byEq. 5)
Subscripts
o stagnation chamber conditions
* sonic conditions
0test section conditions outside of the free jet
A argon
H helium
As applied to the free jet
1 refers to the heavy species,
2 refers to the light species
As applied to the shock wave
1 refers to the free stream conditions upstream of the shock,
2 refers to the conditions downstream of the shock.
vi
I. INTRODUCTION
in the general field- of experimental supersonic gas dynamicsthere occur many instances -ir which -gas mixtures are subjected to severeaccelerations and decelerations. Under these -conditions the resulting gasdynamic forces are able to support large pressure gradients, accompanied bycorresponding temperature and density gradients. In many cases these grad-ients cant become quite significant over the distance of a molecular mean freepath, and diffusion effects, in particular those resulting from barodiffusion,can no longer be ignored and must be included in a general description of the'flow structure. Typical examples are gas dynamic shock waves and Prandti;Meyer expansibn fans in a rarefied gas mixture.
Since planetary atmospheres, in which aircraft and spacecrafthave to operate, consist -of mixtures of various gas components, and sincethe gases expelled by propulsive devices are generally made up of constituentsof widely varying molecular massesj the diffusion phenomena are also ofpractical interest in aerodynamic problems. For example, the heat transferto- the surface of a re-entering space vehicle, the combustion- characteristicsof a fuel-air mixture in a supersonic flow, or the thrust characteristics ofa reaction jet (rocket exhaust), are all influenced by the distribution ofthe gas components in the relevant gas- mixture.
The present report concentrates on two specific flow configura-tions; the gas dynamic shock and the underexpanded free jet issuing from acircular sonic orifice. Binary-gas mixtures of non-reacting inert compon-ents were used throughout. Helium and argon were chosen, -because these gasesare readily available, and-because their atomic masses differ by a factor often. As will be shown in Section II a large mass difference of the atomicspecies makes the barodiffusion effects correspondingly large and easilydetectable.
Whereas the structure of the underexpanded free jet -and that ofthe one-dimensional shock wave in pure gases are reasonably well understood,the same cannot be said for the case of gas mixtures. Experimental investi-gations of the species separation in the free jet have been performed in thepast for two reasons. One is the prospect of separating isotope mixtures; theother the possibility of generating high energy molecular beams. In thelatter case, a light gas is seeded with a small amount of heavy gas. In theprocess of expansion the heavy molecules reach essentially the adiabaticescape speed of the light gas and, thus, gain a larger directed mass velocitythan could be obtained by adiabatically expanding the heavy gas alone.Furthermore, the heavy molecules remain on the average closer to the jetaxis than the light molecules. By introducing a suitably designed strippingbaffle into the flow, the jet core, which is enriched in the high energymolecules of the heavy type, can be isolated for use in molecular beranexperiments. The arrangement, consisting of a skimaer in a free jet, hasalso been proposed for separating isotopes.
In order to-determine the most efficient combination of jetparameters and stripping baffle design and location for the purpose of iso-tope separation or molecular beam generation, previous experimenters useda mass spectrometer to determine the composition of the gas extracted fromvarious regions in the free jet by means of a sampling probe or skimmer,with the hope of gaining an understanding of the diffusive separation occurr-ing in the free jet itself. The results obtained in this fashion by Becker,
1
-- _7
Bier and Burghoff (Ref. 1)' and by Waterman -and Stern '(Refs. 2 and 3), who cor-
pared the composition in the jet core behind the skimmer with that- in the jetperiphery, gave an inconsistent+ picture of the+ actual free jet separation.This, *is so +partly; because- the +samples were taken from 4 finite cross-sectionof the:,j~t over which the gas composition was not -constanti The measuredcomposition, theref6re+, represented an average value in this case, and couldnot easily be related to the actual composition at any specific point in thefree- jet. Chow (Ref. 4)-, who used a small diameter sampling probe, found thegas enriched inthe heavy species at all points in the free jet. This contra-dicted the measuremehts reported in Refs. 1 to 3. it is now generally believed,and- the present work lends strong support to this view, that Chow's separationresults were probe induced. In fact, Chow has recently shown (Ref. 5) that acurved shock, standing in front of the -sampling tube, could account for theresults obtained in his earlier experiments. Reis and Fenn (Ref. 6) came tothe same conclusion after performing Some sampling probe tests of their own.It is also suspected that the compositions measured behind skimmers in Refs.j to 3 were inflUenced by the skimmer interacting with the supersonic flow.In the present experiments all probe induced effects were avoided by analyz-ing the gaseous luminescence, induced by a thin 17.5 kv, lO1pamp electron beam,for the determination of the component densities in the undisturbed free jet.
Recently there have appeared in the literature several attemptsto give a quantitative theoretical account of the species separation in a freejet. Of these the papers by Zigan (Ref. 7) and Sherman (Ref. 8) are of inter-est here. In Zigan's work the results are given in integral form and allowa comparison with skimmer experiments (e.g. Refs.1 to 3). The agreement ispoor; presumably because of flow disturbances introduced by the skimmer.The results of the present experiments can most readily be compared withSherman (Ref. 8)4 who gives an expression for the mole fractions along theaxis of symmetry of the free jet. This is done in Section VII of this report.
The structure of the one-dimensional normal shock wave in abinary gas mixture has been treated theoretically by several authors (Refs.9 to 11). Both continuum flow concepts and kinetic theory have been appliedto the problem. So far no experimental tests have been reported for theshock wave structure in gas mixtures.
The motivations for the work reported here may be summarizedas follows:
(1) A non-ambiguous measurement of the diffusive separation in under-expanded free jets was in order to settle the argument as to whatspecies separation exists in the undisturbed free jet.
(2) A direct test of Sherman's theory for the axial variation of thecomponent mole fractions became feasible with the use of the electronbeam probe.
(3) Direct experimental evidence of species separation inside shock wavescould be obtained and could be compared with existing theories.
(4) By probing shock waves produced in front of a partially choked shockholder, placed in the supersonic flow of the free jet, some additiouallight could be shed on the "probe induced separation effects".
2
(5) The results could be expected to have some practical application inthe design of gaseous diffusion facilities for isotope separationand. in the design of seeded molecular beam devices.
II. THEORETICAL _EDICTIONS
For the isentropic flow of a diatomic gas (7 = 7/5) the Machnumber variation along the axis of the underexpanded free jet, issuing from a
ed, sonic orifice, has been calculated by Owen and Thornhil' (Ref. 12), using then method of characteristics. More recently similar calculations have been per-
formed for specific heat ratios of 5/3, 7/5, and 9/7 by Wolff and have beenreported by Sherman (Ref. 13). These solutions are universally applicable tofree jets expanding into an ambient gas at non-zero pressure in the regionbounded by the orifice and the first wave front, which registers the existenceof an ambient pressure. This wave front is usually well defined by the barrelshock, formed by the coalescing Mach waves reflected from the jet boundary,and by the Mach disc. The Mach disc location is given by an empirical law(Ref s.14 and 15). I
X D = (2/3) (pWP , (1)
where xM is the distance from the orifice to the Mach disc, D is the orificediameter, and po and p. are the stagnation chamber pressure and ambient pressure,respectively. A sketch of the general flow configuration of an underexpandedfree jet is given in Fig. 2.1.
Once the Mach number is known locally, all other thermodynamicgas properties can be obtained from the isentropic relations in the inviscidcase. These show that for distances larger than about two orifice diametersthe gas density, p (or the molecular number density, n), falls off asi/(x-Xo)2, where xo is the location ofa hypothetical source near the orifice,given by the intersection of the streamline asymptotes with the jet axis (seeFig. 2.1). It should be noted, however, that this variation of the density isnot dependent on the flow being isentropic, but is strictly a result of the geo-metry of the source-flow-like expansion and the fact, that at x/D = 2 thevelocity has virtually reachedits maximum value of the escape speed. For thisreason density measurements which agree with the isentropic density profilecannot be used to establish whether the free jet flow is isentropic or not.
In his treatment of the underexpanded free jet of a binary gasmixture Sherman (Ref. 8) combines the continuum flow conservation equations(Navier-Stokes), written for a two component mixture, with the binary diffus-ion equation based on the Chapman-Enskog theory of diffusion. The latterequation may be written in the form
1 = 2 [f(l-f) Vin p - a Vin T - Vf, (2)
where the subscript "1" refers to the heavier species; f is the mole fractionof the heavier species; m = fmI + (1-f) m2 is the mean molecular mass; D1 2and a are the binary diffusion coefficient and the thermal diffusion factor,respectively; z1 is the diffusion velocity of the heavy species defined by
l: u u "(3)
3
where u1 is the mass velocity of the heavy species and u is the center of massvelocity of an element of the gas mixture.
In the free jet expansion and in the shock transition the tem-perature gradient is in the same direction- as the pressure gradient. Thermaldiffusion opposes barodiffusion under these circumstances. An order of magni-tude analysis of Eq. (2), as applied to the free jet or the shock wave, re-veals that barodiffusion is by far the dominant separating agent. In baro-diffusion the heavy molecules diffuse towards the high pressure regions. Inthe free jet, because of the streamline curvature near the orifice, high pressuresoccur on the jet axis. Radial barodiffusion, therefore, causes an enrichmentof heavy molecules along the jet centerline. Once a separation between thecomponent species has taken place, ordinary diffusion tends to homogenize themixture again.
In order to obtain a solution for the set of equations, Shermanexpands all variables in terms of inverse powers of the Reynolds number, basedon the stagnation conditions and the orifice diameter: e.g.
f = f(o) + f(l)/Re + f 02/Re2 +
where the, jet Reynolds number* is defined by the expression,
Reo = po a D/o = mo no (7RTo)1 D/p° . (4)
In the zeroth approximation the flow is isentropic, and the mixture remainshomogeneous. Neglecting all terms of second and higher order Sherman thensolves for the first order perturbation terms in the mole fraction, f, andthe molecular number flux fraction,
0 = n1 il.S/(nu I + nH 2 ).s , (5)
along the axis of the jet by integrating the equations along the centralstreamline (s is a unit vector along the streamline). Using the expressionsderived in this manner in Ref. 8 the change in the mole fraction of the heavycomponent along the axis can be written:
(f-f o = (r-1) M2(l + Y M2)(537)/2(Y-) dMo EC =L2 d x/D)
M (M2-1)(3+M2) 1+Y-1 M2) 75)2y dM-2M -l+2 M d/D) JM (6)0
In this relation M represents the Mach number,
E - Sco)[ mom (o)c J
SThe Reynolds number used here is twice that used by Sherman.
4

andC T 0 ToI ° T4 (8)
The Schmidt number is defined as Sco a pLpo D1 2 , and the starred quantitiesare those at sonic conditions. For a monatomic gas mixture (7= 5/3) Eq- (6)reduces to
Reo 2 2 dY M 2 _1 D dM (9)(f-f) ---C = 3 M (x/D - M "x/d)
0The difference between the molecular number fraction and the
number flux fraction on the jet axis is given by
(f_0jRe o = (7_1) ( - M2)(5-3)/2(71) dx (i0)
which for 7 = 5/3 reduces toReo 2 dM
The fact that f - ¢ does not vanish is a consequence of the gas componentshaving different mass velocities in the x-direction.
Equations (6),(9),(10), and (11) are subject to the followingassumptions and limitations:
(1) Sherman's analysis has been based on the assumption of large Reynoldsnumbers, so that second order terms (of order Reo "2) in the asymptotic expan-sion could be neglected. This is equivalent to stating that the free jet ex-pansion of the gas mixture as a whole is reasonably well described by theisentropic theory, and that the diffusion effects, as well as the viscosityand heat conduction effects, introduce only small perturbations around theisentropic solution. Furthermore, as a consequence of retaining first orderperturbation terms only, ordinary concentration diffusion is neglected.Because the local Reynolds number per unit length decreases with increasingx/D, it is evident that this analysis cannot be valid for arbitrarily largevalues of x/D.
(2) Since relatively few experimental data exist for the temperaturedependence of the diffusion coefficient, -the product pD12 in Eq. (2) has beenreplaced by u/Sc. In the subsequent analysis the local Schmidt number has thenbeen considered independent of temperature, and it has been assumed that thetemperature dependence of the diffusion processes are adequately taken intoaccount by the temperature variation of the viscosity, for which sufficientdata are available. In this connection, a linear viscosity-temperaturerelation (/Po = CT/To) has been assumed which becomes increasingly inaccuratewith increasing x/D and the consequent very low temperatures, since for a realgas the relation is better described by a power law dependence, the exponentof which is less than unity.
Reference 8 presents an explicit numerical solution for the caseof diatomic gases. In order to find the corresponding result for a monatomicgas mixtureEq. (9) has been integrated numerically by the author. For theintegration Wolff's calculated Mach number curve for 7= 5/3 was used from onenozzle diameter out to infinity. In lieu of other available data this curve
5
was extended backwards through the orifice using impact probe data (see Ref.15) for the case of air. This appareitly inconsistent patchwork can bejustified on two accounts.
S(1) The isentropic expansion of a gas up to about Mach 2 is primarily afunction of the geometry o the constraints on the flow and is only a weakfunction of 7
(2) It has been demonstrated in Ref. 8 that the calculated downstreamseparation is almost insensitive to- the shape of the axial Mach. number profilethrough the nozzle.
The calculated results are shown in Fig. 2.2. These indicatethat for a monatomic gas mixture the species separation takes place morerapidly and reaches a slightly higher value than for the diatomic case. Thus,it appears that for a helium-argon mixture almost all of the species separa-tion in the expansion takes place- ovtr an initial distance of about three ori-fice diameters, and remains relatively constant thereafter. Furthermore, thetheory predicts an inverse proportionality of f - fo to the flow Reynolds num-ber. In- fact, the species separation will be insignificantly small forRe o > 5000 for all mixtures. For a given Reynolds number, on the other hand,the change in the mole fraction of argon appears to be a maximum for a mix-ture consisting of about equal numbers of helium and argon atoms. This is so,because the parameter E varies from zero, for fo = 0, to a maximum value ofabout three at fo = 0.5, and back -to zero again, for fo = 1.
In order to compare any experimental data with the theoreticallypredicted species separation, the jet Reynolds number and the parameters E andC must be calculated for the particular jet under investigation. In this connec-tion, the product p0D serves as a convenient parameter for defining the experi-mental conditions, since for any given gas or gas mixture this number is pro-portional to the jet Reynolds number. To facilitate an easy conversion ofthe experimental p0D value to the jet Reynolds number and to Reo/EC, thequantities Reo/poD and Reo/EC poD have been calculated as a function of fofor helium-argon mixtures at a stagnation temperature of 3000K (see Fig. 2.3for these curves). In deriving these curves Wilke's formula (Ref. 16) wasused to estimate the viscosities of the gas mixtures from the pure gas viscosi-ties. The latter were calculated according to the Chapman-Enskog theoryassuming an atomic interaction potential of the Lennard-Jones type (see e.g.Ref. 17).
For a theoretical treatment of the shock structure in binarygas mixtures the reader is referred to the papers by Sherman (Ref. 9).Fujimoto (Ref. 10) and Oberai (Ref. 11). The following two features, commonto these theories, should be noted.
(1) Owing to the fact that barodiffusion tends to accelerate the heavymoleculas in the downstream and the light molecules in the upstream direction,the light species compresses ahead of the heavier species, resulting in anenrichment of the light gas throughout most of the shock.
(2) The overall thickness of the shock transition, in teris of the up-stream flow properties, is larger than for a pure gas unaer similar conditions.
One, very unexpected result is peculiar to Sherman's analysis,however, and is a consequence of the application of the Navier-Stokes equations
6
to the shock structure problem. F )r a helium-argon mixture containing twoper cent argon, Sherman finds the heavj gas accelerating in the upstreamportion of a steady flow Mach 2 shock wave before undergoing the-expecteddeceleration. Oberai, who uses a Mort-Smith type analysis, also calculates theshock profiles for the case of very small mole fractions of the heavy gas, butdoes not anywhere observe this peculiar behaviour of the heavy species. Since,by necessity, both these theoretical methods are approximate treatments of aninherently complex phenomenon, it is not possible at this time to discard oneanalysis in favour of the other on purely theoretical grounds. The answerwill have to be provided by experiment. In fact, the initial behaviour of the
heavy component at low concentrations may turn out to be a very sensitive testfor the adequacy of any theoretical model.
III. THE ELECTRON BEAM DENSITY PROBE
The optical electron beam density probe was suggested and de-veloped by Schumacher and Gadamer (Ref. 18) and was first applied to anactual flow investigation by Gadamer (Ref. 19), who showed that it can beused to accurately determine the local densities in a rarefied gas flow.The technique employs a narrow, well-collimated, high energy electron beam,which is- projected at right angles to the flow through the region of inter-est. Because of the relatively small collision cross-section of the gasatoms for 20 kv electrons, the interaction of the beam with the gas is weakand results mainly in the scattering at small angles of s Sme of the primaryelectrons. For gas densities below 4 x lO15 atoms per cm (120g Hg at roomtemperature) the beam remains well defined and virtually unattenuated over
c- distances of the order of 10 cm. At the electron- energy used many of theelectron-atom interactions are of the elastic type. There occur, however,sufficient inelastic collisions, resulting in electronic excitation and subse-quent de-excitation, to give rise to a luminescence, which is largely confinedto the beam region itself. By focusing the luminescence onto an optical slit,,hich is at right angles to the beam, the light issuing from a small elementalgas volume is selected and can subsequently be analyzed by photomultipliers.The photocurrent measured is a direct indication of the molecular number den-sity in the elemental volume under consideration. The component densities ina gas mixture can be measured selectively by spectrally separz-ting the lightemitted by the gas components.
It should be pointed out, that at gas densities correspondingto a gas pressure of 0.2 torr a room temperature, the average time betweenatomic collisions (of order lO- sec for most gases) becomeg comparable to thelife times of the excited states of the atoms (of order 10- sec for allowedtransitions). Urder these conditions> a measurable fraction of the electronbeam excited atom collide with other atos (ground state atoms), before theycan emit the excitation energy in the form of radiation. In this connection,it is quite unlikely, that in the collision all of the excitation energy (oforder 10 ev) is converted to kinetic energy of the two colliding atoms. Onthe other hand, it is not difficult to think of collision processes, in whichthe excited atom is knocked into a different energy level, from which radia-tive de-excitation takes place in a spectral region, that lies outside thespectral range observed (e.g. in the ultra-violet). This makes the observedintensity of the electron beam luminescence less than one would otherwise pre-dict. The effect is generally referred to as "collisional quenching" of theradiation concerned.
7
-Ad
Since the collision -frequency- and, therefore, the collisionalquenching effects are temperature dependent as well as density dependent, itis almost imperative to work with gas densities, at which collisional quench-ing can be neglected. For the visible spectrum of nitrogen Gadamer (Ref. 19)found no quenching effects. up to 0.1 torr, and Muntz and Marsden (Ref. 20) foundthat for the green line of helium (A 50161) the quenching effects becameimportant only above 0.25 torr.
IV. DESCRIPTION OF APPARATUS
4.1 The Low Density Tunnel
All experiments described in Sections V, VII, and VIII ofthis report were performed in the UTIAS steady flow low density tunnel, thebasic design of which has been described by Enkenhus (Ref. 21). The pri-mary pumping system of the tunnel consists of nine booster type oil vapourdiffusion pumps, which have a total maximum pumping capacity of about 10,000liters/sec of air at 0.03 torr. The pumping speed is somewhat lower for argon,but nearly twice that value for heiium. Since the speed of sound in heliumis about three times that in air, however, the exit diameter of a heliumnozzle cannot be made as large as that of an air nozzle (producing the sameMach number jet at the same jet pressure) in order to not exceed the tunnel'spumping capacity. In the present tests the mass flow of helium was also limit-ed by the mechanical backing pumps, which have a combined pumping speed of anominal 485 cubic feet/minute at a pressure of about 1 torr, regardless of thegas used.
The pumping speed limitations of a low density tuzinel definethe maximum size of the expansion field of an underexpanded free jet, whichcan be produced in the tunnel. As was pointed out by Ashkenas and Sherman(Ref. 15), the distance from the sonic orifice to the Mach disc is.simplyproportional to the square root of the volumetric pumping speed, V , of thetunnel, independent of the orifice diameter; i.e.
XM =-~ (RT 0 ) (7,1) (7+l)/4(7-l), . 124 (yRO 2" (2
With the present pumping capacity of the UTIAS tunnel thefollowing maximum distances from the orifice to the Mach disc can be achieved:
air, xM = 18 cm,argon, xM = 18 cm,helium, xM = 13 cm.
If the tunnel pressure, po, is kept constant at the value atwhich the volumetric pumping speed is a maximum, in order to maximize thesize of the test region, then the mass flow (which is proportional to pD 2)is fixed. In this case the jet Reynolds number is inversely proportional to bheorifice diameter. For example, if the orifice diameter is decreased from D1to D2, the stagnation chamber pressure has to be raised by a factor of(D1/D2) 2 , for the equilibrium test section pressure, p., to remain unchanged.The new jet Reynolds number is then larger by a factor of D1/D2. Furthermore,since xM is unchanged, xM/D has increased, and the maximum Mach number in the
8

jet (just in front, of the Mach disc) is correspondingly larger. Therefore,a wide variety of Mach number ranges and jet Reynolds numbers can easily beachieved by using a suitable selection of orifice sizes.
4.2 -The Electron Gun
The electron gun- assembly, complete -with 'diffusion mpsadgauges, is mounted on a traversing table, which makes a sliding.peal with, thetop of the test section of the UTIAS low density tunnel. An it lrenali tra-versing mechanism allows the electron beam, which passeg through the testsection from top to bottom, to be moved parallel to igsaf within a 15 cm by15 cm square, A schematic diagram of the low density t nnelwithlthe electrongun in place is given in Fig. 4.1. An external view; of the -un- nd the tra-versing table, with the power supplies and the instrumentation in the back-ground, is shown in Fig. 4.2.
The electron beam is produced by a cohmrcialotelevision tubegun (Philips, Part No. 902-564) housed in the inner of two concentric tubes,which pass through the traversing table into the ttst secti!nh of ,the tunnel,where the normal operating pressure is. between 10 and 10"- tort. To pre-vent deterioration of the electron gun cathode and- to eliminate scatteringof the electron- beam before it enters the test section, the gun chamber(formed by the inner stainless steel tube) must be. maintained at a vacuum ofabout 10- torr during operation. This is achieved by passing the eiectronbeam through an intermediate pressure chamber before ejecting it into thetest section. The intermediate pressure chamber is formed by the outer tube,which projects somewhat farther into the tunnel than the gun chamber. Thegun chamber as well as the intermediate chamber are constantly evacuated bytwo separate 80 liters/sec oil vapour diffusion pumps (Edwards, Model 203B).A flexible backing line connects the diffusion pumps to a two stage rotarypump. The pressure in the intermediate chamber is less than 5 x 10 torrunder normal operating conditions.
From the gun chamber into the intermediate chamber ard fromthere into the test section the electron beam has to lass through two aper-tures of low gas conductance. These restrict the inflow of gas from the testsection and confine the electron beam geometrically. The upper aperture is2 mm in diameter and 12.5 mm long. The lower aperture is 1 = in diameterand 15 mm long and is followed by a copper block with a i mm wide slit to re-duce the beam width as seen by the optical apparatus for a good spatial re-solution. In both cases the apertures consist of cylindrical holes drilledthrough copper inserts, which can easily be replaced. The lower one iselectrically insulated from ground by means of ceramic washers so that theelectron beam current intercepted by it can be measured with a micro-ammeter.
Careful alignment and focusing of the beam is necessary to allowit to pass through both apertures. A system of eight electrostatic deflectionplates mounted below the gun electrodes has proved to be an invaluable aidfor bringing out the beam and for keeping the beam current constant duringthe tests. The voltage between the plates of any pair can be varied between-400 and +400 volts. The deflecting plates are 4 cm wide, 4 cm long, andlcm apart. With the aid of the control circuit shown in Fig. 4.3 it ispossible to shift the beam parallel to itself by a single adjustment for eachof the two horizontal dimensions. Similarly, the beam can betilted about itspoint of incidence at the upper aperture by adjusting a single control dial.
9
Any defocusing effect due to the transverse electric fields is minimized by
always keeping the electric potentials of the plates of each1pair equal inmagnitude-, but opposite in polarity, with respect to ground, so that theregion traversed by the beam is effectively at ground potential.
The alignment of an originally misaligned beam is effected asfollows. First the beam is shifted parallel to itself until the sun of thecurrents intercepted by the bottom aperture and the collecting cup is a maxi-mum. This ensures that the beam passes freely through the top aperture.Then the beam is tilted around the top aperture until the current collectedby the Faraday cup is a maximum. If, at this point, it is felt that the beam
alignment can still, be improved further, small trimming adjustments can bemade~ by repeating the above sequence of operations. With this rapidly con-verging procedure a perfect alignment of the electron beam can be achievedwith relative ease. As a final step the electron gun lens voltages are ad-justed such as to minimize the current intercepted by the bottom aperturefor an optimum focusing of the beam.
The cathode potential is supplied by an NJE high voltage,
regulated, DC power supply and may be varied between zero and minus 30 kilo
volts. The anode is kept at ground potential. The grid and lens voltagesare obtained from a voltage divider circuit, which allows ample adjustmentof the lens voltages (up to 15% of cathode potential). A rectifying and filter-
ing network, which floats at cathode potential, supplies the filament current(see Fig. 4.3). A separate regulated 400 volt DC power supply (Kepco ABC 425 M)furnishes the deflection plate voltages.
A mechanical gun tilting mechanism is also provided in casea coarse alignment of the electron beam becomes necessary (see Fig. 4.4).
This mechanism consists of two mutually perpendicular pairs of loops madefrom spring steel. These are attached to the glass pumping stem of the elec-tron gun and bear against the inner wall of the gun chamber. When one of the
loops is compressed or elongated by turning a threaded rod, the gun tiltsaround the anode clips, which rest in grooves machined in the anode block ofthe gun chamber.
To shield the electron beam from the earth's magnetic fieldand from any stray fields in the laboratory, the outer tube surrounding thegun chamber is made of mild steel. The fact that the tunnel itself is con-structed from mild steel plate also helps in this respect.
The bottom aperture in the electron gun assembly can be closedby a remote-controlled door in order to isolate the electron gun chambers be-tween tests, when the tunnel may be at atmospheric pressure. The electrongun elements are protected against back-streaming oil vapour (CVC Convalex-lO)from the diffusion pumps by water cooled baffles and liquid nitrogen traps.Protective automatic valves have been built into the electron gun pumpingsystem to guard it against the detrimental effects of electric power failures.The pumping connections and protective control circuits are shown in Fig. 4.5.
At the instant the electricity to the pumps is turned off,
purposely or accidentally, a magnetic isolation valve between the mechanicalpump and the diffusion pumps isolates the system from the rotary pump, and the
rotary pump is automatically vented. In additionthe gun chambers are iso-lated from the diffusion pumps by two self-closing 2" butterfly valves. To
10

0close the valves the valve handles are turned through 90 by fallingweights, which are released when the electric current ceases to flow throughthe solenoids that normally support the weights.
When the electric power is turned on again- the venting valvesclose and the mechanical pump starts up. A slip clutch is- provided to protectthe motor from starting overloads. A time delay relay keeps the magnetic iso-lation valve closed for 120 seconds, by which time the pressure in the pipebetween the mechanical pump and the isolation valve has dropped to 10-3 torror less. After these two minutes the isolation valve opens, and the merhani-cal pump resumes pumping on the backing line and the diffusion pumps. Thediffusion pumps remain off until the starting relays are activated again bya push button control. Similarly, the 2" butterfly valves have to be opened-by hand, and the solenoids holding the weights have to be switched on. Theabove devices have been designed to keep the activated electron gun cathodeunder a high vacuum at all times and to keep the inner gun chamber from be-coming contaminated with pump oil.
A hot cathode ionization gauge and a Pirani gauge are usedto monitor the pressures in the gun chamber and in the backing line, respec-tively.
4.3 The Optical Analyzer
The function of the optical analyzer is to measure the inten-sity of the helium and argon radiation issuing from a small gas volume in theelectron beam. In accordance with this requirement the instrument must havea high sensitivity to analyze a basically very weak light source, and it mustspectrally discriminate between the light emissions from the helium and theargon. Furthermore, only light which originates in a well defined region ofthe electron beam should be allowed to enter the analyzer.
Good sensitivity is obtained by using an optical system of lowf-number in conjunction with high gain photomultiplier tubes, selected for amaximum signal-to-noise ratio in the relevant spectral regions. Two achromaticf/2 lenses are used in an approximately symmetric configuration to form a realimage of the electron beam. In the image plane a slit, normal to the electronbeam, is used to spatially define the height of the section at the electronbeam, from which light is received for analysis. To spectrally separate thehelium radiation from the argon radiation, the light beam, emerging from the slit,issplit into two parts, each of which is transmitted through an optical filterand onto the cathode of a photomultiplier.
A narrow band interference filter Baird-Atomic, Inc., TypeB-11) is used to select the heliugm line at 2 5016A. The half width of thefilter's transmission band is l. The intensity of the transmitted light isthen measured with an EMI-9502S tube. The argon signal is obtained from anEMI-9558A tube used in conjunction with a red filter (Kodak, Wratten FilterNo. 88A), which transmits light only at wave lengths above 7200A. TheEMI-9558A tube is insensitive to light aboXe 8500A. Several intense ArI linesexist in the spectral region between 7200 and 8500, but practically nohelium lines are located there. The spectral response curves of the photo-multiplier-filter combinations are given in Fig. 4.6. These curves were ob-tained by multiplying the quantum efficiencies of the photocathodes with thetransmission factors for the filters, as given by the manufacturers.
11

The photomultipiier tubes and the optics are contained in alight tight housing (constructed from !" thick black "Arboron" panels)- whichis rigidly supported from the outer electron gun tube inside the- tunnel.This arrangement has the advantage that the optics remain aligned with theelectron beam as the-beam is moved from point to point in the flow field understudy. Furthermore, the f-number of the instrument can be kept at -a favour-ably low value by putting the analyzer inside the tunnel close to the beam.On the other hand, the typical gas densities (between 10-2 and 10-1 torr)inside the tunnel are such as to favour electrical breakdown between bareconductors, and suitable precautions have to be taken to prevent a glow dis-charge between the high voltage connections leading to the photomultipliers.
Originally the light was directed from the optical slit tothe photomultipliers via a lens, a splitter plate, and a prism. As will bediscussed in the following paragraph, this set-up proved unsatisfactory andwas later revised. The original design is shown in Fig. 4.7. In this versionthe electron beam image is of the- same size as the actual electron beam.The light emerging from the 2mm high slit, S, is bundled into a parallelbeam by the lens, C. A dichroic splitter plate (Bausch & Lomb, Inc., Type45-1-600), D, at an angle of 450 w~th respect to the light beam, transmitslight of wave lengths between 3500A and 6000A and reflects the red lightabove 650O toward the argon detector (red filter + EMI-9558A). A rightangled prism, P; is used-to-reflect-the--' green'Ylight beam toward thehelium detector (interference filter + FMI-9502 S).
Pr.eliminary tests have shown that this optical arrangement issensitive to small 2hanges in optical alignment. For example, a small lateralshift of the electron beam of mm, due to stray magnetic fields, causes thebeam of light to shift over one cathode radius (5mm) at the EMI-9502 S tube,with a resulting attenuation of the helium signal of about 50 per cent. Ow-ing to the large photocathode (44 mm in diameter) of the EMI-9558A tube theargon signal is affected less severely. It is evident that this arrangementis not very satisfactory, since the calibration curves for such a system aresubject to change according to the space and time variations of the stray mag-netic fields in the tunnel. Of the results discussed in this report the onlymeasurements made with this optical arrangement are the preliminary tests dis-cussed in Section 5.6.
To overcome the difficulties outlined in the foregoing paragraph,the optical components, S,C,D, and P, have been replaced by a fiber opticallight guide (American Optical Co.). This light guide consists of two separatebundles of 0.076 mm diameter coated glass fibers. For each bundle the en-trance section is rectangular (1.2 mm x 15 mm) and forms the horizontal slit.The exit sections are circular and rest directly on the optical filters (seeFig. 4.8). The dimensions of the light guide are such that the front faceof the fiber optics is located about 3 cm ahead of the original slit plane,requiring a shift of the electron beam image plane by that distance. Thismakes it necessary to use the achromatic lenses in a slightly non-symmetricalarrangement resulting in an image "magnification" factor of 0.69. Hence,the 15 mm width of the fiber bundles in the image plane corresponds to awidth of 22 mm at the actual electron beam.
An "ultra-stable" Keithley, Model M-242,power supply providesthe cathode and dynode voltages for the multiplier tubes. Purely resistivevoltage dividing chains (about 200 k-ohms between dynodes) are used for obtain-ing the dynode voltages. An additional voltage attenuating circuit,built fromwire-wound precision resistors, allows for the possibility of applying differ-
12

ent cathode potentials to the two tubes, using a common power supply (seeFig. 4.9 for the wiring diagram of the photomultiplier circuits)'. The anodecurrents are measured with the aid of-a Keithley, Model 414, pico-ammeter.The photomultiplier bases and the voltage dividers are immersed in diffusionpump oil to prevent a glow discharge between the tube pins or across the dynoderesistors. The latter are contained in a separate oil filled box. This pre-vents the heat dissipated by these resistors from raising the temperature ofthe photomultipliers which, in turn, would cause an increase in the darkcurrents of the tubes. The tubes are screened against external magneticfields by mu-metal shields.
4.4 Nozzles and Shock Holder
The underexpanded free jets investigated were produced by lett-ing the gas expand from the "high" pressure stagnation chamber int6 the M'low"pressure test section through a sharp edged orifice. The orifice diameterconsisted of a 5 mm, 15 mm, or 47.5 mm diameter hole machined in a brassend plate, which was fitted onto an existing converging nozzle of largerexit diameter. The 5 mm and 15 mm orifice plates were attached to a conver-ging nozzle of 47.5 mm exit diameter. The 47.5 mm orifice plate was fittedto a subsonic nozzle of 140 mm diameter. The wall thickness at the Prificewas equal to 0.03 times the orifice diameter in all cases.
The normal steady-flow shock waves studied were produced by meansof a shock holder placed in the supersonic jet flow. The shock holder is de-picted in Fig. 4.10. It consists of a cylindrical tube, 50 mm in diameter,with its axis parallel to the flow. The downstream end of this tube can bepartially closed by means of a conical plug, in order to choke the flow throughthe tube just enough to produce a normal shock at the entrance lip of the shockholder. Four narrow slits are cut into the front lip of the shock holder,so that electron beam measurements can be made throughout the entire shockwave. Each slit is 3 mm wide and 12.5 mm long. The slits at the top and thebottom allow for the electron beam to be moved into the shock holder, whereasthe slits in the side make it possible for the optical analyzer to "see" thebeam, when it is probing the downstream portion of the shock transition in-side the shock holder. Because the width of the slits is small with respectto the typical shock thickness encountered and with respect to the shockholder diameter, the influence of the slits on the shock geometry is believedto be negligible.
A photographic view of the spatial arrangement in the testsection of the shock holder, the nozzle (5 mm), the electron gun, and the opticalanalyzer is given in Fig. 4.11. The photograph shows the bottom end of theelectron gun (with the remote controlled door closed). The support arm,clamped around the gun tube, holds the optical analyzer (on the right) andthe bracket for the Faraday cup (vertical rod on the left). A separate viewof the optical analyzer (original version) is furnished in Fig. 4.12.
13
MA
I
V. PRELIJNIAY TESTS
5.1 Static Calibration Using.Pure Gases
The photomultiplier anode currents, Iph' were calibratedagainst helium and argon densities by admitting pure gases into the tunnel andby measuring the test section pressure with a McLeod gauge and the tempera-ture with a thermocouple, All calibration tests were performed with a 17.5 kvolt electron beam energy and a 100 g amp beam current. In these tests thegases were leaked into the tunnel at a steady rate (monitored by a flow rater)through the auxiliary test section at point A (see Fig. 4.1), while one or morediffusion pumps kept the tunnel pressure at a steady value. The calibrationcurves for argon and helium, obtained in this manner, are shown in Fig. 5.1.The slight non-linearity of these curves is caused by the presence of afluorescent halo around the electron beam, which at very low densities ex-tends beyond the field width observed by the optical analyzer. The scatterof the calibration points is due to the uneven pumping of the diffusionpumps, causing small fluctuations in the tunnel pressure and a correspondinguncertainty in the McLeod gauge readings.
The optical filters used were not completely effective inseparating the argon lines from the helium lines. There existed some degreeof "cross-talk" between the filters producing small error signals, which hadto be calibrated as well. This was easily done, for example, by recordingthe small argon signal obtained when calibrating for the helium radiation withpure helium in the tunnel. Likewise, the helium error signal, due to the pre-sence of argon, was obtained simultaneously with the argon -calibration. Theseerroneous signals were one to two orders of magnitude smaller than the "true"signals. The calibration curves for these error signals are given in Fig.5.2.
It is believed that the two ArII lines at ? 5009R and ? 5017Rwere responsible for the helium error signal in the presence of argon. On theother hand, the "argon signal" observed in the static helium calibration can-not be attributed entirely to helium lines between ? 7200A and ?a 8500R. Theonly helium line listed in this range in the"MIT Wavelength Tables" (Ref. 22)is the HeI line at X 7281R. Being very close to the cut-off wavelength of thered filter, the intensity of this line would have to be an order of magnitudeabove that given in Ref. 22 to fully account for the observed signal. Itappears, therefore, that the "argon error signal due to the presence of helium"was caused to a large extent by impurity gases present in the tunnel duringthe static calibrations. With only one diffusion pump evacuating the tunnel,background gas pressures as "high" as 10-3 torr were observed in the tunnel.This background gas was the result of small leaks and of desorption of gasesfrom the tunnel walls. In this connection it should be realized, however, thatany atmospheric argon leaking into the tunnel cannot account for the observedargon error signal either, since the amounts of argon, which could possiblyhave. been present in the test section, are at least two orders of magnitudebelow those indicated by the argon error signal. Although it is now believed,that most of the argon signal observed during the static helium calibrationswas caused by N2 , no specific attempt has been made to identify the excitationmechanisms, or even the spectral bands, involved.*
* The bang or bands, responsible for the observed light between ? 720O0 and
8500K, probably belong to the first positive system of N2.
14

This type of argon error signal could be expected to bepractically absent in the free jet flows, because the level of impurity gaseswas significantly lower under these conditions than it was in the statictests. In the free jet runs 9 diffusion pumps were used (as compared to 1 or2 in the static calibrations) to pump away the large volume flow of gas, there-by significantly reducing the impurity level in the test section. In addition,the test section gas could not penetrate into the supersonic jet. Free jetcalibrations of the error signals could easily be made by observing simultaneous-ly the helium and argon signals, obtained-while moving the electron beam along
the axes of pure helium and pure argon jets, In-a pure helium jet, for example,the local helium density was obtained from the helium signal and the staticcalibration curve for helium (Fig. 5ol).* The argon error signal, caused bythe radiative emission of the helium in the free jet at the indicated heliumdensity, has then been plotted in Fig. 5.2. It is evident from Fig. 5.2 thatthe argon error signal, observed in the pure helium jet, is very much smallerthan that obtained in helium containing small amounts of N2 . This remainingsmall argon error signal, which increases linearly with helium density, canbe associated with the HeI line at \72 8 1. (3s 1S. -2p iP 1 o). For the pur-pose of reducing the free jet and shock wave results, presented in SectionsVII and VIII of this report, the free jet calibration of the argon error sig-nal has been used. On the other hand, for the case of the helium error sig-nal, measurements obtained in a free argon jet are in perfect agreement withthe static calibrations (Fig. 5.2).
When the electron bea was near or inside the lip of the shockholder the observed beam intensity diminished, because the shock holder sur-faces intercepted some of the light which- would otherwise have entered thelens of the optical analyzer. Some light reflection from the shock holder sur-faces occurred as well, increasing the amount of light received by the lenssomewhat above that reaching the lens directly. The measurements very closeto the nozzle were similarly affected. It is also conceivable that thesegrounded metallic objects could have actively influenced the intensity of thefluorescent halo (e.g. by removing metastable and ionized atoms from the beamsurroundings, or by absorbing or emitting secondary electrons, or by absorbingor reflecting ultra-violet photons, which are involved in producing the heliumhalo). The changes in the helium and argon signals, which occurred when theelectron beam was moved into the shock holder, were calibrated for various hel-ium and argon densities under static conditions. Some such calibration curvesare given in Fig. 5.3. These show that the main effect was a signal attenuationdue to light interceptioa by the shock holder lip. The solid curve in Fig. 5.3gives the expected signal attenuation for an ideal point-source of light locat-ed on the axis of the shock holder (assuming non-reflecting surfaces). Because
Lt of the presence cf a halo around the electron beam the experimental attenuationfactors for the helium and argon signals are density dependent and lie abovethe theoretical point-source curve.** Furthermore, these calibrations had tobe repeated every time the shock holder was adjusted or moved, because theoptical alignment of the slit in the side of the shock holder critically in-fluenced the amount of light received by the optical fibers in the analyzer.The signal attenuation for electron beam positions very close to thenozzle was also calibrated.
* It is shown in Section 5.4, that the static calibration curves can be usedto infer gas densities in a high speed flow without introducing a significanterror.
** A calibration of this effect was also made using nitrog n as a test gas andan interference filter centered around the N2 band at ?3914A. In this case thesignal attenuation followed the theoretical point-source curve closely. Nohalo has been observed for this N+ band.
15
5.2 Electi-onBeam Excited Spectra in Helium and Argon
Before these calibration curves, obtained with pure gases understagnant conditions, could be applied with any confidence to measure partialdensities in gas mixtures flowing at supersonic speeds, the following ques-tions had to be dealt with:
(1) What are the life imes of the excited states involved? Are theseshort enough (<10- sec), so that the excited atoms are not sweptdownstream, and are not lost from the field of observation, beforethey radiate?
(2) How do density gradients affect the symmetry of the fluorescenthalo? Are accurate density measurements still possible when gradientsare present?
(3) Is the radiation from the helium influenced by the presence of theargon in a gas mixture (or vice versa), giving rise to erroneousmeasurements of the species concentrations?
In order to answer these questions, it was necessary to havean understanding of the excitation processes involved. In particular an ade-quate knowledge of the nature of the fluorescent halo was required in thisrespect. The fluorescent mechanisms are, therefore, discussed in some detailhere. In the following discussions the word "luminescence" is used to des-cribe the light-emission in the electron beam region resulting from the pri-mary excitation of the gas by the high energy electrons. The term"fluorescence" is reserved for the halo resulting from secondary excitation byphotons or secondary electrons.
For the helium line at ? 5015.7 it has been shown conclusivelyby the work of Lees and Skinner (Ref. 23) and Wolf and Maurer (Ref. 24) thatthe fluorescent halo is caused almost ent*rely by the resonance spreading of theultra-violet radiation of wave length 537A resulting from the transition3P lp1 - ls 1 S0 , (Fig. 5.4). For every thousand 3P P? states produced byprimary excitation in the electron beam, 24 atoms de-ex ite to the metastable2s 1S0 state with the emission of green light at ? 5016, whereas 976 atomsde-excit down to the ground state with the emission of ultra-violet lightat N 537. The mean life time of the 3p 1p state is only 1.74 x 10⁻⁹ sec(Ref. 25). When a neutral helium atom in tle vicinity of the beam absorbsa \ 537A photon this atomis raised to the 3P 1P state and may again emitgreen light at N 5016R with a 0.024 probability. Because the X 537R photonshave a relatively short mean free path, the radial outward flux of the ultra-violet light is rapidly attenuated. Consequently the visual intensity of thehelium fluorescence falls off faster than with the inverse distance from thebeam, as would be appropriate for the cylindrical geometry alone. Beforeall the excitation energy of the original 3P 1l states is completely convertedto ? 5016R radiation and metastable 2s 1S0 states, the average ultra-violetphoton is absorbed and re-emitted 40 times, as is evident from the ratio of thetransition probabilities involved. Because the re-emission events are com-pletely random with respect to direction, however, the photon does not diffusemore than a few optical mean free paths away from the electron beam in theprocess. The fact, that the helium calibration curve (Fig. 5.1) becomeslinear at 5 x 10¹⁴ atoms per cm3 , is an indication that at higher densities
16
essentially all the ? 5016R photons produced reach the photomultiplier. Thismeans that the ultra-violet resonance spreading is confihe4 to a radial dis-tance of about 1 cm at an atomic number density of 5 x lO} atoms per cm3 .Consequently, the atomic absprption cross-section for this ultra-violet radia-tion is of the order of l0
-1 cm2 .*
With respect to isolating the mechanisms involved in the
helium fluorescence the work of Wolf and Maurer (Ref. 24) is of particularinterest. For this reason a short outline of their experiments and conclu-sions is presented. The vacuum system used by Wolf and Maurer was divided in-to two chambers connected by a small aperture. The lower chamber was tra-versed by a high intensity, low energy electron beam (0.5 to 2.0 amp and 35to 80 ev) parallel to the dividing wall. The analysis concentrated on theray of fluorescence penetrating through the aperture into the upper chamber.The helium pressures ranged between 0.01 and 0.25 torr. The most conclusiveparts of this study are itemized hereunder.
(1) A spectrographic survey revealed that most of the observed fluores-cence consistedof HeI lin s due to transitions from the np 1 P0 states to the
2s 1S0 state (e.g. ? 361, X 3965R, and ?, 5016R). Other weaker lines, how-
ever, were observed as well in the fluorescence, e.g.
A 4388R (5d 1D - 2p1P)
? 3889 (P 3pO ,1 2 2s 3Sl)
? 3820R
4o26 (nd 3D - 2p 3pO)
? 5876 JThe lines in this second group became more intense relative to the lines in
the first group with increasing helium pressure.
(2) In all tests a strong magnetic field of 1000 gauss parallel to the
electron beam forced the scattered beam electrons and the secondary electronsto move in tight spirals, and thereby prevented these from moving away fromthe beam and into the upper observation chamber. Furthermore, an electricfield of 330 volt/cm, applied normal to the ray of fluorescence, was found
to have no influence on the spatial and spectral intensity distribution ofthe fluorescence. It could, thus, be concluded that secondary electronsand ions playedat most a very minor role in producing the helium fluorescencein this configuration.
(3) A quartz plate, which absorbed the far ultra-violet but not thevisible light, was placed across the observation chamber. In this case no
fluorescence appeared above the quartz plate. This strongly suggested thatall the observed helium fluorescence owed its existence to the ultra-violetresonance lines between 500 and 600R.
(4) The intensities of all lines found in the helium fluorescence in-creased linearly with electron beam current, indicating that a fluorescenceof metastable helium atoms, diffusing away from the electron beam, cou not
Lees and Skinner estimate an experimental value of 2 x 10 "1 5 cm2 and
derive a theoretical cross-section of 10-13 cm2 .
17
have been involved.
The observations, described above, conclusively showed thatthe strong lines (np1 -- 2s 1So) observed in the helium fluorescence re-suited from the resonance spreading of the ultra-violet transitions(np l1 - is 'So), as described previously for the line at ? 5016X. The
presence in the fluorescence of the other "unexpected" lines (correspondingto transitions from excited levels such as 1D, 3po, 3D, etc.) could only beexplained by assuming that the responsible terms are produced in the "halo"
by collisions of the second kind of excited atoms in the lP0-states with neu-
tral helium atoms in the ground state, e.g..
He (3pP" P) + He (is Iso) -+He (is iSo) + He (3d 3D).
An actual spectrogram of the helium spectrum, excited by anelectron beam, is presented in Fig. 5.5. Here the electron beam energy andcurrent are 17.5 kv and 200 L amp; the beam width is 1 mm. The heliumpressure is about 0.1 torr, and the gas is at rest. The slit of the t/14spectrograph (Hilger, Model E498) is normal to the electron beam image.The distance between the two vertical lines drawn across the spectrogramcorresponds to the width of the electron beam. Ip the spectrograms* ofFig. 5.5 all HeI lines between X 3800K and X5900A show some fluoresc ntspreading. This spreading is very pronounced for the lines at A 3965 andN 5016. A relatively weak fluorescent halo is observed for the lines at
A 3820R (6d 3D - 2p 3po)
X 3889R (3p3 -2s 3s)
A 4026R (Sd 3D - 2p 3po)
A 44144 (6d 1D - 2p 1pO)
4388R (5d 1D - 2p iPO)
X 4472R (4d 3D - 2p 3po)
X 4922R (4d 1D - 2p 1pO)
X 5876R (3d 3D - 2p 3po)
It is, therefore, evident that for a 17.5 kv electron beam thecharacteristics of the helium fluorescence are very similar, if not identical,to those observed by Wolf and Maurer for an 80 ev beam. The nitrogen bandsin Fig. 5.5 are caused by the background impurity level of about 10-3 torrin the tunnel.
The electron beam excited spectrum of argon differs markedlyfrom that of helium. Whereas for the case of helium there-exist practicallyno HeII lines in the electron beam induced luminescence, a substantialportion of the radiation from the electron beam excited argon results fromtransitions between excited levels of the argon ion. Since in the presentexperiments only Ar lines were utilized, the following discussion willconcentrate on the spectrum of the neutral argon atom.
* The exposure time was about 1 hour.
18

A simplified energy level diagram for neutral argon is pre-sented in Fig. 5.6. Only those levels are shown which account for most ofthe observed radiation in the blue and red parts of the spectrum. The wavelenrgths of spectral lines resulting from transitions from the 3p5 "4p and3p5 5p configurations to the levels of the 3P' 4s configuration are tabulatedin Fig. 5.7. It should be noted that for neutral argon the spectral termscannot easily be designated by the usual symbols established for atoms, whichexclusively exhibit LS-coupling (Russell-Saunders) between the orbit and spinangular momenta of the excited electrons, because in many instances theelectrons of the argon atom exhibit various degrees of jj-coupling. For thisreason the energy levels for a given electronic configuration are often simplynumbered consecutively in the order of increasing excitation energy. Theinformation presented in Figs. 5.6 and 5.7 has been derived from Refs. 22,26 and 27.
A spectrogram showing the electron beam excited argon lines inthe blue and violet regions of the spectrum is given in Fig. 5.8*. Thisspectrogram was obtained in a high speed argon jet with a 1 mm wide electronbeam perpendicular to the spectrograph slit and the flow. It shows a numberof ArI and ArII lines, many of them exhibiting a halo-like fluorescence (e.g.the ArI line at ?4200.7), which extends farther on the downstream side thanon the upstream side. Almost all the ArI lines in Fig. 5.8 are the result oftransitions from the levels of the electronic 3p5 5P configuration to thoseof the 3p5 4s configuration. These lines are subject to the same excitationmodes and transition rules, and should, therefore, exhibit the same charact-eristics, as the red lines belonging to the 3p5 4p -*3p5 4s system of trans-itions. The characteristics of any red ArI line (contributing to the argonsignal of the optical analyzer), can, thus, be inferred from the characteris-tics of a corresponding blue line in Fig. 5.8. Pairs of corresponding linescan easily be determined from the table in Fig. 5.7. Figure 5.8 is presentedhere primarily because of this close correspondence, and because of the fact,that a good spectrogram of the red argon lines, resulting from electron beamexcitation, was not obtained, owing to a lack of sensitivity of easily availablespectroscopic films in this region. Nevertheless, the red argon lines aresignificantly more intense, on an absolute scale, than the blue lines, as caneasily be seen from Fig. 5.9A, which gives a spectrum obtained in an arc heat-ed argon plasma jet. Figure 5.9B shows some of these same lines obtained fromthe argon luminescence produced by an electron beam. The strongest linesexcited by the electron beam in this spectral region appear to be those at
75o4 ,
7515R
} 8104R
? 8115R (strongest line),
84082,and ? 8425.
* The author is indebted to D.J. Marsden, formerly at UTIAS and presently
at the University of Alberta, for this spectrogram.
19

All these lines are the result of transitions from the elec-tronic 3p5 kp-configuration to the 3p 5 4s configuration. The Einstein transition
probabilities for these intense red argon lines are all a~out 5 x lO7 sec-1
(RePr. 28). In the case of argon the even terms of the 3p; 4p configurationCannot be excited from the even ground state by resonance absorption ofelectric dipole radiation. Outside of the region traversed by the primaryelectrons the excited 3p5 4p states involved can, therefore, only be pro-duced by secondary electron excitation and/or by resonance absorption of redlight by excited atoms in the 3p5 4s configuration. The electronic 3p5 4sconfiguration gives rise to four terms, two of them metastable (see Fig. 5.6).It is believed that light absorption and re-emission by metastable argonatoms accounts for a substantial fraction of the observed intensity in theargon halo (some evidence for this is presented in the following sections).Atoms in the metastable 4s 10 (3p0) and 4s 30 (3P8)states, which originatein the electron beam, diffuse into the surrounding gaF where they can a sorband re-emit red ight of wave lengths 7635.11, 7723.76, 8o!4.79,8115.31X and77?4.21, 7948.18X, respectively. Since this type of fluorescence depends onthe diffusion field of the metastables, the red argon halo should, thus, show-a definite non-symmetry in a high speed flow.
It is also conceivable that excited argon atoms in the shortlived states, 4s 20 (3P1) and 4s 4°(lP9), contribute to the fluorescence,1since these states can e produced outside of the beam from neutral argonatoms in the ground tate by the absorption of the ultra-violet resonance 1 nesof wave lengths 1066 and 1048X. During the short life times of 1.05 x 10sec and 3.0 x 10⁻⁹ sec (Ref. 29) of the 4s 20 and 4s 40 states the argonatoms can absorb and later re-emit the red argon lin~ts of wave lengths7272.94, 7383.98 7514.65, 8006.16, 8103.69, 8424.65. and 7503.87, 8264.52,8408.21, 8521.44U, respectively. The part of the fluorescent halo, which isdue to this cause, should have cylindrical symmetry in a uniform argon flow.The fluorescent mechanisms discussed above will, of course, also apply tothe corresponding blue argon lines (see Fig. 5.7).
Having discussed the possible fluorescent mechanisms forhelium and argon, it is now feasible to predict how the intensity per unitvolume of the fluorescence should vary with electron beam current and withgas density. For this purpose let Ib be the electron beam current, nb thenumber density of atoms of the relevant gas in the electron beam, and nfthe number density of atoms at the point outside of the beam at which thefluorescent intensity is to be considered. In cases where strong.,densitygradients exist the values of nb and nf may well be different, and it isimportant under these conditions (with regard to the spatial resolution ofthe electron beam probe) to know. , whether the fluorescence observed isproportional to nb or nf. On account of previous arguments the gaseousluminescence and fluorescence per unit volume should exhibit the followingdependence on beam current and gas density.
(1) The intensity of the primary beam luminescence per unit length ofbeam is proportional to nbIb for both gases.
(2) At very low helium densities, when the ultra-violet radiation fluxis not attenuated appreciably by absorption, the intensity of the greenhelium fluorescence per unit volume, at a given position in the halo, isapproximately proportional to nbnfIb.
20

(3) For the argon. line at 2 8115R (for example) the local fluorescenceper unit volume, due to absorption andre-emission by metastable argon atoms,is approximately proportional to nb2 2 -sin e the radial diffusion flux ofmetastables and the radiation flux of X 8115 photons, originating in theelectron beam, are both separately proportional to nbIb. Similarly, the localfluorescence due to ultra-violet excited argon atoms (e.g. X 7504X) can beshown to be proportional to nb2nfIb2 .
(4) If it is assumed that the secondary electrons, resulting from primaryionization events in the beam, have energies in excess of 13 ev for argon andin excess of 20 ev for helium, then the fluorescence per unit volume due toexcitation by secondary electrons (at a given point within the range of thesecondaries) is proportional to nbnfIb.
(5) If the secondary electrons have, on the average, energies below thosecited above, they can only excite the metastable atoms, and the resulting localfluorescence per unit volume is approximately proportional to nb2Ib2. For thecase of argon this fluorescence would have features, which are very similar tothose discussed for the first mechanism in statement no. 3.
(6) The total intensity per unit length of the beam luminescence plus thefluorescence, integrated from the beam center to infinity, is again proportion-al to nbIb, since it is a direct function of the beam energy transferred to thegas by primary electron-atom collisions.
To obtain a photomultiplier signal which, for a given beamcurrent, increases linearly with gas density, it is necessary to either lookat the beam luminescence alone or, otherwise, include all of the fluorescenthalo. The first alternative is impossible to achieve in practice, sincethere is always some fluorescence along the line of sight. Also, the signalwould be a function of the electron current density in the beam, rather than ofthe total electron beam current. The second alternative can be approachedclosely by using a long slit at right angles to the electron beam, as wasdone in the present case. In this configuration the spatial resolution inthe direction normal to the beam is sti.ll equal to the width of the primaryelectron beam, because the total light output is proportional to nb and not nf.As a third alternative a spectral line could be chosen which is known not to occurin the halo, but which is present in the primary luminescence. Since none ofthe intense helium and argon lines exhibits this property, this would meanworking with extremely low light levels.
The dependence of the local fluorescence on n2 (for some me-chanisms even on n3) causes the calibration curves in Fig. 5.1 to curve upwardat the low density end. At higher density levels the fluorescence does notreach significantly beyond the field width of 22 mm observed with the opticalanalyzer, and the calibration curves approach a linear density dependence inaccordance with statement no. 6, above. It is interesting to note that accord-ing to statement no. 3, above, the local argon fluorescence should vary asthe square of the electron beam current. A somewhat non-linear behaviour ofthe argon signal with changing beam current was indeed observed. Consequently,it became necessary to work consistently with the same beam current for bothcalibration and experiment. In contrast with this behaviour, the helium sig-nal varied linearly with beam current for all helium densities, indicating,in agreement with Wolf and Maurer (Ref. 24), that resonance absorption and re-emission by atoms in excited states do not play an important role for helium.
21

5.3 Optical Profiles, of the Electron Beam in a High Speed Gas Flow
In order to study the characteristics of the halo, a series oftests were performed, in which a narrow slit (0.3 mm wide), parallel to thebeam, was traversed at a uniform rate across the electron beam image, whilethe photomultiplier output currents were simultaneously displayed on anoscilloscope screen. In this fashion the profiles of the electron beam indu-ced light, as seen through the optical filters, were obtained in the super-sonic flow of helium and argon jets. Some of these profiles are reproducedin Fig. 5.10 showing the effect of pressure gradients and flow velocitiesnormal to the beam on the -symmetry of the optical radiation field. Figures5.10a to 5.10e give the intensity profiles of the argon and helium radiationat various points along the axes of underexpanded helium and argon jets. Thestagnation chamber pressure and temperature are 25 torr and 3000K. The ori-fice diameter is 5 mm. The flow is from right to left. The length scales havebeen determined from the ratio of the oscilloscope sweep speed to thescanning speed. It should be noted that under normal operation the field ofview-of the optical analyzer corresponds to 2.5 times that covered by theoscilloscope screen in Figs. 5.lOb to 5.1Oe. The high intensit peaks,corresponding to about a 1 mm width, must be ascribed to the primary lumine-scence in the electron beam. The lack of asymmetry of these peaks indicatesa mean life time of less than 10-7 sec for the upper excited states involved,as expected. In Fig. 5.10a the beam luminescence shows a considerable spread-ing due to small angle sgattering of primary electrons by argon atoms. Ata concentration of 2 x 101 argon atoms/cm3 (or 600 p Hg at room temperature)this effect can be expected to dominate over the fluorescent light spreading,which cannot be discerned here. At an equivalent room temperature pressureof 145 p Hg (Fig. 5.10b), however, the argon halo is clearly evident. Thehigher intensity of the halo on the downstream side is caused by the non-sym-metrical diffusion field of argon metastables, which are apparently responsiblefor most of the fluorescence. As expected from the predominantly n2 depend-ence of the argon fluorescence the relative local intensity in the argon haloat an equivalent room temperature pressure of 34 p Hg (Fig. 5.10c) is onlyabout 1/5 of that at 145 p Hg. Figures 5.10d and 5.10e indicate that thesymmetry of the green helium fluorescence is relatively unaffected by the gasvelocities and density gradients in the free jet. It is also evident that theultra-violet penetration into the surrounding gas decreases (i.e. the halocontracts) with increasing helium density.
Figure 5.1Of shows the intensity profile observed through thehelium filter in an argon jet. The light is believed to be due to the ArIIlines at ? 5009.35 (4p 41/2 - 4s p/2) and t 501 .16 (4p' 2Fo 3d2which are close enough to ;he helium l ne at ?\ 5016 to pass thr6 h thehelium interference filter. The "helium error signal" due to the presence ofargon varies linearly with argon density (see Fig. 5.2). There exists, there-fore, no halo due to secondary processes for the above two ArII lines. Thedelayed light emission evident in Fig. 5.10f must be associated with a rela-tively long life time of one of the two upper states involved. The mean lifetime in question is about l0-5 sec. Since the 4p 'P^ state is known to havea mean life time of less than 6 x 10⁻⁸ sec (Ref. 28) /the long life timeprobably belongs to the 4p, 2F /2 state.
22

5.4 Axial Density Measurements in Pure Gas Jets
The calibrated electron beam probe was used to determine thedensitk along the axes of underexpanded free jets of pure helium and pureargon. Within the range of the static calibration curves the measured densi-ties followed the theoretical density curve quite well (Fig. 5.11). This meantthat the possible error, caused by the halo distortion due to a flowing gaswith density gradients, could be neglected. These free jet runs were thenused to extend the calibration curves to higher densities (Fig. 5.12). Asis evident from Fig. 5.11, the density rise due to the Mach disc sets inrelatively early, even though the Mach disc location is approximately that givenby the accepted empirical law (Eq. 1). This suggests that the barrel shockand Mach disc are quite diffuse for the Reynolds number range covered. Aflow visualization study of the free jets (Fig. 5.13) substantiates this. Thephotographs were obtained by uniformly traversing the electron beam in a planedefined by the flow axis and the beam itself during the exposure of the film.The technique has been described by the author in Ref. 30.
5.5 Shock Profiles in Pure Gases
Since normal shock waves in pure gases hay in the past beenextensively studied, both theoretically and experimentally (see e.g. the sur-vey paper by Talbot, Ref. 31), it can be assumed that the one-dimensional shockstructure in a pure gas is reasonably well described: (at least experimentally).In connection with early experimental shock structure studies, the Ph.D. workof F.S. Sherman (Ref. 32) deserves some mentioning at this point. In his re-port (and thesis) he describes the development and operation of various shockholders. The ideas, which he.put forth on this subject, were used in the de-sign of the shock holder described in Section 4.4. Sherman determined tempera-ture profilesthrough steady fl6w shock waves (produced by shock holders placedin a supersonic wind tunnel flow) with a free-molecule equilibrium temperatureprobe. Most experimental shock structure work since then has been performedin shock tubes and shock tunnels.
For the present work the normal shock wave in a pure gas appear-ed to be a cohvenient flow configuration for testing the accuracy of the elec-tron beam probe under the extreme conditions of strong streamwise gradients.There existed some doubt, whether the spatial resolution of the electron beamprobe was sufficient to give a true density profile through the shock. Inthis context it should be kept in mind that the spatial resolution in the flowdirection was determined by the electron beam width, which was between mnmand 1 mm. Furthermore, it could be expected that the distortion of thefluorescent halo (see Section 5.3), caused by the severe density gradient inthe shock resulted in a possible error in the measured density.
To obtain an idea of the limits imposed by the spatial resolu-tion (or the lack of it) of the electron beam probe, density measurements weremade through plane shock waves produced by means of the shock holder, whichwas placed into free jets of pure argon and pure helium. Figure 5.14 is a flowvisualization photograph of the flow configuration obtained by mapping out thedensity field with the electron beam. It depicts a Mach 4.5 shockin argon.The density profile through this shock (along the axis of symmetry), as mea-sured with the optical analyzer, is given in Fig. 5.15.
23
The flow in the free jet is not uniform; it has streamwisegradients, and the streamlines diverge. It is, therefore, difficult to esta-blish a close correspondence of the measured shock profile with that of a one-dimensional shock transition. On the other hand, an approximate comparisoncan be made by referring the measured density profile to a free stream- base.,-hich follows closely the axl density profile of the undisturbed free jet,(the iseritropic expansion curve for the free jet has been used here). On thedownstream side of the shock this reference curve is allowed to asymptoticallyapproach a constant downstream value, which is determined in such a way as togive the correct theoretical density ratio across a normal shock Of a givenMach number (see Fig. 5.15). An approximate shock Mach number has been in-ferred from the position of the shock in the free jet expansion, which hasbeen assumed to be close to isentropic.
Previous experimental shock thickness measurements made inargon (see e.g. Ref. 33 and 34) indicate that the one-dimensional maximum slopethickness, based on the density profile, ranges between 4 and 5 upstream meanfree path lengths for shock Mach numbers between 3 and 10. For the argon shockin Figs. 5.14 and 5.15 the equivalent upstream mean free path, based on theasymptotic value of the reference density curveis about 1 mm. On this basis,the experimental maximum slope thickness (6s) of 6 mm , as measured with theelectron beam, appears to be about 30% too large. Although this discrepancyis still within the scatter of the experimental shock thicknesses reported inthe literature, it is perhaps an indication that the spatial resolution ofthe electron beam densitometer prohibited the exact analysis of shocks, whichwere thinner than about 1 cm. On the other hand, -this discrepancy could justas well be explained by the fact that, strictly speaking, the shock was notone-dimensional, because of shock curvature with respect to the streamlines,non-uniform upstream flow conditions, and the finite diameter of the shockholder. From this point of view there is thus no conclusive evidence thatthe limits, imposed by the spatial resolution of the electron beam probe, re-sult in any artificial broadening of the shock transition. Since all othershock waves discussed in this report are wider than 6 mm, this matter hasbeen given no further consideration.
The measured density profile through a Mach 8.5 shock in heliumis given in Fig. 5.16. In this case the "equivalent" maximum slope thicknessof the shock of 19 mm (as compared to an upstream mean free path of 4.7 mm)is in good agreement with other results reported in the recent literature(6 s/ 1 t;4).
5.6 Static Calibration of Gas Mixtures with the Aid of a Mass-Spectrometer
The fact that secondary processes are responsible for spread-ing the light emission in a pure gas, strongly suggests the possibility thatthe helium signal observed in a gas mixture might be influenced by the pre-sence of argon and vice versa. This could come about by the transfer of pri-mary excitation energy from one atomic species to the other by radiative reson-ance coupling, by interatomic collisions, or by secondary electrons. Radiativeresonance coupling can be eliminated immediately on the grounds that the energylevels of the excited states of helium are widely separated from those ofargon. It turns out, that all excited ArI states are more than 4 ev below thefirst excited state of helium. Furthermore, all excited ArII states are atleast 4.5 ev above the ionization limit of HeI and more than 20 ev below thefirst excited state of HeII. This state of affairs makes an inter-speciesenergy transfer ,y atomic collisions also very unlikely, except, perhaps, by
24
some rare "'collisions of the third kind", in which the colliding atoms areboth in excited states. This leaves the possibility df cross-excitation bysecondary electrons.
A series of experiments, using gas mixtures of known comipositiorand at known densities, were performed to test for any cross-excitation. Thehelium-argon mixtures were again introduced into the tunnal at point A (rig. 4.1).Separate helium and argon- supplies were used. The flow rate of each gas couldbe accurately controlled -and was measured by a separate flow rater. Sirce atlow tunnel pressures (below 50 p Hg) the diffusion pumps pump away the heliumfaster than the argon, it follows that the helium to argon ratio in the tunine!was not identical with the ratio of the flow rates into the tunnel. It was,therefore, necessary to obtain an independent measurement of the gas composi-tion in the tunnel. This was done by sampling the stagnant gas mixture froma point near the electron beam with a free molecule extraction tube (0.15 rimdia. x 5 cm-lg. hypodermic stainless steel tubing). The sampling tube wasconnected to a "VEECO-MS-9 AB" mass spectrometer type leak detector. Theexperimental arrangement is shown schematically in Fig. 5.17. In all testsperformed with this system the pressure behind the sampling tube., as measuredby a hot cathode ionization gauge, was relatively independent of the tunnelpressure -and ranged between 5 x 10⁻⁵ torr and 10 - 4 torr at all times. Thehelium ion current obtained from the mass spectrometer was calibrated againsthelium pressure in the test section by admitting pure helium into the tunrneland by measuring the helium pressure accurately with a McLeod gauge. Thiscalibration curve is reproduced in Fig. 5.18.
The calibrated system was then used to determine the partialpressure of helium ia the gas mixtures studied. The calibration curve for thehelium ion current could be used directly to this effect, provided the flowthrough the sampling tube was free molecular, in which case the flow of exgoratoms through the tube did not influence the flow of helium atoms through thetube. For the case of helium the Knudsen number based on the mean free pathin the tunnel and the sampling tube diameter was larger than 5 for tunnelpressures below 200 g Hg; for the case of argon this was so for pressuresbelow 110 i Hg/ The molecular mean free path in the 1" copper tube* connect-ing the sampling tube to the leak detector was larger than 60 cm at all times.
The mixture composition in the tunnel was varied from ! heliiunto 90% helium, and the total pressure in the test section, which was measuredwith the McLeod gauge, ranged from 5 p Hg to 150 p Hg. The helium and argonsignals from the electron beam densitometer were calibrated for these helivua-argon mixtures as follows: Through a control valve and a flow rater purehelium was admitted into the tunnel while one or two oil booster pumps keptthe tunnel pressure at an equilibrium value. The test section pressure(McLeod), the helium ion current from the mass spectrometer, and the heliumand argon signals from the optical analyzer were recorded. Then a specifiedamount of argon was added to the inflow through a second control valve. Thehelium flow rate was adjusted until the helium ion current from the massspectrometer was again at the previously recorded value (i.e. the partial
* This tube had been thoroughly cleaned with hot detergent, with acetone,and with chlorothene, and had been baked out with a heat gun at about 300 0Cto reduce outgassing.
25
pressure of helium in the tunnel was the same). The new test section pressureand the electron beam densitometer readings were recorded. Then the inflow ofargon was increased again following the same procedure. In this manner thepartial pressure of argon was increased step by step, while keeping thepartial pressure of helium constant, until the total pressure exceeded,, lOOpHg.At the end of each run the pure helium calibrations were checked again at theparticular helium pressure.
The procedure described above offered the most direct way oftesting for any influence of the argon on the helium radiation measured bythe optical analyzer. Several runs were made starting with different heliumpressures. After subtracting the photomultiplier dark currents and the errorsignals it was found that within the experimental error the helium radiationat 5016X remained constant for each run, independent of the amount of argonpresent.
In order to test whether the presence of helium had any in-fluence on the argon fluorescence, the same data could be used. For each testthe partial pressure of argon in the test section was obtained by subtractingthe partial pressure of helium (leak detector) from the total pressure (McLeod).By comparing the argon signals obtained in the helium-argon mixtures with thecorresponding pure argon calibration values, no influence of the helium on theargon signal could be detected.
The experimental results of these tests are summarized in Figs.5.19 and 5.20. The magnitude of the probable error is indicated by the ver-tical "error bar" drawn through each experimental point. These errors arebased on an estimate of the following effects, which are believed to be re-sponsible for most of the scatter of points in Figs. 5.19 and 5.2C:
(1) Small fluctuations of the tunnel pressure occurred during each testbecause of the somewhat uneven pumping of the oil vapour booster pumps onthe tunnel. Owing to their different time constants the instruments used in-dicated different average densities or pressures. The time constants involved.were:
electron beam densitometer T < 1 secMcLeod gauge T m 1 minmass spectrometer 3 min <T < 6 min
(2) The ion current amplifier in the leak detector showed signs of driftand of instability with respect to power line fluctuations.
It is interesting to note that, in order to keep the heliumpressure constant during a run, the helium inflow into the tunnel had to bereduced as more argon was added. This can be attributed to the fact that above30 P Hg the volumetric pumping speed of the booster pumps decreased with in-creasing pressure. At lower pressures this must be attributed to a decreasein the preferential pumping of helium with increasing pressure. The lattereffect has been investigated by leaking a constant composition gas mixture(57.5% He - 42.5% Ar) from a high pressure cylinder into the tunnel and bymeasuring the equilibrium composition in the tunnel with the mass-spectrometerfor various tunnel pressures. The results are plotted in Fig. 5.21, whichseems to indicate that the effect has virtually disappeared at pressures above
50 11 Hg6
26

Since the tests discussed in this section indicate no noticeablecoupling between the helium radiation and the argon radiation. I Mu-.1 be con-cluded that the secondary electrcns., which originate in the elecotron ",beafrom ionizing collisions with one atomic species, have on the average, notenough kinetic energy to excite atoms of the other species. -n tlhis conneticnit is of interest to note that for 17.5 1v electrons the ior-izatien cross,-section of the argon atom is about ten times that of the helium. atom (see Ref.35). In mixtires containing more than 0%o argcn, therefore.., the tnajority -f thesecondary electrons produced resc2t from argon ionization events. , Hence, '.hedata presented in Figs. 5.19 and 5.20 provide styong evidence for the con:lu-sion that secondary electrons originating from argon atoms have ener.4ie; ofless than 20 ev.' On the other hand, they provide relatively weak evidencefor the secondary electrons originating from helium atoms to have e.erg:.esof less than 12 ev,**
VI. DISCUSSION l SYSTEMATIC ERROPS
On the basis of the prelirninary calibration and validity teststhe following remarks can be made about some of the possible scarzes of errorin the final results.
(1) .If no spurious background, like N'2 is present, the helium and argon"error signals" due to zross-talk betwe n the op+.icai filters prcsei t nl cblem, since these can be accurately calibrated arid subtracted from the f'nalreadings. Owing to their relative smallness (see Fig. 5.2), these erzor sig..nals become significant only for the rare component in mixtures ccntain-.ngvery small amounts of either holiam or argon.
(2) In a high speed flow the downstream drift of metastatle argon atoms,resulting in a partial "loss" of the argon halo, causes the argon signal tobe lower than the calibrated value for a given density, The free jet tests
in pure gases show this effect to be small, and it has therefore, been .ignored.
(3) Simple density gradients across or along the electron bean,, "distort"
the halo. The observed signal is, however, not appreciably af'fe ,,ed, sin.,ethe effects of the low density region on the one side approximately :ompen-sate for the effects of the high density region on the other side. Zecond spa-tial density derivatives across or along the electron beamn may, Gn the otherhand, influence the observed. signals significantly. 0econd den.;:ty derivati.esacross the beam are not serious, provided almost all of the light in tne ha].ois collected for the analysis. Those occurring along the beam*. howzver, in-variably introduce an errcr in the measured density. In the present 'ae th,most severely affected measurements are those made on the axis of tha "e' jetsclose to the 5 mm orifice, Here a high density region is (J.osely su.rroundedby a region of low density, resulting in a diminished halo intens.ity. F'orthe argon density measurements small (:orretions have been applined -n these
* Energy above the ground state of the first excited state of the he!..
atom is 19.86 ev.
*. Energy above the ground state of the first excited state of the argon
atom is 11.5 ev,
27

severe cases, based on an estimate of the effect. For the helium this effecthas been ignored.
(4) The mass-spectrometer tests have shown that any coupling between thehelium and argon fluorescence, through secondary electron excitation (or anyother mechanism), does not introduce any significant error into the partialdensity measurements of the component gases in helium-argon mixtures.
(5) The reflection and interception of light by the nozzle face and theshock holder surfaces has been found to affect the density readings nearthese objects (see Section 5.1). This effect has been calibrated for therelevant spectral lines in the density range encountered. Correspondingcorrection factors have been applied.
(6) The dark currents of the photomultiplier tubes were measured beforeand after every run and have been subtracted from every reading. The magni-tudes of the average dark currents were
5 x 10⁻¹⁰ amp for the EMI-9502 S tube, and2 x 10-9 amp for the EMI-9558A tube .
In most instances these currents were completely negligible when compared tothe normal signal strengths (see Fig. 5.1).
At this point a word is in order about the possibility of con-densation occurring in the free jets, since this might complicate the freejet structure and influence the diffusion processes taking place in the freejet and the shock waves produced therein. In the. free jet expansions (stag-nation temperature was about 3000K) the local temperatures and pressures de-creased such that under equilibrium conditions the argon should have conden-sed (into the solid state) between Mach numbers of 4 and 5 in the jet. Owingto the low densities and the high rates of expansion occurring in these freejets, however, condensation does not easily take place, and a high degree ofsupersaturation cEzn be obtained. For nucleation to occur in the free jet"Ar2-molecules" have to be formed first by triple collisions (a third particleis needed to carry away the heat of sublimation). Anderson, Andres, Fenn,and Maise (Ref. 36) have made a calculation, based on kinetic theory, of themole fraction of Ar2 to be found in free argon jets expanding from room tem-perature to the collisionless state. The predicted values are in agreementwith experimental values obtained by Milne (Refs. 37 and 38), who observed"cluster populations" in free jets using a mass spectrometer. On the basisof these studies it is estimated that the mole fraction of Ar2 in any of thejets, used in the present work, is below 5 x 10 5 . Accordingly, it is believedthat condensation effects can be ignored.
28
VII. FREE JET RESULTS (Helium-Argon Mixtures)
Having gained sufficient confidence in the technique by theforegoing tests the optical electron beam probe was used to study the densitydistribution in the free jet expansion of helium-argon mixtures. The molefraction of argon in the stagnation chamber ranged from 0.05 to 0.5. The gasmixtures were bought in pressurized cylinders from the Union Carbide Corpora-tion. Although the gas composition in these cylinders was known approximately,
a separate quantitative analysis (see Appendix A) of these gas mixtures hadto be performed, since the reduction of the free jet data required an accurateknowledge of the fo-values. The cylinders used were found to contain thefollowing mole fractions of argon.
cylinder 1 fo = 0.12 1cylinder 2 fo = 0.21cylinder 3 fo = o.425 ± 0.005cylinder 4 fo = 0.11cylinder 5 fo = 0.49
Other mixtures were metered into the tunnel from separate gas supplies. Thestagnation temperature was approximately 300°K for all runs. The jet Reynoldsnumbers varied between 100 and 10,000. The range covered by each nozzle wasas follows:
D = 47.5 mm - lO0 < Reo < 500,) = 15 mm - 200 < Reo < 2000,D = 5 mm - 500 < Reo < 10,000o
The Reynolds number ranges overlap sufficiently, so that, for some free jetruns, Reynolds numbers could be duplicated with different orifices.
It may be argued, on account of the non-zero value of 0 "foat the center of the orifice (Fig. 2.2), that the mole fractions of the gascomponents in the stagnation chamber could well be different from those inthe supply cylinder. This would indeed be true if the integral of 0-fo ,
integrated over the orifice area, were non-zero. For the reduction of theexperimental data it has been assumed, that in the orifice the value of0-fo is sufficiently negative off the axis to exactly balance the positivecontribution on the jet axis. An argument is presented in Appendix B tosupport this assumption. Consequently, the stagnation chamber value of fohas been taken to be identical with that in the supply cylinder (or with thevalue derived from the volume flow rates metered in).
Figure 5.13 shows the general structure of the jet flow fields.As is evident from these photographs, the lower Reynolds number jets exhibita very diffuse shock envelope. For these jets the barrel shock and the Machdisc have become broadened to the point, where the extent of the undisturbedcentral flow field is considerably reduced. In agreement with the photo-graphs the axial density surveys,performed with the electron beam probe,indicate a density deviation from the isentropic behaviour somewhat ahead ofthe expected Mach disc location.
An attempt has been made to account for the different appear-ances of these jets in terms of the flow parameters. The general featuresof an underexpanded jet are characterized by the size of the first expansioncell and by the diffuseness of the barrel shock and Mach disc. The distance
29

. .~ z.cIt.±vu unicxness of the barrel shock at any point,or that of the Mach disc, may be defined by the ratio 2ormed by the shockthickness, 6 , and the streamline distance, s, from the orifice plane to thecenter Of the shoc),. If it is assumed that the density along the jet axisfalls off as (x/D) (corresponding to a simple source flow model with thesource located near the orifice), and if the shock thickness is assumed to beequal to 4.5 times the distance of a molecular mean free path ahead of theshock (a value, which agrees reasonably well with experimental data for M > 4),then the relative thickness of the Mach disc can be shown (see Appendix C1 tovary inversely as the jet Reynolds number and directly as the jet pressureratio raised to a power, which falls between 1/3 and 1J2, depending on theviscosity-temperature law assumed. if pl/1o = (TI/To)y° is assumed, then therelative thickness of the Mach disc becomes,
b = 69 3/ Re (13)
M (Y+()2 (-i)
This equation applies to a pure gas. For a gas mixture theshock may be several times wider. When the jet Reynolds number and the jetpresqure ratio are such that 6/xM becomes approximately unity, then noregion in the jet remains undisturbed ty the ambient1gas. For the tarrelshock 61s can be considered propo'rtional to (pJp)j Re0 in a very approxi-mate sense onlyo A qualitative analysis of a number of flow visualizationphotographs confirms the above dependence.
Some of the experimental density profiles obtained along the axesof various free jets are presented in Figs. 7.1 to 7.8. In these figures thepartial number densities of helium and argon atoms, normalized with respectto the corresponding partial number densities in the stagnation chaber, havebeen plotted against axial distance in terms of x/D. The original mole frac-tion of argon, the jet Reynolds number, the orifice diameter, and the pressureson either side of the orifice, are stated for each run. The gas mixtures as awhole follow the isentropic expansion curve quite well, which drops offapproximately as the inverse square of the axial distance for x larger than2D. The first experimental downstream deviation from this dependence forany one run indicates the point at which the surroundings start to affect theaxial flow. The apparent discrepancy between the shape of the isentrope andthe experimental curves, very close to the orifice (x/D < 0.5), is simply aconsequence of the fact, that the isentropic expansion through a sonic orificeis not exactly known. In all cases the argon curve is above the helium curve,indicating an argon enrichment along the jet centerline. It is evident fromthese figures that the axial argon enrichment decreases with increasing jetReynolds number. As shown by Figs. 7.7 and 7.8 the diffusive component separa-tion on the jet axis becomes very small indeed for Reynolds numbers of 2000and 3000. For jet Reynolds numbers above 5000 the separation was smaller thanthe experimental error and could not be detected. For all density profilesshown, the density increase caused by the "Mach disc" (i.e. the diffuse shockenvelope closing in) is clearly evident. As predicted by one-dimensional shocktheory the helium compresses ahead of the argon, resulting in a helium enrich-ment in the Mach disc. The corrected and smoothed out experimental densitydata are believed to be accurate to within one or two percent.
30
...... ._'_

From these experimental density profiles, the local mole frac-tions of argon can easily be determined. For the free jets starting out withoriginal mole fractions oflargon of 0.12 and 0.425 these mole fractions havebeen plotted against (x/D)f for various Reynolds numbers in Figs. 7.9 and7.10. The solid curves give the theoretical-mole fractions as per Fig. 2.2The downstream "tails", indicating a sudden decrease in the mole fraction ofargon, are caused by the Mach discs. It should be noted that free jetsoriginating from different stagnation conditions and emerging through differ-ent sized orifices, but having approximately the same Reynolds number (and thesame fo), show identical species separation effects. Also, in the undisturb-ed portions of the free jet expansions the agreement with theory is quitereasonable.
In Fig. 7.11 the experimental data for gas mixtures rangingfrom 5% to 50% argon and for Reynolds numbers between 100 and 1000 have beensummarized and are compared with Sherman's theory (Ref. 8). Only those por-tions of the free jets which were not affected by the shock envelope havebeen used in this graph. Note that in this representation the experimentalerrors are multiplied by the Reynolds numbers of the jets, resulting in afair amount of experimental scatter. it is evident that Sherman's first
order approximation predicts the actual species separation on the jet axisquite well, even for Reynolds numbers as small as 100.
Point-by-point measurements of the partial densities of heliumand argon were made throughout the free jet, off the axis as well as on theaxis, for two cases:
Jet 1: fo = 0.12, Reo = 533, D = 15 mm, Po /P( = 150 •
Jet 2: fo = 0.21, Reo = 224, D = 15 mm po/p = 188 .
For jet 1 the radial number density profiles at various axial positions aregiven in Fig. 7.12. The mole fraction of argon throughout the jet is shownin Fig. 7.13. The "depression" in the downstream direction after the initialincrease in f is caused by the Mach disc. A pronounced argon deficiencyexists also near the edge of the jet. This is believed to be partially dueto the presence of the barrel shock and partially due to the fact that radialpressure diffusion causes an argon enrichment on the axis and a correspondingargon deficiency off the axis of the jet. The gas in the test section outsideof the jet is slightly moreenriched in argon than the stagnation chamber gas,because the diffusion pumps remove the helium at a somewhat faster rate. Aflow visualization of jet 1 is given by the bottom left photograph of Fig.5.13. The radial partial density profiles for jet 2 are presented in Fig. 7.14;
the mole fractions of argon throughout the flow field are plotted in Fig. 7.15.The results indicate the same general features for jet 2 as were observed forjet 1. Throughout the jet the separation effects are somewhat more pronouncedbecause of the lower Reynolds number. Furthermore, the features which can berelated to the barrel shock and Mach disc are considerably more diffuse.
31

VI-II. SHOCK WAVE RESULTS (Helirm-Argon Mixtures)
Normal shock waves were produced in front of the partiallychoked shock sholder placed in the free jets. Figure 8.! shows the generalappearance of the shock waves investigated. It is a flow visualization photo-graph of a Mach 9 shock in a 49 argon mixture. The shock appears to bequite plane, perhaps slightly "dished in". It should be kept in mind, however,that a plane shock in a diverging flow corresponds to a curved convex shock ina parallel flow. From this point of view the shock in Fig. 8.1 is not dishedin enough to be perpendicular to the incoming streamlines at all points andcorresponds, therefore, to a shock which has a small convex curvature withrespect to the streamlines. This is also true for the other shock wavesstudied. Furthermore, the shock diameter is only about three times the shockthickness. The shocks can, thus, hardly be considered one-dimensional.
Figures 8.2 to 8.4 give the normalized partial density profilesalong the axes of the underexpanded jets and through the shock waves for 49%,11% and 1% original argon mixtures, respectively. The corresponding profilesof "f" are given in Figs. 8.5 to 8.7. The initial argon enrichment is causedby the free jet expansion. In all cases the helium compresses ahead of theargon in concord with theory. Radial diffusion in and behind the shock isbelieved to be responsible for the pronounced argon surplus inside the shockholder. For the 1% argon case the general features are as for the othercases, except for the behaviour of the argon density in the upstream portionof the shock. The partial argon densit.y, which originally is significantlyabove the isentropic expansion curve, decreases below the isentrope prior tocompression. This can be interpreted as an acceleration of the argon atomsbeyond the free stream value, in which case it would verify the effect des-
cribed by*Sherman (Ref. 9). It should be noted, however, that the scatterof the experimental argon densities in Fig. 8.4 is relatively large because ofthe smallness of the argon signals measured in this case. Furthermore, theargon error signals subtracted, due to the presence of heli,.um, were largerthan the true argon signals. On account of this there exists some uncer-tainty about the argon density curve drawn in Fig. 8.4. The effect, however,appears to be real, and it remains a matter of interpretation, whether it isascribed to a one-dimensional acceleration of the argon or to a three-dimensional effect, hitherto unexplained-
In order to get a rough comparison of the experimental shockprofiles with the existing one-dimensional theories an attempt has been madeto compensate for the fact that the shock is embedded in a flow with consid-erable streamwise gradients. To this effect an arbitrary reference curvehas been drawn in each of Figs. 8.2, 8.3 and 8°4. This reference curvefollows the isentropic expansion curve into the shz.ck and then levels outsmoothly toward a constant downstream reference density, which was chosen tobe equal to the isentropic free jet density at the centre of the helium shock,Of course, this procedure has to be viewed with serious reservations and isoffered here only in an attempt to compare the salient features in a qualitative
way.
Figure 8.8 gives the total mass density divided by the localreference density through the shock. The total mass density has been calcu-lated from the density curves for the individual species. The distance isgiven in terms of the upstream mean free path defined by
32
16- 1 (14).
where the subscript 1 refers to conditions just ahead of the shock. Equation(14) is the accepted formula for the mean free path of smooth elastic spheres.Even though this "mean free path" has n6 direct microscopic meaning for a gasmixture, it serves as a convenient reference length. In calculating thisreference length the shock Mach number, Ml, was estimated from the positionof the shock in the -free jet. The free stream quantities, Pl, Tl, and Ulwere then obtained from Po, To and-Ml, using the-isentropic relations. Thepure helium and pure argon viscosities at T, were estimated according to theChapman-Enskog theory, assuming an atomic interaction potential of the Lennard-Jones type. Wilke's formula (Ref. 16) was then used to calculate 1Al for thegas mixture, using the pure gas viscosities. For the purpose of displayingseveral shock profiles in one figure, the zero point of the axial length scalehas been relocated at the position, at which the total mass density has reach-ed half the theoretical density increase for the given shock Mach number. Todistinguish this shifted length scale -from the previously defined x-scale (withthe zero point at the orifice), a new symbol, x1, has been introduced in Fig.8.8.
The increase in the non-dimensional shock thickness with in-creasing mole fraction of argon, from pure helium (curve 1) to 50% argon (curve4), is evident from the shock profiles in Fig. 8.8, which- are all for an up-stream Mach number of about 9. The compression ratio across the experimentalpure helium shock agrees quite well with one-dimensional shock theory andprovides some "justification" for the use of the somewhat arbitary referencecurve. In the case of the gas mixtures the total mass density on the down-stream side of the shock turns out to be too high, because there is too muchargon due to radial diffusion in the "curved" shock.
It can be expected that both the shock Mach number and theReynolds number, based on the free stream conditions and the radius of shockcurvature (i.e. Rer = Plul rc/ll), become scaling parameters for the radialdiffusion effect behind curved shocks. A third parameter is needed to describethe dependence of the effect on the free stream composition. Since no appro-priate function has as yet been derived for the curved shock problem, it isassumed here that the function El, based on the free stream composition,adequately describes the composition dependence of the radial diffusion effect.In parallel with Sherman's free jet analysis one might then expect, that,for a given shock Mach number, the quantity (f2-fl)Rer/El is approximatelyconstant for all curved shocks (f2 is the mole fraction of argon behind thenormal part of the shock). Furthermore, the Mach number dependence of theargon enrichment is probably insignificant for l> 5.
For the experimental shock waves discussed here, it is diffi-cult to estimate, what theequivalent shock curvature would be, if the shockswere embedded in a parallel flow. An approximate transformation from thediverging flow of the free jet to a parallel flow can be obtained, if oneimagines the incident streamlines rigidly attached to the shock surface, andif one then rotates these streamlines into a parallel configuration, therebyforcing the shock surface into a more convex shape (the angle of incidence ofeach streamline remaining constant in the process). On this basis it has beenestimated from flow visualization photographs, that the equivalent radii ofshock curvature ranged between 10 cm and 20 cm, and that the quantity(f2-fl)Rer/E1 is of the order of 100 for these shocks.
33

It is also difficult to define a meaningful shock thicknessfor the shocks of Fig. 8.8, since the downstream halves of the shock waves 2,3, and 4 differ radically from any corresponding one-dimensional shocks. Theupstream halves of the shock waves, on the other hand, should not be signifi-cantly influenced by radial diffusion and should correspond closely to thoseof one-dimensional shocks. This appears to be a reasonable assumption, be-cause in the supersonic part of the shock the downstream influences are expect-ed to produce no significant curvature of the streamlines. An approximate"equivalent 1D-shock thickness", 6s, has therefore- been defined by taking theslope of the total mass density profile at x' = 0 and extending it down toP/PREF = 1 and up to the theoretical density ratio. Thus 6s is defined by
6 (P2/Pl)TH-1(S- (15)[dpsRF /x]x,=O
The values of bs and 6 /X obtained in this fashion are tabu-lated in Fig. 8.8. These values indicate, that for a shock of M1 = 9 andfl = 0.5 the shock thickness, in terms of ? l,is about three times that in apure gas (fl= 0 or 1).
IX. CONCLUSIONS
Based on the reported experiments and discussionsthe followingconcluding remarks can be made.
(1) The method of using a thin electron beam and a set of interferencefilters for a spectroscopic study of the composition of rarefied gases hasbeen shown to give accurate results for argon-helium mixtures. Other mix-tures may presumably be analyzed in a similar manner, provided that theexcitation processes involved are reasonably well understood. It appears tobe necessary to make preliminary tests, similar to those outlined in SectionV, for each new gas mixture and for each new set of spectral lines selectedin order to interpret the beam intensity measurements correctly. The electronbeam provides, at the same time, a convenient means of mapping out photo-graphically the density field under study.
(2) No radiative coupling between the helium and the argon fluorescencehas been detected in helium-argon mixtures. Any interspecies transfer ofexcitation energy by secondary electrons must evidently be insignificant.
(3) Sherman's theory for the species separation along the centerline ofan underexpanded free jet has been substantiated experimentally for a binarymixture of monatomic gases. According to this theory and the experimentaltests the species separation in the undisturbed free jet is smaller than haspreviously been observed by investigators, such as Stern and Waterman or Chow,who analyzed the gas sampled by a skimmer or sampling tube placed in the jet.The species separation is inversely proportional to the jet Reynolds numberand takes place almost entirely 6ver the first three diameters downstream ofthe orifice. For Reynolds numbers above 5000 the species separation becomesinsignificantly small.
34

(4) The salient features predicted for the one-dimensional shock struc-ture in a binary non-reacting gas mixture have been observed. For all shockwaves encountered the light gas has been found to compress significantly aheadof the heavy gas, resulting in an enrichment of the light atomic species through-out most of the shock. In terms of the upstream gas properties the shocktransition for a gas mixture has been observed to be up to-three times as wideas for a pure gas. For a Mach 9 shock in a 1% argon mixture the argon hasbeen observed to expand beyond the free stream value in the upstream portionof the shock transition. If this is interpreted as a one-dimensional effectit means an argon acceleration as predicted by Sherman. It is felt, however,that for a definite proof of the existence of this effect, is is necessary torepeat the experiment in a truly uniform one-dimensional high Mach number flow,which was not attainable with the present UTIAS low density facility.
(5) The shock wave results indicate that shock curvature may producevery significant radial diffusion effects, resulting in an enrichment of theheavy gas on the centerline behind the shock. This effect might be used toexplain, at least partially, the unrealistically large species separationobserved when sampling tubes are introduced into a supersonic flow field.
There remain a number of interesting gas dynamical problemsfor the study of which the optical electron beam densitometer is ideallysuited. A short list of the most obvious extensions of the present experi-ments is given hereunder.
(.1) A study could be made of the diffusion effects in the free jet expan-sion and the shock compression of a mixture of diatomic gases (say, N2 and H2).This is of particular interest, since the rotational temperatures of the com-ponent species could also be obtained using the electron beam technique (Ref.39). The component temperatures are not expected to be equal at a point in-side a shock wave, for example.
(2) Along similar lines, a study of the diffusive separation in gas mix-tures, the components of which having different specific heat ratios (7),should be of interest. This problem also remains to be solved theoretically.
(3) A systematic study should be made of the effect of shock curvatureon the degree of heavy species enrichment behind the curved shock.
(4) In the present study an attempt was made to verify one-dimensionalshock structure theory for binary gas mixtures. The present experimentshave shown that this cannot be done accurately in a free jet flow field.These studies should be repeated in a truly uniform flow.
(5) Species concentration measurements should be of value in countlessapplications involving reacting gas mixtures.
(6) A detailed spectroscopic study of the radiation resulting fromelectron beam excitation in various gases is of interest in itself, since itmay lead to a better understanding of atomic physics and to improvements inthe electron beam technique.
35

(7) It is self-evident that the optical electron beam density probe canbe applied to numerous gas dynamical problems in pu1e gases (e.g. for a studyof boundary layers, wakes, turbulence, shocks etc.).
For electron beam studies in helium-argon mixtures or in pureargon the spatial resolution can be improved by choosing spectral lines, whichdo not show a fluorescent halo. In retrospect of the present study it appearsto be advantageous to sacrifice intensity in favour of spatial resolution,thereby avoidipg needless jorrections. From that point of view the ArlI linesbetween X 4300A and X4500X appear to Re suitable. In the case of heliumthe fluorescent halo observed at X 5016A appears to have little effect onthe spatial resolution except at very low densities.
36

REFERENCES
1.. BeckerE.W. Die Trennd{se, ein neues Element zur Gas-undBier, K. Isotopentrennung, Zeitschrift ftir Naturforschung,Burghoff, H. Vol. 10a, p. 565-572, 1955.
2. Waterman, P.C. Separation of Gas Mixtures in a Supersonic Jet, JournalStern, S.A. of Chemical Physics, Vol. 31, p. 405-419, Aug. 1959.
3. Stern, S.A. Separation of Gas Mixtures in a Supersonic Jet II.Waterman, P.C. Behaviour of Helium-Argon Mixtures and-Evidence ofSinclair, T.F. Shock Separation, Journal of Chemical Physics, Vol. 33,
p. 805-813, Sept. 1960.
4. Chow, R.R. On the Separation Phenomena of a Binary Gas Mixture inan-Axisymmetric Jet, University of California,. Instituteof Engineering Research Report HE-150-175, Nov. 1959.
5.. Chow, R.R. Separation of Binary Gas Mixtures Behind a Curved Shock,Grumman Research Department Memorandum RM-295, Sept.1965.
6. Reis, V.H. Separation of Gas Mixtures in Supersonic Jets, JournalFenn, J.B. of Chemical Physics, Vol. 39, P. 3240 - 3250, Dec.1963.
7. Zigan, F. Gasdynamische Berechnung der Trenndusen-entmischung, Zeitschrift fr'Naturforschung, Vol. 17a,p. 772-778, 1962.
8. Sherman, F.S." Hydrodynamical Theory of Diffusive Separation of Mix-tures in a Free Jet, The Physics of Fluids, Vol. 8,P. 773-779, May 1965.
9. Sherman,.F.S. Shock-Wave Structure in Binary Mixtures of ChemicallyInert Perfect Gases, Journal of Fluid Mechanics, Vol.8,p. 465-480, July 1960.
10. Fujimoto,Tetsuo Shock Wave Structure in Binary Gas Mixtures with noChemical Reaction, Proceedings of the 4th InternationalSymposium on Rarefied Gasdynamics at Toronto, 1964,edited by J.H. deLeeuw, Academic Press, N.Y. 1966.
11. Oberai, M.M. Kinetic-Theory Approach to the Problem of Shock-WaveStructure in a Binary Mixture, The Physics of Fluids,Vol. 8, p. 826-833, May 1965.
12. Owen, P.L. The Flow in an Axially Symmetric Supersonic Jet from aThornhill, C.K. Nearly-Sonic Orifice into a Vacuum, Aero. Res. Council
Report, 9 & M No. 2616, Great Britain, 1948.
13. Sherman, F.S. Self Similar Development of Inviscid Hypersonic Free--Jet Flows, Lockheed Report 6-90-63-61 (1963).
14. Bier, K. Zur Form der Verdichtungsst8gse in frei expandierendenSchmidt, B. Gasstrahlen, Zeitschrift fu'r angewandte Physik, Vol. 13,
p. 493-500, 1961.
'Z7

Aft
15. Ashkenas, H. The Structure and Utilization of Supersonic Free JetsSherman, F.S. in Low Density Wind Tunnels, Proceedings of the 4th
International Symposium on Rarefied Gasdynamics atToronto, 1964, edited by J.H. deLeeuw, Academic Press,N.Y., 1966.
16. Wilke, C.R. A Viscosity Equation for Gas Mixtures, Journal ofChemical Physics, Vol. 18, p. 517-519, April 1950.
17. Bird, R.B. Transport Phenomena, John Wiley & Sons, New York,-Stewart, W.E. 1960.Lightfoot, E.N.
18. Schumacher, B.W. Electron Beam Fluorescence Probe for Measuring theGadamer, E.O. Local Gas Density in a Wide Field of Observation,
Canadian Journal of Physics, Vol. 36, p. 659-671,1958.
19. Gadamer, E.O. Measurement of the Density Distribution in a RarefiedGas Flow Using the Fluorescence Induced by a ThinElectron Beam, UTIA Report No. 83, University ofToronto, March 1962 - also AFOSR TN60-500
20. Muntz, E.P. Electron Excitation Applied to the Experimental Investi-Marsden, D.J.. gation of Rarefied Gas Flows, Proceedings of the 3rd
International Symposium on Rarefied Gasdynamics,Academic Press, Inc., New York, 1963.
21. Enkenhus, K.R. The Design, Instrumentation and Operation of theUTIA Low Density Wind Tunnel, UTIA Report No. 44,University of Toronto, June 1957.
22. Harrison, G.R. M.I.T. Wavelength Tables, Technology Press, Massachu-setts Institute of Technology, John Wiley & Sons,New York,1939.
23. Lees, J.H. Notes on the Excitation Processes in Helium, Proceed-Skinner, H.W.B. ings of the Royal Society of London, Series A, Vol.
137, P. 186-198, 1932.
24. Wolf, R. Versuche uber Helium-Fluoreszenz und uber dieMaurer, W. Giltigkeit des Spinerhaltungssatzes bei Stossen
zweiter Art von angeregten mit normalen Helium-Atomen,Zeitschrift four Physik, Vol. 115, p. 410-430, 1940.
25. Allen, C.W. Astrophysical Quantities, University of London,Athlone Press, 1955.
26. Bacher, R.F. Atomic Energy States, McGraw-Hill, 1932.Goudsmit, S.
27. Merr.ll, P.W. Lines of the Chemical Elements in Astronomical Spectra,Carnegie Institution of Washington Publication 610,Washington, D.C.,1956.
38

28. Olsen, H.N. Measurement of Argon Transition Probabilities Using theThermal Arc Plasma as a Radiation Source, Journal ofQuantitative Spectroscopy and Radiative Transfer, Vol.3,p. 59-76, 1963.
29. Knox, R.S. Excited-State Wave Functions, Excitation Energies, andOscillator Strengths for Argon (3p5 4s), PhysicalReview, Vol. 110, p. 375-381, 1958.
30. Rothe, D.E. Flow Visualization Using a Traversing Electron Beam,AIAA Journal, Vol. 3, P. 1945-1946, October 1965.
31. Talbot, L. Survey of the Shock Structure Problem, ARS Journal,Vol. 32, p. 1009-1016, July 1962.
32. Sherman, F.S. A Low Density Wind Tunnel Study of Shockwave Structureand Relaxation Phenomena in Gases, University ofCalifornia, Institute of Engineering Research ReportNo. HE-150-122, May 1954.
33. Hansen, K. Thickness of Shock and Detonation Fronts and RotationalHornig,D.F. Relaxation at High Temperatures, Rarefied Gasdynamics,Levitt, B. edited by L. Talbot, Academic Press, N.Y. 1961,p.593Myers, B.F.Linzer, M.
34. Camac, M. Argon and Nitrogen Shock Thicknesses, AerospaceSciences Meeting at New York, Jan. 1964, AIA Pre-print No. 64-35.
35. Kieffer, L.J. Electron Impact Ionization Cross-Section Data forDunn, G.H. Atoms, Atomic Ions, and Diatomic Molecules, Reviews
of Modern Physics, Vol. 38, p. 1 - 35, Jan. 1966.
36. Anderson, J.B. Studies of Low Density Supersonic Jets, ProceedingsAndres, R.P. of the 4th International Symposium on Rarefied Gas-Fenn, J.B. dynamics at Toronto, 1964, edited by J.H. de Leeuw,Maise, G. Academic Press, N.Y. 1966.
37. Milne, T.A. Mass Spectrometer Study of Metal - Containing Flames,7th Quarterly Technical Summary Report, MidwestResearch Institute, Kansas City, 1963.
38. Greene, F.T. Mass Spectrometric Detection of Polymers in Super-Milne, T.A. sonic Molecular Beams, Journal of Chemical Physics,
Vol. 39, P. 3150 - 3151, December 1963.
39. Muntz, E.P. Measurement of Rotational Temperature, VibrationalTemperature, and Molecule Concentration in Non-RadiatingFlows of Low Density Nitrogen, UTIA Report No. 71,University of Toronto, April 1961. Also, Physics ofFP 11d,4 Vol. 5, p. 80, 1962.
39

BLANK PAGE
I,
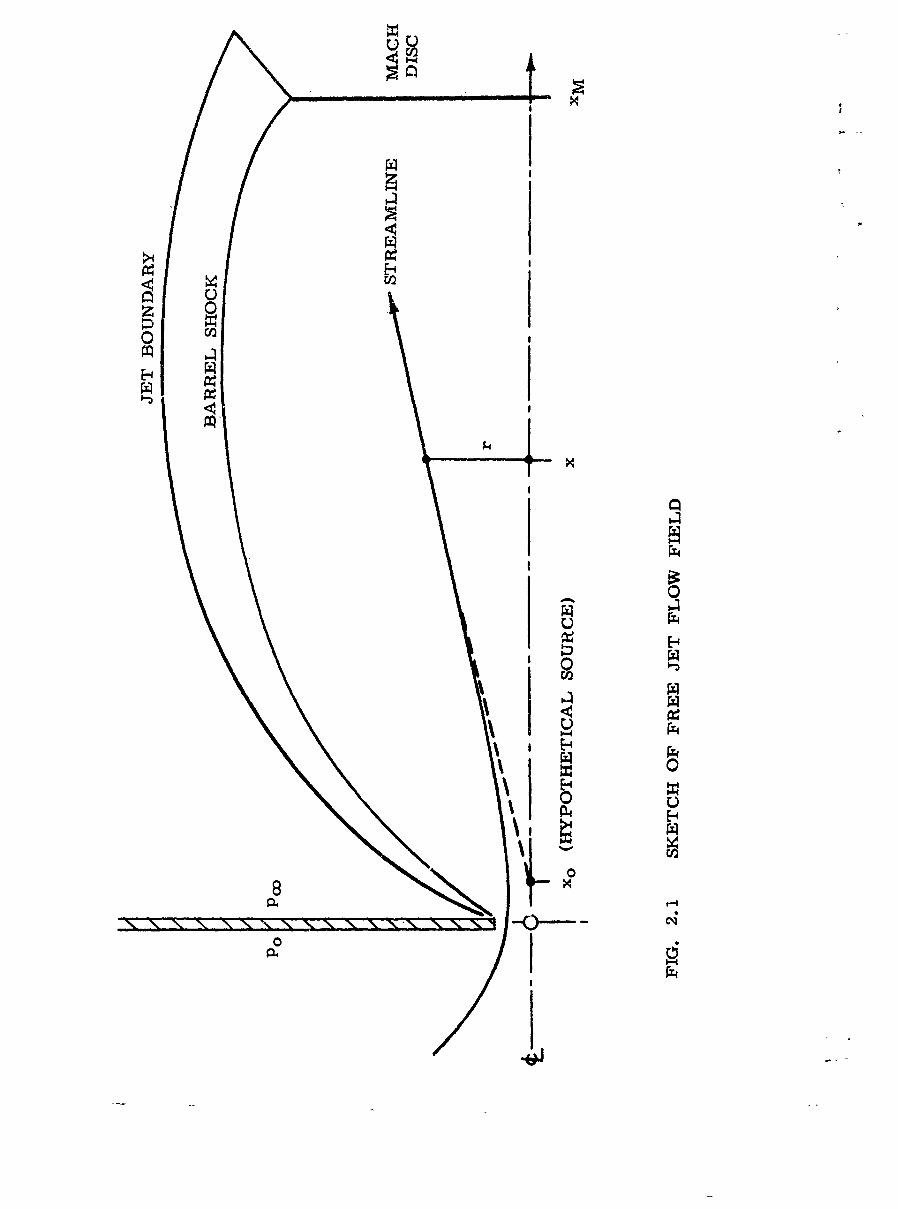
00
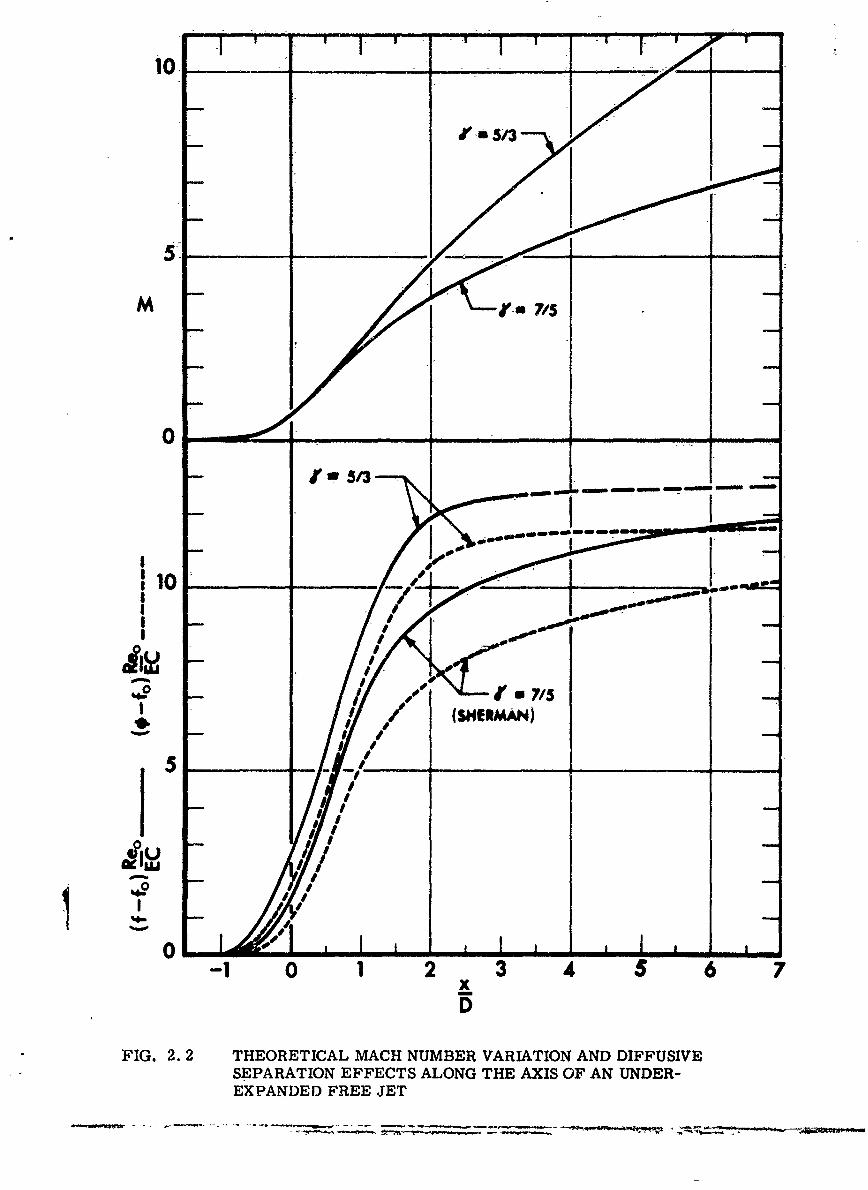
in in -ri fl I - --'... I ,r - rf ' Ii0,
'53
M
o -- d!to 7/50o 0
0
I ( S E MAJ N )I f
IIII
II5 1
x 7
FIG. 2.2 THEORETICAL MACH NUMBER VARIATION AND DIFFUSIVESEPARATION EFFECTS ALONG THE AXIS OF AN UNDER-EXPANDED FREE JET

100
40P D___ _ in torr- mm-
10
0 . 040.6 0.8 1.0fo
FIG. 2. 3 THEORETICAL DEPENDEWNE OF THE REYNOLDS NUMBibiaAND Or THE PARAMETER Reo/EC ON THE GAS'COMPOSITIONFOR ARGON"-HELIUM MIXTURES

t,
IL I [
ml 0 CEE,
WU
2 4jII
do'
z 4
-E W4~

U)3
020
E- ~ E-)
100
E0
F4z

Ai,2 mzy , Y
.. . .. .. . . ... . . .
'C 4 -; ~ . 4~ 4 .t-* ,*
I J! I S-
\ if
I I
it 1 , I'

,~ .,
zr.z
' UNP
04:
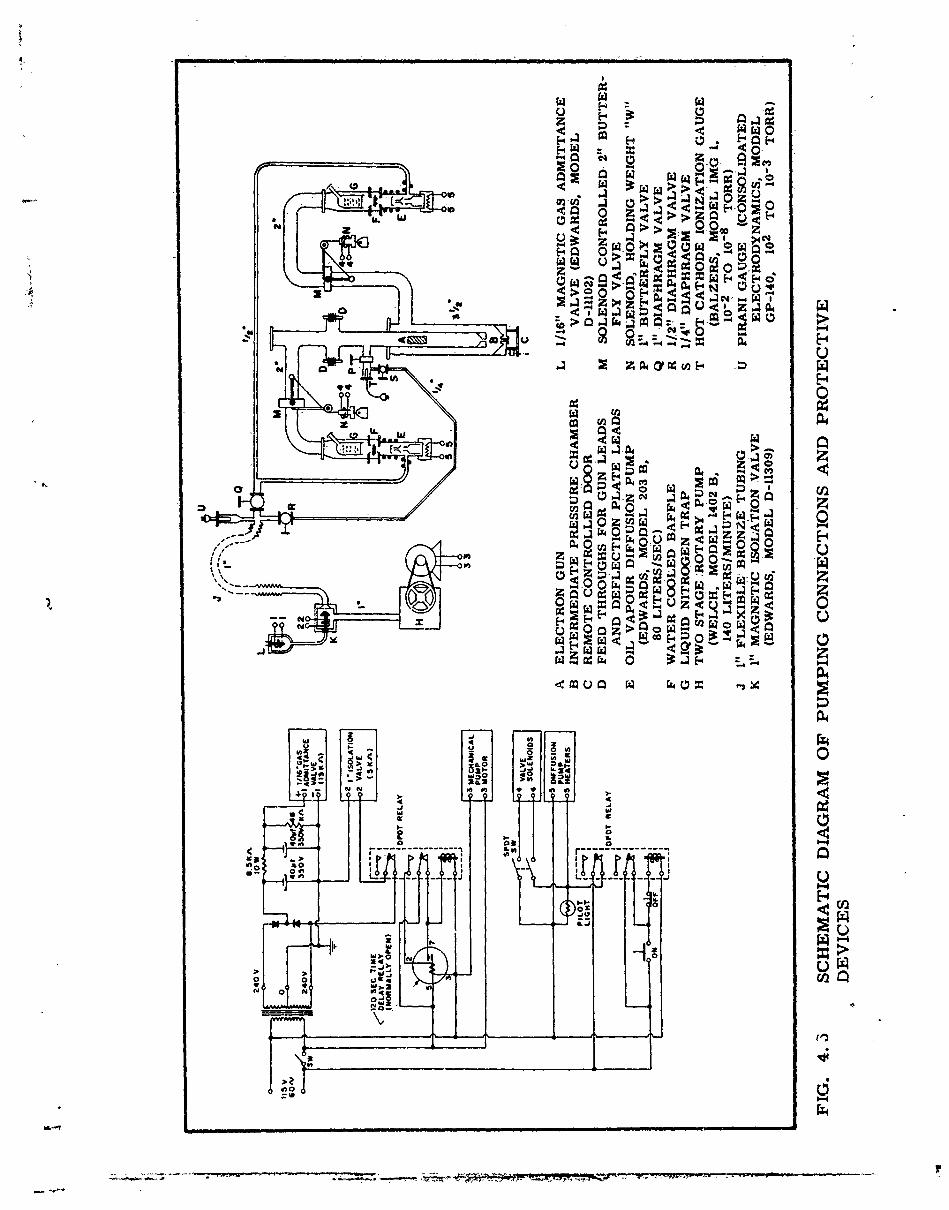
H ~40,X-O 0 -
4:9 -o .
.I C4 4 W
0 > >
00 0
0~~~ 0 0w wz
> 0(z 0 1*
U 04
.4 0
imi
z HI.
0 0 3 0 .
0 "WO -6hi 0 ~~ <C w K .
--- of -IWOW -WU
0 ,0 N
5E-
w .4 9 44 Cj
a 0 An
2 ;i -,
_ _ _ _ _ _ _ _~~> _ _ _ _ _ _ _ _ _ _ _

00
00
0)
Cu rI-
00
t-' E-4
z
too
0 ~0 0Lo)
z0 LO Z1z W
0 fA 44
0 2
0to
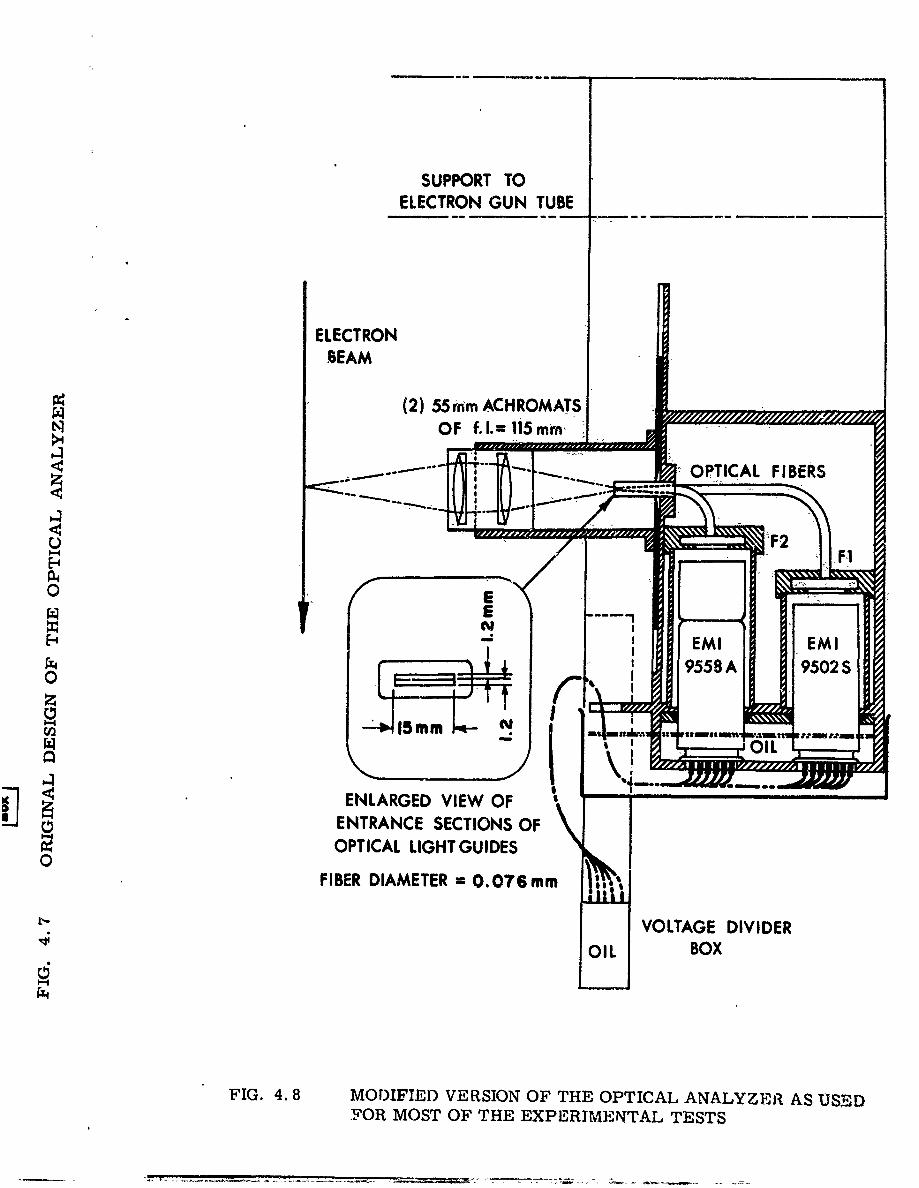
SUPPORT TOELECTRON GUN TUBE
ELECTRONBEAM
(2) 55rnm ACHROMATSOF f.I.= 15mm
I ...---. OPTICAL FIBERS
o f- 4 ii, .t.£ 1 EMIEM
H --
z
0ENLARGED VIEWOF
~ENTRANCE SECTIONS OFOPTICAL LIGHT GUIDESI
FIBER DIAMETER =0.076 mm I
[" VOLTAGE DIVIDER
OILI O IL
FIG. 4.8 MODIFIED VERSION OF THE OPTICAL ANALYZ!f] AS USEDFOR MOST OF THE EXPERIMENTAL TESTS
0 ~

SUPPORT TOELECTRON GUN TUBE
ELECTRONBEAM
(2) 55ram ACHROMATS _ _ _
OF f.I.=115mm
--OPTICAL FIBERS
-- " sEMI EM I
[ & I 9558 A 9502 S
ENLARGED VIEW OFENTRANCE SECTIONS OFOPTICAL LIGHT GUIDES
FIBER DIAMETER = 0. 076 mm
VOLTAGE DIVIDER
O IL BOX
FIG. 4.8 MODIFIED VERSION OF THE OPTICAL ANALYZER: AS USEDFOR MOST OF THE EXPERIMENTAL TESTS

GREiN LIGHT
_____________ ( SO6)
,,,,,. . + ++ f. -7 I
1' - * -1 ,~7' 7 9502 5
N 60 0 NULC 4 InV0ECK I
:DC POWER " . PIco-I P ,upPLY : _ AMMETER
JM-242 [ C,,' K F-n4LY
30T'36 4 __ _ _ __ _S '10 am0.1 rI ;. I " ++.I
oT + :
.,J I _ --
V
F4.4. IRN4DARA.O PHTMLIPLE UE
5
7' XK6 ISOC 1 1 9558A!71 18
II1 0
LIGHT
FIG. 4. 9 WIRING DIAGRAM FOR PHOTOMULTIPLIER TUBES

Ift
ZZ0
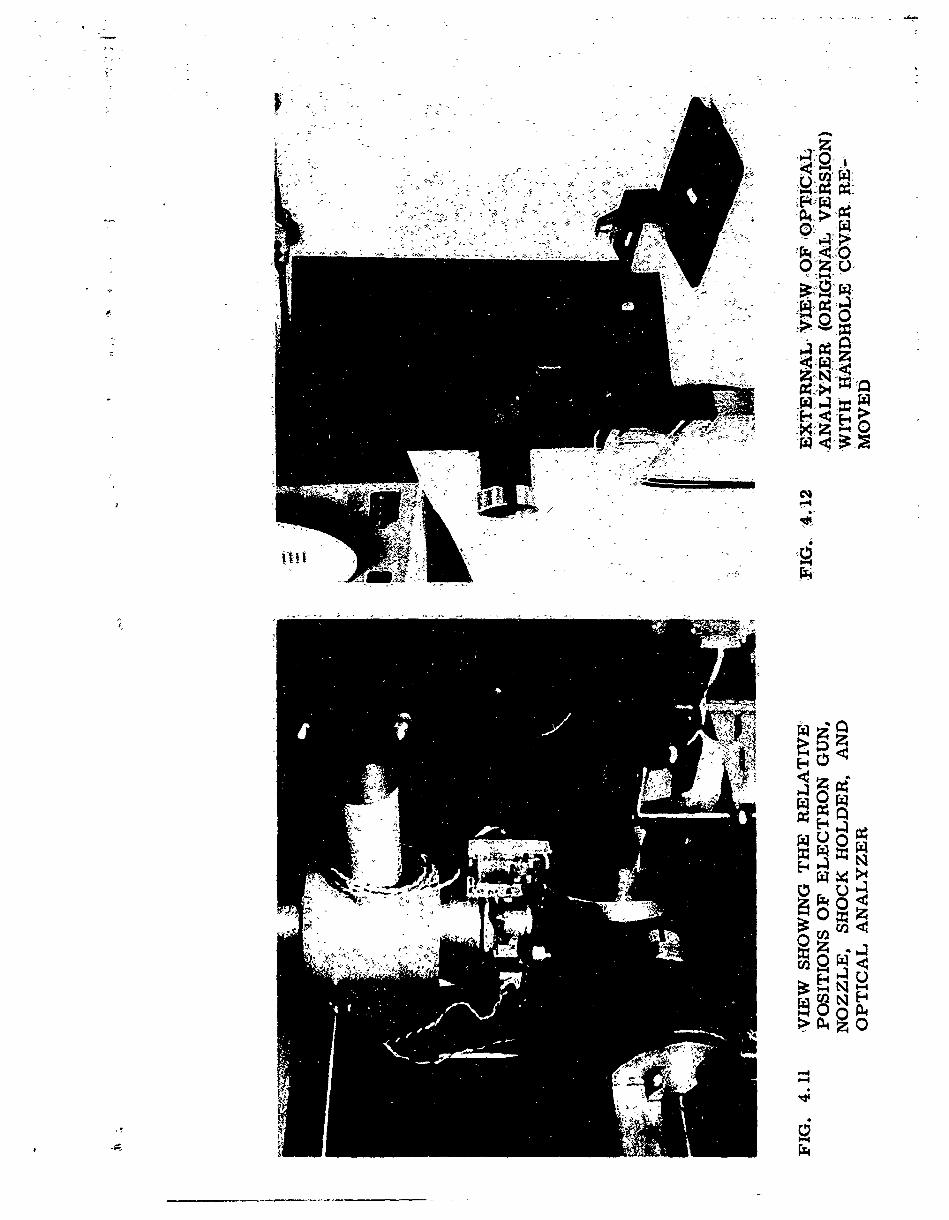
' cc
-
MA
0.4
10
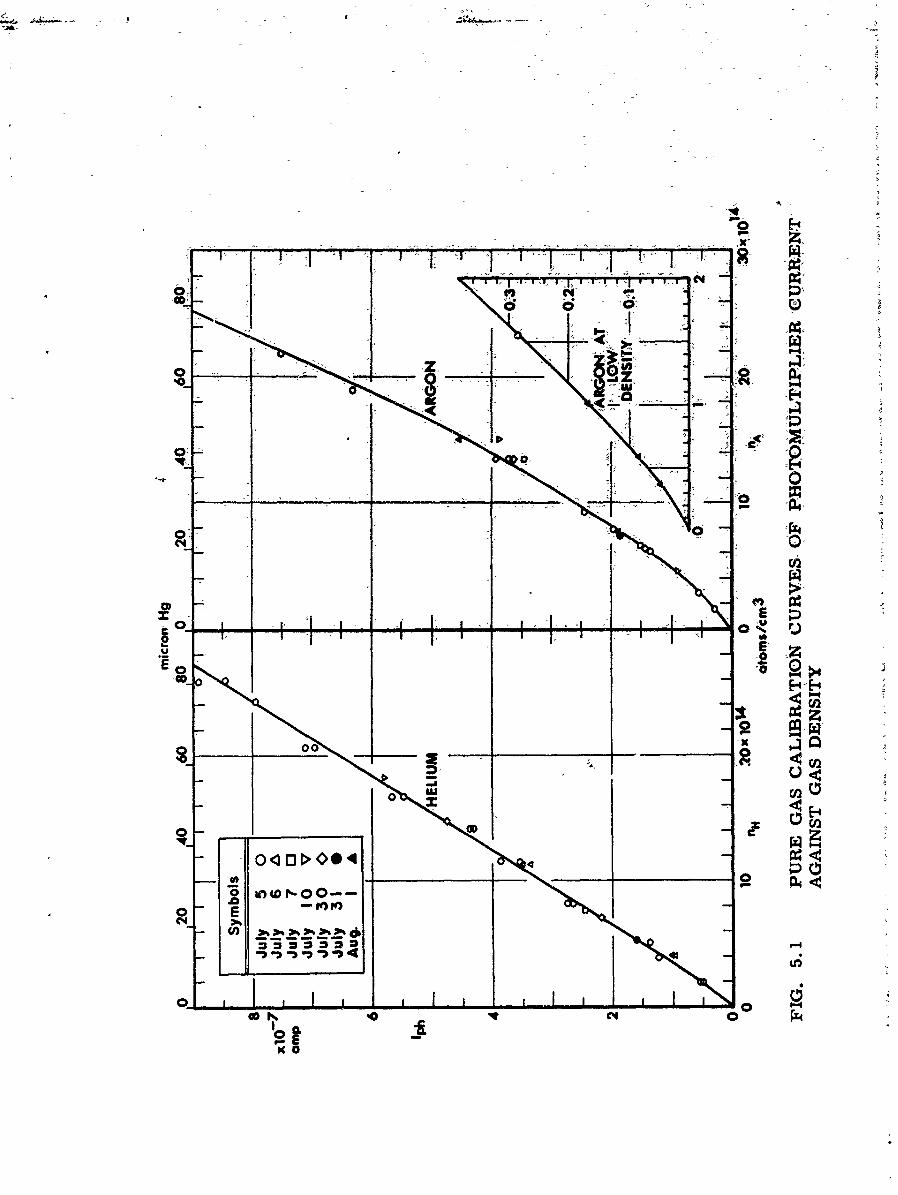
so
00'
00
O<2t * 4
0
0IIs E

'0073;)
-00
04 Zl 0
A Eox
00 Ci0
- 2mui 0
< 0
w~ n4wU
- 0 Z
0
f0
400-0;f OD)
3_ _ _ -1 02- 2-4
90 C14
OD CL
__ _ _ _ __Ei _ _ _ _
X0 20uoH1dun4l~
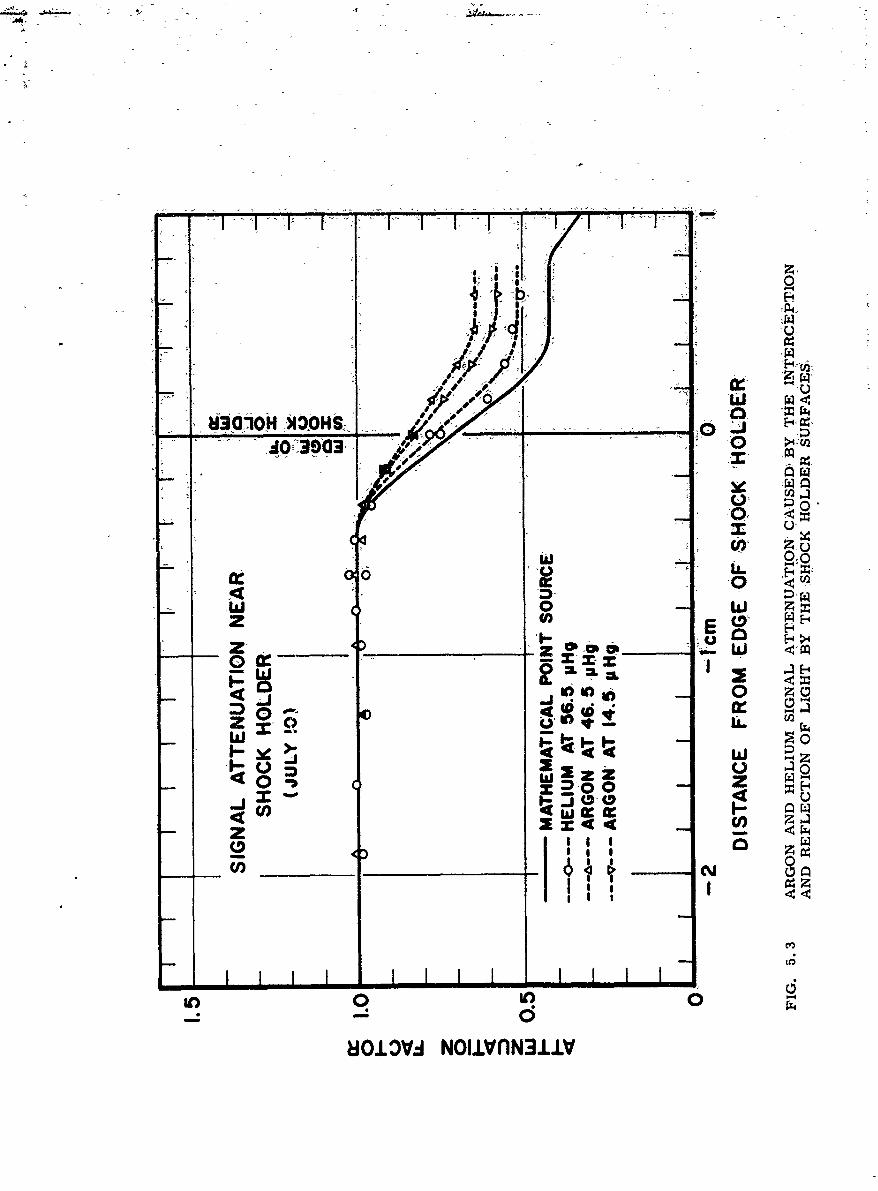
AAi
a0 -
a'p4
C) .)
-o 4t,0H)~OS -'
iO~~~ 393 v
w 0x w zC0 z-zZ
a: u
0i 0 wC4z
10- J
8o3V a:-N31

Prhlu 5:fih 4', Sd5/
'Ay Ir -?4 I41 Ike000 ok
ry OyO
f5O WC~
zfp =0 s==op' =5171700
AIM 00
fe-2000o,7
FIG. 5. 4 ENERGY LEVEL DIAGRAM FOR NEUTRAL HELIUM(taken from Ref. 24)

5876 FILM:
KODAK103aO
imm
"'- - • --- --- 50 15.7 ... , _ , .
4921.9
4471.74 4 71. 5
___________ 4387. 9 . .
N 2
IT1 4143.7
FILM: 4026.4
KODAK 4026.2$- ,,,,ROYAL-X PAN 3 964 .7 ,.,
N23888.6--
3819.6 ----- "
FIG. 5.5 ELECTRON BEAM EXCITED SPECTRUM OF HELIUM.THE 1/2 mm WIDE ELECTRON BEAM IS AT RIGHT ANGLESTO THE SPECTROGRAPH SLITELECTRON BEAM: 17.5 kv - 200/i ampHELIUM PRESSURE: 100/1 Hg
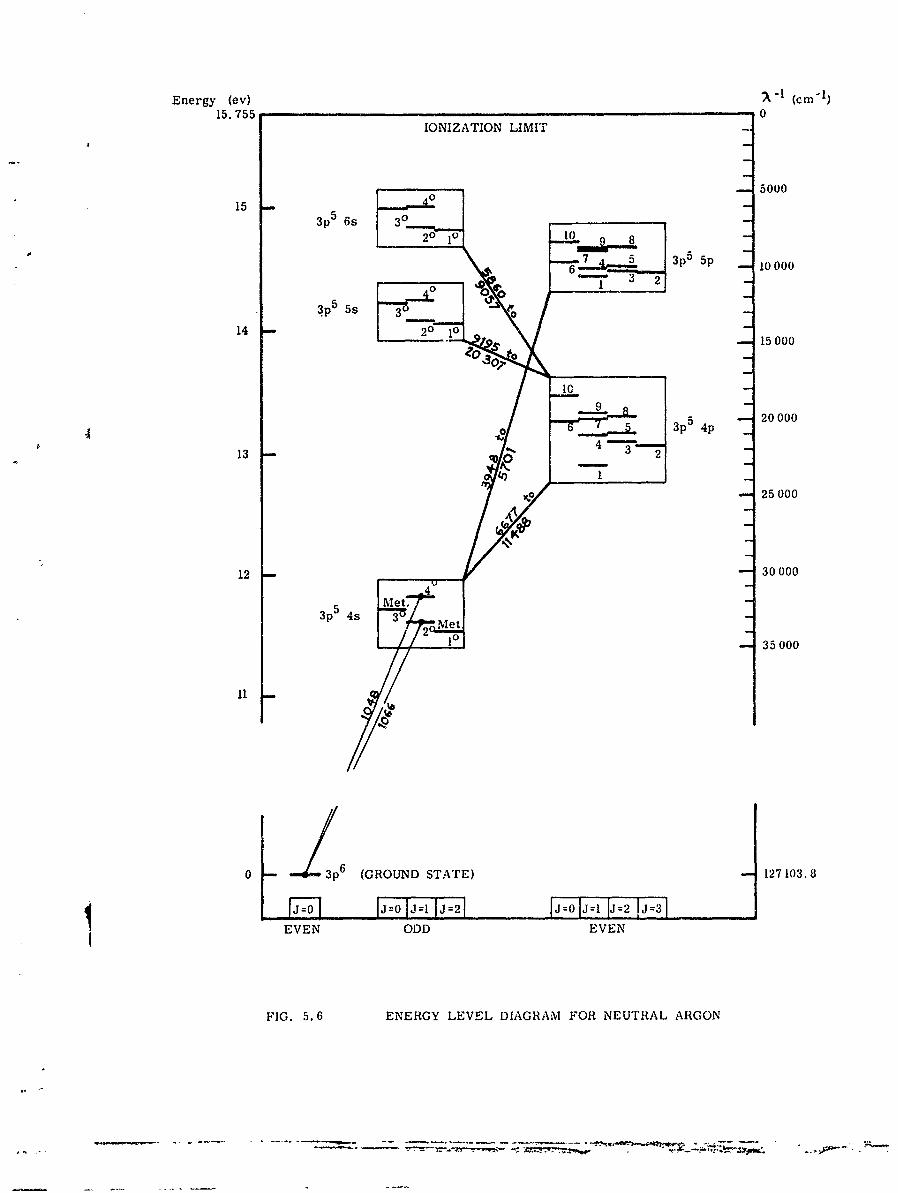
Energy (ev) - (cml)15. 755 0
IONIZATION LIMIT
5000
15 4
3p5 6s 3020 10 .1 9 8
7 3p 5 5p 10000- 3"2
q.p5 5s 314 20I
1415 000
9--'--3p 5 4p 20 000
13
25000
12 30000
'e3p5 4s 3 e
20--- 35 000
0 k - 3p 6 (GROUND STATE) 127103.8
EVEN ODD EVEN
FIG. 5.6 ENERGY LEVEL DIAGRAM FOR NEUTRAL ARGON
- -- - .. .-- - - .=
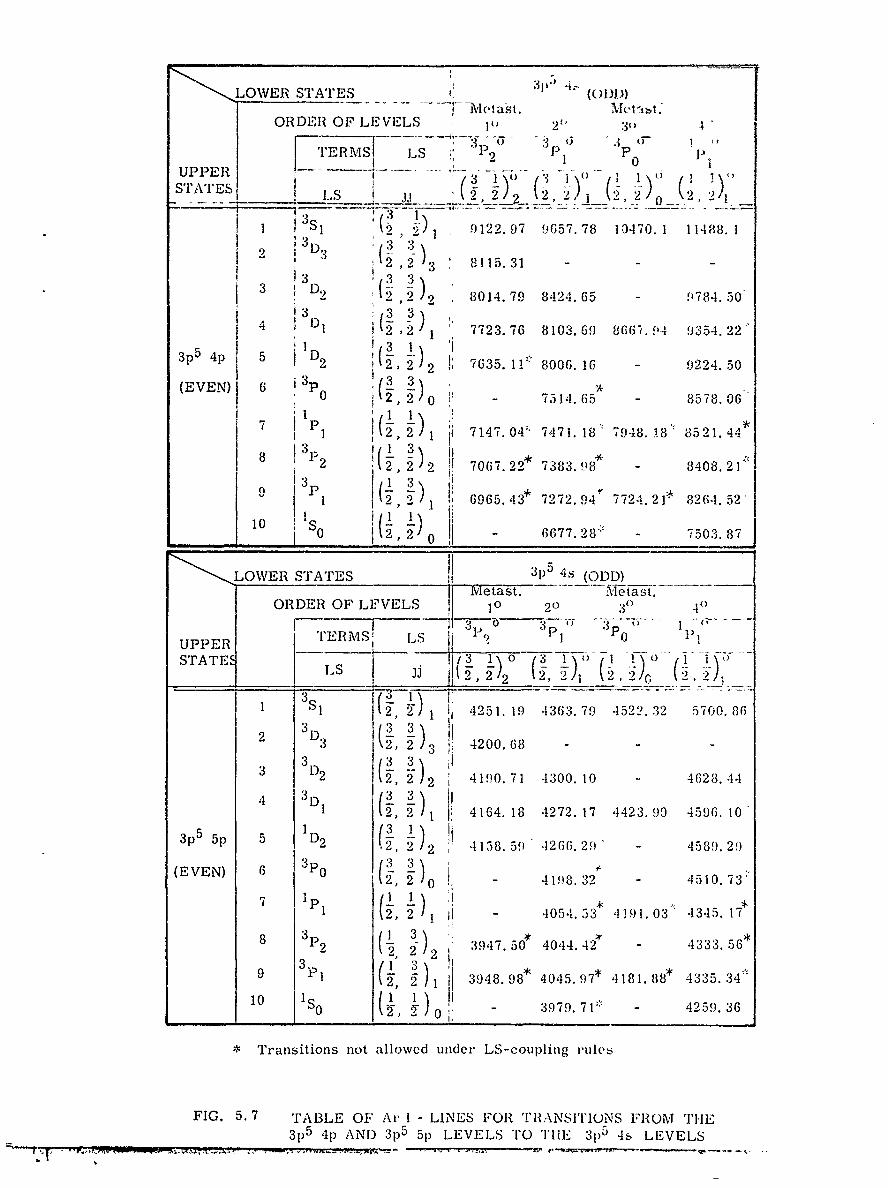
LOWER STATES (-ia.MAfjimieast. Mts --ORDER OF LEVELS 2" 4'
TERMSV LS ;' P93P 7 0
E1 I's 3(P2 0 --.UPPER
;T'ATE"- i's__ ___ _2(_2 (
1 1) 1 9122.97 9657.78 10470. 1 11488. 1; 13D 3 :(3 3
I 3 8115.313 D3 3
3 D , 2 8014.79 8424.65 - 9784.504 2'2 1 7723.76 8103.69 866.f44 9354. 22
p1(3 1 I3p 5 4 p 5 D2 12, 2)2 , 7635.1!" 8006.16 - 9224.50
(EVEN), 6 3- 714.65 - 8578.06
PI 1(2, 2 i 1 t 7147 04' 7471. 18 7948. 18 " 8521.44*
1 2 2 1 7147.22 04 ,27067.22 7383. 58 - 8408.21
3 ~P 1 2, 2)1 6965.43 7272. 94' 7724.21* 8264.52
10 iS 2) 0 - 6677. 28* - 7503.87
LOWER STATES _ __3p5 4s (ODD)Metast. Aetast.
ORDER OF LEVELS 10 20 0 4()31% 0 3 , 0 :3 .. . . - ....
UPPERTRMS LS 31 0STATES IS Jj (I,2/ (, 1) (/) (-J.~ A, C 2/ -I,---....
2 1 4251. 19 4363.79 4522. 32 5700. 86
2 D 3 2 2 4200.68 - -302 (31 23 ,,
3 (, - 4190.71 -1300. 10 - 4628.44
4 3D. 1
1 (2, 2 /), 4164. 18 4272. 17 4423. 99 4596. 10
3p5 5p 5 1D2 2 2 .1158.59 -1266.29" 4589.29
(EVEN) 6 3 P 0 (, 2 0 4198. 32* 4510. 73'
2 p 2 4054.33 '1191. 03" 4345. 17
8 3 p 2 - i 3947 50 4044.42' - 4333. 56
-7, 3948.98* 4045. 97 ' 4 181. 88* 4335. 34""
10 I s0 I~ - 3979. 7W 1 4259. 361o TS , T o 1!
• Transitions not allowed under LS-coupling rules
FIG. 5. 7 TABLE OF Ar I - LINES FOR 'I'lRANSITIONS FROM THE
31p5 41p AND 3p5 51) LEVELS TO THIE 3p5 4, LEVELS' :I "V )' .¢r , .. -a . . .' - .- . . -- ..-..- , - ,' -. . . . . - -,, - . -.. ,

FILM:
Ar, II LINES KODAK Ar I LINES103-0
489. - 4876.3
4764. 9-4735.'9__ _ .- ' .4726. 9
465?. 9
4589. 9____ ~ -
4545. 1 -A~'~' ~- 45 10. 7
4430. 2
440 1.0 04400.1 y4379.74371.4-4370.8--~
4348. 1-~ 4345. 24331.2 4335.3-4333.6
4277.5 '4266.3~
4237.2 42.
4198.3- 4200.7
- 4190.74181.94142 4158.6
4131.74103.9
4 0782. 440 7940204052. 9 . 4054. 5
4042.9 4045.9-4044.4
3992. 1
3944.3___ 3948. 8-3947.5
3928. 6
JU-imm
FIG. 5.8 ELECTRON BEAM EXCITED SPE~CTRUM OF ARGON IN THESPECTRAL RANGE FROM 3900 A TO 4900 A.THE SPECTROGRAM WAS OBTAINED IN AN UNDEREXPANDED
ARGON JET WITH THE 1 mm WIDE ELECTRON BEAM ATRIGHT ANGLES TO THE SPECTROGRAPH SLIT.THE JET FLOW IS FROM LEFT TO RIGHT
- Spectrogram by D. Marsden, UTIAS-

_____8424.6 -8408. 2
____ ____8264.5
-8 115. 3 -8 103. 7
E 8014.:B8-8006. 2- 7948.2
- - 7724.2-7723.8
-7514. 7- 7503. 9
___ 41 7384
FILM:
KODAKI-N
U:FIG. 5. 9 B ELECTRON BEAM EXCITED- SPECTRUM OF ARGON IN_______THE FAR RED REGION
(ELECTRON BEAM PARALLEL- TO SPECTROGRAPH SLIT)
FILM:KODAK
I-N
FIG. 5.9 A SPECTRUM OF AN ARC HEATED ARGON PLASMA JET
- Spectrogram by D. Marsden, UTIAS-

a ~FLOW -FO
4mm 0 ,j,2m 0 0 2w
TIME TIMvE
0pe~ 2mm 0 lsc
CFLOW f FOTIME is
,~~~~ ,F,,., o
it mall
Fig. Gas Lines (_At.ini x I ec0
2ra 0 se mm/seco
a Ar I 720A-8500.\ 2. 34 ;,2 % if - .17 5.36 X 10⁵
b Ar I 72601 -8500A 3. 08 .6 i 4 - 0.075 5.50 X 10
c Ar I 72OOX -8,d-, II. (1 1 K 0. 037 5.56 X 10⁵
d He 1 5016A 5.,011. 6 1 - u.075 1.74 X 10
e e I 5Ul l6' 1 V p ' -0.037 1.76 X10 6
f Arl1 5 0 0 &5 ,17 1 3 , - o.075 5.50 X10 5
FIG. 5.10 RADIATION PIRuHLJ , I H, I H LIECTRON BEAMIN ARGON ANt) lI1L .Ii C, Lj-I
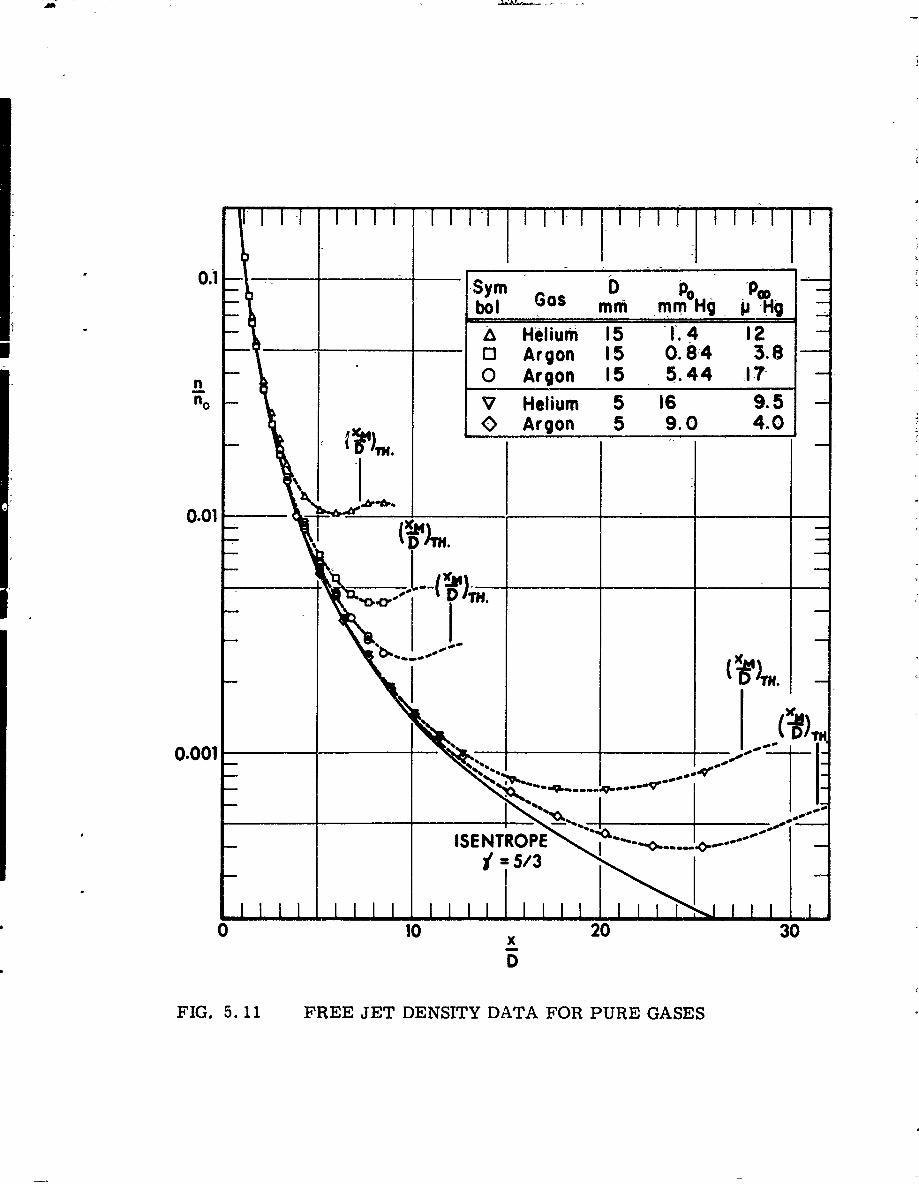
Sym b PPb~lGos mm mmHg p Hg
A__ _ Helium 15 1. 4 1203 Argon 15 0.84 3.8
n 0 Ar gon 15 5.44 -17-
no V Helium 5 16 9.5. Argon 5 9.0 4.0
0.01-
4 0
0.0 01 . .. . ,T
%% 10IS = /3 NTII I i-
0 10 x 20 30
FIG. 5.11 FREE JET DENSITY DATA FOR PURE GASES

Ob%
sa.c
* ___ iEE E
0 0
I 1& 0
N U)
%U
o\ 0
0N -
au 4 E E
0 0)
z 00 0
0 Z
22:3
00 0
InI
(dlf j~I .40 S.LINf) IN3uflD 300NV H31dwl4~OlOHd

f* 1.6t 1.0p :5.44torr 0 9.0 torr
p-l-micron p 4mcrofl
00
o 6T
0
z 6
f.:=0.125 f;:=0.125P. : 2.79 torr P. = 44.5 torrP. p: 10 micron P.0 = 17.5 micron
Reo: 840 Re0: 440FI.51zLWVSAIAINO OEO H REJT
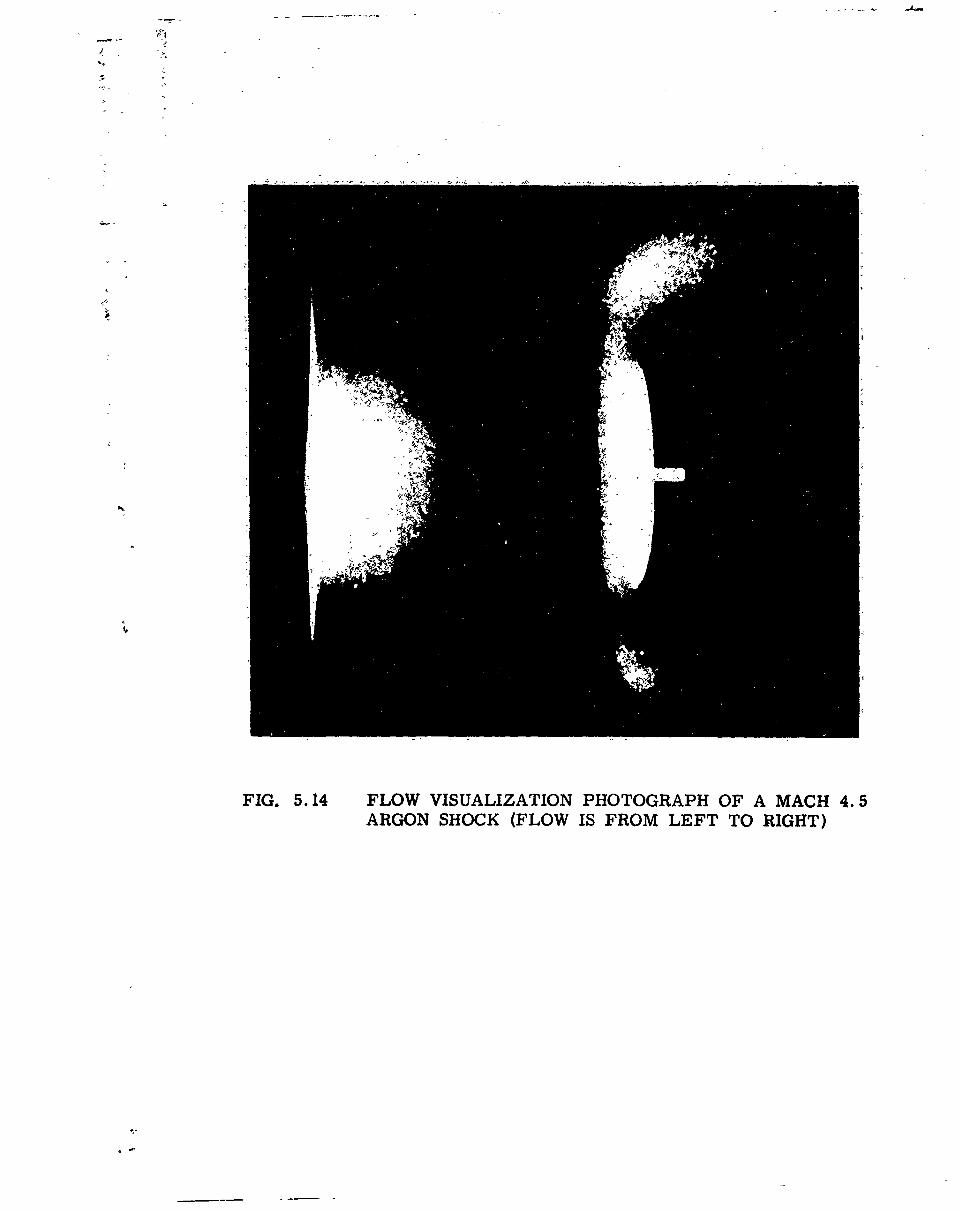
FIG. 5.14 FLOW VISUALIZATION PHOTOGRAPH OF A MACH 4.5ARGON SHOCK (FLOW IS FROM LEFT TO RIGHT)
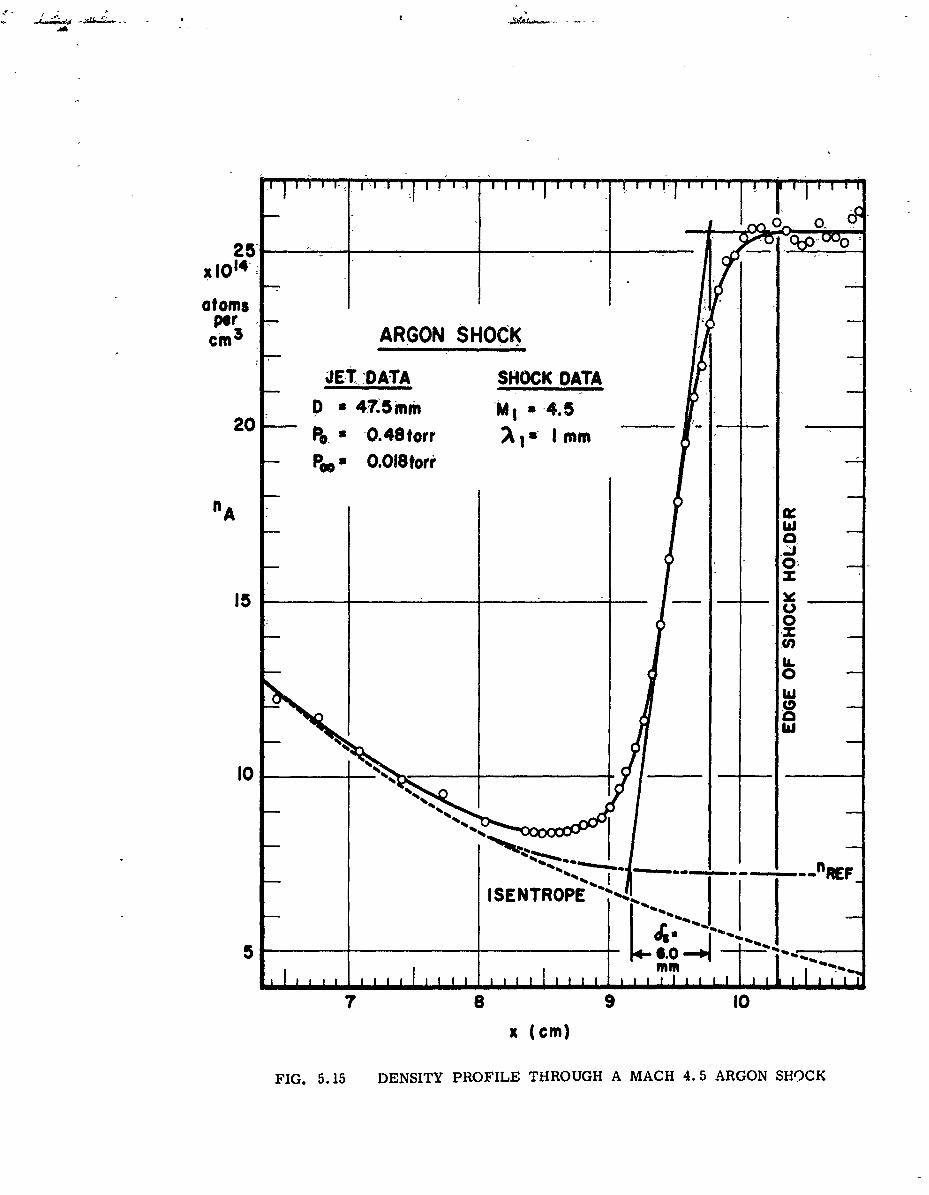
0 0-
X 1014 ,
atom'sI
cm3 ARGON SHOCK
J ET DATA SHOCK DQATAD a 47.5mm r V -4.5
20 pw a .48torr ~ mmPo O.Ol8torr
0w
10
ISENTROPE b
5 6.0_______ ___ " m
7 8 9 10x (cm)
FIG. 5.15 DENSITY PROFILE THROUGH A MACH 4.5 ARGON SHOCK

atoms Icm3 s
"HELIUM SHOCK
14 JETDATA SHOCK DATA-D a 15ram M,-a 8.5A ao" 1.90torr 4.1m
~AlPal. - ODi2Storr
12
. nH
I \
I, a
(0
I Ii.0
ISENTROPE % % RE
119m -
4 I I I I i I I I I I n I 1 ' L,4 5 6 7 8 9
x (cm)
FIG. 5.16 DENSITY PROFILE THROUGH A MACH 8.5 HELIUM SHOCK
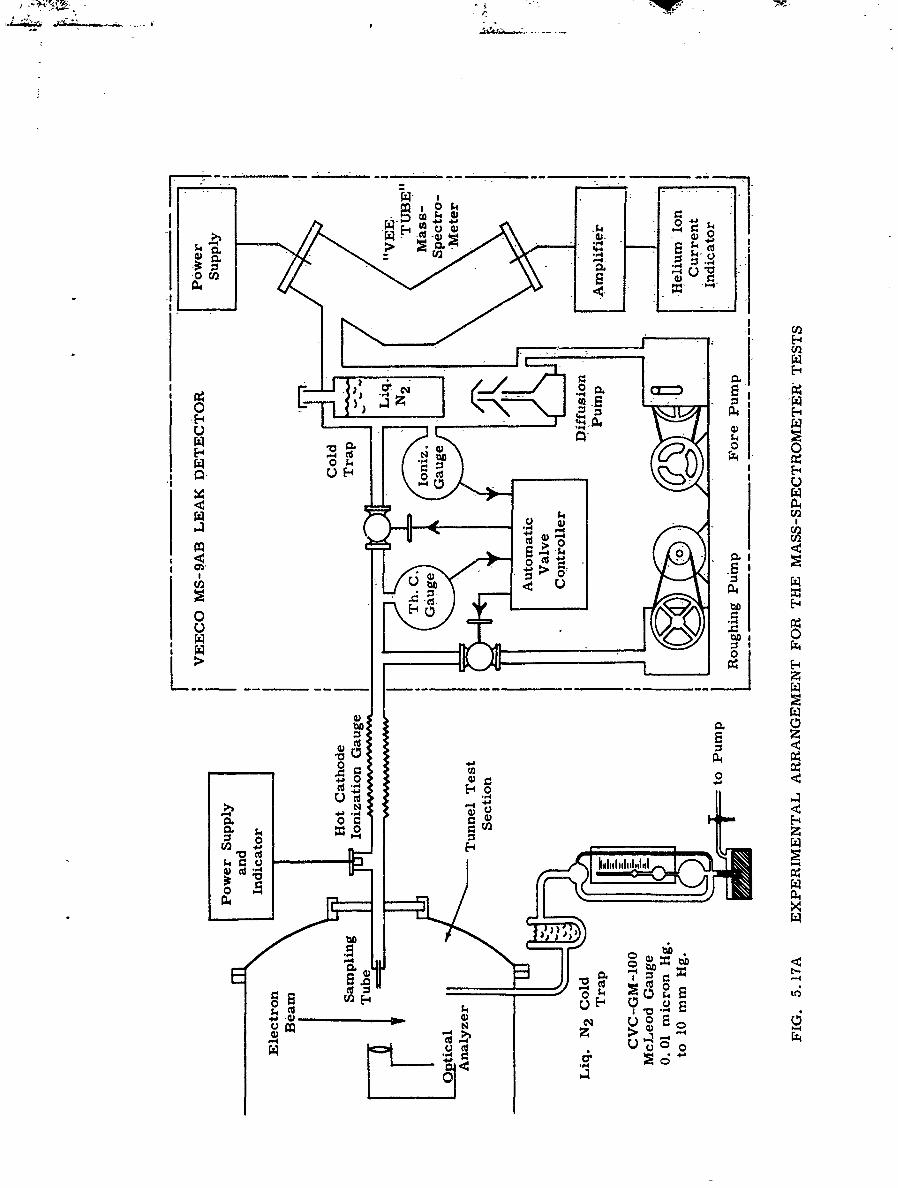
E C12
to 2. 0 N H
0 ;4
64U/
V/2
0U0[P4
z
.0 (a
cd E-44
0 b .0
-Vz

-A
To P6wl SuppLYPATENTED HEATED
'REPELLER GRID
-ELECTRON BEAM'-
GAS MOLECULES _ "
FROM TEST OBJECT
//ELECTRON POCUS PLATES
-TUNGSTEN FILAMENT
SLIT
ION FOCUS PLATES
/ -ION BEAM
PERMANENTMAGNET I /1111
LIGHT IONS
HELIUM IONS
BAFFLESTARGETSUPPRESSOR
ELECTROMETER TUBE
TO AMPLIFIER
FIG. 5.17B SCHEMATIC OF "VEE TUBE" MASS-SPECTROMETEROF THE VEECO MS-9AB LEAK DETECTOR(Reproduced from VEECO Leak Detector Manual)

.A-..-o.- I'~I -1 I I ! I~ - - I -
700 0rr- m ____
0
LATES 600
MENT
0
kTE$ 50
00
I --_
-L 300
z
_oE 200
tUBE_ _ _ _ _ __ _ __
: 300
0ItX
0 I I J InL I.J J
0 25 50 75 100
ER PH (pi Hg)
FIG. 5.18 LEAK DETECTOR CALIBRATION CURVE

4
tH
000 0
0 00
*O
0.3 0080
060
0 000
E
0
0 to a I inIn
is a a i s 0
0
-~ -T 0 0
Hd 3UdfSS3~d JLVA n~lI3H 3afld NI IVNDIS VdflI3HHd 3&fSS3~d -iviiuvd iLv VdflI3H SNINIV.LNOO Unifl±XVA NI IVNOIS VmflI13H
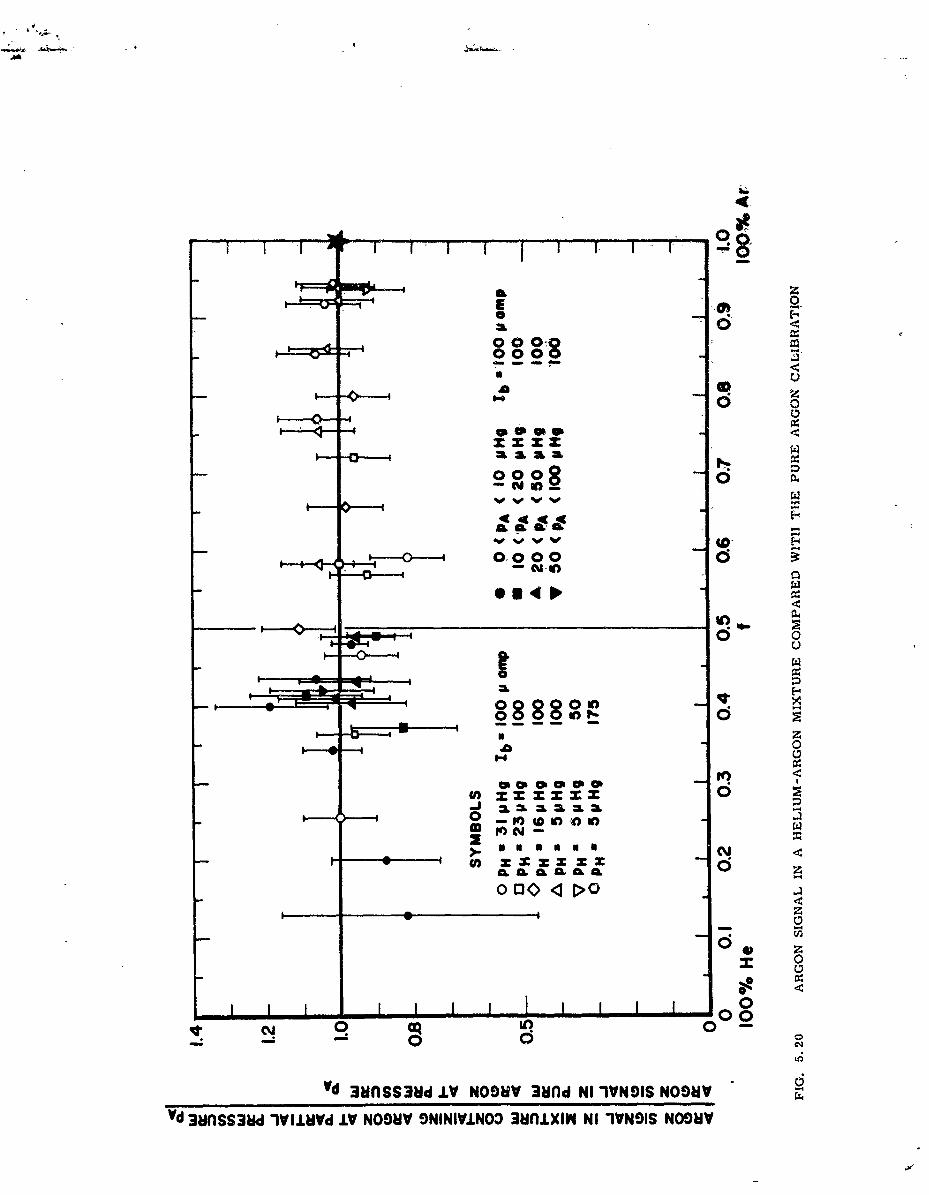
0 U,
0 010
0 o
CC.,
0 000
0 z
0Q8800C4
0 0
00
(I) Z ZZZZ
Wd3inS0dL NOV n N VNI 0DJ
Yd onS38 -II~i~dIVNOOVO INIIO nx I1NI O

- 44
0
U)z
o -4
0
o 0-
0 ~0 0_ _
000
0 0 0 0 0 0 0 J
vyndl*13H %

(1.0
nnnoo
.n.
J ULY 31,19 6 5 \*-*-
4o = 0. 05D z 47.5 mmPo z 0.220torr-
0.Ol~torrISENTROPE\Re.:z 127
0.021. \
0.1 x .
D
FIG. 7.1 PARTIAL DENSITY PROFILES ALONG THE AXIS OFA FREE JET FOR Re0 = 127 AND fo= 0. 05
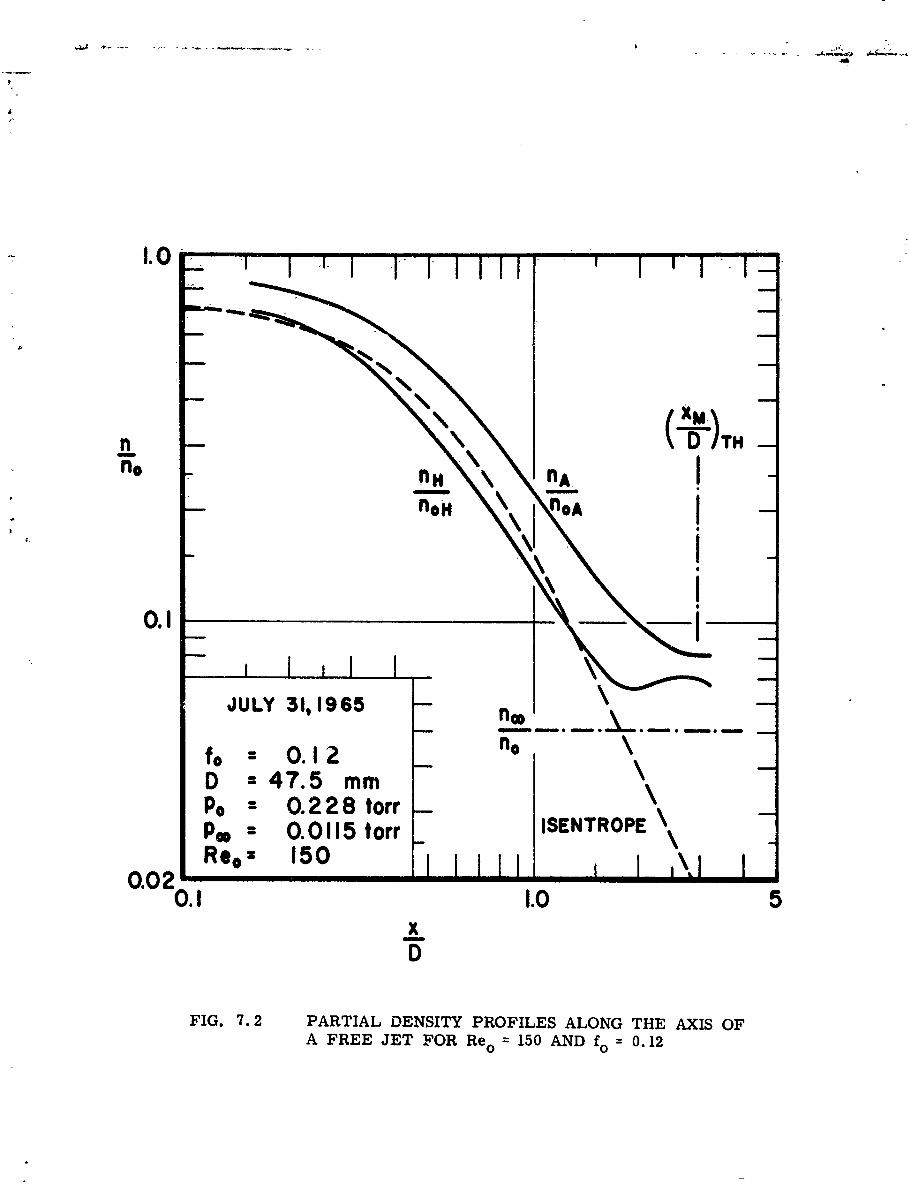
nD
nokn0
0.1
JULY 31,1965 n
D a 47.5 mmPo z 0. 2 28 torr SNRPPa a 0. 0115 torr SNRE
0.20.1 1.0 5xD
FIG. 7. 2 PARTIAL DENSITY PROFILES ALONG THE AXIS OFA FREE JET FOR Re0 150 AND fo= 0. 12
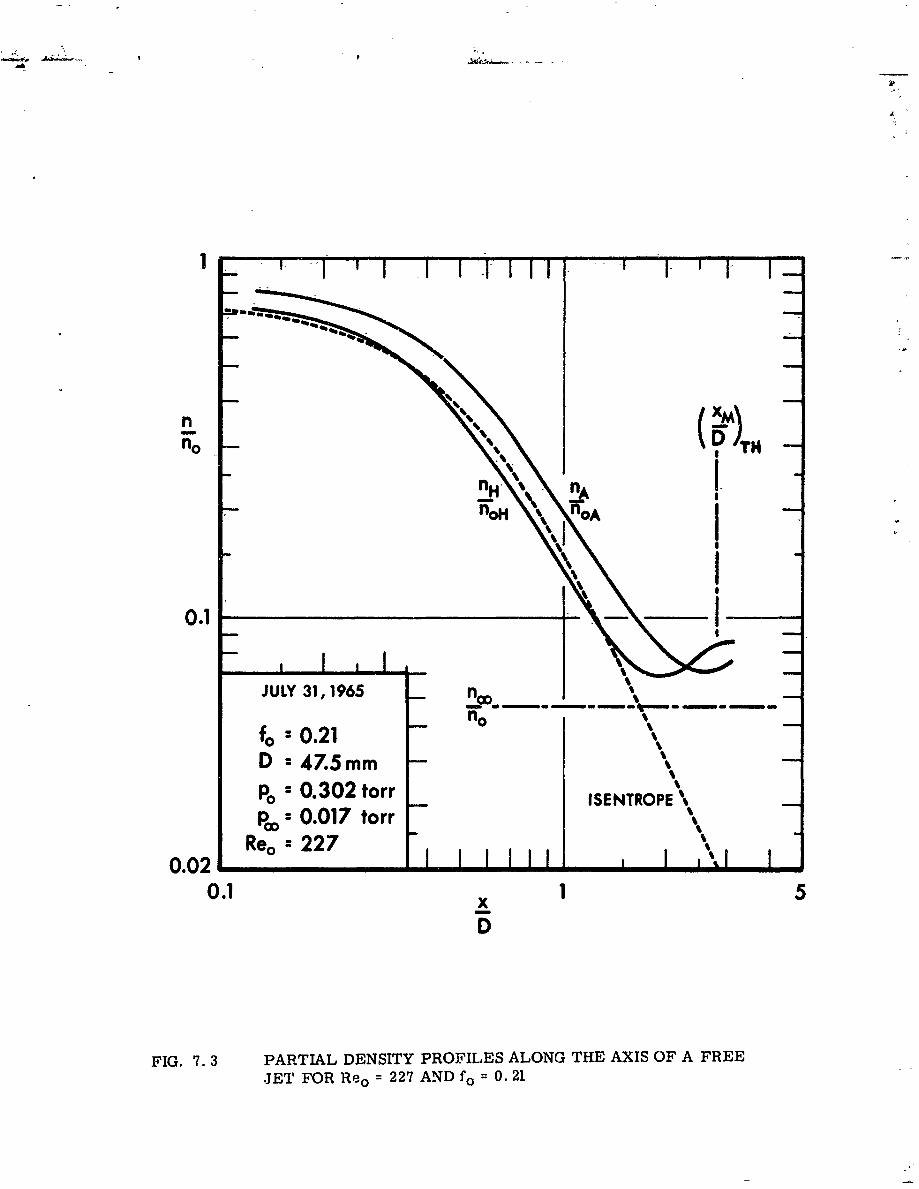
n %
0.1
J ULY 31, 1965 nl 0 -~
fo0.21 n
D :47.5mmP : 0.302 torr SNRP\
P 0.017 torr%Re0 :z22 7 \%t
0.0210.1 5
FIG. 7. 3 PARTIAL DENSITY PROFILES ALONG THE AXIS OF A FREEJET FOR Re0 = 227 AND fo = 0. 21

0.1
JULY 311 1965
:0.425 n
Po -- 0. 435 torr I E T O EPoo 0.OlTtorr IETOE
0.02 Re,. 4 14 j j.0.1 1.0 5
x
IFIG. 7. 4 PARTIAL DENSITY PROFILES ALONG THE AXIS OF-A FREE JET FOR Ro= 414 AND fo= 0. 425

nno
0.1 JULY 6,1965 A
fo :0.12 5no%D :15mm \
Pox2.56 torr % ENTOE
p 0 0.017 torr%
Re : 533 %1.
0.2 1 x10
FIG. 7. 5 PARTIAL DENSITY PROF ILES ALONG THE AXIS OF A FREEJET FOR Roo = 5:33 AND f0 = 0. 12
*=
VJ
0! -
*o
0.1I
nI
wo X
JULY 701965
fo 0.425D 15 mmP. x 2.79 torr noPe : 0.20torr ISENTROPERe.= 840 w I itI NJ
0.002 I z 8400.2 1.0 10
D
FIG. 7.6 PARTIAL DENSITY PROFILES ALONG THE AXIS OFA FREE JET FOR Re o = 840 AND f 0 0.425
0.1 (-- )THN
0.01
O.O m
D T11- . .--nH
0.001_ H_
- IJ I .. . -JULY 8, 1965 -- no
fo = 0.12 nAD = 5 mmP 29.7 torr \ISENTROPEPoo = 0.0185 torr\Reo a 20600.00 2 JILL i.iI
10 100xD
FIG. 7.7 PARTIAL DENSITY PROFILES ALONG THE AXIS OFA FREE JET FOR Re o = 2060 AND fo = 0.12

0.1I
Al000.01
m~ Mm
ItI
0.001
JULY S,1965 no"
fo = 0.425D 5 mm nop . 29.7 torr _\nA.npa 0. 012torr ISENTROPE \ noARe ' 3000 1i 0.002 I 0
I10 100
FIG. 7.8 PARTIAL DENSITY PROFILES ALONG THE AXIS OFA FREE JET FOR Re o x 3000 AND fo - 0.425
0
Flo0
(44
0
.0 ~ ~ op 0.
ft 0z -
10: 0lo z
Fm qtIt
040 inP
- o0U 0
(0 qt 0 in
9,;e 01
/0(D 000
N0 0 0
00
w10 0 0
0E >
(0___o(0
N
0~ 10
_ _ _ ___ 0 0
0N
to 0-
H-
_l 0 0 0
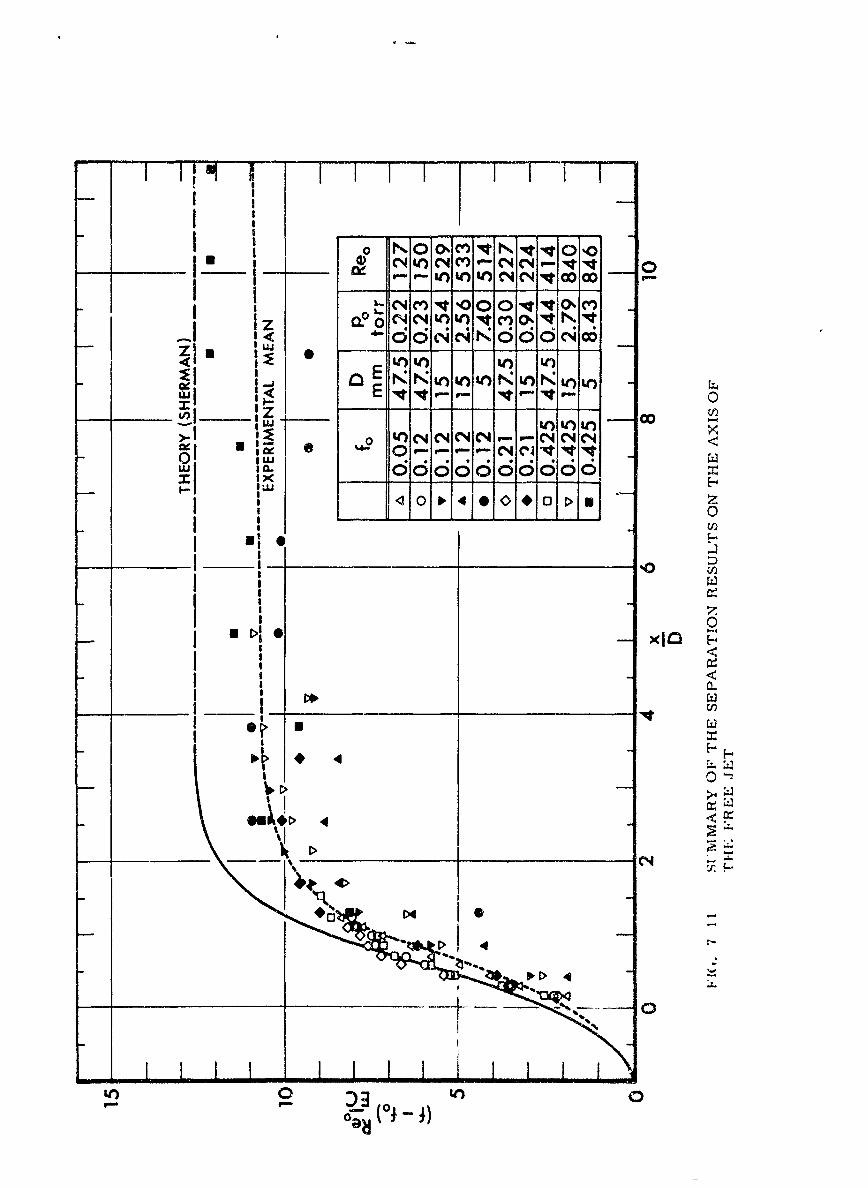
TFIO o. I v N Iq 4 FT0
NI.M- N v 0
E ~ ~ f tn n ) f )E r0'W n ) C
:: nC4NWix 00 0 0 0 0 0 0 0 0 0 04
LIua ;6 6 6 6I XE-
- 0 ~O ~ o m
1 0
i1.0
N0
It)) E0
U-)
(01 - I

I 1 11
\1 C1249c~ ~ I CC*
/r
I If) a

gT,0
0
0 Q
.44
Zz
It
5 04.,o
0 mCY)
0 LO
0
-2;0 0
Ile, u
0
CV)
rzf

cne
0C;
0coQtO.
.~ 4p,
Qf)
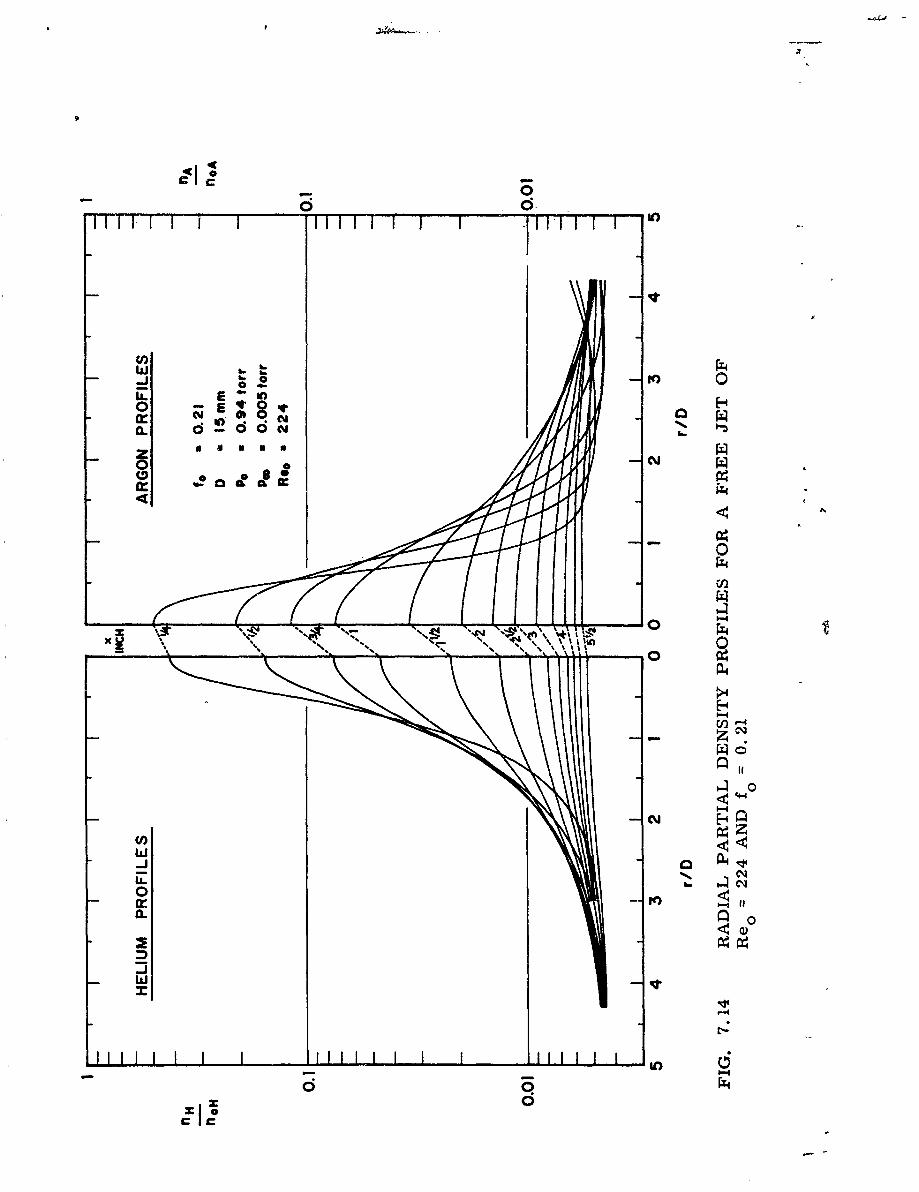
U) bw
0'E~b
0 E 28
00(9)irz
0-02
-4
C14- ZC%
II,
MN
00
w 1
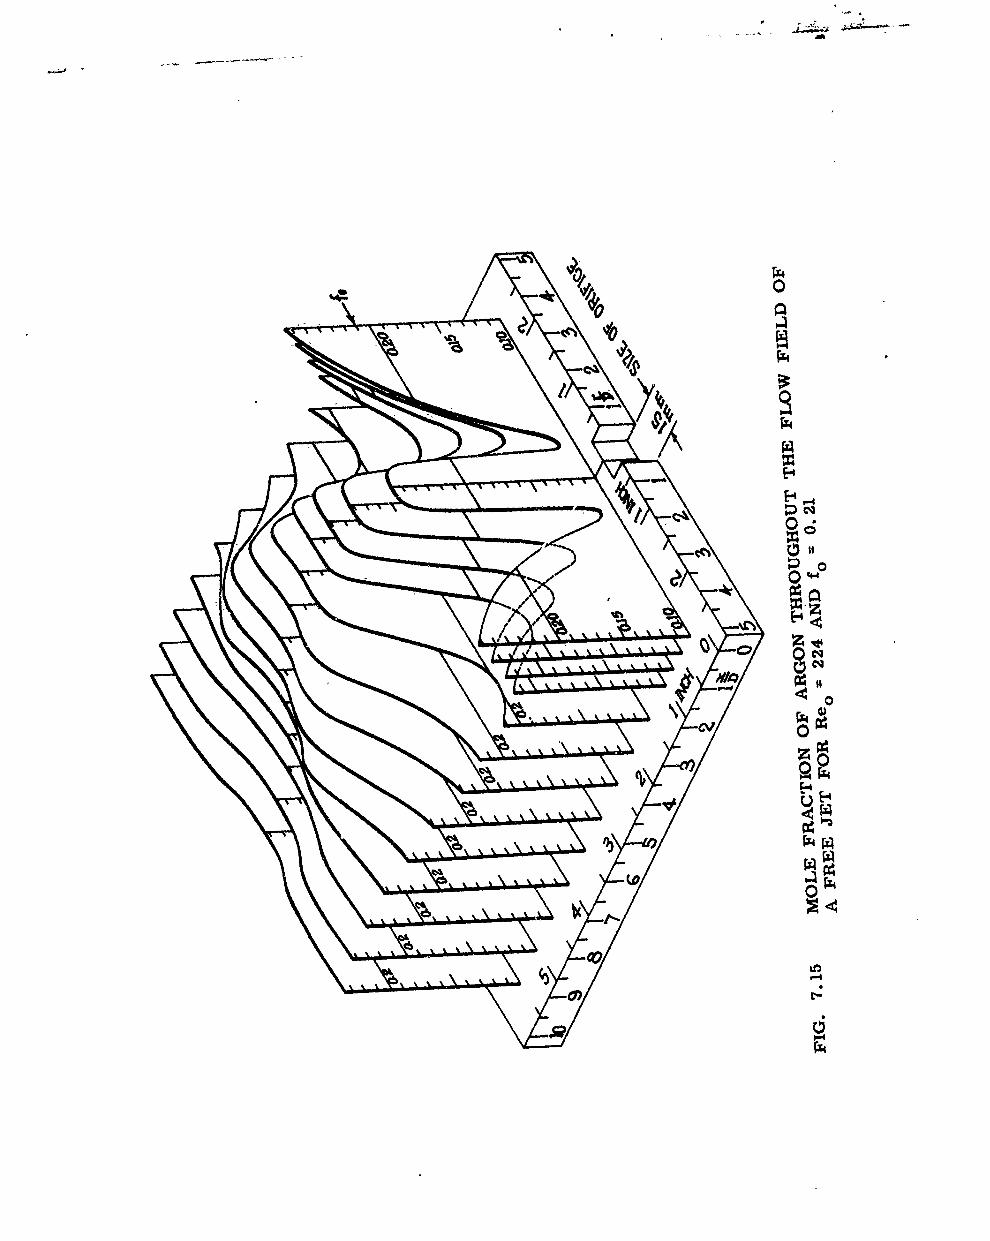
700
44z
E-4
Cz4

FIG. 8.1 FLOW VISUALIZATION OF A SHOCK WAVE IN
FRONT OF THE SHOCK HOLDER (fo = 0.49, M1 0 9)
I
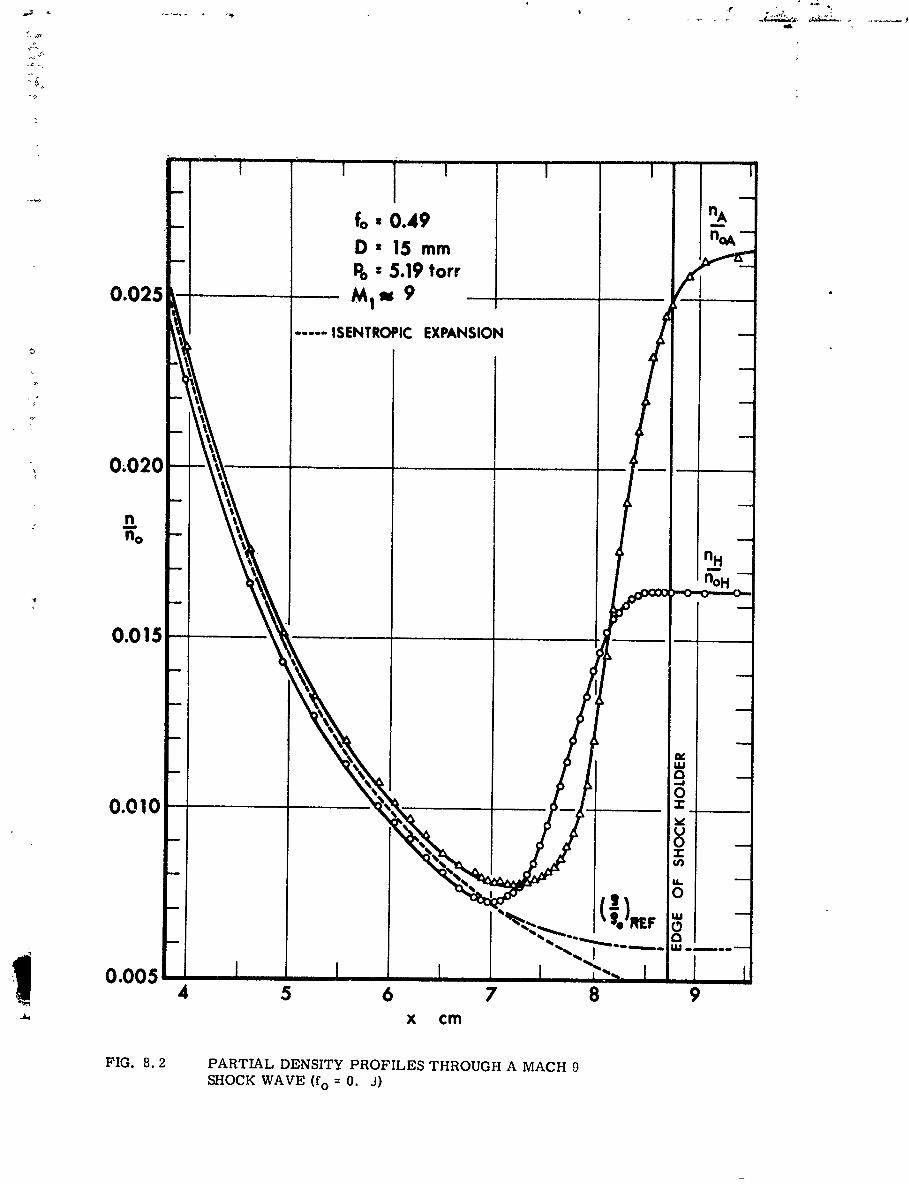
fo x 0.49 nA
D a15 mmPo" 5.19 torr
0.025 M.u9 ft9
---- ISENTROPIC EXPANSION
'2 I,0.020
nno
I ni
0.015
Lu
0
% -0
0.005 rrn-,.I
456 7 8 9x cm
FIG. 8.2 PARTIAL DENSITY PROFILES THROUGH A MACH 9SHOCK WAVE (fo = 0. J)

II - ! /
0.05 f. 0.11D: 15mm A
p: 2.79 torr noA
M, =8.7
------ ISENTROPIC EXPANSION
0.04 - _ _ _ _ _ _ _ _ _ _ _ _ _ _ _ _
nno
Lu0.03 ,
0II
LL
/0.4j
0.02 u,
\ u
0.01 - . .
-- ""-._ ~ ~ .- - ...... I l .
4 5 6 7 8 9x cm
FIG. 8.3 PARTIAL DENSITY PROFILES THROUGH A MACH 8.7SHOCK WAVE (fo = 0. 11).

0.10 1 __ ~00I D:15 mmPo0 1.95 torrM, vi8.5
---- ISENTROPIC EXPANSION U.0 A
0.08
n,
0.06 _ _
0.04 ----
0.02 H
0 2 46 810x cm
FIG. 8. 4 PARTIAL DENSITY PROFILES THROUGH A MACH 8.5SHOCK WAVE (fo = 0. 01)

F -
0.60
fo = 0.49
D=I5 mmp. = 5.19 torrMm 9
0.550
0C')
FREEJET THQRY 0o
00.50 - -0fo .. .
0.45
~I L Li ,, I in0 2 4 6 8 10
x (cm)
FIG. 8.5 MOLE FRACTION OF ARGON THROUGHOUT SHOCKWAVE (fo = 0.49, M1 - 9)

.................
f. z 0.11D =15mm
0.25 P = 2.79 torrM1 8.7
f
0.20
w0
-J
0
xco
0.15 U.0
FREE JET THEORY w-- o---- --- --- .. .0
0.10
0 2 4 6 8 10
x (cm)
FIG. 8.6 MOLE FRACTION OF ARGON THROUGHOUT SHOCKWAVE (fo = 0.11, M 1 8.7)
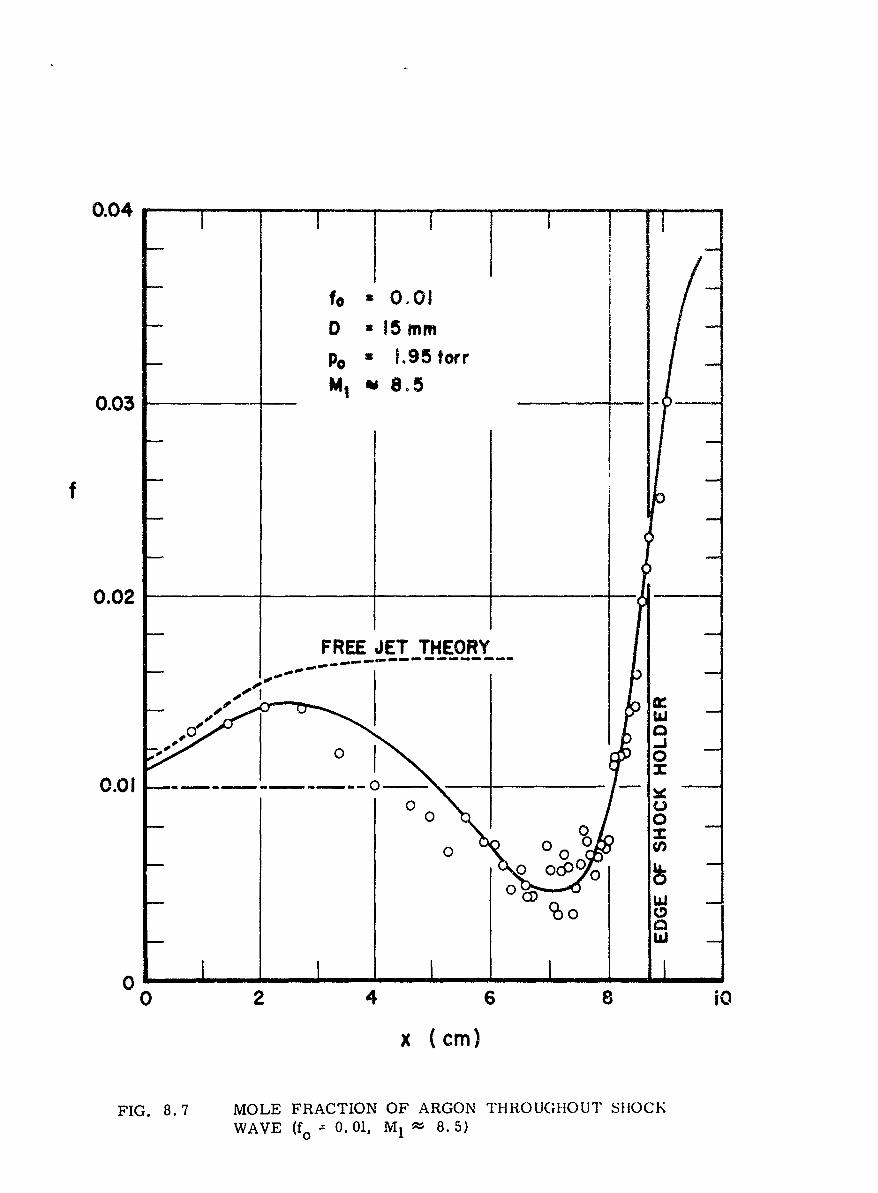
0.04 I [
to a 0.01
p0 x 1.95 torr
0.03 __ __ to 8.5
0.02 1-FREE JET THEORY
w
00
00
0 x
000
0 2 4 6 8 io
x (cm)
FIG. 8. 7 MOLE FRACTION OF ARGON THROUGHOUT SHIOCKWAVE (fo - 0. 01, M1 'Ze 8. 5)
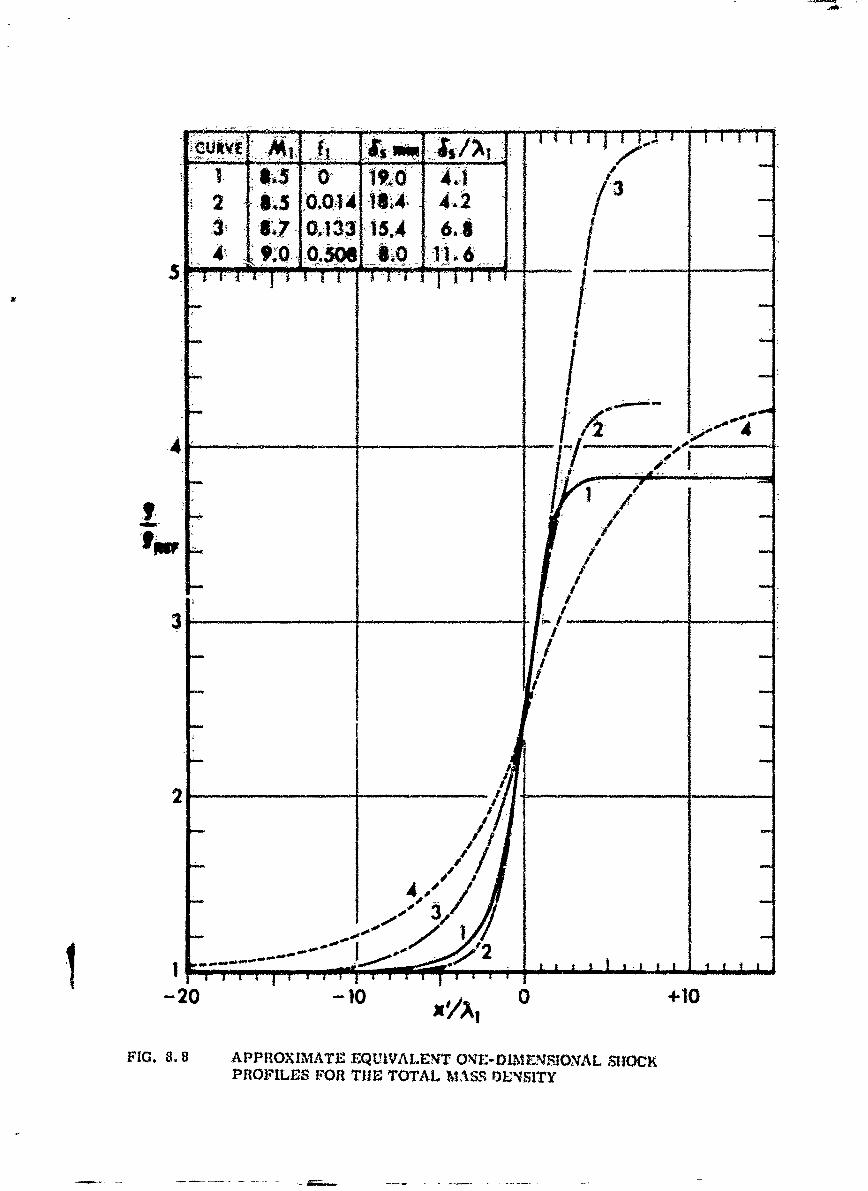
0103 ,7To"3 it'd4.1s2 "6014 IA 42,
l 1 66
iw I
22
: #I
_ //
2 /
-20 -10 0 +10
FIG. 8. 8 APPROXIMATE E"QUIVALENT OE-DIME$SIQOAL SOCKPROFILES FOR THE TOTAL MASS DENTSITY
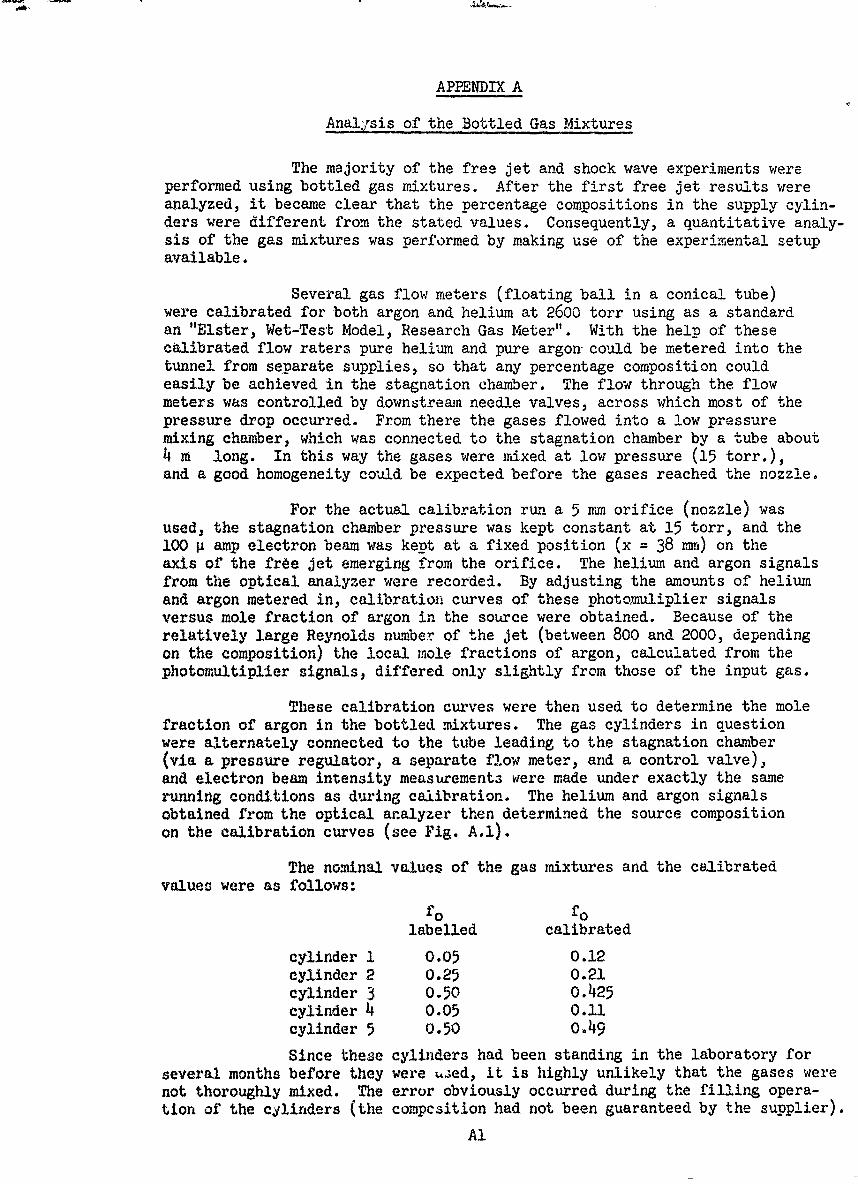
APPENDIX A
Analysis of the Bottled Gas Mixtures
The majority of the free jet and shock wave experiments wereperformed using bottled gas mixtures. After the first free jet results wereanalyzed, it became clear that the percentage compositions in the supply cylin-ders were different from the stated values. Consequently, a quantitative analy-sis of the gas mixtures was performed by making use of the experimental setupavailable.
Several gas flow meters (floating ball in a conical tube)were calibrated for both argon and helium at 2600 torr using as a standardan "Elster, Wet-Test Model, Research Gas Meter". With the help of thesecalibrated flow raters pure helium and pure argon could be metered into thetunnel from separate supplies, so that any percentage composition couldeasily be achieved in the stagnation chamber. The flow through the flowmeters was controlled by downstream needle valves, across which most of thepressure drop occurred. From there the gases flowed into a low pressuremixing chamber, which was connected to the stagnation chamber by a tube about4 m long. In this way the gases were mixed at low pressure (15 torr.),and a good homogeneity could be expected before the gases reached the nozzle.
For the actual calibration run a 5 mm orifice (nozzle) wasused, the stagnation chamber pressure was kept constant at 15 torr, and the100 p amp electron beam was kept at a fixed position (x = 38 mnr) on theaxis of the free jet emerging from the orifice. The helium and argon signalsfrom the optical analyzer were recorded. By adjusting the amounts of heliumand argon metered in, calibration curves of these photomuliplier signalsversus mole fraction of argon in the source were obtained. Because of therelatively large Reynolds number of the jet (between 800 and 2000, dependingon the composition) the local mole fractions of argon, calculated from thephotomultiplier signals, differed only slightly from those of the input gas.
These calibration curves were then used to determine the molefraction of argon in the bottled mixtures. The gas cylinders in questionwere alternately connected to the tube leading to the stagnation chamber(via a pressure regulator, a separate flow meter, and a control valve),and electron beam intensity measurements vere made under exactly the sa-merunning conditions as during calibration. The helium and argon signalsobtained from the optical analyzer then determined the source compositionon the calibration curves (see Fig. A.1).
The nominal values of the gas mixtures and the calibratedvalues were as follows:
fo folabelled calibrated
cylinder 1 0.05 0.12cylinder 2 0.25 0.21cylinder 3 0.50 o.425cylinder 4 0.05 0.11cylinder 5 0.50 0.49
Since these cylinders had been standing in the laboratory forseveral months before they were ued, it is highly unlikely that the gases werenot thoroughly mixed. The error obviously occurred during the filling opera-tion of the cjlinders (the compcsition had not been guaranteed by the supplier).
Al
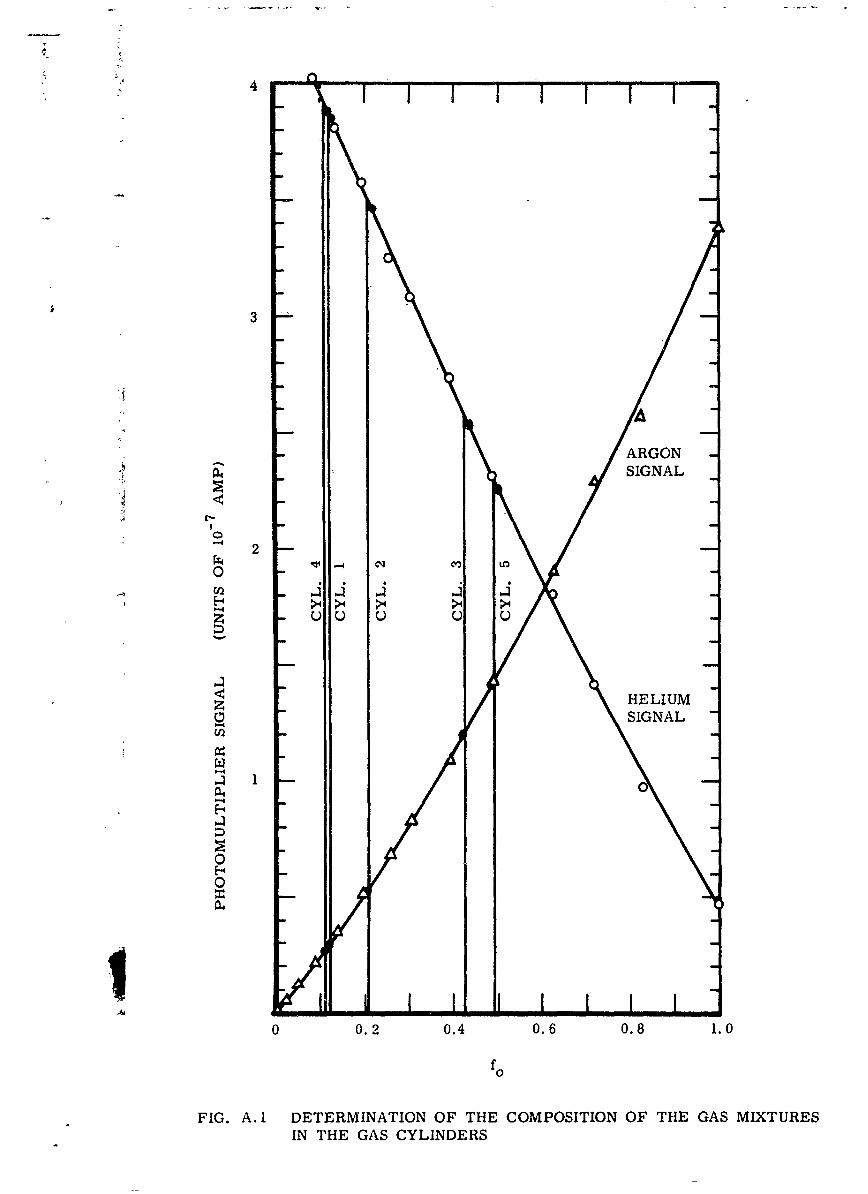
p
4
3-
ARGONSIGNAL
2
HELIUMzSIGNAL
oo
0,-1 0HELIUM
0 0.2 0.4 0.6 0.8 1.0
fo
FIG. A. I DETERMINATION OF THE COMPOSITION OF THE GAS MIXTURESIN THE GAS CYLINDERS
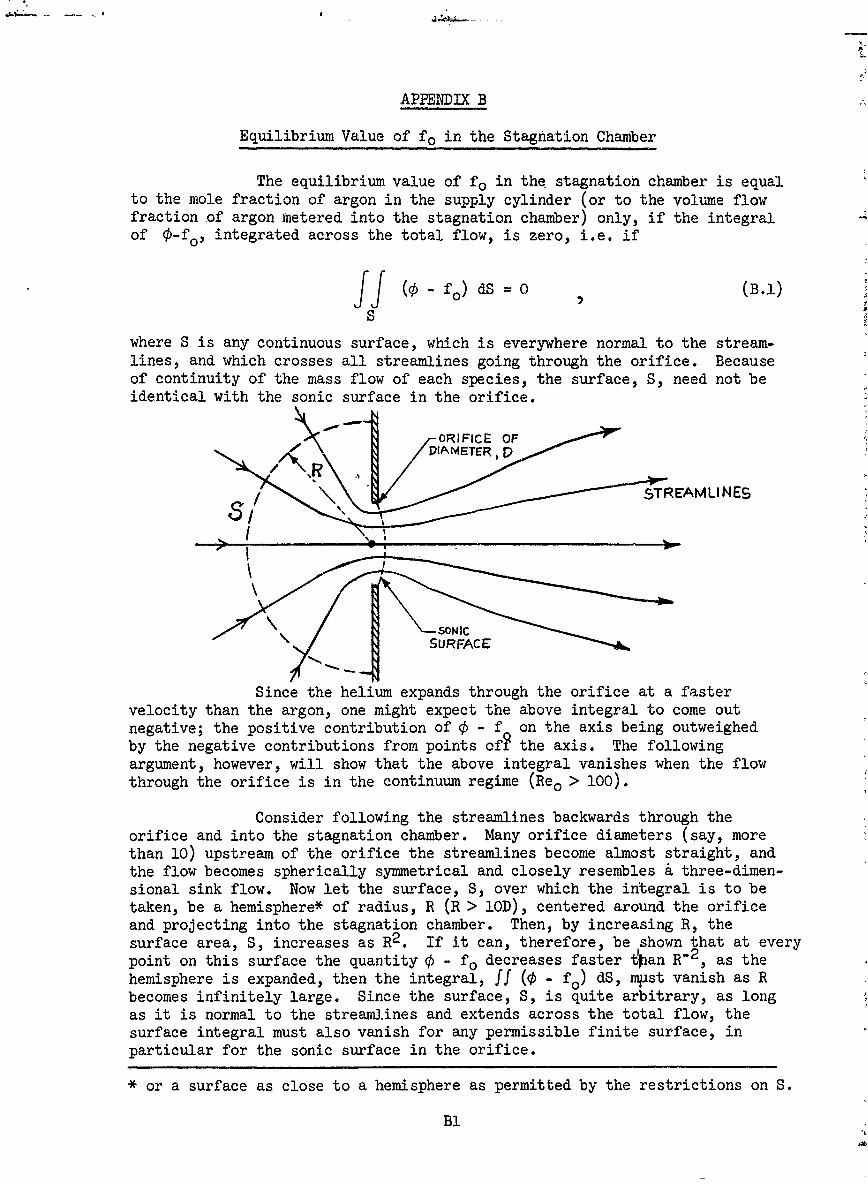
APPENDIX B
Equilibrium Value of fo in the Stagnation Chamber
The equilibrium value of fo in the stagnation chamber is equalto the mole fraction of argon in the supply cylinder (or to the volume flowfraction of argon metered into the stagnation chamber) only, if the integralof 0-fo' integrated across the total flow, is zero, i.e. if
ff (0 - fo) dS =0 (B.1)
S
where S is any continuous surface, which is everywhere normal to the stream-lines, and which crosses all streamlines going through the orifice. Becauseof continuity of the mass flow of each species, the surface, S, need not beidentical with the sonic surface in the orifice.
ORIFICE OF
DIAM ETER, 0
SSTREAMLINES
\ SURFACE
Since the helium expands through the orifice at a fastervelocity than the argon, one might expect the above integral to come outnegative; the positive contribution of 0 - f on the axis being outweighedby the negative contributions from points of? the axis. The followingargument, however, will show that the above integral vanishes when the flowthrough the orifice is in the continuum regime (Re0 > 100).
Consider following the streamlines backwards through theorifice and into the stagnation chamber. Many orifice diameters (say, morethan 10) upstream of the orifice the streamlines become almost straight, andthe flow becomes spherically symmetrical and closely resembles a three-dimen-sional sink flow. Now let the surface, S, over which the integral is to betaken, be a hemisphere* of radius, R (R > lOD), centered around the orificeand projecting into the stagnation chamber. Then, by increasing R, thesurface area, S, increases as R2 . If it can, therefore, be shown that at everypoint on this surface the quantity 0 - fo decreases faster 1 an R-2 as thehemisphere is expanded, then the integral, ff (0 - fo) dS, nust vanish as Rbecomes infinitely large. Since the surface, S, is quite arbitrary, as longas it is normal to the stream.ines and extends across the total flow, thesurface integral must also vanish for any permissible finite surface, inparticular for the sonic surface in the orifice.
* or a surface as close to a hemisphere as permitted by the restrictions on S.
B1

That # - fo decreases at a faster rate than R-2 for increasingR can be shown for the flow close to the axis by considering Eq. (16) of Ref.8. This equation is,
5 - 37
Re° (i 72 2(7-1)( -fo)Ec(f.1) = (M-l)yl+ -M} d7 5 (B.2)
_______ 2 Y-(V1 ~2(2J)(3 + 142-) (1 + Y-1 M ) )dx2 . . M 2 M2)
For R > IOD the flow is in the low speed subsonic regime, andthe gas behaves as an incompressible fluid. Therefore, the Mach number be-comes simply proportional to the flow velocity, which, according to the con-tinuity equation, is inversely proportional to the flow area. Hence, asR -+c (or x -+- oo), the Mach number functions occurring in Eq. (B.2) approachzero in the following way:
M decreases proportionally to (21R2)-I; sayk
M =- . where k is a constant.R2
ThenM4 dM 2k
dx dR R,3
and 2 4k2
and Rk
f)dx=( )R - 3 R,3
Equation (B.2) then becomes of the following form for R - *c.
Reo 2k + 2k _
o EC(Y-l) R3 R3
The two terms in Eq. (B.2) individually decrease as R-3 asR *-*o . Furthermore, the two terms become exactly equal and opposite insign in the limit. It can, therefore, be said, that f - 00 near the axisgoes to zero faster than R-3 for R becoming large. Because of the sphericalsymmetry of the flow at large R, it is unlikely that the behaviour of 0 - focan be much different from the axial behaviour in regions away from the axis.
From the above arguments it can be concluded that Eq. (B.1) issatisfied, provided the Reynolds number, Reo, is large (say, Reo > 100). Thelatter is the basic assumption underlying Eq. (B.2)
This means that, under these conditions, the number flow ratesof argon atoms and helium atoms through the orifice are of the same ratio asthe corresponding mole fractions in the stagnation chamber. Hence, the equili-brium value of fo in the stagnation chamber is equal to the volumetric argonflow fraction metered into the tunnel, which in turn is equal to the mole frac-tion of argon in the supply cylinder.
B2* .

APPENDIX C
Relative Thickness of the Mach Disc in a Pure Gas
In order to estimate the Mach disc thickness in terms of thejet Reynolds number and the jet pressure ratio across the orifice, it is firstnecessary to find the state of the gas in front of the Mach disc as a functionof the stagnation chamber conditions and the ambient pressure, p, . A goodestimate of the Mach number, M1, in front of the Mach disc can be obtainedby making the following two assumptions:
(1) The gas flowing along the axis of the free jet expands isentropicallyup to the Mach disc, then compresses to a pressure P2 > p through a normalshock wave.
(2) The pressure behind the Mach disc is simply related to the ambientpressure, such that P2 = C(7)pD , where E(7) is independent of po/p. .
If M1 were known, the static pressure in front of the Machdisc would then be given by the isentropic relation.
PO + -i M?)/(7-l) (0.1)Pl2 •C1
p1The pressure p1 is related to P2 by the Rankine-Hugoniot
relations for a normal shock.
p2 27M, 2 - 7 + 1 E _(7) p(2
p1 7 + p (C.
Dividing Eq. (C.1) by Eq. (C.2) an explicit relation is obtainedfor the orifice pressure ratio required to achieve a Mach number, M1 , in frontof the Mach disc.
E) 1M+ 2 7/i(7l)Po C 2 M )j(0.3)
PO 27M - 7 + 1
Alternately, knowing the jet pressure ratio, M1 can be obtain-ed from this equation. But an accurate value of M1 can also be found inde-pendently from Wolff's calculations (Ref. 13) combined with the semi-empiricalMach disc location, given by Eq. (1) of the main text. The M1 values obtain-ed from Eq. (C.3), in the range Ml > 4, can be brought into good agreementwith those given by the characteristics solution of Wolff and Eq. (1), bysimply assuming that :7+ 1
E(7) = 2 (C.4)
There exists no direct justification for this assumption, except that itfacilitates fitting Eq. (C.3) to the calculations of Wolff.
It is now possible to combine Eqs. (C.3) and (c.4) with Eq.(1) in order to obtain a semi-empirical relation for the axial variation ofMach number in the free jet. The result is,
Cl
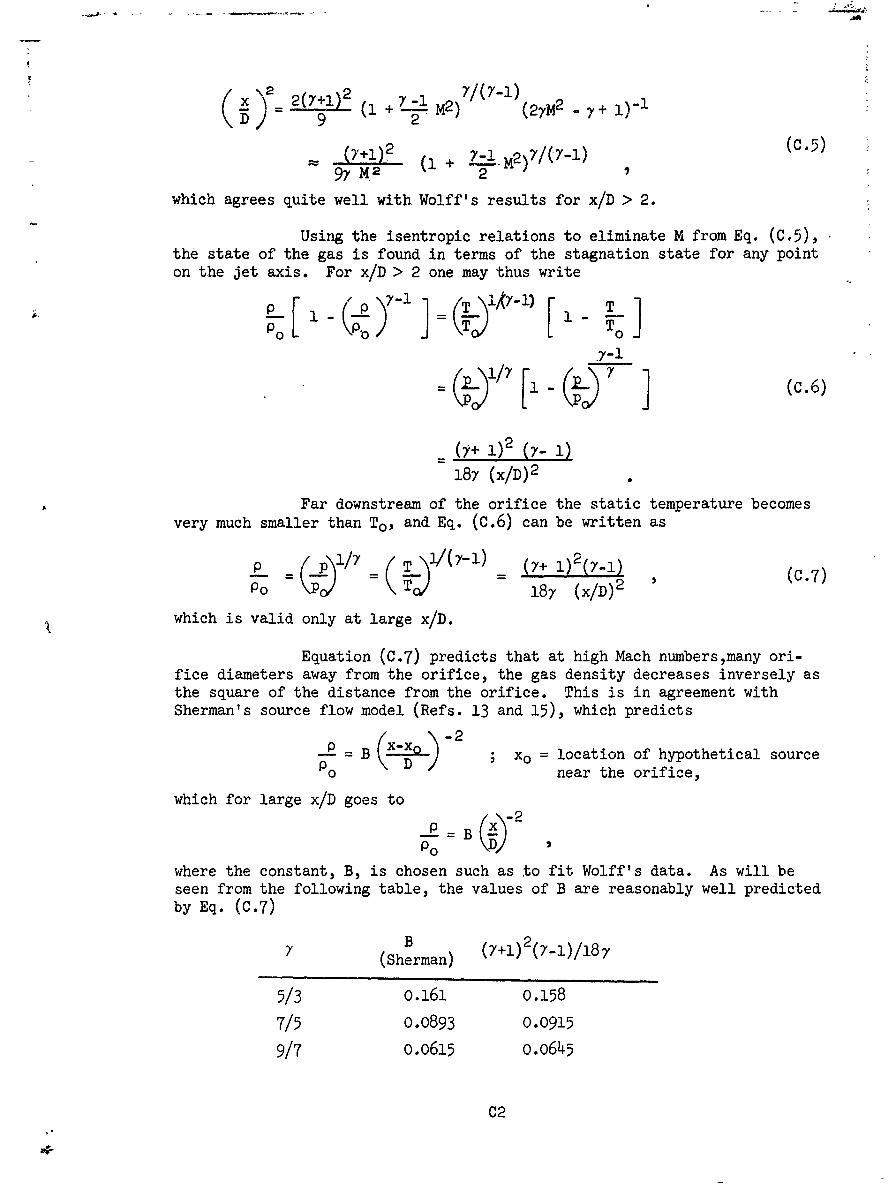
x M2) (2yM2 y + ) -1
D9 2
(9+1M2 (1+ c5)
which agrees quite well with Wolff's results for x/D > 2.
Using the isentropic relations to eliminate M from Eq. (c.5),the state of the gas is found in terms of the stagnation state for any pointon the jet axis. For x/D > 2 one may thus write
.Y-l ]_ I) (C.6)
(1+ 1)2 (7- 1)
18Y (x/D)2
Far downstream of the orifice the static temperature becomesvery much smaller than To, and Eq. (C.6) can be written as
S( i/y = ( T=() (7+ 1)2(7.1) (C.7)
_c T "18y (x/D)2
which is valid only at large x/D.
Equation (C.7) predicts that at high Mach numbers,many ori-fice diameters away from the orifice, the gas density decreases inversely asthe square of the distance from the orifice. This is in agreement withSherman's source flow model (Refs. 13 and 15), which predicts
P -B (X-Xo xo = location of hypothetical source
O D near the orifice,
which for large x/D goes to
where the constant, B, is chosen such as to fit Wolff's data. As will beseen from the following table, the values of B are reasonably well predictedby Eq. (C.7)
7 B (y+1)2( _1)/18Y(Sherman)
5/3 0.161 0.158
7/5 0.0893 0.0915
9/7 0.0615 o.o645
C2
The Mach disc thickness can now be estimated using Eq. (C.7),if it can be assumed that xM/D is large. In this case M1 is of the orderof 10 or larger. Experimental shock thicknesses in this range are aboutequal to 4.5 mean free paths ahead of the shock (see e.g. Ref. 34). There-fore, let the Mach disc thickness be
5:4.5 l • (M.)
But, 16 1? i =T L/pl a, (14)
Therefore, 72
5 411- iyP 1 a1
=72 Re _1 4±% )(a /aj)(p/p)D.
Using now Eq. (C-7) and pjo (T1/T 0)v , this equation can be re-written as1
= 1296 y3/2 Re 1 (T ) a 2 /X )XM 5F2-r (y+1) 2(y-i) Re- I T oo
Substituting Eq. (i) and assuming v = 1/2 the relative Mach disc thicknessbecomes
6= Re3/2 -1 (Po )1/2 .
XM (+1) 2 ( 0) (13)
C3
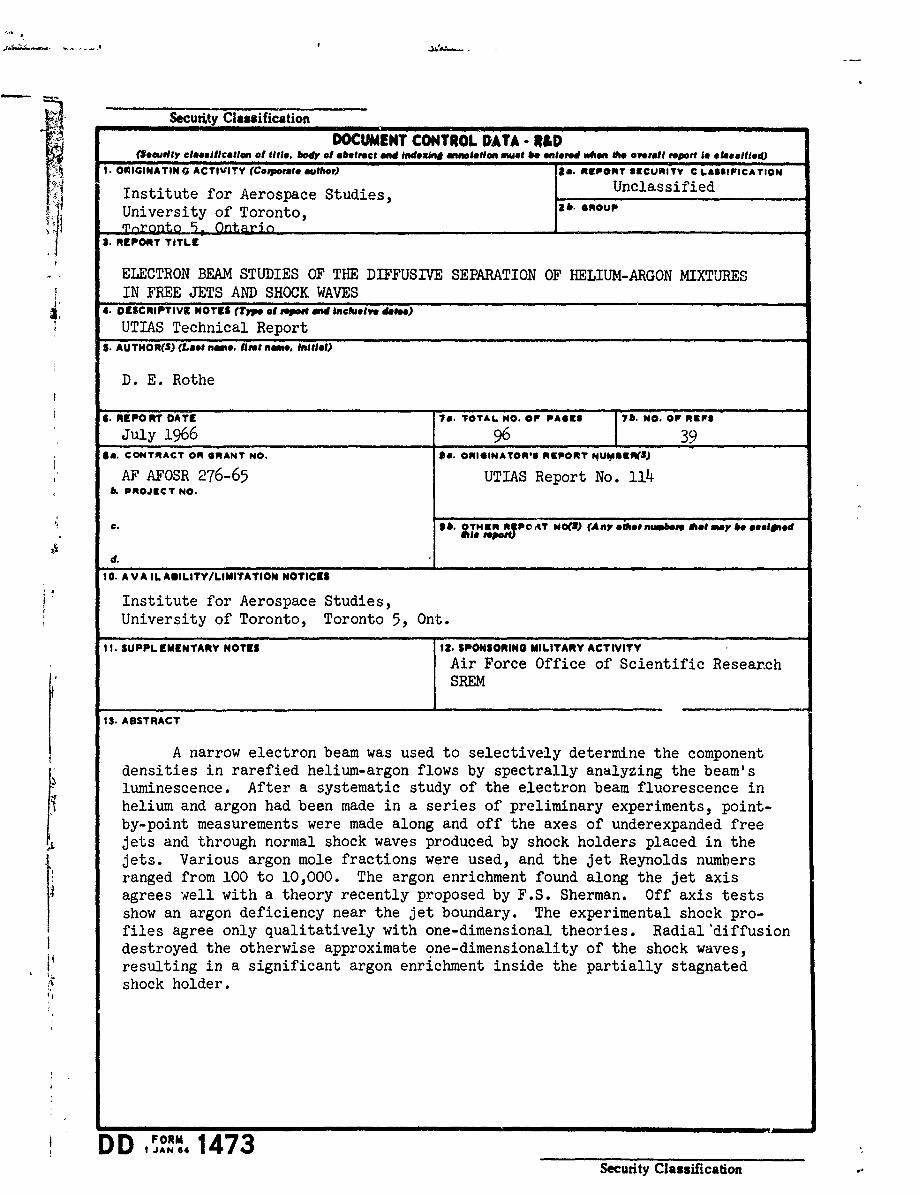
.j Security Classificationi DOCUMENT CONTROL DATA - IMP
(Socurity classification of fill*. body of abstract and indexing annotatio must 60 OntoNN rld doo hoW1 0130d or is Olosailigot)
A I. ORIGINATING ACTIVITY (Corpot author) Ila. REPORT SECURITY C &.&iSIFICATION
Institute for Aerospace Studies,University of Toronto, z.6op
* ' nronto 5. Ontario
3. REPORT TITLE
ELECTRON BEAM STUDIES OF THE DIFFUSIVE SEPARATION OF HELIUM-ARGON MIXTURESIN FREE JETS AND SHOCK WAVES
4. DESCRIPTIVE NOTES (Type of oport and Inclusive doe)
UTIAS Technical ReportS. AUTHOR(S) (Last nae, first nano. initial)
D. E. Rothe
I. REPORT DATE I*. TOTAL NO. OF PAGES 76.'NOF REFS
July 1966 961 39Sa. CONTRACT OR GRANT NO. 98. ORIGINATOR'S REPORT NUIIIER(S)
AF AFOSR 276-65 UTIAS Report No. 114b PROJECT NO.
C. 9b. ITH.R,.P0AT woel) (Any oihgenumte Abotay b a1,.d
d.
10. A VA IL A@ILITY/LIMITATION NOTICES
Institute for Aerospace Studies,University of Toronto, Toronto 5, Ont.
II. SUPPLEMENTARY NOTES 12. SPONSORING MILITARY ACTIVITYAir Force Office of Scientific Resear.chSREM
13. ABSTRACT
A narrow electron beam was used to selectively determine the componentdensities in rarefied helium-argon flows by spectrally analyzing the beam'sluminescence. After a systematic study of the electron beam fluorescence inhelium and argon had been made in a series of preliminary experiments, point-by-point measurements were made along and off the axes of underexpanded freejets and through normal shock waves produced by shock holders placed in thejets. Various argon mole fractions were used, and the jet Reynolds numbersranged from 100 to 10,000. The argon enrichment found along the jet axisagrees well with a theory recently proposed by F.S. Sherman. Off axis testsshow an argon deficiency near the jet boundary. The experimental shock pro-files agree only qualitatively with one-dimensional theories. Radial'diffusiondestroyed the otherwise approximate one-dimensionality of the shock waves,
j$ resulting in a significant argon enrichment inside the partially stagnatedshock holder.
DD ,JAN64 1473Security Classification

Security Classification_ .
14. KLINK A LINK S LINK C
ROLE WT ROLE WT ROLE WT
FDiffusive separationFree JetArgon-helium mixtures
Electron beam densitometerShock mixture
INSTRUCTIONS
1. ORIGINATING ACTIVITY: Enter the name and address imposed by security classification, using standard statementsof the contractor, subcontractor, grantee, Department of De- such as:fense activity or other organization (corporate author) issuing (1) "Qualified requesters may obtain copies of thisthe report. report from DDC."2a. REPORT SECUI[TY CLASSIFICATION: Entc: the over- (2) "Foreign announcement and dissemination of thisall security classification of the report. Indicate whether report by DDC is not authorized."Rest .cted Data" is included. Marking is to be in accordrance with appropriate security regulations. (3) "U. S. Government agencies may obtaincopies of
this report directly from DDC. Other qualified DDC2b. GROUP: Automatic downgrading in specified In DoD) Di- users shall request throughrective 5200. 10 and Armed Forces Industrial Manual. Enterthe group number. Also, when applicable, show that optionalmarkings have been used for Group 3 and Group 4 *as author- (4) "U. S. military agencies may obtain copies of thisized. report directly from DDC. Other qualified users3. REPORT TITLE: Enter the complete report title in all shall request throughcapital letters. Titles in all cases should be unclassified.If a meaningful title cannot be selected without classifica-tion, show title classification in all capitals in parenthesis (S;Aldsrbto fti eoti otold ual-
immediately following the title. ified DDC users shall request through
4. DESCRIPTIVE NOTES. If appropriate, enter the type of ."report, e.g., interim, progress, summary, annual, or final. If the report has been furnished tc the Office of TechnicalGive the inclusive dates when a specific reporting period is Services, Department of Commerce, for sale to the public, indi-covered. cate this fact and enter the price, if known.
5, AUTHOR(S): Enter the name(s) of author(s) as shown on IL SUPPLEMENTARY NOTES: Use for additional explana-or in the report. Entei last name, first name, middle initial, tory notes.If .ilitary, show rank ond branch of service. The name ofthe principal .. Athor is an absolute minimum requirement. 12. SPONSORING MILITARY ACT!VITY: Enter the name of
the departmental project office P: laboratory sponsoring (pay-6. REPORT DATa Enter the date of the report as day, ing for) the research and develop~ment. Include address.month, year; or morn. year. If more than one date appearson the report, use date of publication. 13. ABSTRACT: Enter an abstract giving a brief and factual
se'mmary of the document indicative of the report, even though7a. TOTAL NUMBER OF PAGES: The total page count it may also appear elsewhere in the body of the technical re-shou*d foliow normal pagination procedures, i.e., enter the port. If additional space is required, a continuation sheet shallnumber of pages containing information, be attached.
7b. NUMBER OF REFERENCES. Enter the total number of It is highly desirable that the abstract of classified reportsreferences cited in the report. be unclassified. Each paragraph of the abstract shall end with
8a. CONTRACT OR GRANT NUMBER: If appropriate, enter an indication of the military security classification of the in-the applicable number of the contract or grant under which formation in the paiagraph, represented as (TS). (S), (C), or (U).the report was written. There is no limitation cn the length of the abstract. How-
8b, 8c, & 8d. PROJECT NUMBER: Enter the appropriate ever, the suggested length is fom 150 to 225 words.military department identification, such as project numbe, 1subpoieet number, system numbers, task number, etc. 14. KEY WORDS: Key words are technically meaningfl terms
or short phrases that characterize a report and may be used as9a. ORIGiNATOR'S REPORT NUMBER(S): Enter the offi- index entries for cataloging the report. Key words must becial report number by which the document will be identified selected so that no security classification is required. Identi-and controlled by the originating activity. This number must fiers, such as equipment model designation, trade name, militarybe unique to this report. project code name, geographic location, may be used as key9b. OTHER REPORT NUMBER(S): If the report has been words but will be followedby an indication of technical con--ssigned any other report numbers (either by the originator text. The assignment of links, rules, and weights is optionalor by the sponsor). -lso enter this number(s).
13, AVAILABILITY/LIMITATION NOTICES: Enter any lim-itttns ,in further dissemination of the riport, o'.her than those
Security Classification