dysphagia and nutritional status following stroke
TRANSCRIPT

DYSPHAGIA AND NUTRITIONAL STATUS FOLLOWING STROKE
By
MICHAEL A. CRARY
A THESIS PRESENTED TO THE GRADUATE SCHOOLOF THE UNIVERSITY OF FLORIDA IN PARTIAL FULFILLMENT
FOR THE REQUIREMENTS FOR THE DEGREE OF MASTER OF SCIENCE
UNIVERSITY OF FLORIDA
2004

ii
ACKNOWLEDGMENTS
Many professionals contributed to the completion of this research effort. I would
like to thank the Shands Jacksonville clinical research team of Dr. Scott Silliman and
Leslie Page Miller. They have been the front line in this effort. My friend and colleague,
Dr. Giselle Carnaby Mann, has been central in educating me on the behavioral aspects of
clinical stroke research and extended my knowledge of statistical analysis and design
issues. My thesis committee has been flexible, informative, and extremely helpful. I am
grateful for the efforts of Drs. Peter Stacpoole, Nabih Asal, and Scott Silliman. Finally,
I thank Dean Robert Frank of the College of Public Health and Health Professions for
financial support to conduct this research.

iii
TABLE OF CONTENTS
page
ACKNOWLEDGMENTS . . . . . . . . . . . . . . . . . . . . . . . . . . . . . . . . . . . . . . . . . . . . . . . . ii
ABSTRACT . . . . . . . . . . . . . . . . . . . . . . . . . . . . . . . . . . . . . . . . . . . . . . . . . . . . . . . . . . . vi
LIST OF TABLES . . . . . . . . . . . . . . . . . . . . . . . . . . . . . . . . . . . . . . . . . . . . . . . . . . . . . . . v
CHAPTER
1 INTRODUCTION . . . . . . . . . . . . . . . . . . . . . . . . . . . . . . . . . . . . . . . . . . . . . . . . . . . 1
Specific Aims . . . . . . . . . . . . . . . . . . . . . . . . . . . . . . . . . . . . . . . . . . . . . . . . . . . . . . . 1Glossary of Key Terms . . . . . . . . . . . . . . . . . . . . . . . . . . . . . . . . . . . . . . . . . . . . . . . . 2
2 REVIEW OF LITERATURE . . . . . . . . . . . . . . . . . . . . . . . . . . . . . . . . . . . . . . . . . . . 5
Disability Among Stroke Survivors . . . . . . . . . . . . . . . . . . . . . . . . . . . . . . . . . . . . . . 5Dysphagia in Acute Stroke . . . . . . . . . . . . . . . . . . . . . . . . . . . . . . . . . . . . . . . . . . . . . 5Nutritional Status in Acute Stroke . . . . . . . . . . . . . . . . . . . . . . . . . . . . . . . . . . . . . . . 7Relationships Between Dysphagia and Nutritional Status . . . . . . . . . . . . . . . . . . . . . 9Summary . . . . . . . . . . . . . . . . . . . . . . . . . . . . . . . . . . . . . . . . . . . . . . . . . . . . . . . . . . 11
3 METHODS . . . . . . . . . . . . . . . . . . . . . . . . . . . . . . . . . . . . . . . . . . . . . . . . . . . . . . . . 13
Design . . . . . . . . . . . . . . . . . . . . . . . . . . . . . . . . . . . . . . . . . . . . . . . . . . . . . . . . . . . . 13Subjects . . . . . . . . . . . . . . . . . . . . . . . . . . . . . . . . . . . . . . . . . . . . . . . . . . . . . . . . . . 13Data Collection . . . . . . . . . . . . . . . . . . . . . . . . . . . . . . . . . . . . . . . . . . . . . . . . . . . . . 14Power Analysis and Sample Size Feasibility . . . . . . . . . . . . . . . . . . . . . . . . . . . . . . 16Statistical Analyses . . . . . . . . . . . . . . . . . . . . . . . . . . . . . . . . . . . . . . . . . . . . . . . . . 17
4 RESULTS . . . . . . . . . . . . . . . . . . . . . . . . . . . . . . . . . . . . . . . . . . . . . . . . . . . . . . . . . 18
Timing of Assessments . . . . . . . . . . . . . . . . . . . . . . . . . . . . . . . . . . . . . . . . . . . . . . 18Patient Characteristics . . . . . . . . . . . . . . . . . . . . . . . . . . . . . . . . . . . . . . . . . . . . . . . 19Correlation and Association Analyses . . . . . . . . . . . . . . . . . . . . . . . . . . . . . . . . . . . 23Predictors of Dysphagia or Poor Nutritional Status . . . . . . . . . . . . . . . . . . . . . . . . . 26
5 DISCUSSION . . . . . . . . . . . . . . . . . . . . . . . . . . . . . . . . . . . . . . . . . . . . . . . . . . . . . 27

iv
REFERENCES . . . . . . . . . . . . . . . . . . . . . . . . . . . . . . . . . . . . . . . . . . . . . . . . . . . . . . . . 34
BIOGRAPHICAL SKETCH . . . . . . . . . . . . . . . . . . . . . . . . . . . . . . . . . . . . . . . . . . . . . . 37
v
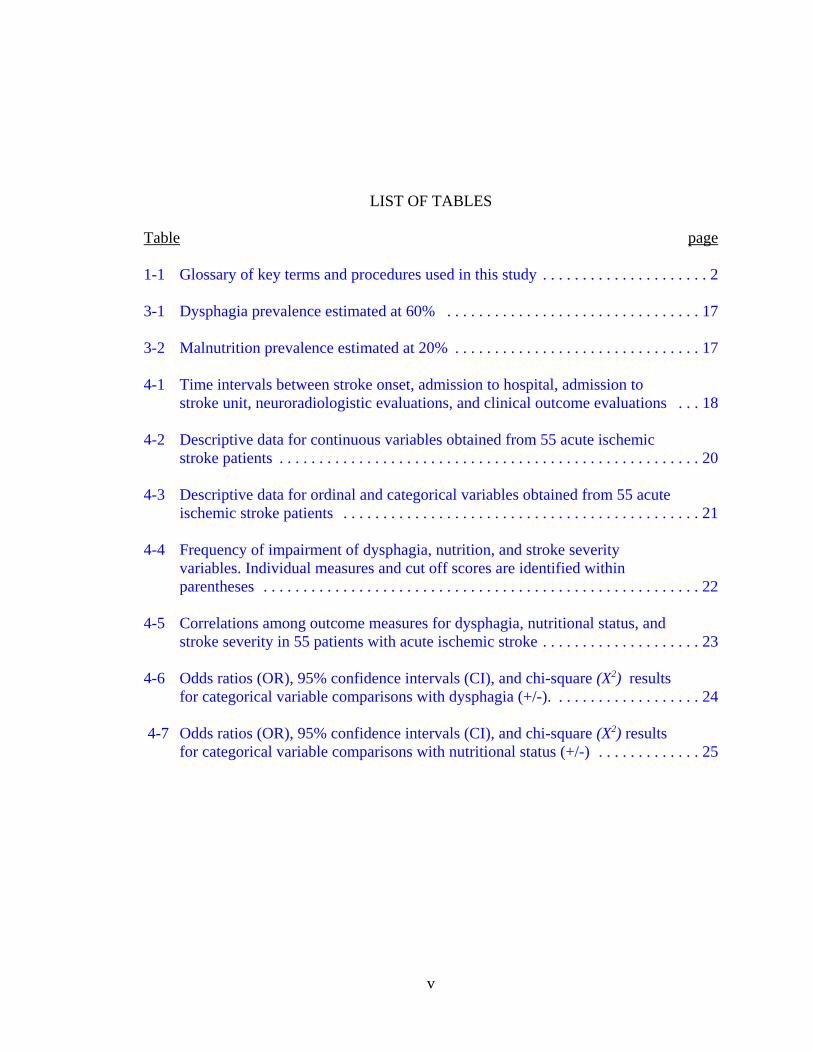
LIST OF TABLES
Table page
1-1 Glossary of key terms and procedures used in this study . . . . . . . . . . . . . . . . . . . . . 2
3-1 Dysphagia prevalence estimated at 60% . . . . . . . . . . . . . . . . . . . . . . . . . . . . . . . . 17
3-2 Malnutrition prevalence estimated at 20% . . . . . . . . . . . . . . . . . . . . . . . . . . . . . . . 17
4-1 Time intervals between stroke onset, admission to hospital, admission tostroke unit, neuroradiologistic evaluations, and clinical outcome evaluations . . . 18
4-2 Descriptive data for continuous variables obtained from 55 acute ischemicstroke patients . . . . . . . . . . . . . . . . . . . . . . . . . . . . . . . . . . . . . . . . . . . . . . . . . . . . . 20
4-3 Descriptive data for ordinal and categorical variables obtained from 55 acuteischemic stroke patients . . . . . . . . . . . . . . . . . . . . . . . . . . . . . . . . . . . . . . . . . . . . . 21
4-4 Frequency of impairment of dysphagia, nutrition, and stroke severityvariables. Individual measures and cut off scores are identified withinparentheses . . . . . . . . . . . . . . . . . . . . . . . . . . . . . . . . . . . . . . . . . . . . . . . . . . . . . . . 22
4-5 Correlations among outcome measures for dysphagia, nutritional status, andstroke severity in 55 patients with acute ischemic stroke . . . . . . . . . . . . . . . . . . . . 23
4-6 Odds ratios (OR), 95% confidence intervals (CI), and chi-square (X2) resultsfor categorical variable comparisons with dysphagia (+/-). . . . . . . . . . . . . . . . . . . 24
4-7 Odds ratios (OR), 95% confidence intervals (CI), and chi-square (X2) resultsfor categorical variable comparisons with nutritional status (+/-) . . . . . . . . . . . . . 25
vi
ABSTRACT
Abstract of Thesis Presented to the Graduate Schoolof the University of Florida in Partial Fulfillment of the
Requirements for the Degree of Master of Science
DYSPHAGIA AND NUTRITIONAL STATUS FOLLOWING STROKE
By
Michael A. Crary
Chair: Peter W. StacpooleMajor Department: Clinical Investigation
Swallowing difficulties are prevalent following acute stroke with estimates
exceeding 50% of stroke patients. Nutritional deficits are less prevalent upon acute
hospital admission (16%-22%) but this problem appears to increase subsequent to stroke
with estimated prevalence approaching 50% upon admission to rehabilitation. An
association appears to exist between dysphagia and nutritional status, but this potential
association has not been carefully studied. The purpose of the present cross sectional
study was to examine potential associations between swallowing ability and nutritional
status in acute stroke patients upon admission to a dedicated, hospital-based stroke unit.
Potential relationships between these stroke sequelae and more traditional stroke severity
measures were evaluated. Patients with acute ischemic stroke were recruited sequentially
upon admission to the dedicated stroke unit of an academic medical center. Average age
of the study patients was 65.2 years with 49% male gender. Forty three percent (43%) of
patients were African American and 62% suffered first-ever stroke. Patients were
assessed with a clinical swallowing evaluation, a functional oral intake scale, the Mini
vii
Nutritional Assessment, BMI, percent body fat, NIHSS, modified Rankin Scale, and
modified Barthel Scale. On clinical examination, 50.9% of study patients demonstrated
dysphagia, and 23.6% were identified with poor nutrition. Just over 30% (30.9%) of the
cohort was obese upon admission. The majority of patients were eating by mouth, but
47.3% had some degree of limitation in this function. Clinical swallowing ability
correlated with stroke severity and with functional oral intake but not with measures of
nutritional status. Nutritional measures did not correlate with any of the swallowing or
stroke severity measures. It is possible that the clinical nutrition measures chosen for this
study may not be sensitive to rapid changes in nutritional status. To better address this
possibility, longer term follow up studies are being designed that will include blood
serum assessments of nutritional markers in addition to anthropomorphic and behavioral
measures. Ultimately, a better understanding of potential associations between dysphagia
and nutritional status following stroke will lead to improved care for the acute and
subacute stroke patient and improved long-term outcomes.
1
CHAPTER 1INTRODUCTION
Stroke is the leading cause of long-term disability in the United States. Dysphagia
(difficulty swallowing food or liquid) and poor nutritional status have been estimated to
impact between 16% to 60% of stroke survivors leading to increased morbidity and poor
long-term functional outcomes. The association between dysphagia and nutritional status
is unknown. The primary purpose for this cross-sectional study is to determine the
prevalence of dysphagia and poor nutritional status in acute ischemic stroke and to
identify potential associations between these outcome measures and more global stroke
severity indices. Given the suggested magnitude of swallowing and nutritional deficits in
acute stroke, and the potential for ongoing complications following discharge, it is
anticipated that this line of research will lead to improved clinical resource utilization and
development of clinical management strategies to enhance long-term functional outcome
for stroke survivors.
Specific Aims
The specific aims of this research are the following:
• To determine the prevalence of dysphagia and poor nutritional status in a cohort ofacute ischemic stroke patients from a single center dedicated stroke unit.
• To identify potential associations between dysphagia and nutritional status andbetween these outcomes and traditional measures of stroke severity in acuteischemic stroke patients.
• To identify important predictors of dysphagia and poor nutritional status in acuteischemic stroke patients.

2
Glossary of Key Terms
To facilitate clarity in this manuscript, Table 1-1 provides abbreviations and
operational definitions of key words and procedures used in completion of this research.
Table 1-1. Glossary of key terms and procedures used in this studyVariable Abbreviation DescriptionAge N/A Age in yearsGender N/A Male or FemaleRace N/A Caucasian, African-American, OtherMarital status N/A Living alone or with a spouse at the time of
strokePrior stroke N/A Patient did or did not have a history of a prior
stroke before the current eventDiabetes Mellitus N/A One of the following:
• Fasting plasma glucose > 126 mg/dL• 2-hour oral glucose tolerance test > 200
mg/dL• On medication for diabetes mellitus
Chronic hypertension Hypertension One of the following:• Systolic blood pressure > 140 or diastolic
blood pressure > 90 based on the mean of atleast two readings conducted on twodifferent days.
• History of treatment for chronichypertension.
Smoking N/A Patient is smoking or using smokeless tobaccoat the time of stroke or recently (within afew months) quit smoking or usingsmokeless tobacco.
Alchohol N/A Patient is identified as using excessive alcoholas documented in medical chart.
Coronary artery disease CAD One of the following:• History of angina• History of myocardial infarction• History of coronary artery intervention such
as CABG or angioplasty
Atrial fibrilation AFIB Atrial fibrillation identified upon clinicalexamination and documented in medicalchart
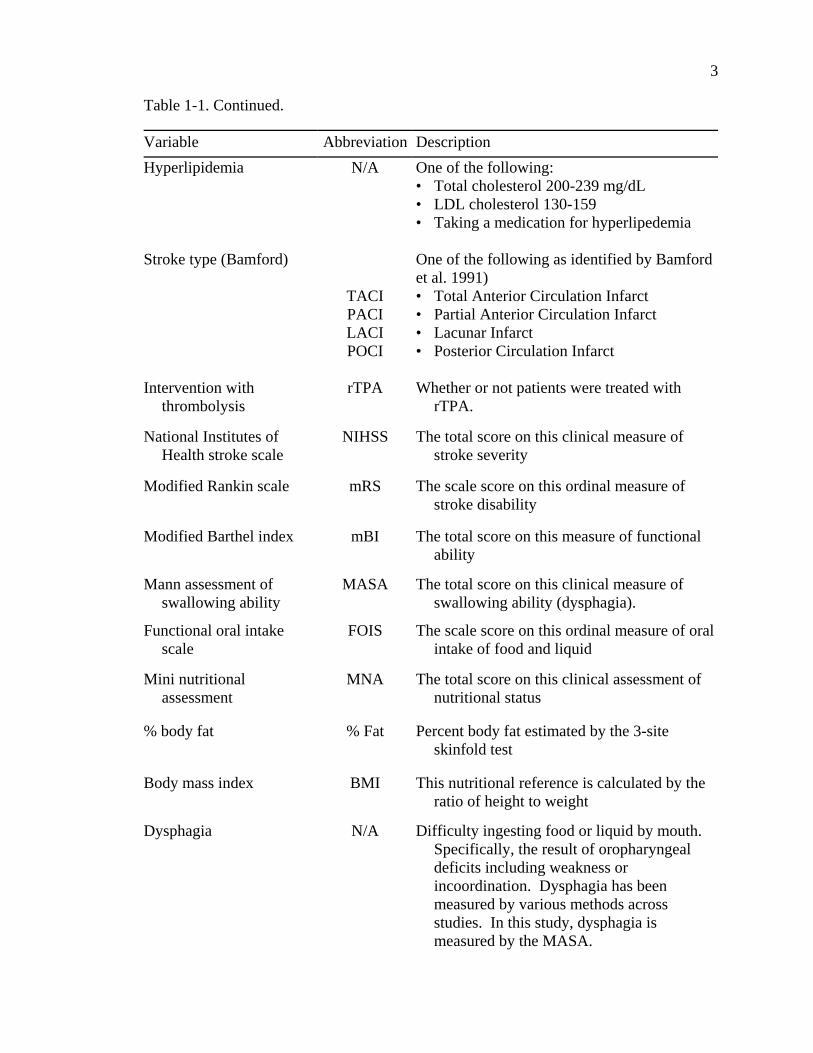
Table 1-1. Continued.
3
Variable Abbreviation DescriptionHyperlipidemia N/A One of the following:
• Total cholesterol 200-239 mg/dL• LDL cholesterol 130-159• Taking a medication for hyperlipedemia
Stroke type (Bamford)
TACIPACILACIPOCI
One of the following as identified by Bamfordet al. 1991)• Total Anterior Circulation Infarct• Partial Anterior Circulation Infarct• Lacunar Infarct• Posterior Circulation Infarct
Intervention withthrombolysis
rTPA Whether or not patients were treated withrTPA.
National Institutes ofHealth stroke scale
NIHSS The total score on this clinical measure ofstroke severity
Modified Rankin scale mRS The scale score on this ordinal measure ofstroke disability
Modified Barthel index mBI The total score on this measure of functionalability
Mann assessment ofswallowing ability
MASA The total score on this clinical measure ofswallowing ability (dysphagia).
Functional oral intakescale
FOIS The scale score on this ordinal measure of oralintake of food and liquid
Mini nutritionalassessment
MNA The total score on this clinical assessment ofnutritional status
% body fat % Fat Percent body fat estimated by the 3-siteskinfold test
Body mass index BMI This nutritional reference is calculated by theratio of height to weight
Dysphagia N/A Difficulty ingesting food or liquid by mouth. Specifically, the result of oropharyngealdeficits including weakness orincoordination. Dysphagia has beenmeasured by various methods acrossstudies. In this study, dysphagia ismeasured by the MASA.

Table 1-1. Continued.
4
Variable Abbreviation DescriptionPoor nutrition N/A A global term representing a current state of
under nutrition. Other studies have usedterms such as “under nutrition,”“malnutrition,” or “impaired nutritionalstatus.” Nutrition has been measuredvariably across studies. In this study, theMNA will be used to identify patients “atrisk for malnutrition” which will beconsidered as reflecting poor nutritionalstatus.
5
CHAPTER 2REVIEW OF LITERATURE
Disability Among Stroke Survivors
Stroke is the leading cause of long-term disability in the United States with
estimates as high as 73% among stroke survivors (American Heart Association [AHA],
2004). According to statistics provided by the American Heart Association,
approximately 4.4 million stroke survivors are alive today, 15% to 30% of whom are
permanently disabled.
The American Stroke Association states that in 1999 direct and indirect costs of
stroke exceeded $51 billion. Over $30 billion was spent on hospital, nursing home,
physicians and other health care specialists fees, medication, and other medical durables.
The remaining $20 billion was a result of lost productivity, morbidity, and mortality.
Given the rapid aging of the United States population, it is expected that Medicare’s
financial burden will double in the next 75 years. Research identifying significant post
stroke problems, their persistence, and how to predict and more effectively treat these
problems will yield benefit to the burdened health care system by improved resource
utilization.
Dysphagia in Acute Stroke
Dysphagia is highly prevalent among acute stroke patients. Some estimates
suggest that nearly 65% of stroke survivors suffer some degree of impairment in the
ability to swallow (Mann, Hankey, & Cameron, 2000). This limitation in the ability to
6
ingest safely adequate amounts of food and liquid places the patient with acute stroke at
risk for poor nutrition and hydration and/or for complications such as aspirated related
pneumonia (Finestone, Foley, Woodbury, & Greene-Finestone, 2001; Mann, Hankey, &
Cameron, 1999). Dysphagia and related complications increase length of acute stay and
are associated with increased mortality, comorbidity, and increased health care costs
(Smithard et al., 1997). Furthermore, dysphagia is reported to persist and perhaps worsen
during the first month after stroke (Sala et al., 1998). Overt dysphagia is reported to have
a high rate of spontaneous resolution. However, a substantial number of stroke survivors
will demonstrate dysphagia characteristics well beyond the rehabilitation period; for
some patients this can be a permanent condition (Mann, Hankey, & Cameron, 1999;
Smithard et al., 1997). These persisting deficits impact physical and social functioning,
quality of life for both patients and caregivers, community re-entry opportunities, and
health care resource utilization.
One persistent problem in studies of dysphagia post stroke is the variability in
how dysphagia is diagnosed. Clinical investigators have relied on subjective measures
such as observations of coughing following liquid ingestion, global impressions, or level
of consciousness. The disparity among studies in the criteria for identifying patients with
dysphagia contributes to heterogeneity in dysphagic subjects both within and across
studies. An appropriate assessment tool to identify dysphagia in acute stroke should
represent a comprehensive examination of those factors known to relate to dysphagia in
this population. Furthermore, this tool should be validated in a population of acute stroke
patients and demonstrate strong reliability among raters. Finally, such a measure should
have the potential to grade severity of identified dysphagia. In the present study, a
clinical measure of dysphagia is employed that has demonstrated strong inter-rater
7
reliability, has been validated in a population of stroke patients, and provides a numerical
score reflecting the severity of dysphagia symptoms (Mann Assessment of Swallowing
Ability (MASA); Mann, 2002). A related measure, the Functional Oral Intake Scale
(FOIS; Crary, Carnaby (Mann), & Groher, 2004) is used to document functional
limitations in the oral ingestion of food and liquid secondary to the presence of
swallowing difficulties. Like the MASA, this tool has demonstrated strong inter-rater
reliability, been validated in a population of stroke patients, and has a numerical score
reflecting the degree of limitation in oral intake of food and liquid.
Nutritional Status in Acute Stroke
Poor nutritional status is prevalent among acute stroke patients upon admission
and may worsen during hospitalization. Upon admission, prevalence has been estimated
between 16% and 22%. This figure increases to 22% and 26% through discharge from
acute care (Axelsson, Asplund, Norberg, & Alafuzoff, 1988; Davalos et al., 1996;
Gariballa, Parker, Taub, & Castleden, 1998a). Nutritional decline appears to go beyond
acute care. The prevalence of poor nutritional status in stroke patients at admission to
rehabilitation has been reported to approximate 50% (Finestone, Greene-Finestone,
Wilson, & Teasell, 1995). At approximately 1 month post stroke, nutritional status
improves with continuing improvement up to 4 months follow up. Thus, one-quarter to
one-half of poststroke patients may demonstrate poor nutritional status from hospital
admission through acute rehabilitation. This deficit in nutritional status may be
preexisting to the stroke in some patients (Davis et al., 2004). Additionally, stroke may
serve as a trigger to a catabolic stress response that may initiate and/or further amplify
poor nutritional status (Chalea, Haymore, Schellinger, & Kang, 2004). Regardless of the
mechanism for this deterioration in nutritional status, impact of poor nutritional status on

8
recovery and long-term functional outcome becomes a significant issue. Various
outcome factors have been reported to be associated with poor nutritional status
including increased 3 month mortality (OR 1.13, 95% CI 1.01–1.27; Gariballa et al.,
1998), frequency of urinary or respiratory infection (50% versus 24%; p = .017) and
bedsores (17% versus 4%; p = .054: Davalos et al., 1996), length of stay in acute
rehabilitation (p < .01; Finestone et al., 1995), and functional outcome as measured by
general indices such as the Barthel Index (OR 3.5, 95% CI 1.2–10.2; Davalos et al.,
1996).
A remaining concern in studies of nutritional status (as in dysphagia) is which
nutritional measure is best suited to assess nutritional status. Studies of nutritional status
in stroke patients have utilized anthropomorphic measures such as skin fold or mid arm
muscle circumference (Davalos et al., 1996), biochemical measures such as serum
albumin levels (Davalos et al., 1996; Dziedzic, Slowik, Szczudlik, 2004), and/or
behavioral health surveys such as the Subjective Global Assessment (SGA; Davis et al.,
2004). In studies of stroke in elderly patients, an appropriate tool should be simple and
available to the widest range of patients to increase external validity of results. It should
also have demonstrated validity compared to other measures of nutrition and
demonstrated reliability across raters. Finally, it should be sensitive to change in
nutritional status over time. The present study employs a clinical measure of nutritional
status that has been validated on elderly, medically compromised populations (Mini
Nutritional Assessment (MNA); Vellas, Guigoz, Garry, & Albarede, 1994). It has high
sensitivity, specificity, and predictive value compared to blood serum and
anthropomorphic nutritional measures (Vellas et al., 2000). It has not, to date, been
employed in studying nutritional status following stroke. However, the MNA is similar

9
to the SGA, which has been used in recent research on nutritional status in acute stroke
patients (Davis et al., 2004). Thus, while no “gold standard” for nutritional assessment
exists (Gariballa, 2003), it is important for any tool utilized to estimate nutritional status
to be robust across clinical environments, have strong validity with other nutritional
measures, and adequate reliability across judges. The MNA meets these criteria. In this
study, MNA findings are compared to two more traditional nutritional measures; Body
Mass Index and percent body fat.
Relationships Between Dysphagia and Nutritional Status
Little research has been conducted on the potential relationships between
swallowing ability (dysphagia) and nutritional status in stroke patients. This is surprising
given the relatively high prevalence of these factors, their parallel clinical course post
stroke, and the overt, logical interaction between them. Davalos and colleagues (1996)
reported that nutritional parameters (midarm muscle circumference, triceps skinfold, or
low serum albumin) did not differ between stroke patients with and without swallowing
problems upon admission. One limitation of this study was the definition of dysphagia
among stroke patients. Patients who failed a water swallow test (cough within one
minute of ingesting 10ml of water) and patients who were unconscious both were
considered to demonstrate dysphagia. Likewise, preliminary results from the FOOD trial
(FOOD Trial Collaboration, 2003) indicate no differences in the percent of patients able
to swallow among undernourished (73%), normal nourished (77%), or overweight (73%)
stroke patients examined within the first seven days following stroke. These
investigators used clinician judgement based on multiple sources of information to
identify both poor nutritional status and dysphagia. Conversely, Finestone and colleagues
(1995) reported similar rates of malnutrition assessed with biochemical and

10
anthropomorphoric data (49%) and dysphagia assessed clinically (47%) among stroke
patients admitted to a rehabilitation service. Malnutrition and dysphagia as measured in
their study were significantly associated (p = .032) at the univariate level. Westergren,
Karlsson, Andersson, Ohlsson, and Hellberg (2001) reported that several “eating
variables” were predictive of nutritional status. Inspection of their data suggests that in
84% of patients “eating variables” suggested reduced oral intake secondary to poor
swallowing abilities. Eating variables suggestive of dysphagia in this study included but
were not limited to eats three-quarters or less of served food (60%), aberrant eating speed
(26%), difficulty manipulating food in the mouth (24%), and overt swallowing
difficulties (18%). Nonoral feeding routes (NG, PEG) also should be considered as
Finestone and colleagues (1995) have reported a significant association (p = .002)
between acute service tube feedings and malnutrition (defined by biochemical and
anthropomorphic data) in stroke patients admitted to a rehabilitation service. Davalos
and colleagues (1996) reported that malnutrition was more frequent (48.3%) in patients
with swallowing incapacity (nonoral feeding) than in those with normal swallowing
function (13.6%), but refer to the abovementioned limitation of their definition of
dysphagia. Though prior studies have implied overlap between dysphagia and nutritional
status it is obvious that relationships between dysphagia and nutritional status post stroke
remain unclear at this time. Despite the initial attempts described herein, potential
relationships between dysphagia and nutritional status, and the impact of combined
dysphagia and nutritional status on long term functional outcomes in stroke remain
poorly understood and warrant further study.
The importance of obtaining a better understanding of potential associations
between dysphagia and nutritional status is highlighted by a second consideration.

11
Several published trials have suggested positive results from nutritional supplementation
in hospitalized adult patients; however, there is no agreement on the benefit of routine
supplementation or how it should be achieved (Potter Langhorne, & Roberts, 1998).
Provision of additional calories beyond oral or nonoral feeding regimens (e.g. nutritional
supplementation) has been shown to improve nutritional status and functional outcome in
elderly nursing home patients (Lauque et al., 2000), critically ill older inpatients
(Bourdel-Marchasson et al., 2000) and in certain surgical or respiratory conditions
(Akner & Cederholm, 2001). Specific to stroke, Gariballa, Parker, Taub, and Castleden
(1998b) reported that supplemental oral sip feeding improved energy and protein intake
in non-dysphagic stroke patients in a rehabilitation setting. More accurately, their data
suggest maintenance of nutritional markers rather than improvement in nutritional
markers. Follow up over a 12-week period indicated trends toward improved functional
outcome and lower morbidity and mortality, but no significant differences were obtained.
Thus, limited available data suggest that nutritional supplementation via oral sip feeding
may be successful in combating nutritional decline in the initial weeks post stroke. The
impact of this nutritional maintenance on functional outcome is unclear. Also, this single
limited trial of nutritional supplementation in stroke patients did not include patients with
any degree of dysphagia. Many patients with mild dysphagia may be appropriate
candidates for nutritional intervention. A better understanding of the association between
dysphagia and nutritional status in this population will facilitate improved and possibly
expanded patient selection for this form of intervention.
Summary
Studies using a variety of definitions of both dysphagia and poor nutritional
status, and disparate methods to measure these conditions consistently reveal that both

12
dysphagia and poor nutritional status occur frequently in the acute stroke patient. They
often coexist but the nature of their association remains vague. Both are related to
increased mortality and poorer functional outcomes in stroke patients. Both may impact
the type of postacute rehabilitation and interventions afforded to stroke patients and
influence health care resource utilization. Given the lack of information in this area and
the clinical importance of these factors, it is imperative that further research be
completed to identify potential associations between dysphagia and nutritional status in
acute ischemic stroke patients and factors that may impact resultant associations.
Important considerations for studying these factors are the clinical protocols employed to
measure each. Prior studies have varied greatly in the tools used to identify both
dysphagia and malnutrition. The present study proposes to utilize clinical tools that have
been developed and standardized in elderly populations including acute stroke in order to
offer a consistent framework for comparison. As an initial investigation, this study uses
a cross sectional design in an attempt to identify associations between dysphagia and
poor nutritional status and factors that may impact any obtained association in a
population of acute ischemic stroke patients.

13
CHAPTER 3METHODS
Design
This study follows a cross-sectional design in which dysphagia and nutritional
status were evaluated simultaneously in a sequential cohort of stroke patients admitted to
a dedicated stroke unit.
Subjects
Fifty-five (55) patients with acute ischemic stroke were recruited for this study.
This study focused on ischemic stroke as this is the most frequent form of stroke with
estimates up to 88% of all strokes (American Heart Association [AHA], 2004).
Sequential patients admitted to the inpatient stroke unit at Shands Hospital in
Jacksonville (Shands Jacksonville) who met the following inclusion-exclusion criteria
were recruited as the sample for this study.
• Ischemic stroke identified by neurological and radiological examination
• No prior history of oropharyngeal dysphagia by patient and/or caregiver report
• No previous head/neck surgery or trauma that may impact swallowing ability
• No other/concomitant neurological disorders (e.g., Parkinson’s disease) thatwould impact oropharyngeal swallowing ability. This exclusion does not includepost stroke deficits.
• Physician and patient/family agreement to participate
The geographic area of recruitment incorporated the greater Jacksonville, Florida,
metropolitan area and beyond. This reflects a population of over 1,100,000. In Duval

14
County, the home of Jacksonville, the population in 2003 was 817,480 with 51.5% of the
population being female, 27.8% being African American, and 10.5% being over 65 years
of age. Shands Jacksonville is the major stroke referral center in the city. This facility is
a tertiary care hospital with 720 beds. The hospital is a major teaching hospital affiliated
with the University of Florida School of Medicine. Over 600 stroke patients are admitted
to Shands Jacksonville on an annual basis. Stroke patients are treated in a state of the art
18 bed neuroscience specialty unit by a stroke team including neurologists,
neuroradiologists, specialized nurses, and rehabilitation specialists.
All subjects were initially identified by the treating stroke neurologist as
appropriate for inclusion in this study and subsequently approached by the speech
pathologist researcher who reviewed study procedures and obtained informed consent
from either the patient or the family. This study was reviewed and approved by the
Institutional Review Board on the Jacksonville campus.
Data Collection
All patients enrolled in this study received stroke-specific, dysphagia-specific,
and nutrition-specific evaluations. All evaluations were completed as soon as possible
following admission into the inpatient stroke unit. Stroke-specific evaluations were
completed by qualified stroke neurologists (Dr Silliman or his fellow). Dysphagia-
specific and nutrition-specific evaluations were completed by a licensed speech
pathologist trained in the specific assessment procedures used in this study. Information
on the timing of the admission process (days from stroke to hospital admission, hospital
admission to stroke unit admission) and study evaluations (CT/MRI scans, clinical
outcome measurement) was collected for each patient and averaged to describe the
timing of study procedures.

15
Stroke-Specific Evaluations
Stroke neurologists performed standard stroke evaluations at the time of
admission and during the acute hospital stay including:
• Brain and vascular imaging (CT and/or MRI) was used to identify the nature andlocation of pathology and stroke subtype. Stroke classification byclinical/anatomic location was completed according to the Oxfordshireclassification (Bamford, Sandercock, Dennis, Burn, & Warlow, 1991).
• Functional outcome was measured using the modified Rankin Scale (Hacke et al.,1998) and the modified Barthel Index (Collin, Wade, Davis, & Horne, 1988). Obtained scores were used except when these measures were dichotomized. Dichotomized cut-off scores were >3 for the modified Rankin Scale and <12 forthe modified Barthel Index.
• Neurological status was quantified with the National Institutes of Health StrokeScale (Brott et al., 1989; Goldstein & Samsa, 1997). Obtained scores were usedexcept when this measure was dichotomized. A cut-off score of 8 was used fordichotomized analyses.
Dysphagia-Specific Evaluations
The speech pathologist assigned to this study administered clinical protocols
specific to dysphagia and functional oral intake including:
• Clinical evaluation of dysphagia was completed with the Mann Assessment ofSwallowing Ability (MASA; Mann, 2002). On this clinical tool, a score of lessthan 178 identifies patients with clinical symptoms and signs of dysphagia.
• Ability to consume food/liquid by mouth was documented with the FunctionalOral Intake Scale (FOIS; Crary, Carnaby, & Groher, 2004). This ordinal ratingscale was used to describe the amount of oral food and liquid intake consumed bypatients in the study. When this scale was dichotomized, a score below 6 out of amaximum of 7 was used to reflect limitations in oral intake of food and liquid.
Nutrition-Specific Evaluations
Nutritional assessment was also completed by the speech pathologist on this
study:
• Body Mass Index (BMI: wt in kg/ht in m2). A BMI of under 18.0 representspatients in the poor nutrition category. A BMI of over 30 represents patients whoare obese.

16
• Percent body fat (% fat) computed from 3 site skinfold measurement. Langeskinfold calipers were used to make these measurements. From male patients,skinfold measurements were obtained from lateral chest, abdomen, and thigh. Forfemale patients, skinfold measurements were obtained from tricep, suprailliacregion, and thigh. Body fat percentages were used as a general assessment ofnutritional status reflected in body composition.
• Mini Nutritional Assessment (MNA; Vellas, Guigos, Garry, & Albarede, 1994).On this assessment tool, a score of less that 23.5 is indicative of “at risk” formalnutrition. This cut-off score was used to identify patients with clinicallymeasured poor nutritional status.
These clinical measures were selected as representative of commonly used and
widely accepted estimates of nutritional status. Funding was unavailable to obtain serum
markers of nutritional status. However, the MNA is highly correlated with both energy
intake (r = 0.50, p < .001) and serum albumin levels (r = 0 .71, p < .001) (Vellas et al.,
2000).
Power Analysis and Sample Size Feasibility
Sample size was estimated using an a priori alpha level of .05 with a beta level of
.80. Sample size was based on expected prevalence of dysphagia and poor nutritional
status compared to previously published rates. Dysphagia rates have been estimated to
be from 40% to 60% among acute stroke patients. Malnutrition rates have been
estimated to be from 16% to 22% in the same population. Tables 3-1 and 3-2 summarize
the power analysis.
Based on these analyses and feasibility of recruitment based on the initial 30
patients and in consideration of the prevalence of both dysphagia (.40) and poor
nutritional status (.21) in that initial sample, a study sample of at least 50 patients was
required to estimate adequate power. This number was feasible given the fiscal resources
supporting this study and the number of patients admitted to the Shands Jacksonville
stroke unit on an annual basis. Time available for data collection was just under 6

17
months. Approximately 40 to 50 stroke patients are admitted to the unit monthly, not all
of whom have ischemic strokes. Of this total numbers of admissions, the speech
pathologist was requested to maintain a recruitment rate of at least 10 patients per month
or approximately 25% of the total number of patients admitted to the unit.
Table 3-1. Dysphagia prevalence estimated at 60%.P1 Delta Sample Size.35 .25 30.40 .20 47.45 .15 86.50 .10 216
Table 3-2. Malnutrition prevalence estimated at 20%P1 Delta Sample Size.45 .25 23.40 .20 36.35 .15 63.30 .10 129
Statistical Analyses
Subject demographic variables were described by mean and variance statistics for
continuous variables or prevalence statistics for categorical variables. Correlation
analyses were used to examine potential relationships among continuous variables.
Subgroups were identified based on dysphagia and poor nutrition cutoffs scores on
clinical protocols (MASA and MNA). Demographic variables were then examined
between subgroups using chi-square analyses and odds ratios with 95% confidence
intervals to identify any variable significantly associated with dysphagia or poor
nutrition. Variables that were highly related to the primary outcome measures (dysphagia
or poor nutrition) were entered into a logistic regression analysis to identify independent
predictors of each outcome.
18
CHAPTER 4RESULTS
Timing of Assessments
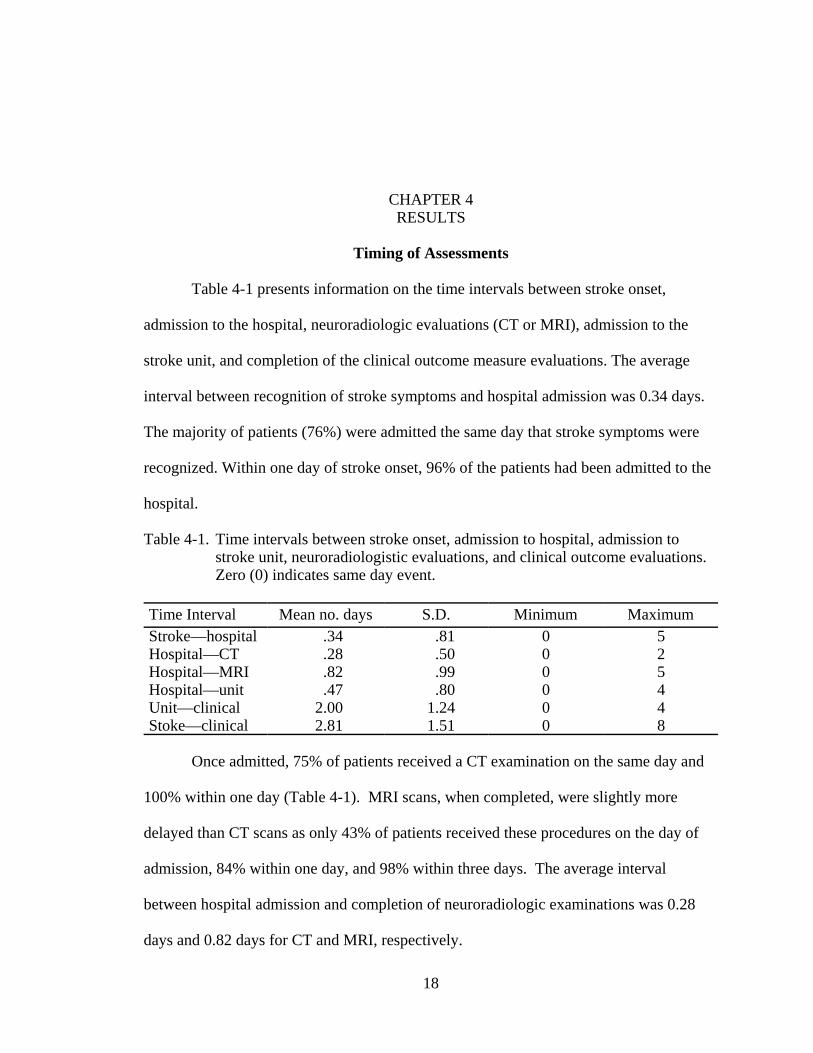
Table 4-1 presents information on the time intervals between stroke onset,
admission to the hospital, neuroradiologic evaluations (CT or MRI), admission to the
stroke unit, and completion of the clinical outcome measure evaluations. The average
interval between recognition of stroke symptoms and hospital admission was 0.34 days.
The majority of patients (76%) were admitted the same day that stroke symptoms were
recognized. Within one day of stroke onset, 96% of the patients had been admitted to the
hospital.
Table 4-1. Time intervals between stroke onset, admission to hospital, admission tostroke unit, neuroradiologistic evaluations, and clinical outcome evaluations.Zero (0) indicates same day event.
Time Interval Mean no. days S.D. Minimum MaximumStroke—hospital .34 .81 0 5Hospital—CT .28 .50 0 2Hospital—MRI .82 .99 0 5Hospital—unit .47 .80 0 4Unit—clinical 2.00 1.24 0 4Stoke—clinical 2.81 1.51 0 8
Once admitted, 75% of patients received a CT examination on the same day and
100% within one day (Table 4-1). MRI scans, when completed, were slightly more
delayed than CT scans as only 43% of patients received these procedures on the day of
admission, 84% within one day, and 98% within three days. The average interval
between hospital admission and completion of neuroradiologic examinations was 0.28
days and 0.82 days for CT and MRI, respectively.

19
Patients were quickly transferred into the stroke unit as evidenced by an average
interval of 0.47 days between hospital admission and stroke unit admission. Sixty-four
percent (64%) of patients were transferred to the stroke unit on the day of hospital
admission. Ninety-four percent (94%) of patients were transferred to the stroke unit
within a single day.
On average, patients were recruited into the study and completed clinical outcome
measure evaluations within 2 days of being admitted to the stroke unit. Seventy percent
(70%) of all clinical evaluations were completed within two days of admission to the
stroke unit and all evaluations were completed within 4 days. Collectively, patients were
evaluated with the clinical outcome measures on an average of 2.81 days following
recognition of stroke symptoms. Seventy-two percent (72%) of patients were evaluated
within 2 days and 96% within 5 days.
Patient Characteristics
Fifty-five (55) patients were recruited into the study satisfying the a priori power
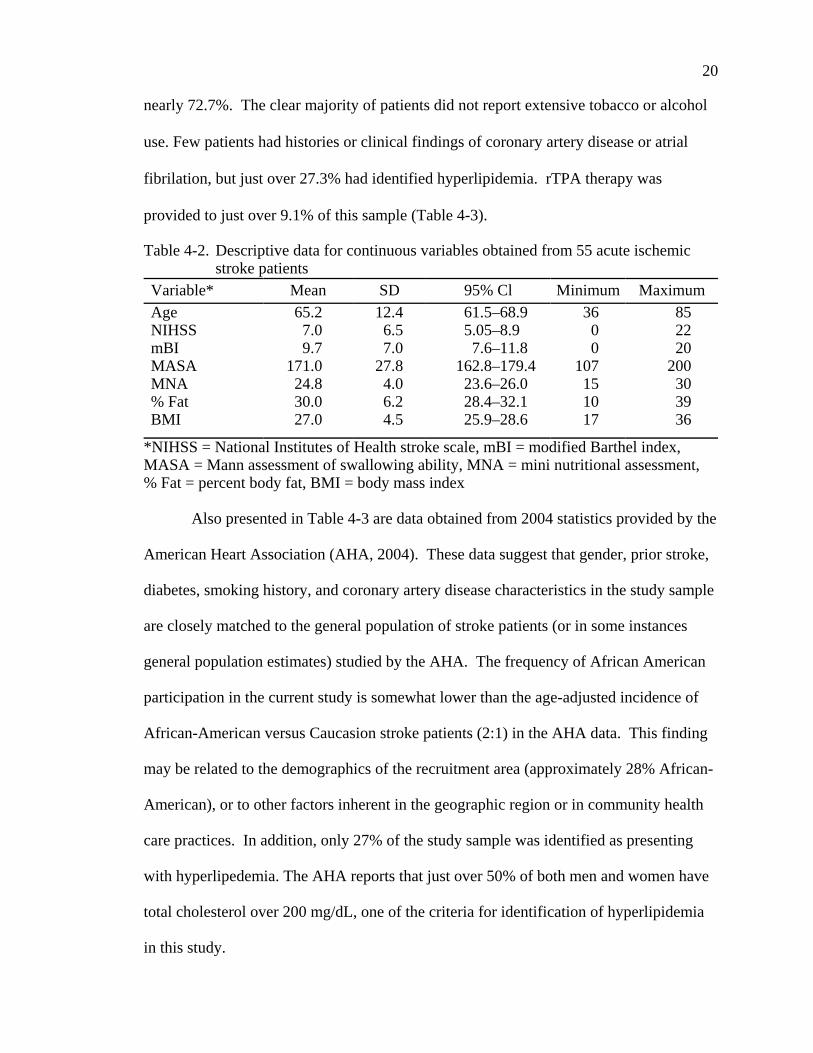
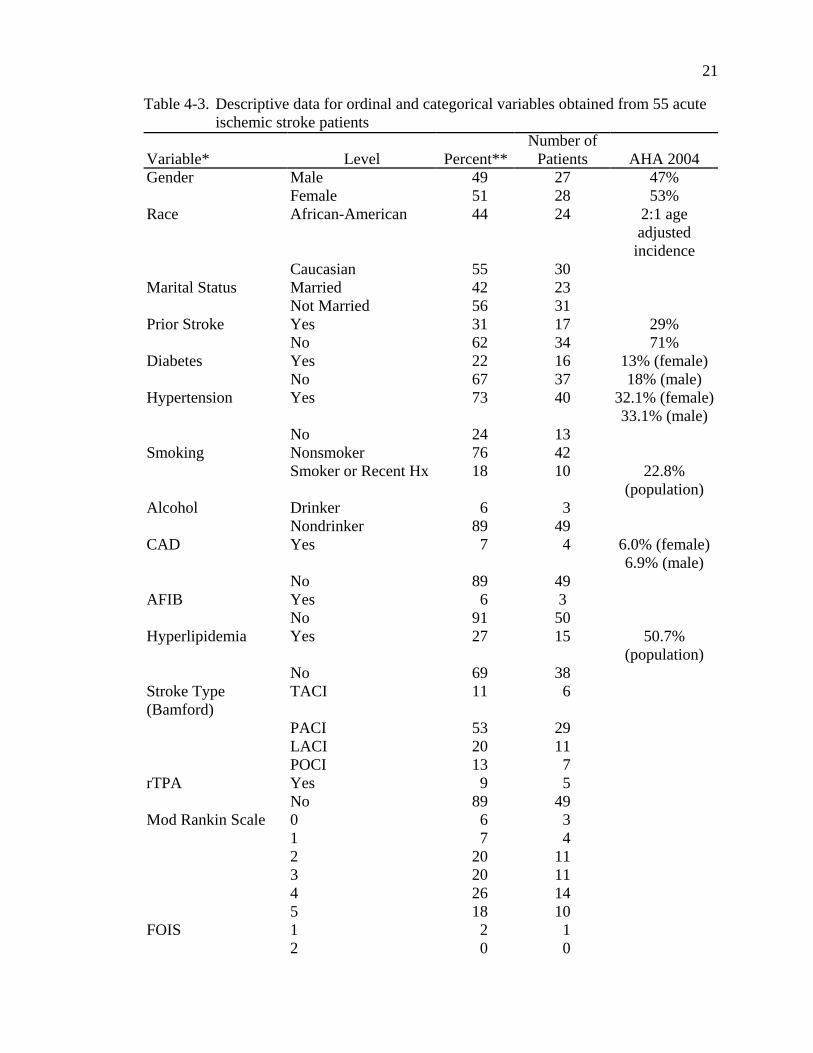
analysis. Descriptive data for continuous variables is presented in Table 4-2. Descriptive
data for categorical variables is presented in Table 4-3. Scores from the NIHSS,
modified Barthel Index (Table 4-2) and the modified Rankin scale (Table 4-3) identified
this patient group as moderately impaired. The majority of strokes (Table 4-3) were
partial anterior circulation infarcts (PACI) with lower numbers of patients demonstrating
total anterior circulation infarcts (TACI).
Gender was approximately equally distributed within this sample as was race, and
marital status, though slightly more Caucasian patients and slightly more patients who
were not married at the time of stroke were recruited into the study (Table 4-3). Diabetes
was identified in just over 21.9% of patients, but hypertension was more prevalent at
20
nearly 72.7%. The clear majority of patients did not report extensive tobacco or alcohol
use. Few patients had histories or clinical findings of coronary artery disease or atrial
fibrilation, but just over 27.3% had identified hyperlipidemia. rTPA therapy was
provided to just over 9.1% of this sample (Table 4-3).
Table 4-2. Descriptive data for continuous variables obtained from 55 acute ischemicstroke patients
Variable* Mean SD 95% Cl Minimum MaximumAge 65.2 12.4 61.5–68.9 36 85NIHSS 7.0 6.5 5.05–8.9 0 22mBI 9.7 7.0 7.6–11.8 0 20MASA 171.0 27.8 162.8–179.4 107 200MNA 24.8 4.0 23.6–26.0 15 30% Fat 30.0 6.2 28.4–32.1 10 39BMI 27.0 4.5 25.9–28.6 17 36
*NIHSS = National Institutes of Health stroke scale, mBI = modified Barthel index,MASA = Mann assessment of swallowing ability, MNA = mini nutritional assessment,% Fat = percent body fat, BMI = body mass index
Also presented in Table 4-3 are data obtained from 2004 statistics provided by the
American Heart Association (AHA, 2004). These data suggest that gender, prior stroke,
diabetes, smoking history, and coronary artery disease characteristics in the study sample
are closely matched to the general population of stroke patients (or in some instances
general population estimates) studied by the AHA. The frequency of African American
participation in the current study is somewhat lower than the age-adjusted incidence of
African-American versus Caucasion stroke patients (2:1) in the AHA data. This finding
may be related to the demographics of the recruitment area (approximately 28% African-
American), or to other factors inherent in the geographic region or in community health
care practices. In addition, only 27% of the study sample was identified as presenting
with hyperlipedemia. The AHA reports that just over 50% of both men and women have
total cholesterol over 200 mg/dL, one of the criteria for identification of hyperlipidemia
in this study.
21
Table 4-3. Descriptive data for ordinal and categorical variables obtained from 55 acuteischemic stroke patients
Variable* Level Percent**Number of
Patients AHA 2004Gender Male 49 27 47%
Female 51 28 53%Race African-American 44 24 2:1 age
adjustedincidence
Caucasian 55 30Marital Status Married 42 23
Not Married 56 31Prior Stroke Yes 31 17 29%
No 62 34 71%Diabetes Yes 22 16 13% (female)
No 67 37 18% (male)Hypertension Yes 73 40 32.1% (female)
33.1% (male)No 24 13
Smoking Nonsmoker 76 42Smoker or Recent Hx 18 10 22.8%
(population)Alcohol Drinker 6 3
Nondrinker 89 49CAD Yes 7 4 6.0% (female)
6.9% (male)No 89 49
AFIB Yes 6 3No 91 50
Hyperlipidemia Yes 27 15 50.7%(population)
No 69 38Stroke Type(Bamford)
TACI 11 6
PACI 53 29LACI 20 11POCI 13 7
rTPA Yes 9 5No 89 49
Mod Rankin Scale 01
67
3 4
2 20 113 20 114 26 145 18 10
FOIS 1 2 12 0 0

Table 4-3. Continued
22
Variable* Level Percent**Number of
Patients AHA 20043 6 34 13 75 27 156 13 77 38 21
*Refer to Table 1-1 for description of variables**Values not equaling 100% are due to missing data.CAD = coronary artery disease, AFIB = atrial fibrilation, rTPA = treatment with rTPA,FOIS = functional oral intake scale
Table 4-4 presents dichotomized data from dysphagia, nutrition, and stroke
severity variables. Just over half (50.9%) of the sample was identified as demonstrating
dysphagia based on the MASA examination with 47.3% demonstrating some limitation
in oral intake of food and liquid as reflected in the FOIS scale. Based on the MNA,
nearly one-quarter of the patients (23.6%) were classified at having poor nutritional
status. However, BMI scores identified a much smaller percentage of malnourished
patients (1.8%). The BMI scores indicated that 30.9% of this sample was obese. Stroke
impairment as measured by the NIHSS, mRS, and mBI suggest that approximately one
half of this sample demonstrated at least moderate impairment.
Table 4-4. Frequency of impairment of dysphagia, nutrition, and stroke severityvariables. Individual measures and cut off scores are identified withinparentheses
MeasureNumber of patients
impaired Percent impairedDysphagia (MASA < 178) 28 50.9Dysphagia (FOIS <6) 26 47.3Nutrition (MNA < 23.5) 13 23.6Nutrition (BMI Low < 18) 1 1.8Nutrition (BMI High = Obese > 30) 17 30.9Stroke (mRS >3) 35 63.6Stroke (NIHSS >8) 18 32.7Stroke (mBI <12) 30 54.5
MASA = Mann assessment of swallowing ability; FOIS = functional oral intake scale;MNA = mini nutritional assessment; BMI = body mass index, mRs = modified rankingscale; NIHSS = National Institutes of Health stroke scale; mBI = modified Barthel index

23
Correlation and Association Analyses
Table 4-5 presents results of correlation analyses among continuous variables for stroke
severity, dysphagia, and nutritional status. Both dysphagia measures (MASA, FOIS)
correlate significantly with stroke severity measures (NIHSS: -0.665, -0.581; mRS: -
0.697, -0.584; mBI: 0.552, 0.469), but not with any measure of nutritional status (MNA:
0.018, -0.003; % Fat: 0.188, 0.176; BMI: 0.269, 0.206). Likewise, none of the nutritional
measures (MNA, % Fat, BMI) correlated significantly with any of the stroke severity
measures. The stroke severity measures tend to correlate with each other as do the
dysphagia measures. Results from the MNA do not correlate with the remaining
nutritional measures (BMI or % Fat).
Table 4-5. Correlations among outcome measures for dysphagia, nutritional status, andstroke severity in 55 patients with acute ischemic stroke
MASA FOIS MNA %Fat BMI Age NIHSS mRs mBIMASA .836* .018 .188 .269+ -.107 -.665* -.697* .552*FOIS -.003 .176 .206 -.072 -.581* -.584* .469*MNA .231 .232 .077 .107 -.160 .024%Fat .477* -.042 - .019 -.215 -.100BMI -.372* .230 -.206 .140Age -.112 .144 -.252NIHSS .729* -.609*mRs -.638**Significant beyond the .05 level+ p = .056MASA = Mann Assessment of Swallowing Ability, FOIS = Functional Oral Intake Scale,MNA = Mini Nutritional Assessment, % Fat = percent body fat, BMI = body mass index,NIHSS = National Institutes of Health Stroke Scale, mRs = Modified Ranking Scale,mBI = Modified Barthel Index
Tables 4-6 and 4-7 present results of association analyses among categorical
(dichotomized) variables for dysphagia (Table 4-6) and poor nutritional status
(Table 4-7). As seen in Table 4-6, only 4 variables are significantly associated with the
presence of dysphagia. Scores on the mRS (OR 10.9, 95% CI 2.6–45.6), NIHSS (OR
6.5, 95% CI 1.7–24.68), mBI (OR 3.7, 95% CI 1.6–11.9), and FOIS (OR 20.2, 95% CI

24
5.0–8.5) are significantly associated with dysphagia. Other variables (gender,
hypertension, smoking, atrial fibrillation, and TACI) revealed elevated odds ratios
suggesting trends of association with dysphagia; however, these were not statistically
significant.
Table 4-6. Odds ratios (OR), 95% confidence intervals (CI), and chi-square (X2) resultsfor categorical variable comparisons with dysphagia (+/-). Continuous andordinal variables were dichotomized using accepted or clinically plausiblecut-points for this analysis.
Comparison Chi-Square OR 95% CI
mRs 12.8* 10.9 2.6–45.6NIHSS 8.6* 6.5 1.7–24.7mBI 5.0* 3.7 1.6–11.9rTPA - - -Prior stroke 0.04 0.89 .3–2.9Gender 2.7 2.5 .8–7.4Marital status 0.4 1.4 .5–4.1Race 0.1 1.1 .4–3.4Diabetes 1.7 0.5 .1–1.5Hypertension 1.1 2 .5–7.0Smoking 2 2.8 .6–12.4Alcohol - - -CAD 1.2 0.3 .0–3.0AFIB 0.3 2 .2–23.5Hyperlipidemia 1 0.5 .2–1.8Poor nutrition 0.2 0.7 .2–2.6FOIS 21.6* 20.2 5.0–8.5Obesity 0.8 0.6 .2–1.9Bamford Type TACI PACI LACI POCI
2.7 1.2 .0 .3
5.4 .5 1.1 .7
.6–50.1 .2–1.6 .3–4.3 .1–3.3
* Significant beyond the .05 level+ p = .074
Treatment with rTPA or excessive alcohol use were not analyzed with these
procedures owing to small event rates (N = 5 and 3 respectively) and empty cells in the 2
25
X 2 matrix. However, at the descriptive level all patients who were treated with rTPA
and all patients who were identified to use alcohol excessively were identified as
dysphagic.
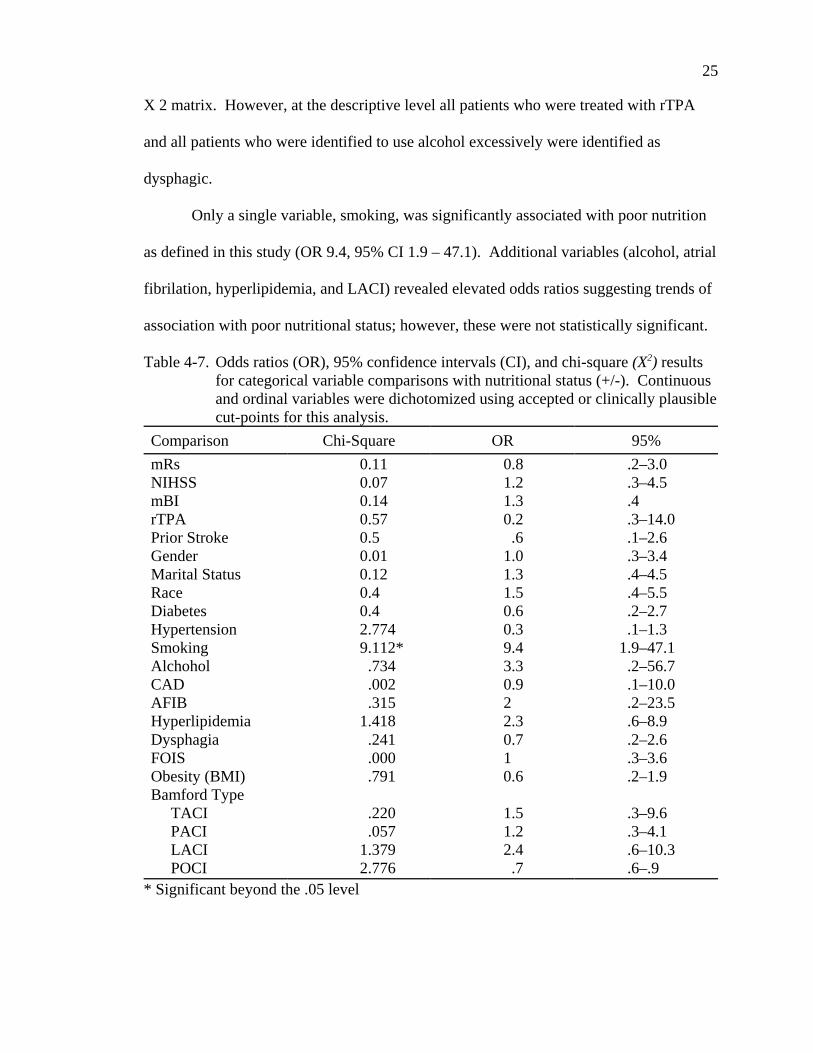
Only a single variable, smoking, was significantly associated with poor nutrition
as defined in this study (OR 9.4, 95% CI 1.9 – 47.1). Additional variables (alcohol, atrial
fibrilation, hyperlipidemia, and LACI) revealed elevated odds ratios suggesting trends of
association with poor nutritional status; however, these were not statistically significant.
Table 4-7. Odds ratios (OR), 95% confidence intervals (CI), and chi-square (X2) resultsfor categorical variable comparisons with nutritional status (+/-). Continuousand ordinal variables were dichotomized using accepted or clinically plausiblecut-points for this analysis.
Comparison Chi-Square OR 95%mRs 0.11 0.8 .2–3.0NIHSS 0.07 1.2 .3–4.5mBI 0.14 1.3 .4rTPA 0.57 0.2 .3–14.0Prior Stroke 0.5 .6 .1–2.6Gender 0.01 1.0 .3–3.4Marital Status 0.12 1.3 .4–4.5Race 0.4 1.5 .4–5.5Diabetes 0.4 0.6 .2–2.7Hypertension 2.774 0.3 .1–1.3Smoking 9.112* 9.4 1.9–47.1Alchohol .734 3.3 .2–56.7CAD .002 0.9 .1–10.0AFIB .315 2 .2–23.5Hyperlipidemia 1.418 2.3 .6–8.9Dysphagia .241 0.7 .2–2.6FOIS .000 1 .3–3.6Obesity (BMI) .791 0.6 .2–1.9Bamford Type TACI PACI LACI POCI
.220 .0571.3792.776
1.51.22.4 .7
.3–9.6 .3–4.1 .6–10.3 .6–.9
* Significant beyond the .05 level

26
Predictors of Dysphagia or Poor Nutritional Status
Given the low event rate for poor nutritional status as defined in this study
(N = 13) and the resulting correlation and association analyses identifying only a single
significantly associated variable, no regression analysis was completed on this outcome
variable. The event rate for dysphagia (N = 26) was deemed sufficient only to support a
pilot or exploratory regression analysis to identify independent predictors of this outcome
variable. However, only four variables were significantly associated with dysphagia at
the univariate level: NIHSS, mRS, mBI, and FOIS. As seen in Table 4-5, these variables
were highly intercorrelated, with the FOIS demonstrating the highest correlation with
dysphagia as measured by the MASA. However, since the FOIS score is the result of
dysphagia it is unsuited to serve as a predictor of dysphagia following stroke. Of the
remaining variables, the mRS demonstrated the strongest univariate relationship with
dysphagia. Thus, of all the variables considered in this study, stroke severity, specifically
as reflected by the modified Rankin scale (mRS), emerged as the best independent
predictor of post stroke dysphagia (OR 10.9, 95% CI 2.6 – 45.6).
Smoking was the only variable significantly associated with poor nutritional
status (OR 9.4, 95% CI 1.9 – 47.1). The large confidence intervals associated with both
variables indicate relatively large variability, and hence instability, around the point
estimate.

27
CHAPTER 5DISCUSSION
This study found no significant associations between dysphagia and nutritional
status in a sample of acute ischemic stroke patients. Furthermore, while dysphagia was
related to stroke severity, nutritional status was not. Collectively, these findings raise
questions focusing on the procedures used to assess nutritional status in this study and,
more generally, the timing of nutritional assessments preceding and following stroke.
The primary nutritional outcome measure in this study was the Mini Nutritional
Assessment (MNA). This tool appears to be a better indicator of premorbid nutritional
status than nutritional changes following stroke. Items on the MNA include dietary
changes, weight loss, and stress factors that may have occurred 3 months prior to the
evaluation. In addition, anthropomorphic measures such as BMI, mid-arm
circumference, and calf circumference are included. These measures would not be
expected to reflect rapid changes in nutritional status as they rely on physical changes in
weight or body fat that are reactive to a prolonged state of poor nutrition. Other items in
the MNA, specifically pressure sores or skin ulcers, also reflect more chronic nutritional
problems. Therefore, though the MNA has demonstrated a strong relationship with both
energy intake (r = 0.50, p < .001) and serum albumin (r = 0.71, p < .001), it is not well
suited to assess acute, potentially rapid changes in nutritional status. It is similar to the
Subjective Global Assessment (SGA), which has been used recently to study the impact
of premorbid nutritional status on stroke outcome (Davis et al., 2004). In that regard, the

28
present study is better considered as an assessment of premorbid nutritional status on
stroke severity and post stroke dysphagia. The results of the present study would suggest
that premorbid nutritional status as defined by MNA results does not impact either stroke
severity nor the presence or severity of post stroke dysphagia.
The lack of association between nutritional status and dysphagia is in agreement
with earlier findings in acute stroke reported by Davalos and colleagues (1996) who
reported no nutritional differences between patients with and without swallowing
problems at admission. These investigators used a combination of blood serum markers
(serum albumin) and anthropomorphic markers (triceps skin fold and mid-arm muscle
circumference) to estimate nutritional status. Likewise, preliminary results from the
FOOD Trial (FOOD Trial Collaboration, 2003) reported no descriptive differences in the
percent of patients with swallowing impairment among undernourished, normal, and
overweight stroke patients. These investigators used various combinations of clinical
impression, anthropomorphic measures, and/or blood serum markers to assess nutritional
status within an average time interval of 7 days following stroke symptom onset. No
other studies have examined potential relationships between swallowing ability and
nutritional status in the acute stroke patient. Thus, the results of the present study in
combination with prior and ongoing investigations suggest that nutritional status is not
related to the presence of dysphagia in the acute stroke patient.
In the present study, dysphagia was significantly associated to multiple measures
of stroke severity. At least one prior study has suggested that stroke severity was an
important predictor of dysphagia in the post stroke patient. Mann and Hankey (2001)
reported that disabling stroke as measured by the Barthel Index (score < 60 on the full
index) was a significant predictor of dysphagia (assessed by radiographic procedure) in a

29
group of 128 acute stroke patients. In the present study, all indices of stroke severity
(NIHSS, mRS, and mBI) were significantly associated with the presence of dysphagia
with the modified Rankin Scale (mRS) demonstrating the strongest association (OR 10.9,
95% CI 2.6–45.6).
Nutritional status did not correlate or associate with any of the stroke severity
measures. Davalos et al. (1996) reported that malnourished status (serum album, triceps
skinfold or mid-arm circumference) was significantly associated with stroke severity
(Canadian Stroke Scale < 5) at admission. The criteria for “malnourished” in their study
was either low serum albumin or triceps skin fold or mid-arm circumference less than the
10th percentile of their reference population. These investigators did not account for
potential premorbid functional limitations that might impact their measures. Conversely,
Davis and colleagues (2004) found that stroke severity as measured by the NIHSS was
not associated with poor nutritional status as measured by the Subjective Global
Assessment (SGA) in acute stroke patients. These investigators did use a premorbid
modified Rankin Scale to identify a significant association with premorbid nutritional
status measured by the SGA. One conclusion is that premorbid functional level may
impact nutritional status preceding or following stroke. This observation may be
supported by the finding in the present study that smoking was the only premorbid
variable significantly associated (OR 9.4, 95% CI 1.9–47.1) with poor nutritional status
as measured by the MNA.
In the present study, only 13 patients were identified to reflect poor nutritional
status based on results of the MNA. On the dichotomized modified Barthel Index and the
modified Rankin Scale, 61.5 % (N = 8) of the patients with poor nutritional status were
considered impaired while 38.5% (N = 5) were above the established cut-off for
30
impairment. These proportions did not result in significant associations. The resulting
proportions based on the NIHSS cut-off score were reversed. The majority of patients
with poor nutritional status (61.5%) were not identified as beyond the cut-off for
impairment. Collectively, these findings may reflect the somewhat arbitrary nature of
dichotomizing these scales, and certainly reflect the small sample size. Future studies
should evaluate not only larger samples but also multiple cut-off scores based on specific
criteria. At a descriptive level, more patients with poor nutritional status were classified
as impaired by the mRS and mBI. This finding may or may not have been maintained
with a larger sample.
One strength of this study was the inclusion of standard clinical assessment
protocols for both dysphagia and nutritional assessment. The Mann Assessment of
Swallowing Ability (MASA) was specifically developed and validated to assess
dysphagia in post stroke patients. This is a commonly used tool that is widely accepted
and accessible for replication efforts. Likewise, the Mini Nutritional Assessment (MNA)
was developed and validated to assess nutritional status in elderly patients. However,
this tool has not been specifically validated for use in post stroke patients. Thus, while
validated and accessible methods were employed for both dysphagia and nutritional
assessments, this study was the first attempt to utilize the MNA to evaluate nutritional
status in a sample of post stroke patients. One result of that application is the implication
that this tool may be biased to premorbid factors that impact nutritional status in the post
stroke patient. This implication is one potential limitation of the present study.
Potential limitations of this study arise primarily from limited sample size and
from limitations in outcome assessment protocols, especially for nutritional assessment
as mentioned above. Though small, this sample did reflect certain characteristics
31
associated with general health characteristics and/or characteristics of stroke patients
from national surveys (Table 4-3). Also, the prevalence of both dysphagia and poor
nutritional status as defined in this study parallels that reported in several prior studies
using varying assessment protocols. Thus, though this study may suffer from small
sample size and associated limitations in statistical power, the subject sample does have
some degree of external validity.
A primary limitation in the interpretation of obtained results was the choice of the
nutritional status measures. As discussed above, it is likely that the MNA as used in this
study is more sensitive to premorbid nutritional status than to changes in nutritional
status that might be induced by stroke. The same argument may be applied to both BMI
and percent body fat. These methods may be relatively insensitive to very rapid changes
in nutritional status. Davalos (1996) reported that nutritional indices deteriorated during
the first week post stroke. This finding is consistent with many observations of
nutritional decline following stroke (Axelsson et al., 1988; Davalos et al., 1996; Gariballa
et al., 1998a). Additionally, poor nutritional status is often associated with poorer stroke
outcome and with measures of severity and other comorbidities subsequent to the
immediate post stroke period (Davalos et al., 1996; Davis et al., 2004; Dziedzic et al.,
2004). It is conceivable that in the immediate post stroke period, nutritional status is
more representative of premorbid status and that with time nutritional decline, when
present, results from stroke-related factors. From this perspective, combining an
assessment technique that identifies rapid nutritional changes with techniques that reflect
more long-term changes in nutritional status would prove beneficial. One possibility
would be to use serum markers such as prealbumin to identify short-term protein changes
that reflect rapid changes in nutritional status. Combined with more long-term markers
32
such as serum albumin or clinical and anthropomorphic measures such as the MNA and
SGA, a more complete profile of nutritional status and change over time might result.
Future studies should include a follow up period to study the impact of dysphagia
and poor nutritional status, both individually and combined, on functional outcome in the
stroke survivor. While prior studies have addressed one or the other of these factors, no
study has looked at their combined impact. Prior to addressing this task, however,
follow-up studies should evaluate the potentially changing relationship between
dysphagia and nutritional status during the poststroke recovery period. The natural
history of potential interactions between dysphagia and nutritional status following stroke
has not been examined. Combined with improved nutritional surveillance, follow up
studies will have the potential to provide significant insight into two prevalent limitations
encountered by the stroke survivor and to evaluate the combined impact of these
morbidities.
A subsequent step to this study will involve use of biochemical markers of
nutritional status and a pre-defined time table of follow up to identify changes in
nutritional status and dysphagia over time and to estimate the impact of these variables,
individually and combined, on functional outcome. Specifically, serum albumin levels
will be used as an estimate of longer-term nutritional status that will reflect the prestroke
condition. This measure will be supplemented by premorbid assessment of nutritional
parameters assessed by both the MNA and the SGA. Also, premorbid level of
stroke-related disability will be assessed using the mBI and the mRS. Serum prealbumin
levels will be used as a reflection of post-stroke changes in nutritional status. Dysphagia
presence and severity (MASA) and feeding patterns (FOIS) will be used to identify
swallowing factors that may impact changes in nutritional status following stroke. To
33
detail the natural history of these variables, premorbid estimates will be obtained from
family members upon admission to the hospital. Likewise, serum albumin and
prealbumin levels will be obtained upon admission and at one week post-stroke or upon
discharge from the stroke unit, whichever occurs first. Finally, a systematic program of
follow up evaluations will be implemented at one, three, and six months following
discharge from the stroke unit. These changes will facilitate better description of
longitudinal changes in stroke severity, dysphagia, and nutritional status and permit study
of the potential dynamic nature of the interaction between dysphagia and nutritional
status in the stroke survivor.
One final aspect to consider is whether or not to evaluate biochemical aspects of
the post-stroke stress factor. Many biochemical markers have been used to evaluate this
phenomenon. Therefore, the research team must consider which if any aspects of the
stress factor to evaluate.
In summary, the present study found no significant relationship between
dysphagia and nutritional status in the acute ischemic stroke patient. Furthermore, while
dysphagia was significantly related to stroke severity, nutritional status was not. The
potential influence of prestroke parameters must be considered when evaluating
poststroke nutritional status. Likewise, nutritional parameters sensitive to more rapid
changes in status should be employed. Finally, it will be imperative to follow stroke
patients over time to fully understand the potential interaction of the two dynamic
morbidities.
34
REFERENCES
American Heart Association (AHA). (2004). Heart disease and stroke statistics.Retrieved August 15, 2004, from http://www.americanheart.org
Akner, G., & Cederholm, T. (2001). Treatment of protein-energy malnutrition in chronicnonmalignant disorders. American Journal of Clinical Nutrition, 74, 6-24.
Axelsson, K., Asplund, K., Norberg, A., & Alafuzoff, I. (1988). Nutritional status inpatients with acute stroke. Acta Medica Scandinavica, 224, 217-224.
Bamford, J., Sandercock, P., Dennis, M., Burn, J., & Warlow, C. (1991). Classificationand natural history of clinically identifiable subtypes of cerebral infarction. Lancet, 337, 1521-1526.
Bourdel-Marchasson, I., Barateau, M., Rondeau, V., Dequae-Merchadou, L., Salles-Montaudon, N., Emeriau, J. P., Manciet, G., & Dartigues, J. F. (2000). A multi-center trial of the effects of oral nutritional supplementation in critically ill olderpatients. GAGE Group. Nutrition, 16:1-5.
Brott, T., Adams, H. P., Olinger, C. P., Marler, J. R., Barsan, W. G., Biller, J., Spilker, J.,Holleran, R., Eberle, R., & Hertzberg, V. (1989). Measurements of acute cerebralinfarction: A clinical examination scale. Stroke, 20, 864-870.
Chalea, J. A., Haymore, J., Schellinger, P. D., & Kang, D. W. (2004). Acute strokepatients are being underfed: A nitrogen balance study. Neurocritical Care, 1,331-334.
Collin, C., Wade, D.T., Davis, S., & Horne, V. (1988). The Barthel ADL index: Areliability study. International Disability Studies, 10, 61-63.
Crary, M. A., Carnaby (Mann), G. D., & Groher, M. E. (2004). Initial psychometricassessment of a functional oral intake scale for dysphagia in stroke patients.Manuscript submitted for publication.
Davis, J. P., Wong, A. A., Schluter, P. J., Henderson, R. D., O’Sullivan, J. D., & Read, S.J. (2004). Impact of premorbid undernutrition on outcome in stroke patients.Stroke, 35, 1930-1934.

35
Davalos, A., Ricart, W., Gonzalez-Huix, F., Soler, S., Marrugat, J., Molins, A., Suner, R.,& Genis, D. (1996). Effect of malnutrition after acute stroke on clinical outcome. Stroke, 27, 1028-1032
Dziedzic, T., Slowik, A., & Szczudlik, A. (2004). Serum albumin level as a predictor ofischemic stroke outcome. Stroke, 35, e156-e158.
Finestone, H. M., Foley, N. C., Woodbury, M. G., & Greene-Finestone, L. (2001).Quantifying fluid intake in dysphagic stroke patients: A preliminary comparisonof oral and nonoral strategies. Archives of Physical Medicine and Rehabilitation,82, 1744-1746.
Finestone, H. M., Greene-Finestone, L. S., Wilson, E. S., & Teasell, R. W. (1995).Malnutrition in stroke patients on the rehabilitation service and at follow-up:Prevalence and predictors. Archives of Physical Medicine Rehabilitation, 76,310-316.
FOOD Trial Collaboration. (2003). Poor nutritional status on admission predicts pooroutcomes after stroke. Stroke, 34, 1450-1456.
Gariballa, S. (2003). Editorial comment: Protein energy undernutrition and acute strokeoutcome. Stroke, 34, 1455.
Gariballa, S. E., Parker, S. G., Taub, N., & Castleden, C. M. (1998a). Influence ofnutritional status on clinical outcome after acute stroke. American Journal ofClinical Nutrition, 68, 275-81.
Gariballa, S. E., Parker, S. G., Taub, N., & Castleden, C. M. (1998b). A randomized,controlled, single-blind trial of nutritional supplementation after acute stroke. Journal of Parenteral and Enteral Nutrition, 22, 315-19.
Goldstein, L. R., & Samsa, G. P. (1997). Reliability of the National Institutes of HealthStroke Scale. Extension to non-neurologists in the context of a clinical trial. Stroke, 28, 307-310.
Hacke, W., Kaste, M., Fieschi, C., von Kummer, R., Davalos, A., Meier, D., Larrue, V.,Bluhmki, E., Davis, S., Donnan, G., Schneider, D., Diez-Tejedor, E., & Trouillas,P. (1998). Randomized double-blind placebo-controlled trial of thrombolytictherapy withintravenous alteplase in acute ischaemic stroke (ECASS II). SecondEuropean-Australasian Acute Stroke Study Investigators. Lancet, 352, 1245-1251.
Lauque, S., Arnaud-Battandier, F., Mansourian, R., Goigoz, Y., Paintin, M., Nourashemi,F., & Vellas, B. (2000). Protein-energy oral supplementation in malnourishednursing-home residents. A controlled trial. Age Ageing, 29, 51-56.
36
Mann, G. (2002). The Mann assessment of swallowing ability: MASA. Philadelphia: Delmar Thompson Learning.
Mann, G., & Hankey, G. J. (2001). Initial clinical and demographic predictors ofswallowing impairment following acute stroke. Dysphagia, 16, 208-215.
Mann, G., Hankey, G. J., & Cameron, D. (1999). Swallowing function after stroke:Prognosis and prognostic factors at 6 months. Stroke, 30, 744-748.
Mann, G., Hankey, G. J., & Cameron, D. (2000). Swallowing disorders following acutestroke: Prevalence and diagnostic accuracy. Cerebrovascular Diseases, 10, 380-386.
Potter, J., Langhorne, P., & Roberts, M. (1998). Routine protein energy supplementationin adults: Systematic review. BMJ, 317, 495-501.
Sala, R., Munto, M. J., de la Calle, J., Preciado, I., Miralles, T., Cortes, A., Molla, R., &Alcaide, M. (1998). Swallowing changes in cerebrovascular accidents: Incidence,natural history, and repercussions on the nutritional status, morbidity, andmortality. Revista de Neurologia, 27, 759-766.
Smithard, D. G., O'Neill, P. A., England, R. E., Park, C. L., Wyatt, R., Martin, D. F.,Morris, J. (1997). The natural history of dysphagia following a stroke. Dysphagia, 12, 188-193.
Vellas, B., Guigoz, Y., Garry, P. J., & Albarede, J. L. (Eds). (1994). The mini nutritionalassessment: MNA. Nutrition in the elderly (2nd ed.). Paris: Serdi.
Vellas, B., Guigoz, Y., Baumgartner, M., Garry, P. J., Lauque, S., & Albarede, J. L.(2000). Relationships between nutritonal markers and the mini-nutritionalassessment in 155 older persons. Journal of American Geriatrics Society, 48,1300-1309
Westergren, A., Karlsson, S., Andersson, P., Ohlsson, O., & Hallberg, I. R. (2001).Eating difficulties, need for assisted eating, nutritional status and pressure ulcersin patients admitted for stroke rehabilitation. Journal of Clinical Nursing, 10,257-269.
37
BIOGRAPHICAL SKETCH
Michael A. Crary, Ph.D., is a Professor of Speech-Language Pathology and
Director of the Florida Dysphagia Institute at the University of Florida Health Science
Center. Dr. Crary's current clinical and research interests revolve around disorders of
swallowing, specifically improving assessment and treatment strategies. Current research
projects include studies of the clinical and instrumental evaluation of dysphagia and
outcomes of various treatments. He has a long history as a practicing clinician and
remains active in patient care. He has written and lectured extensively, including
internationally, on these topics. His latest project is the text The Introduction to Adult
Swallowing Disorders. He has served as assistant director of the ASHA Special Interest
Division #13: Dysphagia. He is a former nominee for the DiCarlo award from ASHA, a
recipient of the Outstanding Clinical Achievement Award from ASHA, and has been
elected as a Fellow of ASHA.