dysfunction in parkinson’s disease
TRANSCRIPT

cells
Article
Synergistic Effect of Mitochondrial and LysosomalDysfunction in Parkinson’s Disease
Flora Guerra 1,* , Giulia Girolimetti 2 , Raffaella Beli 1, Marco Mitruccio 1, Consiglia Pacelli 3 ,Anna Ferretta 4 , Giuseppe Gasparre 2, Tiziana Cocco 4 and Cecilia Bucci 1,*
1 Department of Biological and Environmental Sciences and Technologies (DiSTeBA), University of Salento,Via Provinciale Lecce-Monteroni 165, 73100 Lecce, Italy; [email protected] (R.B.);[email protected] (M.M.)
2 Department of Medical and Surgical Sciences (DIMEC), Medical Genetics Unit, University of Bologna,via Massarenti 9, 40138 Bologna, Italy; [email protected] (G.G.); [email protected] (G.G.)
3 Department of Clinical and Experimental Medicine, University of Foggia, 71122 Foggia, Italy;[email protected]
4 Department of Basic Medical Sciences, Neurosciences and Sensory Organs, University of Bari “A. Moro”,70122 Bari, Italy; [email protected] (A.F.); [email protected] (T.C.)
* Correspondence: [email protected] (F.G.); [email protected] (C.B.);Tel.: +39-3280-088383 (F.G.); +39-0832-298900 (C.B.)
Received: 23 March 2019; Accepted: 13 May 2019; Published: 14 May 2019�����������������
Abstract: Crosstalk between lysosomes and mitochondria plays a central role in Parkinson’sDisease (PD). Lysosomal function may be influenced by mitochondrial quality control, dynamicsand/or respiration, but whether dysfunction of endocytic or autophagic pathway is associated withmitochondrial impairment determining accumulation of defective mitochondria, is not yet understood.Here, we performed live imaging, western blotting analysis, sequencing of mitochondrial DNA(mtDNA) and senescence-associated beta-galactosidase activity assay on primary fibroblasts from ayoung patient affected by PD, her mother and a healthy control to analyze the occurrence of mtDNAmutations, lysosomal abundance, acidification and function, mitochondrial biogenesis activation andsenescence. We showed synergistic alterations in lysosomal functions and mitochondrial biogenesis,likely associated with a mitochondrial genetic defect, with a consequent block of mitochondrialturnover and occurrence of premature cellular senescence in PARK2-PD fibroblasts, suggesting thatthese alterations represent potential mechanisms contributing to the loss of dopaminergic neurons.
Keywords: Parkinson’s disease; lysosome; autophagy; endocytosis; mitochondria
1. Introduction
Parkinson’s disease (PD) is one of the most common neurodegenerative disorders, second onlyto Alzheimer’s disease. PD is characterized by motor symptoms as bradykinesia, resting tremor,postural instability, and muscle rigidity together with non-motor signs such as anosmia, sleep disorders,depression and, with disease progression, dementia. The principal features of PD are the selective lossof dopaminergic neurons in the substantia nigra pars compacta and the presence of protein aggregates(e.g., Lewy bodies, LB) in remaining neurons post mortem [1].
The pathological mechanisms of PD are largely unknown, although it has been establishedthat multifactorial and genetic causes are involved. Associated with exposure to environmentaltoxins [2], most PD cases are sporadic, while only about 10% are familial, frequently of early onset [3]and correlated with monogenic mutations in 15 causative genes. Among these, mutations in theleucine-rich repeat kinase 2 gene (LRRK2) [4] or in the α-synuclein gene [5] are causes of PD autosomaldominant forms, whereas genes involved in autosomal recessive PD include parkin [6], PTEN-induced
Cells 2019, 8, 452; doi:10.3390/cells8050452 www.mdpi.com/journal/cells
Cells 2019, 8, 452 2 of 22
putative kinase 1 (PINK1) [7], DJ-1 [8] and ATP13A2 [9]. Moreover, mutations in many other genes,identified through genome-wide association studies, correlate with increased risk to develop thedisease. Interestingly, most of the proteins encoded by these genes are implicated in mitochondrialquality control pathways, varying from mitochondrial proteins to proteins regulating endo-lysosomalfunction [10].
Several studies have demonstrated impairment of mitochondrial respiratory complex I (CI) functionin in vivo and in vitro models of PD, as well as in human parkinsonism due to intoxicants [11,12].Environmental exposure to neurotoxin 1-methyl-4-phenyl- 1,2,3,6-tetrahydropyridine (MPTP), aninhibitor of mitochondrial CI, determines depletion of ATP production, Reactive Oxygen Species(ROS) production, degeneration of dopaminergic neurons and parkinsonism [13]. Also, mitochondrialdysfunction and neurotoxicity are caused by transport of herbicide paraquat, which is reduced byNADPH oxidase in microglia, into dopaminergic neurons [14]. Moreover, rotenone, a well-establishedCI inhibitor, is a pesticide that induces parkinsonian phenotype in animal models [15], andenvironmental exposure to this compound may increase the risk of PD also in humans [2].
Interestingly, mitochondrial dysfunction was also induced by PD-linked mutations [16,17]. Indeed,dysfunction of CI, dissipation of mitochondrial membrane potential, disruption of Ca2+ homeostasis,and enhanced release of cytochrome c were observed in cellular and animal models with solubleprefibrillar α-synuclein oligomers [16]. 4-hydroxynonenal, a lipid peroxidation product, promotes, inan in vitro model of PD, the accumulation of α-synuclein aggregates and the extrusion of extracellularvesicles (EVs) containing toxic α-synuclein [18]. Internalization of these EVs into neighboring neuronscauses their degeneration finally resulting in the development of PD [18]. Mitochondrial fragmentationand neuronal death were observed also in PD patients with mutations in the Vacuolar Protein Sorting35 (VPS35) gene, encoding a key component of the retromer complex which regulates the process oftransmembrane protein sorting between endosomes and the Golgi [19]. Consistently, VPS35 deficiencytoo leads to mitochondrial dysfunction and finally results in the loss of dopaminergic neurons [20].Glucocerebrosidase (GBA1) gene mutations are the most common genetic risk factor for PD [21].Glucocerebrosidase 1 (GCase 1) catabolizes the glycolipid glucocerebroside to ceramide and glucosein lysosomes [22]. Interestingly, inhibition of GCase 1 enzymatic activity, or GBA1 silencing causesimpairment of mitochondrial function in SH-SY5Y, with deficit in the mitochondrial respiratory chainactivity, mitochondrial depolarization and fragmentation, and elevated levels of ROS [23].
Notably, the familial forms of PD associated with mutations in genes important in the regulationof the autophagic–lysosomal pathway often show mitochondrial deficit [20,24–26]. In fact, α-synucleinaggregation and LRRK2 mutations determine, through different mechanisms, dysregulation ofautophagic and endo-lysosomal pathways, but also mitochondrial dysfunction [27–30]. On theother hand, a rapid increase in the transcriptional level of a number of lysosomal genes was induced byacute exposure of mouse embryonic fibroblasts to rotenone, while a marked decrease in the expressionof the same genes was caused by chronic treatment [31].
What emerges from the knowledge obtained so far on the molecular mechanisms of non-idiopathicPD pathogenesis is that the crosstalk between lysosomes and mitochondria plays a central role. Indeed,both parkin and PINK1 are involved in the mitophagy process, needed for clearance of dysfunctionalmitochondria [32]. Mitophagy is activated by mitochondrial damage following by PINK1 stabilizationon the outer mitochondrial membrane, direct PINK1 phosphorylation and mitochondrial recruitmentof parkin. Activated parkin, which is a multifunctional E3 ubiquitin ligase, polyubiquitinatesmitochondrial proteins, leading to their association with the ubiquitin-binding domains of autophagyreceptors, causing the formation of the autophagosome, its subsequent fusion with lysosomes and,finally, mitochondrial autophagic degradation [33].
Lysosomal dysfunction and enlargement of the lysosomal compartment is induced by PINK1depletion [34]. In addition, inhibition of the mitochondrial ATP-synthase using oligomycin [34] andknockout of TFAM, the major transcription factor for mitochondrial biogenesis determine lysosomalcompartment defects [35]. Furthermore, the PD-related protein DJ-1, localized to mitochondria [36,37],

Cells 2019, 8, 452 3 of 22
is involved in both mitochondrial function and autophagy. DJ-1 silencing in M17 neuroblastomacell line causes a reduction of mitochondrial membrane potential, mitochondrial fragmentation andaccumulation of autophagy markers [38].
Altogether, these data suggest that in PD lysosomal function may be influenced by mitochondrialquality control, dynamics and/or respiration. However, whether dysfunction of the autophagy–lysosomalpathway is associated with mitochondrial impairment determining accumulation of defectivemitochondria through failed mitophagy/autophagy, or other pathways, has not been clarified.
Mutations in parkin gene (PARK2) cause inherited juvenile parkinsonism and since these mutationswere discovered, about half of all Parkinson’s disease cases have been correlated to mutations inthis gene.
In this work, primary fibroblasts from a patient affected by a juvenile form of PD with a compoundheterozygous deletional mutation of PARK2 gene, previously used to characterize mitochondrialdysfunction [39], were studied. We showed synergistic alterations in lysosomal function and inmitochondrial biogenesis. We concluded that this scenario, likely associated with mitochondrialgenetic defects and characterized by block of mitochondrial turnover and occurrence of prematurecellular senescence, could be one of the mechanisms contributing to the loss of dopaminergic neurons.
2. Materials and Methods
2.1. Skin Fibroblasts and Culture Conditions
Primary fibroblasts from a young patient affected of PD juvenile form (PARK2-PD, 36 yearsold), the mother (parental healthy control, CTR2, 59 years old) [39] and a healthy control (CTR1,46 years old) [40], were obtained by explants from skin punch biopsy, after informed consent, aspreviously described. CTR2 and PARK2-PD cells were previously described and indicated as CTRLand P1, respectively [39]. PARK2-PD cells carry a compound heterozygous deletional mutation ofPARK2 (del exon2-3/del exon3), while the CTR2, unaffected parental control, displays the heterozygousdel exon2-3 [39]. Cells were grown in high-glucose Dulbecco’s modified Eagle’s medium (DMEM,Corning, NY, USA) supplemented with 20% (v/v) fetal bovine serum (FBS), 1% (v/v) L-glutamine,1% (v/v) penicillin/streptomycin (Sigma-Aldrich, St. Louis, MO, USA) at 37 ◦C in a humidifiedatmosphere of 5% CO2. All experiments were performed on cells with similar passage numbers.For starvation in nutrient-depleted medium, cells were incubated in Earle’s Balanced Salt Solution(EBSS) (Sigma-Aldrich, Saint Louis, MO, USA) for 3 h at 37 ◦C in a humidified atmosphere of 5% CO2.
2.2. NSC34 Cells and Culture Conditions
The mouse motoneuron-like hybrid cell line NSC34 [41] was cultured in Dulbecco’s modifiedEagle’s medium (DMEM, Corning, NY, USA) supplemented with 10% (v/v) fetal bovine serum (FBS),1% (v/v) L-glutamine, 1% (v/v) penicillin/streptomycin (Sigma-Aldrich, St. Louis, MO, USA) at 37 ◦C ina humidified atmosphere of 5% CO2. Rotenone (Santa Cruz Biotechnologies, Dallas, TX, USA), aninhibitor of mitochondrial complex I, used to induce Parkinson-like syndrome as an experimentalmodel in rats, was added to the culture medium at 100 nM for 24 h.
2.3. Immunofluorescence and Live Microscopy
For immunofluorescence analysis cells grown on 11 mm round glass coverslips were permeabilizedwith piperazine-N,N′-bis(2 ethanesulfonic acid) (PIPES)-Saponin 0.1% buffer for 2 min, fixed in 3%paraformaldehyde for 20 min, washed in Phosphate Buffer Saline (PBS)-Saponin 0.1%, treated withNH4Cl (50 mM) for 10 min and incubated with the primary antibody in PBS- Saponin 0.1% for20 min. After 3 washes with PBS-Saponin 0.1%, samples were incubated for 20 min with the secondaryantibody in PBS-Saponin 0.1%, washed three times with PBS-Saponin 0.1% and finally rinsed in PBS1×. Coverslips were then mounted on a drop of Mowiol (Calbiochem-Novabiochem Corporation,La Jolla, CA, USA). For LAMP1 staining we used mouse anti-LAMP1 (H4A3), deposited to the

Cells 2019, 8, 452 4 of 22
Developmental Studies Hybridoma Bank (University of Iowa, Iowa City, IA, USA) by J.T. August andJ.E.K. Hildreth at 1:250 dilution, and goat anti-mouse AlexaFluor488 (ThermoFisher, Carlsbad, CA,USA) at 1:500 dilution.
For live microscopy, cells were seeded into microscopy chambers (8 well µ-slide, Ibidi GmBh,Martinsried, Germany) and, after 24 h, incubated with 1 µM LysoTracker Red DND-99 for 30 min at37 ◦C, 1 µM LysoSensor Blue DND-167 or 1 µM LysoSensor Yellow/Blue DND 160 for 5 min at 37 ◦C.These dyes were from ThermoFisher Scientific (Carlsbad, CA, USA) and are characterized by aminegroups, which are partially protonated at neutral pH and fully protonated at acidic pH. In particular,LysoTracker DND-99 fluorescence is somewhat pH-independent, while LysoSensor DND-160 andDND-167 are able to detect compartments within the pH range of 3.5–6.0 and 4.5–6.0, respectively [42].After 3 washes in PBS, L-15 medium (Leibowitz medium without phenol red, Gibco, ThermoFisher) wasadded and the cells were imaged by confocal microscopy. We used also MitoTracker Green FM (500 nM)or MitoTracker Red CM-H2XROS (500 nM) (ThermoFisher Scientific) as described previously [43].Briefly, cells were incubated with the dyes for 45 min at 37 ◦C in DMEM medium without serum. After3 washes in PBS, L-15 medium was added and cells were imaged by confocal microscopy.
Fluorescence images were captured using a confocal laser scanning microscope (CLSM) (Zeiss,LSM 700, Germany) equipped with a laser diode emitting at 405 nm, an argon-ion laser for excitationat 488 nm, and a helium-neon laser for excitation at 555 nm.
Emission intervals for individual dyes were: AlexaFluor488: 495–550 nm (λex = 488 nm);LysoTracker DND-99: 560–615 nm (λex = 555 nm); LysoSensor DND-167: 415–500 nm (λex = 405 nm);LysoSensor DND-160: 500–590 nm (λex = 405 nm); MitoTracker Green FM: 495–550 nm (λex = 488 nm)and MitoTracker Red CM-H2XROS: 560–615 nm (λex = 555 nm). Images were taken with aPlan-Apochromat 63.0 × 1.40 oil- immersion objective DIC M27 and the pinhole aperture was set to1 Airy unit. The images were acquired using ZEN Black Edition 2011 software (Zeiss, Jena, Germany).
Intensity of fluorescence was determined by ImageJ software (Version 1.5Oi, Bethesda, MD, USA)and it was calculated as intensity/cell normalizing on the area of each single cell. Measures wereobtained by analyzing at least 50 cells/sample in at least three independent experiments.
2.4. DQBSA (Self-Quenched BODIPY Dye Conjugates of Bovine Serum Albumin) Assay
Cells were seeded on 11 mm round glass coverslips and incubated in the presence of Red DQ-BSA(10 µg/mL) or Green DQ-BSA (50 µg/mL) (ThermoFisher Scientific, Carlsbad, CA, USA) for 24 h (forNSC34 Cells) or 48 h (for fibroblasts) at 37 ◦C with full medium in a humidified atmosphere of 5% CO2.Subsequently, cells were fixed in methanol, incubated with DAPI dye (1 µg/mL) and analyzed withLSM 700 confocal microscope (Zeiss). DAPI was excited with 405 nm laser diode and emission wascollected from 405 nm to 490 nm. Emission intervals: Red DQBSA = 560–615 nm (λex = 555 nm) andGreen DQBSA = 495–550 ((λex = 488 nm). Images were taken with a Plan-Apochromat 63.0 × 1.40 oil-immersion objective DIC M27 and the pinhole aperture was set to 1 Airy unit. Images were acquiredusing ZEN Black Edition 2011 acquisition software (Zeiss, Germany).
Intensity of fluorescence was determined by ImageJ software (Version 1.5Oi, Bethesda, MD, USA).Intensity of fluorescence was calculated as intensity/cell normalizing on the area of each single cell.Measures were obtained by analyzing at least 50 cells/sample for at least three different experiments.
2.5. Western Blotting
Cells were lysed in Laemmli Buffer (100 mM Tris–HCl, pH 6.8, containing 4% SDS, 20% glyceroland 0.2% blue bromophenol). The protein amount in cell extracts was quantified loading extracts onCoomassie Blue gel (12% SDS-PAGE) together with a control lysate of known concentration and usingImageJ software to quantify. On each well of SDS-PAGE gels about 20 to 50 µg of lysates were loaded.Western blotting was performed as described [44]. Antibodies against RAB7A, ATP6V1G1, TFAM,Cathepsin D, GAPDH were from Santa Cruz Biotechnology (Dallas, TX, USA). Antibody againstLC3 was from Nanotools (GmbH and Co. KG, Teningen, Germany), anti-p62 from BD Biosciences

Cells 2019, 8, 452 5 of 22
(San Jose, CA, USA), anti-p21 and anti-LAMP1 from Abcam (Cambridge, MA, USA). We used gelsat 12% of acrylamide to detect RAB7A and p62, at 15% of acrylamide to detect ATP6V1G1, TFAM,LC-3, p21 and at 10% of acrylamide to detect Cathepsin D and LAMP1. Anti-α-tubulin was fromSigma-Aldrich (St Louis, MO, USA). Secondary anti-mouse and anti-rabbit antibodies, conjugatedwith HRP, were from Biorad (Hercules, CA, USA). Bands were detected using Clarity Max TM WesternECL substrate (Biorad) and UltraCruz Autoradiography (X-ray) film (Santa Cruz Biotechnology).Briefly, polyvinylidene difluoride membrane (PVDF) was blocked in Milk 5% in PBS/Tween 0.1% for1 h, incubated with primary antibody in 5% defatted milk in PBS-Tween 0.1% for 1 h, washed threetimes in PBS/Tween 0.1%, incubated with secondary antibody in defatted Milk 5% in PBS/Tween 0.1%for 30 min and washed three times with PBS-Tween 0.1%. Substrate kit components were mixed 1:1and membrane was incubated for 5 min before of exposure in X-Ray film cassette. Images were thenacquired with Epson Perfection V600 Scanner (Epson, Suwa, Japan) and bands were quantified bydensitometry using ImageJ software (Version 1.5Oi, Bethesda, MD, USA) normalizing against α-tubulinor GAPDH.
2.5.1. Maturation of Cathepsin D
Cathepsin D is a lysosomal protease synthesized as preprocathepsin D precursor, converted intoprocathepsin D (52 kDa) in the endoplasmic reticulum, and further processed in the acidic milieu oflate endosomes and lysosomes, into the 44-kDa form and finally into the 32-kDa mature form [45].Maturation of Cathepsin D was evaluated through western blotting analysis with an anti-Cathepsin-Dantibody (Santa Cruz Biotechonolgy) that recognizes, not only the 32 kDa mature form, but also the52 kDa and 44-kDa immature forms. Protein levels were quantified by densitometry with ImageJsoftware and amount of maturation was expressed as ratio between immature forms (52/44 kDa) andmature form (32 kDa).
2.5.2. Autophagic Flux
To examine the autophagic flux, we determined if LC3 is degraded in a lysosomal-dependentmanner by using Bafilomycin A, an inhibitor of lysosomal acidification but also, independently of itseffect on lysosomal pH, of fusion between autophagosomes and lysosomes [46–48]. To this purpose,fibroblasts were incubated with full medium (untreated) or with medium containing BafilomycinA (400 nM for 3 h). Western blot analysis was performed on cell lysates using antibodies againstLC3 (Nanotools) and α-tubulin (Sigma-Aldrich). The amount of LC3 II was calculated normalizingon α-tubulin, through densitometric analysis using ImageJ software, and the autophagic flux wascalculated as the ratio of LC3II of cells treated with Bafilomycin A and untreated.
2.6. Nucleic Acid Extraction and Whole mtDNA Amplification, Sequencing and Mutation Screening
Whole genomic DNA was extracted using Mammalian Genomic DNA Miniprep Kit(Sigma-Aldrich) according to the manufacturer’s protocols. Sanger sequencing of the entire mtDNAwas performed following a quality-check protocol as previously described [49]. Mitochondrial DNAmutations were confirmed using a second PCR reaction. In silico prediction of the pathogenic potentialof missense mutations was performed with PolyPhen2 (http://genetics.bwh.harvard.edu/pph2/) aspreviously described [50]. FASTA files were used as input for MToolBox [51] in order to annotatemitochondrial variants and related features, which read mapping, post-mapping processing, genomeassembly, haplogroup prediction and variant annotation. Nucleotide site-specific variability wasestimated on the multi-alignment of the updated healthy genomes reported in HmtDB [52] and inHmtVar [53].
2.7. Senescence-Associated Beta-Galactosidase (SA-βgal) Activity Assay
The SA-β-Gal activity assay was performed as previously described [54]. Briefly, cells were seededin 6-well plates and, after 24 h, washed twice with PBS and then incubated for 7 min with a fixation

Cells 2019, 8, 452 6 of 22
solution (2% formaldehyde and 0.2% glutaraldehyde). Cells were then washed five times with PBS andincubated with a staining solution (40 mM citric acid/Na phosphate buffer pH 6, 1 mg/mL X-gal, 5 mMK4[Fe(CN)6]3H2O, 5 mM K3[Fe(CN)6], 150 mM NaCl and 1 mM MgCl2 in ddH2O) at 37 ◦C overnightor until β-Gal staining became visible. Cells were finally washed five times with PBS and once inmethanol. Image acquisition and cell counting was performed using EVOS FL Auto Cell ImagingSystem (ThermoFisher) with UPlanFLN 4 × 0.13 PhP (Olympus, Shinjuku, Tokyo, Japan).
2.8. Statistical Analysis
All experiments were repeated at least three times and represented as mean ± standard error (SE).Statistical significance was determined for all experiment through Student’s t test for unpaired data(* p ≤ 0.05, ** p ≤ 0.01 and *** p ≤ 0.001).
3. Results
3.1. PARK2-PD Fibroblasts Display Abnormal Abundance, Acidification and Morphology of the LateEndocytic Compartment
Previous data obtained on PARK2-PD fibroblasts harboring a compound heterozygous deletion (delexon2-3/del exon3) in PARK2 displayed mitochondrial defects and Peroxisome proliferator-activatedreceptor Gamma Coactivator 1-alpha (PGC-1α) dysfunction [39], severe ultrastructural abnormalities,mainly in mitochondria and cytoskeleton [39,55], and altered expression level of several proteinsinvolved in cytoskeleton structure dynamics, Ca2+ homeostasis, oxidative stress response proteinand RNA processing [56,57]. Considering the cross-talk between lysosomes and mitochondria in PDand that lysosomal function can be influenced by mitochondrial activity [58], we decided to monitorlysosomal morphology, size, distribution and activity.
We started by monitoring intracellular distribution of lysosomes in healthy control cells (CTR1), inunaffected parental control cells (CTR2) and in patient’s fibroblasts (PARK2-PD) through live imagingmicroscopy using specific vital dyes to stain acidic organelles such as LysoTracker DND-99, LysoSensorDND-160 and LysoSensor DND-167 (Figure 1A). As shown in Figure 1A, PARK2-PD cells displayed asignificant increase of acidic compartments stained with LysoSensor DND-160 or with LysoTrackerDND-99 and intensity quantification revealed about 3 and 1.5-fold change, respectively, for dyesstaining in PARK2-PD cells compared to control cell lines (Figure 1B). Instead, staining with LysoSensorDND-167 did not reveal a significant difference in the abundance of labeled organelles (Figure 1A,B)suggesting that only lysosomes with lower pH are affected, considering the pH range of detection ofthe dye. Similarly, immunofluorescence analysis using antibodies against the lysosomal-associatedmembrane protein 1 (LAMP-1), a marker of late endosomes and lysosomes, did not reveal anysignificant increase. Interestingly, we also observed altered lysosomal morphology with abnormallylarge peripheral organelles in PARK2-PD cells (Figure 1C).
RAB7A is a small GTPase with a central role in the late endocytic pathway [59–61]. It is pivotal incontrolling the early and late endosome maturation, lysosomal biogenesis and acidification, but alsoclustering and fusion of late endosomes and lysosomes in the perinuclear region [61,62]. Moreover,RAB7A regulates pH of endocytic organelles by controlling assembly and activity of the vacuolarATPase (V-ATPase) on RAB7A-positive organelles through the interaction of the RAB7A effector RILP(Rab Interacting Lysosomal Protein) with the ATP6V1G1 subunit of the V-ATPase [63,64].
Considering the RAB7A role in regulating lysosomal biogenesis and functions, as well as lysosomalpH controlling V-ATPase assembly and activity, we performed western blotting analysis to evaluatethe expression level of RAB7A and of the ATP6V1G1 subunit of V-ATPase (Figure 1D). We found asmall but significant RAB7A reduction (10%) in PARK2-PD compared to CTR1 and about 80% and 40%reduction of ATP6V1G1 compared to CTR1 and CTR2, respectively (Figure 1D,E).
Altogether these results indicate that PARK2-PD cells are characterized by altered acidification ofendocytic compartments confirmed by downregulation of ATP6V1G1 expression.

Cells 2019, 8, 452 7 of 22
Figure 1. Alterations of late endocytic compartments in PARK2-PD cells. (A) Cells were labeledlive with LysoSensor DND-160 (yellow), with LysoSensor DND-167 (blue) and with Lysotracker RedDND-99 or were fixed and immunostained with anti-LAMP1 antibody (green). White dashed boxesindicate zoomed areas on the right. Scale bar: 10 µm. (B) Immunofluorescence intensity was quantifiedby ImageJ software. Data represent the mean ± s.e.m. (three independent experiments, ≥ 20 cells).(C) Staining with LysoSensor DND-160 (yellow) and with LysoSensor DND-167 (blue) show enlargedlysosomes in PARK2-PD cells. White dashed boxes indicate zoomed areas on the right. Scale bar:10 µm. (D,E) Relative protein abundance of RAB7A and ATP6V1G1 was assessed by western blottingand quantified by densitometry normalizing against GAPDH. Data represent the mean ± SE of at leastthree independent experiments (* p ≤ 0.05, ** p ≤ 0.01 *** p ≤ 0.001).
3.2. Lysosomal Function Is Impaired in PARK2-PD Fibroblasts
With the aim of understanding if altered acidic compartments in PARK2-PD fibroblast weredysfunctional, we decided to perform a DQBSA assay to detect lysosomal proteolytic activity [65].Indeed, this dye is strongly self-quenched and digestion of the BSA conjugates results in dequenchingas the dye-labeled released protein fragments are brightly fluorescent. Moreover, DQBSA is insensitiveto pH from pH 3–11 allowing the direct detection of proteolytic activity in situations where thepH is unknown and cannot be controlled or where the pH is known to be low (e.g., lysosomesand endosomes).
Cells 2019, 8, 452 8 of 22
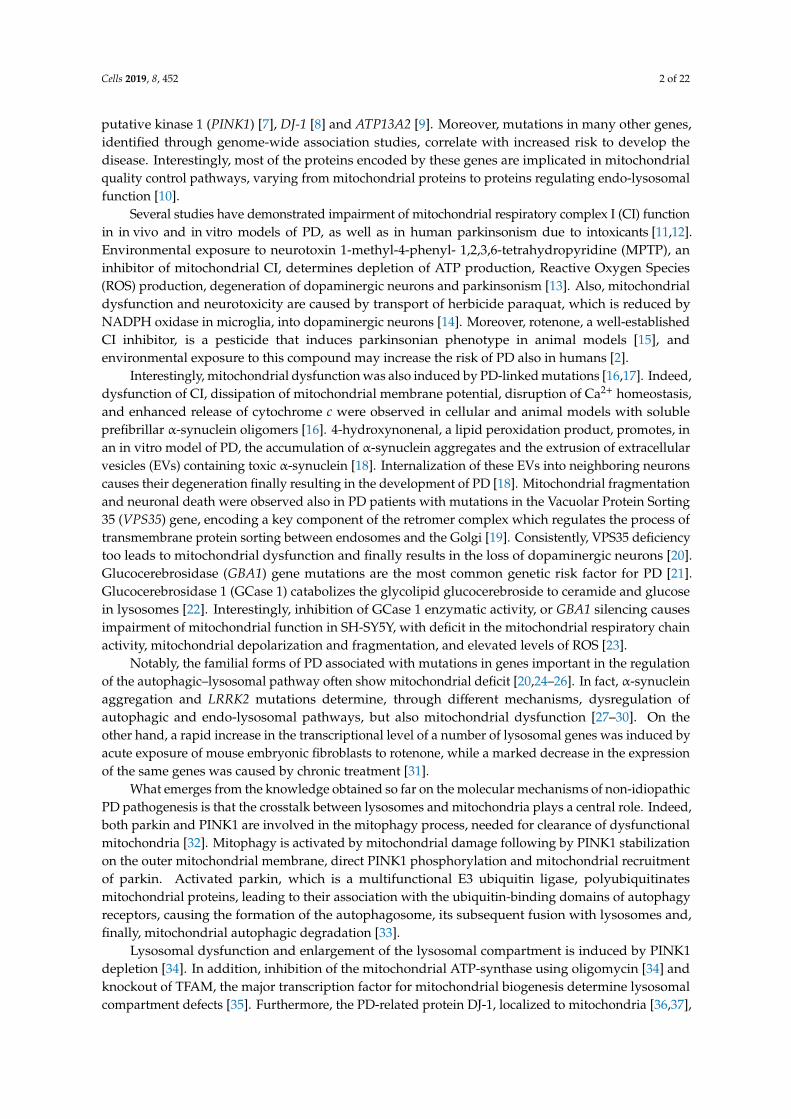
As shown in Figure 2A, control cells had similar proteolytic activity, as measured with the DQBSAassay although CTR2 (the unaffected mother of the proband) had lower values. In contrast, patient’sfibroblasts were characterized by a significant reduction (55% and 40%) of DQBSA intensity comparedto CTR1 and CTR2 respectively, indicating that these cells display strongly decreased proteolyticactivity of late endocytic organelles (Figure 2B).
Figure 2. Alterations of lysosomal activity in PARK2-PD cells. (A,B) Cells were incubated in thepresence of Red DQ-BSA and immunofluorescence intensity was quantified by ImageJ software. Nucleiwere labeled with DAPI (blue). Scale bar: 10 µm. (C,D) Relative abundance of three Cathepsin D formswas assessed by western blotting and quantified by densitometry normalizing against 32 kDa matureform. (Data represent the mean ± SE of at least three independent experiments (* p ≤ 0.05, **p ≤ 0.01*** p ≤ 0.001).
Cathepsin D is an aspartic-type lysosomal protease, ubiquitously expressed in all the cells andparticularly expressed at a high level in the brain. In brain Cathepsin D assures neuronal homeostasisthrough degradation of unfolded or oxidized protein aggregates delivered to lysosomes via autophagyor endocytosis. In neurodegenerative disease, abnormal accumulation of neuronal proteins (e.g.,the amyloid precursor, α-synuclein, and huntingtin) are due to diminished or abolished activity ofCathepsin D [66].
In order to confirm the alterations suggested by the DQBSA assay, we monitored cathepsin Dmaturation in the three cell lines through western blot analysis (Figure 2C). The ratio between the twoimmature forms and the 32-kDa mature form was strongly altered in PARK2-PD cells. Indeed, weobserved a significant four-fold increase of immature forms in PARK2-PD cells compared to CTR1 andCTR2 controls, indicating that the pathway of Cathepsin D maturation is impaired in PARK2-PD cells(Figure 2D).
Altogether, these data strongly indicate that the lysosomal compartment is dysfunctional inPARK2-PD fibroblasts.
3.3. Autophagic Flux Is Impaired in PARK2-PD Fibroblasts
In order to establish if the alterations detected in the endocytic pathway also affected the autophagicprocess, we decided to analyze through western blot analysis the expression of microtubule-associatedprotein light chain 3 (LC3) and p62, two known markers of autophagy [67]. Indeed, during thephase of elongation/nucleation of the phagophore, LC3 is cleaved to form LC3-I and subsequentlyconjugated to phosphatidylethanolamine (PE) to form LC3-II, localizing on isolation membrane andautophagosomes [48,68]. For this reason, the amount of LC3 reflects the number of autophagosomes

Cells 2019, 8, 452 9 of 22
and autophagy-related structures. Instead, p62 is directly bound to LC3 and selectively degradedduring the autophagic process [69]. As shown in Figure 3A and in subsequently densitometric analyses(Figure 3B,C), PARK2-PD cells revealed a significant increase of the LC3II/LC3I ratio (about 2 fold)compared to controls and a significant reduction of p62 of about 85% and 120% compared to CTR1 andCTR2, respectively.
Figure 3. Alterations of autophagy in PARK2-PD cells. (A–C) Expression of LC3I, LC3II and p62 wasevaluated through western blotting analysis. Densitometric analysis was performed, LC3I/ LC3II ratiowas calculated and p62 expression was normalized against GAPDH. (D,E) Cells were incubated with(full medium) FM or (bafilomycin A) BAF and western blotting was performed for LC3 and α-tubulin.The autophagic flux was calculated as the ratio of LC3 between BAF and FM of the same sample.Data represent the mean ± SE of at least three independent experiments (* p ≤ 0.05, ** p ≤ 0.01 *** p ≤ 0.001).
The autophagic activity is not necessarily estimated through measurements of the LC3 amountbecause inhibition of autophagosome degradation also increases LC3 amount and LC3 can localize tonon-autophagosomal structures, which are excluded by lysosomal turnover [70,71]. Furthermore, p62degradation does not only indicate activation of autophagy because p62 is also involved in a numberof other signaling pathways [72].
To this purpose, to better study autophagy in these cells, we have evaluated the autophagicflux and we found that both CTR2 and PARK2-PD showed an autophagic flux significantly impairedcompared to CTR1 control cells (Figure 3D,E).
Altogether, these results indicate that in PARK2-PD fibroblasts autophagic flux is compromised.
3.4. Mitochondrial DNA Mutations and Biogenesis Dysfunction in PARK2-PD Fibroblasts
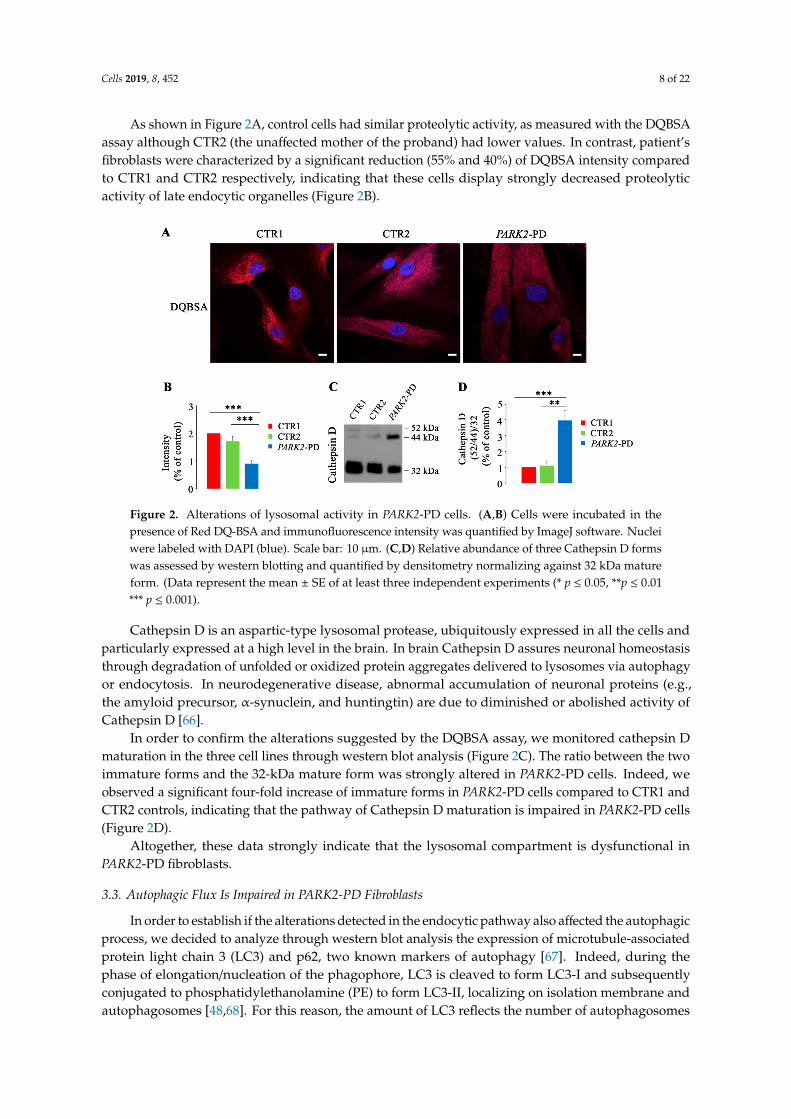
Mitochondrial impairment in PARK2-PD cells compared to CTR2 has been already described [39].To further investigate this issue, we searched for genetic alterations in the mitochondrial DNA (mtDNA)as they could be one of the causes of mitochondrial dysfunction. Thus, we sequenced the wholemtDNA of CTR1, CTR2 and PARK2-PD cells. CTR2 and PARK2-PD cells displayed the same arrayof variants describing the two cells as belonging to the same haplogroup and providing a qualitycontrol to confirm the two subjects were of the same family. Interestingly, we found two heteroplasmicmissense mutations in the mtDNA of CTR2 (m.6076T>C in MT-COXI and m.13676A>G in MT-ND5),predicted in silico as possibly damaging, and a heteroplasmic frameshift mutation in the mitochondrial
Cells 2019, 8, 452 10 of 22
genome of PARK2-PD (m.6692delA in MT-COXI) (Figure 4A). Since these mutations were detectedat very early passages of both fibroblast lines, we exclude such mutations to be artifacts occurredsubsequent to culturing, as it would take much longer for them to accumulate to the high loads ofheteroplasmy that we here observed. Amino acid change, nucleotide variability and disease score forCTR2 mtDNA mutations are reported in Table 1.
Figure 4. Mitochondrial defects in PARK2-PD cells. (A) Electropherograms of mitochondrial lociharboring mutations in CTR2 and PARK2-PD cells. Red arrows indicate the mutated and deletedbases. (B,C) Relative protein abundance of TFAM was assessed by western blotting and quantifiedby densitometry normalizing against α-tubulin. (D–F) Staining in live imaging of mitochondria withMitoTracker Green FM (green) and MitoTracker CM-H2XRos (red) in the three cell lines. Quantificationof different intensities was performed with ImageJ software and represented in histograms (threeindependent experiments, ≥ 20 cells). Scale bar: 10 µm. Data represent the mean ± SE of at least threeindependent experiments (* p ≤ 0.05, ** p ≤ 0.01 *** p ≤ 0.001).

Cells 2019, 8, 452 11 of 22
Table 1. Analysis of CTR2 mtDNA mutations.
Variant Gene Amino AcidChange
Polyphen2Score
NucleotideVariability
m.6076T>C MT-COXI V58A 0.783 0.000277m.13676A>G MT-ND5 D447S 0.51 0.0005
Mitochondrial DNA mutations, mostly when they induce mitochondrial respiratory chaindysfunction, may trigger compensatory activation of mitochondrial biogenesis with the aim to increasemitochondrial turnover [73,74]. At the same time the presence in a cell of damaged/dysfunctionalmitochondria may trigger autophagy with the aim to rid the cytoplasm of organelles with a derangedOXPHOS. Cells energy demand induces mitochondrial biogenesis and, among others, the MitochondrialTranscription Factor A (TFAM), through its several functions, regulates such process [75]. Thus, welooked at TFAM expression in control and patient cells and we observed a significant downregulationof TFAM both in PARK2-PD and in CTR2 cells of about 65% and 40% compared to CTR1, respectively(Figure 4B,C). Also, TFAM was reduced in PARK2-PD of about 40% compared to CTR2 (Figure 4B,C),likely in agreement with the more damaging nature of the frameshift mutation in Complex IV, thebottleneck complex of the respiratory chain, and with the low expression of respiratory chain subunitpreviously reported [39].
To more deeply understand the mitochondrial phenotype in PARK2-PD cells, we performeda quantification of mitochondrial mass and of mitochondrial membrane potential using twodifferent probes: MitoTracker Green FM, which stains mitochondria regardless of mitochondrialmembrane potential and is an indicator of mitochondrial mass and MitoTracker Red CM-H2XROS,whose accumulation in mitochondria depends on mitochondrial membrane potential [42,43].Using MitoTracker Green we observed a different intracellular distribution of mitochondria inPARK2-PD cell compared to CTR1 and CTR2 (Figure 4D). Indeed, in CTR1 and CTR2 mitochondriawere uniformly distributed in the cytoplasm, while in PD cells these organelles were mainly clusteredin the perinuclear region (Figure 4D). Moreover, intensity quantification of MitoTracker Green signalrevealed a decreased staining of about 20% for CTR2 and of about 70% for PARK2-PD comparedto CTR1, indicating a strong and significant reduction of the mitochondrial mass in patient cells(Figure 4E). In contrast, MitoTracker Red CM-H2XROS staining showed a similar disperse distributionof mitochondria in the cytoplasm of control and patient cells but a decreased staining for CTR2 andPARK2-PD. In fact, quantification using ImageJ software revealed a significant reduction of signal ofabout 20% and 70% in CTR2 and PARK2-PD, respectively (Figure 4F). These data indicate a reductionof the mitochondrial membrane potential in PARK2-PD cells.
These results demonstrate that the discovered mtDNA mutation is associated to mitochondrialdysfunction in PARK2-PD fibroblasts, and suggest that there is no compensatory activation ofmitochondrial biogenesis as TFAM and other PGC-1α downstream target genes are downregulated orunchanged [39].
Interestingly, after staining with LysoSensor DND-160 we observed, only in PARK2-PD cells,peripheral structures very similar to mitochondria. In Figure 5A, two examples of PD cells labeled withLysoSensor DND-160 are shown (Figure 5A). To clarify the nature of these structures, we performeddouble staining using LysoSensor DND-160 and MitoTracker Red CM-H2XROS and we were ableto find a number of organelles labeled by both dyes, thus confirming that they are mitochondria(Figure 5B).
Using MitoTracker Red CM-H2XROS and MitoTracker Green FM staining, in PARK2-PD cells,we could frequently observe mitochondria labeled with both dyes in peripheral structures similarto filopodia and connecting cells (Figure 5C). This suggests that PARK2-PD cells, in which bothmitochondrial biogenesis and autophagic flux are blocked, may attempt to compensate for the energeticdeficit through transfer of mitochondria.

Cells 2019, 8, 452 12 of 22
Figure 5. Altered intracellular distribution of mitochondria in PARK2-PD cells. (A,B) Mitochondrialand lysosomal staining in PARK2-PD cells was performed with LysoSensor DND-160 (yellow) andMitoTracker CM-H2XRos (red). In A two different PARK2-PD cells labeled with LysoSensor DND-160are shown. In B a peripheral detail of a cell labeled with LysoSensor DND160 and MitoTrackerCM-H2XROS is shown (C) Staining with MitoTracker Green FM (green) and MitoTracker CM-H2XRos(red) in PARK2-PD cells showing mitochondria in peripheral structures connecting cells suggestingmitochondrial transfer to neighboring cells. Scale bar: 10 µm.
3.5. Premature Senescence in PARK2-PD Fibroblasts
We next investigated whether, along with dysfunction of lysosomal compartment, accumulationof damaged mitochondria would induce activation of cellular senescence. This mechanism isphysiologically activated to prevent the propagation of damaged cells, but it is also associated withloss of function present in ageing and age-related diseases [76].
A shift from oxidative phosphorylation to glycolysis, already described in PARK2-PD [39] andupregulation of lysosomal senescence-associated β-galactosidase [77,78] are characteristic changesof senescent cells which, unlike apoptosis, remain viable and metabolically active. Furthermore, it isknown that dysfunctional mitochondria and increased number of lysosomes are important features ofcellular senescence [78,79]. Thus, understanding whether the impairment of mitochondrial function,influencing lysosomal/autophagy function, triggers cellular senescence would allow linking the twocellular processes in PARK2-PD. Therefore, we decided to investigate the presence of senescent cellsmeasuring activity of β-galactosidase at pH 6.0 by using in situ staining with the chromogenic substrateX-gal [54]. We performed the assay on CTR1, CTR2 and PARK2-PD cells at the same passage number(18) and we observed, as shown in Figure 6A, that PD fibroblasts were mostly senescent. Indeed, about

Cells 2019, 8, 452 13 of 22
95% of PARK2-PD cells were β-gal positive while CTR1 and CTR2 populations contained only 18%and 15% of senescent cells, respectively (Figure 6B).
Figure 6. Premature senescence in PARK2-PD cells. (A,B). Senescence-associated β-galactosidasestaining in CTR1, CTR2 and PARK2-PD cells. One representative experiment of three is shown.Magnification x4. Scale bar 75 µm. Senescent cells were counted and normalized on total amount ofcells and represented in histograms. (C,D) Protein expression of p21 was evaluated by western blottingand abundance quantified by densitometric analysis normalizing against GAPDH. Data represent themean ± SE, Standard Error of at least three independent experiments (* p ≤ 0.05, ** p ≤ 0.01 *** p ≤ 0.001).
To validate this result, we also analyzed the expression of CDKi (cyclin-dependent kinaseinhibitor) p21 as senescent cells arrest permanently their cell cycle, through regulation by p16INK4Aand p53-p21-RB (retinoblastoma). The cell cycle arrest is due initially to upregulation of p21, inducedby increased expression of p53 and then becomes permanent through inhibition of CDK4 and CDK6by p16INK4A and consequent RB hypophosphorylation, blocking entry to the S phase [80]. As shownin Figure 6C, we observed upregulation of p21 only in PARK2-PD cells with a statistically significantincrease about of 6 fold compared to CTR1 and CTR2 cells.
These results suggest that the block of mitochondrial turnover, inhibiting generation of newfunctional mitochondria, and the alterations of autophagic flux, inhibiting the efficient elimination ofdamaged organelles, may determine premature senescence in PARK2-PD fibroblasts.
3.6. Inhibition of Complex I Activity Induce Lysosomal Dysfunction
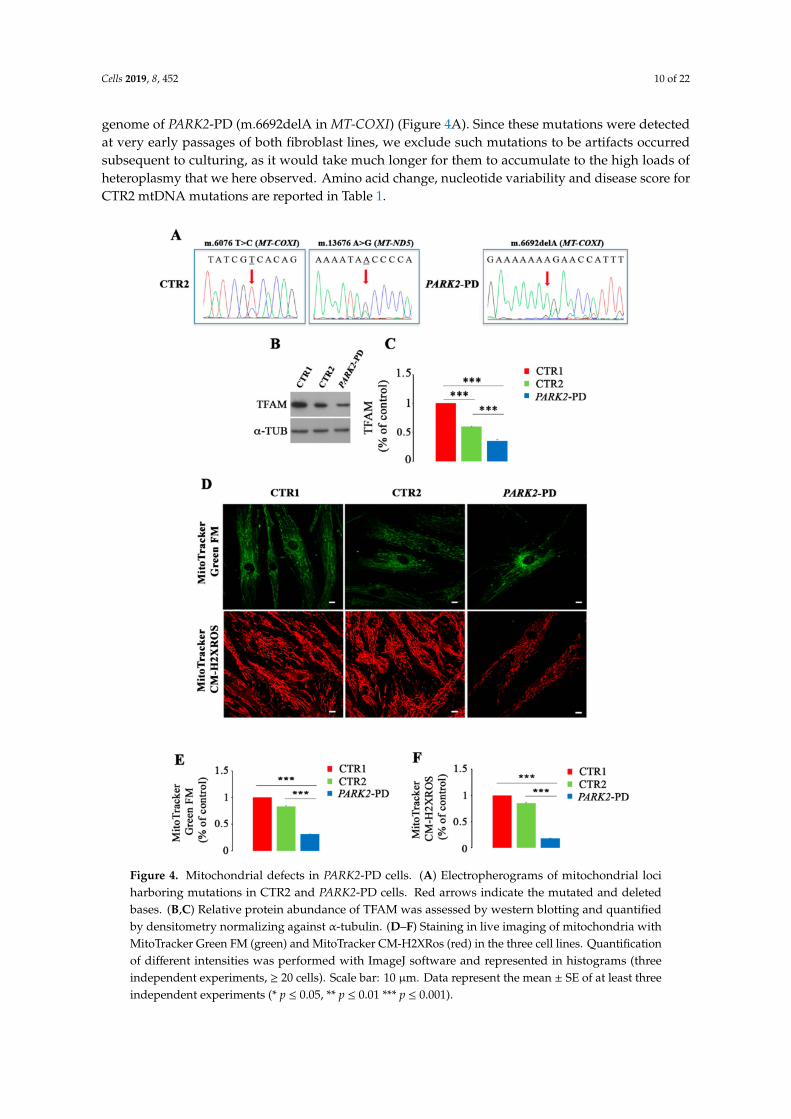
In order to understand if treatment with Rotenone, an inhibitor of complex I activity, mightinduce similar lysosomal alterations as observed in PARK2-PD fibroblasts, we treated NSC34 cells withthis drug and we analyzed structural and functional changes in lysosomes. Interestingly, in treatedcells, we found a significant decrease of Lamp-1 expression (Figure 7A,B), a significant increase ofstained lysosomes with LysoSensor DND-160 (Figure 7C) and a significant reduction of Green DQBSA(Figure 7D,E).
These results indicate that the inhibition of CI activity, inducing ROS production, may be thecause of alterations in biogenesis, morphology and function of lysosomes.
Cells 2019, 8, 452 14 of 22
Figure 7. Rotenone induces lysosomal dysfunction in NCS34 cells. (A,B) Abundance of Lamp-I wasevaluated by Western blot analysis and quantified by densitometric analysis normalizing againstα-tubulin. (C) Staining with LysoSensor DND-160 (yellow) in Mock and Rotenone-treated (100 nM)cells showing increased staining of enlarged lysosomes after treatment. Dashed boxes represent zoomedareas on the right. Scale bar: 10 µm. (D,E) Cells were incubated in the presence of Green DQ-BSAand nuclei were labeled with DAPI (blue). Fluorescence intensity was quantified by ImageJ software.Scale bar: 10 µm. Data represent the mean ± SE of at least three independent experiments (* p ≤ 0.05,** p ≤ 0.01 *** p ≤ 0.001).
4. Discussion
In this paper, we show that impairment of autophagy and lysosomal function in PARK2-PDfibroblasts is associated with mitochondrial defects, determining accumulation of non-functionalmitochondria and cellular senescence as a result of mitochondria-lysosomal cross-talk.
Our hypothesis arises from the observation that patient cells grew very slowly and werecharacterized by mitochondrial dysfunction [39]. Indeed, it was previously demonstrated that,in these cells, decrease of CI and CIV activity and defective OXPHOS capacity causes impairment ofmitochondrial function and compensatory increase of glycolysis [39]. Moreover, this is accompaniedby a remarkable dysfunction of PGC-1α, the master regulator of mitochondrial biogenesis, unable toactivate downstream target genes [39]. For these reasons, we searched for mtDNA mutations in parentalcontrol and PARK2-PD cells. We found a frameshift mutation in MT-COXI in PARK2-PD fibroblasts,possibly contributing to the observed mitochondrial impairment, and mutations in MT-COXI andMT-ND5 in the healthy parental control (CTR2). Although unexpected, these slight differences ingenotype might be as a result of the continuous shifts in heteroplasmy that unfixed mtDNA mutationsundergo, particularly in the context of cells with an impaired mitochondrial turnover such as these.Deep sequencing analyses are warranted to understand whether the same mutations indeed occurin both subjects analyzed. Indeed, they could be at too low heteroplasmic levels to be detectedby Sanger sequencing or they could represent somatic events occurred in the connective tissue ofsingle individuals.

Cells 2019, 8, 452 15 of 22
Mitochondrial respiratory complexes are organized in supramolecular associations to form “supercomplexes” with catalytic enhancement, substrate channeling, and stabilization of CI by CIII inmammalian cells [81]. Structural dependence between these complexes was confirmed by dramaticloss of CI as result of the absence of assembled CIII [82,83]. Moreover, CIV is required for assemblyand stability of CI [84]. Finally, interaction between CI, CIII and CIV in pre-respirasome structuresensures complete assembly of CI [85]. According to these data, the mtDNA mutation in MT-COXIdescribed in PARK2-PD cells, in agreement with the low protein expression described in [39], mighthave an impact on the development of the Parkinsonism, as in this case CIV may be decreasedin amount and availability to interact with CI for the proper operation of substrate channeling.Indeed, we confirmed mitochondrial impairment activity through labeling with the MitoTrackerRed CM-H2XROS fluorescent dye, whose accumulation in mitochondria depends on mitochondrialmembrane potential, and we observed reduced mitochondrial mass and perinuclear clustering, whenwe stained with MitoTracker Green FM dye, which stains mitochondria regardless of mitochondrialmembrane potential. Interestingly, it was reported that perinuclear clustering of mitochondria isassociated with accumulation of nuclear ROS in hypoxic condition [86]. Thus, the high level of ROS,OXPHOS dysfunction and activation of compensatory glycolytic pathway measured in PARK2-PD cells,could mimic the cellular response to hypoxic conditions [39]. The missense mutations found in CTR2,on the other hand, although likely below the threshold for a clear-cut pathogenic effect, may accountfor the intermediate phenotype that we observe (Figure 4B–F). In any case, whether mitochondrialmutations in PARK2-PD cells are a direct cause of PD pathogenesis or a secondary consequence of anongoing mitochondrial dysfunction is still not clear, as previously observed [87].
Mitochondrial turnover is guaranteed by balance between mitochondrial biogenesis and autophagyelimination of damaged organelles. Indeed, mtDNA mutations induce compensatory activation ofmitochondrial biogenesis to increase the number of mitochondria in order to compensate mitochondrialdeficit [73]. The health of a mitochondrial population is assured also by efficient clearance mechanismsto remove dysfunctional mitochondria from the organelle pool, a mechanism particularly importantin post-mitotic cells, such as neurons, characterized by high energetic demand and low regenerativecapacity where mitochondrial dysfunction may cause cell death [88]. In this scenario, autophagy orselective degradation of damaged mitochondria, known as mitophagy, are key cellular mechanisms toremove dysfunctional mitochondria. The most studied pathway to remove damaged mitochondriais the PINK1-Parkin dependent-mitophagy [89]. Previously, it was demonstrated that PARK2-PDfibroblasts, carrying a compound heterozygous deletional mutation of PARK2 gene (del exon2/3 anddel exon 3), have lost full-length parkin protein compared to CTR2, which displayed only heterozygousdeletion in exon 3. However, a growing body of evidence has shown that the mitophagy pathway is notunique and that there are additional regulatory processes for the clearance of damaged mitochondria,most of which require functional lysosomes [90]. Thus, our data indicating that in patient cellslysosomes are not fully functional support the accumulation of impaired mitochondria.
Recently, the importance of mitochondria-lysosomes contacts has been highlighted in themaintenance of cellular homeostasis [91]. Interestingly, formation and stabilization of contacts betweenthe two organelles was promoted by GTP-bound Rab7 and inhibition of Rab7 hydrolysis leaded toabnormally large lysosomes and extended duration of mitochondria-lysosomes contacts [91]. Here, weobserved an increased number of enlarged lysosomes in PARK2-PD fibroblasts using LysoSensor andLysoTracker dyes. We think that the increased lysosomal fluorescent staining is due to accumulation oflysosomes, suggesting an impairment of the late endocytic pathway. Indeed, Cathepsin D maturation,DQBSA assay and autophagic flux evaluation showed dysfunctional lysosomal compartment inPARK2-PD fibroblasts.
Mitochondrial dysfunction was described as responsible of lysosomal alterations [58]. Indeed,impairment of ATP production affects also V-ATPase (responsible for acidification of the endocyticpathway), as ATP produced by compensatory activation of glycolysis could be not sufficient toguarantee also this function. Surprisingly, not only PARK2-PD cells but also CTR2 cells display

Cells 2019, 8, 452 16 of 22
downregulation of ATP6V1G1 expression, alterations of Cathepsin D maturation and inhibition ofthe autophagic flux, but in CTR2 cells mitochondrial biogenesis is active and might ensure a healthymitochondria population compensating the energetic deficit.
Interestingly, we observed peripheral mitochondria-like structures labeled with LysoSensorDND-160 in PARK2-PD cells. Using MitoTracker Red CM-H2XROS we confirmed that mitochondriawere also present at cell periphery, suggesting that the respiratory chain deficit may induce partialdissipation of mitochondrial proton gradient determining their acidification and making themrecognizable by the lysosomal dye. Cell-to-cell transfer of mitochondria, known as horizontalmitochondrial transfer, is a phenomenon described in human cells [92]. To overcome mitochondrialfailure and ensure cell survival, cells with mitochondrial dysfunction are able to acquire newmitochondria from donor cells. In fact, it was demonstrated that mitochondria and/or mtDNA can movebetween cells and rescue aerobic respiration in dysfunctional acceptor cells [92]. Mitochondrial transferis achieved though several mechanisms, including tunneling nanotubes, microvesicles, channels andexoxomes [93–96]. Block of mitochondrial turnover, due to dysfunctional mitochondrial biogenesisand autophagic flux, could induce PARK2-PD cells to try to compensate the energetic deficit throughtransfer of mitochondria or in the attempt to get rid of dysfunctional ones. Actually, the reason for cell-tocell mitochondrial transfer is still unclear, but it was also hypothesized that it could be a mechanismemployed when degradation pathways are compromised, in order to maintain the cell fit [97].
PARK2-PD fibroblasts are characterized by a very slow growth and a peculiar cellular morphology,as previously published [55]. Moreover, these cells need a high cellular density to proliferate.As pathological features of PARK2-PD are present also in primary fibroblasts from patients [98],understanding the growth arrest mechanisms in PARK2-PD cells could help to explain dopaminergicneurons loss. In this work, we demonstrated that PD fibroblasts arrested their growth through amechanism leading to premature senescence. Large and numerous lysosomes and increased levels ofβ-galactosidase have been described in senescent cells [99], Also, mitochondrial dysfunction, changesin mitochondrial morphology and ROS production are characteristics of the senescent phenotype [99].All these features are present in PARK2-PD cells.
It is important to emphasize that skin fibroblasts represent a good model to study PD pathogenesisharboring defined mutations and the cumulative cellular damage of the patients. In fact, it has beenproposed that skin fibroblasts from PD patients are a good cellular system to model the disease, beingable to reproduce several of the molecular alterations occurring in this neuropathology [100–104].Indeed, according to polygenic predisposition and environmental etiopathology, skin fibroblastscomprise the chronological and biological aging of the patients [100]. Furthermore, procedures toperform skin biopsies are minimally invasive and allow the possibility to obtain primary cultures ofself-propagating cells with patient’s genomic background without additional genetic manipulation.Elucidation of altered pathway in skin fibroblasts from PD patients can contribute to understandin vivo mechanism of neurodegeneration and plays a significant role in future PD diagnosis and incell-replacement therapy.
Finally, it is known that rotenone is among the possible causes of sporadic (idiopathic) PD,inducing mitochondrial impairment, ROS production, protein oxidation increase and dopaminergicneurodegeneration [105,106]. Moreover, acute exposure to rotenone determines, as consequence ofmitochondrial stress, activation of AMPK signaling, inhibition of mTOR and TFEB with block oflysosomal biogenesis [31]. Furthermore, it was demonstrated that lysosomal impairment can be due tomitochondrial ROS production [34]. According to this, in NCS34 cells treated with Rotenone we founda decrease of Lamp-I expression, indicating inhibition of lysosomal biogenesis, and dysfunctionallysosomes, as demonstrated by inhibition of Cathepsin D maturation and of DQ-BSA degradation.Therefore, we hypothesize that mitochondrial perinuclear clustering, observed in PARK2-PD cells,could induce oxidative insult to autophagosomes, which are concentrated in perinuclear region,determining also autophagic and lysosomal impairment.

Cells 2019, 8, 452 17 of 22
In conclusion, we have characterized PARK2-PD fibroblasts discovering impairment of bothmitochondrial and lysosomal functions possibly causing growth arrest and senescence. We believe tohave elucidated new aspects of pathogenesis and neurodegenerative progression in juvenile form ofPD with PARK2 mutation showing that premature senescence could be accounted for or contribute todopaminergic neuron loss as a result of cross-talk between dysfunctional mitochondria and lysosomes.Although further investigations are needed to better understand PD pathogenesis, both of familiarand idiopathic forms, our observations could aid to better explain the role of mitochondria, oxidativestress, lysosomal and autophagy dysfunction in the progression of this disease with the ultimate goalof identifying pharmacological therapies to prevent and/or arrest dopaminergic neurodegeneration.
Author Contributions: Conceptualization, F.G., T.C. and C.B.; Data curation, F.G.; Funding acquisition, C.B.;Investigation, F.G., G.G. (Giulia Girolimetti), R.B. and M.M.; Methodology, F.G., G.G. (Giulia Girolimetti),R.B., M.M., C.P. and A.F.; Supervision, G.G. (Giuseppe Gasparre), T.C. and C.B.; Validation, F.G. and C.B.;Writing—original draft, F.G.; Writing—review and editing, G.G. (Giuseppe Gasparre), T.C. and C.B.
Funding: This research was partially funded by MIUR (ex60%) and by AIRC IG2016 N. 19068 to C.B.
Acknowledgments: We thank 2HE-PONa3_00334 grant for the Zeiss LSM700 confocal microscope and FondazionePuglia for the EVOS FL Auto Cell Imaging System. We thank Riccardo Cristofani and Angelo Poletti (Dip. DiScienze Farmacologiche e Biomolecolari, Centro di Eccellenza sulle Malattie Neurodegenerative, Università degliStudi di Milano, Milano, Italy), and Neil Cashman (Department of Neurology and Neurosurgery, MontrealNeurological Institute, MCGill University, Canada) for NCS34 cells.
Conflicts of Interest: The authors declare no conflict of interest. The funders had no role in the design of thestudy; in the collection, analyses, or interpretation of data; in the writing of the manuscript, or in the decision topublish the results.
References
1. Dauer, W.; Przedborski, S. parkinson’s disease: Mechanisms and models. Neuron 2003, 39, 889–909. [CrossRef]2. Tanner, C.M.; Kamel, F.; Ross, G.W.; Hoppin, J.A.; Goldman, S.M.; Korell, M.; Marras, C.; Bhudhikanok, G.S.;
Kasten, M.; Chade, A.R.; et al. Rotenone, paraquat, and parkinson’s disease. Environ. Health Perspect 2011,119, 866–872. [CrossRef] [PubMed]
3. Klein, C.; Westenberger, A. Genetics of parkinson’s disease. Cold Spring Harb. Perspect. Med. 2012, 2, a008888.[CrossRef] [PubMed]
4. Paisan-Ruiz, C.; Jain, S.; Evans, E.W.; Gilks, W.P.; Simon, J.; van der Brug, M.; Lopez de Munain, A.;Aparicio, S.; Gil, A.M.; Khan, N.; et al. Cloning of the gene containing mutations that cause park8-linkedparkinson’s disease. Neuron 2004, 44, 595–600. [CrossRef] [PubMed]
5. Polymeropoulos, M.H.; Lavedan, C.; Leroy, E.; Ide, S.E.; Dehejia, A.; Dutra, A.; Pike, B.; Root, H.; Rubenstein, J.;Boyer, R.; et al. Mutation in the alpha-synuclein gene identified in families with parkinson’s disease. Science1997, 276, 2045–2047. [CrossRef] [PubMed]
6. Kitada, T.; Asakawa, S.; Hattori, N.; Matsumine, H.; Yamamura, Y.; Minoshima, S.; Yokochi, M.; Mizuno, Y.;Shimizu, N. Mutations in the parkin gene cause autosomal recessive juvenile parkinsonism. Nature 1998,392, 605–608.
7. Valente, E.M.; Abou-Sleiman, P.M.; Caputo, V.; Muqit, M.M.; Harvey, K.; Gispert, S.; Ali, Z.; Del Turco, D.;Bentivoglio, A.R.; Healy, D.G.; et al. Hereditary early-onset parkinson’s disease caused by mutations inpink1. Science 2004, 304, 1158–1160. [CrossRef]
8. Bonifati, V.; Rizzu, P.; Squitieri, F.; Krieger, E.; Vanacore, N.; van Swieten, J.C.; Brice, A.; van Duijn, C.M.;Oostra, B.; Meco, G.; et al. Dj-1( park7), a novel gene for autosomal recessive, early onset parkinsonism.Neurol. Sci. 2003, 24, 159–160. [CrossRef] [PubMed]
9. Ramirez, A.; Heimbach, A.; Grundemann, J.; Stiller, B.; Hampshire, D.; Cid, L.P.; Goebel, I.; Mubaidin, A.F.;Wriekat, A.L.; Roeper, J.; et al. Hereditary parkinsonism with dementia is caused by mutations in atp13a2,encoding a lysosomal type 5 p-type atpase. Nat. Genet. 2006, 38, 1184–1191. [CrossRef]
10. Verstraeten, A.; Theuns, J.; Van Broeckhoven, C. Progress in unraveling the genetic etiology of parkinsondisease in a genomic era. Trends Genet. 2015, 31, 140–149. [CrossRef] [PubMed]
11. Papa, S.; De Rasmo, D. Complex i deficiencies in neurological disorders. Trends Mol. Med. 2013, 19, 61–69.[CrossRef] [PubMed]

Cells 2019, 8, 452 18 of 22
12. Schapira, A.H.; Cooper, J.M.; Dexter, D.; Clark, J.B.; Jenner, P.; Marsden, C.D. Mitochondrial complex ideficiency in parkinson’s disease. J. Neurochem. 1990, 54, 823–827. [CrossRef] [PubMed]
13. Langston, J.W.; Ballard, P.; Tetrud, J.W.; Irwin, I. Chronic parkinsonism in humans due to a product ofmeperidine-analog synthesis. Science 1983, 219, 979–980. [CrossRef]
14. Rappold, P.M.; Cui, M.; Chesser, A.S.; Tibbett, J.; Grima, J.C.; Duan, L.; Sen, N.; Javitch, J.A.; Tieu, K. Paraquatneurotoxicity is mediated by the dopamine transporter and organic cation transporter-3. Proc. Natl. Acad.Sci. USA 2011, 108, 20766–20771. [CrossRef]
15. Liu, Y.; Sun, J.D.; Song, L.K.; Li, J.; Chu, S.F.; Yuan, Y.H.; Chen, N.H. Environment-contact administrationof rotenone: A new rodent model of parkinson’s disease. Behav. Brain Res. 2015, 294, 149–161. [CrossRef][PubMed]
16. Luth, E.S.; Stavrovskaya, I.G.; Bartels, T.; Kristal, B.S.; Selkoe, D.J. Soluble, prefibrillar alpha-synucleinoligomers promote complex i-dependent, ca2+-induced mitochondrial dysfunction. J. Biol. Chem. 2014, 289,21490–21507. [CrossRef]
17. Ferretta, A.; Gaballo, A.; Tanzarella, P.; Piccoli, C.; Capitanio, N.; Nico, B.; Annese, T.; Di Paola, M.;Dell’aquila, C.; De Mari, M.; et al. Effect of resveratrol on mitochondrial function: Implications inparkin-associated familiar parkinson’s disease. Biochim. Biophys. Acta 2014, 1842, 902–915. [CrossRef][PubMed]
18. Zhang, S.; Eitan, E.; Wu, T.Y.; Mattson, M.P. Intercellular transfer of pathogenic α-synuclein by extracellularvesicles is induced by the lipid peroxidation product 4-hydroxynonenal. Neurobiol. Aging 2018, 61, 52–65.[CrossRef]
19. Bonifacino, J.S.; Hurley, J.H. Retromer. Curr. Opin. Cell Biol. 2008, 202, 427–436. [CrossRef]20. Tang, F.L.; Liu, W.; Hu, J.X.; Erion, J.R.; Ye, J.; Mei, L.; Xiong, W.C. Vps35 deficiency or mutation causes
dopaminergic neuronal loss by impairing mitochondrial fusion and function. Cell Rep. 2015, 12, 1631–1643.[CrossRef]
21. Taguchi, Y.V.; Liu, J.; Ruan, J.; Pacheco, J.; Zhang, X.; Abbasi, J.; Keutzer, J.; Mistry, P.K.; Chandra, S.S.Glucosylsphingosine promotes α-synuclein pathology in mutant gba-associated parkinson’s disease.J. Neurosci. 2017, 37, 9617–9631. [CrossRef] [PubMed]
22. Bae, E.J.; Yang, N.Y.; Lee, C.; Lee, H.J.; Kim, S.; Sardi, S.P.; Lee, S.J. Loss of glucocerebrosidase 1 activitycauses lysosomal dysfunction and alpha-synuclein aggregation. Exp. Mol. Med. 2015, 47, e153. [CrossRef]
23. Cleeter, M.W.; Chau, K.Y.; Gluck, C.; Mehta, A.; Hughes, D.A.; Duchen, M.; Wood, N.W.; Hardy, J.; MarkCooper, J.; Schapira, A.H. Glucocerebrosidase inhibition causes mitochondrial dysfunction and free radicaldamage. Neurochem. Int. 2013, 62, 1–7. [CrossRef] [PubMed]
24. Wang, W.; Wang, X.; Fujioka, H.; Hoppel, C.; Whone, A.L.; Caldwell, M.A.; Cullen, P.J.; Liu, J.; Zhu, X.Parkinson’s disease-associated mutant vps35 causes mitochondrial dysfunction by recycling dlp1 complexes.Nat. Med. 2016, 22, 54–63. [CrossRef] [PubMed]
25. Gusdon, A.M.; Zhu, J.; Van Houten, B.; Chu, C.T. Atp13a2 regulates mitochondrial bioenergetics throughmacroautophagy. Neurobiol. Dis. 2012, 45, 962–972. [CrossRef]
26. Ramonet, D.; Podhajska, A.; Stafa, K.; Sonnay, S.; Trancikova, A.; Tsika, E.; Pletnikova, O.; Troncoso, J.C.;Glauser, L.; Moore, D.J. Park9-associated atp13a2 localizes to intracellular acidic vesicles and regulates cationhomeostasis and neuronal integrity. Hum. Mol. Genet. 2012, 21, 1725–1743. [CrossRef]
27. Niu, J.; Yu, M.; Wang, C.; Xu, Z. Leucine-rich repeat kinase 2 disturbs mitochondrial dynamics viadynamin-like protein. J. Neurochem. 2012, 122, 650–658. [CrossRef]
28. Papkovskaia, T.D.; Chau, K.Y.; Inesta-Vaquera, F.; Papkovsky, D.B.; Healy, D.G.; Nishio, K.; Staddon, J.;Duchen, M.R.; Hardy, J.; Schapira, A.H.; et al. G2019s leucine-rich repeat kinase 2 causes uncouplingprotein-mediated mitochondrial depolarization. Hum. Mol. Genet. 2012, 21, 4201–4213. [CrossRef] [PubMed]
29. Nakamura, K.; Nemani, V.M.; Azarbal, F.; Skibinski, G.; Levy, J.M.; Egami, K.; Munishkina, L.; Zhang, J.;Gardner, B.; Wakabayashi, J.; et al. Direct membrane association drives mitochondrial fission by the parkinsondisease-associated protein alpha-synuclein. J. Biol. Chem. 2011, 286, 20710–20726. [CrossRef] [PubMed]
30. Yang, S.; Xia, C.; Li, S.; Du, L.; Zhang, L.; Hu, Y. Mitochondrial dysfunction driven by the lrrk2-mediatedpathway is associated with loss of purkinje cells and motor coordination deficits in diabetic rat model.Cell Death Dis. 2014, 5, e1217. [CrossRef]

Cells 2019, 8, 452 19 of 22
31. Fernandez-Mosquera, L.; Diogo, C.V.; Yambire, K.F.; Santos, G.L.; Luna Sanchez, M.; Benit, P.; Rustin, P.;Lopez, L.C.; Milosevic, I.; Raimundo, N. Acute and chronic mitochondrial respiratory chain deficiencydifferentially regulate lysosomal biogenesis. Sci. Rep. 2017, 7, 45076. [CrossRef]
32. McWilliams, T.G.; Muqit, M.M. Pink1 and parkin: Emerging themes in mitochondrial homeostasis. Curr. Opin.Cell Biol. 2017, 45, 83–91. [CrossRef] [PubMed]
33. Fivenson, E.M.; Lautrup, S.; Sun, N.; Scheibye-Knudsen, M.; Stevnsner, T.; Nilsen, H.; Bohr, V.A.; Fang, E.F.Mitophagy in neurodegeneration and aging. Neurochem. Int. 2017, 109, 202–209. [CrossRef] [PubMed]
34. Demers-Lamarche, J.; Guillebaud, G.; Tlili, M.; Todkar, K.; Belanger, N.; Grondin, M.; Nguyen, A.P.; Michel, J.;Germain, M. Loss of mitochondrial function impairs lysosomes. J. Biol. Chem. 2016, 291, 10263–10276. [CrossRef]
35. Baixauli, F.; Acin-Perez, R.; Villarroya-Beltri, C.; Mazzeo, C.; Nunez-Andrade, N.; Gabande-Rodriguez, E.;Ledesma, M.D.; Blazquez, A.; Martin, M.A.; Falcon-Perez, J.M.; et al. Mitochondrial respiration controlslysosomal function during inflammatory t cell responses. Cell Metab. 2015, 22, 485–498. [CrossRef]
36. Girotto, S.; Cendron, L.; Bisaglia, M.; Tessari, I.; Mammi, S.; Zanotti, G.; Bubacco, L. Dj-1 is a copper chaperoneacting on sod1 activation. J. Biol. Chem. 2014, 289, 10887–10899. [CrossRef] [PubMed]
37. Junn, E.; Jang, W.H.; Zhao, X.; Jeong, B.S.; Mouradian, M.M. Mitochondrial localization of dj-1 leads toenhanced neuroprotection. J. Neurosci. Res. 2009, 87, 123–129. [CrossRef]
38. Thomas, K.J.; McCoy, M.K.; Blackinton, J.; Beilina, A.; van der Brug, M.; Sandebring, A.; Miller, D.; Maric, D.;Cedazo-Minguez, A.; Cookson, M.R. Dj-1 acts in parallel to the pink1/parkin pathway to control mitochondrialfunction and autophagy. Hum. Mol. Genet. 2011, 20, 40–50. [CrossRef]
39. Pacelli, C.; De Rasmo, D.; Signorile, A.; Grattagliano, I.; di Tullio, G.; D’Orazio, A.; Nico, B.; Comi, G.P.;Ronchi, D.; Ferranini, E.; et al. Mitochondrial defect and pgc-1alpha dysfunction in parkin-associated familialparkinson’s disease. Biochim. Biophys. Acta 2011, 1812, 1041–1053. [CrossRef]
40. Colecchia, D.; Stasi, M.; Leonardi, M.; Manganelli, F.; Nolano, M.; Veneziani, B.M.; Santoro, L.; Eskelinen, E.-L.;Chiariello, M.; Bucci, C. Alterations of autophagy in charcot-marie-tooth type 2b. Autophagy 2018, 14, 930–941.[CrossRef]
41. Cashman, N.R.; Durham, H.D.; Blusztajn, J.K.; Oda, K.; Tabira, T.; Shaw, I.T.; Dahrouge, S.; Antel, J.P.Neuroblastoma x spinal cord (nsc) hybrid cell lines resemble developing motor neurons. Dev. Dyn. 1992,194, 209–221. [CrossRef]
42. Haugland, R.P. The Handbook: A Guide to Fluorescent Probes and Labeling Technologies, 10th ed.; MolecularProbes; Invitrogen Corp.: Carlsbad, CA, USA, 2005; p. 390.
43. Vergara, D.; Stanca, E.; Guerra, F.; Priore, P.; Gaballo, A.; Franck, J.; Simeone, P.; Trerotola, M.; De Domenico, S.;Fournier, I.; et al. Beta-catenin knockdown affects mitochondrial biogenesis and lipid metabolism in breastcancer cells. Front. Physiol. 2017, 8, 544. [CrossRef] [PubMed]
44. Kurien, B.T.; Scofield, R.H. Western blotting: An introduction. Methods Mol. Biol. 2015, 1312, 17–30. [PubMed]45. Richo, G.; Conner, G.E. Proteolytic activation of human procathepsin d. Adv. Exp. Med. Biol. 1991, 306,
289–296.46. Mauvezin, C.; Neufeld, T.P. Bafilomycin a1 disrupts autophagic flux by inhibiting both v-atpase-dependent
acidification and ca-p60a/serca-dependent autophagosome-lysosome fusion. Autophagy 2015, 11, 1437–1438.[CrossRef]
47. Mauvezin, C.; Nagy, P.; Juhasz, G.; Neufeld, T.P. Autophagosome-lysosome fusion is independent ofv-atpase-mediated acidification. Nat. Commun. 2015, 6, 7007. [CrossRef] [PubMed]
48. Klionsky, D.J.; Abdelmohsen, K.; Abe, A.; Abedin, M.J.; Abeliovich, H.; Acevedo Arozena, A.; Adachi, H.;Adams, C.M.; Adams, P.D.; Adeli, K.; et al. Guidelines for the use and interpretation of assays for monitoringautophagy (3rd edition). Autophagy 2016, 12, 1–222. [CrossRef]
49. Girolimetti, G.; Guerra, F.; Iommarini, L.; Kurelac, I.; Vergara, D.; Maffia, M.; Vidone, M.; Amato, L.B.;Leone, G.; Dusi, S.; et al. Platinum-induced mitochondrial DNA mutations confer lower sensitivity topaclitaxel by impairing tubulin cytoskeletal organization. Hum. Mol. Genet. 2017, 26, 2961–2974. [CrossRef]
50. Adzhubei, I.; Jordan, D.M.; Sunyaev, S.R. Predicting functional effect of human missense mutations usingpolyphen-2. Curr. Protoc. Hum. Genet. 2013. [CrossRef]
51. Calabrese, C.; Simone, D.; Diroma, M.A.; Santorsola, M.; Gutta, C.; Gasparre, G.; Picardi, E.; Pesole, G.;Attimonelli, M. Mtoolbox: A highly automated pipeline for heteroplasmy annotation and prioritizationanalysis of human mitochondrial variants in high-throughput sequencing. Bioinformatics 2014, 30, 3115–3117.[CrossRef]

Cells 2019, 8, 452 20 of 22
52. Rubino, F.; Piredda, R.; Calabrese, F.M.; Simone, D.; Lang, M.; Calabrese, C.; Petruzzella, V.;Tommaseo-Ponzetta, M.; Gasparre, G.; Attimonelli, M. Hmtdb, a genomic re- source for mitochondrion-basedhuman variability studies. Nucleic Acid Res. 2012, 40, D1150–D1159. [CrossRef] [PubMed]
53. Preste, R.; Vitale, O.; Clima, R.; Gasparre, G.; Attimonelli, M. Hmtvar: A new resource for humanmitochondrial variations and pathogenicity data. Nucleic Acids Res. 2019, 47, D1202–D1210. [CrossRef][PubMed]
54. Debacq-Chainiaux, F.; Erusalimsky, J.D.; Campisi, J.; Toussaint, O. Protocols to detect senescence-associatedbeta-galactosidase (sa-betagal) activity, a biomarker of senescent cells in culture and in vivo. Nature 2009, 4,1798–1806.
55. Vergara, D.; Ferraro, M.M.; Cascione, M.; del Mercato, L.L.; Leporatti, S.; Ferretta, A.; Tanzarella, P.; Pacelli, C.;Santino, A.; Maffia, M.; et al. Cytoskeletal alterations and biomechanical properties of parkin-mutant humanprimary fibroblasts. Cell Biochem. Biophys. 2015, 71, 1395–1404. [CrossRef]
56. Vergara, D.; Gaballo, A.; Signorile, A.; Ferretta, A.; Tanzarella, P.; Pacelli, C.; Di Paola, M.; Cocco, T.; Maffia, M.Resveratrol modulation of protein expression in parkin-mutant human skin fibroblasts: A proteomicapproach. Oxid. Med. Cell Longev. 2017, 2017, 2198243. [CrossRef]
57. Lippolis, R.; Siciliano, R.A.; Pacelli, C.; Ferretta, A.; Mazzeo, M.F.; Scacco, S.; Papa, F.; Gaballo, A.;Dell’Aquila, C.; De Mari, M.; et al. Altered protein expression pattern in skin fibroblasts from parkin-mutantearly-onset parkinson’s disease patients. Biochim. Biophys. Acta 2015, 1852, 1960–1970. [CrossRef]
58. Diogo, C.V.; Yambire, K.F.; Fernandez Mosquera, L.; Branco, F.T.; Raimundo, N. Mitochondrial adventures atthe organelle society. Biochem. Biophys. Res. Commun. 2018, 500, 87–93. [CrossRef]
59. Wang, T.; Ming, Z.; Xiaochun, W.; Hong, W. Rab7: Role of its protein interaction cascades in endo-lysosomaltraffic. Cell Signal. 2011, 23, 516–521. [CrossRef]
60. Guerra, F.; Bucci, C. Multiple roles of the small gtpase rab7. Cells 2016, 5, 34. [CrossRef] [PubMed]61. Bucci, C.; Thomsen, P.; Nicoziani, P.; McCarthy, J.; van Deurs, B. Rab7: A key to lysosome biogenesis.
Mol. Biol. Cell 2000, 11, 467–480. [CrossRef]62. Vitelli, R.; Santillo, M.; Lattero, D.; Chiariello, M.; Bifulco, M.; Bruni, C.; Bucci, C. Role of the small gtpase
rab7 in the late endocytic pathway. J. Biol. Chem. 1997, 272, 4391–4397. [CrossRef] [PubMed]63. De Luca, M.; Cogli, L.; Progida, C.; Nisi, V.; Pascolutti, R.; Sigismund, S.; Di Fiore, P.P.; Bucci, C. Rilp regulates
vacuolar atpase through interaction with the v1g1 subunit. J. Cell Sci. 2014, 127, 2697–2708. [CrossRef]64. De Luca, M.; Bucci, C. A new v-atpase regulatory mechanism mediated by the rab interacting lysosomal
protein (rilp). Commun. Integr. Biol. 2014, 7, 1–4. [CrossRef]65. Voss, E.W., Jr.; Workman, C.J.; Mummert, M.E. Detection of protease activity using a fluorescence-enhancement
globular substrate. Biotechniques 1996, 20, 286–291. [CrossRef]66. Vidoni, C.; Follo, C.; Savino, M.; Melone, M.A.; Isidoro, C. The role of cathepsin d in the pathogenesis of
human neurodegenerative disorders. Med. Res. Rev. 2016, 36, 845–870. [CrossRef]67. Yoshii, S.R.; Mizushima, N. Monitoring and measuring autophagy. Int. J. Mol. Sci. 2017, 18, 1865. [CrossRef]
[PubMed]68. Kabeya, Y.; Mizushima, N.; Ueno, T.; Yamamoto, A.; Kirisako, T.; Noda, T.; Kominami, E.; Ohsumi, Y.;
Yoshimori, T. Lc3, a mammalian homologue of yeast apg8p, is localized in autophagosome membranes afterprocessing. EMBO J. 2000, 19, 5720–5728. [CrossRef] [PubMed]
69. Pankiv, S.; Clausen, T.H.; Lamark, T.; Brech, A.; Bruun, J.A.; Outzen, H.; Overvatn, A.; Bjorkoy, G.; Johansen, T.P62/sqstm1 binds directly to atg8/lc3 to facilitate degradation of ubiquitinated protein aggregates byautophagy. J. Biol. Chem. 2007, 282, 24131–24145. [CrossRef]
70. Mizushima, N.; Yoshimori, T. How to interpret lc3 immunoblotting. Autophagy 2007, 3, 542–545. [CrossRef]71. Tanida, I.; Minematsu-Ikeguchi, N.; Ueno, T.; Kominami, E. Lysosomal turnover, but not a cellular level, of
endogenous lc3 is a marker for autophagy. Autophagy 2005, 1, 84–91. [CrossRef]72. Manley, S.; Williams, J.A.; Ding, W.X. Role of p62/sqstm1 in liver physiology and pathogenesis. Exp. Biol.
Med. (Maywood) 2013, 238, 525–538. [CrossRef] [PubMed]73. Guerra, F.; Kurelac, I.; Cormio, A.; Zuntini, R.; Amato, L.B.; Ceccarelli, C.; Santini, D.; Cormio, G.; Fracasso, F.;
Selvaggi, L.; et al. Placing mitochondrial DNA mutations within the progression model of type i endometrialcarcinoma. Hum. Mol. Genet. 2011, 20, 2394–2405. [CrossRef] [PubMed]
74. Gasparre, G.; Romeo, G.; Rugolo, M.; Porcelli, A.M. Learning from oncocytic tumors: Why choose inefficientmitochondria? Biochim. Biophys. Acta 2011, 1807, 633–642. [CrossRef] [PubMed]

Cells 2019, 8, 452 21 of 22
75. Picca, A.; Lezza, A.M. Regulation of mitochondrial biogenesis through tfam-mitochondrial DNA interactions:Useful insights from aging and calorie restriction studies. Mitochondrion 2015, 25, 67–75. [CrossRef]
76. Howcroft, T.K.; Campisi, J.; Louis, G.B.; Smith, M.T.; Wise, B.; Wyss-Coray, T.; Augustine, A.D.; McElhaney, J.E.;Kohanski, R.; Sierra, F. The role of inflammation in age-related disease. Aging (Albany NY) 2013, 5, 84–93.[CrossRef] [PubMed]
77. Weichhart, T. Mtor as regulator of lifespan, aging, and cellular senescence: A mini-review. Gerontology 2018,64, 127–134. [CrossRef]
78. Lee, B.Y.; Han, J.A.; Im, J.S.; Morrone, A.; Johung, K.; Goodwin, E.C.; Kleijer, W.J.; DiMaio, D.; Hwang, E.S.Senescence-associated beta-galactosidase is lysosomal beta-galactosidase. Aging Cell 2006, 5, 187–195.[CrossRef]
79. Correia-Melo, C.; Passos, J.F. Mitochondria: Are they causal players in cellular senescence? Biochim. Biophys. Acta2015, 1847, 1373–1379. [CrossRef] [PubMed]
80. Stein, G.H.; Drullinger, L.F.; Soulard, A.; Dulic, V. Differential roles for cyclin-dependent kinase inhibitorsp21 and p16 in the mechanisms of senescence and differentiation in human fibroblasts. Mol. Cell Biol. 1999,19, 2109–2117. [CrossRef]
81. Enriquez, J.A. Supramolecular organization of respiratory complexes. Annu. Rev. Physiol. 2016, 78, 533–561.[CrossRef]
82. Blakely, E.L.; Mitchell, A.L.; Fisher, N.; Meunier, B.; Nijtmans, L.G.; Schaefer, A.M.; Jackson, M.J.;Turnbull, D.M.; Taylor, R.W. A mitochondrial cytochrome b mutation causing severe respiratory chainenzyme deficiency in humans and yeast. FEBS J. 2005, 272, 3583–3592. [CrossRef]
83. Lamantea, E.; Carrara, F.; Mariotti, C.; Morandi, L.; Tiranti, V.; Zeviani, M. A novel nonsense mutation(q352x) in the mitochondrial cytochrome b gene associated with a combined deficiency of complexes i and iii.Neuromuscul. Disord. 2002, 12, 49–52. [CrossRef]
84. Diaz, F.; Fukui, H.; Garcia, S.; Moraes, C.T. Cytochrome c oxidase is required for the assembly/stability ofrespiratory complex i in mouse fibroblasts. Mol. Cell Biol. 2006, 26, 4872–4881. [CrossRef]
85. Moreno-Lastres, D.; Fontanesi, F.; Garcia-Consuegra, I.; Martin, M.A.; Arenas, J.; Barrientos, A.; Ugalde, C.Mitochondrial complex i plays an essential role in human respirasome assembly. Cell Metab. 2012, 15,324–335. [CrossRef]
86. Al-Mehdi, A.B.; Pastukh, V.M.; Swiger, B.M.; Reed, D.J.; Patel, M.R.; Bardwell, G.C.; Pastukh, V.V.;Alexeyev, M.F.; Gillespie, M.N. Perinuclear mitochondrial clustering creates an oxidant-rich nuclear domainrequired for hypoxia-induced transcription. Sci. Signal. 2012, 5, ra47. [CrossRef]
87. Cieri, D.; Brini, M.; Cali, T. Emerging (and converging) pathways in parkinson’s disease: Keepingmitochondrial wellness. Biochem. Biophys. Res. Commun. 2017, 483, 1020–1030. [CrossRef] [PubMed]
88. Wallace, D.C. A mitochondrial paradigm of metabolic and degenerative diseases, aging, and cancer: A dawnfor evolutionary medicine. Annu. Rev. Genet. 2005, 39, 359–407. [CrossRef] [PubMed]
89. Youle, R.J.; Narendra, D.P. Mechanisms of mitophagy. Nat. Rev. Mol. Cell Biol. 2011, 12, 9–14. [CrossRef]90. Villa, E.; Marchetti, S.; Ricci, J.E. No parkin zone: Mitophagy without parkin. Trends Cell Biol. 2018, 28,
882–895. [CrossRef]91. Wong, Y.C.; Ysselstein, D.; Krainc, D. Mitochondria-lysosome contacts regulate mitochondrial fission via
rab7 gtp hydrolysis. Nature 2018, 554, 382–386. [CrossRef] [PubMed]92. Spees, J.L.; Olson, S.D.; Whitney, M.J.; Prockop, D.J. Mitochondrial transfer between cells can rescue aerobic
respiration. Proc. Natl. Acad. Sci. USA 2006, 103, 1283–1288. [CrossRef] [PubMed]93. Torralba, D.; Baixauli, F.; Sanchez-Madrid, F. Mitochondria know no boundaries: Mechanisms and functions
of intercellular mitochondrial transfer. Front. Cell Dev. Biol. 2016, 4, 107. [CrossRef]94. Lou, E.; Fujisawa, S.; Morozov, A.; Barlas, A.; Romin, Y.; Dogan, Y.; Gholami, S.; Moreira, A.L.;
Manova-Todorova, K.; Moore, M.A. Tunneling nanotubes provide a unique conduit for intercellulartransfer of cellular contents in human malignant pleural mesothelioma. PLoS ONE 2012, 7, e33093. [CrossRef]
95. Sinha, P.; Islam, M.N.; Bhattacharya, S.; Bhattacharya, J. Intercellular mitochondrial transfer: Bioenergeticcrosstalk between cells. Curr. Opin. Genet. Dev. 2016, 38, 97–101. [CrossRef] [PubMed]
96. Cho, Y.M.; Kim, J.H.; Kim, M.; Park, S.J.; Koh, S.H.; Ahn, H.S.; Kang, G.H.; Lee, J.B.; Park, K.S.; Lee, H.K.Mesenchymal stem cells transfer mitochondria to the cells with virtually no mitochondrial function but notwith pathogenic mtdna mutations. PLoS ONE 2012, 7, e32778. [CrossRef] [PubMed]

Cells 2019, 8, 452 22 of 22
97. Desdin-Mico, G.; Mittelbrunn, M. Role of exosomes in the protection of cellular homeostasis. Cell Adh. Migr.2017, 11, 127–134. [CrossRef] [PubMed]
98. Burbulla, L.F.; Kruger, R. The use of primary human fibroblasts for monitoring mitochondrial phenotypes inthe field of parkinson’s disease. J. Vis. Exp. 2012. [CrossRef] [PubMed]
99. Kurz, D.J.; Decary, S.; Hong, Y.; Erusalimsky, J.D. Senescence-associated (beta)-galactosidase reflects anincrease in lysosomal mass during replicative ageing of human endothelial cells. J. Cell Sci. 2000, 113,3613–3622. [PubMed]
100. Auburger, G.; Klinkenberg, M.; Drost, J.; Marcus, K.; Morales-Gordo, B.; Kunz, W.S.; Brandt, U.; Broccoli, V.;Reichmann, H.; Gispert, S.; et al. Primary skin fibroblasts as a model of parkinson’s disease. Mol. Neurobiol.2012, 46, 20–27. [CrossRef]
101. Ambrosi, G.; Ghezzi, C.; Sepe, S.; Milanese, C.; Payan-Gomez, C.; Bombardieri, C.R.; Armentero, M.T.;Zangaglia, R.; Pacchetti, C.; Mastroberardino, P.G.; et al. Bioenergetic and proteolytic defects in fibroblastsfrom patients with sporadic parkinson’s disease. Biochim. Biophys. Acta 2014, 1842, 1385–1394. [CrossRef]
102. Hoepken, H.H.; Gispert, S.; Azizov, M.; Klinkenberg, M.; Ricciardi, F.; Kurz, A.; Morales-Gordo, B.; Bonin, M.;Riess, O.; Gasser, T.; et al. Parkinson patient fibroblasts show increased alpha-synuclein expression.Exp. Neurol. 2008, 212, 307–313. [CrossRef] [PubMed]
103. Romani-Aumedes, J.; Canal, M.; Martin-Flores, N.; Sun, X.; Perez-Fernandez, V.; Wewering, S.;Fernandez-Santiago, R.; Ezquerra, M.; Pont-Sunyer, C.; Lafuente, A.; et al. Parkin loss of function contributesto rtp801 elevation and neurodegeneration in parkinson’s disease. Cell Death Dis. 2014, 5, e1364. [CrossRef][PubMed]
104. Yakhine-Diop, S.M.; Bravo-San Pedro, J.M.; Gomez-Sanchez, R.; Pizarro-Estrella, E.; Rodriguez-Arribas, M.;Climent, V.; Aiastui, A.; Lopez de Munain, A.; Fuentes, J.M.; Gonzalez-Polo, R.A. G2019s lrrk2mutant fibroblasts from parkinson’s disease patients show increased sensitivity to neurotoxin1-methyl-4-phenylpyridinium dependent of autophagy. Toxicology 2014, 324, 1–9. [CrossRef] [PubMed]
105. Giordano, S.; Dodson, M.; Ravi, S.; Redmann, M.; Ouyang, X.; Darley Usmar, V.M.; Zhang, J. Bioenergeticadaptation in response to autophagy regulators during rotenone exposure. J. Neurochem. 2014, 131, 625–633.[CrossRef]
106. Giordano, S.; Darley-Usmar, V.; Zhang, J. Autophagy as an essential cellular antioxidant pathway inneurodegenerative disease. Redox Biol. 2014, 2, 82–90. [CrossRef]
© 2019 by the authors. Licensee MDPI, Basel, Switzerland. This article is an open accessarticle distributed under the terms and conditions of the Creative Commons Attribution(CC BY) license (http://creativecommons.org/licenses/by/4.0/).