dynamique de spin dans les structures semi … · semi-conductrices de basses dimensions ......
TRANSCRIPT
HAL Id: tel-00647043https://tel.archives-ouvertes.fr/tel-00647043v3
Submitted on 19 Dec 2012
HAL is a multi-disciplinary open accessarchive for the deposit and dissemination of sci-entific research documents, whether they are pub-lished or not. The documents may come fromteaching and research institutions in France orabroad, or from public or private research centers.
L’archive ouverte pluridisciplinaire HAL, estdestinée au dépôt et à la diffusion de documentsscientifiques de niveau recherche, publiés ou non,émanant des établissements d’enseignement et derecherche français ou étrangers, des laboratoirespublics ou privés.
Dynamique de spin dans les structuressemi-conductrices de basses dimensions
Mateusz Goryca
To cite this version:Mateusz Goryca. Dynamique de spin dans les structures semi-conductrices de basses dimensions.Autre [cond-mat.other]. Université de Grenoble, 2011. Français. <NNT : 2011GRENY076>. <tel-00647043v3>

University of Warsaw
Universite de Grenoble
Mateusz Goryca
Spin dynamics in low-dimensionalsemiconductor structures
PhD thesis supervised by
dr hab. Piotr Kossacki and dr Marek Potemski
30.11.2011

I dedicate this thesis to Professor Jan Gaj.

Acknowledgements
Here I would like to thank all the people who helped and supported me
during my doctoral study. First of all, I would like to thank my PhD
supervisors - Piotr Kossacki and Marek Potemski. I highly appreciate
their support and care during my study, their advice and discussions.
Thank you Piotr for forcing me into making an effort to understand
physics.
I thank all my colleagues form research groups of Prof. Jan Gaj at
the University of Warsaw and Dr. Marek Potemski at Grenoble High
Magnetic Field Laboratory. In particular I thank Tomek Kazimier-
czuk for priceless help in the experimental work and fruitful discus-
sions about results and interpretation. I thank Paulina Płochocka
for great help with the high magnetic field experimental setup and
long measurements. I also thank her and Duncan Maude for fan-
tastic hospitality in Grenoble. I appreciate help and patience of Ivan
Breslavetz, without whom the experimental work would be much more
painful than it was.
It is my pleasure to thank Dr. Denis Scalbert and Dr. hab. Adam
Babiński for agreement to be the referees of my manuscript and Prof.
Joel Cibert and Prof. Andrzej Wysmołek for the acceptance to par-
ticipate in my jury.
I thank Dr. Piotr Wojnar form Polish Academy of Sciences and Prof.
Joel Cibert for the samples and helpful discussions about physics.
I would like to thank Andrzej Golnik, Tomek Jakubczyk, Wojtek Pa-
cuski, Asia Papierska, Jan Suffczyński and all other colleagues form
University of Warsaw for creating great atmosphere in the lab. I also
thank Clement Faugeras, Aurelien Nicolet and Benjamin Piot from

Grenoble High Magnetic Field Laboratory for their hospitality and a
lot of help with French paperwork.
I would like to thank all my other friends from University of Warsaw
and Grenoble High Magnetic Field Laboratory, who were not involved
in my research, but with whom I have spent this great time: Monika
Bajda, Asia Bartoszek, Ania Korbecka, Jan Kunc, Petr Neugebauer
and all the others.
I would also like to express my gratitude to my loving parents for their
constant support.
Thank you!

Abstract / Resume / Streszczenie
Abstract
This work is devoted to the studies of spin dynamics of magnetic Mn2+
ions embedded in low-dimensional CdTe-based nanostructures. The
particular emphasis is focused on the system of single CdTe quantum
dots with single Mn2+ ions, which give an insight into unperturbed
interactions of magnetic ion with its semiconductor environment. A
method of all-optical manipulation and readout of the spin state of a
single magnetic ion is presented. The experiment exploits the spin-
conserving exciton transfer between neighbouring quantum dots to
inject polarized exitons into the dot with the Mn2+ ion and to orient
its spin. The dynamics of the orientation process is measured in a
time-resolved experiment and described with a simple rate equation
model. One of possible orientation mechanisms - the dark excitons
recombination - is discussed and shown experimentally. The optical
orientation of the Mn2+ ion is also used to investigate the spin-lattice
relaxation of an isolated magnetic ion in low and high magnetic field.
The work also addresses phenomena occurring in low and zero mag-
netic field in large systems of magnetic moments - quantum wells and
quantum dots containing Mn2+ ions. New experimental technique of
fast magnetic pulses is used to investigate the Mn2+ electronic spin
dynamics in the absence of magnetic field with nanosecond resolution.
After the pulse of magnetic field, a fast decay of the magnetization
is observed. The experimental findings are described in terms of hy-
perfine coupling with the nuclear spin of the Mn2+ ions. The effect is
highly sensitive to the presence of an anisotropy, particularly the one
introduced by hole gas and by strain. Application of the external mag-
netic field suppresses the fast dynamics in diluted magnetic quantum
wells and well known, slow spin-lattice relaxation is observed. Surpris-
ingly, quantum dots with many Mn2+ ions show fast spin dynamics
even after application of external field, up to 0.5 T. The fast process
may origin from the spin-spin interaction between the magnetic ions,
especially if their spatial distribution within the dot is not uniform.
The work is organized in following way:
• In chapter 1 I briefly present a short introduction into the sub-
ject: description of basic properties of diluted magnetic semicon-
ductors (Cd1−xMnxTe in particular) and low-dimensional semi-
conductor structures - quantum wells and quantum dots - con-
taining magnetic ions. Current level of knowledge on spin dy-
namics in such systems is presented. The aim of this work is also
defined.
• Chapter 2 contains description of the samples used in this work.
Both the growth techniques and the basic properties of quantum
wells and quantum dots are presented.
• Chapter 3 presents standard experimental techniques, commonly
used in optical studies of semiconductor nanostructures. Micro
photoluminescence, single photon correlation and spectroscopy
in high magnetic field are discussed.
• A new experimental technique of fast magnetic pulses is pre-
sented in chapter 4. The pulses of magnetic field are generated
by a miniature magnetic coil placed directly on a sample surface.
• Chapter 5 describes the experiment of optical spin manipulation
of a single Mn2+ ion embedded in the CdTe quantum dot. The
dynamics of the orientation process was measured in a time-
resolved experiment and described with a simple rate equation
model.
• One of possible Mn2+ orientation mechanisms is discussed in
chapter 6. The dark excitons optical transitions, which are al-
lowed due to the presence of a magnetic impurity in the dot, can

efficiently induce the Mn2+ polarization.
• Chapter 7 describes investigation of the spin relaxation for sys-
tems of single and many magnetic ions, in both high and low
magnetic field. In the case of a single Mn2+ ion in a quantum
dot it was possible to measure pure spin-lattice relaxation, un-
perturbed by the spin-spin interaction. In the case of diluted
magnetic quantum wells a fast spin dynamics in the complete
absence of the magnetic field was observed.
• The last chapter 8 contains the summary of the work. Perspec-
tives of future research in the fields discussed in this work are
briefly presented.

Resume
Ce travail presente l’etude de la dynamique de spins d’ions Mn2+
inseres dans des structures de CdTe de faibles dimensions. L’accent
est plus particulierement mis sur des boıtes quantiques individuelles de
CdTe contenant un ion Mn2+ unique, ce qui permet d’acceder aux in-
teractions non perturbees de l’ion magnetique avec son environnement
semi-conducteur. Nous presentons une methode purement optique
de manipulation et de lecture des etats de spin de l’ion magnetique
unique. Les experiences utilisent le fait que les etats de spin se conser-
vent lors d’un transfert excitonique entre proches boıtes quantiques,
pour injecter un exciton polarise dans la boıte contenant l’ion Mn2+
afin d’orienter son spin. Les dynamiques de processus de reorientation
sont observees lors de mesures resolues en temps, puis analysees via
un modele simple d’equations de taux. Un des mecanismes possible
de reorientation, la recombinaison d’excitons sombres, est presente
experimentalement, puis discute. L’orientation optique de l’ion Mn2+
est aussi utilisee pour etudier les relaxations spin-reseau d’un ion
magnetique isole sous faibles et sous forts champs magnetiques.
Ce travail decrit aussi les phenomenes presents pour des champs mag-
netiques nuls ou faibles dans des systemes de moments magnetiques
plus grands (puits et boıtes quantiques contenant plusieurs ions Mn2+).
Une nouvelle technique experimentale, basee sur des impulsions mag-
netiques rapides, nous permet d’etudier la dynamique de spin des ions
Mn2+ en l’absence de champ magnetique et ce, avec une resolution
temporelle de l’ordre de la nanoseconde. Nous observons une rapide
decroissance de la magnetisation apres une impulsion magnetique.
Le phenomene est decrit en terme de couplage hyperfin avec le spin
nucleaire des ions Mn2+. Cet effet est particulierement sensible a
toute anisotropie, notamment celles introduites par un gaz de trous
ou par le contrainte du reseau. L’application d’un champ magnetique
externe supprime les dynamiques rapides dans les puits quantiques
magnetiques dilues et des phenomenes plus commun de relaxation
lente spin-reseau sont alors observes. Il est toutefois surprenant que
les boıtes quantiques avec un grand nombre d’ions Mn2+ presentent
ces dynamiques de spin rapides meme apres application d’un champ
magnetique allant jusqu’a 0.5 T. Ce processus rapide pourrait venir
des interactions spin-spin des ions Mn2+, en particulier si leur distri-
bution spatiale n’est pas reguliere a l’interieur de la boıte.
Cette etude est organisee de la maniere suivante:
• Le Chapitre 1 presente une breve introduction au sujet: la de-
scription des proprietes fondamentales des semiconducteurs di-
lues magnetiques (en particulier les alliages de Cd1−xMnxTe) et
des structures semiconductrices de basse dimensionnalite - puits
et boıtes quantiques - contenant des impuretes magnetiques.
L’etat de l’art concernant la dynamique de spin dans de tels
systemes est presente. Le but de cette etude est ensuite defini.
• Le Chapitre 2 est consacre a la description des echantillons uti-
lises dans cette etude. Les techniques de croissance ainsi que les
proprietes des puits et des boıtes quantiques sont presentees.
• Le Chapitre 3 presente les techniques experimentales, couram-
ment utilisees pour les etudes de spectroscopie optique de nanos-
tructures semiconductrices. Les techniques de micro-photolu-
minescence, de correlation de photons et de spectroscopie sous
champ magnetique intense sont discutees.
• Une nouvelle technique experimentale basee sur des impulsions
magnetiques rapides est presentee au Chapitre 4. Les impul-
sions magnetiques sont generees par une bobine miniature placee
directement sur la surface de l’echantillon.
• Le Chapitre 5 decrit les experiences de manipulation optique du
spin d’un ion Mn2+ unique situe dans une boıte quantique de
CdTe. La dynamique de spin ainsi que le processus d’orientation
du spin ont ete mesure par une experience resolue en temps et
sont decris par un modele simple d’equations bilans.
• Un mecanisme possible d’orientation du spin des ions Mn est
discute au chapitre 6. Les transitions optiques des excitons ob-
scurs, qui sont autorisees a cause de la presence d’une impurete
magnetique dans la boıte quantique, peuvent efficacement in-
duire une polarisation de l’ion Mn2+.
• Le Chapitre 7 decrit l’etude de la relaxation de spin dans des
sytemes d’ions uniques ou contenant plusieurs ions magnetiques,
en condition de faible ou de fort champ magnetique applique.
Dans le cas de l’ion Mn2+ unique dans une boıte quantique, il
a ete possible de mesurer directement la relaxation spin-reseau,
non perturbee par l’interaction spin-spin. Dans le cas de puits
quantiques dilues magnetique, une dynamique de spin rapide a
ete observe en absence de champ magnetique applique.
• Le dernier Chapitre 8 presente un resume de ce travail, ainsi que
les possibles perspectives.

Streszczenie
Niniejsza praca poświęcona jest badaniom dynamiki spinów magnety-
cznych jonów Mn2+ w niskowymiarowych strukturach wykonanych z
CdTe. Szczególną uwagę poświęcono systemowi pojedynczych kropek
kwantowych zawierających pojedyncze jony Mn2+. Kropki takie o-
ferują wyjątkową możliwość szczegółowego badania oddziaływań po-
jedynczego jonu magnetycznego z jego półprzewodnikowym otocze-
niem. Zaprezentowano metodę optycznej manipulacji i odczytu stanu
spinowego pojedynczego jonu magnetycznego. Eksperyment wyko-
rzystuje transfer ekscytonu pomiędzy sąsiadującymi kropkami, pod-
czas którego spin jest zachowany, do umieszczenia spolaryzowanych
ekscytonów w kropce z jonem Mn2+ i do zorientowania spinu tego
ostatniego. Dynamika procesu orientacji została zbadana w ekspery-
mencie czasowo-rozdzielczym i opisana prostym modelem. Przedysku-
towano i zaprezentowano doświadczalnie jeden z możliwych mech-
anizmów orientacji - optyczną rekombinację tzw. ciemnych ekscy-
tonów. Optyczna orientacja spinu Mn2+ została również użyta do
zbadania relaksacji spin-sieć izolowanego jonu w niskim i wysokim
polu magnetycznym.
W pracy poruszono również zjawiska zachodzące w niskim i zero-
wym polu magnetycznym w dużych systemach jonów magnetycznych
- studniach i kropkach kwantowych zawierających jony Mn2+. Nowa
technika eksperymentalna, wykorzystująca szybkie impulsy pola mag-
netycznego, została użyta do zbadania dynamiki elektronowego spinu
jonów Mn2+ przy braku zewnętrznego pola magnetycznego z nanosekun-
dową rozdzielczością. Zaobserwowano szybką relaksację namagne-
sowania po impulsie pola. Wyniki doświadczalne opisano uwzględ-
niając sprzężenie nadsubtelne ze spinem jądrowym jonów Mn2+. Za-
obserwowany efekt jest czuły na obecość anizotropii, spowowodanej
na przykład obecnością gazu dziurowego lub naprężeń. Przyłożenie
zewnętrznego pola magnetycznego blokuje szybką relaksację namag-
nesowania w studniach kwantowych, a obserwowana jest dobrze poz-

nana relaksacja spin-sieć. Co zaskakujące, w kropkach kwantowych
zawierających wiele jonów Mn2+ szybka relaksacja jest obserwowana
nawet po przyłożeniu zewnętrznego pola do 0,5 T. Ten szybki proces
może być spowodowany oddziaływaniem spin-spin pomiędzy jonami
magnetycznymi, szczególnie jeśli ich rozkład przestrzenny w kropce
nie jest jednorodny.
Układ pracy jest następujący:
• W rozdziale 1 przedstawiono krótkie wprowadzenie do tema-
tyki poruszanej w niniejszej pracy: opis podstawowych włas-
ności półprzewodników półmagnetycznych (ang. Diluted Mag-
netic Semiconductors), w szczególności Cd1−xMnxTe, oraz nisko-
wymiarowych struktur półprzewodnikowych - studni i kropek
kwantowych - zawierających jony magnetyczne. Przedstawiono
obecny stan wiedzy na temat dynamiki spinów w takich struk-
turach, jak również określono cel niniejszej pracy.
• Rozdział 2 zawiera opis spróbek użytych w pracy. Opisano za-
równo techniki wzrostu, jak i podstawowe własności studni i
kropek kwantowych.
• W rozdziale 3 przedstawiono standardowe techniki pomiarowe,
szeroko stosowane w optycznych badaniach nanostruktur pół-
przewodnikowych. Opisano techniki mikro-fotoluminescencji, ko-
relacji pojedynczych fotonów oraz spektroskopii w wysokim polu
magnetycznym.
• Nowa technika eksperymentalna, wykorzystująca szybkie impul-
sy pola magnetycznego, została zaprezentowana w rozdziale 4.
Impulsy pola magnetycznego są generowane za pomocą miniatu-
rowej cewki umieszczonej bezpośrednio na powierzchni próbki.
• W rozdziale 5 opisano eksperyment optycznej manipulacji spi-
nem pojedynczego jonu Mn2+ w kropce kwantowej wykonanej z
CdTe. Dynamika procesu orientacji została zbadana w ekspery-
mencie czasowo-rozdzielczym i opisana prostym modelem.

• Jeden z możliwych mechanizmów orientacji spinu Mn2+ przedys-
kutowano w rozdziale 6. Optyczna rekombinacja tzw. ciemnych
ekscytonów, dozwolona dzięki obecności domieszki magnetycznej
w kropce, może efektywnie indukować znaczącą polaryzację jonu
Mn2+.
• W rozdziale 7 opisano badania relaksacji spinowej w systemach
z pojedynczym oraz z wieloma jonami magnetycznymi, zarówno
w wysokim jak i niskim polu magnetycznym. W przypadku poje-
dynczego jonu Mn2+ w kropce kwantowej możliwe było zbadanie
czystej relaksacji spin-sieć, niezaburzonej poprzez oddziaływanie
spin-spin. W przypadku studni kwantowych wykonanych z pół-
przewodnika półmagnetycznego zaobserwowano szybką relaksację
przy braku zewnętrznego pola magnetycznego.
• Ostatni rozdział 8 zawiera podsumowanie pracy. Możliwości
dalszych badań w obszarach w niej poruszanych zostały krótko
przedstawione.

Contents
Contents xiii
List of Figures xvi
Acronyms and abbreviations xxii
1 Introduction 1
1.1 Diluted Magnetic Semiconductors . . . . . . . . . . . . . . . . . . 2
1.1.1 Magnetooptical properties of Cd1−xMnxTe . . . . . . . . . 4
1.2 Quantum wells . . . . . . . . . . . . . . . . . . . . . . . . . . . . 8
1.3 Quantum dots . . . . . . . . . . . . . . . . . . . . . . . . . . . . . 11
1.3.1 Diluted magnetic quantum dots . . . . . . . . . . . . . . . 12
1.3.2 Quantum dots with single magnetic ions . . . . . . . . . . 14
1.4 Aim of this work . . . . . . . . . . . . . . . . . . . . . . . . . . . 20
1.4.1 Spin orientation . . . . . . . . . . . . . . . . . . . . . . . . 20
1.4.2 Spin relaxation . . . . . . . . . . . . . . . . . . . . . . . . 21
2 Samples 23
2.1 Technology . . . . . . . . . . . . . . . . . . . . . . . . . . . . . . 23
2.2 Quantum wells . . . . . . . . . . . . . . . . . . . . . . . . . . . . 24
2.3 Quantum dots . . . . . . . . . . . . . . . . . . . . . . . . . . . . . 27
3 Standard experimental setups and techniques 30
3.1 Micro photoluminescence . . . . . . . . . . . . . . . . . . . . . . . 30
3.2 Single photon correlation . . . . . . . . . . . . . . . . . . . . . . . 34
3.3 Spectroscopy in high magnetic field . . . . . . . . . . . . . . . . . 37
xiii
CONTENTS
4 Pulsed magnetic field technique 38
4.1 Concept of the experiment . . . . . . . . . . . . . . . . . . . . . . 39
4.2 Micro-coils . . . . . . . . . . . . . . . . . . . . . . . . . . . . . . . 41
4.3 Power supplying . . . . . . . . . . . . . . . . . . . . . . . . . . . . 43
4.4 Electric field of the micro-coil . . . . . . . . . . . . . . . . . . . . 43
4.5 Optical excitaction and detection . . . . . . . . . . . . . . . . . . 45
4.5.1 Illumination of the sample . . . . . . . . . . . . . . . . . . 45
4.5.2 Detection of the optical signal . . . . . . . . . . . . . . . . 48
4.5.2.1 Photon counting setup . . . . . . . . . . . . . . . 48
4.5.2.2 Optical bridge . . . . . . . . . . . . . . . . . . . 50
4.6 Data analysis . . . . . . . . . . . . . . . . . . . . . . . . . . . . . 53
5 Spin orientation 56
5.1 Influence of exciton state on Mn2+ spin . . . . . . . . . . . . . . . 56
5.2 Spin orientation by polarized photons . . . . . . . . . . . . . . . . 63
5.2.1 Coupled quantum dots . . . . . . . . . . . . . . . . . . . . 64
5.2.2 Spin-conserving exciton transfer . . . . . . . . . . . . . . . 68
5.2.3 Mn2+ spin orientation . . . . . . . . . . . . . . . . . . . . 68
5.2.4 Dynamics of the Mn2+ spin orientation . . . . . . . . . . . 71
6 Dark excitons 76
6.1 Optical recombination of dark excitons . . . . . . . . . . . . . . . 77
6.2 Mn2+ spin orientation by dark exciton recombination . . . . . . . 84
7 Spin relaxation 85
7.1 Single isolated spin . . . . . . . . . . . . . . . . . . . . . . . . . . 86
7.1.1 Efficiency of the optical orientation of the magnetic ion . . 87
7.1.2 Direct time-resolved measurement . . . . . . . . . . . . . . 93
7.1.2.1 Low magnetic field . . . . . . . . . . . . . . . . . 93
7.1.2.2 High magnetic field . . . . . . . . . . . . . . . . . 94
7.2 System of coupled spins . . . . . . . . . . . . . . . . . . . . . . . 99
7.2.1 Diluted magnetic quantum wells . . . . . . . . . . . . . . . 100
7.2.2 Mn doped quantum dots . . . . . . . . . . . . . . . . . . . 109
xiv

CONTENTS
8 Conclusions 113
8.1 Perspectives . . . . . . . . . . . . . . . . . . . . . . . . . . . . . . 115
Appendix A 117
Appendix B 118
References 121
xv

List of Figures
1.1 A schematic diagram of the band structure of the CdTe. . . . . . 5
1.2 A schematic diagram of the selection rules for excitonic transitions
in Cd1−xMnxTe with non-vanishing magnetization. . . . . . . . . 6
1.3 A schematic diagram of the band structure of a Type I and Type
II quantum well. . . . . . . . . . . . . . . . . . . . . . . . . . . . 9
1.4 Optical spectra of an 8 nm wide Cd0.998Mn0.002Te quantum well
with different densities of two-dimensional hole gas. . . . . . . . . 10
1.5 A schematic diagram of a few lowest energy charge states of a CdTe
quantum dot . . . . . . . . . . . . . . . . . . . . . . . . . . . . . 12
1.6 Typical photoluminescence spectra of individual CdTe/ZnTe quan-
tum dots. . . . . . . . . . . . . . . . . . . . . . . . . . . . . . . . 13
1.7 Photoluminescence spectra of a small ensemble of Cd1−xMnxTe
/Zn0.8Cd0.2Te quantum dots with moderate content of Mn2+ ions,
measured in magnetic field in the range 0 - 6 T. . . . . . . . . . . 15
1.8 Photoluminescence spectra of a large ensemble of Cd1−xMnxTe
/Zn0.8Cd0.2Te quantum dots with moderate content of Mn2+ ions,
measured with and without magnetic field. . . . . . . . . . . . . . 16
1.9 Typical photoluminescence spectrum of a single-Mn doped CdTe
quantum dot. . . . . . . . . . . . . . . . . . . . . . . . . . . . . . 18
xvi

LIST OF FIGURES
1.10 A schematic diagram of possible relative orientations of the exciton
and Mn2+ spin; Diagram of the neutral exciton energy levels and
optical transitions in the non-magnetic quantum dot and in the
single Mn-doped dot; Photoluminescence spectrum of the neutral
exciton confined in the quantum dot with single Mn2+ ion taken
without polarization resolution. . . . . . . . . . . . . . . . . . . . 19
2.1 A schematic cross section of the samples containing quantum wells. 25
2.2 A schematic diagram of the mechanism allowing the control over
the hole gas density in the quantum well in the p-type samples. . 26
2.3 Transmission spectra of a p-type sample containing a CdTe quan-
tum well doped with 0.8% of Mn with high and low density of hole
gas. . . . . . . . . . . . . . . . . . . . . . . . . . . . . . . . . . . . 27
2.4 A schematic diagram of the mechanism allowing the control over
the hole gas density in the quantum well in the n-type samples. . 28
2.5 A transmission electron microscopy (TEM) image of a typical quan-
tum dot used in this work. . . . . . . . . . . . . . . . . . . . . . . 28
2.6 A schematic cross section of the samples containing quantum dots
used in experiments described in this work. . . . . . . . . . . . . . 29
3.1 A photograph of the microscope objective used in the micro-lumi-
nescence measurements in low magnetic field in an optical cryostat
and a schematic diagram of beam path inside. . . . . . . . . . . . 31
3.2 A photograph of the micro-luminescence setup comprising of a
microscope objective and piezoelectric x-y-z stages with sample
holder used during measurements in high magnetic field. . . . . . 32
3.3 A schematic diagram of polarization optics used in the micro-
photoluminescence setup utilizing optical fibers. . . . . . . . . . . 33
3.4 A schematic diagram of the experimental micro-photoluminescence
setup. . . . . . . . . . . . . . . . . . . . . . . . . . . . . . . . . . 35
3.5 A schematic diagram of the experimental setup for single photon
correlation. . . . . . . . . . . . . . . . . . . . . . . . . . . . . . . 36
xvii

LIST OF FIGURES
4.1 The idea of the optical measurement of the magnetization dynam-
ics of a diluted magnetic semiconductor quantum well after a pulse
of magnetic field. . . . . . . . . . . . . . . . . . . . . . . . . . . . 40
4.2 Result of calibration of the magnetic field produced by micro-coil
- a comparison of a ferromagnetic quantum well PL spectra taken
in magnetic field produced with the micro-coil and an external
superconductive magnet. . . . . . . . . . . . . . . . . . . . . . . . 42
4.3 A schematic drawing presenting the connection of the micro-coil
placed on the surface of the sample to the coaxial transmission line. 44
4.4 Photoluminescence intensity temporal profiles during the magnetic
pulse measured without and with additional illumination . . . . . 46
4.5 Comparison of the results of the two experiments performed with
micro-coil with different number of turns. . . . . . . . . . . . . . . 47
4.6 Illumination method of the sample in the case of photolumines-
cence and transmission measurements. . . . . . . . . . . . . . . . 48
4.7 A schematic diagram of the experimental setup in the configuration
using single photon counting technique. . . . . . . . . . . . . . . . 49
4.8 A schematic diagram of connections between the photon counter
and the pulse generator using the internal global clock of the
counter and enabling synchronization between pulsed magnetic
field and detection setup. . . . . . . . . . . . . . . . . . . . . . . . 50
4.9 A schematic diagram of the light and magnetic field pulses se-
quence in the setup comprising an optical bridge; A schematic dia-
gram of connections between the pulse generator and acousto-optic
modulator in the setup with a CW laser; A schematic diagram of
connections between the pulse generator and the pulse picker in
the setup with a femtosecond laser. . . . . . . . . . . . . . . . . . 51
4.10 A schematic diagram of the experimental setup in the configuration
using the optical bridge. . . . . . . . . . . . . . . . . . . . . . . . 52
4.11 A typical temporal profile of the magnetization of a Cd1−xMnxTe
quantum well after the magnetic pulse; the profile of the current
in the micro-coil; its convolution with different response functions
of the sample. . . . . . . . . . . . . . . . . . . . . . . . . . . . . . 54
xviii

LIST OF FIGURES
5.1 Typical results of photon correlation measurements of non-magnetic
quantum dot. . . . . . . . . . . . . . . . . . . . . . . . . . . . . . 57
5.2 Typical results of photon correlation measurements insensitive on
the Mn2+ spin state. . . . . . . . . . . . . . . . . . . . . . . . . . 59
5.3 Typical results of photon correlation measurements between dif-
ferent components of a single-Mn doped quantum dot excitonic
spectrum. . . . . . . . . . . . . . . . . . . . . . . . . . . . . . . . 60
5.4 Result of cross-correlation measurement of the photons related to
the same Mn2+ ion spin state, but different excitonic states com-
pared with the result of the auto-correlation measurement on neu-
tral exciton line. . . . . . . . . . . . . . . . . . . . . . . . . . . . . 61
5.5 A schematic diagram of the Mn2+ ion spin transitions calculated
with the model described in text. . . . . . . . . . . . . . . . . . . 63
5.6 Comparison of the results of the auto- and cross-correlation mea-
surements with the model described in text . . . . . . . . . . . . . 64
5.7 Result of auto-correlation measurements of the σ+-polarized pho-
tons related to the Mn2+ ion spin state with spin projection equal
to −5/2, performed for different values of excitation power. . . . . 65
5.8 Experimental data shown in Figure 5.7 compared with model de-
scribed in text . . . . . . . . . . . . . . . . . . . . . . . . . . . . . 66
5.9 Photoluminescence excitation map close to the resonance. . . . . . 67
5.10 Comparison of the Zeeman splitting and diamagnetic shift of the
ground excitonic level in the absorbing and emitting quantum dot. 67
5.11 Typical excitonic spectra taken under circular excitation at 1T
compared to the one taken under linear excitation without mag-
netic field. . . . . . . . . . . . . . . . . . . . . . . . . . . . . . . . 69
5.12 The mean spin of the Mn2+ ion as a function of excitation power
compared with model described in text . . . . . . . . . . . . . . . 70
5.13 The temporal profile of the intensity of one of the six excitonic
lines under the excitation pattern described in the text; Calculated
temporal profiles of occupation of six Mn2+ spin states after the
rapid change of excitation from one circular polarization to the
opposite one . . . . . . . . . . . . . . . . . . . . . . . . . . . . . . 73
xix

LIST OF FIGURES
5.14 Temporal profile of the photoluminescence intensity at one of the
six components of the exciton spectrum during the excitation se-
quence described in text for different values of excitation power;
The Mn2+ reorientation time vs. averaged time delay between
capture of two excitons. . . . . . . . . . . . . . . . . . . . . . . . 74
6.1 Color-scale plots of the photoluminescence spectra of two single
Mn-doped quantum dots as a function of magnetic field; Simulation
of the optical transitions in the QD with the model described in
text. . . . . . . . . . . . . . . . . . . . . . . . . . . . . . . . . . . 77
6.2 A schematic diagram of X admixtures in the Xd states and possible
channels of optical transitions related to the Xd recombination. . . 80
6.3 Spectra of the two quantum dots shown in Fig. 6.1 taken under
excitation with σ− polarized light and with polarization resolved
detection. . . . . . . . . . . . . . . . . . . . . . . . . . . . . . . . 81
6.4 Xd/X intensity ratio in σ+ polarization vs. X-Mn exchange con-
stant; Degree of circular polarization of Xd spectrum vs. anisotropic
exchange splitting of the quantum dot. . . . . . . . . . . . . . . . 82
7.1 Photoluminescence spectra of a single-Mn doped quantum dot un-
der circularly polarized excitation. . . . . . . . . . . . . . . . . . . 88
7.2 The mean value of the spin projection 〈Sz〉 of the single Mn2+ ion
in the quantum dot measured vs. excitation power. . . . . . . . . 90
7.3 Spin-lattice relaxation rate of a single Mn2+ ion in the quantum
dot as a function of magnetic field. . . . . . . . . . . . . . . . . . 92
7.4 The idea of the direct measurement of the spin relaxation time of
a single Mn2+ ion in the quantum dot for low magnetic field . . . 93
7.5 Temporal profile of the photoluminescence intensity at one of the
six components of the exciton spectrum during the excitation se-
quence described in text for B=1 T. . . . . . . . . . . . . . . . . . 95
7.6 Initial photoluminescence intensity after turning the excitation on
in σ− polarization versus length of dark period. . . . . . . . . . . 96
7.7 The idea of the direct measurement of the spin relaxation time of
a single Mn2+ ion in the quantum dot for high magnetic field . . . 96
xx

LIST OF FIGURES
7.8 Temporal profile of the photoluminescence intensity of one of the
six components of the exciton spectrum during the excitation se-
quence described in text for B=5.7 T . . . . . . . . . . . . . . . . 97
7.9 Spin-lattice relaxation rate of a single Mn2+ ion in the quantum
dot as a function of magnetic field. . . . . . . . . . . . . . . . . . 98
7.10 Magnetization dynamics of a Cd1−xMnxTe quantum well with 0.8%
of Mn at B = 0 after the pulse of magnetic field. . . . . . . . . . . 101
7.11 Spin-spin relaxation rate at 5 K, spin-lattice relaxation rate at
1.5-4.7 K, and present data at 1.5 K: fast and slow magnetization
decay at 0 and 1 T, respectively. . . . . . . . . . . . . . . . . . . . 102
7.12 Energy levels of a Mn2+ ion in a CdTe crystal . . . . . . . . . . . 104
7.13 Magnetization dynamics of a Cd1−xMnxTe quantum well with 0.8%
of Mn at B > 0. . . . . . . . . . . . . . . . . . . . . . . . . . . . . 107
7.14 Magnetization dynamics of a p-type Cd1−xMnxTe quantum well
with 0.8% of Mn and different hole gas concentration at B = 1 T. 108
7.15 Magnetization dynamics of a n-type and p-type Cd1−xMnxTe quan-
tum wells with 0.8% of Mn at B = 0. . . . . . . . . . . . . . . . . 109
7.16 Typical photoluminescence spectra of an ensemble of Cd1−xMnxTe
quantum dots with 1% of Mn, with and without applied magnetic
field. . . . . . . . . . . . . . . . . . . . . . . . . . . . . . . . . . . 110
7.17 Magnetization dynamics of an ensemble of quantum dots in exter-
nal, constant magnetic field . . . . . . . . . . . . . . . . . . . . . 111
xxi

Acronyms and abbreviations
Roman Symbols
CW continuous wave (e.g. excitation)
DMS Diluted Magnetic Semiconductuctors
EPR Electron Paramagnetic Resonance
MBE Molecular Beam Epitaxy
ML monolayer
PLE Photoluminescence Excitation
QD quantum dot
QW quantum well
RHEED Reflection High Energy Electron Diffraction
SK Stranski-Krastanov growth technique
SLR spin-lattice relaxation
X neutral exciton
X+ positively charged exciton
X− negatively charged exciton
Xd dark exciton
XX biexciton
xxii

Chapter 1
Introduction
The ability to incorporate magnetic atoms into semiconductor structures offers a
tempting possibility to integrate information storage and information processing
microelectronic devices. A completely new research area called “spintronics”
has evolved around this concept [1, 2]. Perspectives of devices operating on
single spins are particularly inspiring. Although today the incorporation of single
magnetic atoms is not fully controllable, the constant progress in technology of
fabrication of semiconductor nanostructures gives hope for a possibility to dope
the nanostructures in controllable manner in the future. Expected advantages
for miniaturization and superior speed of future spintronic devices, as well as
potential use of magnetic ions embedded in semiconductor lattice as spin qubits,
attract attention of many research laboratories around the world.
From the point of view of possible applications, the knowledge about the
spin dynamics of magnetic ions in the semiconductor crystal is crucial. The
mechanisms responsible for this dynamics have been studied for years. Many
experiments supplied substantial knowledge concerning the physical properties of
different diluted magnetic semiconductors. Although many dynamic features of
magnetic ions in a semiconductor crystal are well understood, the development of
new magnetic nanostructures (in particular quantum dots) and new experimental
techniques opened new areas of research. For instance, the ability to produce
quantum dots with exactly one magnetic ion embedded, inside created unmatched
opportunity to investigate properties of a truly isolated ion, not interacting with
any other magnetic moments. The development of the technique of fast magnetic
1

1. INTRODUCTION
pulses allowed, in turn, measurements of the spin dynamics in the absence of any
magnetic field. In reference to these issues, this work reports experimental results
and their interpretation related to the mechanisms governing the spin dynamics -
orientation and relaxation - of the manganese ions embedded in the CdTe crystal.
Particular emphasis has been focused on system of single CdTe quantum dots
with single Mn2+ ions, which give a peerless insight into the interactions of mag-
netic ion with semiconductor environment. Phenomena occurring in low and zero
magnetic field in larger systems of magnetic ions, which have not been investi-
gated before, are also addressed.
In this chapter, I briefly review the current level of knowledge on Cd1−xMnxTe-
based quantum wells and quantum dots and the spin dynamics of magnetic atoms
in these system. In the end, I define the aim of this work.
1.1 Diluted Magnetic Semiconductors
Diluted Magnetic Semiconductuctors (DMS), also known as Semimagnetic Semi-
conductors are semiconductor materials in which part of the original cations has
been substituted by ions with non-vanishing magnetic momentum (e.g. Mn, Cr,
Co, Fe, etc.) [3]. The magnetic system does not form an organised sublattice.
The density of the magnetic ions in the host material is small and they are ran-
domly located at the cation sites. As a result such a system may be considered
as containing two interacting subsystems. The first one is a diluted ensemble of
localised magnetic moments. The second subsystem is a system of delocalized
carriers with well known properties, typical for semiconductor host crystal. The
crystal electronic and structural properties remain almost unchanged by the dop-
ing with magnetic atoms. This makes diluted magnetic semiconductors perfect
for studying the basic mechanisms of the interactions between the spins of the
band carriers and the localised spins as well as other mechanisms governing the
spin dynamics of the magnetic ions (e.g. spin-lattice or spin-spin interactions).
The delocalisation of the carriers is so vast that their wavefunctions cover many
randomly distributed magnetic ions. This allows the use of a virtual crystal ap-
proximation, in which a fraction of the average spin value (proportional to the
content of the magnetic ions in the host crystal) is attributed to each cation
2
1. INTRODUCTION
site. Moreover, the interaction of the carriers with these fractional spins can be
described within assumptions of so-called mean field approximation: all spin op-
erators of localized magnetic moments can be replaced by their thermodynamic
mean value.
Originally, the weak doping of the semiconductor with magnetic ions was in-
tended to enhance the response of the material to external magnetic field. One of
the most spectacular examples of such enhancement are the giant Zeeman split-
ting of the electronic bands and, resulting from the band splitting, giant Faraday
rotation of the polarization plane of light passing the DMS crystal. The prefix
“giant” describing these effects is related to the magnitude of enhancement, being
equal to several orders of magnitude when compared to ordinary semiconductors
without magnetic ions at a given external magnetic field [3, 4].
Among the DMS materials, the most common are II-VI compounds (e.g CdTe,
ZnTe, CdSe) with transition metal ions (e.g. Mn, Co or Fe) substituting their
original cations. In II-VI family, Cd1−xMnxTe appears as particularly suitable
for studies of low-dimensional structures.
First of all the II-VI materials (and CdTe in particular) posses excellent op-
tical properties. CdTe has a direct band gap at the Γ point of the Brillouin zone
(see section 1.1.1). The band gap width for the bulk CdTe is equal to 1.606 eV
(at helium temperature) [5] and lowering its dimensionality leads to the increase
of the gap. This makes the CdTe nanostructures a perfect subject of the optical
spectroscopy, as the light emission and absorbtion occurs in the visible region.
The optical experiments are also facilitated by the fact that decades of develop-
ment of the crystal growth techniques and the state of the art control over the
growth parameters on different substrates result in a superb optical quality of
the samples. The wide bang gap, relatively high exciton (X) binding energy and
significant exciton oscillator strength enable light emission and facilitates optical
experiments at higher temperature, when compared to III-V materials.
Secondly, the great flexibility of the Cd1−xMnxTe material is due to the iso-
electronic character of manganese in CdTe, offering the possibility of independent
magnetic doping and electrical biasing of nanostructures [6, 7]. Moreover, the
advancements in crystal growth, particularly in Molecular Beam Epitaxy (MBE)
allowed zinc blende structure crystals of Cd1−xMnxTe to be grown in almost en-
3

1. INTRODUCTION
tire composition range (x in the range of 0− 100%) without significant change of
crystal properties of the material [8, 9]. This, along with superb optical properties
of the CdTe makes the Cd1−xMnxTe an excellent candidate for growth of diluted
magnetic nanostructures. Such structures offer a broad range of optical methods
which yield direct information on the properties of magnetic system embedded
in the semiconductor crystal.
1.1.1 Magnetooptical properties of Cd1−xMnxTe
As mentioned above, CdTe (and as a consequence diluted Cd1−xMnxTe) has a
direct band gap at the Γ point of Brillouin zone. The structure of the electronic
bands, typical for semiconductors with a zinc-blende crystal lattice, is shown
schematically in Figure 1.1. The conduction band is twofold spin degenerate at
k=0 (two ±1/2 spin subbands), while the valence band is fourfold degenerate.
The latter consists of two subbands with total angular momentum J = 3/2:
the one of so-called heavy holes, with the spin projection onto the growth axis
Jz = 3/2 and the subband of light holes with Jz = 1/2. “Heavy” and “light”
describing the holes refer to the effective mass along the quantization axis. The
holes with total angular momentum J = 1/2 form a split-off band, which is
separated from the maximum of the valence band at k = 0 by the spin-orbit
coupling ∆SO. For CdTe, ∆SO=930 meV [10] which is large enough to neglect
the influence of this band on the phenomena discussed in this work.
As mentioned in previous section, one of the most characteristic effects ob-
served in DMS materials is a giant Zeeman splitting of the electronic bands. It
results from the exchange interaction between the (s, p) band electrons and the
d electrons of the Mn2+ ions, which have 3d5 electronic shell configuration (the
interaction is often shortly called the (s, p)−d exchange). The consequence of the
electronic band splitting caused by the magnetization of the Mn system, is split-
ting of the exciton transition (recombination of the bound electron-hole pair) into
six components. Photons emitted in four of these transitions (two in each circular
polarization) are visible in Faraday configuration, when the magnetization of the
Mn system is parallel to the light propagation direction. Two remaining transi-
tions lead to emission of linearly polarized photons visible in Voigt configuration
4
1. INTRODUCTION
Energy
k hh
lh
so
va
len
ce
ba
nd
co
nd
uctio
n
ba
nd
Figure 1.1: A schematic diagram of the band structure of the CdTe. hh refersto heavy holes, lh to light holes and so to the split-off band (see description intext).
(magnetization perpendicular to the light propagation). The selection rules of
these transitions are shown in Figure 1.2.
The magnetization of the Cd1−xMnxTe material is given by the mean value of
the Mn2+ spin 〈S〉 and the Mn fraction x. If the external magnetic field is applied
along the z axis, the mean value of the spin projections onto perpendicular axes
is equal to 0 and the magnetization M can be written as:
M = −gMnµBN0x〈Sz〉 (1.1)
where gMn is Mn Lande factor (gMn = 2), µB is Bohr magneton, N0 is a number
of cation sites per unit volume and 〈Sz〉 is a mean value of the spin projection of
a Mn2+ ion (therefore x〈Sz〉 is a mean magnetization per one cation site) [11]. In
the case of very diluted material (x <1%), where the interactions between Mn2+
ions can be neglected, the 〈Sz〉 in temperature T and external magnetic field B
is given by:
5

1. INTRODUCTION
+1/2
-1/2
-1/2
-3/2
+3/2
+1/2
σ - σ + π
Magnetic field
Energ
y
Figure 1.2: A schematic diagram of the selection rules for excitonic transitionsin Cd1−xMnxTe with non-vanishing magnetization. The conduction band is de-scribed with the electron spin, the valence band with the hole spin.
〈Sz〉 = −5
2B 5
2
(5
2
gMnµBB
kBT
)(1.2)
where 52
is the total electronic spin of the Mn2+ ion, kB is the Boltzmann constant
and BJ is the Brillouin function:
BJ(x) =2J + 1
2Jcoth
(2J + 1
2Jx
)− 1
2Jcoth
(1
2Jx
)(1.3)
The antiferromagnetic d−d interaction between the Mn2+ ions in material with
higher Mn content makes the situation more complex. The most closely spaced
pairs of the Mn2+ ions are completely resistant to moderate magnetic field, as the
interaction between the ions is much stronger than their interaction with the field
(the exchange constant for nearest-neighbour Mn2+ spins JNN is approximately
equal to 540 µeV [12], while the Zeeman energy gMnµB ≈116 µeV·T−1). This,
6

1. INTRODUCTION
as well as the reduction of the averaged spin in triangles and higher complexes
of Mn2+ ions, can be described by introducing the effective Mn fraction in the
Cd1−xMnxTe material, xeff [4, 13]. This fraction of the Mn2+ ions is aligned by
the magnetic field. However, even weakly interacting (more distant) ions are more
resistant to the field than the isolated ones. This results from non-negligible d−dinteraction. This effect can be simulated by using an effective temperature of the
Mn system, Teff = T +T0 [4, 13]. Thus the formula describing the magnetization
takes following form:
M =5
2gMnµBN0xeffB 5
2
(5
2
gMnµBB
kB(T + T0)
)(1.4)
Due to very large number of possible relative positions of the Mn2+ ions in
the host crystal, it is not efficient to derive the expression for xeff and T0 for a
given Mn content in the Cd1−xMnxTe material. However, in Refs. [14] and [15]
following empirical expressions were found to describe experimental data with
good accuracy:
xeff (x) = x(0.261e−43.34x + 0.723e−6.19x + 0.00715
)(1.5)
T0(x) = x35.37 K
1 + 2.752x(1.6)
All above parameters have been deduced from the Zeeman splitting measure-
ments performed on bulk Cd1−xMnxTe [13]. The approximations are valid for
moderate Mn fraction x<67%, liquid helium temperatures and moderate mag-
netic field (B<5 T). Under other conditions, particularly for lower temperatures,
a spin glass phase was observed [16, 17, 18, 19]. For higher magnetic field, the
correction related to close neighbours is necessary. In all experiments described
in this work structures with very low Mn content were used, so that in most cases
we can consider the Mn2+ ions as isolated.
The important fact from the point of view of investigation of the magnetic
7

1. INTRODUCTION
system is that the splitting of all bands increase linearly with the magnetization of
the material. Thus the splitting of the excitonic transitions measured in different
polarizations also depends linearly on the magnetization. This can be used to
optically probe the state of the magnetic system. In particular, the splitting of
the heavy hole states in Faraday configuration is given by:
∆E = N0(β − α)x〈Sz〉 (1.7)
where α and β are electron-Mn and hole-Mn exchange integrals. Values of
N0α and N0β were determined experimentally. For Cd1−xMnxTe they are equal
0.22 eV and 0.88 eV, respectively [4].
The degeneracy between heavy and light holes can be lifted by reducing the
symmetry of the system. For example, it can be achieved by application of
uniaxial pressure or confinement in a quasi-2D layer. This is the case of thin
CdTe structures, like quantum wells (see section 1.2) or self-organized lens-shaped
quantum dots (section 1.3) embedded in barriers with different lattice constant
(ZnTe, for example). In all structures discussed in this work, the lowest valence
subband is the heavy hole one.
1.2 Quantum wells
Quantum well (QW) is a two-dimensional structure confining particles within
barriers of potential. In practice, this idea is realized most commonly in epitax-
ially grown semiconductors. The simplest way to obtain a quantum well is to
embed a thin layer (usually less than 100 atomic layers) of one semiconductor
between the barriers of a different material with larger energy band gap. The
obtained confinement is the cause of most of the properties which differ quantum
wells from bulk semiconductors.
When a thin layer of one semiconductor is embedded in a different material,
the way the valence and conduction bands in the two materials will line up in
respect to each other is not easy to predict in general case. In principle there are
two possible types of band alignment for a quantum well. In the first one, called
8

1. INTRODUCTION
En
erg
y
z
(a)
VB
CB
En
erg
y
z
(b)
VB
CB
Figure 1.3: A schematic diagram of the band structure of a Type I (a) and TypeII (b) quantum well and the spatial confinement of the carriers. Blue pointsrepresent electrons, the red ones represent holes.
Type I structure, both electrons and holes have lower energy in the material of the
quantum well. This kind of band structure is schematically shown in Figure 1.3a.
In second type, called Type II structure, different charge carriers have minimum
energy in different materials. Figure 1.3b shows this type od structure.
All 2D structures discussed in this work are made of Cd1−xMnxTe embedded
in Cd1−xMgxTe or Cd1−x−yMgxZnyTe material. The compositions are chosen in
such a way that the energy gap of the barrier is larger than the energy gap of
the Cd1−xMnxTe. The band offset between the two materials is such that Type
I alignment is formed. As a result both types of the charge carriers are confined
in the layer possessing smaller band gap and their free movement is limited only
to the plane of this layer.
As mentioned in section 1.1.1, 2D carrier confinement and the strain caused
by the lattice mismatch of the quantum well and the barrier material lift the
degeneracy of the valence band. For biaxial compressive strain (smaller lattice
constant of the barrier compared with the quantum well material), the lowest en-
ergy holes are heavy holes with total angular momentum projection Jz = ±3/2.
Relatively large valence band splitting in all samples discussed in this work justi-
fies considering all valence subbands other than the heavy hole one as irrelevant
for investigated properties, except for the case discussed in chapter 6.
9

1. INTRODUCTION
Figure 1.4: Optical spectra ((a) - absorption and (b) - photoluminescence) ofan 8 nm wide Cd0.998Mn0.002Te quantum well with indicated densities of two-dimensional hole gas. Lines related to both neutral (X) and positively charged(X+) excitons are clearly visible. (from Ref. [24])
The carrier confinement in quantum wells (as in other low-dimensional struc-
tures) enhances the Coulomb interaction between electrons and holes. As a result
the exciton binding energy increases. This is true not only for neutral excitons
(bound electron-hole pair), but also for the trions, i.e charged excitons, for which
the increase is even larger than for neutral ones. These exciton complexes consist
of either two holes and one electron (positive trion, X+), or two electrons and one
hole (negative trion, X−). As a result of the increase of the binding energy in the
optical spectra of quantum wells (both in absorption and emission) lines related
to both neutral and charged excitons are observed and are dominant close to the
band gap edge [20, 21, 22, 23]. This is clearly seen in Figure 1.4. The figure also
shows the possibility to tune the carrier density in the quantum well by using
illumination of energy above the barrier band gap. This mechanism is discussed
in section 2.2.
10
1. INTRODUCTION
1.3 Quantum dots
Quantum dots (QDs) are nanometer-size semiconductor structures in which the
carriers are confined in all three spatial directions. As a result the energy spec-
trum of the carriers is quantized in shells of discrete levels. Due to the analogy
with the energy spectrum of atoms, quantum dots are often called “artificial
atoms”. Properties of the carriers in the quantum dots result from the combina-
tion of the semiconductor bulk properties (e.g. effective mass of the carriers) and
the spatial confinement.
For a long time, the most intensively studied self-organised quantum dots were
those made of III-V binary compounds: arsenides (e.g. InAs/GaAs) [25, 26, 27]
and phosphides (e.g. InP/GaP). [28, 29]. More recently, II-VI materials gained
a large interest as the advancements in growth techniques allowed fabrication of
II-VI high quality quantum dots with fairly controllable parameters. Tellurides
(e.g. CdTe/ZnTe) [30, 31] and selenides (e.g. CdSe/ZnSe) [32, 33] are among the
most intensively investigated II-VI quantum dots. The CdTe dots are particularly
suitable for optical spectroscopy, as the excitonic transitions in such dots occur
in the visible range of the electromagnetic spectrum.
Similarly to the case of quantum wells, the flat lens shape of the dots (see sec-
tion 2.3) lifts the degeneracy of the valence band. The heavy holes with angular
momentum projection Jz = 3/2 are the lowest energy ones. When such a hole
is confined in the quantum dot together with the electron (spin S = 1/2), four
different excitonic states can be formed. The difference between these states is
the spin orientation of the two carriers. Two of these states, with the hole and
electron spin oriented antiparallely, are optically active. Their total angular mo-
mentum equals 1. These are called bright neutral excitons. The other two states,
called dark excitons, possess total angular momentum equal 2 and are usually
not optically active. They might be optically observed when their wave function
is mixed with other (bright) states. This occurs for example when the magnetic
ion is present in the quantum dot. Such situation is described in chapter 6.
Except neutral excitons, other more complex excitonic states might be ob-
served if the barrier potential is high enough. These include charged excitons
(two electrons and one hole or two holes and one electron), biexcitons (XX, two
11
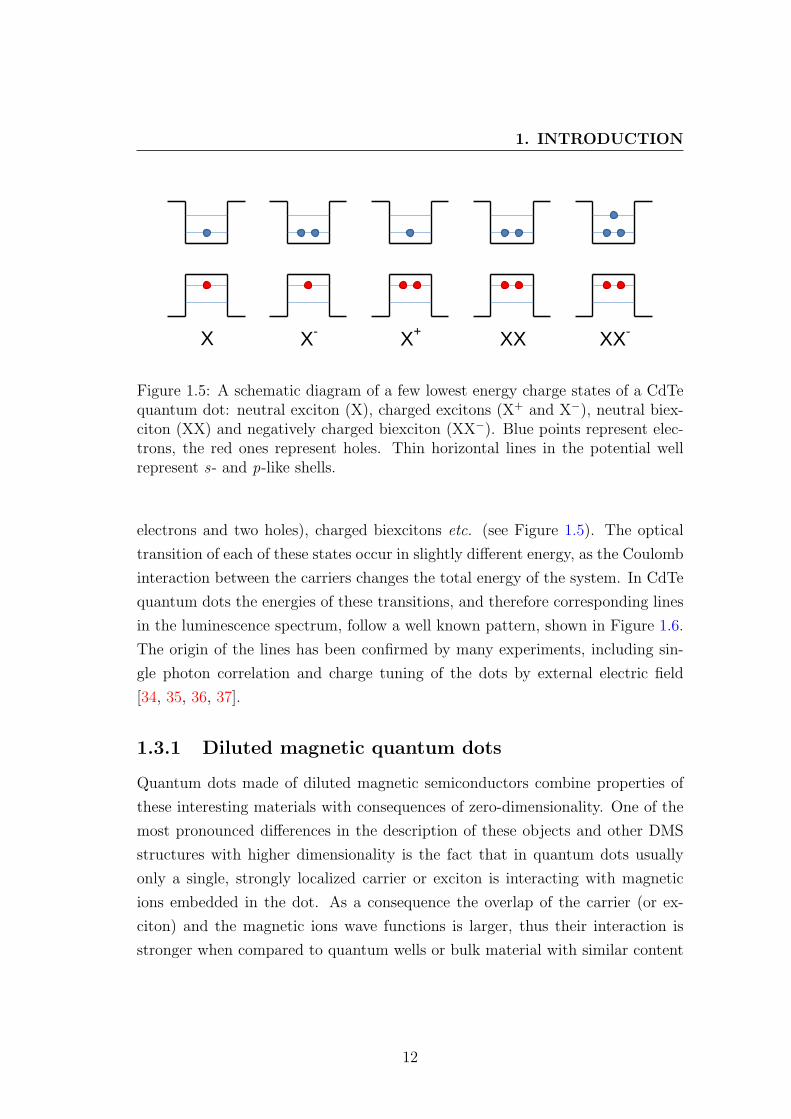
1. INTRODUCTION
X X-
X+
XX
XX-
Figure 1.5: A schematic diagram of a few lowest energy charge states of a CdTequantum dot: neutral exciton (X), charged excitons (X+ and X−), neutral biex-citon (XX) and negatively charged biexciton (XX−). Blue points represent elec-trons, the red ones represent holes. Thin horizontal lines in the potential wellrepresent s- and p-like shells.
electrons and two holes), charged biexcitons etc. (see Figure 1.5). The optical
transition of each of these states occur in slightly different energy, as the Coulomb
interaction between the carriers changes the total energy of the system. In CdTe
quantum dots the energies of these transitions, and therefore corresponding lines
in the luminescence spectrum, follow a well known pattern, shown in Figure 1.6.
The origin of the lines has been confirmed by many experiments, including sin-
gle photon correlation and charge tuning of the dots by external electric field
[34, 35, 36, 37].
1.3.1 Diluted magnetic quantum dots
Quantum dots made of diluted magnetic semiconductors combine properties of
these interesting materials with consequences of zero-dimensionality. One of the
most pronounced differences in the description of these objects and other DMS
structures with higher dimensionality is the fact that in quantum dots usually
only a single, strongly localized carrier or exciton is interacting with magnetic
ions embedded in the dot. As a consequence the overlap of the carrier (or ex-
citon) and the magnetic ions wave functions is larger, thus their interaction is
stronger when compared to quantum wells or bulk material with similar content
12

1. INTRODUCTION
1945 1950 1955 1960
XX-
XX
X-
X+
X
Emission energy (meV)
1870 1875 1880 1885
XX-
XX
X-
X+
X
Ph
oto
lum
ine
sce
nce
in
ten
sity (
arb
.u.)
Figure 1.6: Typical photoluminescence spectra of individual CdTe/ZnTe quan-tum dots with indicated lines related to specific excitonic transitions: neutralexciton (X), charged excitons (X+ and X−), neutral biexciton (XX) and nega-tively charged biexciton (XX−). Details of line identification methods can befound in Refs. [34, 35, 36, 37].
of magnetic ions. Many interesting experiments exploiting this strong interac-
tion have been demonstrated, including the use of magnetic doped nanocrystals
as a voltage-controlled spin filter [38] or observation of quasi-zero-dimensional
magnetic polarons (i.e. correlated carrier and magnetic ion spins) in individual
quantum dots [39].
DMS quantum dots have been proposed as building blocks for spin-base quan-
tum logic gates [40, 41, 42] and are considered as a miniature cells of memory
devices [43, 44, 45, 46]. However, the use of quantum dots with magnetic ions
in such application requires a detailed knowledge on the spin dynamics of the
magnetic moments in such systems. This issue is one of the key points addressed
in this work.
13

1. INTRODUCTION
For the reasons already discussed in previous sections, the Cd1−xMnxTe ma-
terial seems to be perfect for investigation of phenomena occurring in diluted
magnetic quantum dots, especially for optically-oriented experiments. Two types
of such quantum dots have been investigated in this work. The first one contained
moderate amount of magnetic atoms, between tens and one hundred atoms per
one dot in average. The second type was prepared in the way that it was pos-
sible to select single quantum dots with single magnetic ions. The latter type is
discussed in the next section. In case of the former type, only large ensembles of
such dots were investigated. The luminescence spectrum of such ensemble shows
a very broad band consisting of millions of lines, each related to a specific quan-
tum dot. The huge number of lines makes it impossible to resolve them. However,
even the broad band can be used to monitor the magnetization of the Mn2+ ions
embedded in the quantum dots. When the magnetization becomes non-zero (e.g
upon application of external magnetic field) the luminescence lines related to s-
shell excitonic states (X, X−, X+, XX) of every dot follow the giant Zeeman effect
and split into two circularly polarized components. As it was shown by Wojnar
et al. [47], in case of X, X−, and X+ the lower energy component becomes more
pronounced than the high energy one, due to non-negligible spin relaxation of
the excitonic complexes confined in the dots . As a result the spectrum of every
single dot becomes strongly circularly polarized. Such behaviour is clearly visible
in Figure 1.7, presenting results of a micro photoluminescence experiment taken
from Ref. [47]. Therefore the entire spectrum of a big ensemble of dots also
becomes circularly polarized. It is especially pronounced in the low energy part
of the spectrum, consisting mostly of the lines related to s-shell excitonic states.
This is visible in the macro photoluminescence experiment, results of which are
shown in Figure 1.8. Therefore the degree of circular polarization of the spectrum
(or simply its intensity in low energy tail at given polarization) can be used to
monitor the changes in the magnetization of the magnetic ions.
1.3.2 Quantum dots with single magnetic ions
A quantum dot with an exactly one magnetic ion is a qualitatively different
system when compared to the dot with many ions. The magneto-optical effects
14

1. INTRODUCTION
Figure 1.7: Photoluminescence spectra of a small ensamble ofCd1−xMnxTe/Zn0.8Cd0.2Te quantum dots with moderate content of Mn2+
ions (a few tens of ions per dot), measured in magnetic field in the range 0 -6 T. Measurements were performed in liquid helium temperature in Faradayconfiguration. Positive values of field correspond to σ+ polarization, negativevalues to σ− polarization. A low energy shift of lines related to excitonictransitions in single quantum dots is clearly visible upon application of magneticfield. (from Ref. [47])
15

1. INTRODUCTION
0
0.5
1.0
1800 1900 2000 2100
B = 1 TB = 0 T
Energy (meV)
Ph
oto
lum
ine
sce
nce
in
ten
sity (
arb
. u
.)
Figure 1.8: Photoluminescence spectra of a large ensemble ofCd1−xMnxTe/Zn0.8Cd0.2Te quantum dots with moderate content of Mn2+
ions (a few tens of ions per dot), measured with and without magneticfield. Measurements were performed in liquid helium temperature in Faradayconfiguration in σ+ polarization.
16

1. INTRODUCTION
in single Mn-doped dot, resulting from the influence of the magnetic system on
the exciton confined in the dot, cannot be described as an effect of statistical
behaviour of a large ensemble of magnetic moments. On the contrary, it is a
result of a relatively simple interaction between two spins (the excitonic one and
the one of the magnetic ion). This opens insight into properties of a single,
selected Mn2+ ion. It gives possibility to analyze the mechanisms governing the
behaviour of the magnetic atom in the semiconductor crystal unperturbed by the
interaction with other magnetic moments.
Quantum dots with single Mn2+ ions were considered theoretically in the case
of spherical nanocrystals with a strong confinement [48]. The first experimental
observation of the single Mn2+ ions in self-organized CdTe quantum dots was
done by L. Besombes and co-workers [49] and was followed by many experiments
[7, 35, 50] and theoretical works [51, 52] which supplied substantial knowledge on
such system. A few years later a similar observation was done by A. Kudelski and
co-workers in InAs dots [53, 54]. This work is devoted to the CdTe dots. Such
choice is motivated by the availability of the samples and the simplicity of CdTe
based system. The lack of the orbital momentum of the Mn2+ ion embedded
in the CdTe crystal lets us describe the magnetic CdTe quantum dot with the
exciton confined inside in terms of interaction of pure spins (spins of the magnetic
ion, electron and hole), which is not the case with the dots made of InAs.
Basic magnetooptical properties of the single Mn-doped CdTe quantum dots
are the same as in the non-magnetic dots. The order of the transitions related to
recombination of different excitonic complexes, the Zeeman splitting of the exci-
tonic states etc. are typical for similar CdTe dots without magnetic impurities.
A photoluminescence spectrum of a typical dot with single Mn2+ ion is shown in
Fig. 1.9
The major difference between the spectrum of a non-magnetic CdTe quantum
dot, and a dot with exactly one Mn2+ ion is a characteristic multifold splitting
of photoluminescence lines related to each of the excitonic transitions. To under-
stand the origin of this splitting let us focus on the case of neutral exciton state
confined in the quantum dot. In such a case, the exchange interaction between
the exciton and the magnetic ion changes the total energy of the system, depend-
ing on the relative orientation of the two spins (see Figure 1.10(a)). This lifts
17

1. INTRODUCTION
0
1
1.87 1.88 1.89Energy (eV)
Ph
oto
lum
ine
sce
nce
(a
rb.u
.)
X
XX
X-
X+ XX-
Figure 1.9: Typical photoluminescence spectrum of a single-Mn doped CdTequantum dot with indicated lines related to recombination of specific excitonicstates.
the degeneracy of the exciton-Mn system, even in zero magnetic field. Since the
total spin of the Mn2+ ion is equal to 5/2, the number of its possible projections
onto the quantization axis given by the anisotropic excitonic angular momentum
(parallel to the growth axis of the sample) is equal to 6. Therefore the energy
level of the ground state spits into 6 sublevels (see Figure 1.10(b)). As a result
the neutral excitonic spectrum of the quantum dot consist of six sharp lines, each
2-fold degenerated and related to a specific spin state of the exciton-Mn system
(see Figure 1.10(c)). If observed photons are related to the excitons with specific
spin projection (+1 or −1), which defines their circular polarization, then each
component of the excitonic sextuplet corresponds to a specific spin state of the
Mn2+ ion. For example, the lowest energy line is related to the Mn2+ state with
18

1. INTRODUCTION
Jz=+1
1889 1890Energy (meV)
Ph
oto
lum
ine
sce
nce
(a
rb.u
.)5/2
3/2
1/2
-1/2
-3/2
-5/2
5/2
3/2
1/2
-1/2
-3/2
-5/2
X
Jz=-1
Mn2+
QD with single Mn2+
QD with no Mn2+
(a) (b) (c)
Figure 1.10: (a) A schematic diagram of possible relative orientations of the ex-citon and Mn2+ spin. Numbers indicate spin projection onto the quantizationaxis parallel to the growth axis of the sample. (b) Diagram of the neutral excitonenergy levels and optical transitions in the non-magnetic quantum dot (left) andin the single Mn-doped dot (right). (from Ref. [49]) (c) Photoluminescence spec-trum of the neutral exciton confined in the quantum dot with single Mn2+ iontaken without polarization resolution. Red arrows indicate the spin states andphotoluminescence line related to each other.
spin projection equal to −5/2 if the spectrum is recorded in σ+ polarization, and
to the state with spin projection equal to +5/2 if the σ−-polarized spectrum is
observed (see Figure 1.10).
Since the biexciton is a spin singlet state, the interaction of the Mn2+ ion
with the carriers in such state compensate each other and therefore in the first
order approximation no energy splitting is present in the initial state, prior to the
recombination process [49]. However, the final state of the optical recombination
of the biexciton (after emission of the photon) is the neutral exciton state, which
is split into six sublevels. Thus the part of photoluminescence spectrum related to
the biexcitonic transition also shows sixfold splitting, clearly visible in Figure 1.9.
More complex multiplets are related to charged excitonic states. A detailed
analysis of spectra related to recombination of these states can be found in Ref. [7].
The experiments described in this work focus on neutral exciton and biexciton
features.
19
1. INTRODUCTION
1.4 Aim of this work
As mentioned at the beginning of this chapter, the spin dynamics of magnetic
ions embedded in the semiconductor crystal might be important from the point
of view of possible applications. This work explores new fields of research of
this spin dynamics, which became available thanks to the development of new
magnetic nanostructures and new experimental techniques. The work reports
new experimental results related to mechanisms governing the spin dynamics -
orientation and relaxation - of the Mn2+ ions embedded in the CdTe crystal. A
significant part of this work is devoted to single CdTe quantum dots with single
Mn2+ ions and phenomena occurring in low and zero magnetic field, which is
interesting not only from the applicational, but also from the scientific point of
view.
1.4.1 Spin orientation
The knowledge of properties of isolated magnetic ions is particularly important
from the point of view of miniaturization and scalability of future information
storage devices. Among such devices the concept of those with all-optical writing
and readout of information seems particularly promising. The optical readout of
the magnetization of the magnetic system is possible due to the s,p-d interaction
between the optically recombining excitons and the magnetic ions. In the case of
system consisting of many magnetic atoms, it leads to the giant Zeeman splitting
of the excitonic states with different spin projection onto the quantization axis (see
section 1.1). In the case of single magnetic impurity (e.g. in the Mn-doped CdTe
quantum dots), the s,p-d interaction lifts the degeneracy of the magnetic ion-
exciton complex and causes the characteristic multifold splitting of the excitonic
state (see section 1.3.2). This gives the unique possibility to perform a direct
optical readout of the spin state of the single magnetic ion.
The optical writing of information in the magnetic system embedded in the
semiconductor crystal is, however, a more difficult challenge. The optical in-
duction or switching of the magnetization in large magnetic systems has been
demonstrated, for example in (Zn,Mn)Se [55] or (Cd,Mn)Te [6, 56] quantum
wells, (Cd,Mn)Te quantum dots [57], (Hg,Mn)Te crystals [58] or thin films of
20
1. INTRODUCTION
ferrimagnetic alloys [59]. The electric control over the magnetic system in semi-
conductor has been also shown [60], as well as the use of combined electronic and
optical properties of a semiconductor doped with magnetic ions [61]. However,
mechanisms used in all those experiments are not scalable down to single mag-
netic ions, as they all involve the spin-spin interactions between large ensembles
of magnetic impurities. At the time when we started experiments described in
this work, the optically induced spin orientation of a single magnetic ion had not
been demonstrated. Thus the main aim of this work was to develop the proce-
dure for such orientation. The experiment showing the possibility to use a single
Mn2+ ion embedded in the CdTe quantum dot as a magnetic volatile memory is
described in chapter 5. A similar experiment using a slightly different technique
than ours was done independently by L. Besombes and co-workers [45].
The aim of this work was also to investigate the spin-related phenomena,
which can help to understand the dynamics of the spin of magnetic impurities.
The dark excitons optical recombination, for example, impossible to observe in
non-magnetic quantum dots in the absence of magnetic field, is easily observable
in single Mn-doped dots. The experiment, revealing the role of this recombination
in the process of optical orientation of the Mn2+ spin is presented in chapter 6.
The investigation of the spin-lattice relaxation (SLR) of the single Mn2+ ion,
described in the next section, is another example of the experiment which takes
advantage of the spin orientation mechanism to analyze the spin dynamics of the
single magnetic impurities.
1.4.2 Spin relaxation
The spin dynamics caused by relaxation processes has been intensively studied,
for years, in bulk and 2D DMS materials. The main interactions which keep the
system of magnetic ions in thermodynamical equilibrium with the crystal lattice
were identified as a spin-lattice interaction [62, 63] which can lead to a global
change of magnetization, and spin-spin interaction [64, 65] which can act locally
and lead to the spin diffusion to non-spin-conserving centres (e.g. clusters of
more than two coupled magnetic ions [66, 67], which statistically exist within the
random ions distribution). It has been also shown that hot photo-created carriers
21

1. INTRODUCTION
can mediate in the energy transfer between magnetic ions and the crystal lattice
[68, 69].
Although many features of the spin relaxation of a system of magnetic ions in
a semiconductor crystal are well understood, there are still several aspects that
remain little investigated.
First of all, due to limitations of sample growth techniques, in all previous ex-
periments the spin dynamics of a big ensemble of magnetic ions was investigated.
This was done either with diluted magnetic bulk material [63, 70, 71] or quantum
wells [67, 72, 73]. However, even for very diluted materials, the distances between
adjacent magnetic ions were not negligible. Therefore the spin-spin interaction
between these ions had always to be considered, which made the situation more
complicated. Quantum dots with single magnetic ions enable the investigation of
the spin relaxation caused by pure spin-lattice interaction. The aim of this work
is to investigate in detail this interaction in low and high magnetic field. Results
of such experiments are presented in section 7.1.
Secondly, a great majority of the experiments focused on investigation of
the interactions between magnetic ions and their vicinity were performed in the
presence of a moderate magnetic field. For instance, a short heat pulse was
used to change the population of the Zeeman sublevels, and the evolution of
the magnetization was monitored a pick-up coil [71] or extracted from the giant
Zeeman effect in reflectivity [74] or photoluminescence [73]. Faraday rotation
following the creation of electron-hole pairs by a laser pulse reveals the transverse
relaxation time T2 [72, 75]. T2 was also deduced from the width of the Electron
Paramagnetic Resonance (EPR) line, in the range of Mn content where it exhibits
exchange narrowing.
Because of the presence of magnetic field, the spin relaxation was always
connected with the energy relaxation. A completely different situation occurs
in the absence of the magnetic field when the spin-flip of the magnetic field
does not require the energy transfer. The magnetization relaxation under such
conditions was not a subject of any previous experiments. The aim of this work
was therefore to perform a detailed investigation of the spin dynamics of magnetic
ions embedded in a quantum well and in quantum dots in low and zero magnetic
field. I present results of these new experiments in section 7.2.
22
Chapter 2
Samples
2.1 Technology
All samples used in this work were grown by Molecular Beam Epitaxy. It is a
well established method, developed since late 1960s. It allows a precision growth
of thin films of semiconductors and oxides. The extremely slow deposition rate
(typically being of order of 10 nm per minute) allows the films to grow epitaxially
and gives possibility to control the films thickness with monolayer precision. To
monitor the growth of the crystal layers and their quality the reflection high
energy electron diffraction (RHEED) is often used.
One of the simplest structures useful from the point of view of this work, pos-
sible to be grown by MBE, are quantum wells. A progress in the MBE technology
in the 1970s allowed a controllable growth of also more complicated structures,
namely the quantum dots. One of the most intensively studied type of semicon-
ductor quantum dots are self-assembled dots formed using the Stranski-Krastanov
(SK) growth technique [76, 77]. In this technique the lattice mismatch between
the materials of the substrate and the quantum dots leads to the formation of
strained islands on a few-monolayer thick film called a wetting layer. For that
reason this mode of crystal growth is also known as “layer-plus-island”.
The CdTe/ZnTe quantum dots used in this work were formed in modified SK
growth mode, following the original idea of Tinjod et al. [31]. In this method a
2D CdTe layer is temporarily capped with layer of amorphous tellurium to induce
23
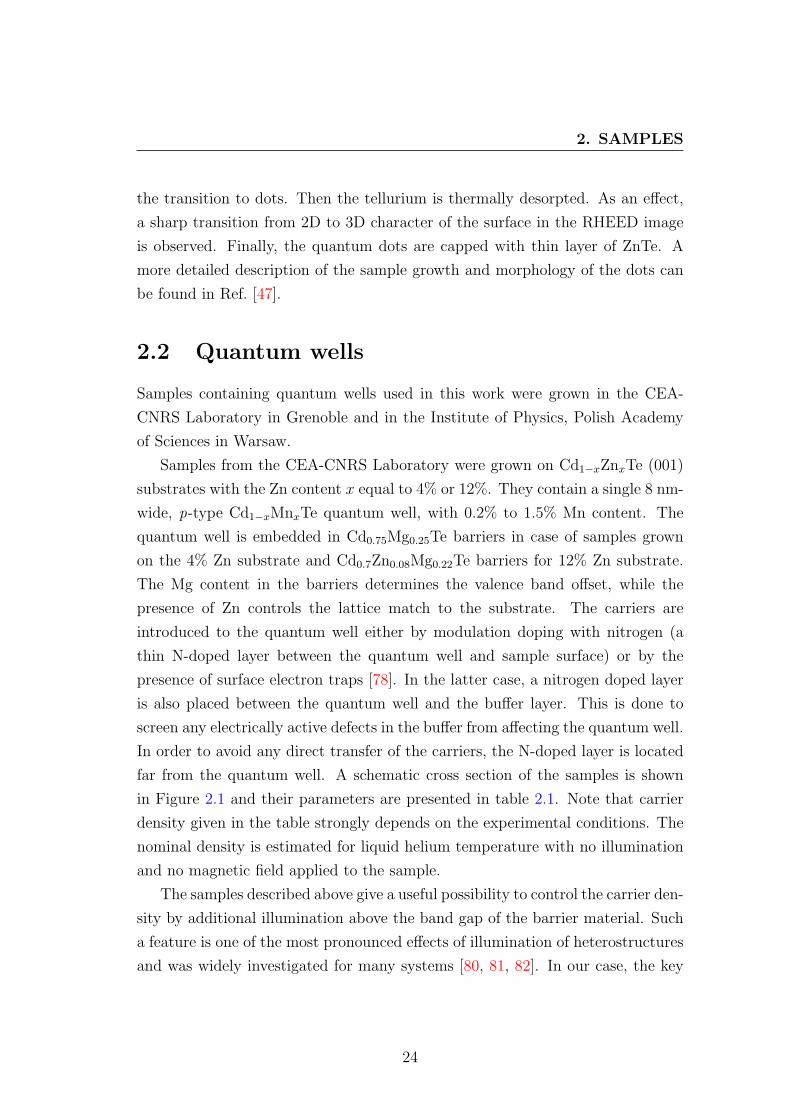
2. SAMPLES
the transition to dots. Then the tellurium is thermally desorpted. As an effect,
a sharp transition from 2D to 3D character of the surface in the RHEED image
is observed. Finally, the quantum dots are capped with thin layer of ZnTe. A
more detailed description of the sample growth and morphology of the dots can
be found in Ref. [47].
2.2 Quantum wells
Samples containing quantum wells used in this work were grown in the CEA-
CNRS Laboratory in Grenoble and in the Institute of Physics, Polish Academy
of Sciences in Warsaw.
Samples from the CEA-CNRS Laboratory were grown on Cd1−xZnxTe (001)
substrates with the Zn content x equal to 4% or 12%. They contain a single 8 nm-
wide, p-type Cd1−xMnxTe quantum well, with 0.2% to 1.5% Mn content. The
quantum well is embedded in Cd0.75Mg0.25Te barriers in case of samples grown
on the 4% Zn substrate and Cd0.7Zn0.08Mg0.22Te barriers for 12% Zn substrate.
The Mg content in the barriers determines the valence band offset, while the
presence of Zn controls the lattice match to the substrate. The carriers are
introduced to the quantum well either by modulation doping with nitrogen (a
thin N-doped layer between the quantum well and sample surface) or by the
presence of surface electron traps [78]. In the latter case, a nitrogen doped layer
is also placed between the quantum well and the buffer layer. This is done to
screen any electrically active defects in the buffer from affecting the quantum well.
In order to avoid any direct transfer of the carriers, the N-doped layer is located
far from the quantum well. A schematic cross section of the samples is shown
in Figure 2.1 and their parameters are presented in table 2.1. Note that carrier
density given in the table strongly depends on the experimental conditions. The
nominal density is estimated for liquid helium temperature with no illumination
and no magnetic field applied to the sample.
The samples described above give a useful possibility to control the carrier den-
sity by additional illumination above the band gap of the barrier material. Such
a feature is one of the most pronounced effects of illumination of heterostructures
and was widely investigated for many systems [80, 81, 82]. In our case, the key
24

2. SAMPLES
buffer
substrate ((Cd,Zn)Te or GaAs)
quantum well (Cd,Mn)Te,
thickness 80 Å, 0,2 – 1,5% Mn
barrier ((Cd,Mg)Te or
(Cd,Zn,Mg)Te)
Iodine or Nitrogen
doped layers
(a) (b) ~
1000 Å
250-6
00 Å
screen
δ doping
Figure 2.1: A schematic cross section of the samples containing quantum wellsused in experiments described in this work. (a) refers to the samples with mod-ulation doped barriers, (b) represents the samples in which the carriers wereintroduced to the quantum well by the presence of surface electron traps
Sample Type Mn concentration Doping Nominal carrier(%) density (cm−2) [15, 79]
M1200 p 0.2 N 1 · 1010
M1305 p 0.4 N 3 · 1011
M1384 p 0.8 surface 1.5 · 1011
M1359 p 1.5 surface 3.5 · 1011
110597c n 0.4 I n/a122905a n 0.4 I n/a122905b n 0.8 I n/a040397b n 1.0 I n/a
Table 2.1: Basic parameters of the samples containing quantum wells used in thiswork (n/a - not available).
25
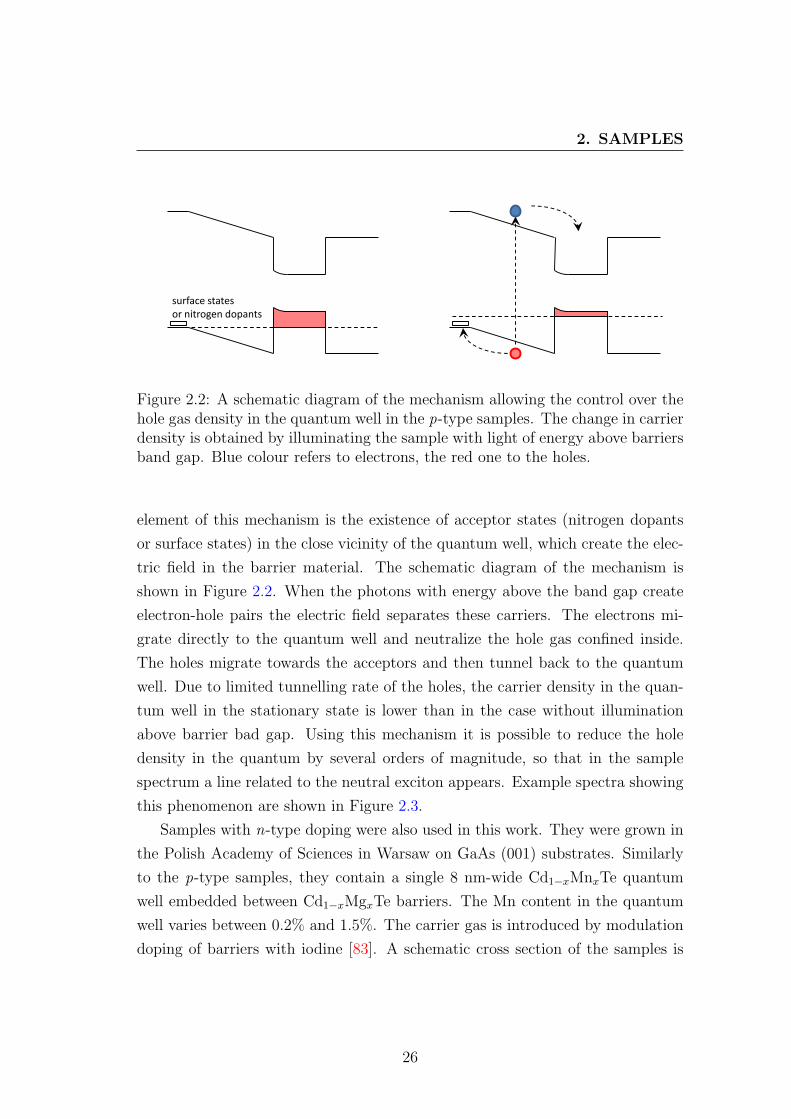
2. SAMPLES
surface states or nitrogen dopants
Figure 2.2: A schematic diagram of the mechanism allowing the control over thehole gas density in the quantum well in the p-type samples. The change in carrierdensity is obtained by illuminating the sample with light of energy above barriersband gap. Blue colour refers to electrons, the red one to the holes.
element of this mechanism is the existence of acceptor states (nitrogen dopants
or surface states) in the close vicinity of the quantum well, which create the elec-
tric field in the barrier material. The schematic diagram of the mechanism is
shown in Figure 2.2. When the photons with energy above the band gap create
electron-hole pairs the electric field separates these carriers. The electrons mi-
grate directly to the quantum well and neutralize the hole gas confined inside.
The holes migrate towards the acceptors and then tunnel back to the quantum
well. Due to limited tunnelling rate of the holes, the carrier density in the quan-
tum well in the stationary state is lower than in the case without illumination
above barrier bad gap. Using this mechanism it is possible to reduce the hole
density in the quantum by several orders of magnitude, so that in the sample
spectrum a line related to the neutral exciton appears. Example spectra showing
this phenomenon are shown in Figure 2.3.
Samples with n-type doping were also used in this work. They were grown in
the Polish Academy of Sciences in Warsaw on GaAs (001) substrates. Similarly
to the p-type samples, they contain a single 8 nm-wide Cd1−xMnxTe quantum
well embedded between Cd1−xMgxTe barriers. The Mn content in the quantum
well varies between 0.2% and 1.5%. The carrier gas is introduced by modulation
doping of barriers with iodine [83]. A schematic cross section of the samples is
26
2. SAMPLES
0.92
0.94
0.96
0.98
1.00
758 760 762 764
(b)
X
X+
Wavelength (nm)
Tra
nsm
issio
n
0.92
0.94
0.96
0.98
1.00
758 760 762 764
(a)
X+
Wavelength (nm)
Tra
nsm
issio
n
Figure 2.3: Transmission spectra of a p-type sample containing a CdTe quantumwell doped with 0.8% of Mn: (a) illuminated with a long-wavelength-pass filter(high density of hole gas) (b) illuminated with a white lamp without any filter(low holes density).
shown in Figure 2.1(a) and their parameters are shown in table 2.1. Likewise in
the p-type samples, there is possibility to control the carrier density by illumi-
nation. A diagram of this mechanism is shown in Figure 2.4. The photocreated
electrons and holes are separated by the electric field in the region between the
sample surface and the doped layer. The holes migrate towards the surface of
the sample and are trapped by surface acceptors states. The electrons migrate
towards the quantum well. Part of photocreated electrons is trapped in the doped
layer, but part of them tunnel farther to the quantum well. As a result the elec-
tron gas density increases. More detailed description of this process can be found
in Ref. [10].
2.3 Quantum dots
Samples used in this work were grown in the Institute of Physics, Polish Academy
of Sciences in Warsaw. The sample structure contain four layers deposited during
the growth on GaAs substrate: a CdTe buffer ('3 µm), a ZnTe lower barrier
27

2. SAMPLES
surface states
I-doped layer
Figure 2.4: A schematic diagram of the mechanism allowing the control over thehole gas density in the quantum well in the n-type samples. Blue colour refers toelectrons, the red one to the holes.
20 nm
2 nm
Figure 2.5: A transmission electron microscopy (TEM) image of a typical quan-tum dot used in this work. Courtesy of S. Kret and P. Dłużewski (Institute ofPhysics, Polish Academy of Sciences).
(0.7 µm), a single CdTe quantum dots plane formed from 6 monolayers (MLs) of
epitaxial CdTe, and a ZnTe capping layer (100 nm). The quantum dots grown in
this process are lens-shaped, with lateral size of about 10-20 nm and about 2 nm
along the growth axis (see Figure 2.5). The density of the quantum dots is equal
to about 5×109 cm−2 [47].
Two central out of six monolayers of the CdTe contain a low amount of Mn
atoms. Two different types of samples were used in the experiments. In the first
one the average Mn content in the quantum dots material is estimated to about
1%. In the second one is was much smaller, reaching the value of about 0.05%.
This value of the Mn content was adjusted in such a way that it is possible to
28
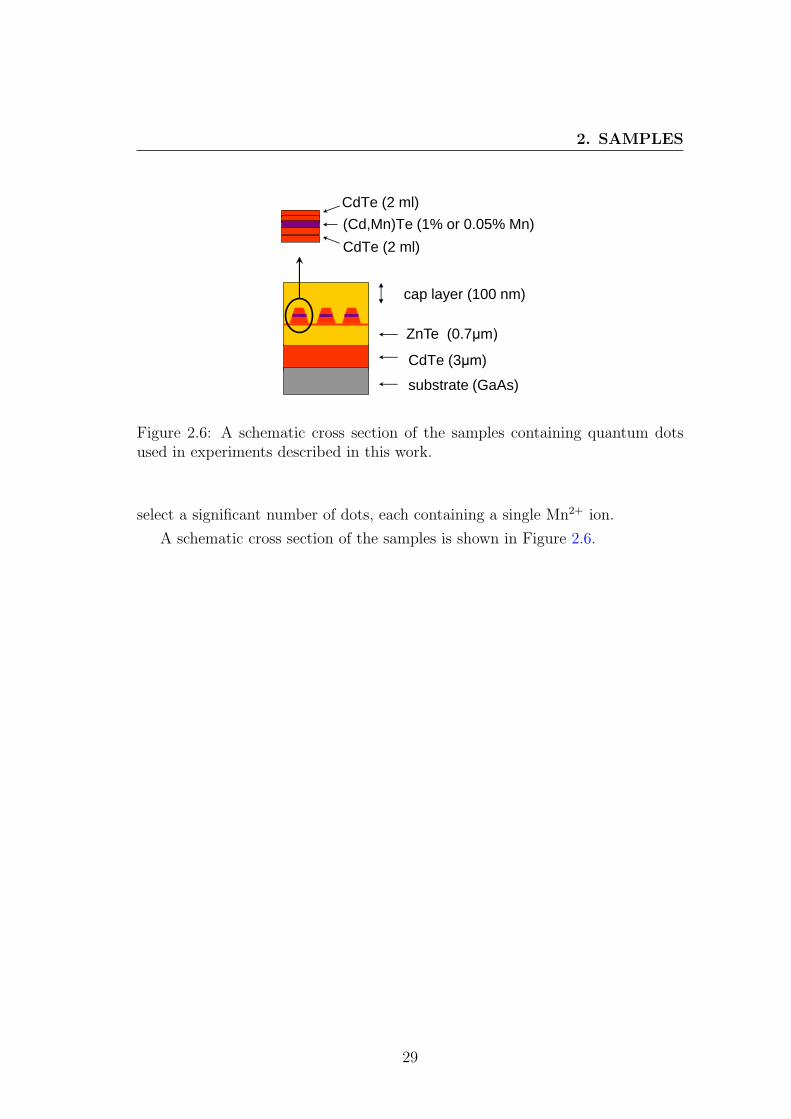
2. SAMPLES
ZnTe (0.7μm)
substrate (GaAs)
cap layer (100 nm)
CdTe (3μm)
CdTe (2 ml)
CdTe (2 ml)
(Cd,Mn)Te (1% or 0.05% Mn)
Figure 2.6: A schematic cross section of the samples containing quantum dotsused in experiments described in this work.
select a significant number of dots, each containing a single Mn2+ ion.
A schematic cross section of the samples is shown in Figure 2.6.
29

Chapter 3
Standard experimental setupsand techniques
Information about the spin dynamics of the magnetic atoms in experiments de-
scribed in this work is obtained by using optical methods. Photoluminescence is a
primary tool to collect information on the state of magnetic system, and the only
one in case of manganese doped quantum dots. In case of diluted magnetic quan-
tum wells, the transmission and reflectance measurements were also involved in
conjunction with fast magnetic field pulses. This original technique is described
in chapter 4. In this chapter, I describe standard experimental techniques, com-
monly used in optical studies of semiconductor quantum dots.
3.1 Micro photoluminescence
The majority of the experiments related to quantum dots described in this work
focus on single dot phenomena. Therefore the first experimental quest is to collect
light emitted by selected single quantum dot. The selection of the dot is done
both spatially and spectrally. The spatial selection is done by using a microscope
objective. It enables illumination and luminescence collection from an area not
greater than 1 µm in diameter.
Two experimental setups with different microscopes were used in this work.
In the Institute of Experimental Physics at the University of Warsaw, where the
30

3. STANDARD EXPERIMENTAL SETUPS AND TECHNIQUES
laser beam
sample
7mm
Figure 3.1: A photograph of the microscope objective used in the micro-lumine-scence measurements in low magnetic field in an optical cryostat and a schematicdiagram of beam path inside.
sample was placed in an optical cryostat, a specially designed mirror objective
with a high numerical aperture (equal to about 0.7) [84] was used. A cross section
of this objective is shown in Figure 3.1. The resolution of the device is given
mainly by the diffraction limit and reaches 500 nm. The sample was placed on
the focal plane of the microscope, at its back surface. Such mounting guarantees
excellent mechanical stability, enabling virtually infinitely long measurements
of selected single quantum dot1. The microscope together with the sample is
immersed in liquid helium bath inside the cryostat. Since the cryostat allows
direct optical access to the sample, the whole setup is based on free beam optics.
The laser used to illuminate the sample enters the cryostat along the optical axis
of the device. The light emitted by quantum dots and collected by the microscope
follows the same axis. The photoluminescence signal is then separated from the
laser beam by use of a dichroic mirror outside the cryostat. Such setup enables
polarization-resolved measurements, both in excitation and detection, simply by
placing polarization optics in appropriate beam.
In Grenoble High Magnetic Field Laboratory, where no optical cryostat was
1The longest experiment on a single quantum dot performed in this setup lasted more than4 weeks and was stopped by the user.
31

3. STANDARD EXPERIMENTAL SETUPS AND TECHNIQUES
microscope
objective
sample on
piezoelectric
stages
monomode fiber
for polarized light
Figure 3.2: A photograph of the micro-luminescence setup comprising of a mi-croscope objective and piezoelectric x-y-z stages with sample holder used duringmeasurements in high magnetic field.
available, an optical fiber setup was used. A standard achromatic microscope ob-
jective is placed inside the cryostat. Both the exciting and the collected light are
transmitted though a monomode fiber coupled directly to the objective. The pho-
toluminescence signal is separated from the laser beam by a fiber-based dichroic
beam splitter. The sample is placed on a precise piezoelectric x-y-z stages below
the microscope. Such setup enables scanning of the sample surface with the laser
spot with spatial resolution of about 100 nm. A photograph of this system is
shown in Figure 3.2. The microscope objective with piezoelectric stages is placed
inside the cryostat and kept in the temperature of about 10 K.
Such setup makes the polarization-resolved measurements much more difficult
in comparison with the setup based on free beam optics. The monomode fiber
which is about 10 m long acts as a high order, wavelength-dependent wave plate.
Moreover, as the experiments are carried out in high magnetic field, a strong
Faraday rotation occurs in the fibers. However, as long as there is a reference
point, the use of polarization optics outside the cryostat permits the compensation
of the influence of the fibers on polarization of transmitted light. In the detection
part of the setup the polarization optics consits of half-wave and quarter-wave
32

3. STANDARD EXPERIMENTAL SETUPS AND TECHNIQUES
fiber-based
dichroic
beamsplitter
to the sample
to the detector
λ/4 λ/2 pol
laser
Babinet-Soleil
prism
Figure 3.3: A schematic diagram of polarization optics used in the micro-photoluminescence setup utilizing optical fibers.
plates and a linear polarizer (such an idea was also presented in Ref. [85]).
On the excitation side, the Babinet-Soleil compensator is used. Such a setup
is schematically shown in Figure 3.3. In case of detection, the light emitted by
the quantum dots itself can be used as a reference point, since in magnetic field
the luminescence excitonic lines of the dots split into two circularly polarized
components. Therefore it is possible to align the wave plates and the polarizer
in such a way that only one of these components is transmitted. As shown in
section 5.2.1, in case of resonant excitation, the excited state also splits into
two states in magnetic field. Both these states are related to a specific spin
projection of the exciton onto the axis given by the magnetic field (+1 or -
1), thus they are resonantly coupled to oppositely circularly polarized light in
Faraday configuration. Therefore the energy of the resonant excitation is strictly
related to the circular polarization of light, which can be used for polarization
calibration of the excitation beam. However, obtaining polarization resolution
without magnetic field, both in detection and excitation, is impossible.
The light emitted by the quantum dots, after leaving the cryostat (in the first
setup) or the fiber (in the second one) is collected with a monochromator equipped
with a charge coupled device (CCD) camera and an avalanche photodiode. The
CCD camera allows collection of time-integrated spectra of the samples. The
avalanche photodiode is connected to a time-resolved photon counter. It enabled
recording of temporal profiles of the photoluminescence at specific energy in the
experiments where the excitation beam is modulated.
Although very small, the size of the illuminated spot did not assure excita-
33

3. STANDARD EXPERIMENTAL SETUPS AND TECHNIQUES
tion of single quantum dot. Due to quite high dot density the number of dots
actually observed with microscope objectives described above was equal to a few
hundreds. The spectral selection of single quantum dots was done by finding
well resolved, isolated lines in the long-wavelength tail of the spectrum of the
observed ensemble of dots. A well known pattern of photoluminescence lines re-
lated to recombination of excitons in specific charge states in CdTe quantum dots
[34, 36, 86, 87] facilitated the identification of lines related to the same quantum
dot. The identification was confirmed by power dependence measurements and
in some cases by single photon correlation experiments. In case of experiments
with resonant excitation of quantum dots (see section 5.2, chapter 6 and section
7.1) the identification of luminescence lines was simplified, as the number of dost
actually emitting light was smaller by more than one order of magnitude than
the total number of dots in the laser spot.
The photoluminescence of the quantum dots was excited with a continuous
wave laser beam, either above the band gap of the ZnTe barrier (at 475 nm or
532 nm) or using a tuneable dye laser in the range 570 - 610 nm. The polar-
ization optics placed in the laser beam enabled selection of the desired circular
polarization of exciting light. In experiments of optical manipulation of the Mn2+
spin (see section 5.2.4) and its relaxation (see section 7.1.2) the intensity of ex-
citation and its polarization were modulated. This was achieved by passing the
laser beam through acousto-optic and electro-optic modulators. Using the first
one we were able to switch the excitation on and off. The second modulator
allowed us to change the circular polarization of the laser. The switching time of
both modulations was 10 ns. The modulators were driven by a set of pulse gen-
erators synchronized with a time-resolved photon counting system (PicoQuant
TimeHarp 200 or PicoHarp 300 ), which was used to record the temporal profiles
of the photoluminescence signal at selected energy. A schematic diagram of the
experimental setup in such configuration is shown in Figure 3.4.
3.2 Single photon correlation
Single photon correlation is a powerful technique that allows investigation of time-
dependent phenomena occurring in light emitting structures. In case of quantum
34

3. STANDARD EXPERIMENTAL SETUPS AND TECHNIQUES
superconductive magnet
with an optical cryostat
CW tunable
laser
monochromator
APD
time resolved
photon coun-
ting system START
STOP
λ/4 pol
AO
EO
Generators Modu-
lators
sample with
the microscope
Figure 3.4: A schematic diagram of the experimental micro-photoluminescencesetup enabling time-resolved measurements with intensity- and polarization-modulated excitation.
dots, it has been used for example to investigate the excitation mechanisms [34]
or entanglement of photons emitted in a biexciton-exciton cascade [88, 89]. In
quantum dots doped with magnetic ions (especially with exactly one magnetic
ion) it gives the possibility to investigate the spin dynamics of the magnetic
system. The information on the state of magnetic ions is carried by the photons
emitted by the quantum dot, originating from the excitonic transitions. Therefore
the temporal resolution of such experiment is limited only by the exciton lifetime.
The correlation measurements were performed in a Hanbury-Brown and Twiss
(HBT) [90] configuration type setup with spectral filtering. The setup consists of
two monochromators equipped with avalanche photodiodes and CCD cameras.
Maximum spectral resolution of the monochromators was better than 100 µeV
enabling observation of well resolved photoluminescence lines of singly Mn-doped
quantum dots. The avalanche diodes were connected with “Start” and “Stop”
inputs of a single photon correlation system (PiqoQuant TimeHarp 200 ). A
schematic diagram of such experimental setup is shown in Figure 3.5.
The overall temporal resolution of this system was equal to about 500 ps,
35

3. STANDARD EXPERIMENTAL SETUPS AND TECHNIQUES
superconductive magnet
with an optical cryostat
sample with
the microscope
CW laser
APD
monochromator
APD
time resolved
correlation
system
monochromator
START
STOP
λ/4
polarizers
Figure 3.5: A schematic diagram of the experimental setup for single photoncorrelation
which is close to the exciton lifetime in the quantum dots under investigation.
The maximum quantum efficiency of the photodiodes (at 560 nm) was equal to
55% and the dark count rate was not greater than 200 s−1. Such parameters allow
performing correlation measurements of photons emitted by a single quantum
dot with a reasonable signal accumulation time (between a few and a few tens
of hours). The correlation system generates histograms of correlated photon
detection events versus delay between the detected photons. The use of a delay
line, made of long coaxial cable, at “Stop” input of the correlation electronics
allowed recoding events with a negative delay between photons, i.e. events when
the photon at “Stop” detector arrived before the photon arrival at the “Start”
one. After normalization, the histograms recorded with the card are equivalent
to the normalized second order correlation function:
g(2)(τ) =〈I(t)I(t+ τ)〉〈I(t)〉2
(3.1)
where 〈...〉 denotes the time average and I(t) is the light intensity at time t. g(2)(τ)
36

3. STANDARD EXPERIMENTAL SETUPS AND TECHNIQUES
gives the probability of detecting a photon at time τ , knowing that a photon has
been detected at time t=0.
Photons emitted by the investigated quantum dot were divided in two beams
collected by the two monochromators on a polarizing or non-polarizing beam
splitter. Polarization optics (quarter-wave plates and linear polarizer) mounted
on the two beams separately enabled independent control of the polarization and
energy of photons detected by the two detectors in use.
3.3 Spectroscopy in high magnetic field
The experimental setup with superconducting split-coil magnet available in the
Institute of Experimental Physics at the University of Warsaw enabled measure-
ments in magnetic field up to 7 T. Experiments in higher field (dark exciton
spectroscopy described in chapter 6 and measurements of the Mn2+ ion spin re-
laxation described is section 7.1) were carried out in Grenoble High Magnetic
Field Laboratory. Two different magnets were in use: a superconductive one,
producing field up to 14 T and a 20 MW resistive magnet capable of producing
field up to 28 T. Both magnets have the same bore diameter equal to 35 mm, thus
they are compatible with the same type of the cryostat. This allowed the use of
the same probe with the optical setup during experiments on both magnets.
37

Chapter 4
Pulsed magnetic field technique
Experimental techniques presented in the previous chapter are among widely used
optical methods of investigating physical phenomena in semiconductors. They do
not, however, give insight to many of the properties of the magnetic system. In
particular, the possibility to investigate the spin dynamics in absence of any
applied magnetic field is strongly limited. Spin dynamics of the Mn2+ ions in
Cd1−xMnxTe has been studied, for years, almost exclusively in the presence of a
magnetic field. Typical measurements involve a short heat pulse used to drive
the sample out of thermal equilibrium, the evolution of the magnetization being
measured with a pick-up coil [71] or extracted from the giant Zeeman effect in
reflectivity [74] or photoluminescence [73]. Faraday rotation following the creation
of electron-hole pairs by a laser pulse reveals the transverse relaxation time T2
[72, 75]. T2 was also deduced from the width of the Electron Paramagnetic
Resonance (EPR) line, in the range of Mn content where it exhibits exchange
narrowing (above 10%).
In Ref. [70], the magnetization of a bulk Cd1−xMnxTe sample, in the presence
of a static field, was changed by the collinear, AC field of a coil, and monitored
by Faraday rotation. The spin-lattice relaxation time was clearly identified and
exhibits a dramatic decrease at low field. In principle, this method can be used
down to zero field but the frequency response of the set-up was limited to a few
microseconds, so that the static field had to be kept above a few tenths of Tesla.
By contrast, T2 slowly increases when decreasing the applied field in Zn0.9Mn0.1Se
[72] or Cd1−xMnxTe [75].
38
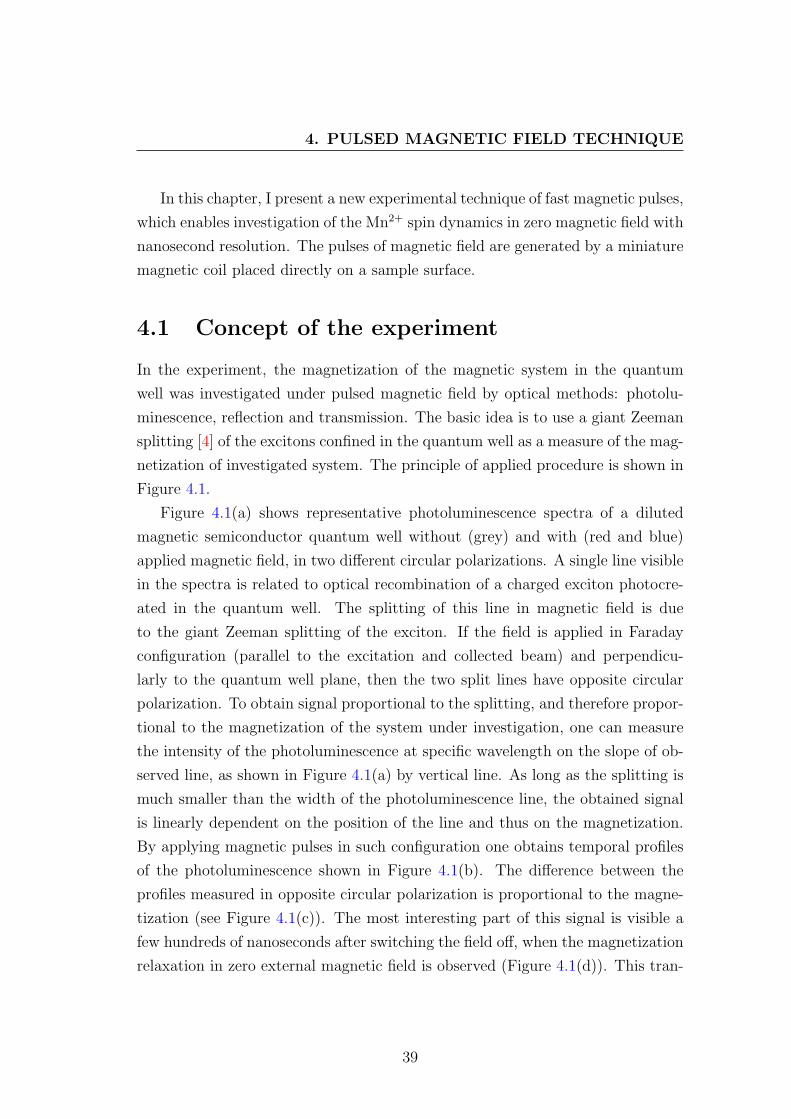
4. PULSED MAGNETIC FIELD TECHNIQUE
In this chapter, I present a new experimental technique of fast magnetic pulses,
which enables investigation of the Mn2+ spin dynamics in zero magnetic field with
nanosecond resolution. The pulses of magnetic field are generated by a miniature
magnetic coil placed directly on a sample surface.
4.1 Concept of the experiment
In the experiment, the magnetization of the magnetic system in the quantum
well was investigated under pulsed magnetic field by optical methods: photolu-
minescence, reflection and transmission. The basic idea is to use a giant Zeeman
splitting [4] of the excitons confined in the quantum well as a measure of the mag-
netization of investigated system. The principle of applied procedure is shown in
Figure 4.1.
Figure 4.1(a) shows representative photoluminescence spectra of a diluted
magnetic semiconductor quantum well without (grey) and with (red and blue)
applied magnetic field, in two different circular polarizations. A single line visible
in the spectra is related to optical recombination of a charged exciton photocre-
ated in the quantum well. The splitting of this line in magnetic field is due
to the giant Zeeman splitting of the exciton. If the field is applied in Faraday
configuration (parallel to the excitation and collected beam) and perpendicu-
larly to the quantum well plane, then the two split lines have opposite circular
polarization. To obtain signal proportional to the splitting, and therefore propor-
tional to the magnetization of the system under investigation, one can measure
the intensity of the photoluminescence at specific wavelength on the slope of ob-
served line, as shown in Figure 4.1(a) by vertical line. As long as the splitting is
much smaller than the width of the photoluminescence line, the obtained signal
is linearly dependent on the position of the line and thus on the magnetization.
By applying magnetic pulses in such configuration one obtains temporal profiles
of the photoluminescence shown in Figure 4.1(b). The difference between the
profiles measured in opposite circular polarization is proportional to the magne-
tization (see Figure 4.1(c)). The most interesting part of this signal is visible a
few hundreds of nanoseconds after switching the field off, when the magnetization
relaxation in zero external magnetic field is observed (Figure 4.1(d)). This tran-
39

4. PULSED MAGNETIC FIELD TECHNIQUE
761 762 763 764
B = 0 +-
(a)
B > 0 :
Wavelength (nm)
Ph
oto
lum
ine
sce
nce
(a
rb.u
.)
-6 -4 -2 0 2 4
(b) = 762.8 nm
field pulse
+
-
Time (s)
Ph
oto
lum
ine
sce
nce
(a
rb.u
.)
-6 -4 -2 0 2 4
(d)
(c)
Time (s)
Diffe
ren
tia
l sig
na
l (a
rb.u
.)
0
1
0 50 100 150
(d)
Time (ns)
Ma
gn
etiza
tio
n (
arb
.u.)
Figure 4.1: The idea of the optical measurement of the magnetization dynamicsof a diluted magnetic semiconductor quantum well after a pulse of magnetic field.A detailed description in text.
sient is significantly longer then the decay of applied pulse of magnetic field. In
our experiment, instead of measuring two temporal profiles of photoluminescence
with different circular polarization, we record two profiles with the same polar-
ization, but with two different directions of the current in the coil (and therefore
two different directions of pulsed magnetic field). Such approach assures better
stability and repeatability of the measurements. It also eliminates the influence
of the electric field produced by the micro-coil and its wiring (see section 4.4)
This scenario of the measurement, however, is not limited to the zero field case.
Exactly the same procedure can be performed after applying additional constant
magnetic field produced for example with external superconductive magnet. The
only difference is that in such case the measured signal does not reflect the total
40
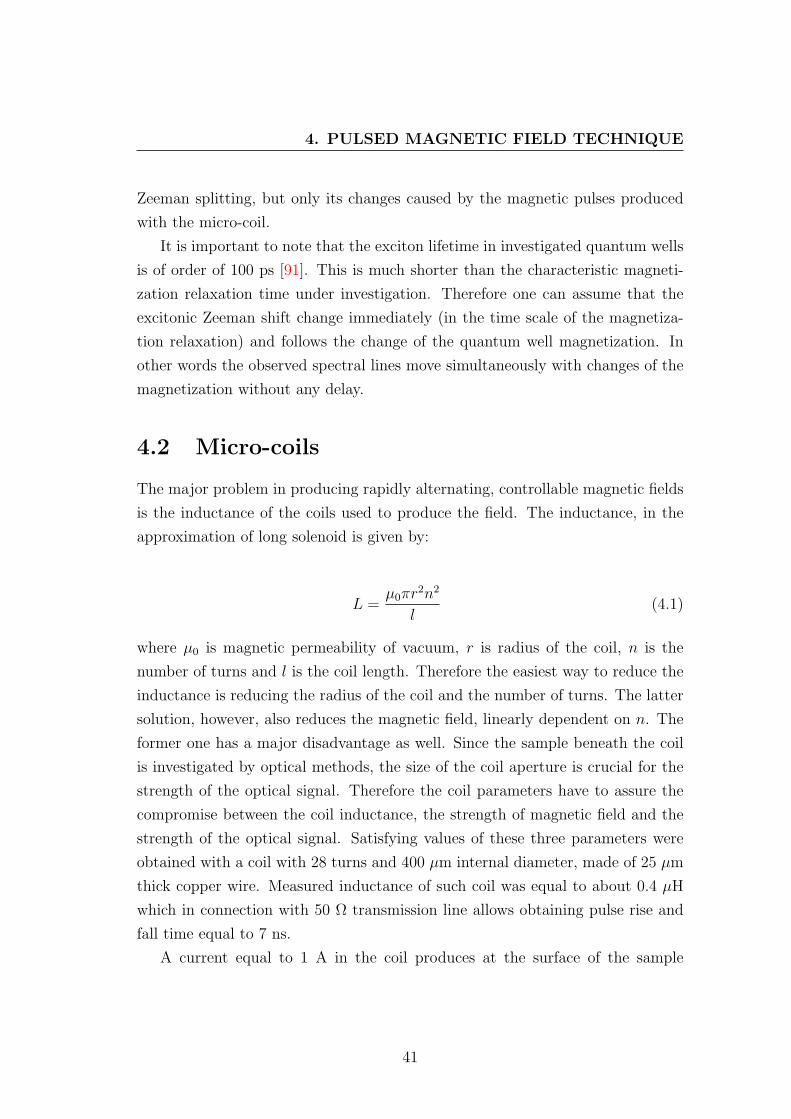
4. PULSED MAGNETIC FIELD TECHNIQUE
Zeeman splitting, but only its changes caused by the magnetic pulses produced
with the micro-coil.
It is important to note that the exciton lifetime in investigated quantum wells
is of order of 100 ps [91]. This is much shorter than the characteristic magneti-
zation relaxation time under investigation. Therefore one can assume that the
excitonic Zeeman shift change immediately (in the time scale of the magnetiza-
tion relaxation) and follows the change of the quantum well magnetization. In
other words the observed spectral lines move simultaneously with changes of the
magnetization without any delay.
4.2 Micro-coils
The major problem in producing rapidly alternating, controllable magnetic fields
is the inductance of the coils used to produce the field. The inductance, in the
approximation of long solenoid is given by:
L =µ0πr
2n2
l(4.1)
where µ0 is magnetic permeability of vacuum, r is radius of the coil, n is the
number of turns and l is the coil length. Therefore the easiest way to reduce the
inductance is reducing the radius of the coil and the number of turns. The latter
solution, however, also reduces the magnetic field, linearly dependent on n. The
former one has a major disadvantage as well. Since the sample beneath the coil
is investigated by optical methods, the size of the coil aperture is crucial for the
strength of the optical signal. Therefore the coil parameters have to assure the
compromise between the coil inductance, the strength of magnetic field and the
strength of the optical signal. Satisfying values of these three parameters were
obtained with a coil with 28 turns and 400 µm internal diameter, made of 25 µm
thick copper wire. Measured inductance of such coil was equal to about 0.4 µH
which in connection with 50 Ω transmission line allows obtaining pulse rise and
fall time equal to 7 ns.
A current equal to 1 A in the coil produces at the surface of the sample
41

4. PULSED MAGNETIC FIELD TECHNIQUE
0
0.5
1.0
726 728 730 732 734 736
-40 mT-20 mT0 mT20 mT40 mT -1 A0 A1 A
Current in the coil:
Magnetic field:
Wavelength (nm)
Ph
oto
lum
ine
sce
nce
(a
rb.u
.)
p-type sample, 4% Mn, T = 1.4 K
Figure 4.2: Result of calibration of the magnetic field produced by micro-coilperformed using a ferromagnetic sample with manganese content equal to 4%.Solid lines represent photoluminescence spectra of the ferromagnetic quantumwell taken in magnetic field produced with a superconductive magnet. Symbolsrepresent photoluminescence intensity measured during a long magnetic pulseproduced with the micro-coil. The only fitting parameter is normalization factor.
magnetic field of about 20 mT. This value was calibrated by comparing the pho-
toluminescence spectrum of a sample with a Cd1−xMnxTe quantum well with rel-
atively high Mn content (x = 4%) in a magnetic field generated by the coil and
by the external superconductive magnet. The result of this comparison is shown
in Figure 4.2. Solid lines represent photoluminescence spectra of the quantum
well taken in magnetic field produced with a superconductive magnet. Symbols
represent photoluminescence intensity at specific wavelengths measured during a
long magnetic pulse produced with the miniature coil.
In further sections, I will refer to the miniature coils as micro-coils.
42

4. PULSED MAGNETIC FIELD TECHNIQUE
4.3 Power supplying
Because of the small number of turns of the micro-coils a large value of the current
is needed to produce a magnetic field which is useful from the point of view of
the experiment (a few tens of militesla). Moreover, a rapid changes in the current
value are needed in the experiment. Therefore the current needs to be provided
to the coil by a transmission line to assure a high bandwidth of the connection
between the coil and the power supply. In order to reduce the voltage needed to
supply the coil the transmission line should have the lowest impedance possible.
Due to technical limitations in mounting such line inside the cryostat we have
decided to use widely commercially available 50 Ω coaxial cable. Therefore the
power supply had to produce pulses of the amplitude in the range 100-200 V in
order to supply the coil with the current of a few Amperes. Because of the lack of
commercial pulse generators capable of producing in a convenient way such pulses
with rising and falling time below 10 ns we decided to build such generator on
our own. The main switching element is a high-voltage, high-current MOSFET
transistor with extremely low gate capacity. The transistor is switched on and off
by a high-current MOSFET driver assuring rising and falling time around 2 ns
in connection with 50 Ω transmission line.
The micro-coil was connected as a part of the transmission line (see Figure 4.3)
which was terminated with a suitable resistor outside the cryostat. The terminat-
ing resistor is made of 80 1 kΩ, 5 W metal film resistors to assure required power
handling and proper impedance in a wide frequency range (metal film resistors
in the range 0.1-1 kΩ have usually low impedance and capacitance, thus they are
appropriate for high frequency circuits). Using an oscilloscope connected to the
terminating resistor we were able to record temporal profiles of the current in the
coil which gives its magnetic field.
4.4 Electric field of the micro-coil
Due to relatively high voltage used to feed the micro-coil and presence of grounded
metal plane below the sample (see Figure 4.3), the coil produces not only mag-
netic field, but also the electric one. This can be observed in the luminescence
43
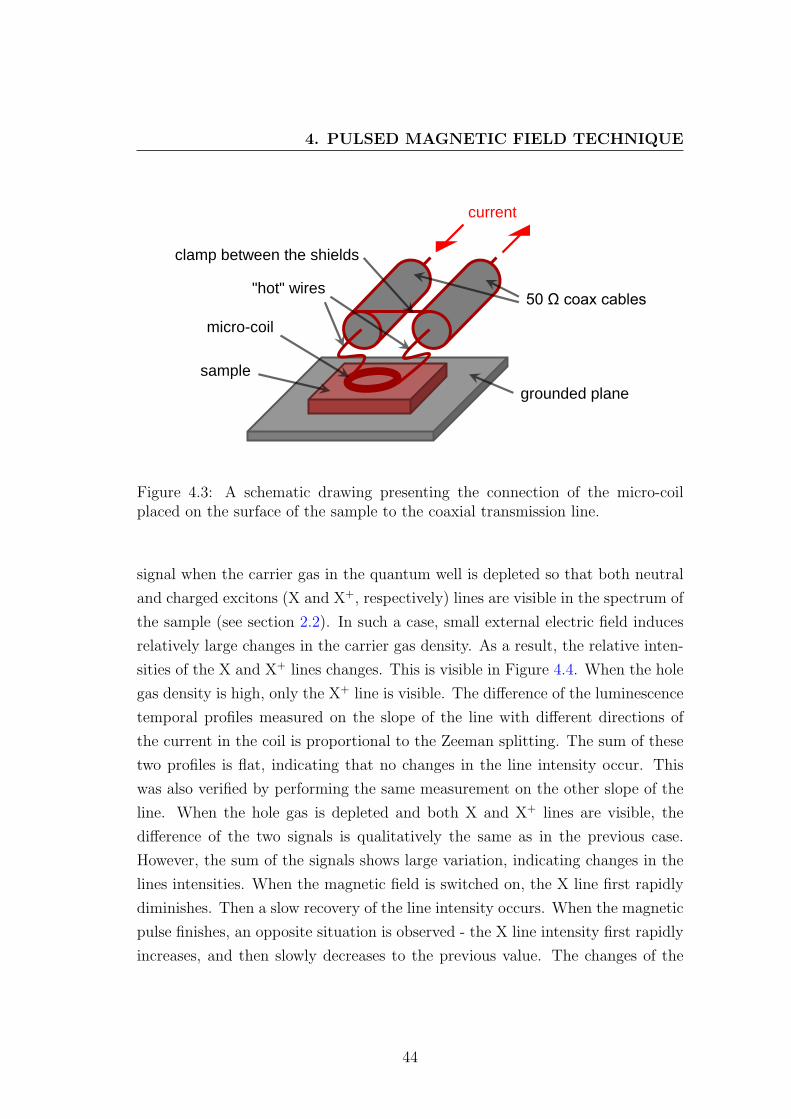
4. PULSED MAGNETIC FIELD TECHNIQUE
sample
micro-coil
"hot" wires 50 Ω coax cables
clamp between the shields
grounded plane
current
Figure 4.3: A schematic drawing presenting the connection of the micro-coilplaced on the surface of the sample to the coaxial transmission line.
signal when the carrier gas in the quantum well is depleted so that both neutral
and charged excitons (X and X+, respectively) lines are visible in the spectrum of
the sample (see section 2.2). In such a case, small external electric field induces
relatively large changes in the carrier gas density. As a result, the relative inten-
sities of the X and X+ lines changes. This is visible in Figure 4.4. When the hole
gas density is high, only the X+ line is visible. The difference of the luminescence
temporal profiles measured on the slope of the line with different directions of
the current in the coil is proportional to the Zeeman splitting. The sum of these
two profiles is flat, indicating that no changes in the line intensity occur. This
was also verified by performing the same measurement on the other slope of the
line. When the hole gas is depleted and both X and X+ lines are visible, the
difference of the two signals is qualitatively the same as in the previous case.
However, the sum of the signals shows large variation, indicating changes in the
lines intensities. When the magnetic field is switched on, the X line first rapidly
diminishes. Then a slow recovery of the line intensity occurs. When the magnetic
pulse finishes, an opposite situation is observed - the X line intensity first rapidly
increases, and then slowly decreases to the previous value. The changes of the
44

4. PULSED MAGNETIC FIELD TECHNIQUE
X+ line intensity are exactly opposite. It increases when the X line diminishes
and vice versa, which was verified on both slopes of both lines.
We interpret this phenomenon as the influence of the electric field created
by the high voltage between the coil placed above the sample and the grounded
plane below. When the magnetic field is on, the rapid change of the electric
field injects additional carriers into the quantum well. Then, the carrier diffusion
between the barriers and the quantum well brings back the steady state, which
is perturbed again by switching the magnetic field off. This interpretation can
be easily verified by performing similar experiment with a different micro-coil.
For example, a coil with the same dimensions but smaller number of turns will
produce smaller magnetic field, while the electric field (dependent only on the
voltage and geometry of the setup) will remain the same. Therefore we performed
such experiment with a coil with only one turn, instead of 28. The comparison of
results obtained with the two coils is shown in Figure 4.5. As opposed to the case
presented in Figure 4.4, two consecutive current pulses (positive and negative)
were used instead of one. The Zeeman splitting observed with the coil with one
turn is smaller by a factor of 30 when compared with the one measured with
the previous coil. At the same time the changes of the excitonic line intensities
are the same within the experimental accuracy. This proves that these changes
are caused by the electric field. It also shows that the procedure of measurement
described in section 4.1 makes the experiment sensitive only on the magnetic field
and independent of the electric one.
4.5 Optical excitaction and detection
4.5.1 Illumination of the sample
In order to collect the optical signal only from the part of the sample placed in
the magnetic field the sample was illuminated through the aperture of the coil
(see Figure 4.6). In the case of photoluminescence measurements on the quantum
wells, the excitation was done below the energy gap of the barrier material with
a 675 nm laser beam. In case of transmission experiment, a halogen lamp with
suitable low-pass filter was used. During the reflectance measurements the sample
45
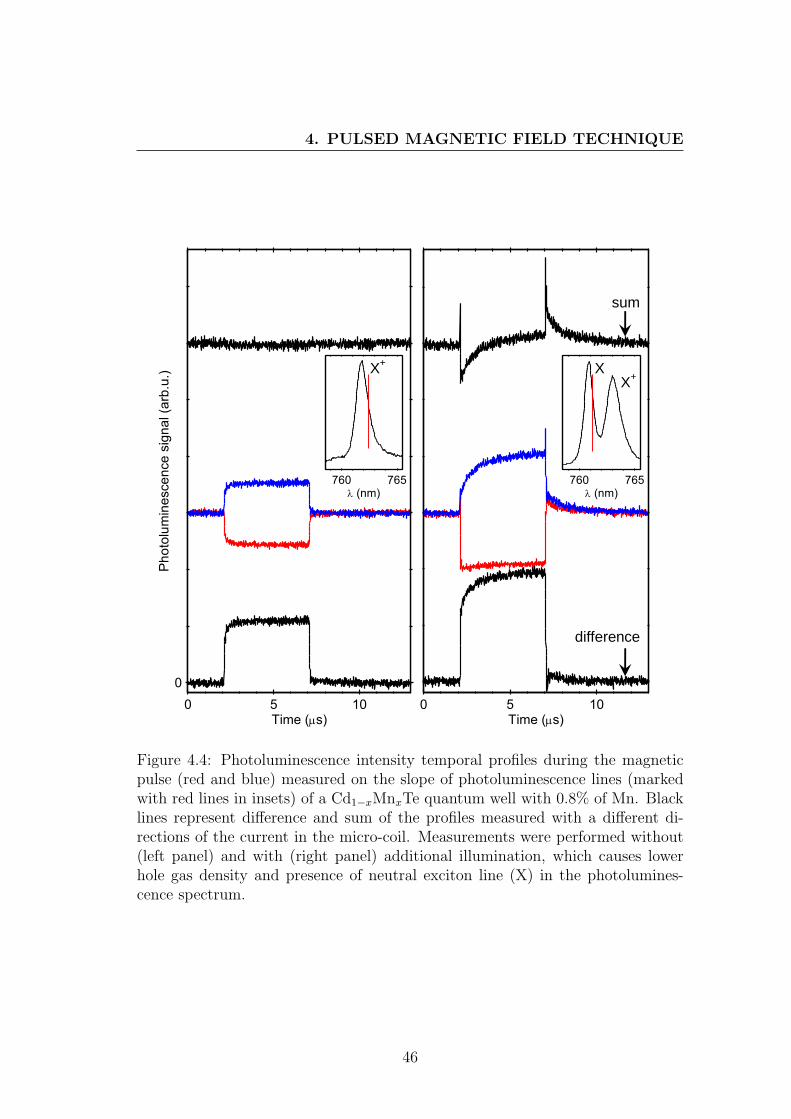
4. PULSED MAGNETIC FIELD TECHNIQUE
0 5 10Time (s)
0
0 5 10Time (s)
Ph
oto
lum
ine
sce
nce
sig
na
l (a
rb.u
.)
difference
sum
760 765 (nm)
760 765 (nm)
X+
X+
X
Figure 4.4: Photoluminescence intensity temporal profiles during the magneticpulse (red and blue) measured on the slope of photoluminescence lines (markedwith red lines in insets) of a Cd1−xMnxTe quantum well with 0.8% of Mn. Blacklines represent difference and sum of the profiles measured with a different di-rections of the current in the micro-coil. Measurements were performed without(left panel) and with (right panel) additional illumination, which causes lowerhole gas density and presence of neutral exciton line (X) in the photolumines-cence spectrum.
46

4. PULSED MAGNETIC FIELD TECHNIQUE
0 2000Time (ns)
1 turn
0
0 2000Time (ns)
Ph
oto
lum
ine
sce
nce
sig
na
l (a
rb.u
.)
28 turns
difference
sum
Figure 4.5: Comparison of the results of the two experiments performed withmicro-coil with different number of turns: 28 (left panel) and 1 (right panel).The effect of the magnetic field (visible in the differential signal) is much smallerin the case of the latter coil, while the effect of the electric field (observed in thesum of the temporal profiles) is the same within the experimental accuracy.
47

4. PULSED MAGNETIC FIELD TECHNIQUE
sample
excitation
beam
collected
signal
luminescence
sample
transmission
Figure 4.6: Illumination method of the sample in the case of photoluminescenceand transmission measurements.
was illuminated using a tuneable continues wave or pulsed Al2O3:Ti laser beam.
4.5.2 Detection of the optical signal
4.5.2.1 Photon counting setup
In case of photoluminescence measurements, we used continuous wave (CW) ex-
citation. The excitation power has to be kept as low as possible, to avoid heating
of the sample. This makes the photoluminescence signal very low. At the same
time the temporal resolution of the detection signal has to be better than rising
and falling time of the current in the micro-coil (equal to about 7 ns). There-
fore the best solution for detecting the optical signal was a time-resolved photon
counting system. Photons emitted by the sample were detected by an avalanche
photodiode (Perkin Elmer SPCM-AQR-13) installed on one of the exits of a
monochromator. The second exit was equipped with a CCD camera enabling
recording of the spectrum of the sample. In some cases two separate monochro-
mators were used. Such a setup enabled simultaneous recording of the sample
spectrum and temporal profiles of the photoluminescence at selected wavelength.
A schematic diagram of the experimental setup in this configuration is presented
48
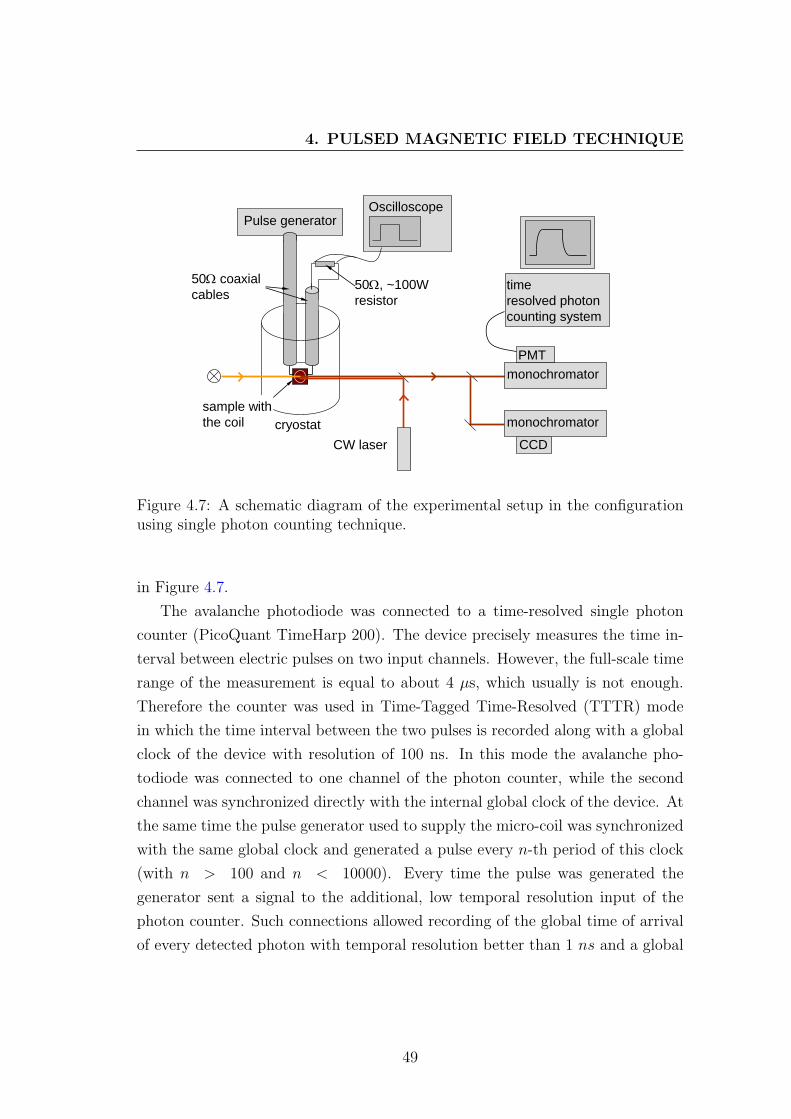
4. PULSED MAGNETIC FIELD TECHNIQUE
Oscilloscope
cryostat
50 coaxial
cables
Pulse generator
sample with
the coil
50, ~100W
resistor
CW laser CCD
monochromator
PMT
time
resolved photon
counting system
monochromator
Figure 4.7: A schematic diagram of the experimental setup in the configurationusing single photon counting technique.
in Figure 4.7.
The avalanche photodiode was connected to a time-resolved single photon
counter (PicoQuant TimeHarp 200). The device precisely measures the time in-
terval between electric pulses on two input channels. However, the full-scale time
range of the measurement is equal to about 4 µs, which usually is not enough.
Therefore the counter was used in Time-Tagged Time-Resolved (TTTR) mode
in which the time interval between the two pulses is recorded along with a global
clock of the device with resolution of 100 ns. In this mode the avalanche pho-
todiode was connected to one channel of the photon counter, while the second
channel was synchronized directly with the internal global clock of the device. At
the same time the pulse generator used to supply the micro-coil was synchronized
with the same global clock and generated a pulse every n-th period of this clock
(with n > 100 and n < 10000). Every time the pulse was generated the
generator sent a signal to the additional, low temporal resolution input of the
photon counter. Such connections allowed recording of the global time of arrival
of every detected photon with temporal resolution better than 1 ns and a global
49

4. PULSED MAGNETIC FIELD TECHNIQUE
Figure 4.8: A schematic diagram of connections between the photon counter andthe pulse generator using the internal global clock of the counter and enablingsynchronization between pulsed magnetic field and detection setup.
time of every pulse of magnetic field. Therefore it was possible to reproduce
the averaged temporal profile of the photoluminescence intensity at given wave-
length before, during and after the magnetic pulse. The schematic diagram of
connections between the counter and the pulse generator is shown in Figure 4.8.
4.5.2.2 Optical bridge
In case of the reflectance and transmission measurements, the optical signal is
much stronger in comparison with the photoluminescence measurements. There-
fore it was possible to use an optical bridge setup for detection of the signal. Such
system is less sensitive, yet more precise than the setup with avalanche photodi-
ode described in section 4.5.2.1. The optical bridge is made of two photodiodes,
each detecting a different linearly polarized component of incoming light. This
is done by splitting the light into two oppositely polarized beams by a Wollaston
polariser. A quarter-wave plate placed before the polarizer enables independent
detection of two circularly polarized components of incoming light. Then the sig-
nal from the two photodiodes is amplified by a differential amplifier which enables
a very precise measurement of the difference between the intensities of the two
components with opposite polarizations.
The spectral resolution of such a setup is achieved by using a tuneable laser
beam as a source of reflected or transmitted light. The response time of the
optical bridge is highly limited, however measurements with the temporal res-
olution are also possible due to proper illumination setup, making the pulsed
50

4. PULSED MAGNETIC FIELD TECHNIQUE
t
light pulse
field pulse
(b) Setup with CW laser:
generator
AOM
resolution ~20 ns
(c) Setup with fs laser:
laser
generator
resolution ~7 ns
(a) Sequence of pulses:
to the coil to the coil
CW laser pulse-picker
Figure 4.9: (a) A schematic diagram of the light and magnetic field pulses se-quence in the setup comprising an optical bridge. (b) A schematic diagram ofconnections between the pulse generator and acousto-optic modulator (AOM) inthe setup with a CW laser. (c) A schematic diagram of connections between thepulse generator and the pulse picker in the setup with a femtosecond laser.
excitation possible (see Figure 4.9(a)). This is done by either use of pulsed laser
or continuous wave laser. In the latter case the laser beam was modulated with
an acousto-optic modulator. A schematic diagram of the experimental setup in
the latter configuration is shown in Figure 4.10, and the diagram of connections
between the pulse generator and the acousto-optic modulator is presented in Fig-
ure 4.9(b). This setup allowed measurements with temporal resolution of about
20 ns, limited only by the response time of the acousto-optic modulator.
In cases when a better resolution was needed, the pulsed laser which produced
pulses of about 40 fs was used. To reduce the spectral width of the illuminating
light we used an additional simple monochromating setup. To reduce the repeti-
tion rate of the laser (equal to 78 MHz) and therefore extend the available range
of the characteristic timescales of the processes under investigation, a pulse-picker
was used in the laser beam. It decreased the laser repetition rate by a factor in
the range 100-10000. A diagram of connections between the pulse generator and
the pulse picker is presented in Figure 4.9(c).
Synchronization between the laser pulses and the magnetic pulses was realized
in two slightly different ways, both relying on the pulsed generator used to supply
the micro-coil. In the case when the acousto-optic modulator was used, two chan-
nels of the generator were used to drive both the micro-coil and the modulator,
enabling independent control over the pulses width and the delay between them.
In the case with a pulsed laser used as a light source, the laser worked also as a
51

4. PULSED MAGNETIC FIELD TECHNIQUE
Oscilloscope
cryostat
50 coaxial cables
Pulse generator
sample with the coil
50, ~100W resistor
CW laser
WP
AOM
lock-in
λ/4
Figure 4.10: A schematic diagram of the experimental setup in the configurationusing the optical bridge.
global clock of the setup. The pulsed generator was synchronized to this clock
and governed only magnetic pulses.
In both cases the optical bridge worked in continuous mode. The repetition
rate of the pulsed light source was much higher than the response frequency of the
bridge. Therefore, collected signal was related only to the specific short period
during or after the magnetic pulse. The whole measurement was performed as a
series of measurements with a specific delay between the light pulse and magnetic
pulse. The best temporal resolution available in such experiment was better than
10 ns.
In order to reduce observed noise and increase the dynamic range of the col-
lected signal a heterodyne detection was used. The optical signal was modulated
with frequency of 1 kHz by gating the magnetic pulses. The signal from the
optical bridge was detected with a lock-in amplifier, synchronized with the mod-
ulation of the magnetic pulses. Such a setup allowed collection of the temporal
profiles of the optical signal with at least two orders of magnitude better than
the setup described in section 4.5.2.1 in the same acquisition time.
52

4. PULSED MAGNETIC FIELD TECHNIQUE
4.6 Data analysis
The magnetization temporal profile M(t) collected with the experimental setups
described above is given by a convolution of the temporal profile of the magnetic
field (we assume that it is proportional to the current in the micro-coil I(t)
recorded with the oscilloscope), and the response function of the sample f(t):
M(t) =
∞∫0
I(t− τ)f(τ)dτ (4.2)
In principle, to obtain the f(t) function, it is sufficient to calculate the decon-
volution of M(t) and I(t). This can be done by calculating Fourier transform of
these two profiles, dividing the results and then calculating the inverse Fourier
transform. However, due to relatively high noise present in the collected signal, a
deconvolution algorithm did not give satisfactory results. Instead, different decay
functions f(t) were tested by convoluting them with I(t) and fitting the result to
the M(t). It was found that in all cases a multi-exponential decays:
f(t) =k∑i=1
Aie− tτi (4.3)
gave a very good agreement with the experimental data with k not greater
than 3. Figure 4.11 shows a typical temporal profile of the magnetization of
a Cd1−xMnxTe quantum well with 0.8% of Mn (points), measured after the mag-
netic pulse produced by the micro-coil, along with the profile of the current in the
coil (blue dashed line). The convolution of the current profile with two different
exponential decays (red lines) clearly shows that in this case the bi-exponential
decay reproduces the experimental data with very good accuracy. At t ≈160 ns
and t ≈320 ns characteristic kinks in profiles of the current and the magnetization
(marked with black arrows) are clearly visible. These kinks are the consequence
of the fact that due to relatively large inductance, the micro-coil does not exactly
match the impedance of the transmission line. As a result, part of high-frequency
53
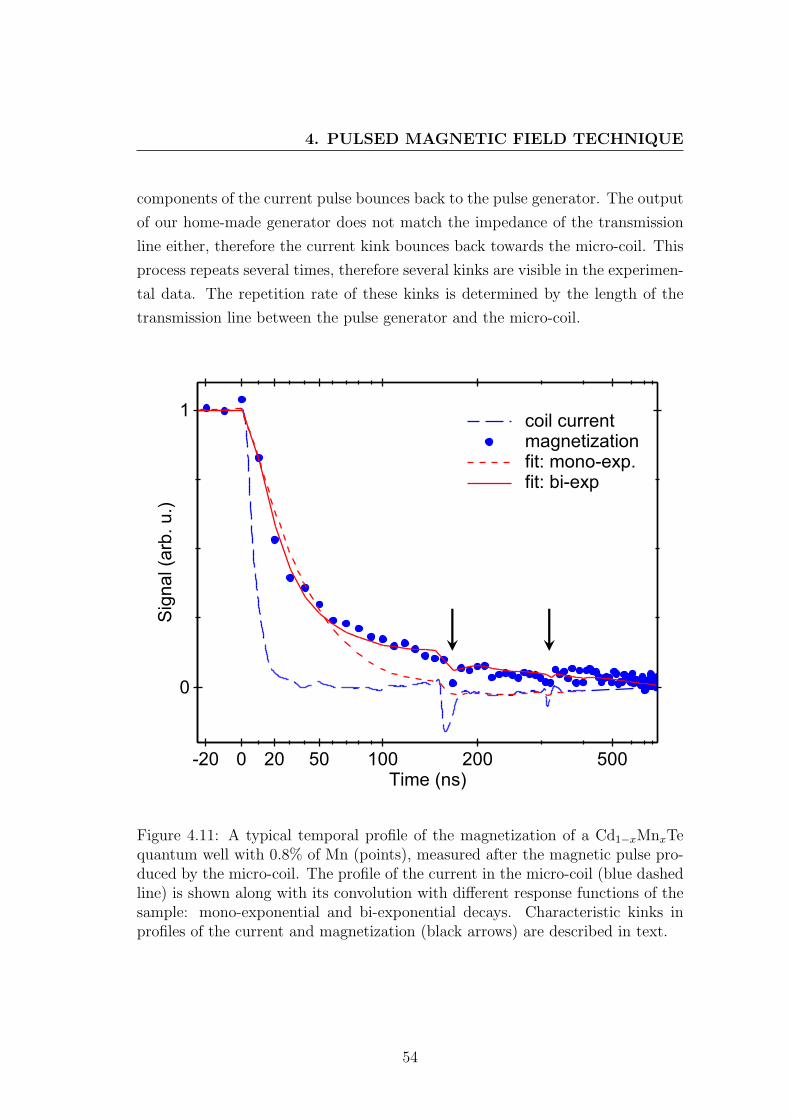
4. PULSED MAGNETIC FIELD TECHNIQUE
components of the current pulse bounces back to the pulse generator. The output
of our home-made generator does not match the impedance of the transmission
line either, therefore the current kink bounces back towards the micro-coil. This
process repeats several times, therefore several kinks are visible in the experimen-
tal data. The repetition rate of these kinks is determined by the length of the
transmission line between the pulse generator and the micro-coil.
0
1
-20 0 20 50 100 200 500
coil currentmagnetizationfit: mono-exp.fit: bi-exp
Time (ns)
Sig
na
l (a
rb.
u.)
Figure 4.11: A typical temporal profile of the magnetization of a Cd1−xMnxTequantum well with 0.8% of Mn (points), measured after the magnetic pulse pro-duced by the micro-coil. The profile of the current in the micro-coil (blue dashedline) is shown along with its convolution with different response functions of thesample: mono-exponential and bi-exponential decays. Characteristic kinks inprofiles of the current and magnetization (black arrows) are described in text.
54
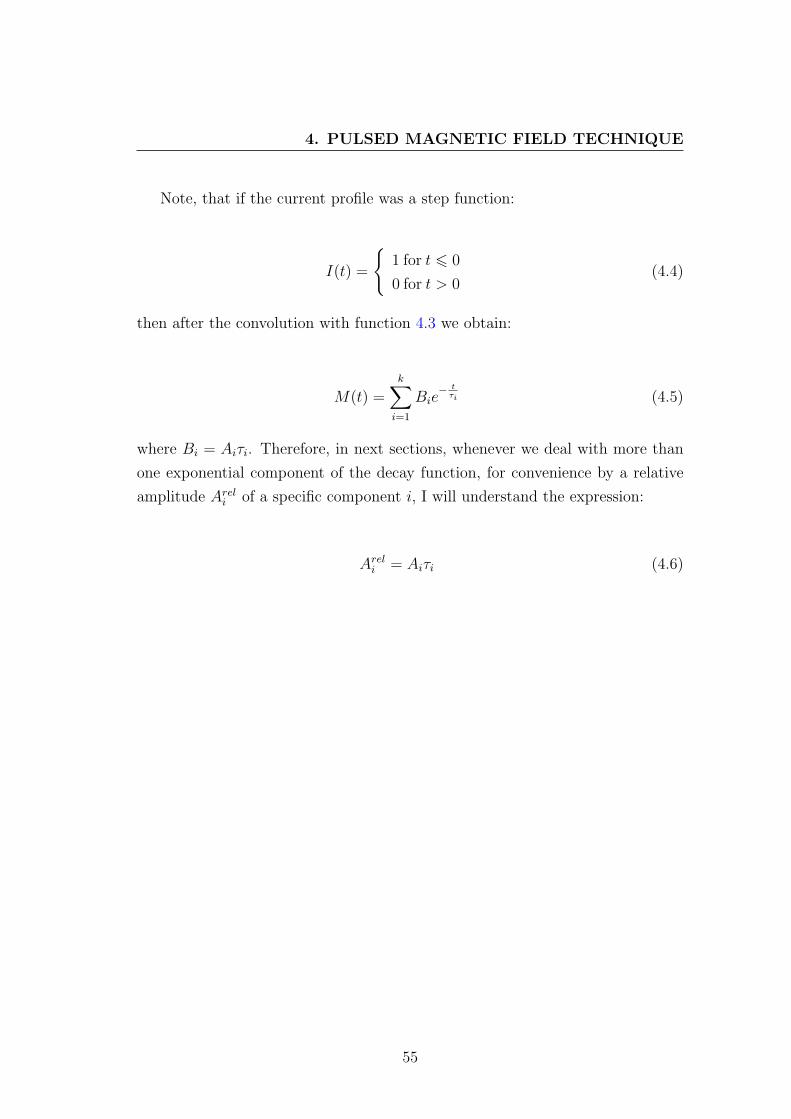
4. PULSED MAGNETIC FIELD TECHNIQUE
Note, that if the current profile was a step function:
I(t) =
1 for t 6 0
0 for t > 0(4.4)
then after the convolution with function 4.3 we obtain:
M(t) =k∑i=1
Bie− tτi (4.5)
where Bi = Aiτi. Therefore, in next sections, whenever we deal with more than
one exponential component of the decay function, for convenience by a relative
amplitude Areli of a specific component i, I will understand the expression:
Areli = Aiτi (4.6)
55

Chapter 5
Spin orientation
In this chapter, I present the experiment of optical manipulation of a single Mn2+
ion embedded in the CdTe quantum dot. The experiment exploits the interaction
between the magnetic ion and excitons confined in the dot. The dynamics of
this interaction is studied in section 5.1 by means of correlation spectroscopy
(the first such measurements of single Mn-doped quantum dots were performed
by L. Besombes and co-workers [92]). In order to manipulate the Mn2+ spin,
polarized excitons are injected to the dot with the magnetic ion using the spin-
conserving exciton transfer between neighbouring dots (sections 5.2.1 and 5.2.2).
The dynamics of the orientation process is also investigated (section 5.2.4).
5.1 Influence of exciton state on Mn2+ spin
As described in section 1.3.2, the optical readout of the spin state of a single
Mn2+ ion embedded in the CdTe quantum dot is possible by recording the en-
ergy and polarization of photons emitted by the dot. This gives opportunity to
investigate the Mn2+ spin dynamics in a dot under illumination by a laser beam.
Photon correlation technique, described in section 3.2 is particularly useful in this
purpose.
A measurement of auto-correlation of a selected component of the excitonic
sextuplet gives the information about the time in which the spin state of the ion
remains unchanged. On the other hand the study of cross-correlation of photons
56

5. SPIN ORIENTATION
from two different components allows us to measure the time of a transition
between two particular spin states. The selection of investigated spin states is
made either by choosing opposite circular polarizations and the same energy of
detected photons or the same polarizations and different energies.
In order to better understand the results of correlation experiments performed
on single Mn-doped dots let us first focus on the case of a non-magnetic quantum
dot. Typical results of auto-correlation and cross-correlation of photons emitted
by such a dot are presented in Figure 5.1. The curves represent normalized
number of such events that both detectors detected a photon, plotted vs. the
time delay between these two photons.
1
2
3
-20 -10 0 10 20
XX-XX-X
time (ns)
co
un
ts (
arb
.u.)
Figure 5.1: Typical results of photon correlation measurements of non-magneticquantum dot. The blue curve corresponds to the auto-correlation measurementperformed on the neutral exciton (X) line, the red one represents cross-correlationmeasurement between neutral exciton and biexciton (XX) lines.
57

5. SPIN ORIENTATION
Narrow features visible around the delay equal to 0 are related to dynamics of
excitons confined in the quantum dot. In case of auto-correlation, both detectors
detect photons related to the optical recombination of a neutral exciton. Since
the quantum dot is a single photon source [93, 94] it is unlikely to detect two
such photons with zero delay (τ) between them, i.e. two photons emitted exactly
at the same time. Therefore in the auto-correlation measurement a sharp anti-
bunching dip is clearly visible at τ=0. The width of the dip is given by an exciton
lifetime in the quantum dot for weak excitation regime and becomes narrower
with increasing excitation power [95, 96]. In an ideal experiment the depth of
the dip would be equal to 100%, e.i. the number of the detected pairs of photons
at τ=0 would be equal to 0. The depth of the dip is, however, limited due to
temporal resolution of the experimental setup, the dark counts of the detectors
used and some background luminescence usually present along with the quantum
dot luminescence.
In case of cross-correlation of photons related to the transition of neutral
exciton and biexciton, observed signal shows an asymmetric feature at the time
delay equal to 0. Such an asymmetric shape is a fingerprint of a biexciton-exciton
cascade [97]. It indicates a higher probability of emission of a photon related to
the neutral exciton recombination right after the photon related to the biexciton
one and low probability of emission of such photons in the opposite sequence.
Basically the same results can be obtained on a single Mn-doped quantum
dot, when the detectors are insensitive to the Mn2+ spin state. This might be
achieved by intentional reduction of the spectral resolution of the spectrometers
by changing the gratings and opening widely the entrance slits. The result of such
experiment along with the observed excitonic spectrum is shown in Figure 5.2.
The features observed at τ = 0 has the same width as those visible in Figure 5.1.
When the resolution of the detection system is high enough to resolve lines
related to different Mn2+ spin states, the results of the correlation measurements
are qualitatively different. Figure 5.3 shows typical results of the auto-correlation
measurement performed on neutral exciton components related to the Mn2+ spin
states with spin projection equal to −5/2 and −3/2 in comparison to the re-
sult of the cross-correlation between these two components. In the case of auto-
correlation, a strong bunching with a narrow, sub-nanosecond antibunching dip is
58
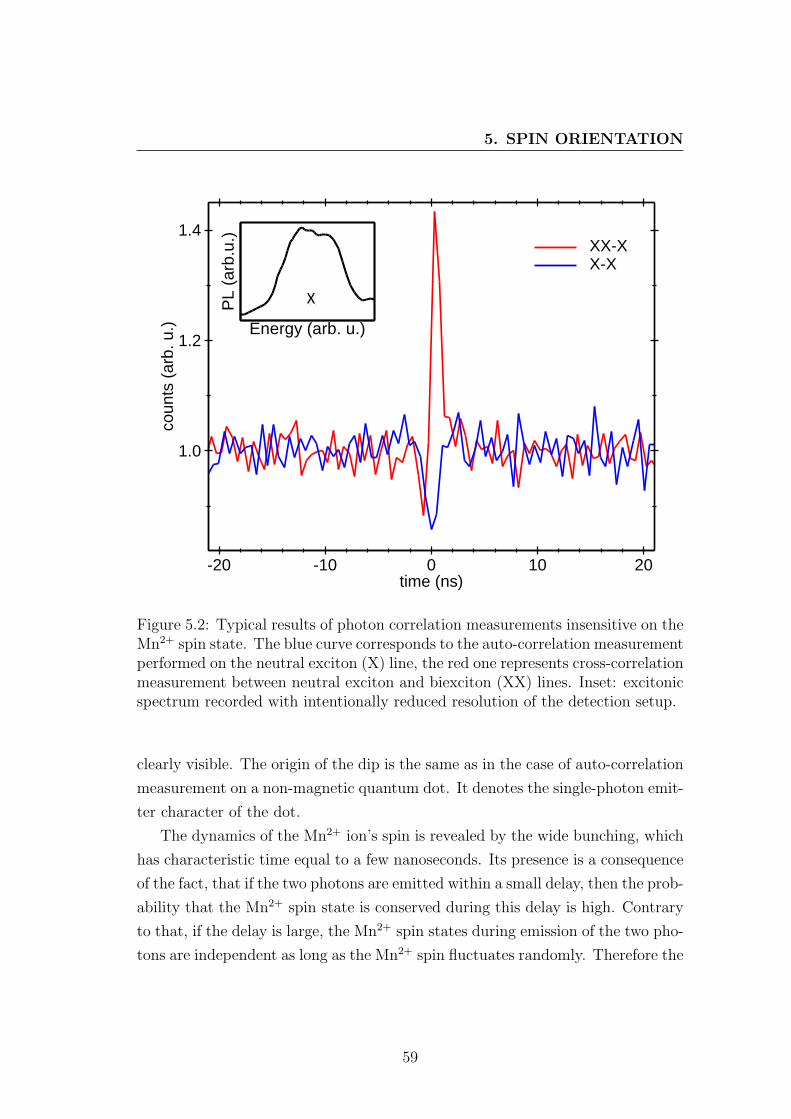
5. SPIN ORIENTATION
Energy (arb. u.)
PL
(a
rb.u
.)
X
1.0
1.2
1.4
-20 -10 0 10 20
XX-XX-X
time (ns)
co
un
ts (
arb
. u
.)
Figure 5.2: Typical results of photon correlation measurements insensitive on theMn2+ spin state. The blue curve corresponds to the auto-correlation measurementperformed on the neutral exciton (X) line, the red one represents cross-correlationmeasurement between neutral exciton and biexciton (XX) lines. Inset: excitonicspectrum recorded with intentionally reduced resolution of the detection setup.
clearly visible. The origin of the dip is the same as in the case of auto-correlation
measurement on a non-magnetic quantum dot. It denotes the single-photon emit-
ter character of the dot.
The dynamics of the Mn2+ ion’s spin is revealed by the wide bunching, which
has characteristic time equal to a few nanoseconds. Its presence is a consequence
of the fact, that if the two photons are emitted within a small delay, then the prob-
ability that the Mn2+ spin state is conserved during this delay is high. Contrary
to that, if the delay is large, the Mn2+ spin states during emission of the two pho-
tons are independent as long as the Mn2+ spin fluctuates randomly. Therefore the
59

5. SPIN ORIENTATION
Energy (arb. u.)
PL
(a
rb.u
.)
1
2
-40 -20 0 20 40time (ns)
co
un
ts (
arb
. u
.)
X
Mn
5/2
3/2
1/2
-1/2
-3/2
-5/2
Figure 5.3: Typical results of photon correlation measurements between differentcomponents of a single-Mn doped quantum dot excitonic spectrum. Inset: neutralexciton photoluminescence spectrum.
width of the bunching visible in the auto-correlation measurement corresponds
to the time in which the spin state of the ion remains unchanged.
What is attracting the attention in the results presented in Figure 5.3 is the
fact that this characteristic time depends on the Mn spin state which is under
investigation. It is significantly shorter in case of measurement performed on
the line corresponding to the state with spin projection equal to −3/2, when
compared to the one with the spin projection equal to −5/2. This might be
explained if we assume that the most likely random transitions of the Mn2+
spin are those which involve adjacent spin states. In that case there is only one
transition which drives the Mn2+ ion out of the ±5/2 states, while two such
transitions exist in case of any other state. Assuming that all these transitions
are random and equally probable one could expect that the Mn2+ ion will remain
in the −5/2 state twice longer than in the −3/2 state. This is consistent with
the experimental results within the experimental accuracy.
In case of cross-correlation of two excitonic lines, we observe strong antibunch-
60

5. SPIN ORIENTATION
ing which consist of two components with different time scale. A representative
result of such experiment, involving adjacent lines related to the −5/2 and −3/2
lines is shown in Figure 5.3. As previously, the narrow, sub-nanosecond dip
is related to dynamics of excitons confined in the quantum dot. The slower,
nanosecond antibunching is related to the dynamics of the Mn spin. The time
scale of this antibunching is related to the time scale of the wide bunching visi-
ble in auto-correlation experiments, as both these features origin from the same
spin-flip transitions of the Mn2+ ion.
A different type of a correlation experiment revealing both the excitonic and
the Mn2+ ion spin dynamics is a measurement involving lines related to the same
state of the Mn2+ ion, but to different excitonic states. An example result of
such measurement, involving neutral excitonic and biexcitonic lines is shown in
Figure 5.4.
1
2
3
-40 -20 0 20 40time (ns)
co
un
ts (
arb
. u
.)
Mn
5/2
3/2
1/2
-1/2
-3/2
-5/2
Energy (arb. u.)
PL
(a
rb.u
.)
Energy (arb. u.)
PL
(a
rb.u
.) X XX
Figure 5.4: Result of cross-correlation measurement of the photons related tothe same Mn2+ ion spin state with spin projection equal to +5/2, but differentexcitonic states (neutral exciton (X) and biexciton (XX)), compared with theresult of the auto-correlation measurement of the photons related to the neutralexciton. Insets: excitonic and biexcitonic photoluminescence spectra
61

5. SPIN ORIENTATION
The observed signal is a product of a narrow asymmetric shape with the broad
bunching related to the dynamics of the Mn2+ ion. The narrow feature denotes
the neutral biexciton-exciton cascade. Its width is the same as the width of the
cascade-related asymmetric features visible in Figures 5.1 and 5.2. The broad
bunching is related to the dynamics of the Mn2+ ion. The width of the bunching
is exactly the same as in the previously described measurement of auto-correlation
of one of the excitonic lines, which can be easily seen in Figure 5.4.
All features related to the dynamics of the Mn2+ ion can be well described by
a simple model of spin transitions of the Mn2+ ion. In the proposed model the
transitions are assumed to be possible only between adjacent states and the tran-
sition probability p per unit time is equal for each pair of states (see Figure 5.5).
A similar model was proposed in Ref. [92]. The rate equations for the occupation
qm of the Mn2+ spin states are following:
dqm/dt =
p (qm−1 + qm+1)− 2pqm for |m| 6 3/2
pqm+1 − pqm form = −5/2
pqm−1 − pqm form = 5/2
(5.1)
Result of fitting such a model to the experimental data is shown in Figure 5.6.
It is clearly visible that the model reproduces all major features observed in the
experiment. Note that the only fitting parameter is the transition probability p.
In the best fit, the transition time, τ = 1p, is equal to 5 ns for the data shown in
Figure 5.6.
In order to better understand the mechanism of the spin transitions of the
Mn2+ ion we performed a series of the auto-correlation measurements with dif-
ferent excitation power. Results of these measurements are shown in Figure 5.7.
Using the same model as described above, we determined the dependence of the
parameter p on the excitation power. Figure 5.8 shows the experimental results
compared with the model curves. It is clearly seen that the characteristic time of
the wide bunching strongly (super linearly) depends on the excitation power - by
increasing the power by a factor of 2 we decreased the bunching width by a factor
of 3.6, from 5 ns at 50 µW excitation to 1.4 ns at 100 µW. These characteristic
times are longer than the mean time between exciton injection into the quantum
62

5. SPIN ORIENTATION
5/2
3/2
1/2
-1/2
-3/2
-5/2
p
p
p
p
p
Figure 5.5: A schematic diagram of the Mn2+ ion spin transitions calculated withthe model described in text.
dot (proportional to the excitation power), ranging roughly from 2 ns to 1 ns for
excitation power equal 50 µW and 100 µW, respectively1. This result suggests
that the random spin-flips of the Mn2+ ion are mainly caused by the interaction
with randomly polarized, photogenerated carriers, which are trapped and recom-
bine in the quantum dot. The exploitation of this fact by using spin-polarized
excitons to polarize the single magnetic ion in the quantum dot is described in
section 5.2. The super linear dependence of the p on the excitation power might
be caused by the influence of biexcitons. Their creation probability is known to
depend almost quadratically on the quantum dot excitation intensity [34].
5.2 Spin orientation by polarized photons
Results presented in section 5.1 suggest that the main driving force of the random
spin-flip transitions of the Mn2+ ion is the interaction with randomly polarized
1The mean time between exciton injection into the QD is estimated by using X and XXintensity power dependence and the exciton lifetime. This method is described in more detailin section 5.2.3 and in Ref. [98].
63

5. SPIN ORIENTATION
1
2
-40 -20 0 20 40time (ns)
co
un
ts (
arb
. u
.)
nsp
0.51
Energy (arb. u.)
PL
(a
rb.u
.) X
1
2
5 10 15 20coun
ts (
arb
. u
.)
Figure 5.6: Comparison of the results of the auto- and cross-correlation measure-ments (points on the right panel) with the model described in text using the timeconstant of the Mn2+ spin flips as a fitting parameter.
carriers trapped in the quantum dot. This brought the idea of inducing the
polarization of the Mn2+ ion by injecting spin polarized excitons into the dot. In
this section, I describe in detail how such an experiment was performed.
5.2.1 Coupled quantum dots
In order to create spin polarized excitons one has to excite them with circularly
polarized light. Moreover, it is necessary to create them resonantly inside the
quantum dot. Otherwise, if they are created in the barrier material, their spin
polarisation is significantly reduced or even completely lost during the relaxation
process. The resonant excitation not only solves this problem, but also signifi-
cantly increases the quantum dot excitation efficiency.
There is, however, a major experimental difficulty in using this type of ex-
citation. If the excited state is the ground exciton state in the quantum dot it
very difficult to observe the photoluminescence from this dot, as it occurs in the
64

5. SPIN ORIENTATION
Mn
5/2
3/2
1/2
-1/2
-3/2
-5/2
1
2
-20 0 20
exc 50Wexc 75 Wexc 100W
= 1.4ns
= 3.5ns
= 5.0ns
time (ns)
co
un
ts (
arb
. u
.)
X
Energy (arb. u.)
PL
(a
rb.u
.)
Figure 5.7: Result of auto-correlation measurements of the σ+-polarized photonsrelated to the Mn2+ ion spin state with spin projection equal to −5/2, performedfor different values of excitation power.
same or very close energy as the excitation. One of the solutions of this problem
proposed by Besombes et al. is excitation resonant with a higher excitonic level
in the dot [45]. In this work a different method is proposed: the resonant exci-
tation of the ground excitonic level in a non-magnetic quantum dot and use of
the tunnelling of the exciton to the neighbouring dot containing a single Mn2+
ion. To realize this excitation scenario, among the identified quantum dots with
single Mn2+ ions we have selected those exhibiting a sharp resonance in photo-
luminescence excitation (PLE) spectra, as shown in Figure 5.9. As it was shown
on similar samples with and without Manganese [46, 99], such resonances are
fingerprints of pairs of coupled quantum dots and of transfer of excitons between
them. Following arguments support the inter-dot energy transfer: (i) resonances
are very sharp (width equal to tens of µeV); (ii) they appear at energy much
larger than energy of observed emission (more than 0.2 eV), with no correla-
tion between the two energies; (iii) all the observed charge states of the emitting
quantum dots share the same resonance energy; (iv) optical in-plane anisotropy
65

5. SPIN ORIENTATION
1
2
5 10 15 20 25
exc 50Wexc 75 Wexc 100W
= 1.4ns
= 3.5ns
= 5.0ns
time (ns)
co
un
ts (
arb
. u
.)
Figure 5.8: Experimental data (points) shown in Figure 5.7 compared with modeldescribed in text (the time constant of the Mn2+ spin flips (τ) used as a fitparameter.
(characteristic for the neutral exciton) is different and uncorrelated in absorption
and in emission; (v) the Zeeman splitting as well as diamagnetic shift (in high
magnetic field) for both absorption and emission are typical for neutral excitons
observed in photoluminescence of quantum dots without magnetic ions (see Fig-
ure 5.10); (vi) while the PL exciton lines exhibit characteristic sixfold splitting
due to the interaction with single Mn2+ ions, the absorption line is usually not
split by this interaction (see Figure 5.9).
Basing on these findings we conclude that the resonance is related to absorp-
tion in a quantum dot with no Manganese. The photocreated exciton is then
transferred to a larger dot containing a single Mn2+ ion. As shown in Ref. [99]
the transfer time is of order of 10 ps. Note that finding such pair of quantum
66

5. SPIN ORIENTATIONEx
cita
tio
n e
ner
gy (
meV
)
1870 1880 1890
2148
2152
2156
Emission energy (meV)
Figure 5.9: Photoluminescence excitation map (density plot of PL intensity versusexcitation/emission photon energy) close to the resonance.
0
1
2
3
4
0 10 20 30
Zeeman splittingDiamagnetic shift
y=a*Ba=0.107
y=a*x2
a=0.0022
B (T)
Photoluminescence
0
1
2
3
4
0 10 20 30
Zeeman splittingDiamagnetic shift
y=a*(B2+b
2)0.5
a=0.130, b=2.65
y=a*x2
a=0.00203
B (T)
Sh
ift
or
sp
littin
g (
me
V)
Excitation
Figure 5.10: Comparison of the Zeeman splitting and diamagnetic shift of theground excitonic level in the absorbing (left) and emitting (right) quantum dot.
dots is possible even despite quite low dot density (equal to about 5× 109 cm−2)
since in our samples quantum dots tend to form groups of closely-spaced dots
67

5. SPIN ORIENTATION
[47]. A more detailed discussion of the interdot transfer mechanism can be found
in Refs. [37, 99].
5.2.2 Spin-conserving exciton transfer
As it was shown in Ref. [46] and Ref. [99], during the transfer between two
coupled quantum dots the spin of the exciton is conserved. The experimental
proof for this fact in case of singly Mn-doped quantum dot is a higher intensity
integrated over the 6 exciton lines in the photoluminescence spectra measured
in the same circular polarizations of excitation and detection (co-polarized) then
the integrated intensity of the excitonic lines measured in different polarizations
(cross-polarized). The lower intensity equals about 65% of the higher one which
gives a lower bound for the polarization transfer efficiency. The transfer efficiency
depends on the details of the parameters of the coupled quantum dots (such
as in-plane anisotropy and excitation transfer rate). In our case it is almost
independent on magnetic field up to 28 T. It decreases for higher excitation
power due to the increased probability of biexciton formation. The biexciton
ground state is a spin the spin singlet state, thus it cannot carry any spin memory.
Therefore the presence of biexcitons leads to a suppression of the spin polarization
transfer.
5.2.3 Mn2+ spin orientation
The exciton polarization transfer is used as a tool for optical writing of informa-
tion on the Mn2+ spin. Carriers created by a defined circular polarization of light
act on the Mn2+ ion and orient its spin. The details of the mechanism of this pro-
cess are, however, not known. There are several hypotheses which are proposed,
including dark exciton recombination [100] (see chapter 6), simultaneous spin-flip
of the Mn2+ ion and the hole localized on the quantum dot and relaxation of the
Mn2+ spin in the effective magnetic field of the exciton. The leading orientation
mechanism has not been determined so far. This issue requires further studies.
The Mn2+ spin orientation appears as a non-uniform distribution of intensities
between the 6 exciton photoluminescence lines, which reflects a non-equal prob-
ability of finding the Mn2+ ion in different spin states. The orientation is much
68

5. SPIN ORIENTATION
more efficient in presence of a magnetic field of about 1 T, due to suppression of
fast spin relaxation channels [101] (see section 7.2.1). Figure 5.11 shows an typi-
cal excitonic spectra taken under circular excitation at B=1 T compared to the
one taken under linear excitation without magnetic field. It is clearly seen that
the polarization of excitation beam affects not only the distribution of intensities
between the 6 excitonic lines, but also the overall intensity integrated over these
6 lines. As mentioned in section 5.2.2, this proves that the polarization of exciton
is indeed conserved with reasonable probability during the transfer between two
coupled quantum dots.
0
1
1889 1890 1891
B=0, exc linB=1T, exc
+
B=1T, exc -
Energy (meV)
Ph
oto
lum
ine
sce
nce
in
ten
sity (
arb
. u
.)
Detection +
Figure 5.11: Typical excitonic spectra taken under circular excitation at 1Tcompared to the one taken under linear excitation without magnetic field. Themeasurements were performed with σ+ polarized detection.
As a quantitative measure of the spin orientation we use the mean spin value
of the Mn2+ ion determined from the centre of mass of the PL sextet (weighted
by intensity). A typical variation of this value versus excitation power is shown in
69

5. SPIN ORIENTATION
Figure 5.12. For B=0 it shows a maximum at about 0.1 mW/µm2 and decreases
for higher and lower power. The decrease at the high power corresponds to
the increased probability of the biexciton formation and - as a consequence -
a decrease of the efficiency of the Mn2+ spin alignment. The decrease at low
excitation power is due to the competition between the Mn2+ spin relaxation,
and the spin orientation by the photo-created excitons. The relaxation becomes
dominant when the average time delay between capture of two excitons is longer
than the relaxation time. This condition provides an estimate of the relaxation
time, being in our case of the order of a few nanoseconds. This value compares
reasonably with the relaxation time determined for very diluted Cd1−xMnxTe
quantum wells in the absence of magnetic field (see section 7.2.1). The fast
relaxation was caused mainly by the hyperfine interaction with nuclear spin.
Figure 5.12: The mean spin of the Mn2+ ion as a function of excitation powerfor B=0 and B=1 T compared with model described in text (solid line).
The situation is different for B=1 T. Similarly to the zero-field case, the mean
spin value of the Mn ion shows a decrease at high power, resulting from an increase
of the probability of biexciton formation. However, no decrease is observed at
70

5. SPIN ORIENTATION
low power, down to its lowest values, due to suppression of fast spin relaxation
channels (see section 7.2.1 and Ref. [101]). Such dependence of the Mn2+ mean
spin on the excitation power can be described by a simple optical orientation
model. It is based on the assumption that any Mn2+ state, characterized by
its quantum number m, can be transferred to a state with m different by 1
with a fixed probability p0 during the presence of a suitably polarized exciton
in the quantum dot. Moreover, it takes into account the influence of biexcitons,
assuming that each of them contributes with equal probability p0/2 to the Mn2+
up- and down spin flips. This gives following rate equation for the probability of
the occupation (qm) of each Mn2+ spin state (with a suitable cut-off for |m| =
5/2):
dqm/dt = qm−1p0(ϕX−1 + ϕXX
2
)+ qm+1p0
(ϕX+1 + ϕXX
2
)−qmp0
(ϕX−1 + ϕX−1 + ϕXX
))
(5.2)
where ϕX±1 are frequencies of arriving of excitons into the quantum dot and ϕXXis the biexciton creation frequency. Within these assumptions of the model, the
steady state of Mn2+ spin does not depend on absolute exciton transfer rate or
p0 value, but only on the relative numbers of biexcitons and spin-up and spin-
down excitons arriving in the emitting dot. To determine the biexciton/exciton
ratio of arrival rates in the quantum dot, we use a rate equation model of exciton
dynamics introduced by Regelman et al. [98]. We select a basis containing up
to three excitons in the dot. Using thus obtained biexciton/exciton arrival rate
ratio, the power dependence of Mn2+ spin orientation was calculated, with the
exciton spin transfer efficiency as a free parameter. As shown in Figure 5.12 an
excellent agreement with the experimental data was obtained with spin-up to
spin-down probability ratio of 0.62. This value agrees well with the lower limit
of the polarization transfer determined experimentally from the net polarization
of the exciton line at low excitation power (see section 5.2.2).
5.2.4 Dynamics of the Mn2+ spin orientation
Dynamics of the Mn2+ spin orientation was studied by the use of the spin-
conserving exciton transfer between quantum dots. The dynamics in magnetic
71

5. SPIN ORIENTATION
field was analyzed in a time-resolved experiment in which the intensity and po-
larization of excitation were modulated. The excitation sequence was following:
first, the Mn2+ spin was oriented using a σ+ - polarized excitation. Then the
light was switched off for a controlled delay and subsequently the light with σ−
polarization was switched on to accomplish the read-out of the spin state and
then to reorient the Mn2+ spin. After a period long enough to allow the Mn2+
spin reaching a steady state the polarization of excitation was switched back to
σ+. Such a pattern reveals different properties of the spin reorientation processes,
both in the absence and in the presence of illuminating light. The Mn2+ state was
investigated by measuring the photoluminescence intensity of a selected compo-
nent of the exciton sextuplet in a given circular polarization. Its evolution reflects
the orientation of the Mn2+ spin combined with the exciton optical orientation.
The measurements were repeated for both circular polarizations of detection.
Here I will consider a relatively simple case when the dark period was short
enough to neglect all Mn2+ spin relaxation processes in the dark. An analysis of
the situation involving long dark period is presented in section 7.1.
A representative result of measurement taken under excitation following above-
mentioned pattern is presented in Figure 5.13(a). It shows a temporal profile of
the photoluminescence intensity of the lowest-energy component of the exciton
sextuplet (as marked on the inset in Fig. 5.13(a)) observed in σ+ polarization.
The excitation power was low enough to neglect the formation of any excitonic
states in the quantum dot except the neutral exciton ground state. It is easy to
distinguish four phases of the profile. The first flat region is related to excitation
with σ+ polarization, the same as the detection polarization. Second phase with
no photoluminescence corresponds to the period when the excitation is off. When
subsequently a σ− polarized excitation is turned on, the photoluminescence in-
tensity first rises rapidly. This is due to the fact that during the short dark period
the Mn2+ spin state is conserved (see section 7.1). The maximum value of the
signal after turning the excitation on is determined only by the efficiency of the
exciton polarization transfer and is equal to about 65% of the previous value.
After the initial rapid increase, the photoluminescence intensity slowly de-
creases with a characteristic time of tens of nanoseconds (part A of the profile
presented in Figure 5.13(a)). This decrease is related to the reorientation of the
72

5. SPIN ORIENTATION
0
0.5
1.0
0 1000 2000 3000Time (ns)
PL
in
ten
sity (
arb
.u.)
T=1.5K, B=1T t
σ+ excitation σ- σ+
A
B
0
250
500
1.874 1.876
0
0.2
0.4
0 250 500
AB
Time (ns)
Pro
ba
bili
ty
(a) (b)
none
Sz=-5/2
Sz=-3/2
Sz=-1/2
Sz=1/2
Sz=3/2
Sz=5/2
Figure 5.13: (a) The temporal profile of the intensity of one of the six excitoniclines (marked in the inset) under the excitation pattern shown in the upper partof the figure and described in the text. (b) Calculated temporal profiles of oc-cupation of six Mn2+ spin states with indicated spin projection after the rapidchange of excitation polarization from σ+ to σ− (solid lines) compared with thetemporal profiles of occupation of the extreme state measured in the experiment(symbols).
Mn2+ spin by circularly polarized light. This process accelerates with increasing
excitation power, as shown in Figure 5.14. Its characteristic time is approximately
inversely proportional to the excitation power. This property suggests that the
simple model, introduced in section 5.2.3 to describe the steady-state Mn2+ spin
orientation, can also be used to interpret its dynamics. In contrast to the steady-
state case, now the rate at which excitons arrive in the emitting quantum dot,
as well as the spin-flip probability p0, becomes important. We determine the
former from the biexciton-exciton intensity ratio, using our rate equation model.
The latter enters the model calculation as a free parameter. The result of such a
calculation, presented in Figure 5.14(b), describes well the experimental values,
assuming p0=0.05. It is also important to note that in our case the photocreated
excitons are well defined and no free photocreated carriers are expected to con-
tribute to the spin relaxation. We excite resonantly excitons in the neighbouring
quantum dot with an excitation power sufficiently low to make any non-resonant
processes negligible. Therefore, in contrast to Ref. [92], we do not consider the
spin exchange with individual carriers surrounding the quantum dot.
73

5. SPIN ORIENTATION
0
0.5
1.0
0 500 1000 1500 2000
exc 2.5Wexc 6Wexc 15W
15.8ns
144ns
time (ns)
PL
in
ten
sity (
arb
.u.)
T=1.5K, B=1T
0
50
100
0 1 2 3
X (ns)
r (n
s)
(a)
(b)
Figure 5.14: (a) Temporal profile of the photoluminescence intensity at oneof the six components of the exciton spectrum during the excitation sequencedescribed in text for B=1 T and indicated values of excitation power. (b) TheMn2+ reorientation time upon illumination in σ− polarization (τr) vs. averagedtime delay between capture of two excitons (τr).
The last part of the temporal profile presented in Figure 5.13(a) (part B) starts
when the polarization of excitation is switched back to σ+. The observed signal
slowly increases due to reorientation of the Mn2+ spin back to the initial state.
It is clearly seen that the decrease of the signal observed under σ− excitation (A)
is much faster than the increase observed after switching the excitation to σ+
(B). It can be explained by a rate equation model introduced in the section 5.2.3.
Using this model we are able to calculate the expected evolution of probability of
finding the Mn2+ ion in each of six spin states after a rapid change of the excitation
polarization to the opposite one. This evolution is shown in Figure 5.13(b) (six
solid lines, each corresponding to a specific spin state of the Mn2+ ion). It is
clearly seen that the probability of occupation of the state, which was initially
the least occupied, is much slower than the decrease calculated for state which
was the most occupied at t=0. This is due to the fact that before the occupation
of the former state is built, the Mn2+ spin has to pass many possible projections
74

5. SPIN ORIENTATION
onto the quantization axis, as transition are allowed only between adjacent states.
The comparison with increase and decrease of the occupation probabilities of the
extreme state measured in the experiment (symbols in Figure 5.13(b) shows that
this model describes measured evolution with very good accuracy.
75

Chapter 6
Dark excitons
An important, but nevertheless, little investigated recombination channel of the
excited state in the quantum dot is related to the dark exciton states i.e. states
with total angular momentum equal to 2 [102]. Random transitions between
dark and bright excitonic states lead to exciton decoherence [103] and a signifi-
cant modification of the recombination dynamics which can result in the delayed
emission of photons [104, 105]. Despite their importance, dark exciton states
are difficult to probe. The radiative recombination of dark excitons is forbidden
so that they usually cannot be studied directly using spectroscopic techniques.
Their properties can be accessed indirectly by a detailed analysis of the dynamics
in time-resolved profiles of the bright exciton photoluminescence [104, 105, 106].
The other possibility is to measure the weak optical transitions under conditions
in which the dark exciton recombination is partially allowed. This has been
achieved either by the use of the in-plane magnetic field which mixes the heavy-
light hole states [107, 108] or by placing the quantum dot in a micro-pillar which
enhances the coupling of the exciton with light [109].
In this chapter, I present an investigation of dark exciton optical transitions
which are allowed due to the simultaneous spin flip of coupled single magnetic
impurity. An important conclusion from this experiment is that these transitions
are one of the mechanisms of the optical orientation of the single Mn2+ spin in
the quantum dot.
76

6. DARK EXCITONS
-1 0
(meV)-1 0
(meV)
0 5 10 15 20 25
0 10 20 5 15 25 0 10 20 5 15 25
A A
B
QD1 QD2
Em
issio
n e
ne
rgy (
me
V)
0
-2
2
1
-1
-3
3
(a) (b) (c) E0=1877.5 meV E0=1890.3 meV
σ+
σ-
Magnetic field (T)
Figure 6.1: (a-b) Colour-scale plots of the photoluminescence spectra of twosingle Mn-doped quantum dots as a function of magnetic field. Two dots (QD1and QD2) differ by in-plane anisotropy. The vertical scale of each panel is shiftedby E0. Insets: PL spectra at B = 0. (c) Simulation of the optical transitions inthe QD2 with the model described in text. The line thickness corresponds to theoscillator strength of the transitions.
6.1 Optical recombination of dark excitons
The ability to control the state of the Mn2+ ion presented in section 5.2.3 enables
easy featuring of selected spectroscopic lines from the Mn-doped quantum dot
excitonic spectrum. This, along with the use of high magnetic field, which allows
separation of lines related to specific spin states of the exciton (by controlling the
Zeeman splitting), facilitates convenient observation of the transitions related to
the dark excitonic states.
Figure 6.1(a-b) shows the evolution of exciton photoluminescence spectra with
magnetic field, measured without polarization resolution for the two selected
quantum dots. To elucidate the most characteristic features of this evolution we
initially focus on Figure 6.1(a) showing the quantum dot with the smaller in-plane
77

6. DARK EXCITONS
anisotropy. In the magnetic field, the exciton sextuplet splits into two distinct
Zeeman branches corresponding to σ+ and σ− circular polarizations for the upper
and lower branch respectively. The lowest component of each branch corresponds
to the Mn2+ spin antiparallel to the exciton spin [49]. The resonant excitation
with σ− polarization, combined with the magnetic field which significantly slows
down the Mn2+ spin relaxation [101], prevents the Mn2+ spin from thermalizing
[46]. Therefore all six lines are visible in both branches up to magnetic fields
∼15 T.
At a magnetic field of around 12 T, an anticrossing of the outermost lines of
both branches is clearly visible (“A” in Figure 6.1(a)). These two lines correspond
to the same −5/2 state of the Mn2+ spin, but two opposite spin states of X. At
this field, the excitonic Zeeman splitting exactly compensates the X-Mn exchange
interaction. The splitting (anticrossing) of these two lines is then simply due to
the in-plane anisotropy of the quantum dot, acting via the anisotropic component
of the electron-hole (e-h) exchange interaction, as observed for excitonic lines
in the absence of magnetic field for non-magnetic quantum dot [110]. As we
have checked, the two split lines show linear polarization (presumably along the
symmetry axes of the anisotropic dot), in contrast to the remaining sextuplet lines
which are polarized circularly. The anisotropic exchange splitting, determined
from the anticrossing, is equal to 60µeV for QD1 in Fig 6.1(a), and 230µeV for
QD2 in Fig 6.1(b).
Our optical method to align the Mn2+ spin against the action of the external
magnetic field [46] (see section 5.2.3) becomes less efficient at magnetic fields
above ∼ 15 T. This is due to the accelerated spin-lattice relaxation of the Mn2+
spin at high magnetic field. Details of the dependence of relaxation rate on
the magnetic field are discussed in section 7.1.2.2. As a result, the Mn2+ spin
orientation thermalizes and the excitonic lines related to the less populated spin
states vanish.
Strikingly, the quantum dot with the larger anisotropic exchange splitting
value (Figure 6.1(b)) has an additional, albeit weaker, lower branch consisting
of only five lines. To understand the origin of this branch one should notice
that optical transitions are possible in two situations: (a) The projection of total
angular momentum of the exciton on the quantization axis is equal to ±1 (bright
78
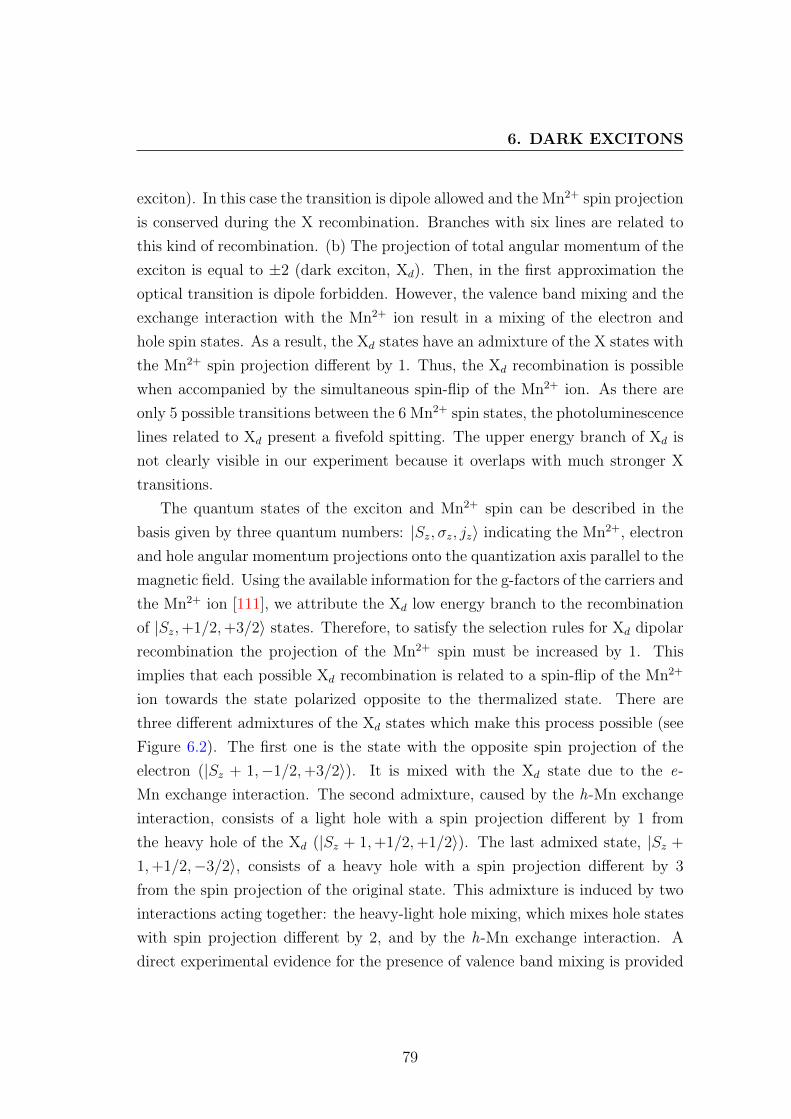
6. DARK EXCITONS
exciton). In this case the transition is dipole allowed and the Mn2+ spin projection
is conserved during the X recombination. Branches with six lines are related to
this kind of recombination. (b) The projection of total angular momentum of the
exciton is equal to ±2 (dark exciton, Xd). Then, in the first approximation the
optical transition is dipole forbidden. However, the valence band mixing and the
exchange interaction with the Mn2+ ion result in a mixing of the electron and
hole spin states. As a result, the Xd states have an admixture of the X states with
the Mn2+ spin projection different by 1. Thus, the Xd recombination is possible
when accompanied by the simultaneous spin-flip of the Mn2+ ion. As there are
only 5 possible transitions between the 6 Mn2+ spin states, the photoluminescence
lines related to Xd present a fivefold spitting. The upper energy branch of Xd is
not clearly visible in our experiment because it overlaps with much stronger X
transitions.
The quantum states of the exciton and Mn2+ spin can be described in the
basis given by three quantum numbers: |Sz, σz, jz〉 indicating the Mn2+, electron
and hole angular momentum projections onto the quantization axis parallel to the
magnetic field. Using the available information for the g-factors of the carriers and
the Mn2+ ion [111], we attribute the Xd low energy branch to the recombination
of |Sz,+1/2,+3/2〉 states. Therefore, to satisfy the selection rules for Xd dipolar
recombination the projection of the Mn2+ spin must be increased by 1. This
implies that each possible Xd recombination is related to a spin-flip of the Mn2+
ion towards the state polarized opposite to the thermalized state. There are
three different admixtures of the Xd states which make this process possible (see
Figure 6.2). The first one is the state with the opposite spin projection of the
electron (|Sz + 1,−1/2,+3/2〉). It is mixed with the Xd state due to the e-
Mn exchange interaction. The second admixture, caused by the h-Mn exchange
interaction, consists of a light hole with a spin projection different by 1 from
the heavy hole of the Xd (|Sz + 1,+1/2,+1/2〉). The last admixed state, |Sz +
1,+1/2,−3/2〉, consists of a heavy hole with a spin projection different by 3
from the spin projection of the original state. This admixture is induced by two
interactions acting together: the heavy-light hole mixing, which mixes hole states
with spin projection different by 2, and by the h-Mn exchange interaction. A
direct experimental evidence for the presence of valence band mixing is provided
79

6. DARK EXCITONS
Figure 6.2: A schematic diagram of X admixtures in the Xd states and possiblechannels of optical transitions related to the Xd recombination.
by the anticrossing of the highest energy line of Xd and the lowest energy line of X
at a magnetic field ∼ 7 T (labelled “B” in Figure 6.1(b)). These lines correspond
to |+ 1.5,+1/2,+3/2〉 and |+ 2.5,+1/2,−3/2〉 states, respectively.
The radiative recombination related to the first two of these admixtures results
in the emission of a photon with σ+ polarization. The amplitudes of these admix-
tures depend only on the e-Mn and h-Mn exchange constants, i.e. on the overlap
of the Mn2+ ion and the carrier wave functions. In contrast, the recombination
related to the third admixture produces a σ− polarized photon. The amplitude of
this admixture depends not only on the X-Mn exchange interaction, but also on
the valence band mixing, which, similarly to the anisotropic exchange splitting,
results from the in-plane anisotropy of the quantum dot [86, 108, 112, 113]. The
role of this anisotropy in determining the polarization of the Xd lines is clearly
visible in our experiment. Figure 6.3 shows spectra of the two quantum dots
shown in Figure 6.1 for similar excitation conditions and magnetic field near the
anticrossing of the lines related to | − 2.5,−1/2,+3/2〉 and | − 2.5,+1/2,−3/2〉states (“A” in Figure 6.1(a-b)). In the Xd region the σ− polarized lines are much
more pronounced with respect to the σ+ polarized ones for a highly anisotropic
QD2.
80
6. DARK EXCITONS
Figure 6.3: Spectra of the two quantum dots shown in Fig. 6.1 taken underexcitation with σ− polarized light and with polarization resolved (σ+ or σ−)detection for magnetic fields near the anticrossing of lines corresponding to | −2.5,−1/2,+3/2〉 and | − 2.5,+1/2,−3/2〉 states (“A” in Fig 6.1(a-b)).
As a quantitative measure of the Xd oscillator strength for both circular po-
larizations we use the Xd/X intensity ratio. Since this ratio depends on the
excitation power [35], one should use identical excitation conditions to be able
to compare its value for different quantum dots. Experimentally, this is achieved
by choosing the same XX/X intensity ratio equal in our case to 1/3. The XX
intensity increases roughly quadratically with the excitation power, while the
X intensity follows linear power dependence [34, 114]. Thus, this ratio gives a
measure of the excitation efficiency.
A strong increase of the Xd/X intensity ratio in σ+ polarization with increas-
ing X-Mn exchange constant (calculated from the splitting of excitonic sextuplet)
is clearly visible in Figure 6.4(a). It confirms the origin of the first two recom-
bination channels described above. However, the Xd oscillator strength for σ−
polarization depends both on the X-Mn exchange interaction and the quantum
dot anisotropy. To elucidate the role of the anisotropy, we can use the circular
polarization of the Xd. Figure 6.4(b) shows that it evolves towards σ− as the
anisotropic exchange splitting increases. Therefore, we conclude that a high in-
81

6. DARK EXCITONS
Figure 6.4: (a) Xd/X intensity ratio in σ+ polarization vs. X-Mn exchange con-stant. (b) Degree of circular polarization of Xd spectrum vs. anisotropic exchangesplitting of the quantum dot. A value of −1 denotes pure σ− polarization, whilea value of +1 refers to pure σ+ polarization. Inset: The width of splitting be-tween the |+ 1.5,+1/2,+3/2〉 and |+ 2.5,+1/2,−3/2〉 lines (“B” in Fig. 6.1(b))calculated from the model vs. splitting between these lines determined directlyfrom the PL for those quantum dots for which it was possible.
plane anisotropy of the quantum dot leads to a strong mixing of light and heavy
holes, which combined with the presence of the Mn2+ ion is the reason for the
strong σ− polarization and high intensity of the Xd spectrum. It is important to
note that for non-magnetic quantum dots showing similar anisotropy [108] the
optical transitions of Xd are not observed, except in the presence of a strong
in-plane magnetic field.
A quantitative description of key features of the data in Fig. 6.1(a-b) is pro-
vided by a simple model with the initial state of the quantum dot after excitation
event given by the following Hamiltonian ([107, 108, 115, 116, 117, 118]),
82

6. DARK EXCITONS
H = gMnµB−→B .−→S + geµB
−→B .−→σ + ghµB
−→B .−→j − Ie
−→S .−→σ
− Ih−→S .−→j +
∑i=x,y,z
(aijiσi + bij
3i σi)− γj2z + β
(j2x − j2y
)(6.1)
where S, σ and j are the Mn2+, electron and hole spin operators, respectively, the
first three terms represent the Zeeman energy of the Mn2+ ion, the electron and
the hole, Ie and Ih are the e-Mn and h-Mn exchange interaction constants, ai and
bi are e-h spin-spin coupling constants, 2γ is the heavy-light hole splitting and
β represents the strength of the heavy-light hole mixing. The first term is also
the Hamiltonian of the final state of the system after the exciton recombination.
We also introduced an additional, phenomenological term related to the excitonic
diamagnetic shift to facilitate a comparison of the model and experimental data.
The energies of the optical transitions versus magnetic field, calculated using
this Hamiltonian for the two circular polarizations, are plotted in Figure 6.1(c)1.
The calculations clearly reproduce the key features of the experimental data
in Figure 6.1(a-b), such as for example the X-Mn exchange splitting and the
anisotropic exchange splitting. All parameters in the Hamiltonian (except for γ
assumed to be 15 meV [86]) can be extracted by fitting to the experimental data.
In particular, the heavy-light hole mixing can be estimated using the degree of
circular polarization of Xd lines. Such an approach permits an estimation of the
β parameter even for those quantum dots, for which the anticrossing between the
| + 1.5,+1/2,+3/2〉 and | + 2.5,+1/2,−3/2〉 lines (“B” in Figure 6.1(b)) is not
clearly visible. As shown in the inset of Figure 6.4(b) the obtained value of this
anticrossing remains in very good agreement with the value estimated directly
from the photoluminescence data. This confirms the proposed mechanism of Xd
brightening.
1Parameters used for calculation can be found in Appendix A
83

6. DARK EXCITONS
6.2 Mn2+ spin orientation by dark exciton re-
combination
As shown in section 6.1, multiple events of injection and recombination of σ−
polarized excitons in a single Mn-doped quantum dot induce the spin polarization
of the Mn2+ ion towards the states with positive spin projection. Since under σ−
polarized excitation the lower energy Xd branch is always visible for anisotropic
quantum dots and each recombination of such Xd involves an increase of the Mn2+
spin projection by 1, these recombinations can play the role of an effective Mn2+
spin orientation mechanism. In our experiment the Xd/X intensity ratio for a
highly anisotropic quantum dot was as high as 10%. This is comparable to the
probability of a spin-flip of the Mn2+ ion per one recombination of the X which
was estimated to be ∼5% in section 5.2.4. While this orientation mechanism
should be present for both circular polarizations of excitation, only the case of
σ− is fully seen. Under σ+ polarized excitation, which decreases the Mn2+ spin
projection [46], the high energy branch of Xd should be populated and the low
energy branch should be virtually invisible. The latter is, indeed, confirmed in
our experiment. However, it is not possible to observe directly the high energy
Xd branch, since it occurs in the same energy region as the much stronger X
lines.
84
Chapter 7
Spin relaxation
As described in chapter 1 many features of the spin dynamics, particularly of the
spin relaxation of a system of magnetic ions in a semiconductor crystal are well
understood. There are still, however, several aspects that remain little investi-
gated. In this chapter, I will present results of new experiments concerning two
important fields.
In section 7.1, I describe the investigation of the spin relaxation of a single
magnetic spin caused by spin-lattice interaction in low and high magnetic field.
Although this kind of interaction have been studied intensively in Cd1−xMnxTe
material, all of these studies were performed on quantum wells or bulk mate-
rial, where the magnetic system under investigation consist of a large number of
magnetic ions. The ability to grow CdTe quantum dots with single Mn2+ ion,
along with the ability to optically control the spin state of this ion, described in
section 5.2, gave the unique possibility to analyze the spin-lattice relaxation of
the magnetic ion unperturbed by the spin-spin interaction.
Section 7.2 presents results of the new experiment on spin relaxation per-
formed on diluted magnetic quantum wells and quantum dots with number of
magnetic ions much larger than one. The unique in these measurements are the
conditions of the experiment. The new experimental technique described in chap-
ter 4 for the first time allowed detailed investigation of the spin dynamics in zero
magnetic field with temporal resolution down to a few nanoseconds.
85

7. SPIN RELAXATION
7.1 Single isolated spin
A disadvantage of using systems containing a large ensemble of magnetic ions
for investigation of the spin-lattice relaxation is that in such system there is
always not negligible interaction between neighbouring ions. Due to this fact one
should always consider the spin-spin interaction as leading to one of the relaxation
channels. This makes the picture more complicated and obstructs analysis of the
SLR.
Among many advantages of the single quantum dot with single magnetic ion,
the great distance to any other magnetic atom is particularly useful in investiga-
tion of the spin-lattice relaxation. The mean distance between quantum dots in
the sample used in the experiment is of order of 100 nm (see section 2.3). The
magnetic ions are present only in the quantum dots material and are embedded in
roughly 1% of the dots, which give the mean distance between the ions of order of
1 µm. This distance, orders of magnitude bigger than in the DMS bulk material
or quantum well system, lets us consider the magnetic ion in the quantum dot as
truly isolated spin. Thus the only mechanism which can lead to its relaxation is
the spin-lattice relaxation.
In this section, I present detailed studies of the spin-lattice relaxation of the
single Mn2+ ion performed in low and high magnetic field. The spin-lattice re-
laxation time was determined in two independent experiments. Section 7.1.1
describes the first one, in which we measured the efficiency of the optical orien-
tation of the Mn2+ ion [46] as function of excitation power and magnetic field.
This approach is relatively simple and fast, however needs additional assumptions
and gives results with limited accuracy. In the second, time-resolved experiment,
described in section 7.1.2, we measured directly the Mn2+ spin relaxation time.
This gives much more precise results. It is, however, more complicated and time
consuming.
86

7. SPIN RELAXATION
7.1.1 Efficiency of the optical orientation of the magnetic
ion
The steady state of the Mn2+ spin in the quantum dot upon circularly polarized
excitation is determined by two processes: the optical orientation of the Mn2+
spin by spin-polarized excitons injected into the quantum dot and thermalization
of the magnetic ion in external magnetic field caused by spin-lattice relaxation.
Given that the excitation is σ− polarized, these two processes are competitive:
interaction with polarized excitons rotates the spin of the Mn2+ ion towards
states with positive spin projection (see section 5.2), while for the thermalized
system the most occupied state is the one with the spin projection equal to
−5/2. This competition results in different spin polarization of the Mn2+ ion,
depending on the ratio between rates of the two processes. This ratio can be easily
changed by changing the excitation power, i.e. changing the exciton injection rate
into the quantum dot. Knowing this rate for a given excitation power and the
corresponding steady state of the Mn2+ ion one can determine the SLR rate.
One of the simplest quantitative measures of the optical spin orientation effi-
ciency is determination of the mean spin projection value of the Mn2+ ion (〈Sz〉).As described in section 1.3.2, the relative intensities of the six components of the
excitonic spectrum of the singly-Mn doped quantum dot gives the occupation of
the six spin states of the Mn2+ ion. Therefore the value of the 〈Sz〉 can be easily
determined from the excitonic spectrum of the dot by using following formula:
〈Sz〉 =
5/2∑i=−5/2
iIi
5/2∑i=−5/2
Ii
(7.1)
where Ii is the integrated intensity of excitonic line corresponding to the Mn2+
state with spin projection equal to i. Representative spectra taken under excita-
tion with different power, together with the value of 〈Sz〉, are shown in Figure 7.1.
The spectra are normalized so that the intensities integrated over the 6 exciton
lines are the same.
87
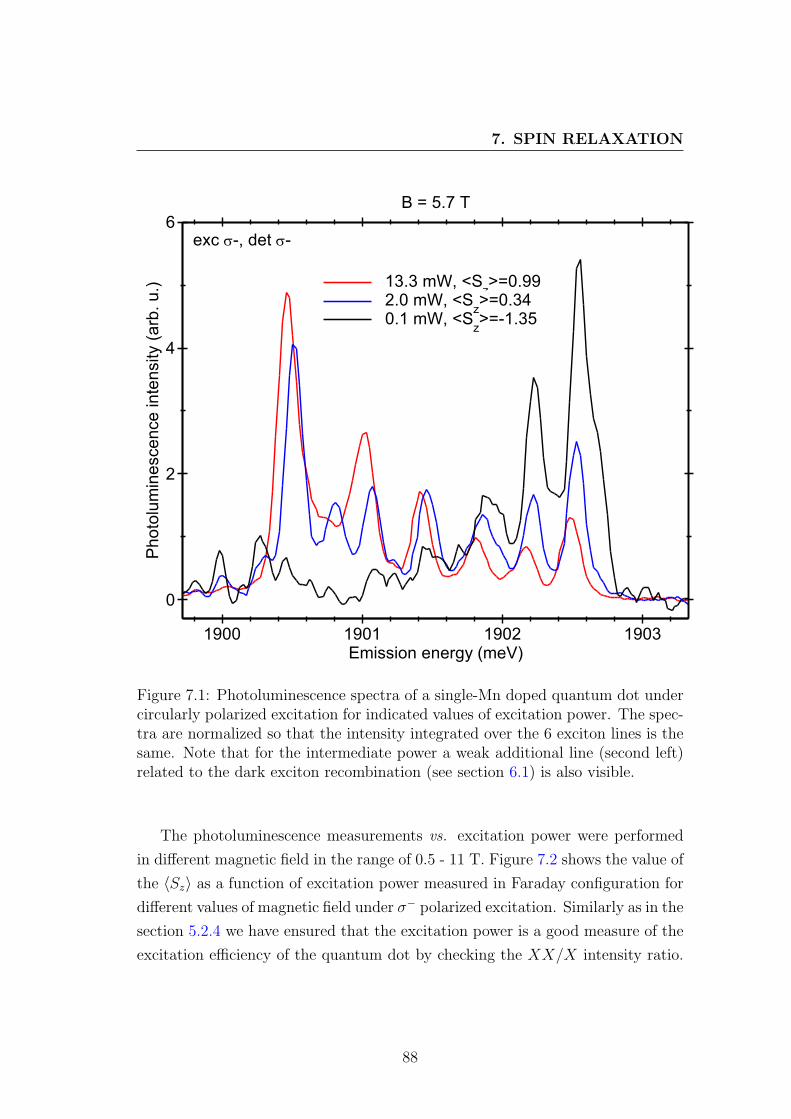
7. SPIN RELAXATION
0
2
4
6
1900 1901 1902 1903
13.3 mW, <Sz>=0.99
2.0 mW, <Sz>=0.34
0.1 mW, <Sz>=-1.35
exc -, det -
Emission energy (meV)
Ph
oto
lum
ine
sce
nce
in
ten
sity (
arb
. u
.)
B = 5.7 T
Figure 7.1: Photoluminescence spectra of a single-Mn doped quantum dot undercircularly polarized excitation for indicated values of excitation power. The spec-tra are normalized so that the intensity integrated over the 6 exciton lines is thesame. Note that for the intermediate power a weak additional line (second left)related to the dark exciton recombination (see section 6.1) is also visible.
The photoluminescence measurements vs. excitation power were performed
in different magnetic field in the range of 0.5 - 11 T. Figure 7.2 shows the value of
the 〈Sz〉 as a function of excitation power measured in Faraday configuration for
different values of magnetic field under σ− polarized excitation. Similarly as in the
section 5.2.4 we have ensured that the excitation power is a good measure of the
excitation efficiency of the quantum dot by checking the XX/X intensity ratio.
88

7. SPIN RELAXATION
As the excitation power approaches zero, the distribution of the occupation of
the Mn2+ six spin states approaches the one given by the Boltzmann distribution
for a given temperature and magnetic field. Thus the 〈Sz〉 converges to specific
negative value, different for different values of magnetic field. For the limit of
high excitation power, when the exciton injection rate into the quantum dot is
higher than the spin-lattice relaxation rate, the occupation distribution between
the Mn2+ spin states is governed mainly by the ratio between the probability of
arrival of the σ− and σ+ polarized excitons. As described in section 5.2.3 the σ−
polarized excitation orients the Mn2+ ion against the magnetic field. Therefore
the 〈Sz〉 approaches a positive value, independent on the magnetic field. The
maximum excitation power used in this experiment was low enough to neglect
the influence of creating higher excitonic states (e.g. biexcitons) on the Mn2+
spin orientation (see section 5.2.3).
The simplest observation enabling the estimation of the spin-lattice relaxation
rate is following: when the optical orientation exactly compensates the thermal-
ization, i.e. the spin orientation rate is exactly equal to the relaxation rate, then
the Mn2+ ion is completely depolarized (the 〈Sz〉 is equal to 0). Thus the spin
orientation rate can be estimated using the exciton injection rate to the quan-
tum dot and probability of the Mn2+ spin flip per one exciton measured in the
experiment described in section 5.2.4. This approach, however, is useful for a
limited range of the values of the SLR rate. When the relaxation is too slow one
should use extremely low excitation power to reach above-mentioned condition,
too low to be able to collect the quantum dot photoluminescence spectrum with
acceptable signal quality in a reasonable time. On the other hand, when the SLR
rate is too high it is impossible to inject the excitons into the quantum dot with
sufficient rate because of the finite exciton lifetime. If the mean time between the
excitons injection is shorter than the excitonic lifetime, then the biexcitons are
created, which leads to suppression of the optical orientation of the Mn2+ ion (see
section 5.2.2). Therefore, to extend the range of the SLR rates we introduce a
rate equation model describing transitions between the Mn2+ spin states caused
by the processes under consideration. Then we extract the SLR rate from the
dependence of the 〈Sz〉 on the excitation power even for such conditions for which
complete depolarization of the Mn2+ ion (〈Sz〉 = 0) is impossible to obtain.
89

7. SPIN RELAXATION
Figure 7.2: The mean value of the spin projection 〈Sz〉 of the single Mn2+ ion inthe quantum dot measured vs. excitation power for indicated values of magneticfield (symbols) compared with the model described in text (solid lines).
The model introduced here takes into account two types of transitions of the
Mn2+ spin. The first one is caused by the spin-lattice relaxation. The probability
of transfer of any Mn2+ state, characterized by its quantum number m, to a state
with m different by 1, is reciprocally proportional to the relaxation time τSLRand dependent on the Boltzmann factor P = e
gMnµBB
kBT . The rate equation for the
occupation qm of each Mn spin state is following:
dqm/dt = pSLR (qm−1P + qm+1P−1 − qm(P + P−1)) (7.2)
90

7. SPIN RELAXATION
(with a suitable cut-off for |m| = 5/2), where pSLR = 1τSLR
. The solution of such
system of equations is the Boltzmann distribution of occupation of the Mn2+
states. As a consequence, the value of the 〈Sz〉 is given by the Brillouin function
(formula 1.2).
The second type of transitions was already discussed in section 5.2.3. The
transitions occur with a fixed probability p0 during the presence of a suitably
polarized exciton in the quantum dot. By combining equations 5.2 and 7.2 one
obtains:
dqm/dt = qm−1(p0ϕX−1 + pSLRP ) + qm+1(p0ϕX+1 + pSLRP−1)
−qm(p0ϕX−1 + p0ϕX−1 + pSLR(P + P−1))(7.3)
where ϕX±1 are frequencies of arriving of excitons into the quantum dot. Terms
from equation 5.2 related to biexciton formation have been skipped because - as
mentioned above - the influence of higher excitonic states can be neglected due to
low excitation power. By numerically solving this system of equations it is pos-
sible to calculate the qm and consequently the 〈Sz〉. Thus it is possible to fit this
quantity to the experimental data using following variables as free parameters: T
which gives the limit of the 〈Sz〉 for an excitation power approaching zero and a
given magnetic field; the ϕX+1/ϕX−1 ratio which determines the maximum value
of the 〈Sz〉 for the high excitation power limit; τSLR which determines the zero-
cross point on the dependence of the 〈Sz〉 on the excitation power. Additionally
one needs two quantities which were already measured in previously described
experiments: the overall frequency of exciton injection into the quantum dot
(ϕX+1+ϕX−1) and the probability p0. As described in section 5.2.4, the former
one can be determined using the XX/X intensity ratio and the excitonic lifetime
in the quantum dot. The latter one was measured in the experiment presented
in section 5.2.4 and is typically equal to 5%.
As can be seen on Figure 7.2 such model fits to the experiment with very
good agreement. It is important to note that for different values of magnetic
field only the value of the τSLR is different, while the temperature T and the
ϕX+1/ϕX−1 are common. T is equal to about 13 K which stays in agreement
within experimental accuracy with the value estimated using calibrated resistor
91

7. SPIN RELAXATION
Figure 7.3: Spin-lattice relaxation rate of a single Mn2+ ion in the quantum dotas a function of magnetic field, measured for several dots.
placed close to the sample. The value of ϕX+1/ϕX−1 is 0.64, very close to the
value obtained in different experiment (0.65 - see section 5.2.2).
Figure 7.3 shows the dependence of the spin-lattice relaxation rate on the
magnetic field determined using the method described above. The relaxation
rate of the single Mn2+ ion in the QD for low magnetic field (around 1 T) is
of order of 104 − 105 s−1. It is strongly increasing with the magnetic field and
reaches more than 107 s−1 at 11 T. It is, however, necessary to note that these
extreme values for lowest and highest magnetic field are only lower and upper
bound, respectively, due to limitations of this experimental technique.
92
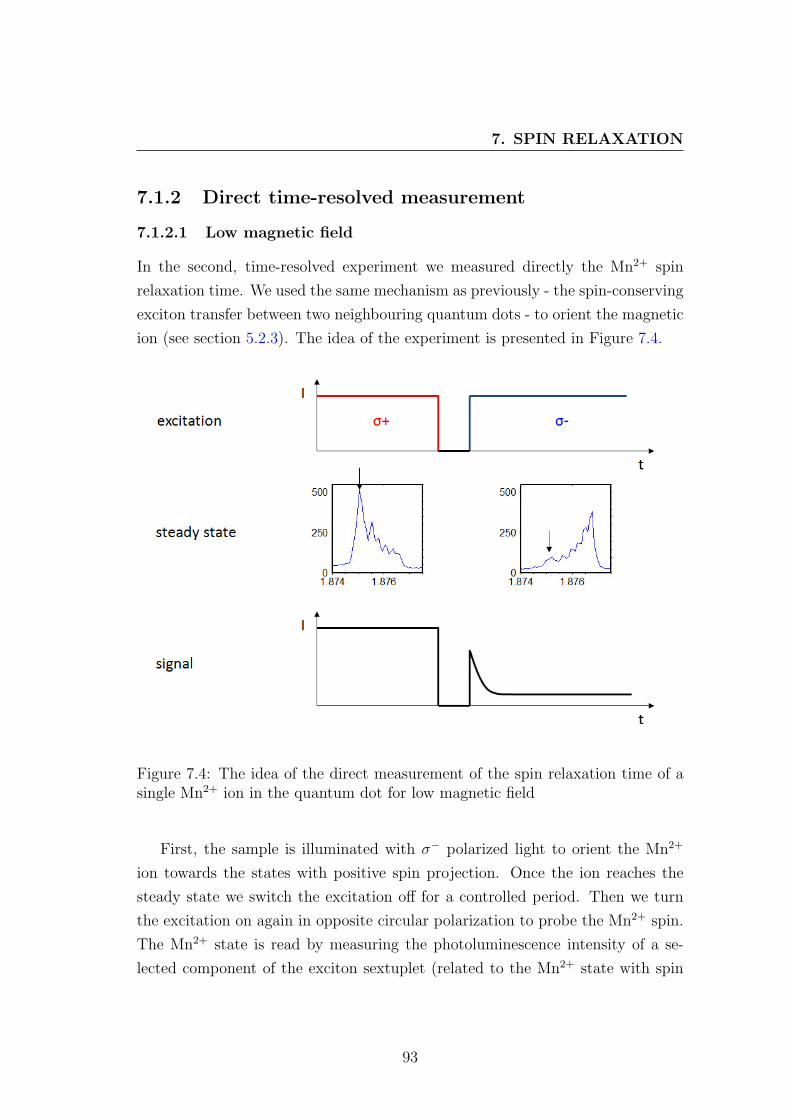
7. SPIN RELAXATION
7.1.2 Direct time-resolved measurement
7.1.2.1 Low magnetic field
In the second, time-resolved experiment we measured directly the Mn2+ spin
relaxation time. We used the same mechanism as previously - the spin-conserving
exciton transfer between two neighbouring quantum dots - to orient the magnetic
ion (see section 5.2.3). The idea of the experiment is presented in Figure 7.4.
Figure 7.4: The idea of the direct measurement of the spin relaxation time of asingle Mn2+ ion in the quantum dot for low magnetic field
First, the sample is illuminated with σ− polarized light to orient the Mn2+
ion towards the states with positive spin projection. Once the ion reaches the
steady state we switch the excitation off for a controlled period. Then we turn
the excitation on again in opposite circular polarization to probe the Mn2+ spin.
The Mn2+ state is read by measuring the photoluminescence intensity of a se-
lected component of the exciton sextuplet (related to the Mn2+ state with spin
93

7. SPIN RELAXATION
projection equal to +5/2) in a given circular polarization. Its evolution reflects
the orientation of the Mn2+ spin combined with the exciton optical orientation.
During the first part of the excitation cycle (σ− polarized excitation) we observe
strong signal, indicating high occupation of the +5/2 state of the Mn2+ ion. When
the excitation is switched off, the photoluminescence signal vanishes and remains
zero as long as the excitation is off. When subsequently a σ+ polarized excitation
is turned on, the photoluminescence intensity first rises rapidly to an initial value
determined by the Mn2+ spin state and the efficiency of the exciton polarization
transfer. If the Mn2+ orientation is conserved, this value is given only by the
exciton polarization transfer and should be equal to about 65% of the previous
value. Any loss of the Mn2+ spin orientation would decrease this value. After
the initial rapid increase, the photoluminescence intensity slowly decreases. This
decrease is related to the reorientation of the Mn2+ spin by circularly polarized
light.
Figure 7.5 shows an example of the temporal profile of the photoluminescence
signal measured in σ− polarization at B=1 T for relatively short dark period. It
is clearly visible that the Mn2+ spin state immediately after the dark period is
very close to that aligned by the light. The initial value of the photoluminescence
intensity is presented versus delay in Figure 7.6. Its decrease allows us to roughly
estimate the Mn2+ spin relaxation time in darkness to be about 0.4 ms.
7.1.2.2 High magnetic field
The method for investigating the spin-lattice relaxation time described in sec-
tion 7.1.2.1 needs to be modified when used in magnetic field stronger than about
1 T. This is due to the Zeeman splitting of the excitonic ground level in the absorb-
ing quantum dot. The splitting makes the change of circular polarization of the
resonant excitation impossible without changing the excitation energy. Therefore
we simplified the excitation scheme by skipping the polarization modulation and
using only the intensity switching. The idea of such experiment is explained in
Figure 7.7. First we illuminate the sample with σ− polarized light, which causes
polarization of the Mn2+ ion against the magnetic field. Then the excitation is
switched off for a controlled delay and switched on again in the same circular po-
94

7. SPIN RELAXATION
0
0.5
1.0
0 500 1000 1500 2000
exc 6W
time (ns)
PL
in
ten
sity (
arb
.u.)
T=1.5K, B=1T
Energy
Figure 7.5: Temporal profile of the photoluminescence intensity at one of the sixcomponents of the exciton spectrum (indicated in inset) during the excitationsequence described in text for B=1 T with excitation power equal to 6 µW.The horizontal arrow indicates the ratio between photoluminescence intensitymeasured in co-polarization and cross-polarization setup.
larization. Similarly to the low magnetic field case, the Mn2+ state is monitored
by measuring the intensity of a selected component of the exciton photolumines-
cence spectrum. It is the component related to the most occupied Mn2+ state
under σ− polarized excitation. If the Mn2+ orientation remains unchanged during
the dark period, the observed intensity immediately rises to the same value as it
was before, after switching the excitation on. If, however, there is non-negligible
Mn2+ spin relaxation, the intensity of the observed component rises to a lower
value. Subsequently, a relatively slow increase of the intensity is observed. It is
related to the Mn2+ spin orientation by polarized carriers. If this increase is slow
enough it is possible to determine the initial intensity with a good precision.
95

7. SPIN RELAXATION
0.8
0.9
1.0
0 100 200
= 0.4 ms
Dark Period (s)
No
rma
lize
d P
ea
k A
mp
liud
e
Figure 7.6: Initial photoluminescence intensity after turning the excitation on inσ− polarization versus length of dark period.
t
I
σ- excitation
stationary state
observed signal
I
0
250
500
1.874 1.876
σ-
0
250
500
1.874 1.876
t
Figure 7.7: The idea of the direct measurement of the spin relaxation time of asingle Mn2+ ion in the quantum dot for high magnetic field
96

7. SPIN RELAXATION
Figure 7.8: Temporal profile of the photoluminescence intensity of one of the sixcomponents of the exciton spectrum (indicated in inset) during the excitationsequence described in text for B=5.7 T and indicated values of the length of thedark period.
By varying the length of the dark period in the range of 20 ns-500 µs, we
were able to measure the broad spectrum of relaxation times and, consequently,
its dependence on the magnetic field in a wide range of fields.
Figure 7.8a shows example temporal profiles of the intensity of the observed
photoluminescence line at magnetic field equal to 5.7 T for various length of the
dark period. As demonstrated in Figure 7.8b the initial intensity after switching
the excitation on decreases exponentially with the length of the dark period. This
allows easy calculation of the spin-lattice relaxation time.
Such experiment was repeated for various values of magnetic field in the range
of 0.5 - 11 T. Figure 7.9 shows the dependence of the spin-lattice relaxation rate
on the magnetic field determined using the method described in this section
together with data measured in the indirect method described in section 7.1.1
and in the former experiments on bulk diluted Cd1−xMnxTe material [71]. It
is clearly visible that two presented methods for the quantum dots, the direct
and the indirect one, gave results which agree within experimental accuracy.
97

7. SPIN RELAXATION
104
105
106
107
108
0.1 1 10
QD1QD2QD3QD4 QD1 Strutz et al., Cd
(1-x)Mn
xTe, x=0.01
Strutz et al., Cd(1-x)
MnxTe, x=0.002
Previous experiments on bulk material:
Direct measurement:
Power dependence:
Magnetic field (T)
Re
laxa
tio
n r
ate
(s
-1)
Figure 7.9: Spin-lattice relaxation rate of a single Mn2+ ion in the quantum dotas a function of magnetic field, measured for several dots (colour points) usingtwo different methods described in text in comparison with the relaxation ratemeasured in diluted Cd1−xMnxTe bulk material (black points).
However, the direct method allows us to measure the spin relaxation time with
greater accuracy. Moreover, the wider range of available time-scales enables the
investigation of the spin relaxation in a wider range of magnetic field.
The relaxation rate of the single Mn2+ ion in the quantum dot for low magnetic
field (around 1 T) is of order of 104 s−1, slightly lower than in bulk material at
4.2 K. It is, however, increasing rapidly with the magnetic field and reaches
almost 108 s−1 at 11 T. This is over two orders of magnitude higher than the
value measured for bulk Cd1−xMnxTe.
The vast difference of the spin-lattice relaxation rate measured in present
experiments and the previous one [71] may be partially explained by the different
temperature: the quantum dots with single Mn2+ ions were investigated at about
98
7. SPIN RELAXATION
13 K, while the experiment with the bulk material was performed at 4.2 K. At
the same time it is well known that the spin-lattice relaxation strongly increases
with the temperature [63, 67]. However, the difference at low field cannot be
explained this way. This, however, does not explain the fact that for low magnetic
field the relaxation rate in quantum dots is actually slightly lower than in bulk
Cd1−xMnxTe. Possible origins of this difference include strain fields, usually high
in structures containing quantum dots. Confirmation of this hypothesis requires
further studies and is beyond the scope of this work.
7.2 System of coupled spins
As mentioned in chapter 1, a great majority of previous studies of spin dynamics
of a large system of Mn2+ ions in Cd1−xMnxTe material was performed in the
presence of a magnetic field. Under such conditions, the relaxation of the trans-
verse component of magnetization is an adiabatic process, which was ascribed
to anisotropic spin-spin interactions [119]. It is fast, and accelerates with the
Mn content. The relaxation of the longitudinal component involves a transfer
of the Zeeman energy to the lattice (spin-lattice relaxation). For isolated Mn2+
ions, this is a slow process, due to the absence of spin-orbit coupling within the
orbital singlet which forms the ground state. In DMSs, the spin-lattice relax-
ation rate increases with the Mn content, as a result of a fast transfer via the
Mn spins towards “killer centres”, in particular Mn clusters [66, 67] which sta-
tistically exist within the random Mn distribution. For compositions where both
have been measured, the spin-spin time is faster than the spin-lattice relaxation
time, by 2 to 3 orders of magnitude [120] (see Fig. 7.11). The general picture
that emerges, is that fast processes are expected in a DMS with relatively high
Mn content, while strongly diluted or isolated Mn2+ spins should exhibit long
relaxation times. More recently, the role of free carriers has been stressed: they
form an efficient channel to transfer the Mn Zeeman energy to the lattice [73].
Since the most promising possible applications of DMS involve information
storage and processing in spintronics, a better knowledge of the magnetization or
spin dynamics is needed, particularly in the absence of an applied magnetic field.
In Ref. [70], the magnetization of a bulk Cd1−xMnxTe sample, in the presence
99

7. SPIN RELAXATION
of a static field, was changed by the collinear AC field of a coil, and monitored
by Faraday rotation. The spin-lattice relaxation time was clearly identified and
exhibits a dramatic decrease at low field. In principle, this method can be used
down to zero field but the frequency response of the set-up was limited to a
few microseconds, so that the static field had to be kept above a few tenths
of Tesla. By contrast, T2 slowly increases when decreasing the applied field in
Zn0.9Mn0.1Se [72] or Cd1−xMnxTe [75].
In this section, I describe the magnetization dynamics in Cd1−xMnxTe quan-
tum wells and quantum dots with similar, low Mn content. In case of quantum
dots, the nominal density of Mn2+ in the CdTe material results in an average
number of magnetic ions in each dot equal to a few tens. A new experimental
technique of short magnetic pulses created by a small coil is used. As described
in chapter 4 this technique allows investigation of the Mn spin relaxation down
to zero magnetic field and with a temporal resolution of a few nanoseconds.
7.2.1 Diluted magnetic quantum wells
The magnetization relaxation of quantum wells with Mn content in the range
0.2% - 1.5% was measured using the technique described in chapter 4. Figure 7.10
shows an example of the temporal evolution of the magnetization as extracted
from the photoluminescence signal observed for sample with 0.8% of Mn after
the pulse of magnetic field and without applied external static field. The time
t=0 on the plot denotes the moment when the pulse is finished. The shape of the
current pulse (dotted line), as recorded by an oscilloscope measuring the voltage
across a 50 Ω resistor terminating the current line, was convoluted with different
possible decay functions and compared to the experimental signal (points) (see
section 4.6). We found that a bi-exponential decay was sufficient to describe the
magnetization relaxation in the absence of magnetic field with very good accuracy.
The characteristic time of the fast component of this decay was of order of 10 ns,
and it is measurably longer than the experimental resolution (≈7 ns). The long
component is relatively weak and its characteristic time is equal to a few hundreds
of nanoseconds. Figure 7.11 presents a comparison of the fast decay rate (blue
symbols) with the spin-lattice relaxation rate measured previously in magnetic
100

7. SPIN RELAXATION
0
0.5
1.0
0 25 50 75
magnetizationmagnetic fieldModel:
xy=0
xy
=4x10⁻³
time (ns)
Sig
na
l (a
rb.
u.)
Figure 7.10: Magnetization dynamics of a Cd1−xMnxTe quantum well with 0.8%of Mn at B = 0 after the pulse of magnetic field (symbols), coil current (dottedline), and the result of calculations (solid and dashed lines) described in the text.
field in materials with comparable Mn content [70, 71]. The rate observed in
the absence of magnetic field is higher than the values obtained in magnetic field
by about three orders of magnitude. It shows almost no dependence on the Mn
content, as expected for isolated Mn ions.
The fast zero-field decay may be caused by many different interactions: the
hyperfine interaction with the nuclear spin of the Mn2+ ion, the superhyperfine
interaction with the nuclear spin of neighbour Cd atoms, dipolar interaction with
nuclear or electronic spins of other Mn2+ ions, the single ion anisotropy due to
the cubic crystal field and strain in the epitaxial structure, fluctuations in the
interaction with carriers, etc.
It is well known, from EPR spectroscopy of Mn diluted in CdTe bulk material
[63] and CdTe- and ZnTe-MnTe super lattices [121, 122], that the Mn2+ electronic
101
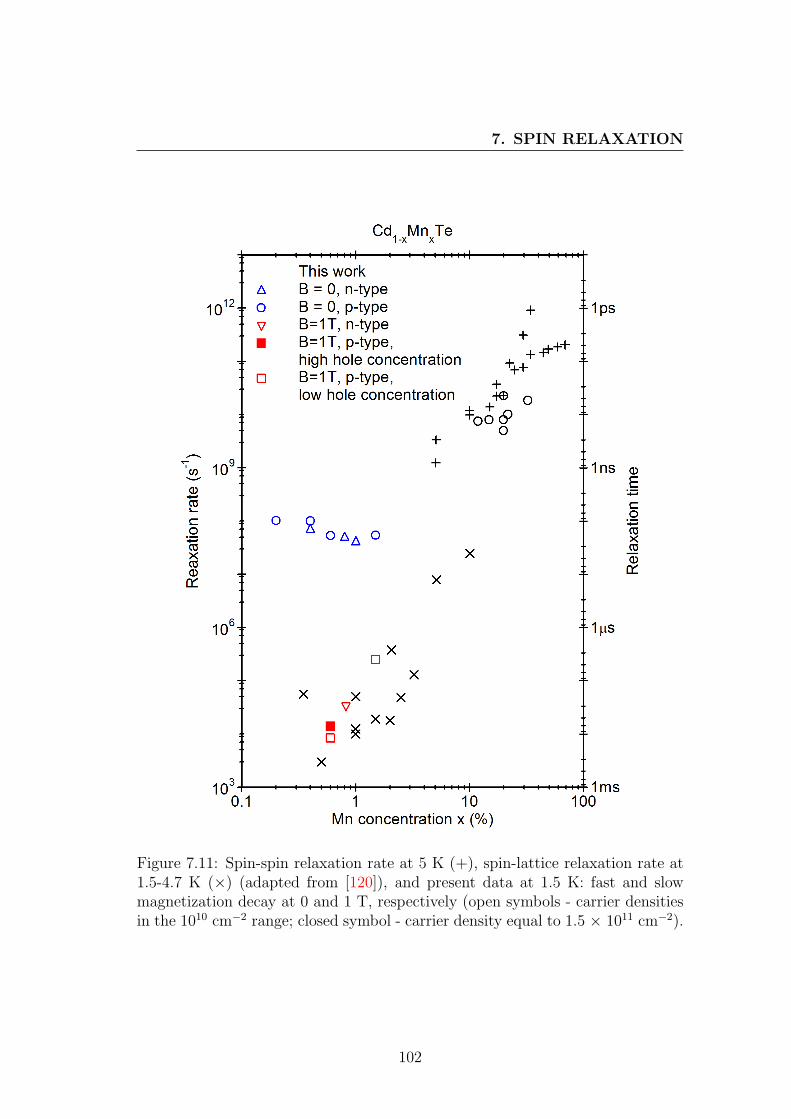
7. SPIN RELAXATION
Figure 7.11: Spin-spin relaxation rate at 5 K (+), spin-lattice relaxation rate at1.5-4.7 K (×) (adapted from [120]), and present data at 1.5 K: fast and slowmagnetization decay at 0 and 1 T, respectively (open symbols - carrier densitiesin the 1010 cm−2 range; closed symbol - carrier density equal to 1.5 × 1011 cm−2).
102
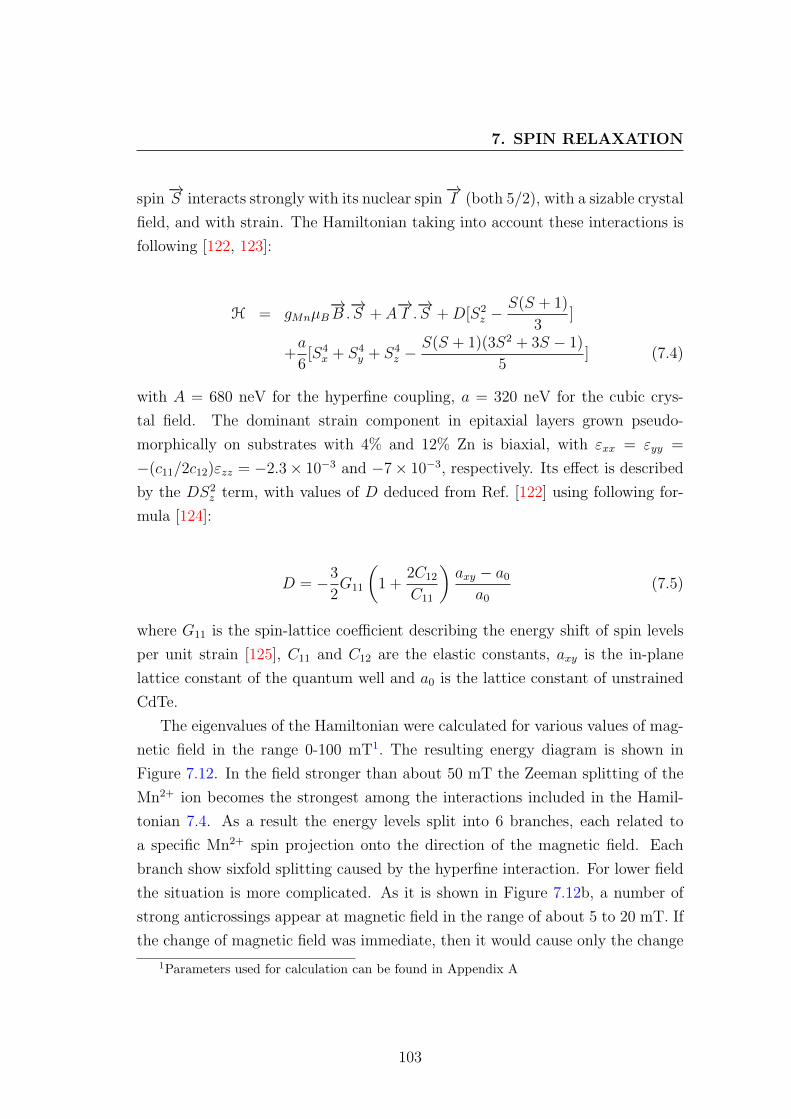
7. SPIN RELAXATION
spin−→S interacts strongly with its nuclear spin
−→I (both 5/2), with a sizable crystal
field, and with strain. The Hamiltonian taking into account these interactions is
following [122, 123]:
H = gMnµB−→B .−→S + A
−→I .−→S +D[S2
z −S(S + 1)
3]
+a
6[S4x + S4
y + S4z −
S(S + 1)(3S2 + 3S − 1)
5] (7.4)
with A = 680 neV for the hyperfine coupling, a = 320 neV for the cubic crys-
tal field. The dominant strain component in epitaxial layers grown pseudo-
morphically on substrates with 4% and 12% Zn is biaxial, with εxx = εyy =
−(c11/2c12)εzz = −2.3× 10⁻³ and −7× 10⁻³, respectively. Its effect is described
by the DS2z term, with values of D deduced from Ref. [122] using following for-
mula [124]:
D = −3
2G11
(1 +
2C12
C11
)axy − a0
a0(7.5)
where G11 is the spin-lattice coefficient describing the energy shift of spin levels
per unit strain [125], C11 and C12 are the elastic constants, axy is the in-plane
lattice constant of the quantum well and a0 is the lattice constant of unstrained
CdTe.
The eigenvalues of the Hamiltonian were calculated for various values of mag-
netic field in the range 0-100 mT1. The resulting energy diagram is shown in
Figure 7.12. In the field stronger than about 50 mT the Zeeman splitting of the
Mn2+ ion becomes the strongest among the interactions included in the Hamil-
tonian 7.4. As a result the energy levels split into 6 branches, each related to
a specific Mn2+ spin projection onto the direction of the magnetic field. Each
branch show sixfold splitting caused by the hyperfine interaction. For lower field
the situation is more complicated. As it is shown in Figure 7.12b, a number of
strong anticrossings appear at magnetic field in the range of about 5 to 20 mT. If
the change of magnetic field was immediate, then it would cause only the change1Parameters used for calculation can be found in Appendix A
103

7. SPIN RELAXATION
1
2
3
4
0.005 0.010 0.015 0.020B (T)
-30
-15
0
15
30
0 0.05 0.10B (T)
En
erg
y le
ve
ls (e
V)
(b)
(a)
(b)
Figure 7.12: Energy levels of a Mn2+ ion in a CdTe crystal taking into accountthe hyperfine coupling, cubic crystal field and mismatch strain.
in the Zeeman energy of all the levels. However, if we sweep down the magnetic
field with finite speed, than at the end of the pulse we will obtain also the change
of the occupation of these levels. The evolution of the magnetization can be
viewed as a series of transitions between different states caused by the coherent
oscillations, which occur every time the coupling between these states becomes
significant (i.e. close to the anticrossing on the energy diagram).
The magnetization evolution can be calculated numerically using the density
matrix formalism. The spin state of ensemble of magnetic moments is represented
by the matrix ρ. Its initial value ρ0 is given by a thermalized system:
104
7. SPIN RELAXATION
ρ0 =∑j
pj|Ψj〉〈Ψj| (7.6)
where |Ψj〉 is a pure jth eigenstate of the Hamiltonian 7.4 at t=0 and pj is the
probability (given by the Boltzmann distribution) that a single ion is in the Ψj
state. The evolution of the system is given by the von Neumann equation:
i~∂ρ
∂t= [H, ρ] (7.7)
where the brackets denote a commutator. If H was a time-independent Hamilto-
nian, the solution would be:
ρ(t) = e−iHt/~ρ0eiHt/~ (7.8)
Since the Hamiltonian evolves (as the magnetic field change), we consider
small time intervals δt and assume that during each interval H is constant. In
order to model a realistic case, the temporal profile of the magnetic field used in
the calculation is taken from the experiment.
As shown by the dashed line in Figure 7.10, such calculation of the magnetiza-
tion evolution using Hamiltonian 7.4 with no additional effect of the environment,
well describes the first fast drop in the experimental data. However, as it is clearly
visible in Figure 7.10, there is still some persistent magnetization, which remains
after this first fast drop of the calculated curve. This is easy to understand, as
the hyperfine coupling has non-zero matrix elements only between states with
∆Sz = ±1. Therefore several levels show no anticrossing, and the spin states
remain eigenstates when varying the magnetic field.
In order to reproduce the experimental data, which do not show strong re-
maining magnetization, we introduce additional mechanisms which mix states
with different values of Sz. Within the single Mn2+ system, this is simulated
when considering strain components which are anisotropic within the quantum
105
7. SPIN RELAXATION
well plane. For instance, the effect of a strain εxy = 4 × 10⁻³, calculated using
Ref. [125, 126], is shown in Fig. 7.10 as a solid line. It shows a good agreement
with the experimental data. Such a strain in a quantum well could be caused
by local fluctuations or dislocations, but its estimated value is surprisingly large:
x-ray diffraction data gives a 4 times smaller estimate for similar structures [127].
This suggests that mechanisms related to the environment of the Mn2+ impurity
should be considered.
Note also that even for the best fit, the calculated evolution leaves a small
but non-zero persistent magnetization. The experimental data in Figures 7.10
and 7.13 (B = 0) shows indeed such a long-time component, which decays with
characteristic times equal to about 500 ns in case of the sample with 0.8% of Mn.
This decay time slightly varies from sample to sample, but always remains in the
sub-µs range.
A dramatic change in the magnetization relaxation was observed after apply-
ing a static magnetic field, additional to the pulsed one created with the coil. The
example results are shown in Fig. 7.13. The slow component becomes dominant
at about B=0.3 T while its characteristic time slightly increases. At field as high
as 1.0 T the fast components are not visible at all and the decay can be described
with monoexponential curve with characteristic time in the range of tens of mi-
croseconds. The values of this characteristic time are in good agreement with
previous data of spin-lattice relaxation in Cd1−xMnxTe [70, 71]. Furthermore the
well known increase of relaxation rate with Mn content is clearly seen (see Figure
7.11).
This result can be understood along the lines developed by Scalbert et al. [70].
The magnetization relaxation in zero magnetic field does not require any transfer
of energy1, however upon applying magnetic field all fast adiabatic processes are
suppressed and a spin-lattice relaxation becomes dominant.
In order to verify the role of the intrinsic background carriers in the quan-
tum well in the relaxation process we performed measurements on samples with
different density of the hole gas. We found that in significant magnetic field the
1For that reason the magnetization decay in the absence of magnetic field should be called“coherent evolution”, rather than “relaxation”. However, for simplicity in this work we referto all magnetization decay processes as “relaxation”.
106

7. SPIN RELAXATION
0.01
0.1
1
0 500 1000
1 T
0.3 T
0.02 T
0 T
time (ns)
Ma
gn
etiza
tio
n (
arb
. u
.)
Figure 7.13: Magnetization dynamics of a Cd1−xMnxTe quantum well with 0.8%of Mn at different values of magnetic field.
hole gas can play role of an additional relaxation channel. This is easily seen in
Figure 7.14, where the decay is faster for a larger hole density (which can be con-
trolled by additional illumination - see section 2.2), in agreement with Ref. [69].
An opposite influence of hole gas on the magnetization dynamics is observed
in zero magnetic field. Figure 7.15 shows the comparison between magnetization
relaxation measured for n-type and p-type samples with the same Mn content.
In the case of the p-type sample the slow component of the relaxation is much
more pronounced. We ascribe this effect to the anisotropy introduced by hole
gas. As mentioned in section 1.1.1, these are heavy holes with projections ±3/2
of their moment along the growth direction. Due to the strong exchange coupling
between holes and Mn2+ spins, the ±5/2 doublet of the Mn2+ spin (with the
proper orientation of the holes) forms the ground state, while the ±3/2 and ±1/2
ones are at higher energy. A polarized hole gas of density in the 1011 cm−2 range
107

7. SPIN RELAXATION
0.1
0.2
0.5
1
0 50 100
p-type, high hole concentration
p-type, low hole concentration
Time (s)
Ma
gn
etiza
tio
n (
arb
. u
.)T = 1.5 K B = 1T
Figure 7.14: Magnetization dynamics of a p-type Cd1−xMnxTe quantum wellwith 0.8% of Mn and different hole gas concentration at B = 1 T. The highconcentration is equal to 1.5 × 1011 cm−2, the low one is of order of 1010 cm−2.
induces an exchange field of the order of 0.1 T, i.e., a splitting of 10 µeV between
the ±5/2 and ±3/2 doublets. This results in an effective anisotropy similar to
that occurring in molecular magnets, where it gives rise to a slow dynamics of
the magnetization [128]. The extreme case of this slowing down is appearance of
the ferromagnetic phase in the Cd1−xMnxTe quantum wells with high Mn content
and carrier concentration [6, 129, 130, 131, 132]. In a ferromagnetic Cd1−xMnxTe
quantum well, this coupling results also in a softening of the Mn resonance when
approaching the critical temperature [131, 133].
108
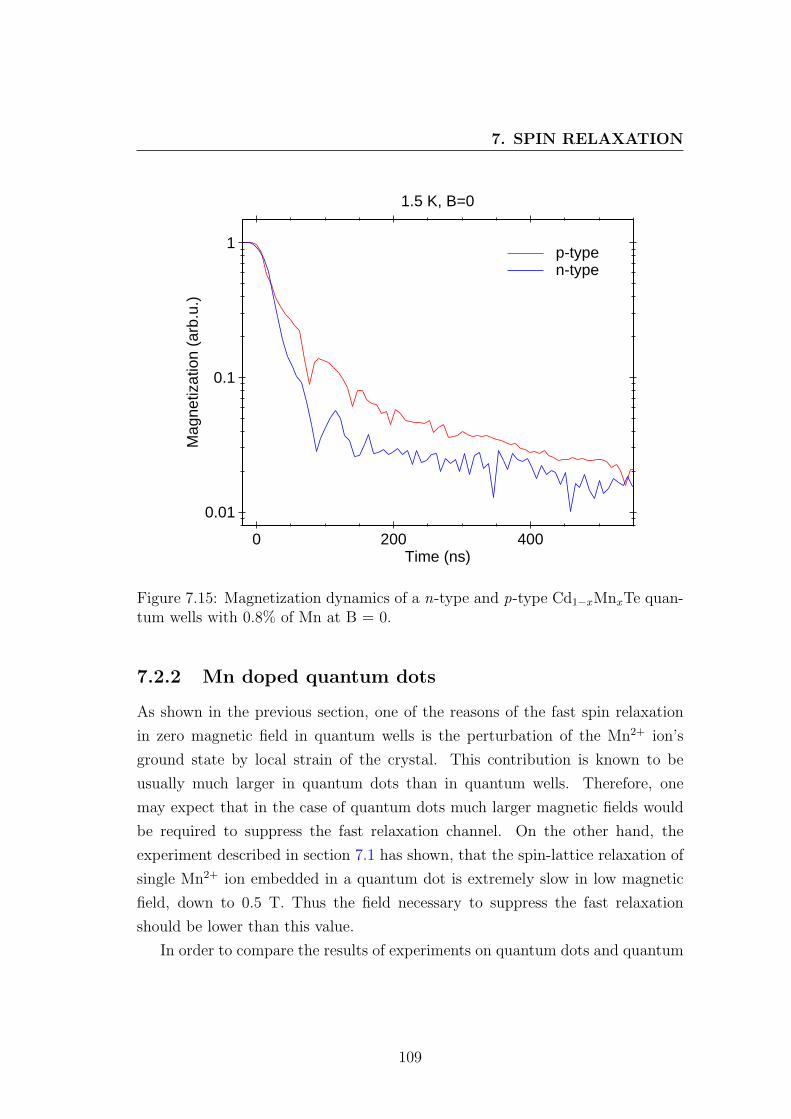
7. SPIN RELAXATION
0.01
0.1
1
0 200 400
p-typen-type
Time (ns)
Ma
gn
etiza
tio
n (
arb
.u.)
1.5 K, B=0
Figure 7.15: Magnetization dynamics of a n-type and p-type Cd1−xMnxTe quan-tum wells with 0.8% of Mn at B = 0.
7.2.2 Mn doped quantum dots
As shown in the previous section, one of the reasons of the fast spin relaxation
in zero magnetic field in quantum wells is the perturbation of the Mn2+ ion’s
ground state by local strain of the crystal. This contribution is known to be
usually much larger in quantum dots than in quantum wells. Therefore, one
may expect that in the case of quantum dots much larger magnetic fields would
be required to suppress the fast relaxation channel. On the other hand, the
experiment described in section 7.1 has shown, that the spin-lattice relaxation of
single Mn2+ ion embedded in a quantum dot is extremely slow in low magnetic
field, down to 0.5 T. Thus the field necessary to suppress the fast relaxation
should be lower than this value.
In order to compare the results of experiments on quantum dots and quantum
109
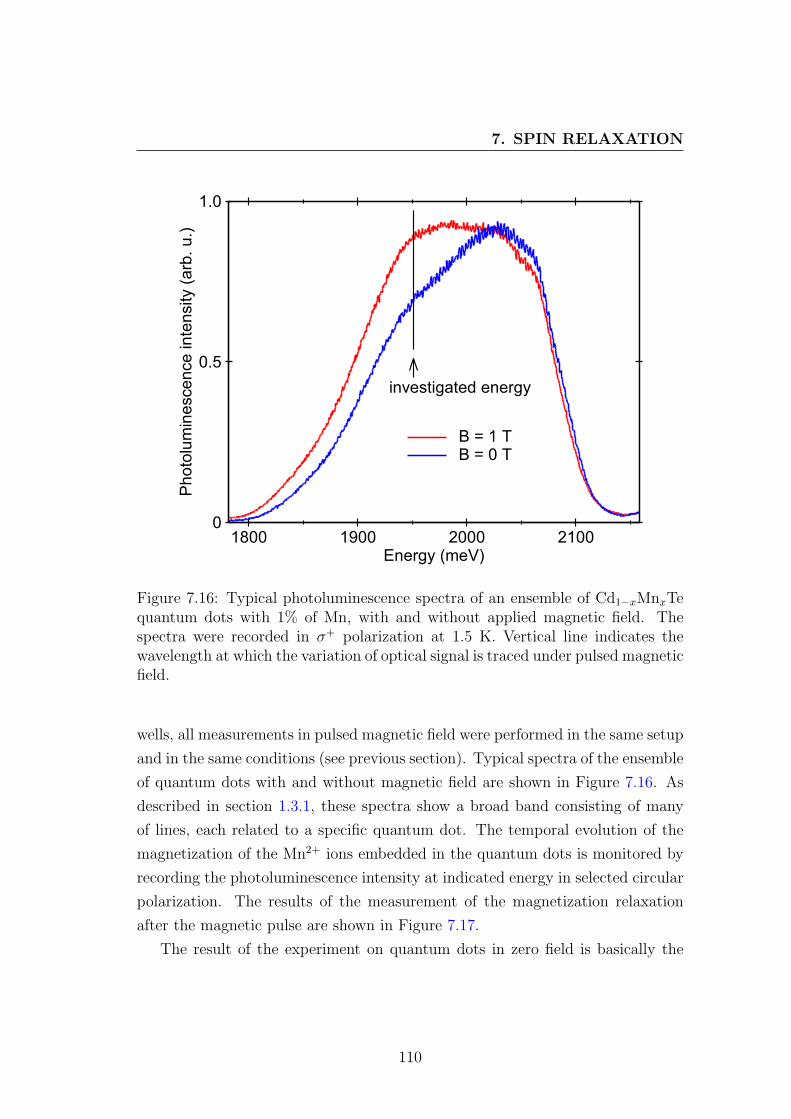
7. SPIN RELAXATION
0
0.5
1.0
1800 1900 2000 2100
B = 1 TB = 0 T
investigated energy
Energy (meV)
Ph
oto
lum
ine
sce
nce
in
ten
sity (
arb
. u
.)
Figure 7.16: Typical photoluminescence spectra of an ensemble of Cd1−xMnxTequantum dots with 1% of Mn, with and without applied magnetic field. Thespectra were recorded in σ+ polarization at 1.5 K. Vertical line indicates thewavelength at which the variation of optical signal is traced under pulsed magneticfield.
wells, all measurements in pulsed magnetic field were performed in the same setup
and in the same conditions (see previous section). Typical spectra of the ensemble
of quantum dots with and without magnetic field are shown in Figure 7.16. As
described in section 1.3.1, these spectra show a broad band consisting of many
of lines, each related to a specific quantum dot. The temporal evolution of the
magnetization of the Mn2+ ions embedded in the quantum dots is monitored by
recording the photoluminescence intensity at indicated energy in selected circular
polarization. The results of the measurement of the magnetization relaxation
after the magnetic pulse are shown in Figure 7.17.
The result of the experiment on quantum dots in zero field is basically the
110

7. SPIN RELAXATION
0 50 100 500
current profilemagnetization relaxation in magnetic field:B=0.3 TB=0.02 TB=0
time (ns)
No
rma
lize
d s
ign
al (a
rb.
u.)
Figure 7.17: Magnetization dynamics of an ensemble of quantum dots at indicatedvalues of external, constant magnetic field at 1.5 K, compared with the profile ofthe current in the coil (grey line). Note, that for non-zero values of external fieldthe zero point on vertical axis does not correspond to vanishing magnetization butto the equilibrium state after the magnetic pulse. Non-linear time scale chosento show both fast and slow components of decays clearly.
same as on quantum well. We observe a fast relaxation with characteristic time
equal to the previous one within experimental accuracy. However there is a
huge difference observed between quantum dots and quantum well in non-zero
magnetic field. In quantum dots, in contrast to quantum well, there is no visible
slowing down of relaxation after applying external field up to 0.5 T. It is clearly
visible in Figure 7.17. The experimental studies in higher field were not possible
- the photoluminescence spectrum of ensemble of quantum dots was completely
circularly polarized at field of about 1 T and no polarization variation could be
observed upon applying small magnetic pulses.
111
7. SPIN RELAXATION
The fact that the magnetization relaxation does not slow down in external
field of a few tenths of Tesla is surprising when compared with the experiment
described in section 7.1. The relaxation of a single Mn2+ ion which do not interact
with other magnetic moments was several orders of magnitude slower than the
one observed in present experiment. This indicates that one of the origins of the
fast relaxation in quantum dots with many Mn2+ ions might be the spin-spin
interaction between the ions. The interaction is not expected to be strong, as
the nominal concentration of the magnetic ions is low (equal to 1%). However,
no data is available on the distribution uniformity of the ions inside the dot.
Agglomeration of the Mn2+ ions in certain parts of the dot (in the dot centre, for
instance) would lead to much stronger spin-spin interaction when compared to
the case of uniform distribution. Further studies are needed on this field, however
they remain beyond the scope of this work.
112
Chapter 8
Conclusions
The spin dynamics of magnetic ions embedded in semiconductor crystal attracted
attention of scientists for years. Although many aspects of the magnetic ions
behaviour in a semiconductor crystal were already well understood, there were
still a lot of open questions. This work reports new experimental results in
this field. It presents experiments related to the mechanisms governing the spin
dynamics - orientation and relaxation - of the manganese ions embedded in the
CdTe crystal. Large part of the work is devoted to single quantum dots with single
Mn2+ ions, which give a peerless insight into the interactions of magnetic ion with
semiconductor environment. Phenomena occurring in low and zero magnetic field
in larger systems of magnetic ions, which have not been investigated before, are
also addressed.
The experiments on single CdTe quantum dots with single Mn2+ ions have
shown, that the random spin flips of the Mn2+ spin are strongly enhanced by
injection of randomly polarized excitons into the quantum dot. This suggested a
procedure of the Mn2+ polarization by spin polarized excitons. The experiment
exploiting exciton spin transfer from a neighbour non-magnetic quantum dot
indeed demonstrated that the information can be written on the spin state of
a single Mn2+ ion. The magnetic field of 1 T strongly enhances the orientation
efficiency. Dynamics of the Mn2+ spin under resonant excitation with circularly
polarized light was measured in a time-resolved experiment and described with a
simple rate equation model. The orientation time varied between 20 and 100 ns
over the used range of excitation power. The storage time of information on
113

8. CONCLUSIONS
the Mn2+ spin depends mainly on the spin-lattice relaxation time and reaches
almost 0.5 ms in low magnetic field and liquid helium temperature. One of
possible orientation mechanisms of the Mn2+ spin has been investigated. The dark
excitons optical recombination, usually not observable in non-magnetic quantum
dots in the absence of magnetic field, is partially allowed in dots with magnetic
ions. Each event of such recombination takes place with a simultaneous spin flip
of the Mn2+ ion. Thus a series of these events can create significant polarization
of the Mn2+ spin. This mechanism can be particularly efficient for dots with high
in-plane anisotropy, thus with significant heavy hole-light hole mixing. However,
the experimental results show that it is not the only mechanism which should
be taken into account. In particular the dominant mechanism of the Mn2+ spin
orientation in the dots with low heavy hole-light hole mixing remains unclear.
The Mn2+ spin relaxation has been investigated for systems of both single and
many magnetic ions. In case of single Mn2+ spin in a quantum dot two methods of
measurement have been demonstrated. Both gave the same results within the ex-
perimental accuracy. However, the time-resolved method allowed measurements
with better accuracy and in a broader range of magnetic fields. The measured de-
pendence of the spin-lattice relaxation rate on the magnetic field is qualitatively
similar to the one measured previously in bulk material. However, there is a rel-
evant quantitative difference between results of these and previous experiments,
especially in high magnetic field. Possible origins of much faster relaxation ob-
served in the experiments on quantum dots include slightly higher temperature of
the sample as well as strain fields, usually high in structures containing quantum
dots. Confirmation of this hypothesis requires further studies.
The spin relaxation in systems with many Mn2+ ions - quantum wells and
quantum dots - were performed with the use of new experimental technique. It
allowed investigation of the magnetization relaxation in the absence of magnetic
field, with temporal resolution down to a few nanoseconds, which was not possible
before.
In case of diluted magnetic quantum wells, we analyzed the evolution of the
giant Zeeman splitting of the photoluminescence, transmission and reflectivity
lines after a pulse of magnetic field. At zero magnetic field, a fast dynamics
was observed, with a dominant component being of order of tens of nanoseconds.
114

8. CONCLUSIONS
This dynamics is driven by hyperfine coupling with the nuclear spin of the Mn2+
ion. It is highly sensitive to the presence of the anisotropy, particularly the one
introduced by holes and by strain. Due to a thermal distribution of nuclear spins
the fast decay of the magnetization is observed when the field is swept down to
zero. When applying an additional, static magnetic field, a much slower relaxation
(by about 3 orders of magnitude) was observed, with a characteristic time up to
tens of microseconds at 1 T for 0.2% - 1.5% Mn. This slow relaxation agrees with
previous measurements of the spin-lattice relaxation time. The influence of two
dimensional hole on magnetization relaxation is also visible. In relatively large
magnetic field (1 T) the presence of hole gas enhances the relaxation rate, due
to additional relaxation channel. At B=0, the introduction of holes results in
appearance of slow relaxation component, which can be ascribed to stabilization
of relaxation caused by the interaction between holes and Mn2+ ions.
In experiments with quantum dots with many magnetic ions, we analyzed the
degree of circular polarization of photoluminescence spectrum after a pulse of
magnetic field. In the absence of magnetic field the magnetization relaxation is
very fast, with dominant component of characteristic time equal to about 20 ns.
This value is comparable with the one obtained in similar experiment with quan-
tum wells. After applying an additional, static magnetic field of order of 0.5 T,
the relaxation does not slow down, contrary to the case of quantum wells. One of
the possible origins of the fast relaxation in magnetic field is the spin-spin inter-
action between the ions. This interaction could be significantly enhanced if the
Mn2+ ions distribution inside the dot would be highly non-uniform. This aspect
requires further studies.
8.1 Perspectives
Although the experiments discussed in this work brought answers to many ques-
tions concerning the Mn2+ spin dynamics in a CdTe crystal, they also raised new
unresolved problems which remain open. One of the most important but not
firmly conducted issue concerns the mechanism of the optical spin orientation in
quantum dots with single Mn2+ ions. Several mechanisms have been proposed
115

8. CONCLUSIONS
so far, including the one involving dark excitons recombination presented in this
work. However a complete explanation of this phenomenon is still missing.
All experiments discussed in this work concern a non-coherent control and
evolution of the spin state of magnetic ions embedded in a semiconductor crystal.
A completely new emerging field of research is related to coherent phenomena,
especially those involving single magnetic ions, as they hold promise for single
atom-based qubits. Future experiments in this area will probably focus on inves-
tigation of the coherence time and possibility of coherent control over the spin
state of a single magnetic ion inside a quantum dot. Hopefully, experimental
work presented here will turn out to be helpful in this new, fascinating field.
116

Appendix A
Parameters used in calculations
• Chapter 6
Parameters of the Hamiltonian 6.1 used to reproduce energies of excitonic
transitions observed for quantum dot QD2 from Figure 6.1(b):
gMn = 2.0; ge = -0.55; gh = 0.43;
Ie = -0.09 meV; Ih = 0.19 meV;
ax = ay = 0; az = -0.025 meV;
bx = -by = 0.13 meV; bz = -0.28 meV;
γ = 15 meV; β = 1.9 meV;
γ2 = 0.0022 meV/T2 (diamagnetic coefficient of the diamagnetic shift:
∆E = γ2B2)
• Chapter 7
Parameters of the Hamiltonian 7.4 and D (equation 7.5) used to reproduce
magnetization temporal profile shown in Figure 7.10:
gMn = 2.0; A = 680 neV; D = 4.16·10−7 eV; a = 320 neV;
G11 = 46 m−1; G11 = 2.7·10−9 Pa−1m−1;
117

Appendix B
List of publications related to this work
• M. Koperski, M. Goryca, T. Kazimierczuk, P. Kossacki, P. Wojnar, J.A.
Gaj, Magnetoluminescence of a CdTe Quantum Dot with a Single Man-
ganese Ion in Voigt Configuration, Acta Physica Polonica A 119, 618
(2011).
• M. Goryca, P. Pochocka, T. Kazimierczuk, P. Wojnar, G. Karczewski, J.
A. Gaj, M. Potemski, and P. Kossacki, Brightening of dark excitons in a
single CdTe quantum dot containing a single Mn2+ ion, Phys. Rev. B 82,
165323 (2010).
• M. Goryca, T. Kazimierczuk, M. Nawrocki, A. Golnik, J. A. Gaj, P. Wojnar,
G. Karczewski, P. Kossacki, Optical manipulation of a single Mn spin in a
CdTe quantum dot, Physica E 42, 2690 (2010).
• M. Goryca, P. Kossacki, A. Golnik, T. Kazimierczuk, P. Wojnar, and M.
Nawrocki, Spin Dynamics of a Single Mn Ion in a CdTe/(Cd, Mg, Zn)Te
Quantum Dot, AIP Conf. Proc. 1199, 453 (2010).
• M. Goryca, T. Kazimierczuk, M. Nawrocki, A. Golnik, J. A. Gaj, P. Kos-
sacki, P. Wojnar, and G. Karczewski Optical Manipulation of a Single Mn
Spin in a CdTe-Based Quantum Dot, Phys. Rev. Lett. 103, 087401 (2009).
• A. Lipińska, C. Simserides, K. N. Trohidou, M. Goryca, P. Kossacki, A.
Majhofer, and T. Dietl, Ferromagnetic properties of p-(Cd,Mn)Te quan-
tum wells: Interpretation of magneto-optical measurements by Monte Carlo
simulations, Physical Review B 79, 235322 (2009).
118

. APPENDIX B
• M. Goryca, D. Ferrand, P. Kossacki, M. Nawrocki, W. Pacuski, W. Maślana,
J.A. Gaj, S. Tatarenko, J. Cibert, T. Wojtowicz, and G. Karczewski, Mag-
netization Dynamics Down to a Zero Field in Dilute (Cd,Mn)Te Quantum
Wells, Phys. Rev. Lett. 102, 046408 (2009).
• J. Kobak, M. Goryca, P. Kossacki, A. Golnik, G. Karczewski, T. Wojtowicz,
and J. A. Gaj, Magnetization dynamics of (Cd,Mn)Te quantum well in
pulsed magnetic field, Acta Physica Polonica A 116, 907 (2009).
• J. Papierska, M. Goryca, P. Wojnar, and P. Kossacki, Temperature of a
Single Mn Atom in a CdTe Quantum Dot, Acta Physica Polonica A 116,
899 (2009).
• J. A. Gaj, T. Kazimierczuk, M. Goryca, M. Koperski, A. Golnik, P. Kos-
sacki, M. Nawrocki, P. Wojnar, and G. Karczewski, Spin-related Spec-
troscopy of CdTe-based Quantum Dots, Acta Physica Polonica A 116, 795
(2009).
• M. Goryca, P. Kossacki, M. Nawrocki, P. Wojnar, G. Karczewski Nanosec-
ond spin dynamics in (Cd,Mn)Te quantum dots and quantum wells, Journal
of the Korean Physical Society 53, 2963- 2966 (2008).
• M. Goryca, D. Ferrand, P. Kossacki, M. Nawrocki, W. Pacuski, W. Maślana,
S. Tatarenko, T. Wojtowicz, G. Karczewski, and J. Cibert Influence of
carriers on magnetization relaxation in (Cd,Mn)Te quantum wells, Physica
Status Solidi (c) 4, 307-310 (2007).
• J. A. Gaj, J. Cibert, A. Golnik, M. Goryca, E. Janik, T. Kazimierczuk, .
Kopotowski, P. Kossacki, J. Kossut, K. Kowalik, O. Krebs, A. Lemaitre, S.
Makowski, W. Maślana, M. Nawrocki, P. Płochocka, B. Piechal, P. Selenart,
J. Suffczyński, S. Tatarenko, and P. Voisin Semiconductor heterostructures
for spintronics and quantum information, Comptes Rendus Physique 8,
243-252 (2007).
• M. Goryca, P. Kossacki, D. Ferrand, M. Nawrocki, W. Pacuski, W. Maślana,
S. Tatarenko, J. Cibert Anisotropy dependent relaxation dynamics of mag-
119

. APPENDIX B
netization in (Cd,Mn)Te quantum wells, Physica Status Solidi (c) 3, 4094-
4097 (2007).
• P. Kossacki, D. Ferrand , M. Goryca, M. Nawrocki, W. Pacuski, W. Maślana,
S. Tatarenko, J. Cibert Relaxation dynamics of ferromagnetic domains in
(Cd,Mn)Te quantum wells, Physica E 32, 454-457 (2006).
• J. A. Gaj, J. Cibert, D. Ferrand, A. Golnik, M. Goryca, G. Karczewski, P.
Kossacki, J. Kossut, K. Kowalik, O. Krebs, A. Kudelski, M. Kutrowski, A.
Lemaitre, W. Maślana, M. Nawrocki, W. Pacuski, P. Płochocka, P. Senel-
lart, S. Tatarenko, P. Voisin, and T. Wojtowicz, Optical probing of spin-
dependent interactions in II-VI semiconductor structures, Physica Status
Solidi (b) 243, 906-913 (2006).
• M. Goryca, D. Ferrand, P. Kossacki, M. Nawrocki, W. Pacuski, W. Maślana,
S. Tatarenko, J. Cibert Magnetization dynamics in (Cd,Mn)Te quantum
wells, Physica Status Solidi (b) 243, 882-886 (2006).
120

References
[1] S. A. Wolf, D. D. Awschalom, R. A. Buhrman, J. M. Daughton, S. von
Molnr, M. L. Roukes, A. Y. Chtchelkanova, and D. M. Treger, Spintronics:
A Spin-Based Electronics Vision for the Future, Science 294, 1488 (2001).
1
[2] I. Zutić, J. Fabian, and S. Das Sarma, Spintronics: Fundamentals and
applications, Rev. Mod. Phys. 76, 323 (2004). 1
[3] J. Furdyna and J. Kossut, Diluted magnetic semiconductors, volume 25 of
Semiconductors and Semimetals (Academic Press, New York, 1988). 2, 3
[4] J. Gaj, R. Planel, and G. Fishman, Relation of Magneto-optical Properties
of Free Excitons to Spin Alignment of Mn2+ Ions in Cd1−xMnxTe, Solid
State Commun. 29, 435 (1979). 3, 7, 8, 39
[5] O. Madelung, M. Schulz, and W. Weiss, editors, Landolt-Bornstein, Nu-
merical Data and Functional Relationships in Science and Technology, New
Series, Group III Vol. 17b (Springer-Verlag, Berlin, 1982). 3
[6] H. Boukari, P. Kossacki, M. Bertolini, D. Ferrand, J. Cibert, S. Tatarenko,
A. Wasiela, J. A. Gaj, and T. Dietl, Light and Electric Field Control of
Ferromagnetism in Magnetic Quantum Structures, Phys. Rev. Lett. 88,
207204 (2002). 3, 20, 108
[7] Y. Leger, L. Besombes, J. Fernandez-Rossier, L. Maingault, and H. Mari-
ette, Electrical Control of a Single Mn Atom in a Quantum Dot, Phys.
Rev. Lett. 97, 107401 (2006). 3, 17, 19
121

REFERENCES
[8] S.-H. Wei and A. Zunger, Alloy-Stabilized Semiconducting and Magnetic
Zinc-Blende Phase of MnTe, Phys. Rev. Lett. 56, 2391 (1986). 4
[9] R. Triboulet, A. Heurtel, and J. Rioux, Twin-free (Cd, Mn)Te substrates,
Journal of Crystal Growth 101, 131 (1990). 4
[10] M. Kutrowski, Magnetooptyczne własności profilowanych studni kwan-
towych opartych na związkach Cd1−xMnxTe i Cd1−yMgyTe., PhD thesis,
Institute of Physics, Polish Academy of Sciences, 2001. 4, 27
[11] J. Kossut and J. Gaj, editors, Introduction to the Physics of Diluted Mag-
netic Semiconductors (Springer-Verlag, Berlin, 2010). 5
[12] J. Kossut and W. Dobrowolski, editors, Diluted magnetic semiconductors,
in Handbook of Magnetic Materials, Vol. 7 (Elsevier B.V., Amsterdam,
1993). 6
[13] J. A. Gaj, W. Grieshaber, C. Bodin-Deshayes, J. Cibert, G. Feuillet,
Y. Merle d’Aubigne, and A. Wasiela, Magneto-optical study of interface
mixing in the CdTe-(Cd,Mn)Te system, Phys. Rev. B 50, 5512 (1994). 7
[14] W. Grieshaber, A. Haury, J. Cibert, Y. M. d’Aubigne, A. Wasiela, and
J. A. Gaj, Magneto-optic study of the interface in semimagnetic semi-
conductor heterostructures: Intrinsic effect and interface profile in CdTe-
Cd1−xMnxTe, Phys. Rev. B 53, 4891 (1996). 7
[15] W. Maślana, Carrier induced ferromagnetism in (Cd,Mn)Te quantum wells:
a spectroscopic study., PhD thesis, University of Warsaw, 2007. 7, 25
[16] R. R. Galazka, S. Nagata, and P. H. Keesom, Paramagnetic¯spin-
glass¯antiferromagnetic phase transitions in Cd1−xMnxTe from specific heat
and magnetic susceptibility measurements, Phys. Rev. B 22, 3344 (1980).
7
[17] M. Escorne and A. Mauger, Spin-glass versus antiferromagnetic clustering
in Cd1−xMnxTe, Phys. Rev. B 25, 4674 (1982). 7
122

REFERENCES
[18] S. B. Oseroff, Magnetic susceptibility and EPR measurements in concen-
trated spin-glasses: Cd1−xMnxTe and Cd1−xMnxSe, Phys. Rev. B 25, 6584
(1982). 7
[19] M. A. Novak, O. G. Symko, D. J. Zheng, and S. Oseroff, Spin glass behavior
of Cd1−xMnxTe below the nearest-neighbor percolation limit, Journal of
Applied Physics 57, 3418 (1985). 7
[20] K. Kheng, R. T. Cox, M. Y. d’ Aubigne, F. Bassani, K. Saminadayar, and
S. Tatarenko, Observation of negatively charged excitons X− in semicon-
ductor quantum wells, Phys. Rev. Lett. 71, 1752 (1993). 10
[21] V. Huard, R. T. Cox, K. Saminadayar, A. Arnoult, and S. Tatarenko, Bound
States in Optical Absorption of Semiconductor Quantum Wells Containing
a Two-Dimensional Electron Gas, Phys. Rev. Lett. 84, 187 (2000). 10
[22] P. Płochocka, P. Kossacki, W. Maślana, J. Cibert, S. Tatarenko,
C. Radzewicz, and J. A. Gaj, Femtosecond Study of the Interplay between
Excitons, Trions, and Carriers in (Cd,Mn)Te Quantum Wells, Phys. Rev.
Lett. 92, 177402 (2004). 10
[23] R. T. Cox, R. B. Miller, K. Saminadayar, and T. Baron, Trions, ex-
citons, and scattering states in multiple quantum wells with a variable-
concentration electron gas, Phys. Rev. B 69, 235303 (2004). 10
[24] P. Kossacki, Optical studies of charged excitons in IIVI semiconductor
quantum wells, Journal of Physics: Condensed Matter 15, R471 (2003). 10
[25] J. M. Moison, F. Houzay, F. Barthe, L. Leprince, E. Andre, and O. Va-
tel, Self-organized growth of regular nanometer-scale InAs dots on GaAs,
Applied Physics Letters 64, 196 (1994). 11
[26] R. Notzel, Self-organized growth of quantum-dot structures, Semiconductor
Science and Technology 11, 1365 (1996). 11
[27] A. Babiński, J. Jasiński, R. Bożek, A. Szepielow, and J. M. Baranowski,
Rapid thermal annealing of InAs/GaAs quantum dots under a GaAs prox-
imity cap, Applied Physics Letters 79, 2576 (2001). 11
123

REFERENCES
[28] S. Fafard, Z. Wasilewski, J. McCaffrey, S. Raymond, and S. Charbonneau,
InAs self-assembled quantum dots on InP by molecular beam epitaxy, Ap-
plied Physics Letters 68, 991 (1996). 11
[29] A. Yoffe, Semiconductor quantum dots and related systems: Electronic,
optical, luminescence and related properties of low dimensional systems,
Advances in Physics 50, 1 (2000). 11
[30] G. Karczewski, S. Maćkowski, M. Kutrowski, T. Wojtowicz, and J. Kos-
sut, Photoluminescence study of CdTe/ZnTe self-assembled quantum dots,
Applied Physics Letters 74, 3011 (1999). 11
[31] F. Tinjod, B. Gilles, S. Moehl, K. Kheng, and H. Mariette, II-VI quantum
dot formation induced by surface energy change of a strained layer, Applied
Physics Letters 82, 4340 (2003). 11, 23
[32] S. H. Xin, P. D. Wang, A. Yin, C. Kim, M. Dobrowolska, J. L. Merz, and
J. K. Furdyna, Formation of self-assembling CdSe quantum dots on ZnSe
by molecular beam epitaxy, Applied Physics Letters 69, 3884 (1996). 11
[33] V. D. Kulakovskii, G. Bacher, R. Weigand, T. Kummell, A. Forchel,
E. Borovitskaya, K. Leonardi, and D. Hommel, Fine Structure of Biexciton
Emission in Symmetric and Asymmetric CdSe/ZnSe Single Quantum Dots,
Phys. Rev. Lett. 82, 1780 (1999). 11
[34] J. Suffczyński, T. Kazimierczuk, M. Goryca, B. Piechal, A. Trajnerowicz,
K. Kowalik, P. Kossacki, A. Golnik, K. P. Korona, M. Nawrocki, J. A.
Gaj, and G. Karczewski, Excitation mechanisms of individual CdTe/ZnTe
quantum dots studied by photon correlation spectroscopy, Phys. Rev. B 74,
085319 (2006). 12, 13, 34, 35, 63, 81
[35] L. Besombes, Y. Leger, L. Maingault, D. Ferrand, H. Mariette, and J. Cib-
ert, Carrier-induced spin splitting of an individual magnetic atom embedded
in a quantum dot, Phys. Rev. B 71, 161307 (2005). 12, 13, 17, 81
[36] T. Kazimierczuk, T. Smoleński, M. Goryca, L. Kłopotowski, P. Wojnar,
K. Fronc, A. Golnik, M. Nawrocki, J. A. Gaj, and P. Kossacki, Magne-
124
REFERENCES
tophotoluminescence study of intershell exchange interaction in CdTe/ZnTe
quantum dots, Phys. Rev. B 84, 165319 (2011). 12, 13, 34
[37] T. Kazimierczuk, Mechanizmy wzbudzenia i relaksacji w kropkach kwan-
towych CdTe/ZnTe, PhD thesis, University of Warsaw, Faculty of Physics,
Institute of Experimental Physics, to be published in 2012. 12, 13, 68
[38] A. L. Efros, E. I. Rashba, and M. Rosen, Paramagnetic Ion-Doped
Nanocrystal as a Voltage-Controlled Spin Filter, Phys. Rev. Lett. 87,
206601 (2001). 13
[39] G. Bacher, A. A. Maksimov, H. Schomig, V. D. Kulakovskii, M. K. Welsch,
A. Forchel, P. S. Dorozhkin, A. V. Chernenko, S. Lee, M. Dobrowolska,
and J. K. Furdyna, Monitoring Statistical Magnetic Fluctuations on the
Nanometer Scale, Phys. Rev. Lett. 89, 127201 (2002). 13
[40] D. Loss and D. P. DiVincenzo, Quantum computation with quantum dots,
Phys. Rev. A 57, 120 (1998). 13
[41] C. Bennett and D. DiVincenzo, Quantum information and computation,
Nature 404, 247 (2000). 13
[42] M. Leuenberger and D. Loss, Quantum computing in molecularmagnets,
Nature 410, 789 (2001). 13
[43] L. V. Titova, J. K. Furdyna, M. Dobrowolska, S. Lee, T. Topuria, P. Moeck,
and N. D. Browning, Magnetic CdSe-based quantum dots grown on Mn-
passivated ZnSe, Applied Physics Letters 80, 1237 (2002). 13
[44] T. Gurung, S. Mackowski, G. Karczewski, H. E. Jackson, and L. M. Smith,
Ultralong spin memory of optically excited single magnetic quantum dots,
Applied Physics Letters 93, 153114 (2008). 13
[45] C. Le Gall, L. Besombes, H. Boukari, R. Kolodka, J. Cibert, and H. Ma-
riette, Optical Spin Orientation of a Single Manganese Atom in a Semi-
conductor Quantum Dot Using Quasiresonant Photoexcitation, Phys. Rev.
Lett. 102, 127402 (2009). 13, 21, 65
125
REFERENCES
[46] M. Goryca, T. Kazimierczuk, M. Nawrocki, A. Golnik, J. A. Gaj, P. Kos-
sacki, P. Wojnar, and G. Karczewski, Optical Manipulation of a Single Mn
Spin in a CdTe-Based Quantum Dot, Phys. Rev. Lett. 103, 087401 (2009).
13, 65, 68, 78, 84, 86
[47] P. Wojnar, J. Suffczyński, K. Kowalik, A. Golnik, M. Aleszkiewicz, G. Kar-
czewski, and J. Kossut, Size-dependent magneto-optical effects in CdMnTe
diluted magnetic quantum dots, Nanotechnology 19, 235403 (2008). 14, 15,
24, 28, 68
[48] A. K. Bhattacharjee and J. Perez-Conde, Optical properties of paramagnetic
ion-doped semiconductor nanocrystals, Phys. Rev. B 68, 045303 (2003). 17
[49] L. Besombes, Y. Leger, L. Maingault, D. Ferrand, H. Mariette, and J. Cib-
ert, Probing the Spin State of a Single Magnetic Ion in an Individual Quan-
tum Dot, Phys. Rev. Lett. 93, 207403 (2004). 17, 19, 78
[50] Y. Leger, L. Besombes, L. Maingault, D. Ferrand, and H. Mariette, Geo-
metrical Effects on the Optical Properties of Quantum Dots Doped with a
Single Magnetic Atom, Phys. Rev. Lett. 95, 047403 (2005). 17
[51] J. Fernandez-Rossier, Single-exciton spectroscopy of semimagnetic quantum
dots, Phys. Rev. B 73, 045301 (2006). 17
[52] A. H. Trojnar, M. Korkusiński, E. S. Kadantsev, P. Hawrylak, M. Goryca,
T. Kazimierczuk, P. Kossacki, P. Wojnar, and M. Potemski, Quantum In-
terference in Exciton-Mn Spin Interactions in a CdTe Semiconductor Quan-
tum Dot, Phys. Rev. Lett. 107, 207403 (2011). 17
[53] A. Kudelski, A. Lemaıtre, A. Miard, P. Voisin, T. C. M. Graham, R. J.
Warburton, and O. Krebs, Optically Probing the Fine Structure of a Single
Mn Atom in an InAs Quantum Dot, Phys. Rev. Lett. 99, 247209 (2007).
17
[54] O. Krebs, E. Benjamin, and A. Lemaıtre, Magnetic anisotropy of singly
Mn-doped InAs/GaAs quantum dots, Phys. Rev. B 80, 165315 (2009). 17
126
REFERENCES
[55] S. A. Crooker, D. D. Awschalom, J. J. Baumberg, F. Flack, and N. Samarth,
Optical spin resonance and transverse spin relaxation in magnetic semicon-
ductor quantum wells, Phys. Rev. B 56, 7574 (1997). 20
[56] F. Teppe, M. Vladimirova, D. Scalbert, T. Wojtowicz, and J. Kossut, Opti-
cally induced instability of spin precession in magnetic quantum wells, Phys.
Rev. B 67, 033304 (2003). 20
[57] S. Maćkowski, T. Gurung, T. A. Nguyen, H. E. Jackson, L. M. Smith,
G. Karczewski, and J. Kossut, Optically-induced magnetization of CdMnTe
self-assembled quantum dots, Applied Physics Letters 84, 3337 (2004). 20
[58] H. Krenn, W. Zawadzki, and G. Bauer, Optically Induced Magnetization
in a Dilute Magnetic Semiconductor: Hg1−xMnxTe, Phys. Rev. Lett. 55,
1510 (1985). 20
[59] C. D. Stanciu, F. Hansteen, A. V. Kimel, A. Kirilyuk, A. Tsukamoto,
A. Itoh, and T. Rasing, All-Optical Magnetic Recording with Circularly
Polarized Light, Phys. Rev. Lett. 99, 047601 (2007). 21
[60] H. Ohno, D. Chiba, F. Matsukura, T. Omiya, E. Abe, T. Dietl1, Y. Ohno,
and K. Ohtani, Electric-field control of ferromagnetism, Nature 408, 944
(2000). 21
[61] Y. Ohno, D. K. Young, B. Beschoten, F. Matsukura, H. Ohno, and D. D.
Awschalom, Electrical spin injection in a ferromagnetic semiconductor het-
erostructure, Nature 402, 790 (1999). 21
[62] L. Kevan and R. Schwartz, editors, Time Domain Electron Spin Resonance
(Wiley-Interscience, New York, 1979). 21
[63] A. Abragam and B. Bleaney, Electron Paramagnetic Resonance of Transi-
tion Ions (Oxford University Press, Oxford, 1970). 21, 22, 99, 101
[64] H. A. Sayad and S. M. Bhagat, Dynamic random fields in diluted magnetic
semiconductors: Cd1−xMnxTe, Phys. Rev. B 31, 591 (1985). 21
127

REFERENCES
[65] R. E. Kremer and J. K. Furdyna, Investigation of EPR in Cd1−xMnxTe by
microwave Faraday effect, Phys. Rev. B 32, 5591 (1985). 21
[66] D. Scalbert, Spin-lattice relaxation in diluted magnetic semiconductors,
physica status solidi (b) 193, 189 (1996). 21, 99
[67] A. V. Scherbakov, A. V. Akimov, D. R. Yakovlev, W. Ossau, G. Landwehr,
T. Wojtowicz, G. Karczewski, and J. Kossut, Spin-lattice relaxation in
semimagnetic CdMnTe/CdMgTe quantum wells, Phys. Rev. B 62, R10641
(2000). 21, 22, 99
[68] A. V. Scherbakov, D. R. Yakovlev, A. V. Akimov, I. A. Merkulov, B. Konig,
W. Ossau, L. W. Molenkamp, T. Wojtowicz, G. Karczewski, G. Cywinski,
and J. Kossut, Acceleration of the spin-lattice relaxation in diluted magnetic
quantum wells in the presence of a two-dimensional electron gas, Phys. Rev.
B 64, 155205 (2001). 22
[69] A. Scherbakov, A. Akimov, D. Yakovlev, W. Ossau, L. Molenkamp,
S. Tatarenko, and J. Cibert, Spinlattice relaxation in semimagnetic CdM-
nTe/CdMgZnTe quantum wells with a two-dimensional hole gas tuned by
optical excitation, Solid State Communications 120, 17 (2001). 22, 107
[70] D. Scalbert, J. Cernogora, and C. Benoıt a la Guillaume, Spin-Lattice
Relaxation in Paramagnetic CdMnTe, Solid State Commun. 66, 571 (1988).
22, 38, 99, 101, 106
[71] T. Strutz, A. M. Witowski, and P. Wyder, Spin-lattice relaxation at high
magnetic fields, Phys. Rev. Lett. 68, 3912 (1992). 22, 38, 97, 98, 101, 106
[72] S. A. Crooker, J. J. Baumberg, F. Flack, N. Samarth, and D. D. Awschalom,
Terahertz Spin Precession and Coherent Transfer of Angular Momenta in
Magnetic Quantum Wells, Phys. Rev. Lett. 77, 2814 (1996). 22, 38, 100
[73] A. V. Scherbakov, A. V. Akimov, D. R. Yakovlev, W. Ossau, A. Waag,
G. Landwehr, T. Wojtowicz, G. Karczewski, and J. Kossut, Heating of the
spin system by nonequilibrium phonons in semimagnetic (Cd,Mn,Mg)Te
quantum wells, Phys. Rev. B 60, 5609 (1999). 22, 38, 99
128
REFERENCES
[74] W. Farah, D. Scalbert, and M. Nawrocki, Magnetic relaxation studied by
transient reflectivity in Cd1−xMnxTe, Phys. Rev. B 53, R10461 (1996). 22,
38
[75] C. Camilleri, F. Teppe, D. Scalbert, Y. G. Semenov, M. Nawrocki,
M. Dyakonov, J. Cibert, S. Tatarenko, and T. Wojtowicz, Electron and
hole spin relaxation in modulation-doped CdMnTe quantum wells, Phys.
Rev. B 64, 085331 (2001). 22, 38, 100
[76] I. Stranski and L. Von Krastanow, Abhandlungen der Mathematisch-
Naturwissenschaftlichen Klasse, Akad. Wiss. Lit. Mainz 146, 797 (1939).
23
[77] E. Bauer, Phanomenologische Theorie der Kristallabscheidung an
Oberflachen. I, Zeitschrift fur Kristallographie 110, 372 (1958). 23
[78] W. Maślana, P. Kossacki, M. Bertolini, H. Boukari, D. Ferrand,
S. Tatarenko, J. Cibert, and J. A. Gaj, p-type doping of II-VI heterostruc-
tures from surface states Application to ferromagnetic Cd1−xMnxTe quan-
tum wells, Applied Physics Letters 82, 1875 (2003). 24
[79] P. Kossacki, H. Boukari, M. Bertolini, D. Ferrand, J. Cibert, S. Tatarenko,
J. A. Gaj, B. Deveaud, V. Ciulin, and M. Potemski, Photoluminescence of
p-doped quantum wells with strong spin splitting, Phys. Rev. B 70, 195337
(2004). 25
[80] S. Koshihara, A. Oiwa, M. Hirasawa, S. Katsumoto, Y. Iye, C. Urano,
H. Takagi, and H. Munekata, Ferromagnetic Order Induced by Photo-
generated Carriers in Magnetic III-V Semiconductor Heterostructures of
(In,Mn)As/GaSb, Phys. Rev. Lett. 78, 4617 (1997). 24
[81] N. Paganotto, J. Siviniant, D. Coquillat, D. Scalbert, J.-P. Lascaray,
and A. V. Kavokin, Donor bound or negatively charged excitons in thin
CdTe/Cd1−xMnxTe quantum wells, Phys. Rev. B 58, 4082 (1998). 24
[82] J. Siviniant, D. Scalbert, A. V. Kavokin, D. Coquillat, and J.-P. Lascaray,
Chemical equilibrium between excitons, electrons, and negatively charged
129

REFERENCES
excitons in semiconductor quantum wells, Phys. Rev. B 59, 1602 (1999).
24
[83] T. Wojtowicz, M. Kutrowski, G. Karczewski, and J. Kossut, Modulation-
doped Cd1−xMnxTe/Cd1−yMgyTe quantum well structures with spatial in-
plane profiling of the well width and the doping intensity, Applied Physics
Letters 73, 1379 (1998). 26
[84] J. Jasny, J. Sepiol, T. Irngartinger, M. Traber, A. Renn, and U. P. Wild,
Fluorescence microscopy in superfluid helium: Single molecule imaging,
Rev. Sci. Instrum. 67, 1425 (1996). 31
[85] A. H. Mack, J. Riordon, C. R. Dean, R. Talbot, and G. Gervais, Local
control of light polarization with low-temperature fiber optics, Opt. Lett.
32, 1378 (2007). 33
[86] Y. Leger, L. Besombes, L. Maingault, and H. Mariette, Valence-band mixing
in neutral, charged, and Mn-doped self-assembled quantum dots, Phys. Rev.
B 76, 045331 (2007). 34, 80, 83
[87] H. S. Lee, A. Rastelli, M. Benyoucef, F. Ding, T. W. Kim, H. L. Park, and
O. G. Schmidt, Microphotoluminescence spectroscopy of single CdTe/ZnTe
quantum dots grown on Si(001) substrates, Nanotechnology 20, 075705
(2009). 34
[88] R. M. Stevenson, R. J. Young, P. Atkinson, K. Cooper, D. A. Ritchie, and
A. J. Shields, A semiconductor source of triggered entangled photon pairs,
Nature 439, 179 (2006). 35
[89] N. Akopian, N. H. Lindner, E. Poem, Y. Berlatzky, J. Avron, D. Gershoni,
B. D. Gerardot, and P. M. Petroff, Entangled Photon Pairs from Semicon-
ductor Quantum Dots, Phys. Rev. Lett. 96, 130501 (2006). 35
[90] R. Hanbury Brown and R. Q. Twiss, Correlation between Photons in two
Coherent Beams of Light, Nature 177, 27 (1956). 35
130

REFERENCES
[91] D. Yakovlev, W. Ossau, G. Landwehr, R. Bicknell-Tassius, A. Waag,
S. Schmeusser, I. Uraltsev, A. Pohlmann, and E. Gbel, Dynamics of two-
dimensional exciton magnetic polaron in CdTe/(Cd,Mn)Te quantum wells,
Journal of Crystal Growth 117, 854 (1992). 41
[92] L. Besombes, Y. Leger, J. Bernos, H. Boukari, H. Mariette, J. P. Poizat,
T. Clement, J. Fernandez-Rossier, and R. Aguado, Optical probing of spin
fluctuations of a single paramagnetic Mn atom in a semiconductor quantum
dot, Phys. Rev. B 78, 125324 (2008). 56, 62, 73
[93] P. Michler, A. Kiraz, C. Becher, W. V. Schoenfeld, P. M. Petroff, L. Zhang,
E. Hu, and A. Imamoglu, A Quantum Dot Single-Photon Turnstile Device,
Science 290, 2282 (2000). 58
[94] C. Santori, M. Pelton, G. Solomon, Y. Dale, and Y. Yamamoto, Triggered
Single Photons from a Quantum Dot, Phys. Rev. Lett. 86, 1502 (2001). 58
[95] A. Beveratos, R. Brouri, T. Gacoin, J.-P. Poizat, and P. Grangier, Non-
classical radiation from diamond nanocrystals, Phys. Rev. A 64, 061802
(2001). 58
[96] C. Santori, S. Gotzinger, Y. Yamamoto, S. Kako, K. Hoshino, and
Y. Arakawa, Photon correlation studies of single GaN quantum dots, Ap-
plied Physics Letters 87, 051916 (2005). 58
[97] E. Moreau, I. Robert, L. Manin, V. Thierry-Mieg, J. M. Gerard, and
I. Abram, Quantum Cascade of Photons in Semiconductor Quantum Dots,
Phys. Rev. Lett. 87, 183601 (2001). 58
[98] D. V. Regelman, U. Mizrahi, D. Gershoni, E. Ehrenfreund, W. V. Schoen-
feld, and P. M. Petroff, Semiconductor Quantum Dot: A Quantum Light
Source of Multicolor Photons with Tunable Statistics, Phys. Rev. Lett. 87,
257401 (2001). 63, 71
[99] T. Kazimierczuk, J. Suffczyński, A. Golnik, J. A. Gaj, P. Kossacki, and
P. Wojnar, Optically induced energy and spin transfer in nonresonantly
131
REFERENCES
coupled pairs of self-assembled CdTe/ZnTe quantum dots, Phys. Rev. B 79,
153301 (2009). 65, 66, 68
[100] M. Goryca, P. Plochocka, T. Kazimierczuk, P. Wojnar, G. Karczewski, J. A.
Gaj, M. Potemski, and P. Kossacki, Brightening of dark excitons in a single
CdTe quantum dot containing a single Mn2+ ion, Phys. Rev. B 82, 165323
(2010). 68
[101] M. Goryca, D. Ferrand, P. Kossacki, M. Nawrocki, W. Pacuski, W. Maślana,
J. A. Gaj, S. Tatarenko, J. Cibert, T. Wojtowicz, and G. Karczewski, Mag-
netization Dynamics Down to a Zero Field in Dilute (Cd,Mn)Te Quantum
Wells, Phys. Rev. Lett. 102, 046408 (2009). 69, 71, 78
[102] J. D. Cuthbert and D. G. Thomas, Fluorescent Decay Times of Excitons
Bound to Isoelectronic Traps in GaP and ZnTe, Phys. Rev. 154, 763 (1967).
76
[103] P. Palinginis, H. Wang, S. V. Goupalov, D. S. Citrin, M. Dobrowolska, and
J. K. Furdyna, Exciton dephasing in self-assembled CdSe quantum dots,
Phys. Rev. B 70, 073302 (2004). 76
[104] S. A. Crooker, T. Barrick, J. A. Hollingsworth, and V. I. Klimov, Multiple
temperature regimes of radiative decay in CdSe nanocrystal quantum dots:
Intrinsic limits to the dark-exciton lifetime, Applied Physics Letters 82,
2793 (2003). 76
[105] O. Labeau, P. Tamarat, and B. Lounis, Temperature Dependence of the
Luminescence Lifetime of Single CdSe/ZnS Quantum Dots, Phys. Rev.
Lett. 90, 257404 (2003). 76
[106] G. Bacher, R. Weigand, J. Seufert, V. D. Kulakovskii, N. A. Gippius,
A. Forchel, K. Leonardi, and D. Hommel, Biexciton versus Exciton Life-
time in a Single Semiconductor Quantum Dot, Phys. Rev. Lett. 83, 4417
(1999). 76
[107] M. Bayer, G. Ortner, O. Stern, A. Kuther, A. A. Gorbunov, A. Forchel,
P. Hawrylak, S. Fafard, K. Hinzer, T. L. Reinecke, S. N. Walck, J. P.
132
REFERENCES
Reithmaier, F. Klopf, and F. Schafer, Fine structure of neutral and charged
excitons in self-assembled In(Ga)As/(Al)GaAs quantum dots, Phys. Rev.
B 65, 195315 (2002). 76, 82
[108] K. Kowalik, O. Krebs, A. Golnik, J. Suffczyński, P. Wojnar, J. Kossut,
J. A. Gaj, and P. Voisin, Manipulating the exciton fine structure of single
CdTe/ZnTe quantum dots by an in-plane magnetic field, Phys. Rev. B 75,
195340 (2007). 76, 80, 82
[109] M. Winger, A. Badolato, K. J. Hennessy, E. L. Hu, and A. m. c. Imamoglu,
Quantum Dot Spectroscopy Using Cavity Quantum Electrodynamics, Phys.
Rev. Lett. 101, 226808 (2008). 76
[110] D. Gammon, E. S. Snow, B. V. Shanabrook, D. S. Katzer, and D. Park,
Homogeneous linewidths in the optical spectrum of a single gallium arsenide
quantum dot, Science 273, 87 (1996). 78
[111] L. Besombes, L. Marsal, K. Kheng, T. Charvolin, L. S. Dang, A. Wasiela,
and H. Mariette, Fine structure of the exciton in a single asymmetric CdTe
quantum dot, Journal of Crystal Growth 214, 742 (2000). 79
[112] M. Bayer, A. Kuther, A. Forchel, A. Gorbunov, V. B. Timofeev, F. Schafer,
J. P. Reithmaier, T. L. Reinecke, and S. N. Walck, Electron and Hole g
Factors and Exchange Interaction from Studies of the Exciton Fine Struc-
ture in In0.60Ga0.40As Quantum Dots, Phys. Rev. Lett. 82, 1748 (1999).
80
[113] A. V. Koudinov, I. A. Akimov, Y. G. Kusrayev, and F. Henneberger, Optical
and magnetic anisotropies of the hole states in Stranski-Krastanov quantum
dots, Phys. Rev. B 70, 241305 (2004). 80
[114] K. Brunner, G. Abstreiter, G. Bohm, G. Trankle, and G. Weimann, Sharp-
Line Photoluminescence and Two-Photon Absorption of Zero-Dimensional
Biexcitons in a GaAs/AlGaAs Structure, Phys. Rev. Lett. 73, 1138 (1994).
81
133

REFERENCES
[115] H. W. van Kesteren, E. C. Cosman, W. A. J. A. van der Poel, and C. T.
Foxon, Fine structure of excitons in type-II GaAs/AlAs quantum wells,
Phys. Rev. B 41, 5283 (1990). 82
[116] E. L. Ivchenko, A. Y. Kaminski, and U. Rossler, Heavy-light hole mixing
at zinc-blende (001) interfaces under normal incidence, Phys. Rev. B 54,
5852 (1996). 82
[117] A. A. Toropov, E. L. Ivchenko, O. Krebs, S. Cortez, P. Voisin, and J. L.
Gentner, Excitonic contributions to the quantum-confined Pockels effect,
Phys. Rev. B 63, 035302 (2000). 82
[118] S. J. Cheng and P. Hawrylak, Controlling magnetism of semi-magnetic
quantum dots with odd-even exciton numbers, EPL 81, 37005 (2008). 82
[119] B. E. Larson and H. Ehrenreich, Anisotropic superexchange and spin-
resonance linewidth in diluted magnetic semiconductors, Phys. Rev. B 39,
1747 (1989). 99
[120] T. Dietl, P. Peyla, W. Grieshaber, and Y. M. d’Aubigne, Dynamics of Spin
Organization in Diluted Magnetic Semiconductors, Phys. Rev. Lett. 74,
474 (1995). 99, 102
[121] J. Lambe and C. Kikuchi, Paramagnetic Resonance of CdTe: Mn and CdS:
Mn, Phys. Rev. 119, 1256 (1960). 101
[122] M. Quazzaz, G. Yang, S. Xin, L. Montes, H. Luo, and J. Furdyna, Electron
Paramagnetic Resonance of Mn2+ in strained-layer semiconductor super-
lattices, Solid State Commun. 96, 405 (1995). 101, 103
[123] W. Low, Paramagnetic resonance in solids, in Solid State Physics, Vol. 2:
Supplement (Academic Press, New York, 1967). 103
[124] G. Yang, Electron Paramagnetic Resonance in II-VI Semiconductor Het-
erostructures, PhD thesis, University of Notre Dame, 1993. 103
134

REFERENCES
[125] M. Causa, M. Tovar, S. Oseroff, R. Calvo, and W. Giriat, Spin-lattice
coefficients of Mn2+ in IIVI compounds, Physics Letters A 77, 473 (1980).
103, 106
[126] E. R. Feher, Effect of Uniaxial Stresses on the Paramagnetic Spectra of
Mn3+ and Fe3+ in MgO, Phys. Rev. 136, A145 (1964). 106
[127] C. Bodin, R. Andre, J. Cibert, L. S. Dang, D. Bellet, G. Feuillet, and P. H.
Jouneau, Optical linewidth and field fluctuations in piezoelectric quantum
wells, Phys. Rev. B 51, 13181 (1995). 106
[128] L. Bogani and W. Wernsdorfer, Molecular spintronics using single-molecule
magnets, Nature Mater. 7, 179 (2008). 108
[129] A. Haury, A. Wasiela, A. Arnoult, J. Cibert, S. Tatarenko, T. Dietl, and
Y. Merle d’Aubigne, Observation of a Ferromagnetic Transition Induced by
Two-Dimensional Hole Gas in Modulation-Doped CdMnTe Quantum Wells,
Phys. Rev. Lett. 79, 511 (1997). 108
[130] T. Dietl, A. Haury, and Y. Merle d’Aubigne, Free carrier-induced ferro-
magnetism in structures of diluted magnetic semiconductors, Phys. Rev. B
55, R3347 (1997). 108
[131] K. V. Kavokin, Coherent dynamics of localized spins coupled with a two-
dimensional hole gas in diluted-magnetic quantum wells, Phys. Rev. B 59,
9822 (1999). 108
[132] P. Kossacki, D. Ferrand, M. Goryca, M. Nawrocki, W. Pacuski, W. Malana,
S. Tatarenko, and J. Cibert, Relaxation dynamics of ferromagnetic domains
in (Cd,Mn)Te quantum wells, Physica E: Low-dimensional Systems and
Nanostructures 32, 454 (2006). 108
[133] D. Scalbert, F. Teppe, M. Vladimirova, S. Tatarenko, J. Cibert, and
M. Nawrocki, Softening of spin resonance at low temperature in p-doped
Cd1−xMnxTe quantum wells, Phys. Rev. B 70, 245304 (2004). 108
135