“dynamics of stoichiometrical and metabolomical traits under climate change” jordi sardans,...
TRANSCRIPT

“Dynamics of stoichiometrical and metabolomical traits under climate change”
Global Ecology UnitCREAF – CSIC – CEAB
Barcelona
Jordi Sardans, Albert Rivas-Ubach, Albert Gargallo-Garriga, Ifigenia Urbina,Jofre Carnicer, Marc Estiarte, Iolanda Filella, Joan Llusià, Romà Ogaya, Josep Peñuelas

Stoichiometry-metabolomic studiesUseful traits to detct and study plant responses to environmental change
Climate change
Sensitivity enough to detect the dynamics of plant responses
PlantMetabolism and stoichiometry shifts
Mechanisms and functions involved in the organism response
Clues to global ecosystem impactsmainly by the effects on trophic webs
Potential improvement of global climate and balance models

Long-time field studies
My first studies of Biogeochemistry in the Global Ecology Unit
Climanani Garraf Site
Prades site

Drought impacts N and P concentrations and contents in Mediterraenan ecosystems
0
10
20
30
40
Protease -Glucosidase
En
zym
e a
cti
vit
y (
g s
ub
stra
te h
yd
roli
zed
g-1
so
il h
-1)
a
ab
b
b
a a
Control
Runoff exclussion
Runoff exclussion plus partial rainfall exclussion
After four years of drought (Mediterranean forest)
Data from Sardans & Peñuelas (2005)Soil Biology and Biochemistry
Four general results observed in all studies
1. Decreases in soil enzyme and root-enzyme activity
2. Decreases of N and P stocks in aboveground biomass3. Increases in total soil N and P stocks but decreses of plant-available stocks4. Changes in plant N:P stoichiometry
-4
0
4
8
Leaves Wood Aboveground
(a) (a)
(b)(b)
Arbutus unedo
50
0
50
a a
b b
Control
Drought
Quercus ilex
Biomass fraction
Total Aboveground
P in
crem
en
t
(k
g h
a-1)
(200
5-1
999
)
0
70
140
210
280
350
Leaves Stem Leaf-Litter
N/P
a
a
bb
bb
Control
Drought
Warming
Erica multiflora
Sardans & Peñuelas (2007)Functional Ecology
Sardans et al. (2008)Global Change Biology
0.05
0.1
So
il S
olu
ble
Pto
tal (
mg
g-1
)
a abb
0.05
0.1S
oil
So
lub
le P
o (
mg
g-1
)
ba a
0-15 cm soil depth
Treatments
0
0.1
0.2
0.3
0.4
C D DD
So
il S
olu
ble
Pi/P
o
a
ab b
Sardans and Peñuelas (2007)Functional Ecology

C/N/P ratio related to several ecosystems process
In freshwater ecosystems
N/P RNA(P-rich)
Growth rate
In terrestrial ecosystems No conclussive results of GR at this moment
Related to species diversity
Relatedto species style of life
Related to soil trophic web structure
Changes in N/P ratio is not a minor question
Growth Rate Hypothesis (GR)Elser et al. (1996)

0
0.05
0.1
So
il so
lub
le K
(mg
g-1
) aab b
0
0.002
0.004
C D DDS
oil
solu
ble
K/t
ota
l K
ab b
0-15 cm soil depth
Treatments
Sardans and Peñuelas (2007)Functional Ecology
But K-stocks were also afected by drought
Sardans et al. (2008)Plant and Soil
0
5
10
15
21
Leaves Stems
a
a
ab bb
b
0
2
4
6
8
10
Leaves Stems
a
b
a
Erica multiflora
Globularia alypum
Ab
so
lute
ab
ov
eg
rou
nd
K a
cc
um
ula
tio
n (
kg
ha
-1)
(19
99
-20
05
)
Plant biomass In soil

Quercus ilex
C
Ca
Fe
K
Mo
N
Na
P S Mg
-1.0 -0.5 0.0 0.5 1.0
PC1 (34%)
-1.0
-0.5
0.0
0.5
1.0
C C C
C
D
D
D
D
-4 -2 0 2 4
PC1 (34% )
-3
-2
-1
0
1
2
3
4
PC
2 (
19
%)
Control
Drought
PC
2 (1
9%)
Drought changes whole foliar elemental composition
C
C
D
D D
W W
W
-4 -2 0 2 4 6
PC1 (42% )
-4
-2
0
2
4
6
PC
2 (
29
%)
C
Drought
Warming
Control
Globularia alypum
C
Ca
Fe
K
M g
M o
N
Na
P S
-1.0 -0.5 0.0 0.5 1.0
PC1 (42%)
-1.0
-0.5
0.0
0.5
1.0
PC
2 (1
9%)
Peñuelas et al. (2008)Pol J Ecol
Soil stocks and biomass concentrations of other several elements (Mo, S or Ca) had been changed by drought
Sardans et a. (2008) Biogeochemistry, Sardans et al. (2008) J. Geophys. Res.

Climate change impact in terrestrial ecosystems stoichiometry: how can we advance?
1.Most studies have been focused on N and P (N/P ratio)
Capture our attention in current studies limitations
What dowe need?
1.More elements such as K, but also Mg, S or Ca among others should be considered
2. Stoichiometric studies of terrestrial plants have been mailny focused on foliar tissues, specially in trees
2. Plants also allocate nutrients to other tissues.We need when possible, take into account whole
plant stoichiometry
3. N/P stoichiometry of higher plants not only depends of the allocation to growth, several other functions can be important sinks for nutrients
3. To gain a global knowledgment of the functional causes underlie stoichiometric shifts in plant
responses to climate change
Sardans et al. (2012a) BiogeochemistrySardans et al. (2012b) Pers Plant Ecol Evol SystSardans and Peñuelas (2012) Plant Physiology
How can improve stoichiometry studiesto be a useful trait to detect dynamics
shifts in terrestrial plant vegetation
Experimental, observationals and review studies (reviews and meta-analysis)

We propose to solve these constrains and advance in the frame of climate change impacts on terrestrial plant communities
Plant functional response
Climate change
Soil resources
Impacts on biotic relationships (competition, herbivorism….)
Change in element use
Changes in gene expresion
Changes in metabolism and molecular structure
Wholel plant stoichiometrical change
1 2
1. Ecometabolomic studies
2. Include other elements such as K.Study the elemental composition and its shifts as a whole
Make the next reasonig

We developed a method to conduct metabolomic analyses with field sampling
Rivas-Ubach et al. (2013)Methods in Ecology and Evolution
We began to use metabolomics analyses in our studies 2

Plants under different climate conditions shift their metabolism. The corresponding metabolomic analysis informs on the molecular causes underlying the shifts in elemental composition
and stoichiometrical ratios
Rivas-Ubach et al. (2012) PNAS
Stoichiometry+
MetabolomicsElemental
Stoichiometry
MetabolomeN/PSugarsAmino acids
S
Spring Season

Preliminary Results
Metabolomic profiling of Quercus ilex.
Seasonal PCA
Drought:
Polyphenolics (antioxidants)Potassium

Oposite responses of roots and leaves

Ecometabolomics : a tool for several ecological estudiesGreat sensitivity to detect plant responses
• When the plant is wounded the metabolome changes
WoundedNo-wounded
Sardans et al. (2013)Plant Biology
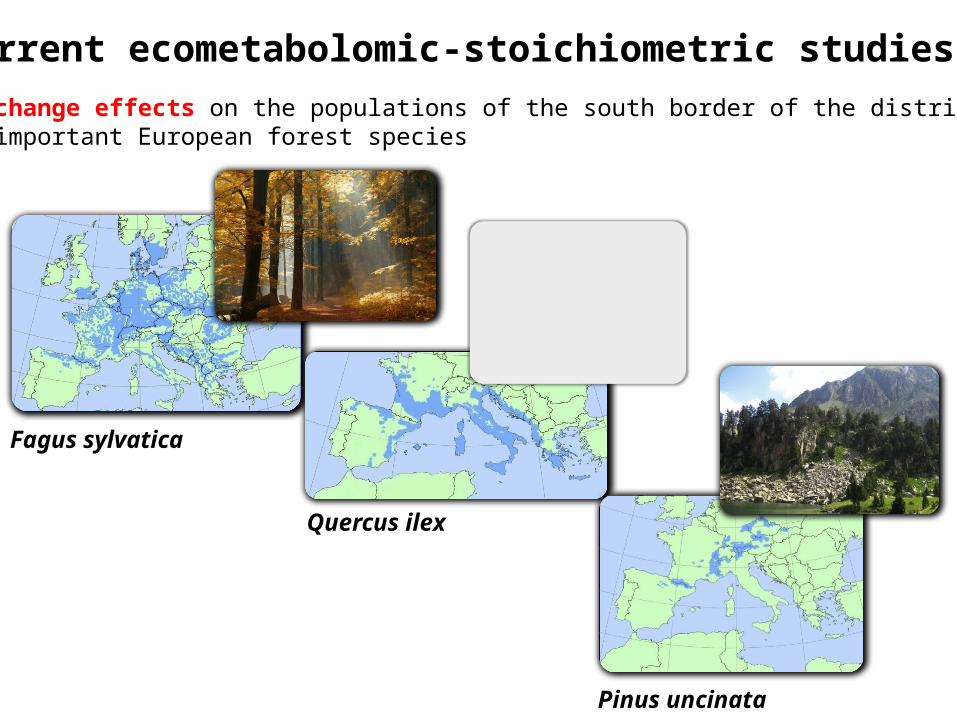
Current ecometabolomic-stoichiometric studiesClimate change effects on the populations of the south border of the distribution Area of important European forest species
Fagus sylvatica
Quercus ilex
Pinus uncinata

Stoichiometry and Metabolism on plant-herbivore relationship
Pine processionary mothsThaumetopoea pityocampa

Until this moment the results show that metabolomics can be an useful tool:
1. To give a global view of plant functions involved in plant responses
2.To explain the causes of plant elemental compostion and stoichiometrical shifts under drought
3. To improve the kowledge of the metabolic pathways up– and down-regulated under drought .
4.Is sensitive enough to detect plant molecular and elemental shifts under different environmental conditions through time
5.To know plant responses to herbivore attack

The role of potassium
Data from Catalan National Forestal Inventory
Foliar K content (kg ha-1) Foliar K:C content ratio Foliar K:N content ratio
0.007- 4.31
4.31 – 7.65
7.65 – 12.66
12.66 – 22.43
> 22.43
8.2 – 72.7
72.7 – 92.2
92.2 – 114.2
114.2 – 152.7
> 152.7
0.5897 – 1.6434
1.6434 – 2.0491
2.0491 – 2.5288
2.5288 – 3.4242
> 3.4242
Foliar K concentration (mg g-1)
> 7.62
5.67 – 7.62
4.52 – 5.67
3.41 – 4.52
1.0 – 3.41
Precipitation (L m-2 yr-1)
< 400
400-500
500-600
600-700
700-800
800-900
900-1000
1000-1100
1100-1200
> 1200
50 Km
0
10
20
30
Evergreens Conifers Deciduous
K c
on
ten
t in
fo
liar
bio
mas
s (k
g h
a-1
)
a
aa
b
b
ab
ab
ab
WinterSpring
Summer
Autumn
Sardans et al. (2012)Functional Ecology
K content is related with MAP
Species adapted to dry climate have higher capacity to allocate more K to foliar biomass during summer
2Second: Whole plant elemental composition

Have we neglegted the K limiting role in terrestrial ecosystems?
Sardans et al. (2012)Global Change Biology (in preparation)
0
10
20
30
40
Grasslands Forests
No-limitingLimiting
1
11
3
33
Nu
mb
er o
f s
tud
ies
Vegetation type
75% of field studies have observed that K limits growth of terrestrial plants in field conditions
Review of published data

Climate change effects on global plant elemental composition
Different elements plays different functional and structural functions
C (structure,..)
N (growth, light capture, metabolism functioning,..)
P (growth, energy transfer,…)
K (water economy, internal transport,…)
Mg (light capture,…)
“Biogeochemical niche”
Each species, as a singular evolutionary product,should have an optimum elemental compositionas consequence of optimum function
Consequence of the optimum adaptation to maximize species fitness in determined abiotic and biotic circumstances, i. e. consequence of long-term genetic adaptation (Genotype)
, but also of short-term capacity to respond under certain limits to life-time environmental competition shifts (Phenotype flexibility)
Peñuelas et al. (2010) Global Change Biology

Principal component 1: 35.6%
-3 -2 -1 0 1 2 3
Pri
nci
pa
l co
mp
on
en
t 2:
15
.4%
-6
-4
-2
0
2
4
6
Principal component 1: 35.6%
-1.0 -0.5 0.0 0.5 1.0
Pri
nci
pa
l co
mp
on
en
t 2:
15
.4%
-1.0
-0.5
0.0
0.5
1.0
Na
ZnCu
K
N
Fe
NiAlienNative
-2
0
2
4
6
8
-5 -4 -3 -2 -1 0 1
PC
2 (
22
.7%
)
PC1 (28.6%)
F. excelsior
Q. petrea
Q. canariensis
C. sativaF. sylvatica
Q. humilis x cerrioidesQ. faginea
Q. humilis
Q. cerrioides
Q. suberA. unedo
Q. ilex
P. sylvestris
P. pinea
A. alba
P. halepensis P. pinaster
P. nigraP. uncinata
C
N P
NP
NK PK
S Ca
M g
K
-1.0 -0.5 0.0 0.5 1.0
PC1 (28.6%)
-1.0
-0.5
0.0
0.5
1.0
PC
2 (2
2.7%
)
C
N P
NP
NK PK
S Ca
M g
K (A)
(B)
(C)
Mediterranean
Wet temperate
Alpine
Transition Med-Temp.
Gymnosperms
Angiosperms
200 400 600 800 1000 1200 1400
M AP (L m -2 yr -1)
-10
-5
0
5
10
15
PC
2
PC 2 = - 1.68 + 0.0021 MAP R = 0.26, P < 0.0001
C
N P
N/P
N/K
P/K
S
Ca
Mg
K
-1.0 -0.5 0.0 0.5 1.0
PC1 (27.7%)
-1.0
-0.5
0.0
0.5
1.0
PC
2 (2
0.7%
)
C
N P
N/P
N/K
P/K
S
Ca
Mg
K
-6
-3
0
3
-0.6 0 0.6 1.2
PC
2 (2
0.7%
)
PC1 (27.7%)
P. halepensis (3)
P. pinea (4)
C. sativa (8)
P. pinaster (2) P. nigra (ab)
Q. suber (7)
A. unedo (6)Q. ilex (5)
Angiosperms
Gimnosperms
(1) a
(2) ab(3) b(4) c
(5) d(6) d
(7) e
(8) f
(3) (4) (5)
(1)
(1,2,7,8) (6)a b c
bc
(A)
(B)
Separated throughout PC4
(explaining12% of variability)
“Biogeochemical niche” in action Native and alien species in Hawai
Different forest types in Catalonia
Mediterranean species
Peñuelas et al. (2010)Global Change Biology

Until this moment the results show that the use of more elements that N and P
Give a more global view of the use of resources
Improve the sensitivity in the use of plant elemental composition shift to detect responses to environmental change

N eutrophication threatens to shift the global stoichiometry
4
8
12
16
8.8
17.7
26.4
35.4
1950s 1980s 1990s 2000s1860s 1900s
N:P
ra
tio
(m
ola
r b
as
is)
N:P
ra
tio
(m
as
s b
as
is)
Natural N2 fixation from continents plus oceans
Natural N2 fixation from continents
Redfield’s ratio
0
50
100
150
200
250
300
350
400N from industrial fertilizersN emissions from fuel combustionN
2 fixation of rice and legume crops
Total anthropogenic NTotal anthropogenic P (mineral fertilizers)
Tg
ye
ar-
1
Global N deposition~ 114 Mtones N yr-1
Global P deposition~ 3.3 Mtones N yr-1
ContinentsN:P ~ 47
Oceans N:P ~ 370
Terrestrial plantsN:P ~ 22-30
Plankton and open ocean watersN:P ~ 15-16
63 0.3
51 3
Peñuelas et al. (2012)Global Change Biology
Changing from local to global scale

Number of “Web of Science” studies reporting effects of changes in N:P ratios and its effects on ecosystems
species composition and function
Human induced chsnges on N/P ratios are already altering ecosystems function and biodiversity by the impacts on N/P ratio is already occuring
Peñuelas et al. (2013)
Natre Communications Submitted.

Global P-cycle is being altered by human activity
Peñuelas et al. (2013)Nature Communicatios(Submitted)

Global climate and C-balance models related to global change should include the changes in nutrients balances and stoichiometry
Our first attempt...Projections under different scenarios of the P demands to fixing C emitted by human activities. The models used were TAXIS, HadCM3, IPSL-CM2 , IPSL-CM4-LOOP, CSM, MPI, LLNL,
FRCGC, UMD, UVIC, CLIMBER, BERNCC
Peñuelas et al. (2013)Nature Geoscience (submitted)
Phosphorus and N/P ratio could be gaining role in global capacity to C fixation andconsequently in the global climatic control

Ecometabolomics-stoichiometric studies
A new tool to study plant responses to climate change
Whole elemental composition shiftsWhole metabolome shifts
Sensitive traits to detect dynamic plant responses
Improvement of the knowledge of the functional mechanisms underliying plant responses (growth, storage, defense, antistress….)
Clues on further consequences throughout trophic web
Useful information to improve global elemental budgets (C, N, P,..) and climatic models

Global Ecology UnitCREAF – CSIC – CEAB
Barcelona
Thank you by your attention and…………by no sleepping (if is the case)
From elements toglobal scale