dynamics of nitrate transfer from agricultural soils to
TRANSCRIPT

Somers, G. and Savard, M. M. (2008) Dynamics of nitrate transfer from agricultural soils to aquifers inferred from stable isotopes. In: Proceedings of the 2008 American Water Works Association Inorganic Contaminants Workshop, Albuquerque, NM. January 27-29. American Water Works Association, Denver, CO. On CD ROM Session MON3
1
Dynamics of nitrate transfer from agricultural soils to aquifers inferred from stable
isotopes
Authors
George Somers, Prince Edward Island Department of Environment, Energy & Forestry
Martine M. Savard, Natural Resources Canada (Geological Survey of Canada)
Abstract
Contamination of groundwater (GW) by nitrate from agricultural sources is of particular
importance in Prince Edward Island (Canada), where agricultural lands dominate the
landscape and GW is the sole source of potable water. In this region and in many others,
the transfer of N compounds from agricultural soils to aquifers is a key process, and it is
important to assess if values coming from residual soil nitrate estimations, and associated
estimates of N loading to aquifers match estimations based on GW concentrations
measured at the top of aquifer. The nitrate “dual isotope” characterization is gaining
popularity in the field of hydrogeochemistry, and such study promises to shed important
insights into the processes involved in the transport of nitrogen from agricultural soils to
GW. The current watershed scale sampling program indicates that nitrate concentrations
in the region are relatively stable throughout the year, as are the water isotope
characteristics (δ2Η and δ
18O) in both surface water (SW) and GW. In contrast δ
18O
values in dissolved nitrate in both GW and SW display distinct seasonal characteristics.
The differing behavior of the water and nitrate oxygen isotopes can be resolved by
invoking mixtures of recent recharge water (soil leachate) characterized by high nitrate
concentrations and seasonally distinct isotopic characteristics, with deeper and older
multi-year GW having lower nitrate concentrations and practically uniform isotopic
characteristics. Mixing 25% or less of seasonal recharge with older, less impacted GW
accounts for the observed characteristics of GW from domestic wells, implying that the
greatest proportion of N flux in GW is at this time restricted to relatively shallow portions
of the aquifer. This same rationale also helps explain why currently observed nitrate
concentrations in well water in the watershed are below those that would otherwise be
expected based on calculated estimates of nitrate loading to the aquifer.
Introduction Prince Edward Island (PEI) residents are 100% dependent on GW for potable uses and
for the vast majority of industrial and commercial water use (Natural Resources Canada,
2005; Piggott et al., 2001). Agricultural activities dominate both the landscape and the
economy of the province, and contamination of GW by nitrate from agricultural sources
is a significant concern. The distribution of nitrate in GW in the province has been well
studied for decades, and linkages have been drawn between the intensity of agricultural
activity and average nitrate levels, with the closest association being between row crop
production and elevated nitrate levels, rather than livestock production.
The traditional understanding of the key sources and behavior of nitrogen in the local
environment had been mostly limited to the interpretation of field scale agricultural
experiments for individual crops. More recently the fate of nitrate has been examined in
the province at a watershed scale, combining stable isotope techniques with a program of
seasonal sampling of GW, SW and precipitation (Savard et al., 2007 a, b).

Somers, G. and Savard, M. M. (2008) Dynamics of nitrate transfer from agricultural soils to aquifers inferred from stable isotopes. In: Proceedings of the 2008 American Water Works Association Inorganic Contaminants Workshop, Albuquerque, NM. January 27-29. American Water Works Association, Denver, CO. On CD ROM Session MON3
2
Nitrate concentrations measured in GW from individual wells, and for the watershed as a
whole show only limited seasonal variation. Similarly, δ2Η and δ
18O results for GW and
SW in the study area are relatively consistent throughout the year. In marked contrast,
δ18
O values in the nitrate ion show distinct seasonal changes (Savard et al., 2007b). An
examination of the combined phenomena of nearly constant nitrate concentrations and
δ18
O ratios in water and distinct seasonal δ18
O ratios in the nitrate ion, provides
interesting clues to the nature of the local GW flow regime and the behavior of nitrate in
this environment. Overall, our approach in this paper is to focus primarily on reconciling
the difference in seasonal δ18
O ratios in GW and the nitrate ion, using both hydraulic and
geochemical arguments. Following from this same line of reasoning, we go on to discuss
how these findings bear on the apparent discrepancy between measured nitrate
concentrations in the GW and expected concentrations based on calculated N inputs to
the aquifer
Study Setting The Province of PEI is situated in the Gulf of St. Lawrence in eastern Canada, with a
total land mass of only 5684km2, and a population of just under 140,000. The province
has a coastline of 805km, indented by frequent estuaries and bays. Topography is gently
undulating to flat, with a maximum elevation of 152 m above sea level. The province has
numerous short river systems, with the estuarine portion of these rivers comprising a
significant portion of their overall length. The climate of PEI is humid-continental, with
long, fairly cold winters and warm summers. Mean annual precipitation, at the
Summerside meteorological Station in the central portion of the island is 1078mm, most
of which falls as rain (approximately 75%), the remainder falling as snow. The mean
annual temperature is about 5.1 C and means for monthly temperature range from minus
8.6 C in January, to 18.4 C in July.
The geology of PEI is dominated by an essentially flat lying sequence of continental red
beds, Upper Pennsylvanian to Middle Permian in age. These sequences consist of
conglomerate, sandstone and siltstone red beds, exhibiting rapid lateral and vertical facies
changes. Bedrock is almost entirely covered by a layer of unconsolidated glacial material
from a few centimetres to several meters in thickness (Prest, 1973). These deposits are
dominantly unsorted tills with rare water-worked glacio-fluvial and glacio-marine
deposits. With few exceptions these surface deposits are not saturated, and as a
consequence the underlying bedrock formations are the only significant aquifers. The
aquifers are characterized as dual porosity in nature, with fractures controlling GW flow,
and matrix porosity determining storage characteristics. In most parts of the Island the
aquifer is unconfined but because of the dominance of sub-horizontal fractures and
delayed drainage, the response under shorter term pump tests resembles that of a confined
aquifer. The geometry of individual GW flow systems is generally controlled by
topography and the boundaries of these systems generally mimic local surface watershed
boundaries. Groundwater and SW resources are closely linked with GW discharge (base
flow) accounting for two thirds of annual stream flow, and during dry periods, nearly all
stream flow represents this base flow.

Somers, G. and Savard, M. M. (2008) Dynamics of nitrate transfer from agricultural soils to aquifers inferred from stable isotopes. In: Proceedings of the 2008 American Water Works Association Inorganic Contaminants Workshop, Albuquerque, NM. January 27-29. American Water Works Association, Denver, CO. On CD ROM Session MON3
3
Groundwaters are typically of a Ca-HCO3 or Ca-Mg-HCO3 type, depending on the
dominant cementing agent in the matrix, although natural ion exchange processes result
in Na-HCO3 type waters in deeper portions of some longer flow systems. Na-Cl type
waters occur locally in some coastal areas, but are generally limited to a few 100’s of
meters from the coast. Fresh SW quality generally mimics GW quality, except for those
periods of the year where it is diluted by direct overland runoff.
The current study area comprises the Wilmot watershed, located in the west-central
portion of the Province. The watershed was selected for study because of the history of
intense row crop production, the availability of data from previous studies and surveys,
and a history of elevated nitrate concentrations in both GW and SW. The Wilmot River
drains an area of about 87km2 and flows south-westerly to Bedeque Bay on
Northumberland Straight. The basin is approximately 17km in length and 5km wide, with
nearly half of the river tidally influenced. Maximum elevations in the watershed (90m
above sea level) are found at the headwaters in the eastern extent of the watershed.
The watershed is predominantly rural in character, with the population residing in
dispersed homes and farmsteads, and a few small hamlets. Agricultural activities cover
76% of the watershed, the remaining land occupied by forest (11%,) residential
development (9%,) and wetland areas. Potato production dominates agricultural activity
in the watershed, accounting for 80% percent of agricultural land use, and 60% percent of
total land use in the watershed. Typical potato production systems are maintained as two
or three year rotations (ie , potato followed by hay, or potato, followed by a cereal crop,
followed by hay).
The geology and hydrogeology of the watershed is characteristic of other areas of the
Province, with sandstone, dominating the sequence tapped by domestic or commercial
wells, with locally variable amounts of inter-bedded siltstones and mudstones. Hydraulic
conductivities determined from packer tests of discrete intervals (Paradis et al., 2007)
show significant decreases with depth, a phemomenon also recognized by Francis (1989)
in work in the nearby Winter River Basin. The aquifer displays significant vertical
horizontal anisotropy, with Kh being several orders of magnitude higher than Kv (Francis,
1989; Jiang et al., 2007). This is generally attributed to the dominant role that sub-
horizontal fractures play in determining GW flow, a feature that becomes less significant
with depth in the aquifer.
Sampling and Analytic Methods
Samples were collected on a seasonal basis from domestic wells over the period between
summer 2003 and spring 2005, and supplemented by samples collected from dedicated
piezometer installations, the Wilmot River and temporary rain collectors. Domestic well
sampling locations were distributed across the watershed, and all wells are of open hole
construction, completed in bedrock. The wells have an average depth of 18m and are
generally cased down to the overburden-rock contact. The water level is generally below
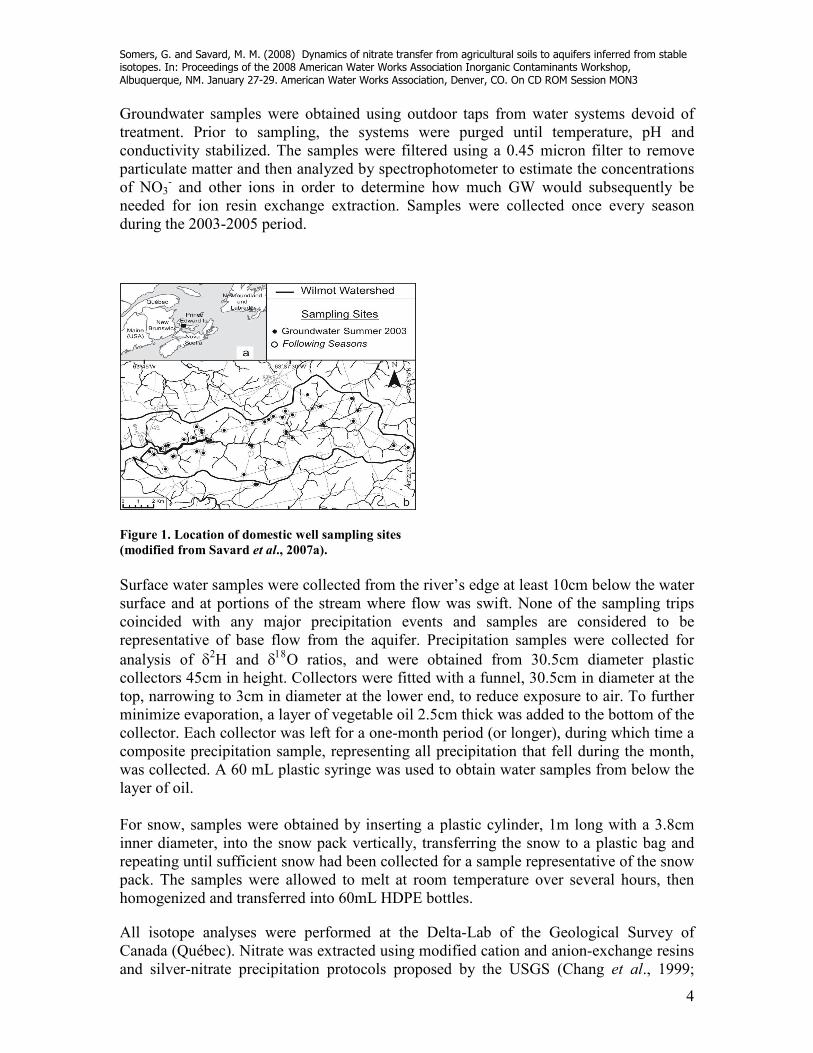
the casing, in the rock formations. The locations of domestic wells sampled during the
program are shown on Figure 1.
Somers, G. and Savard, M. M. (2008) Dynamics of nitrate transfer from agricultural soils to aquifers inferred from stable isotopes. In: Proceedings of the 2008 American Water Works Association Inorganic Contaminants Workshop, Albuquerque, NM. January 27-29. American Water Works Association, Denver, CO. On CD ROM Session MON3
4
Groundwater samples were obtained using outdoor taps from water systems devoid of
treatment. Prior to sampling, the systems were purged until temperature, pH and
conductivity stabilized. The samples were filtered using a 0.45 micron filter to remove
particulate matter and then analyzed by spectrophotometer to estimate the concentrations
of NO3- and other ions in order to determine how much GW would subsequently be
needed for ion resin exchange extraction. Samples were collected once every season
during the 2003-2005 period.
Figure 1. Location of domestic well sampling sites
(modified from Savard et al., 2007a).
Surface water samples were collected from the river’s edge at least 10cm below the water
surface and at portions of the stream where flow was swift. None of the sampling trips
coincided with any major precipitation events and samples are considered to be
representative of base flow from the aquifer. Precipitation samples were collected for
analysis of δ2Η and δ
18O ratios, and were obtained from 30.5cm diameter plastic
collectors 45cm in height. Collectors were fitted with a funnel, 30.5cm in diameter at the
top, narrowing to 3cm in diameter at the lower end, to reduce exposure to air. To further
minimize evaporation, a layer of vegetable oil 2.5cm thick was added to the bottom of the
collector. Each collector was left for a one-month period (or longer), during which time a
composite precipitation sample, representing all precipitation that fell during the month,
was collected. A 60 mL plastic syringe was used to obtain water samples from below the
layer of oil.
For snow, samples were obtained by inserting a plastic cylinder, 1m long with a 3.8cm
inner diameter, into the snow pack vertically, transferring the snow to a plastic bag and
repeating until sufficient snow had been collected for a sample representative of the snow
pack. The samples were allowed to melt at room temperature over several hours, then
homogenized and transferred into 60mL HDPE bottles.
All isotope analyses were performed at the Delta-Lab of the Geological Survey of
Canada (Québec). Nitrate was extracted using modified cation and anion-exchange resins
and silver-nitrate precipitation protocols proposed by the USGS (Chang et al., 1999;

Somers, G. and Savard, M. M. (2008) Dynamics of nitrate transfer from agricultural soils to aquifers inferred from stable isotopes. In: Proceedings of the 2008 American Water Works Association Inorganic Contaminants Workshop, Albuquerque, NM. January 27-29. American Water Works Association, Denver, CO. On CD ROM Session MON3
5
Silva et al., 2000). The extraction is followed by analyses of the δ15
N and δ18
O ratios,
using on-line combustion and pyrolysis-IRMS systems, respectively. Average precision
obtained on sample duplicates (n=86, 161) is 0.1‰ for δ15
N and 0.2‰ for δ18
O. Analysis
of nitrate concentrations was conducted at the AAFC-Québec laboratory by Flow
Injection Analysis (FIA) colorimetric method (LACHAT) for which the detection limit
was 0.04 mg/L N-NO3- (1.53 mg/L NO3
-) and the precision was 0.09 N-NO3
- mg/L (0.4
mg/L NO3-).
Results
Groundwater samples exhibited a broad range of nitrate concentrations, from site to site
(<1 to 14.6mg/L N-NO3-), but were relatively consistent at individual sites throughout the
8 sampling periods, averaging 6.9mg/L. Seasonal mean values for individual sampling
campaigns ranged from 5.5 to 8.1mg/L, Overall, 22% of the summer GW samples have
N-NO3- concentrations above the 10mg/L drinking water guideline recommended by
Health Canada (2004), whereas 7% of summer GW samples have concentrations of less
than 1mg/L, expected for areas devoid of human impacts.
Samples from the Wilmot River exhibited a narrower range of values, falling between 5.1
and 7.7mg/L, assumed to represent base-flow conditions, essentially an integration of
shallow GW discharges throughout the watershed. On average, nitrate concentrations in
SW are very similar to those for GW, with an average of annual value of 6.2mg/L(N-
NO3-), and limited seasonal variation with average concentrations of 6.6, 6.5, 6.2 and
5.4mg/L (N-NO3-) for summer, autumn, winter and spring samples, respectively.
Oxygen isotope ratios for GW samples showed only very limited seasonal variation,
averaging -11.1‰ and ranging from -11.2 to – 10.50/00. Surface water values displayed an
essentially identical pattern averaging -11.1‰ and ranging from -12.5 to -9.6‰. Figure
2. presents δ2H and δ
18O results for both GW and SW, which cluster on or near the local
meteoric water line (MWL). The results have been interpreted by Liao et al., 2005 to
indicate that GW is derived from local precipitation and SW samples are likely derived
primarily from local GW discharge.

Somers, G. and Savard, M. M. (2008) Dynamics of nitrate transfer from agricultural soils to aquifers inferred from stable isotopes. In: Proceedings of the 2008 American Water Works Association Inorganic Contaminants Workshop, Albuquerque, NM. January 27-29. American Water Works Association, Denver, CO. On CD ROM Session MON3
6
-130
-120
-110
-100
-90
-80
-70
-60
-50
-40
-30
-20
-10
0
-20 -15 -10 -5 0
GW SW RAIN SNOW
δ18
O (‰)
δ2H
(‰
)
MWL Truro
H = 7.30 O + 3.59(Fritz et al., 1987)
δ δ2 18
MWL Charlottetown
H = 6.86 O + 6.23(Francis, 1989)
δ δ2 18
Figure 2. Groundwater and surface water samples in
relation to local meteoric water lines (Liao et al., 2005).
Analysis of extracts of dissolved nitrate for δ15
N showed moderate seasonal variation
with mean values ranging from 3.4 to 4.9‰, over the 8 sampling campaigns. In marked
contrast, mean seasonal δ18
O ratios ranged from a high of +10.5‰ in the summer of 2003
to a low of -2‰ the following spring. A similar, though less dramatic downshift in δ18
O
ratios is observed during the following year. Table 1 summarizes mean seasonal results
for NO3-N and δ18
O in GW and δ18
O in the nitrate ion, and Figure 3 illustrates
graphically the results for the 1st year of sampling.

Somers, G. and Savard, M. M. (2008) Dynamics of nitrate transfer from agricultural soils to aquifers inferred from stable isotopes. In: Proceedings of the 2008 American Water Works Association Inorganic Contaminants Workshop, Albuquerque, NM. January 27-29. American Water Works Association, Denver, CO. On CD ROM Session MON3
7
Table 1. Average characteristics of groundwater and nitrate dissolved in
groundwater measured seasonally in domestic wells.
Season Summer
2003
Autumn
2003
Winter
2004
Spring
2004
Summer
2004
Autumn
2004
Winter
2005
Spring
2005
NO3--N (mg/L) 7.2 6.5 6.4 5.5 8.1 6.9 7.1 7.4
Water δ18O (‰) -11.1 -11.2 -11.0 -11.2 -11.1 -11.1 -10.5 -11.2
Nitrate δ18
Ο (‰) 10.5 8.1 -1.2 -0.2 2.3 2.1 -0.2 2.0
Figure 3. Seasonal results for 1st year of sampling program, NO3
--N and δ
18O ratios in groundwater,
and δ18
O ratios in nitrate dissolved in groundwater.
Interpretation and Discussion
The results described above have a number of implications regarding the behavior of
nitrate in the local GW flow regime, as well as for an understanding of the relative
importance of different N sources during different seasons (described in detail by Savard
et al. (2007a, b). Briefly, Savard et al. (2007b) attribute the distinct decrease in δ18
O
ratios in the nitrate ion during cold periods to active nitrification even during the winter
and spring periods of the year, a phenomenon not well recognized in the literature for
temperate climatic regimes. Essentially, as nitrification proceeds, the incorporation of 2/
-15
-10
-5
0
5
10
15
Summer '03 Fall '03 Winter '03/'04 Spring '04
sample season
NO3-N (mg/L) in water
δ18
O in water (‰)
δ18
O in nitrate (‰)

Somers, G. and Savard, M. M. (2008) Dynamics of nitrate transfer from agricultural soils to aquifers inferred from stable isotopes. In: Proceedings of the 2008 American Water Works Association Inorganic Contaminants Workshop, Albuquerque, NM. January 27-29. American Water Works Association, Denver, CO. On CD ROM Session MON3
8
3rds of the oxygen in the nitrate ion from soil water, carries a seasonally distinct isotopic
ratio providing clues on the timing of nitrification. This characteristic, in conjunction
with δ15
N ratios in the nitrate ion, assists in quantifying the relative importance of
individual N sources at different times of the year (Savard et al., 2007a; Somers et al.,
2007). Here, to explain the difference in seasonal characteristics of δ18
O in H2O as
compared with δ18
O in NO3- we propose a conceptual model involving the mixing of
shallow, nitrate rich soil leachate, bearing the seasonal δ18
O(NO3) characteristics resulting
from incorporation of seasonal precipitation, with deeper, multi-season or multi-year GW
with lower nitrate concentrations and uniform isotopic characteristics. The plausibility of
this model is first evaluated from a hydraulic perspective, and subsequently by a series of
geochemical mixing calculations.
It has already been noted that the local aquifer is characterized by declining hydraulic
conductivity with depth, and by corollary, it can be assumed that the greatest contribution
of water to a well penetrating the aquifer will be from the highest part of the well bore,
with progressively decreasing contributions with depth. Given a reasonable estimate of
the specific yield (Sy) of the aquifer, and of the flux of recharging water at any particular
time, it is possible to estimate the vertical extent of the aquifer (or well bore) influenced
by recent recharge events, in contrast to deeper portions of the well receiving older water
accumulated over a number of seasons or years.
While direct measurement of Sy is difficult, reasonable estimates can be made based on
lithology, and by interpretation of numerical GW modeling results. Driscoll (1986)
suggests typical Sy values for sandstones ranging from 5 to 15%, and Francis (1989)
estimated a value in the range of 10% for sandstones of the same geological formation in
the nearby Winter River basin. Interpretation of modeling simulations using MODFLOW
(Jiang and Somers, 2007), and FEFLOW (Paradis et al, 2007) produced estimates of Sy
of 5% to 10% and 10% respectively. Given our interest here in the characteristics of the
very top of the aquifer where fracturing is most significant, it is likely that a value near
the upper end of this range is most appropriate. In addition, it can be expected that under
pumping stress the hydraulic gradient toward a well will be greatest in the upper portions
of the well bore (i.e. within the cone of depression), emphasizing the relative contribution
of the upper most portion of the well. Therefore Sy values in the range of 10 to 15% are
suggested for the uppermost portion of the aquifer.
Typical estimates for annual recharge, based both on base-flow separation and
interpretation of numerical simulation results are in the vicinity of 400mm/year. While
the magnitude of individual recharge events will vary from year to year, typically in PEI
major recharge events are restricted to the spring and fall, with the spring event in most
years being more significant because of the combined influence of recent precipitation
and melting of the winter snow pack. Because of the variability of both the total amount
of annual recharge, and the relative proportions for the spring and fall periods, it is
assumed here that recharge is split equally between these two periods. With values of Sy
in the range of 10 to 15%, it is apparent that the influence of seasonal recharge (recent
soil water leachate) is limited to approximately the top 1 to 2m of the aquifer.
To assess the contribution of this shallow portion of the aquifer relative to contributions
from deeper portions of the aquifer, we can use the vertical distribution of hydraulic
Somers, G. and Savard, M. M. (2008) Dynamics of nitrate transfer from agricultural soils to aquifers inferred from stable isotopes. In: Proceedings of the 2008 American Water Works Association Inorganic Contaminants Workshop, Albuquerque, NM. January 27-29. American Water Works Association, Denver, CO. On CD ROM Session MON3
9
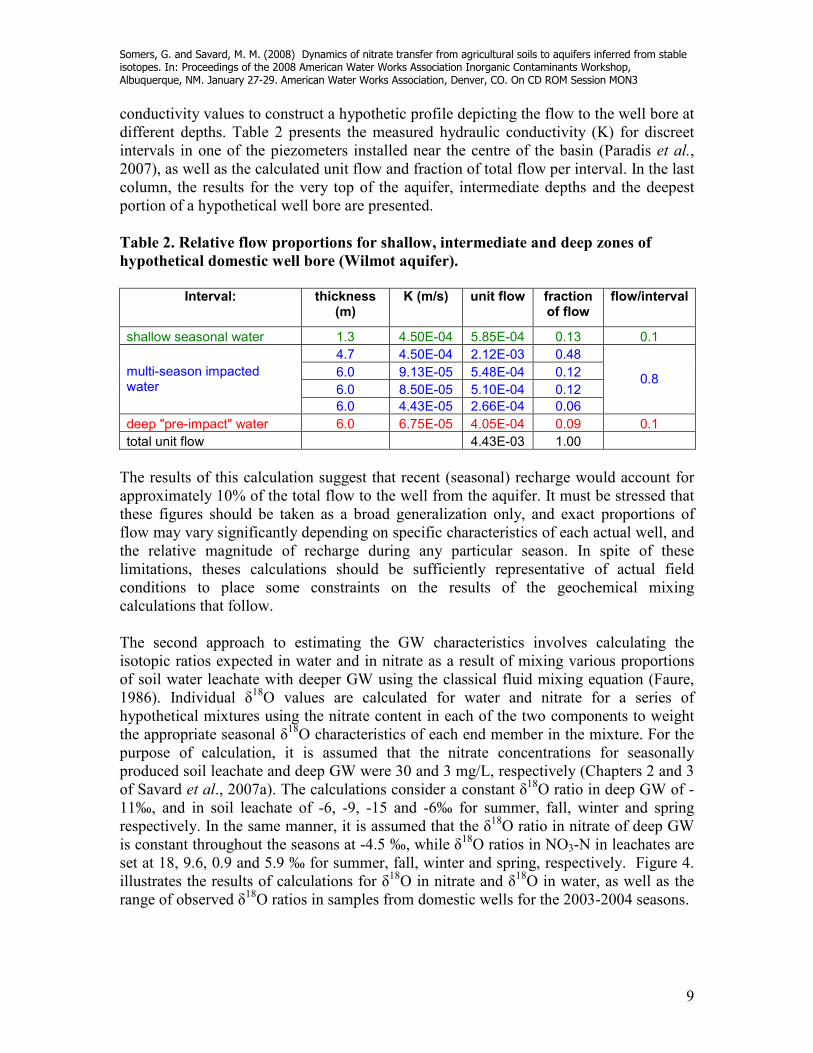
conductivity values to construct a hypothetic profile depicting the flow to the well bore at
different depths. Table 2 presents the measured hydraulic conductivity (K) for discreet
intervals in one of the piezometers installed near the centre of the basin (Paradis et al.,
2007), as well as the calculated unit flow and fraction of total flow per interval. In the last
column, the results for the very top of the aquifer, intermediate depths and the deepest
portion of a hypothetical well bore are presented.
Table 2. Relative flow proportions for shallow, intermediate and deep zones of
hypothetical domestic well bore (Wilmot aquifer).
Interval: thickness
(m) K (m/s) unit flow fraction
of flow flow/interval
shallow seasonal water 1.3 4.50E-04 5.85E-04 0.13 0.1
4.7 4.50E-04 2.12E-03 0.48
6.0 9.13E-05 5.48E-04 0.12
6.0 8.50E-05 5.10E-04 0.12
multi-season impacted water
6.0 4.43E-05 2.66E-04 0.06
0.8
deep "pre-impact" water 6.0 6.75E-05 4.05E-04 0.09 0.1
total unit flow 4.43E-03 1.00
The results of this calculation suggest that recent (seasonal) recharge would account for
approximately 10% of the total flow to the well from the aquifer. It must be stressed that
these figures should be taken as a broad generalization only, and exact proportions of
flow may vary significantly depending on specific characteristics of each actual well, and
the relative magnitude of recharge during any particular season. In spite of these
limitations, theses calculations should be sufficiently representative of actual field
conditions to place some constraints on the results of the geochemical mixing
calculations that follow.
The second approach to estimating the GW characteristics involves calculating the
isotopic ratios expected in water and in nitrate as a result of mixing various proportions
of soil water leachate with deeper GW using the classical fluid mixing equation (Faure,
1986). Individual δ18
O values are calculated for water and nitrate for a series of
hypothetical mixtures using the nitrate content in each of the two components to weight
the appropriate seasonal δ18
O characteristics of each end member in the mixture. For the
purpose of calculation, it is assumed that the nitrate concentrations for seasonally
produced soil leachate and deep GW were 30 and 3 mg/L, respectively (Chapters 2 and 3
of Savard et al., 2007a). The calculations consider a constant δ18
O ratio in deep GW of -
11‰, and in soil leachate of -6, -9, -15 and -6‰ for summer, fall, winter and spring
respectively. In the same manner, it is assumed that the δ18
O ratio in nitrate of deep GW
is constant throughout the seasons at -4.5 ‰, while δ18
O ratios in NO3-N in leachates are
set at 18, 9.6, 0.9 and 5.9 ‰ for summer, fall, winter and spring, respectively. Figure 4.
illustrates the results of calculations for δ18
O in nitrate and δ18
O in water, as well as the
range of observed δ18
O ratios in samples from domestic wells for the 2003-2004 seasons.

Somers, G. and Savard, M. M. (2008) Dynamics of nitrate transfer from agricultural soils to aquifers inferred from stable isotopes. In: Proceedings of the 2008 American Water Works Association Inorganic Contaminants Workshop, Albuquerque, NM. January 27-29. American Water Works Association, Denver, CO. On CD ROM Session MON3
10
Figure 4. Hypothetical δ18
O ratios in water and NO3- as a function of proportion of seasonally
produced soil leachate in groundwater mixtures.
The mixing calculations suggest that a mixture of roughly 10 to 20% of seasonally
distinct leachate with deep GW can explain the essentially constant δ18
O ratios in water,
and variable δ18
O ratios in the nitrate ion. Alternate assumptions for the nitrate
concentrations in leachate and deep GW will of course yield somewhat varying results,
and it is stressed that these calculations are not intended to match exact field conditions,
nor can they be expected to represent the degree of variability likely to be present in a
natural system. Indeed, even for a single well, the relative influence of each stratigraphic
zone will depend on prevailing recharge conditions, and variability in well construction
and local geological conditions. As a consequence, both the hydraulic and geochemical
observations drawn here should only be considered in a conceptual sense.
In addition to reconciling the discrepancies between water and nitrate ion isotopic
characteristics, this mixing model also provides an explanation for the apparent
difference between observed nitrate concentration in the watershed and the
concentrations that might be expected, based on assessments of nitrate loading to the
aquifer. Several estimates of nitrogen loading and subsequent N leaching losses have
been made for the Wilmot watershed in attempts to link the impact of agricultural
practices to observed nitrate levels in GW (van Bochove et al., 2007, Somers et al., 2007,
Jiang and Somers, 2007). All of these estimates are in reasonable agreement, with an
average estimated leaching loss of 33.8 kg N/ha/yr. Assuming an average annual rate of
recharge to the aquifer of 400mm per year, this loading rate should correlate with a GW
nitrate concentration of approximately 8.4 mg/L. Nonetheless, the mean value of
observed mean nitrate levels in the watershed is only 6.9mg/L. This difference between
these two GW nitrate values (observed vs. predicted) implies that either some nitrate is
being lost prior to, or during transfer to the aquifer, or that current GW nitrate
concentrations do not reflect the full impact of the agricultural practices in the area.
The most commonly invoked explanation for a loss of nitrate from soils prior to or during
transfer to the aquifer is denitrification, yet GW in PEI is typically well oxygenated
(Savard et al., 2007b), and indeed dissolved oxygen levels measured at the time of
sampling averaged 8.8 mg/L, a concentration which does not allow denitrification.
Furthermore, in the δ18
O and δ15
N graphic space (see Figure 5), the process of
denitrification should result in a progressive shift in values in dissolved nitrate toward

Somers, G. and Savard, M. M. (2008) Dynamics of nitrate transfer from agricultural soils to aquifers inferred from stable isotopes. In: Proceedings of the 2008 American Water Works Association Inorganic Contaminants Workshop, Albuquerque, NM. January 27-29. American Water Works Association, Denver, CO. On CD ROM Session MON3
11
heavier values for both isotopes (Kendall and Arevena, 2000), however the only
significant shift in values involves a drop in δ18
O ratios associated with colder seasons.
-10
-5
0
5
10
15
20
25
-10 -5 0 5 10 15 20
d15N-NO3
d18O-NO3
summer 2003 fall 2003 w inter 2003-04 spring
Figure 5. The groundwater nitrate δδδδ18181818
O values as a function of δδδδ15
N ratios (modified from Savard et
al., 2007b).
An alternate and more plausible explanation is provided by consideration of the mixing
model presented above, whereby the principle flux of nitrate is via transport from soil to
shallow groundwater, and followed by discharge via base-flow to the river. It is noted
that the same strong seasonal δ18
O signal seen in nitrate of soil leachate is also observed
in nitrate in surface waters, implying rapid transfer of nitrate from shallow portions of the
aquifer to surface water. Thus while sample results clearly show that deeper groundwater
has been impacted by nitrate leaching, a very significant portion of nitrate is cyclingi
through shallow portions of the groundwater/surface water flow system, and the full
impact of current nitrate loading rates has not affected deeper portions of the aquifer to
the same extent. This explanation is supported by predictions made by numerical GW
transport simulations conducted by both Jiang and Somers (2007), and Paradis et al.
(2007). In both cases it is suggested that nitrate levels will continue to climb even under
current N loading rates, and that the impact of any reduction in N-loading will be most
profoundly and rapidly observed in shallow groundwater and base-flow to the river.
Conclusions Both the hydraulic and geochemical arguments described here support the basic premise
that contributions from the shallowest depths are dominating the nitrate characteristics of
water withdrawn from the aquifer by typical domestic wells. Hypothetical calculations
based on the vertical hydraulic conductivity profile of the aquifer, as well as recharge and
storage characteristics of the aquifer suggest that water quality in the top one or two
Seasonal effect of nitrification
denitrification Observed seasonal
δ18
O shift

Somers, G. and Savard, M. M. (2008) Dynamics of nitrate transfer from agricultural soils to aquifers inferred from stable isotopes. In: Proceedings of the 2008 American Water Works Association Inorganic Contaminants Workshop, Albuquerque, NM. January 27-29. American Water Works Association, Denver, CO. On CD ROM Session MON3
12
meters of the aquifer should be dominated by recent, seasonal recharge, whereas deeper
waters would represent the averaged characteristics of water recharged over several
seasons or years. These observations are consistent with independent assessments of local
GW flow conditions, with flow being dominantly horizontal throughout much of the GW
flow systems. Our geochemical mixing model using the observed NO3-N and δ18
O
characteristics of soil leachate and deeper indicates that mixing of 25% or less of seasonal
recharge with older, less impacted GW can account for the observed isotopic
characteristics, again implying that the greatest proportion of N flux in GW is at this time
confined to relatively shallow portions of the aquifer, controlled by a dominantly
horizontal GW flow regime.
One of the important implications of these findings is that the most impacted portions of
the aquifer respond rapidly to changes in N fluxes, and any reduction in N loading may
be expected to have a relatively immediate impact on shallow GW quality. In addition,
the work presented here highlights the importance of considering the detailed
characteristics of the local GW flow regime, including seasonal recharge characteristics,
in the interpretation of hydrogeochemical data.
Acknowledgements This study was supported jointly by the Climate Change Impact & Adaptation program
(NRCan), the GW program of the Earth Science Sector (NRCan), as well as the Prince
Edward Island Department of Environment, Energy and Forestry. We sincerely thank
scientists, technicians and students from NRCan (GSC), Agriculture and Agri-Food
Canada and PEI-EEF: G. Bordeleau, C. Deblonde, I. Destroismaisons, S. Liao, M.
Luzincourt, B. Murray, J. Mutch, B. Potter, and A. Smirnoff.
References:
Chang, C.C.Y., Langston, J., Riggs, M., Campbell, D.H., Silva, S.R., Kendall, C. 1999. A
method for nitrate collection for δ15
N and δ18
O analysis from waters with low nitrate
concentrations. Canadian Journal of Fisheries and Aquatic Sciences, 56, 1856-1864.
Driscoll, F. G., Groundwater and Wells (second edition). Published by Johnston Division,
St Paul Minnesota 1986.
Faure, G. 1986. Principles of Isotope Geology, 2nd
ed., 589 pp., Wiley & Sons, New
York.
Francis, R.M., Hydrogeology of the Winter River Basin, Prince Edward Island.
Department of the Environment, Water Resources Branch, Prince Edward Island, 117 p.,
1989.
Health Canada – HC 2004. Summary of guidelines for Canadian drinking water quality;
Prepared by the Federal–Provincial-Territorial Committee on Drinking Water of the
Federal–Provincial-Territorial Committee on Health and the Environment, April 2004,
http://www.hc-sc.gc.ca/waterquality.

Somers, G. and Savard, M. M. (2008) Dynamics of nitrate transfer from agricultural soils to aquifers inferred from stable isotopes. In: Proceedings of the 2008 American Water Works Association Inorganic Contaminants Workshop, Albuquerque, NM. January 27-29. American Water Works Association, Denver, CO. On CD ROM Session MON3
13
Jiang, Y. and Somers, G., 2007. Numerical modelling of nitrate transport in the Wilmot
watershed using field specific N-inputs – Chapter 4, p. 41-51, In: M.M. Savard & G.
Somers (editors), Consequences of climatic changes on contamination of drinking water
by nitrate on Prince Edward Island; Report to NRCan, Climate Change Action Fund :
Impacts and Adaptation Agreement A881/A843, 142 p.
http://adaptation.nrcan.gc.ca/projdb/pdf/109_e.pdf.
Kendall, C., Aravena, R. 2000. Nitrate isotopes in groundwater systems - Chapter 9. In:
Peter G. Cook and Andrew L. Herczeg editors, Environmental Tracers in subsurface
hydrology, Kluwer Academic Publishers, Boston, 261-297.
Liao, S., Savard, M.M., Somers, G., Paradis, D. and Jiang, Y., 2005. Preliminary results
from water isotope characterization of groundwater, surface water and precipitation in the
Wilmot River Watersehd, Prince Edward Island. Geological Survey of Canada, Current
Research 2005-D4.
Natural Resources Canada – NRCan 2005. The Atlas of Canada. Commercial and
institutional water consumption, 1999. Available at
http://atlas.gc.ca.site/english/maps/fresh water/
Paradis, D., Ballard, J.M., and Lefebvre, R., 2007. Watershed-scale numerical modelling
of nitrate transport using spatially uniform average N inputs – Chapter 5, p. 52-65, In:
M.M. Savard & G. Somers (editors), Consequences of climatic changes on contamination
of drinking water by nitrate on Prince Edward Island; Report to NRCan, Climate Change
Action Fund : Impacts and Adaptation Agreement A881/A843, 142 p.
http://adaptation.nrcan.gc.ca/projdb/pdf/109_e.pdf.
Piggott., A., Brown, D., Moin, S., Mills, B. 2001. Exploring the dynamics of groundwater
and climate interaction; report prepared for the Climate Change Action Fund, 8 p.
Prest, V.K., Superficial deposits of Prince Edward Island. Geological Survey of Canada:
Map 1366A, 1973.
Savard, M.M., Somers, G., Paradis, D., 2007a. Sources and seasonal dynamics of Nitrate
in the Wilmot watershed/aquifer system of Prince Edward Island - Chapter 3, p. 29-40,
In: M.M. Savard & G. Somers (editors), Consequences of climatic changes on
contamination of drinking water by nitrate on Prince Edward Island; Report to NRCan,
Climate Change Action Fund : Impacts and Adaptation Agreement A881/A843, 142 p.
http://adaptation.nrcan.gc.ca/projdb/pdf/109_e.pdf.
Savard, M. M., Paradis, D., Somers, G., Liao, S., van Bochove, E., 2007b. Winter
nitrification contributes to excess NO3- in groundwater of an agricultural watershed - A
Dual Isotope Study. Water Resources Research, Vol. 43, W06422,
doi:10.1029/2006WR005469

Somers, G. and Savard, M. M. (2008) Dynamics of nitrate transfer from agricultural soils to aquifers inferred from stable isotopes. In: Proceedings of the 2008 American Water Works Association Inorganic Contaminants Workshop, Albuquerque, NM. January 27-29. American Water Works Association, Denver, CO. On CD ROM Session MON3
14
Silva, S.R., Kendall, C., Wilkinson, D.H., Ziegler, A.C., Chang, C.C.Y., Avanzino, R.J.
2000. A new method for collection of nitrate from fresh water and the analysis of
nitrogen and oxygen isotope ratios. Journal of Hydrology, 228, 22-36.
Somers, G., Savard, M.M., Paradis, D., 2007. Mass balance calculations to estimate
Nitrate proportions from various sources in the agricultural Wilmot Watershed of Prince
Edward Island. In Proc. from the 60th Canadian Geotechnical Conference and the 8th
Joint CGS/IAH-CNC Groundwater Conference, October 21 to 24, 2007, Ottawa, Canada,
p. 212 to 218
Van Bochove, E., Thériault, G., Cheirf, R., Ziadi, N., and MacLeod, J., 2007. Nitrogen
Leaching from agricultural soils at the watershed scale – Chapter 2, p. 21-28, In: M.M.
Savard & G. Somers (editors), Consequences of climatic changes on contamination of
drinking water by nitrate on Prince Edward Island; Report to NRCan, Climate Change
Action Fund : Impacts and Adaptation Agreement A881/A843, 142 p.
http://adaptation.nrcan.gc.ca/projdb/pdf/109_e.pdf.