dynamics of financial structure adjustments and firms ... · especially thankful to dr. zaheeb...
TRANSCRIPT

II
Dynamics of Financial Structure Adjustments
and Firms' Financial Performance
By
Sohail Amjed
A research thesis submitted to the Department of Management & Social Sciences,
Capital University of Science & Technology, Islamabad in partial fulfillment of the requirements for the degree of
DOCTOR OF PHILOSOPHY IN MANAGEMENT SCIENCES (FINANCE)
DEPARTMENT OF MANAGEMENT & SOCIAL SCIENCES CAPITAL UNIVERSITY OF SCIENCE & TECHNOLOGY
ISLAMABAD AUGUST 2016

IV
Copyright© 2016 by Sohail Amjed
All rights are reserved. No part of the material protected by this copy right notice may be reproduced
or utilized in any form or any means, electronic or mechanical, including photocopying, recording
or by any information storage and retrieval system, without the permission from the author.

VI
Please take certificate from Eng. Khalid and past here

VII
DEDICATION
This dissertation is dedicated to my beloved family whose prayers always pave the way to success
for me.

VIII
TABLE OF CONTENTS
CHAPTER NO.1 ................................................................................................................................ 1
Introduction ........................................................................................................................................ 1
1.1 Overview ................................................................................................................................... 1
1.2 Implication of Financial Structure ............................................................................................ 5
1.3 Research Gap ............................................................................................................................ 6
1.4 Research Motivations: .............................................................................................................. 9
1.5 Research questions .................................................................................................................... 9
1.6 Research objectives ................................................................................................................. 10
1.7 Significance of the study ......................................................................................................... 10
1.8 Research Contributions ........................................................................................................... 11
1.9 Organization of the dissertation .............................................................................................. 12
CHAPTER NO.2 .............................................................................................................................. 13
Financial environment and Corporate Sector of Pakistan ................................................................ 13
2.1 Financial environment of Pakistan.......................................................................................... 13
2.2 Corporate sector of Pakistan ................................................................................................... 14
2.2.1 Capital markets ................................................................................................................. 18
2.2.2 Equity Market ................................................................................................................... 18
2.2.3 Debt market ...................................................................................................................... 23
CHAPTER NO. 3 ............................................................................................................................. 27
Review of Literature ......................................................................................................................... 27
3.1 Brief Chronology of Important Capital Structure Theories .................................................... 27
3.2 Modigliani-Miller Irrelevance Theorem ................................................................................. 29
3.3 Pecking Order Theory ............................................................................................................. 31
3.4 Agency Theory........................................................................................................................ 33
3.5 Tradeoff Theory ...................................................................................................................... 35
3.5.1 Dynamic Tradeoff Model ................................................................................................. 37
3.5.2 Adjustment towards Target Capital Structure .................................................................. 40

IX
2.6 Market timing theory .............................................................................................................. 44
2.7 Variables ................................................................................................................................. 45
2.7.1 Estimators of target capital structure ................................................................................ 46
2.8.2 Determinants of Adjustment Speed .................................................................................. 56
2.8 The relationship between capital structure and firm's performance ....................................... 60
2.9 Cost and availability of capital: A global perspective ............................................................ 62
2.9.1 The duality of debt finance ............................................................................................... 63
2.9.2 Capital structure puzzle .................................................................................................... 66
2.9.3 Towards the solution of capital structure puzzle ............................................................. 66
CHAPTER NO.4 .............................................................................................................................. 69
Methodology ..................................................................................................................................... 69
4.1 Research Philosophy ............................................................................................................... 69
4.2 Data and Sampling .................................................................................................................. 70
4.3 Graphical presentation of the model ....................................................................................... 77
4.4 Estimation scheme .................................................................................................................. 78
4.1.1 Variables ........................................................................................................................... 79
4.1.2 Statistical Model ............................................................................................................... 79
4.5 Estimation of Adjustment Speed: ........................................................................................... 83
4.6 Determinants of Adjustment Speed ........................................................................................ 86
4.7 Impact of adjustment speed on financial performance: .......................................................... 87
CHAPTER NO. 5 ............................................................................................................................. 88
Results and discussions .................................................................................................................... 88
5.1 Aggregate Descriptive Statistics: ............................................................................................ 88
5.2 Parameters Estimation ............................................................................................................ 96
5.2.1 Significance of the target Contractual Debt ratio determinants ....................................... 97
5.2.2 Coefficients of Target Long Term Debt ratio ................................................................ 101
5.2.3 Coefficients of target Total Debt ratio ........................................................................... 103
5.3 Capital Structure Adjustment Speed ..................................................................................... 106
5.3.1 Annual Adjustment Speed .............................................................................................. 108
5.3.2 Industry Adjustment Speed ............................................................................................ 111
5.4 Determinants of Adjustment Speed ...................................................................................... 113

X
5.5 Impact of Adjustment Speed on Financial Performance ...................................................... 116
CHAPTER NO.6 ............................................................................................................................ 119
Conclusion and recommendations: ................................................................................................. 119
6.1 recommendations .................................................................................................................. 121
6.2 Research Limitations ............................................................................................................ 121
6.3 Future research ...................................................................................................................... 122
References ...................................................................................................................................... 123
APPENDIX-I .................................................................................................................................. 152

XI
LIST OF TABLES
Title Page No Table 2.1: Companies registered under Companies Ordinance 1984
Table 2.2: Performance of KSE at glance
Table 2.3: Number of Listed Companies, fund Mobilized and Total
Turnover of Shares in Various Stock Exchanges
Table 2.4: Number of companies issued debt instruments and Amount in
Billion Rupees of Debt Securities as on 30th June 2015
Table 4.1: Sector Wise List of Companies in BSA and Selected Sample
Table 4.2: List of Variables
Table 5.1: Summary Statistics of Variables
Table 5.2: Correlation Matrix
Table 5.3: Descriptive Statistics of Three Capital Structure Measures
Table 5.4: Determinants of Target Contractual Debt to Asset ratio
Table 5.5: Determinants of Target Long Term Debt to Asset ratio
Table 5.6: Determinants of Target Total Debt to Asset ratio
Table 5.7: Annual Capital Structure Adjustment Speed Overall
Table 5.8: Capital Structure Adjustment Speed summary statistics of
individual economic sectors
Table 5.9: Determinants of Adjustment Speed
Table 5.10 Impact of Adjustment Speed on Financial Performance
16
20
22
24
73
79
89
92
96
98
102
104
110
111
114
117

XII
LIST OF FIGURES
Title Page No Figure.2.1: Year Wise new Company Incorporation
Figure 2.2: Corporate Debt Market at Glance
Figure 3.1: Graphical presentation of Tradeoff Model
Figure 4.1: Graphical Presentation of the Model
Figure 5.1: Average Return on Assets of Corporate Sector over
thirteen year period
Figure 5.2: Corporate Sector Long Term Leverage history
Figure 5.3: Corporate Sector Contractual Debt history
Figure 5.4: Corporate Sector Total Debt history
Figure 5.5: Capital Structure Adjustment speed of Overall
Figure 5.6: Sector wise annual capital structure adjustment speed
17
25
36
77
90
93
94
95
109
112

XIII
ABBREVIATIONS
CPs Commercial Papers
DCs Domestic Companies
GMM Generalized Method of Moments
ISE Islamabad Stock Exchange
KSE Karachi Stock Exchange
LBO Leverage Buy outs
LSE Lahore Stock Exchange
MBO Management Buy Outs
MNCs Multinational Companies
OTC Over the Counter Market
SBP State Bank of Pakistan
SECP Securities and Exchange Commission of Pakistan
SIC Standard Industrial Classification
SMCs Single Member Company
SMEs Small and Medium Enterprises
TFCs Term Finance Certificates
TSLS Two-Stage Least Squares

XIV
ACKNOWLEDGEMENTS
All praises are attributed to Almighty Allah, the Compassionate, the Merciful and Source of
Knowledge and Wisdom, who bestowed upon me the health, the power of communication and the
audacity to accomplish this thesis.
I express my cordial gratitude to my teacher, mentor and supervisor Dr. Syed Mohammad
Amir Shah (Head of Commerce Department, AIOU Islamabad) for his guidance and support. I am
especially thankful to Dr. Zaheeb Abbas, Dr. Arshad Hassan and Dr. Safdar Butt for their support
and guidance. My sincere thanks to my dear friends Dr. Adnan Riaz, Dr. Arif Khattak and Ms.
Nosheen Zafar, Mrs. Summayya Chughtai and Mrs. Faiza Urooj for their encouragement and
motivation.
I am highly grateful to all my friends and colleagues here in College of Applied Sciences
Salalah who gave me strength and courage to complete my research thesis. It would not have done
without the continuous support and prayers of these wonderful people. I am indebted to Dr. Hanna
Sid Ahmed (Head of Scientific Research Department, CAS Salalah), Dr. Iqtidar Ali Shah (Head of
IBA Department, CAS Salalah) for their technical and moral support and all other colleagues gave
me unconditional support during this endeavor.
XV
ABSTRACT
This longitudinal study is an empirical investigation into the financial policy of
Pakistan's non-financial corporate sector over a thirteen year period starting from 1999 to 2011
by using panel data methodologies. Most significant capital structure theories can be grouped
into two broader categories, namely Pecking Order Theory and Tradeoff Theory. The Pecking
order theorists believe that firms follow an order of preference for one source of finance over
other sources. Tradeoff theory predicts that firms adjust their capital structure on the basis of
underlying costs and benefits of the debt and equity capital. Firms optimize their capital
structure by balancing marginal cost with the marginal benefit of the debt. Panel data
regressions were applied in a systematic way to test the impact of speed of adjustment on
financial performance. The empirical results indicate that the size of the firm, profitability,
collateral value of assets, firm specific interest rate, non-debt tax shield, spontaneous finance
and short term solvency are the significant determinants of the target capital structure. The
Size of the firm, the collateral value of asset and short term solvency have a positive
relationship with the target capital structure. On the other hand, profitability firm specific
interest rate, non-debt tax shield and spontaneous finance has negative relationship. Growth
opportunities have positive but statistically insignificant relationship with contractual debt to
asset target ratio and positive and significant relationship with Long term debt to asset and
total debt to asset target ratios. The results show that the adjustment speed towards target
capital varies across industry and over time. The speed of adjustment is affected by the
macroeconomic and firm specific factors. Results also indicate that volatile inflation and
higher interest rates impedes the adjustment speed. Banking sector performance, GDP growth
rate and distance to target capital structure accelerates the speed of adjustment. It is also found
that closer the firms are to their target capital structure by speedy adjustments better the
financial performance. Speed of adjustment has a significant effect on the financial
performance of Pakistan's corporate sector. The results are consistent with the other
international studies with ignorable differences.

1
CHAPTER NO.1
INTRODUCTION
This study is an empirical investigation into the financial structure decisions of firms from
diverse perspective ranging from the estimation of target capital structure parameters, estimation
of dynamic adjustments toward target leverage, factors affecting adjustment speed and Impact of
adjustment speed on the financial performance in the corporate sector of Pakistan. The empirical
analysis pursued all listed non-financial public companies of Pakistan during the period 1999 to
2011.
1.1 OVERVIEW
Capital structure studies attempt to elucidate the financing patterns and their implications
for business firms. Capital structure issue has been heavily debated and widely researched in the
last few decades. Owing to its significance and inherited complexity the issue has got considerable
attention of the finance scholars. Practitioners always pose great concern about the issue as the
capital structure decision is one of the most significant financial decisions (e.g., Brennan, 1995;
Matsa, 2010; Graham and Leary, 2011). The growing interest of the researchers and practitioners
in this imperative financial issue has made this stream of finance a specialized area of research.
A comprehensive and testable theory of capital structure which can be supported by
statistical model and empirical evidence is still awaited. From the beginning scholars have been
striving hard to explain, how firms should effectively formulate financial policy to finance their
operations and growth opportunities efficiently and effectively (e.g., DeAngelo and Masulis, 1980;
Titman and Wessels, 1988; Bradley, Jarrell and Kim, 1984; Harris and Raviv, 1991; Lemmon and
Zender, 2010; Joeveer, 2013). A major portion of finance literature has been dedicated to

2
discussing this most critical business decision. Notwithstanding, all endeavors by finance scholars
to explain this critical business decision, the issue is still not clear and thoroughly understood.
With the advent of every new theory the issue of capital structure has become more
complex and difficult to understand. Complexity of the issue has rendered no choice to the scholars
except to refer capital structure as a puzzle. The apparent reason of this increasing ambiguity is the
fact that every theorist highlights a new dimension of capital structure decision and gives birth to
new questions. According to Mayers (2001) there is no universal theory of capital structure, all
proposed theories of capital structure are useful to understand the nature of decision under certain
conditions. No-one single model or theory exists to incorporate all those conditions and dynamics.
Barclay and Smith (2005) also documented more or less same conclusion that existing theories of
capital structure focus on just one aspect of capital structure, either the existing capital structure
(which they referred as "stock") or the restructuring decision (which they referred as "flow"). They
suggested simultaneous understanding of the target capital structure and the underlying strategy to
achieve those targets is imperative to solve the capital structure puzzle.
Starting from the capital structure irrelevance theory proposed by Franco Modigliani and
Merton Miller (1958) to the latest developments the whole journey is full of adventures and
setbacks. The major milestones in the history are Trade-off Theory (Modigliani and Miller, 1963)
and Pecking Order Theory (Mayer, 1977). The proponents of MM theorem believe that capital
structure and dividend policy has no observable and predictable impact on the value of firm and
therefore has no relevance to the market value of the firm (e.g., Chirinko and Singha, 2000; Chen,
2004; Strebulaev, 2007; Feld, Heckemeyer and Overesch, 2013). Tradeoff theorists hypothesized
that capital structure is a deliberate decision, by optimizing leverage on the basis of cost and
benefits of debt yields incremental gain of value. This school of thought establishes the existence

3
of optimal capital structure which firms strive to achieve over the long run. The advocates of the
pecking order theory hold the view that firms have an order of preference for different sources of
financing. Firms make financing decisions on the basis of preferred and feasible sources of
financing (e.g., Frank and Goyal, 2003; Zoppa and McMahon, 2002; Fan, Titman and Twite,
2012). All the competing arguments and counter theories have made capital structure a puzzle. It
is strived to test in case of Pakistan if the firms have any predictable target capital structure and
how firms adjust to that target in presence of economic challenges generally faced by the
developing countries.
The work of the theorists provides insights for understanding decision making patterns of
a rational economic man in predictable ordinary situations. The real world is not static; every day
different new situations emerge and make the situation more complex and diversified.
Conventional wisdom is that environmental factors shape the preferences and affect the cognitive
process of the decision makers on one side and bring new opportunities and threats to the other
end (Yang, 2013). Financial environment is changing constantly and bringing new opportunities
as well as challenges for the corporate managers. Therefore, one static theory seems impossible
to explain such a complex financial decision. The required details and explanations of the
contemporary financial environment and the role of global economic framework are difficult if not
impossible to incorporate in a single theory (Kayo and Kimura, 2011). Therefore, it is important
to study the corporate financing decisions in the particular financial environment before
generalization of any model or theory.
Corporate financial management is about three major decisions; first acquisition of
organizational resources (investing decisions), second raising funds to acquire the assets and
conduct the operations of the business (financing decisions), and third management of

4
organizational resources. All the decisions are made to maximize the wealth of the existing owners
of the business. Fisher’s Separation Theorem asserts that firm’s investment decisions are
independent of financing decisions, therefore investors’ investment preferences do not affect the
firm’s value. The three financial decisions are treated and analyzed separately as devised by the
Fisher’s Separation Theorem, but all three types of decisions are directly or indirectly articulated
with each other. Imbalance of any element may results corporate level aggregate loss (e.g., Milne,
1981; Agrawal and Mandelker, 1987; Brennan, 1995; Hovenkamp, 2009).
The financing decisions are most important and complex of all major financial decisions
and also considered the web of all business decisions (e.g., Bogan, 2012; Rampini and
Viswanathan, 2013; Campello and Giambona, 2013). Finance managers can raise funds from
multiple sources including various types of debt and equity. Every individual source has its own
unique risk return attributes. In line with portfolio theory, the combination of various finance
sources yields different results. When financing decisions are made particular source of finance
not only evaluated individually, but aggregate analysis is also needed. Normally firms use and
have to use a mix of various sources of financing in their capital (Voutsinas and Werner, 2011). In
common discourse, the proportion of debt and equity in the total capital of the firm is called capital
structure. The proportion of short term debt long term debt and the equity is known as financial
structure. The proportion of the long term debt and equity in the total capital of the firm is referred
to as capital structure. Financial strategy if properly formulated and implemented can provide a
competitive advantage and contribute greatly to the achievement of financial goals of the firms by
reducing the cost of capital (e.g., Fernandez, 2013; Miles and Marcheggiano, 2013). The Cost of
capital is a prime consideration in all financial decisions. The Cost of capital is normally taken as
the weighted average of the cost of all sources of capital including debt and equity sources. The

5
proper blend of debt and equity, which is referred to as optimal capital structure is the central point
of the whole debate of capital structure. No-one theory of finance could succeed to develop
consensus among the scholars about this hypothetical optimality. One of the possible reasons for
this gap may be the inability of existing models to quantify underlying socioeconomic cost and
benefit associated with debt financing (e.g., Fan, Wei and Xu, 2011; Cheng, Ioannou and Serafeim,
2014; Agrawal and Matsa, 2013).
1.2 IMPLICATION OF FINANCIAL STRUCTURE
It is now a common wisdom that developments in the Information and Communication
Technologies have significantly changed the dynamics of the world. Where technological
developments have brought new opportunities and operational efficiencies in doing business, it
also has intensified the competition by making customers more knowledgeable. Only those firms
can survive in this cut throat competition, which are thoroughly efficient in all areas of business
decisions ranging from product design to financial decisions. The firms now days put more
emphasis on reducing costs of doing business by various means. The Cost of business can be
grouped into three major categories, production cost, operating cost and financial costs. One of
the most significant areas of efficient utilization of business resources is optimal utilization of
capital. A proper mix of debt and equity reduces the cost of doing business. Firms strive to achieve
this optimality by designing the financial structure in an efficient way. Firms having distance from
the optimality may not perform better than their efficient counterparts (Öztekin and Flannery,
2012; Camara, 2012).
Debt as a source of financing has its own advantages and disadvantages (Brigham and
Houston 2011). The advantages of deploying debt in the capital structure include tax shield and
debt as a control mechanism for agency problem which exists between the shareholders and the

6
management. The list of disadvantages of debt financing is a bit longer than the advantages, but
the magnitude of specific advantage and disadvantage is a subjective matter and is difficult to
establish any stance. Disadvantages include cost of financial distress also called bankruptcy cost,
agency cost which exists between creditors and management, financial inflexibility, cost of
information asymmetry and added cost for lack of redeploy-able assets (Fan, Titman and Twite,
2012). Balancing the capital structure for optimal utilization of capital is the biggest challenge as
well as an opportunity to outperform. The practitioners are, therefore, interested to know how firms
should make financial policy in order to achieve their financial goals.
1.3 RESEARCH GAP
The capital structure is subject to many antagonistic claims of theorists. The major
contestants are tradeoff theorists, pecking order theorists and the proponents of the market timing
theory. All three major schools of thought have incongruousness over how firms compose their
capital mix. Underlying assumptions of existing capital structure models and theories hold true
only in developed economies where capital markets are complete and efficient. Very little is known
how corporations made financing decisions in developing countries where they have fewer
financing choices. Therefore it is important to empirically investigate the prophecies of such
theories before generalization in the developing countries.
Most of the extant literature of capital structure related to Pakistan is about estimation of
capital structure determinates through static models (see e.g., Shah, Hijazi and Javed, 2004; Hijazi
and Tariq, 2006; Shah and Khan, 2007; Rafiq, 2008; Ilyas, 2008; Ahmed, Ahmed and Ahmed,
2010; Ahmed and Wang, 2011; Afza and Hussain, 2011; Memon, Bhutto and Abbas, 2012;
Shaheen and Malik, 2012; Saleem, et. al., 2013; Ahmad and Zaman, 2013). A bit different to
aforementioned studies Ahmad, Fida and Zakaria (2013) tried to estimate the co-determinants of

7
the capital structure and the stock returns. There are few studies which have tried to study the
impact of financing decisions on the financial performance of the firm. For instance, Saeed and
Badar (2013) tried to study the impact of financial structure on the financial performance of the
firm in food industry. They applied linear model on the five years data of 10 companies. It is an
established fact that financial performance is an explanatory variable of the capital structure
therefore the cause and effect relationship modeled by the scholars is questionable. Similarly,
Mumtaz, et. al. (2013) strived to prove the cause and effect relationship between capital structure
and financial performance through ratio analysis without any proper methodology. Bokhari and
Khan (2013) also attempted to assess the impact of various capitals structure ratios on the financial
performance of the firm through simple OLS method. They tested the relationship with the static
models and contended to establish that capitals structure has impact on the financial performance
of the non-financial sector of Pakistan. In a recent study by Sheikh and Qureshi (2014) investigated
the impact of tax shield and profitability keeping size and collateral value of asset as control
variable. They applied simple linear regression to find out the impact. The matter of the fact is that
their model relationship is no different than the equations used for estimation of determinants of
capital structure. Khalid (2010) claims to capture the dynamics of capital structure in response to
financial reforms. However their model does not support their claim. They regressed one period
lagged explanatory variables with the leverage ratio in presence of industry dummies.
In capital structure research the differences related to methodological issues are intense
compared to the objectivity of capital structure (Haung and Ritter 2009). A holistic research
covering all aspects of financial policy of the firm including determinants of target capital
structure, adjustment speed and effectiveness of financial policy does not exist to date, especially
in the context of developing economies.

8
No any comprehensive research study with reference to Pakistan could be found which
answer the questions like how leverage targets are set by companies in Pakistan. How effectively
do they achieve those targets in the presence of economic impediments peculiar to developing
countries? It was unclear that what factors reliably important in the adjustment process to reach
the target level. No any research till date clearly embark that how the adjustment towards target
affect the financial performance of the firm.
This study aims to fill the gap in literature by providing comprehensive and robust analysis
of determinants of target capital structure and speed of adjustment toward target leverage. This
holistic empirical pursuit addresses all aspects of financial policy step by step starting from the
determinants of target capital structure, estimation of adjustment speed, determinants of
adjustment speed, and to the effectiveness of the adjustment. This multitier study addresses issues
of high significance in a systematic way, the results of one tier serves the foundation of another
tier. The gradual development of the argument goes to logical end with conclusive and summarized
evidence of the effectiveness of the whole debate. It provides a comprehensive description of the
financing decisions and the factors which help or restrain the firms to achieve their target capital
structure. The results of this research provide an opportunity to argue about the strength and
efficiency of the financial system of Pakistan. Extensive firm level dataset for all industries for
thirteen years has been used in this study. A comprehensive set of variables have been identified
by extensive review of literature. All the variables have been tested with the largest set of data.
Such a huge panel dataset has provided the robust results. By means of dynamic model estimation
techniques wider coverage of capital structure decisions is reported.

9
1.4 RESEARCH MOTIVATIONS:
Compared to developed countries, capital markets in developing countries like Pakistan
are incomplete and inefficient (Maddison, 2013; Desai, Foley and Hines, 2004; Chuhan, Claessens
and Mamingi, 1998). Capital markets in developing countries are not capable to cater the financing
needs of the business; therefore, firms have to rely on the banking sector for funding growth
opportunities and operations. In developing economies firms face different economic challenges
therefore financial decisions are not directly comparable to the corporate sector of developed
economies. The prominent theories assume the financial environment of developed economies.
Those theories cannot be generalized to developing economies without due diligence. In
developing countries firms face more capital related issues than developing countries due to
limited financing options. No any significant research study could be found which address
important aspects of the capital structure issue of Pakistan.
1.5 RESEARCH QUESTIONS
This study indirectly addresses the question, how efficient the financial system of Pakistan
to facilitate the firms to adjust their capital structure to the target level and the capital structure
adjustments are effective. This study explores the factors which affect the adjustment speed and
impact of adjustment speed on financial performance.
Specifically, this research answers the following questions:
1) What factors are reliably important to determine target (desired) capital structure?
2) How do frequently Pakistani firms adjust their capital structure towards target capital?
3) What are the determinants of the adjustment speed of capital structure?
4) What is the impact of adjustment speed on firms’ financial performance?

10
1.6 RESEARCH OBJECTIVES
The study aims to provide more robust results and comprehensive coverage of the factors
which affect capital structure decisions of the firm. Based on the dynamic model developed by the
Banerjee, Heshmati, and Wihlborg (1999), also called BHW model, this study explores the
dynamic adjustments in the capital structure of the Pakistani firms, the speed of adjustment towards
target level of the capital structure and its impact on firms; performance. The focus of this research
is an adjustment towards the target capital structure. The specific objectives of the study are to:
1. To estimate the determinants of the target capital structure and the adjustment speed
towards target capital structure of non-financial corporate sector of Pakistan.
2. To empirically investigate the factors which help the firms to achieve their target
level of capital and the impact of speed of adjustment on the financial performance
of Pakistan’s corporate sector.
1.7 SIGNIFICANCE OF THE STUDY
The comprehensive discussions on effectiveness of financial policy in context of financial
environment of the country would enhance our understanding about the corporate financing. This
study also has many practical implications for the corporate sector of Pakistan, in general and non-
financial sector specifically. The results of this study would help the industry to signify the efficient
use of debt by timely adjustments in capital structure in response to changing financial
environment in order to be financially effective. The study also addresses the economic
environmental forces affecting the financial policy that how these factors impede the firm's
financial restructuring ability. This study would supplement the policy formulation with relative
economic rational. Since, it evaluates the role of financial environment in the speed of capital

11
structure adjustment towards the optimal level. The impact on the financial performance of firms
has also been reported in the light of the prevailing economic conditions.
Capital structure research is mostly done with respect to the developed economies. In
developed economies markets are relatively more complete, thus firms have more financing
opportunities and their cost of optimizing the capital structure is comparatively lower than
developing economies. It is not logical to generalize the results of research studies conducted in
developed economies to the developing economies like Pakistan. This research is the first of its
kind in Pakistan to the best of author’s knowledge. It is more comprehensive in terms of depth,
scope and implication than any research on capital structure conducted in Pakistan. It also provides
ample analysis and coverage of capital structure decisions by discussing the results of different
industries.
1.8 RESEARCH CONTRIBUTIONS
This study has contributed to the finance literature in three different ways. First, the study
has empirically investigated the issue of capital structure with a holistic approach ranging from
estimation of target capital structure to impact of capital structure adjustment speed toward target
on the financial performance of the firm in a developing country i.e. Pakistan. This is the first study
to the best of author’s knowledge which investigate the capital structure of non-financial corporate
sector of Pakistan with dynamic model. Thus, the estimation techniques and methodology of this
research captures the dynamics of the capital structure of non-financial sector of Pakistan and its
financial implications for the firm. Second, the study also has assessed the impact of volatile
financial environment on the capital structure adjustment speed and offered some useful solution
to the corporate sector of Pakistan. Dynamic tradeoff theory postulates that firms adjust their
capital structure to reach at an optimum level, however, it fails to predict that financial environment
12
affect the adjustment process. This study attempts to enhance our understanding that how
macroeconomic factors affect the adjustment speed towards target level. Third, the impact of
adjustment speed on the financial performance of the firms operating in volatile financial
environment, a common attribute of developing countries, is has never been researched. This study
also attempts to assess the role of adjustment speed on the financial performance of the non-
financial corporate sector of Pakistan.
1.9 ORGANIZATION OF THE DISSERTATION
Chapter 2 is a brief account of corporate sector of Pakistan. It describes the corporate sector
and the financial markets of the country to give a country context in which the study has been
conducted. Chapter 3 reviews the relevant literature. This review is organized in accordance
with the significant theories. Since the MM theorem of irrelevance to the latest developments
the whole debate revolves around the optimal level of debt and equity. Major theories of
capital structure and the diverse perspectives of capital structure are discussed in this chapter.
Chapter 3 examines the methodology and draws upon the statistical models to achieve the
objectives of the study for maximum effectiveness of intended empirical investigation.
Chapter 4 is an empirical investigation by using the panel data of Pakistan’s corporate sector
from 1999 to 2010. This chapter is comprised of various statistical analysis and model
application. Data analysis is done to test the relevance and reliability of the data and the
application of proposed model for this study. Chapter 5 sets out explanation of the various
analysis and debate is carried out from the different perspectives on the relationship of target
capital structure and the actual capital structure which is referred to as capital structure
adjustment speed. This debate leads toward the conclusive statements about the dynamics of
capital structure adjustments of Pakistan’s corporate sector. The last chapter concludes the
debate and provides the recommendation in the light of results and discussions.

13
CHAPTER NO.2
FINANCIAL ENVIRONMENT AND CORPORATE SECTOR OF PAKISTAN
This chapter is an overview of the corporate sector of Pakistan and the financial
environment in which the corporate sector is operating. All economic activities are affected by the
financial environment. The formal and informal institutes of a country determine to a large extent
the success or failure of the firm (Peng, Wang and Jiang 2008). For understanding and analyzing
the financial decisions it is pertinent to understand the environment in which those decisions are
made. It is well documented in almost all disciplines of social sciences that the environmental
factors affect the decisions and financial decisions are not exception. There is not even a single
reason to believe that financial decisions like capital structure can be made without considering
the contemporary financial environment (Grinblatt and Titman 2002).
2.1 FINANCIAL ENVIRONMENT OF PAKISTAN
Analogous to the changes in social behaviors of individuals due to globalization the
financial behavior of individuals and institutions have also affected. It cannot be repudiated by any
logic that strong networks, information flood and new cheapest means of communication have
changed the financial system of the world (Alexander, 2006). The developments in the field of
Information and Communication Technologies have changed the financial world dramatically.
Great changes have been witnessed in the last two decades in the function and organization of
financial markets. The traditional economic boundaries have blurred in recent past. The virtual
markets have become a reality and growing exponentially (Castells, 2011). Investors can execute
transactions from around the globe to any place by using modern communication means. Firms
now have more financial liberty to access international capital markets conveniently and cost
effectively. All these developments in the financial world require reiteration of the theories which

14
were proposed before this technological and communication revolution. This section briefly
discusses the financial system of Pakistan.
Pakistan’s financial system is diversified and sophisticated than other developing
countries. Commercial banks are playing a dominant role in Pakistan’s financial system. Other
financial institutions of Pakistan including stock markets, specialized financial institutions,
insurance companies, leasing companies are also working effectively (Haque, 1997). Non-banking
financial sector is relatively smaller than the commercial banks. Total assets of the commercial
banks were about 56 percent of the GDP, whereas total assets of the all financial institutions were
58 percent of GDP in 2009 (Economic Survey of Pakistan, 2009). Thus, non-banking financial
sector has great potential to grow. Multi-pronged financial reforms will serve the purpose best to
enhance the effectiveness of the non-banking financial sector. Balanced growth of financial system
is essential for a sound and vibrant corporate sector.
2.2 CORPORATE SECTOR OF PAKISTAN
From 1999 to 2011 Pakistan has passed through different political and economic eras. In
the year 1999 General Pervaiz Musharaf (The Army Chief) in 1999 dissolved the democratic
government of Pakistan Muslim League (N). In the general election of 2002 Pakistan Muslim
League (Q) formed the government under the patronage of General Pervaiz Musharaf for five
years. The government policies, especially economic policies were almost consistent during this
era. In 2008 General Elections PPP (Pakistan Peoples' Party) got the mandate to form a government
in coalition with other political parties. During this period serious political and economic
challenges were faced by Pakistan. The biggest economic problem during this government was
energy crises which they failed to resolve. This economic suffocation affected Pakistan's industry
15
the most. This period is the most critical economic period for the industry with respect to business
decisions and especially financial decisions.
Economists have consensus that for sustainable economic growth a sound and efficient
corporate sector is essential. The key to develop a sound and efficient corporate sector is a strong
and balanced regulatory regime based on investors’ protection and good governance (Iakova and
Wagner 2001). The basic law governing the corporate sector of Pakistan is Companies Ordinance
1984. The other sources of law include court judgments, rules, regulations, directive, guidelines
and policies issued by regulatory bodies time to time for solving the emerging issues and problems.
As a mix economy, the corporate law of Pakistan allows various formations of the companies like
single member company, private limited company, public limited company, company limited by
guarantee and unlimited companies. Corporate sector of Pakistan is mainly regulated by the
Securities and Exchange Commission of Pakistan (SECP). Securities and Exchange Commission
of Pakistan (SECP) came into force as a result of Securities and Exchange Commission of Pakistan
Act, 1997. The SECP is responsible for developing efficient corporate sector and financial markets
in Pakistan based on international legal standards and best practices. State Bank of Pakistan along
with the SECP regulates the companies working in the financial sector of Pakistan. As a major
regulator of the corporate sector of Pakistan both organizations are performing a variety of
regulatory and supervisory role in Pakistan.
Pakistan has witnessed a remarkable growth in the corporate sector in the last few decades,
this development is attributable to its investors’ friendly policies and economic freedom for the
investors. The growth was accelerated after 1991 financial reforms in which foreign investors were
given economic freedom at par with local investors. Following are the numbers of the different
companies registered in Pakistan under the Companies Ordinance 1984 in last five years.

16
Source: Data extracted from SECP Annual Reports
Table 2.1 Companies registered under Companies Ordinance 1984
Types of Companies 2006 2007 2008 2009 2010 2011 2012 2013 2014 2015
Companies limited by Shares:
Public listed (Only those which are registered under the Ordinance)
613 612 616 616 609 648 602 595 580 576
Public unlisted 2178 2211 2168 2214 2223 2207 2237 2213 2250 2322
Private 45928 46548 46125 49042 50750 53750 56335 55938 57650 60758
SMCs 436 610 775 902 1024 1225 1438 1623 1792 2079
Total Companies limited by shares 49155 49981 49684 52774 54606 57830 60612 60269 62282 65735
Companies limited by Guarantee u/s 43
62 68 64 68 69 73 75 71 71 72
Not for profit associations U/s 42 341 356 398 429 449 500 533 582 634 680
Trade organizations 181 202 202 205 205 213 222 224 228 251
Foreign companies 653 710 725 778 783 798 807 838 847 881
Unlimited companies 5 5 3 3 3 3 3 0 1 1
Companies under section 503 of the Ordinance
4 5 4 4 5 0 0 3 2 2
Total Companies 50401 51327 51080 54261 56120 59417 62252 61989 64067 67624

17
Total sixty seven thousand six hundred and twenty four companies were registered under the
Companies Ordinance 1984 by the end of financial year 2014-15. Ninety seven percent of the
companies are limited by share and only three percent are other formations. Out of companies
limited by shares, 93% are private companies. Private limited companies are the largest segment
of the corporate sector. Single member companies are 1.87% of the total companies limited by
shares. Single member companies (SMCs) were started incorporating in 2003 by the Securities
and Exchange Commission of Pakistan with the approval of the Federal Government.
In the last five years about six thousand new companies were registered. The largest chunk
of the registered companies is the companies limited by shares parallel to the other economies of
the world.
Figure.2.1 Year wise new company incorporation
0
1000
2000
3000
4000
5000
6000
7000
2005-06 2006-07 2007-08 2008-09 2009-10 2010-11 2011-12 2012-13 2013-14 2014-15

18
2.2.1 Capital markets
The role of capital markets is the efficient allocation of funds, efficiency in terms of
reduction in transaction cost. Efficient capital markets are essential for the effective flow of funds
from households to the business. Capital markets facilitate the effective utilization of funds for
economic growth and prosperity. As a part of financial system capital markets play an important
role in capital formation. Capital markets not only meet the capital requirements of the business,
but also provide liquidity to the investors at the same time. This twofold function of the capital
markets encourages savings and investments which are core to the economic development of any
country. Pakistan’s capital markets like other developing countries are not complete and non-
segmented. Since the development of capital markets is not just the matter of good economic
policies but also time variant function. Capital markets just emerge and evolve over time if the
land for investments is fertile and nourished by good economic planning. Compared to developed
economies Pakistan’s capital market is at the infancy stage. Capital market consists of equity
market and the debt market.
2.2.2 Equity Market
Equity markets play an important role in sustainable economic development of the country.
Complete and dynamic equity markets efficiently channelize funds from household to business
sector. Efficient distribution of national resources increases the available stock of capital and
efficient utilization of the resources. This function of the equity market is technically called
Formation of Capital. By the formation of capital long run availability of funds is ensured which
generates positive economic activity in the country. Increase in economic activity results more
income and savings for household and better economic life.
Pakistan has three stock exchanges namely Karachi Stock Exchange, Lahore Stock
Exchange and Islamabad Stock Exchange. Karachi Stock Exchange is the largest and the most

19
liquid stock exchange of Pakistan with capitalization of more than 41 billion U.S. dollars and
average daily turnover of 254 million shares (KSE website as on May 30th 2012). KSE 100 index
is a weighted average index is being used as a performance indicator of Karachi Stock Exchange.
KSE 100 index is a diversified index of 100 shares. Lahore stock Exchange is the second largest
exchange of Pakistan with an Aggregate Market Capitalization of Rs.3294.1 billion. Islamabad
Stock Exchange is the smallest exchange of Pakistan with total number of listed companies (as of
July 2012) 253 with an Aggregate Market Capitalization of Rs.2824.4 billion.

20
Table 2.2: Performance of KSE at glance (In million except companies, index and bonds data)
Total No. of Listed Companies
31-12-2008 31-12-2009 31-12-2010 30-12-2011 31/12/2012 31/12/2013 31/12/2014 31/12/2015
653 651 644 638 573 569 557 560
Total Listed Capital - Rs. 750,478 814,479 919,161 1,048,444 1,086,439 1,116,005 1,160,341 1,189,519
Total Market Capitalization - Rs. 1,858,699 2,705,880 3,268,949 2,945,785 4,134,732 5,154,738 7,022,692 7,421,032
KSE-100TM Index 5,865 9,387 12,022 11,348 16,538 22,758 29,790 34,827
KSE-30TM Index 5,485 9,850 11,588 10,179 13,387 16,208 20,416 21,573
KSE All Share Index 4,401 6,666 8,359 7,857 11,643 14,988 21,973 24,037
New Companies Listed during the year 10 4 6 4 4 4 5 9
Listed Capital of New Companies - Rs. 15,312 8,756 33,438 16,011 6,275 7,404 19,235 38,140
New Debt Instruments Listed during the year
7 1 4 6 5 9 5 4
Listed Capital of New Debt Instruments - Rs.
26,500 3,000 5,650 14,755 2,000 12,255 8,779 31,000
Average Daily Turnover - Shares in million
147 180 133 97 198 221 229 233
Average value of daily turnover - Rs. 14,228 7,451 4,405 3,506 4,731 5,708 8,730 11,102
Source: Data extracted from the annual reports of KSE

21
Last eight years data of KSE reflects very encouraging performance for the equity securities.
Market indicators (KSE-100 Index and KSE-30 Index) show a gradual recovery of the stock prices,
but no encouraging signs for the debt instruments. The listed capital of debt instruments is
significantly low compared to the equity securities.
Overall Performance of the capital market during the last decade as shown in the following
table depicts a symmetric pattern. The period from 2004 to 2007 was the best period in terms of
turnover and funds mobilization for Pakistan's equity market. It is of great interest specifically with
reference to this research that during last decade equity market has witnessed mix performance.
The symmetric pattern will yield most robust results and findings of this study.
The data show a constant decrease in the number of listed companies in all exchanges. One of the
apparent reasons for this simultaneous delisting trend in all exchanges is that overwhelming
majority of the companies listed on the LSE and ISE are also listed on the KSE. It is another very
important and interesting area of research that what factors affect the delisting decisions.

22
Table 2.3 NUMBER OF LISTED COMPANIES, FUND MOBILISED AND TOTAL URNOVER OF SHARES IN VARIOUS
STOCKEXCHANGES
2001-02
2002-03
2003-04
2004-05
2005-06
2006-07
2007-08
2008-09
2009-10
2010-11
2011-12 2012-13
2013-14
2014-15
KARACHI STOCKEXCHANGE
i) Total Listed 712 702 668 659 658 658 653 651 644 638 591 569 557 560
ii) New Companies Listed 4 2 16 15 14 16 7 8 8 1 3 4 5 6
iii) Fund Mobilized (Rs in billions)
15.2 23.8 4.2 54 41.4 49.7 62.9 44.9 111.8 31 115.1 29.5 47.6 29.1
iv) Total Turnoverof Shares (in billions)
29.1 53.1 97 88.3 79.5 54 63.3 28.3 43 28 38.1 54.32 56.58 38.38
LAHORE STOCKEXCHANGE
i) Total Listed Companies 581 561 647 524 518 520 514 511 510 496 460 440 432 433
ii) New Companies Listed 3 2 18 5 7 10 2 9 25 9 2 2 4 8
iii) Fund Mobilized (Rs in billions)
14.2 4.1 3.1 42.1 24.5 38.8 29.7 32.8 67.5 18.1 5.5 7.7 40.4 4.3
iv) Total Turnoverof Shares (in billions)
18.3 28.2 19.9 17.5 15 8.2 6.5 2.7 3.4 1.1 0.9 1 0.7 0.2
ISLAMABAD STOCKEXCHANGE
i) Total Listed Companies 267 260 251 232 240 246 248 261 244 236 218 210 210 218
ii) New Companies Listed 3 1 8 5 6 12 7 15 2 - - 1 1 7
iii) Fund Mobilized (Rs in billions)
3.7 11.5 2.6 27.6 5.2 30.7 24.6 24.8 76.7 17.8 12.8 8.1 8.1 6.9
iv) Total Turnoverof Shares (in billions)
2.7 2.1 1.4 0.7 0.4 0.2 0.6 0.3 0.2 0.04 0.03 0.03 0.03 0.02
Source: The data extracted from the Economic Survey of Pakistan (various Issues)
23
2.2.3 Debt market
For any economy a vibrant debt market is crucial for sustainable economic growth. Debt
market helps in channeling funds from lenders to corporate borrowers. Debt instruments provide
financial flexibility to both investors and the corporations. In developed countries debt markets
have significant contribution in the national exchequer and constitute a relatively large portion of
total capital markets as a complementary source of finance. In Pakistan, however, debt market
could not develop due to political and administrative reasons. Due to ineffective debt capital
market Pakistan's corporate sector heavily depends on the banking sector (Economic Survey of
Pakistan, 2012). Shah (2007) reported that 82% of the total debt of textile companies was raised
from the banking sources.
Pakistan's debt market as other developing market is incomplete (lack depth and width)
and illiquid. Market capitalization of debt securities is less than one percent of GDP, which is very
low compared to other countries1. Recently a joint task force of SBP and SECP has been formed
to give recommendations to the regulators for development of the debt market2.
As shown in table 1.4, relatively a small number of debt securities are in place. A government with
a total market share of 98% is by far the largest issuer of the debt securities (Economic Survey of
Pakistan 2012). The share of corporate sector and other constituencies is negligible. The major
1DEBT CAPITAL MARKETS COMMITTEE REPORT (2007) The committee reported that one
of the major impediments in the development debt securities market is the ineffective role of Banks
as a trustees of TFCs.
2 SBP Governor Yaseen Anwar disclosed while delivering his key-note address at a conference on
‘Long Term Debt Financing - Issues and Challenges for Pakistan organized by the Institute of
Business Management on March 2012.

24
reason of this dichotomy is the fact that firms feel it easier, cost effective and less risky to raise
funds from the banks.
Table 2.4 Number of companies issued debt instruments and Amount in Billion Rupees of Debt Securities as on 30th June 2015 Privately placed debt securities
Sr. Name of Security Number of Issues Amount (In billion rupees)
1 Term Finance certificates 2 4.75 2 Sukuk 2 5.2
3 Commercial Papers 1 0.5 Total 5 10.45 Corporate debt securities outstanding
Sr. Name of Security Number of Issues Amount (In billion rupees)
1 Listed term finance certificates (L-TFCs) 20 30.36 2 Privately placed TFCs(PP-TFCs) 33 68.86 3 Sukuk 42 393.13
4 Commercial Papers 1 0.5 Total 96 492.85
Source: SECP Report 2015
The data reflect that Privately Placed SKUKs have the largest share in the overall corporate
debt market and the Privately Placed Term Finance Certificates come second. The share of the
other corporate debt securities is negligible. The data show that the debt market is incapable of
meeting the financing requirements of the corporate sector, thus the corporate sector depends on
the other financial institutions for debt financing. This draws attention towards the significance of
the banking sector as determining factors of capital structure adjustment speed. Besides other
essentials, a sound financial system is one which has a variety of available options to the users of
funds as well as providers of funds. Pakistan's corporate sector is deprived of many financial
choices which their counterparts have in developed countries. This fundamental difference in
decision alternatives poses a framing problem. Best out of many choices for capital structure
restructuring and best out of available choices for capital structuring cannot be benchmarked with
one yardstick.

25
Figure 2.2: Corporate Debt Market at Glance
Source: SECP Report 2015
This whole scenario depicts an interesting situation and demands a research study to explore the
financial policy of the firms operating in this unique financial environment. It is imperative to
investigate the corporate leverage decisions and their implications for the firms working in such
financial system. This research addresses the capital structure related issues in the customized
financial system of Pakistan and would help to generalize the findings to the developing economies
like Pakistan. The results of this research would also available for comparison with developed
economies of the world.
Pakistan like other developing countries of the world is facing economic challenges and
also offers promising business opportunities. The corporate sector of Pakistan has great potential
to grow on sound foundation. The results of the research studies conducted in developed
economies or other countries cannot be generalized to Pakistan because of socio-economic
differences. Pakistan has made reasonably good economic growth in recent past besides all
economic challenges like war on terror, energy crises and law and order conditions. These

26
challenges discourage foreign investors besides the fact that government of Pakistan has
formulated very investment friendly policies. This economic vacuum offers great business
opportunities. This potential can be fully realized only if right and thoughtful financial decisions
are made. The research studies peculiar to Pakistan’s challenging environment can guide corporate
sector to formulate effective financial policies. This study is thorough investigation of financial
policy of corporate sector of Pakistan. This research study offers solution to the unique issues of
capital structure of corporate sector of Pakistan.

27
CHAPTER NO. 3
REVIEW OF LITERATURE
The review of literature on capital structure could be organized in several ways. One
approach used by many scholars (e.g., Aggarwal, 1981; Ali, Ahmed and Hisham, 2009; Bancel, and
Mittoo, 2004) is to construct a model and discuss how existing models and theories fit into this model
and/or the discrepancy, if any, is highlighted. The second approach is to discuss model and variables
separately with reference to the existing literature (e.g., Alti, 2006; Baron, 1974; Brealey, Leland,
and Pyle, 1977). The set of factors that has been included in the model presented here is relatively
large and discussion of individual factors would not yield clearer understanding. Thus the literature
review is organized according to the dominant theories of capital structure and then individual
variables are justified. It has been tried to maintain the chronological order wherever possible. The
empirical evidences of theories have been articulated into the relevant category of theories. Certain
studies fit into more than one category of theories or variables which are discussed accordingly. It
has been tried to group the relevant empirical evidences around the theory to which they relate, to
the possible extent. The larger portion of the literature is focused on the empirical research to test
the capital structure theories. Therefore, the findings are in line with the employed methodology
without criticizing the methodology.
3.1 BRIEF CHRONOLOGY OF IMPORTANT CAPITAL STRUCTURE THEORIES
The ideas of capital structure in the modern business sense can be traced back to the year
1938 when Williams J. B wrote his book "The theory of Investment Value" as reported by Rubinstein
(2003). William floated the idea but did not propose any explicit model or theory of financial policy.
He just recommended that some theory should be developed to understand the financial decisions of

28
some firms. Same is the case of Weston (1955) who suggested that theories of capital structure
should be developed to answer the questions; teachers come across while teaching corporate
financial policy. Both of the aforementioned pieces of literature could not get the attention of
academia and practitioners due to nonexistence of any explicit theory or model. Modigliani and
Miller (1958) however, first time advanced a theory of capital structure and got considerable
attention of academia and practitioners. As pioneer capital structure theorists, they set stage for
further research on this imperative decision of the firm. On the word of their supposition, firm’s
value is independent of its capital structure under restrictive assumptions of perfect capital markets
with no corporate or personal taxes, complete perfect market, no arbitrage and equal rate of interest
for individuals and firms. Clearly stating the conditions under which capital structure is independent
of the firm value, actually they irradiated the factors which affect financial policy of the firm. Later
in the year (1963) Modigliani and Miller considered the corporate tax which was held constant in
their initial supposition and theorized that debt provide a tax shield. By 1426relaxing the assumptions
of their initial supposition they set the basis for "Trade-Off Theory" which is most significant and
convincing theory of capital structure. Many scholars have developed their careers by refuting,
advocating and proving this theory from different perspectives. This theory is most researched in the
finance literature.
Building on the work of Modigliani and Miller (1958) Donaldson (1961) proposed a theory
of firms' preference for financing sources. They hypothesized that firms follow an observable pattern
of preference when they finance the growth opportunities or operations. This theory was modified
by Mayer and Majluf (1984). They proposed an adverse selection model which was later known as
"Pecking Order Theory". They gave a ranking of preference for various sources of finance. As a

29
contender of tradeoff theory, pecking order theory also fascinated many researches in the field of
financial policy.
According to Mayer and Majluf 1984 "A firm is said to follow a pecking order if it prefers
internal to external financing and debt to equity if external financing is used."
Capital structure has also been widely researched with agency perspective. Jensen and
Mackeling (1976) initiated the theory of agency conflict in which two types of agency conflicts were
accentuated; one among the owners and the mangers and second between the owners and the debt
financers. Agency theory envisages positive relationship between leverage and firm's value.
Ross (1977) and Leland and Payle (1977) deliberated that inefficiencies in the capital market
are propelled by the asymmetry of information between the managers and the outsiders. Asymmetric
information theories try to predict the changes in prices of securities in response to capital
restructuring and observe the preferred sources of financing.
3.2 MODIGLIANI-MILLER IRRELEVANCE THEOREM
All the developments in the field of financial policy are attributed to the debate initiated by
Modigliani and Miller (1958). None of the significant and explicit theory of capital structure could
be found before their supposition therefore their work is considered seminal work in this segment of
finance. They hypothesized that, in a perfect market, the value of a firm is unaffected, no matter how
that firm is financed assuming that there is no taxation, no agency costs and asymmetry of
information. This theory instigated many questions which later on served as a foundation stone for
new theories and models of capital structure. The proponents of this theory argue that by distribution
of cash flows among the capital providers in any proportion would have no effect on the aggregate
value of the firm. Normally an example is given that cutting the cake in whatever manners will not
affect the size of cake. The implicit assumption of this theory is that investors and firms have equal

30
access to the financial markets and they have equal opportunity to rebalance their financing mix.
Thus the leverage of the firm is independent of whatever leverage investors have, therefore firm's
leverage would not affect the market value of the firm.
Afterward, two perspectives of irrelevance principle emerged. One is classic arbitrage based
view in which investors offset the leverage of firms with their own leverage; consequently no effect
on the market value of the firm. Steglitz (1969) Hishelifer(1966) and Baron (1974) strongly
advocated this classic arbitrage based irrelevance proposition and reported convincing evidence in
favor of their claim. Second , model of irrelevance principle based on market equilibriums was given
by the Auerbach and King (1983). They argued that equilibrium conditions bear the cumulative effect
of aggregate debt and equity in the market. They failed to specify that how market equilibrium can
affect the firm' financial policy. Their work was in line with the Miller’s (1977) argument that
personal taxes and corporate taxes are determinants of market level aggregate leverage.
Popular debate on MM principle is regarding the unrealistic assumptions of the theory. The
critics gave convincing and logical evidences against the theory. The opponents criticized the MM
theorem on the ground that it is based on unrealistic assumptions which do not hold true in the real
world. The proponents answer this criticism by stating that MM theorem's assumptions are basically
illustrious factors under which capital structure does affect firm value.
In 1963 Modigliani and Miller reviewed and revised their irrelevance principle by including
the factors initially held constant, they documented that the use of debt leads to optimal capital
structure that minimizes the cost of capital and thus increases firm’s value. The dilution in cost of
capital is attributed to the tax benefit of debt specifically for the economies where the interest is tax
deductible expense. Based on these developments, significantly large number of theories was
proposed. Many scholars tested, refuted or challenged these theories and built their careers in finance.

31
In line with Modigiliani and Millers' later work Stiglitz and Joseph (1969) also examined the MM
theorem without the assumptions originally taken by M&M. They gave convincing arguments in
favor of the existence of optimal capital structure. Lewllen and Mauer (1988) by taking risk
perspective of M&M theorem reported that irrelevance principle holds true, if time and state are
controlled in a certain way. Their findings indicate that capital structure affects the value of the firm
if the risk is a time variant factor. Titman (2002) highlighted the implications of M&M theorem with
reference to the financial markets. He argued that market conditions affect the leverage decisions of
the firms and market conditions are determined by the suppliers of capital i.e. individuals and firms.
Regardless of the implications and significance of their thesis, Modigliani and Miller actually paved
the way to the capital structure research.
3.3 PECKING ORDER THEORY
Pecking Order Theory as a contestant to Tradeoff Theory has also got considerable attention
of the academia. Both theories have been central point of finance literature for last few decades.
Economics model of inside information is the origin of theories based on asymmetric information
like pecking order theory. Managers as insider have better insights about the financial prospects of
the company. Outsiders misprice the securities due to incomplete and inaccurate information about
the financial health and profitability of the firms. Myers and Majluf (1984) first time hypothesized
that firms follow a pecking order for different financing sources. They hypothesized that firms prefer
internally generated funds over external debt financing and debt financing over the issuance of new
equity. Later Shayam-Sunder and Myers (1999) established an empirically testable model for
pecking order theory. They tested their model on US firms and found strong implications of pecking
order theory. Kraskar (1986) protracted the concept of Mayer and Majluf by considering the size of
the project being financed and the corresponding new issue. He upheld the Mayer and Majluf's

32
supposition that large stock offerings affect the stock price inversely. Heinkel and Zechner (1990)
also got the similar results and added to that debt is less mispriced than equity, thus, financing new
projects with debt would reduce the risk of overinvestment. Brenan and Krause (1987) found results
contrary to the Pecking order as envisioned by the Mayer and Majluf. They reported that firms do
not follow the order of preference strictly in accordance with the pecking order theory. They argued
that the problem of overinvestment can be resolved by sensible financing no matter how that
financing mix is established. Neo (1988) also rejected the thesis of Mayer and Majluf for same
reasons mentioned by Branan and Krause (1987). Grundy (1989) in line with Brenan and Krause
repudiated the pecking order theory and concluded that by increasing financing choices would
invalidate the claim of pecking order theorist.
Frank and Goyal (2002) in their empirical paper tested the pecking order theory on a large
set of pooled data, they concluded that large firms follow pecking order ,however, their finding do
not supported pecking order in case of small firms. In small firms equity issue tends to dominate
external debt in order of preference. Jong, Verbeek and Verwijmeren (2009) also attest pecking order
and found supportive results for pecking order theories. They reported a significant relationship
between leverage decisions and debt capacity. Keeping debt capacity constant they tested firm size
and time along with pecking order. They concluded that financing deficit and financing surplus play
a vital role in leverage decisions. However, Ahmed and Hisham (2009) found mix results in their
comparative study of pecking order model and tradeoff model. They concluded that internal funds
deficiency is the major determinant of leverage of Malaysian companies which is consistent with the
pecking order theory. They also found statistically significant results in favor of tradeoff theory.
Lemmon and Zender (2010) tested pecking order theory with reference to rating of the firm's
outstanding debt. The implicit assumption of using debt rating as a proxy for debt capacity is the fact

33
that companies with high rated debt have relatively better prospects to generate more debt. With the
sample of heterogeneous companies they reported pecking order theory best describe the financing
patterns of small and large companies. Their findings are consistent with the pecking order theory.
3.4 AGENCY THEORY
In corporate setting, management is separate from the ownership. Management act as agent
of owners, the separation of ownership from the management may create a conflict of interest
between agents (management) and principals (owners). Management may not necessarily act in the
best interest of shareholders for the sake of their own benefits. This phenomenon is referred as
agency problem. Jensen and Meckling (1976) initiated this stream of capital structure studies. They
considered the agency cost associated with the debt financing and analyzed its impact on the
financing decisions of the firm. They indicated two types of agency conflicts one between the equity
holders and managers and second between the creditors and the management. They documented that
in first type of conflict debt serve as a control mechanism by creating financial inflexibility for the
managers to serve their own interests. The second type of conflict, which exists between the debt
holders and the equity holders, they treated as cost of the debt. Assets substitution effect (investment
in more risky assets by managers contrary to the risk tolerance of debt providers) decreases the value
of debt which is a cost for the firm. They argued that firms strive to optimize capital structure in
between these two agency conflicts. Jensen (1986) argued that since debt requires mandatory fix
payments, it reduces the free cash flows, consequently reduces the space for managers to persuade
their personal benefits at the cost of equity holders. Mayer (1977) also embarked upon similar kind
of agency conflict he reported that the equity investors don’t have any incentive to contribute capital
in financially distressed firms even for value increasing projects. Jensen (1986) gave another
advantage of using debt, he observed that the mandatory cash payments of interest and debt servicing

34
will reduce the free cash flows resultantly eliminate or reduces the discretionary powers of the
mangers. According to his view debt serves as the disciplinary mechanism to control or reduce the
agency cost. Stulz (1991) specified the same thing as the cost of debt financing. As per their thesis
the cost of debt, which was not specified by the Jensen (1986), is underinvestment due to financial
inflexibility and risk of financial distress. Their perceived cost of debt is of similar nature to the
supposition of Haris and Raviv (1990). However, the benefit of debt financing indicated by Haris
and Raviv (1990) is the ease of liquidation by the equity holders in case liquidation is desired. They
reported that firms with higher liquidation value have more debt in their capital structure contrary to
the firms having less liquidation value. Hirshleifer and Thakor (1989) concluded that agency cost,
bankruptcy cost and tax benefit of the debt when combined to a single place, gave birth to the concept
of trade-off. The trade of between the cost and benefits of the debt financing further leads to the
concept of optimal capital structure.
Chang (1987) using agency model, however, found a negative relationship between leverage
and profitability, contrary to other studies. Their findings indicate that less profitable firms have
comparatively high degree of financial leverage. There are fewer studies which have concluded
negative relationship between debt financing and performance of the firm. Titman and Tsyplakov
(2007) used continuous time model to prove the impact of agency cost on the optimality of the capital
structure. Their supposition based on the endoginity of the firms' value and the investment choices,
indicates relationship between cost of financial distress due to agency problem between shareholders
and bondholder and the firm's ability to adjust its capital structure.
The implications of all variations of agency theory indicate significant relationship between
the leverage and firms value. Agency theory also indirectly implies some kind of tradeoff between
the administrative cost of debt and administrative benefits of debt financing.

35
3.5 TRADEOFF THEORY
The most researched and substantial theory of capital structure is tradeoff theory. Tradeoff
theory is often described as a group of related theories which emerged to establish the existence of
optimal capital structure. Optimality is ascribed to tradeoff between different types of cost and
benefits of debt. Personal and corporate taxes, cost of financial distress, market imperfections and
agency conflicts are often synthesized as variations of tradeoff theory. This stream of finance
literature came into being when scholars started relaxing basic assumptions of MM theorem.
Academics have investigated various tradeoffs between an advantage of the debt and costs associated
with debt financing. These tradeoffs can be grouped into four categories or four subsidiary models,
namely; (1) debt tax shield (2) cost of financial distress (3) Agency problem (both between debt
providers and management and equity holders and management) (4) Market signaling theory another
countenance is asymmetric information.
The first expression of tradeoff theory can be traced back to the Modigliani and Miller's work
in 1963 when they relaxed one of the major assumptions of their irrelevance principle, the existence
of personal and corporate taxes,. They concluded that the leverage does affect the value of firm in
presence of corporate and personal taxes. On the way pawed by Modigliani and Miller, Scott (1976)
proposed a multi-period static model of tradeoff, assuming the existence of possible bankruptcy and
imperfect market. They argued the existence of a unique optimal capital structure of the firm. He
also specified the parameters of the optimal capital structure of the firm. Mauer and Ott (2000) gave
a detail and comprehensive analysis of competing models of tradeoff theory which are later widely
researched with reference to the growth opportunities and debated with reference to the explanatory
powers of these models.

36
In the absence of offsetting the cost (bankruptcy cost) the MM irrelevance model entails
hundred percent debt financing which does not hold true in the real world. The net marginal benefit
of debt is decreasing function, due to the offsetting cost of debt, after certain level the cost of debt
outweighs the benefit, therefore debt is no more advantageous. The point where the cost and benefit
of debt is equal or marginal benefit of debt is zero is called optimal capital structure. Kraus and
Litzenberger (1973) referred cost of debt as deadweight cost of financial distress. They reported that
capital restructuring decisions are mostly driven by the potential cost of bankruptcy which is
bankruptcy risk. They documented that firms optimize their capital structure by weighing the
bankruptcy risk with tax benefit of debt.
Figure 3.1: Graphical presentation of Tradeoff Model
This tradeoff indicates that the marginal benefit of tax saving gradually offset against the cost
of debt. This tradeoff between benefit and cost of debt postulates existence of optimal capital
structure (Graham and Tucker, 2006;DeAngelo and Masulis, 1980). DeAngelo and Masulis (1980)

37
concluded that the marginal benefit of tax and default cost if incorporating in the Miller’s differential
tax model fallouts market equilibrium in which each firm has a distinctive optimum leverage. Their
claim implies that the optimality is endogenous to firms, therefore the assumptions of bankruptcy
cost, agency cost or other leverage related costs are irrelevant. In support of their thesis, they
postulated that market prices capitalize the personal and corporate taxes and make bankruptcy cost a
significant consideration in debt equity trade off. Leland (1994) tried to standardize the tradeoff
model. Their generic model implies that where the marginal bankruptcy cost is equal to the marginal
tax benefit that point is called optimal capital structure. He suggested that the tax benefit of debt is
offset by the cost of financial distress which is the result of debt financing. At the point where the
marginal benefit of financial leverage is equal to the marginal cost of the financial distress is called
optimal capital structure.
In all types of trade off theories, the cost and benefits of debt were calibrated by different
perspectives like Jensen (1986) treated debt as a tool to control agency problem which exist between
the management and shareholders; Leland and Pyle (1977) and Ross (1977) calibrated issue of new
debt as signals to market regarding the financial position of the firm.
3.5.1 Dynamic Tradeoff Model
Static tradeoff theory states that firms have an optimal capital structure which is determined
by balancing the cost and benefits of the debt. However, the dynamic model of tradeoff theory
implies that the optimal capital structure of the firm is a time variant phenomenon. Due to random
shocks and changes in macroeconomic conditions, the optimal capital structure of the firm varies
over time and firms deviate from their optimal capital. The fluctuation in optimality over time in
response to changes in the financial environment and firm specific factors force firms to rebalance
their capital structure. Both models indicate existence of optimal capital structure, however, dynamic

38
model as the extension to static model devise capital structure adjustments toward optimal for the
firms.
Fischer, Heinkel and Zechner (1989) introduced the dynamic tradeoff model based on market
imperfections. Considering the transaction cost, they found empirical evidence in favor of their
argument that firm specific factors determine the range of firms' leverage ratio. Shayam Sunder and
Mayer (1999) applied tests of dynamic tradeoff model and concluded that the firms which marginally
balance the cost of debt with tax benefits outperform the firms which don’t optimize their capital
structure. Hovakimian, Opler, and Titman (2001) illuminated the role of capital structure deviations
on the restructuring decisions. They studied different restructuring strategies with reference to the
capital structure deviations. They found that deviation from the optimal capital structure have greater
influence on the repurchasing strategy (treasury stock or retirement) than the issuance of new
securities for rebalancing of capital structure. Arvin and Francis (2004) testified that firms adjust
their capital structure to the industry mean. They observed that adjustment speed is high when the
firms are over levered and the speed of adjustment is low when the firms are under levered. Their
applied non parametric Fisher Exact Probability (FEP) test and Goodman-Kruskal Gamma measures
in their analysis. Flannery and Rangan (2006) also affirmed that firms have target capital structure
and firms strive to reach their target level. In their empirical study, they found that firm could achieve
only one third of their target level. Flannery and Hankin (2007) documented that adjustment speed
is the result of firms’ endeavor to balance between the cost of adjustment and the cost of deviation
from the target. Cost of adjustment refers to the transaction cost of capital transactions and the value
of firm’s equity, the cost of upward deviation from the optimal leverage is referred to as cost of
financial distress. Leary and Roberts (2005) argued in favor of the existence of target capital structure
in favor of their supposition. They provided empirical evidences. They pointed out that firms actively

39
rebalance their capital structure which indicates that firms strive to achieve a specific level of
leverage and referred it as “target range of leverage”. Ju.Net.al (2005) applied a contingent claim
method to test dynamic tradeoff model. They concluded that firms with moderate deviation from the
optimal capital structure should not adjust their capital structure frequently as cost of adjusting
outweighs the benefit of adjustment. Flannery and Rangan (2006), using a partial adjustment model
affirm that firms do have a target capital structure and strive to achieve that target level. Kayhan and
Titman (2007) argued that the dynamic tradeoff model has more explanatory powers than pecking
order model and market timing model. Strebulaev (2007) strongly advocated the view that none of
any static model of capital structure has explanatory powers. One point optimality is beyond the
reality, in dynamic economy actual capital structure deviates from the optimal capital structure and
firms strive to achieve that optimality by readjusting their financing mix. The frequency of
adjustment in the presence of friction is low which propels divergence of actual capital structure
from the optimal one. In their most cited and seminal work on dynamic adjustments, Susmel and
Zhao (2008) attested the dynamic tradeoff theory with the help of large pooled data set. In their
empirical research they tested the dynamic model of tradeoff theory and reported firms adjust their
capital structure, however, the parameters of adjustment vary significantly across the firms. They
reported strong empirical evidence in favor of a dynamic model of tradeoff.
Very few studies on capital structure refute the existence of the optimal capital structure
hypothesis. Hennessy and Whited, (2005) used a customized, dynamic tradeoff model and reported
that the optimal capital structure is non-existent. Their claim cannot be taken at par because there is
no reason to believe that finance managers are not aware of the implication of the optimal capital
structure. However, model or methodology for testing or measuring optimal capital can be

40
questioned. Without any solid reason, it cannot be assumed that significant financial decisions like
capital structure are made without due diligence.
3.5.2 Adjustment towards Target Capital Structure
The recent development in pecking order theory is a dynamic model of tradeoff. Dynamic
model of tradeoff theory stipulates a time variant target capital structure. Firms make capital
restructuring decisions to reach that target level by making capital transactions for adjustments in
their existing financing mix. Firms make capital structure adjustments to achieve the optimal mix of
debt and equity. The adjustment process and the magnitude of adjustment determines effectiveness
of the restructuring process which is referred to as the adjustment speed. The literature suggests that
speed of adjustment is influenced by many micro and macro-economic factors or more specifically
firm specific or financial, environmental factors (Drobetz and Wanzenried, 2006; Hackbarth, Miao
and Morellec, 2006; Huang and Ritter, 2009; Cook and Tang, 2010).
Ozkan (2001) applied the generalized method of moment for estimation of target capital and
reported that firms do have long term target leverage ratios. He argued that deviation from the target
capital structure is a substantial cost for the firm. Therefore, firms strive to fill this gap by corrective
measures provided that the cost of adjustment is lower than the cost variance. Fama and French
(2002) reported that US firms adjust their capital structure from 7% to 18% per annum. They further
documented that the payout ratio of the firm affects the adjustment speed inversely. Hovakimian,
Hovakimian and Tehranian (2004) in their comprehensive study investigated the operating
performance, market performance and target capital structure. They concluded that capital market
conditions of the firm play important role in shaping the target level of capital structure. They also
found results consistent with market timing theory and reported that high stock returns encourage
firms to issue equity securities. Flannery and Rangan (2006) used partial adjustment model. Their

41
empirical results suggest that firms on average attain one third of their target leverage ratio by
making adjustments in their existing debt and equity. Hackbarth, Miao and Morellec (2006) argued
that macro-economic conditions and cyclical movements in the industry affect the capital structure
adjustment and this effect is stronger in cases where cash flows depend on the economic conditions.
They suggested that in boom and recession periods firms should not engage in big capital
transactions rather restructuring should be done more frequently and in small amounts. Their
arguments are strong and logical but empirical test of their model is imperative to attest their
suppositions. Titman and Tsyplakov (2007) in their proposed dynamic model argued that firms with
high cost of financial distress and low agency conflict between debt holders and equity holders adjust
their capital towards target level quickly. Firms having severe agency conflict cannot adjust their
capital structure even if they are over levered or under levered due to financial inflexibility resulting
from agency problem. Huang and Ritter (2009) found that US firms adjust their capital structure
with moderate speed and it take on average 3.7 years in full adjustment. Their results imply that US
firms adjust their capital about 27% per annum. Their findings are consistent with the other empirical
studies. Getzmann, Lang, and Spremann (2010) in their empirical study found that Asian firms on
average adjust 27% to 39% their capital structure toward target level. They applied the same
methodology which is used in this study. They claim that their results are consistent with the other
studies on capital structure adjustment speed. Cook and Tang (2010) investigated the impact of micro
and macroeconomic conditions on the firm's ability to adjust capital structure. They reported that in
good economic conditions adjustment speed is high whereas in unfavorable economic conditions
firms cannot adjust their capital quickly.
According to the dynamic model of tradeoff theory firms have a target level of the capital
structure and firms actively pursue that target level keeping in view the cost and benefits of
42
restructuring. In favorable economic conditions firms adjust their capital to the target provided the
firm specific financial conditions permit (e.g., Bancel and Mittoo 2004; Sundaresan, Wang and
Yang, 2015; Elsas, Flannery, and Garfinkel, 2014). The adjustment process involves a tradeoff
between the benefit of tax shield and overall cost of debt, which include the financial cost,
administrative cost and cost of financial distress. During the good economic conditions generally the
firms have more financing avenues and cost of adjustment is comparatively low. Economic
conditions play an important role in correction of capital structure deviations caused by random
shocks (Antão and Bonfim, 2014). The underlying concept of rebalancing the capital structure is to
ensure effective use of capital by leverage. More specific view of dynamic tradeoff theory poses that
by random shocks firms gradually deviate from the optimal level of capital structure over time and
firms constantly adjust their capital structure to undo the random shocks (Halling and Zechner,
2014). Firms adjust their capital structure fast where the cost of being away from the target level of
capital outweighs the cost of rebalancing. Deesomsak, Paudyal and Pescetto (2004) probed Asia
Pacific firms' capital structure decisions and found that environmental factors, along with the firm
specific factors play significant role in financing decisions. Existing literature suggests that capital
structure adjustments are attributed to the institutional setting and environmental factors.
Environmental factors in broader perspective affect the rebalancing cost of capital. Convergence to
target capital structure which is also referred as adjustment speed is considered the result of legal
and financial environment (e.g., Cook and Tang, 2010; Elsas and Florysiak, 2013; Getzmann, Lang,
and Spremann, 2010).
For the last two decades a significant number of studies have focused this issue and produced
consistent results. Graham and Harvey (2001) reported that firms have a target level of the capital
structure and capital structure rebalancing is done to that target in mind. In their large survey they

43
reported that more than 80% Chief Financial Officers of the firms do have a strict target capital
structure or an acceptable range of capital structure. They also claimed that the CFOs of the firms
clearly know or acknowledge the cost and benefit of rebalancing the capital structure.
Being overleveraged or underleveraged cannot be considered a deliberate choice of firms
rather the environmental changes over time turn a well knitted capital structure to overleveraged or
underleveraged. This deviation from the optimal or target level of the capital structure impairs the
firm’s value (e.g., Mukherjee and Mahakud, 2010; Aybar, Casino and López, 2012). The firms strive
to undo the deviation by making adjustment in capital structure. The adjustments are done by issuing,
retiring or swapping the securities or debt covenants. These transactions do involve cost now the
firms have to tradeoff between the cost of adjustments and the resulting incentives. If the cost of
adjustment is low the adjustment speed will be higher and vice versa. In the ideal state where there
is no transaction cost firms adjust their capital structure immediately where there is high transaction
cost the adjustment speed is competitively slow. The capital structure adjustments are well
documented in the literature. Meany studies have found that rebalancing behavior exists and firms
do adjust their capital the speed of adjustment depend on the transaction cost of the adjustment.
Leary and Roberts (2005) found that the transaction cost of capital adjustment has a clustering effect
on the leverage rebalancing. Faulkender et al. (2008) also concluded that the cost of adjustment is
an important factor, faster adjustment are reported when the cost of adjust is sunk in case the
adjustment cost is incremental the adjustment is slow. The cost of adjustment is also affected by
various macroeconomic and firm specific factors. The macroeconomic conditions play an important
role to form the investors’ expectations about the returns. Hackbarth et al. (2006) argued that the
adjustment speed of capital structure is affected by the economic conditions of the country. He
advocated that during economic boom the adjustment is higher than the economic recession period.

44
Cook and Tang (2010) focused on macroeconomic conditions to investigate the relationship between
the economic conditions of the state in which firms operate. They found that in good economic state
firms adjust the capital structure faster than the bad economic state. The claim of tradeoff theory has
logical and empirical conviction which cannot be ignored or superseded without superior arguments
and theoretical support which is still awaited.
2.6 MARKET TIMING THEORY
Ross (1977) presented a model of market timing. He claimed that restructuring decisions of
capital structure are made to exploit the capital market favorable conditions. According to this
philosophy firms issue equity securities in the time of favorable equity market conditions and debt
in unfavorable debt market conditions. Two versions of the market timing theory got popularity in
prominent finance circles. First version as inverse selection model proposed by Mayer and Majluf
(1984), in which firms issue equity after releasing information to reduce the asymmetry of
information assuming manger and investors are rational. Lucas and McDonald (1990) reported that
firms tend to issue new equity after positive returns on stock or rise in the market. Their results are
consistent with the theory that firms strive to time. Korajczyk, Lucas and McDonald (1992) studied
the adverse selection over time and concluded that market timing persists.
Baker and Wurgler (2002) found market timing theory prevalent and reported that capital structure
is the result of firms' effort to time the capital market. Huang and Ritter (2005) in their empirical
study of US capital market found strong evidence in favor of market timing theory. They reported
that US firms' external financing decisions are influenced by equity risk premium. Alti (2006) in his
empirical investigation found results attesting that market timing is important determinant for the
capital structure decision. He concluded that firms with good primary market which he referred as
hot market issue more equity at the time of IPO opposite to the firms with cold market. After IPO

45
firms with good prospects and hot market increase their leverage by issuing debt securities. He
implied that firms strive to exploit market conditions for rebalancing capital structure. Byoun (2008)
found that firms adjust their capital structure by stepping down when firms are over levered and they
have financial surplus. Firms increase their leverage by rebalancing the capital structure in the times
of financial distress. His results are not consistent with the pecking order theory rather indicates
financing decisions are influenced by market timing. DeAngelo, DeAngelo and Stulz (2010) also
found that market timing play an important role in the financing decisions and consequently
performance of the firms. They studied the market timing and the firm's life cycle together as factors
of the restructuring decisions. They found reported that basic determinant of Seasonal Equity
Offering is need of financing but market timing and life cycle stage play significant role as an
ancillary variable.
In Pakistan’s context where market is incomplete and segmented in addition to volatile
economic conditions, no any single theory is comprehensive enough to explain the corporate
financing decisions. Dynamic version of tradeoff theory appears to be more convincing on account
of highly dynamic environment of Pakistan. It is assumed that corporate sector of Pakistan response
to the changing economic conditions by making adjustments in their capital structure to bring it to
the optimal level.
2.7 VARIABLES
After extensive literature review most significant (which existing studies proved significant
determinants) variables have been identified and selected. The primary objective of this study is to
estimate the adjustment speed of non-financial corporate sector. To this end, the parameters of the
considered variables have been estimated. With the help of these parameters target level of capital
structure is estimated in two steps. The logical explanation has also been given and hypothesized

46
relationship is established on the basis of logics and with reference to previous studies. The
hypothesized signs of the relationship between the considered variables are guided by the tradeoff
theory.
2.7.1 Estimators of target capital structure
2.7.1.1 Size of the firm
The research suggests that size of the firm is one of the most significant determinants of
target capital structure. Researchers have interpreted the significance of size of the firm from diverse
perspectives. For instance Rajan and Zingales (1995) specified that size of the firm as proxy for
asymmetric information has significant effect on firm's leverage decisions. According to Rajan and
Zingales (1995) large firms have more information symmetry than the smaller companies. The
symmetry of information reduces the cost of capital thus has positive impact on the leverage of the
firm. Lee and Kwok (1988) compared the capital structure of MNCs with the DCs and found
significant difference between the capital structure of MNCs (large companies) and DCs (Small
companies). Baker and Wurgler (2002) also attest that size play an important role in the capital
structure decisions of the firms. Very few studies refute size as a determinant of capital structure
(e.g., Aggarwal, 1981; Wald, 1999).
The nature of relationship between size and the capital structure is not clear. Tradeoff theory
postulates a positive relationship whereas pecking order theory and information asymmetry
assumption indicates a negative relationship. Given below is the list of studies which have found
significant relationship between the size of the firm and its capital structure. There is a great deal of
variation among the researchers about the direction of relationship. Mix results were found about the
positive and negative relationship. This is not complete list of studies but give a fair idea that size
is an important factor of financing decisions.

47
Sr. No Determinants of Capital Structure
Literary Evidences
1 Size
o Galai and Masulis (1976)
o Jensen and Meckling (1976)
o Myers (1977)
o Grossman and Hart (1982)
o Mayer and Majluf (1984)
o Titman and Wessels (1988)
o Bennett and Donnelly, R. (1993)
o Ozkan (2001)
o Baker and Wurgler, (2002)
o Bancel and Mittoo, (2004)
o Hall, Hutchinson, and Michaelas, (2004)
o Bancel and Mittoo, (2004)
o Shah, Hijazi,and Javed, (2004)
o Shah and Hijazi, (2004)
o Huang and Song, (2006)
o Hijazi and Tariq, (2006)
o Haas and Peeters, (2006)
o Delcoure, (2007)
o Shah and Khan, (2007)
o Frank and Goyal, (2009).
o Getzmann, Lang and Spremann, (2010)
o Lemmon and Zender, (2010)
o Sheikh and Wang, (2011)
Conclusion: Both negative and positive relationships are found based on the underlying
theory. Majority of the researches based on tradeoff models found positive relationship.
This study also hold the stance of tradeoff theory. Therefore we hypothesized the positive
relationship
H1: There is a positive relationship between capital structure and size of the firm.

48
2.7.1.2 Profitability
According to this survey of literature profitability is the second most important factor of
capital structure decisions. Both pecking order theory and static tradeoff theory cogitates profitability
as significant factor. However the disagreement persists on the nature of relationship between these
two competing theories. Very few studies could be found which refute profitability as determinant
of capital structure (see, Aggarwal (1981).
The relationship of profitability and capital structure is explained from diverse perspectives.
Various tradeoff considerations pose a positive relationship for instance profitable firms employ high
leverage to reduce their tax burden, in accordance with the agency theory debt as a controlling
mechanism reduces the agency cost, profitable firms have low expected cost of financial distress
therefore they have added advantage to use debt financing. In contrast, pecking order theorists
assumes a negative relationship, profitable firms are able to generate funds from internal sources
therefore their leverage ratios are lower. All of the studies in the following list have calibrated
significant relationships either negative or positive.
Sr. No Determinants of Capital Structure
Literary Evidences
2 Profitability
Bennett and Donnelly, (1993)
Ozkan, (2001)
Deesomsak, Paudyal, and Pescetto, (2004)
Hall, Hutchinson, and Michaelas, N. (2004)
Shah, Hijazi, and Javed, (2004)
Huang and Song, (2006)
Haas, and Peeters, (2006)
Delcoure, (2007)
Shah and Khan, (2007)

49
Frank and Goyal, (2009)
Lemmon and Zender, (2010)
Getzmann, Lang, and Spremann, (2010)
Qiu, and La, (2010)
Conclusion: Both positive and negative relationships are found in existing literature. In line
with tradeoff theory most of the studies have found negative relationship between
profitability and capital structure.
H2: There is a negative relationship between capital structure and profitability.
2.7.1.3 Collateral Value of Assets
Tangible assets of the firm are considered a security against the debt covenants. Literature suggests
that the proportion of fixed assets in the asset structure of the firm increases the chances that firms
can raise more debt than the firms having low fixed asset ratio. Morellec (2001) exclusively
established that the relationship between the asset structure and financing decision is significant. The
following list of the researches has tested collateral value of assets as a determinant of capital
structure and found mix results.
Sr. No Determinants of Capital Structure
Literary Evidences
3 Collateral value of Assets
Bennett and Donnelly, (1993)
Ozkan, (2001)
Morellec, (2001)
Shah, Hijazi, and Javed, (2004)
Deesomsak, Paudyal, and Pescetto, (2004)
Hall, Hutchinson, and Michaelas, (2004)
Huang and Song, (2006)
Delcoure, (2007)

50
Frank and Goyal, (2009).
Lemmon and Zender (2010)
Qiu, and La, (2010)
Getzmann, Lang, and Spremann (2010)
Conclusion: Both positive and negative relationships are found in literature. In line with
agency problem between shareholders and creditors as well as other expressions of tradeoff
a positive relationship is envisaged.
H3: There is a positive relationship between capital structure and collateral value of assets.
2.7.1.4 Growth Opportunities
Conventional wisdom postulates that growing firms need more capital than firm at maturity
level or having less growth opportunities. For meeting their capital requirements firms raise capital
from diverse sources, by this logic a positive relationship between growth opportunities and capital
structure can be expected. However, Gul (1999) found inverse relationship contrary to the
conventional wisdom and results of many other studies. Following is not fully exhaustive list of
studies which found significant relationship between collateral value of assets and the capital
structure.
Sr. No Determinants of Capital Structure
Literary Evidences
4 Growth opportunities
Bennett and Donnelly, (1993)
Gul, (1999).
Ozkan, (2001)
Anderson, (2002)
Hall, Hutchinson, and Michaelas, (2004)
Shah, Hijazi and Javed, (2004)

51
Deesomsak, Paudyal, and Pescetto, (2004)
Low and Chen, (2004)
Haas and Peeters, (2006)
Delcoure, (2007)
Shah and Khan, (2007)
Qiu, and La, (2010)
Conclusion: The existing literature reflect mix results for this variable few studies in line
with pecking order or information asymmetry suggest a negative relationship whereas
tradeoff theory envisage a positive relationship.
H4: There is a positive relationship between capital structure and growth opportunities.
2.7.1.5 Non-debt tax shield
As per claim of tradeoff theorists in presence of corporate taxes, debt provide tax shield. Interest is
a tax deductible expense; use of debt reduces the tax expenses of the firm. The tax deductibility
dilutes the overall cost of capital and resultantly increases the value of firm. Depreciation,
amortization and depletion like interest are also tax deductible expenses and provide tax shield
parallel to the interest. If the firm has ample non-cash expenses which can reduce the tax burden of
the firm, the firms find debt financing less attractive if other things remains the same. So a negative
relationship can be envisaged between the Non-debt tax shield and the capital structure.
Sr. No Determinants of Capital Structure
Literary Evidences
5 Non-debt tax shield
Bennett and Donnelly, (1993)
Ozkan, (2001)
Huang and Song, (2006)

52
Haas, and Peeters, (2006)
Delcoure, (2007)
Shah and Khan, (2007)
Getzmann, Lang, and Spremann, (2010)
Conclusion: Most of the studies have found negative relationship between non-debt tax
shield and the capital structure.
H5: There is a negative relationship between capital structure and non-debt tax shield.
2.7.1.6 Earnings Volatility
Earnings volatility as measure of riskiness indicates negative relationship with leverage. Two
implications of earnings volatility for capital structure can be established, first as measure of risk
debt financers expect high return from firms having volatile earnings. Therefore firms will find it
costly to have debt financing. Second; due to unpredictable earnings, firms cannot program
repayment plans with certainty. The cost of potential default resists firms to deploy debt in their
capital. The following list of theoretical and empirical researches tried to establish this relationship.
Sr. No Determinants of Capital Structure
Literary Evidences
6 Profitability
Bennett and Donnelly, (1993)
Nivorozhkin, (2004)
Deesomsak, Paudyal, and Pescetto, (2004)
Huang and Song (2006)
Haas, and Peeters, (2006)
Delcoure, (2007)
Qiu, and La, (2010)

53
Lemmon and Zender, (2010)
Conclusion: Negative relationship is found in almost all studies.
H6: There is a negative relationship between capital structure and earning volatality.
2.7.1.7 Liquidity
Liquidity measures firm's ability to meet its financial obligations. Firms with more liquid
assets have less potential of default and bankruptcy and more financial flexibility. The financial
flexibility of the firms encourages firms to employ debt as an alternate source of financing. Firms
with poor liquidity find it hard to service debt therefore a negative relationship between the debt
financing and liquidity can be hypothesized. Many of the researchers have found robust results for
establishing negative relationship between capital structure and the liquidity of the firm.
Sr. No Determinants of Capital Structure
Literary Evidences
7 Liquidity Hoshi, Kashyap and Scharfstein, (1991)
Ozkan, (2001)
Anderson, (2002)
Deesomsak, Paudyal, and Pescetto, (2004)
Low and Chen (2004)
Amihud, and Mendelson, (2005)
Eriotis, Vasiliou, and Ventoura-Neokosmidi,
(2007)
Lipson and Mortal (2009)
Sibilkov, (2009)

54
Conclusion: The proportion of liquid assets in the assets structure of the firm signals short
term solvency to meet the financial obligations. Positive relationship has been found in
literature.
H7: There is a positive relationship between capital structure and liquidity.
2.7.1.8 Firm Specific Interest Rate
Interest as cost of debt play important role in the debt financing. Prevailing market interest rate and
the risk return profile of the debt securities, nature of debt covenants and time to maturity determine
the cost of debt of a specific firm. Over time, the real cost of debt may change in response to random
shocks and changing capital market settings. The real interest rate of the firm if turns unfavorable
over time; firms have several options to correct the situation by readjusting capital structure as a part
of hedging strategy. Theoretical and logical arguments can be found in the finance literature in favor
of this supposition. The following studies have considered this important factor as determinant of
the capital structure decisions. It is hypothesized that in case of developing economies like Pakistan
where debt market is on infancy stage this factor would have significant impact on capital
restructuring decisions.
Sr. No Determinants of Capital Structure
Literary Evidences
8 Firm specific Interest Rate
Jalilvand, and Harris (1984)
Wald, (1999)
Ooi, (1999)
Deesomsak, Paudyal, and Pescetto, (2004)
Haas, and Peeters, (2006)
Conclusion: A negative relationship has found in literature between firm specific interest
rate and leverage.

55
H8: There is a negative relationship between capital structure and firm specific interest
rate.
2.7.1.9 Spontaneous Financing
Creditors and accruals have no substantial cost for the firm. Spontaneous financing as an
alternate source of financing, is advantageous for the firm. Not all firms can enjoy this free ride.
Firms operating in environment where bargain power of customers and bargain power of the
suppliers is comparatively low can enjoy this luxury. In connection with capital structure decisions
two competing arguments can be presented. First, firms having more spontaneous financing would
not depend heavily on the negotiated financing and will reduce the cost of capital, second firms
already having enough spontaneous finance would have already reached to the saturation point and
would go for negotiated financing. the following studies have considered the role of spontaneous
financing in capital structure decisions and found significant relationship between the two.
Sr. No Determinants of Capital Structure
Literary Evidences
9 Spontaneous financing Deesomsak, Paudyal and Pescetto, (2004)
Nivorozhkin, (2004)
Haas, and Peeters, (2006)
Conclusion: In literature negative relationship is found between spontaneous financing and
leverage ratios.
H9: There is a negative relationship between capital structure and spontaneous financing.

56
2.8.2 Determinants of Adjustment Speed
It is well documented in finance literature that optimal utilization of capital is highly
desirable. By constructing an optimal mix of debt and equity firms may reduce the financing cost
and lever the returns of residual owners of the firm resultantly the value of the firm. However,
optimality is not directly observable and static according to the dynamic tradeoff theorists. The firms
may deviate from their targets due to business dynamics and firm specific factors (Dudley, 2007).
Firms strive to revert to the optimality by making changes into the capital structure which is referred
to as capital structure adjustments. The adjustments are affected by various exogenous and
endogenous factors (Drobetz and Wanzenried, 2006). The exogenous variables include
macroeconomic factors which may make economically viable for firms to adjust their capital to the
target level or impede the adjustment by making adjustment a costlier tradeoff. In last few years
many research studies have been conducted to discover the impact of macroeconomic factors on the
adjustment speed of the firms. The literature suggests many factors which may affect adjustment
speed directly or indirectly. The factors consistently proved significant determinants of the
adjustment speed have been identified and incorporated in this study.
2.8.2.1 Inflation Rate
Volatile inflation affects the capital structure in several ways. Lending during high inflation
period reduces the real returns on debt investment thus makes debt investment less lucrative. Lenders
during high inflationary periods require higher interest rates to bring real returns to the risk
acceptable level (Gaud, et al. 2005). Resultantly borrowing during high inflation period increase the
cost of debt therefore makes capital restructuring through debt costlier. Thus firms prefer to stick
with their existing debt covenants. On this analogy negative relationship between adjustment speed
and volatile inflation is hypothesized. Frank and Goyal (2009) also indicated the role of expected

57
inflation in market leverage. Despite the fact that their methodology and research objectives were
different but one can easily infer the relationship between the inflation and the borrowing and lending
decisions.
Another theoretical notion is that inflationary trends do inflate nominal profits and market
values of equity ceterus paribas. However the existing debt is less sensitive to the inflation owing
to fix payments of interest and principal. Difference in sensitivity of debt and equity to inflation rate
takes the actual capital structure away from the optimal level. Kim and Wu (1988) reported in their
empirical research findings that during high inflation period the yield difference between corporate
debt securities and government debt securities is higher. Due to higher interest rate spread the
corporate debt also increase. This notion implies a positive relationship between volatile inflation
and adjustment speed. Moderate and consistent inflation is healthy for industry however the volatile
inflation develops state of economic instability.
A third view is that the relationship between capital structure and inflation is not clear in
absolute terms. Hochman and Palmon (1985) reported that the relationship between debt to asset
ratio and the inflation without controlling for prevailing taxes is not clear. The taxes mediate the
direction of the relationship between leverage and inflation. Santaella (2001) in a very basic study
of impact of inflation on leverage found no significant relationship between two variables. Thus the
relationship is not clear, however we hypothesize the relationship as under.
H10: There is a positive relationship between volatile inflation and capital structure adjustment
speed.

58
2.8.2.2 Gross Domestic Product Growth
GDP growth as a proxy for the economic conditions of the country plays an important role in shaping
financial policy of the firms. Levy and Hennessy (2007) gave a comprehensive description that why
capital structure choices vary in different economic conditions. They reported that in expansion firms
substitute debt with equity and in contraction period they tend to decrease the debt in their mix of
capital. Hackbarth, Miaoand and Morellec (2006) specified the role of macro-economic conditions
on the financial policy of the firms in their model. Korajczyk and Levy. (2003) hypothesized that
capital structure adjustment speed is a function of macro-economic conditions. They divided their
sample into two groups financially constraint companies and unconstraint companies and reported
that for financially unconstrained companies' target capital structure has inverse relationship with
the business cycle which they call counter cyclic. However for financially constraint companies the
relationship of target capital structure and business cycle is positive means pro cyclic. GDP growth
has been included as proxy for financing requirements of the firms. Higher GDP growth is
characterized by higher profits and industrial expansion. During economic growth firms expand their
capacities and invest in new projects. In economically good periods financial markets also perform
well and investors are motivated to invest. Firms in economically good periods have more
availability of funds compared to the bad economic conditions (Cook and Tang 2010). GDP growth
as a generally accepted measure of economic growth affects the financing choices of the firm. It is
hypothesized that the GDP growth has positive impact on the capital structure adjustment speed.
Inflation adjusted GDP growth is included as the inflation is also explanatory variable of the model.
Annual data of constant dollar GDP growth rate is imported from the MATADATA database of
United Nation's database.
H11: There is a positive relationship between GDP growth and capital structure adjustment speed.

59
2.8.2.3 Interest Rate
It is well document in the finance literature that interest rate volatility affects the term structure of
the debt securities (e.g., Cox, Ingersoll and Ross, 2005; Dieffenbach 1975; Richard, 1978). Interest
rate volatility affect the borrowing options of the firms in different various ways for instance it affect
the asset pricing, interest rate risk and cost of borrowing for the borrowers. Prevailing market interest
rate is included to capture the impact of cost of borrowing on the adjustment speed. Cost of
borrowing is an important factor in financial decisions and consequently the speed of adjustment.
During periods of high interest rates the cost of debt is higher thus makes debt a costlier choice.
During low interest rate periods the firms strive to swap their costlier debt with the cheaper one.
Therefore a negative relationship between interest rate and speed of adjustment is expected.
H12: There is a negative relationship between interest rate and capital structure adjustment speed.
2.8.2.4 Banking sector performance:
Debt market of Pakistan is not developed enough to cater the financing needs of the firms. Nishat,
(2012) attributed this inefficiency to the regulatory framework. Debt instruments are not very
popular in Pakistan; therefore firms have to heavily rely on the banking sector for their short term
and long term debt requirements (Arif, 2007). Banking sector performance is expected to have
positive impact on the adjustment speed of the capital structure. Well-functioning banking sector is
essential for the industrial development of any economy but for the developing economies where
bank performs very critical role as financial intermediary the role of banks is crucial (Haque, 1997).
Thus the banking sector performance has been included as explanatory variable and positive
relationship with adjustment speed is expected.
H13: there is a positive relationship between banking sector performance and capital structure
adjustment speed.

60
2.8.2.5 Deviations from the target capital structure:
Deviation from the target capital structure is a costlier variance and firms strive to revert to
the optimal level by making adjustments in the proportion of debt and equity. Drobetz, and
Wanzenried (2006) found that in the presence of adjustment cost firms may not fully revert to the
desired level of capital structure. The cost of adjustment impedes the adjustment speed. The
discrepancy between the target and actual capital structure is the problem which firms strive to solve
with the available means. This distance is the motivation behind restructuring of capital. Flannery
and Rangan (2006) applied partial adjustment model to observe how firms reconcile the gap between
target and actual capital structure in the presence of the difference between the two. Faulkender et
al (2008) also found that the deviation from the target level initialize the adjustment process. If the
firms have actual capital structure just equal to the desired level there is no reason to change it.
H14: There is a positive relationship between deviations from target capital structure and capital
structure adjustment speed.
2.8 THE RELATIONSHIP BETWEEN CAPITAL STRUCTURE AND FIRM'S
PERFORMANCE
Most of the existing Capital structure studies in Pakistan assess the relationship between
financial leverage and firms' performance in the framework of static determinants of capital structure
(see e.g., Shah, Hijazi and Javed, 2004; Hijazi and Tariq, 2006; Shah and Khan, 2007; Rafiq, 2008;
Ilyas, 2008; Ahmed, Ahmed and Ahmed, 2010; Ahmed and Wang, 2011; Afza and Hussain, 2011;
Memon, Bhutto and Abbas, 2012; Shaheen and Malik, 2012; Saleem, et. al., 2013; Ahmad and
Zaman, 2013). The existing literature about the relationship between capital structure and financial
performance in Pakistani context can be grouped into two streams. Few studies, in accordance with
61
the pecking order theory have found negative relationship between the capital structure and financial
performance (Raza and Wajid. 2013; Khan, 2012; Shah and Khan, 2007; Amjed 2007; Rafiq, Iqbal
and Atiq, 2008). However, some studies have also found positive relationship and attested the claims
of tradeoff theorists (see e.g. Sadeghian et al 2012; Memon, Bhutto and Abbas, 2012; Chaganti and
Damanpour, 1991). The reason of this dichotomy can be attributed the methodological differences
and models. All the aforementioned studies assumed a direct relationship between the leverage ratio
and profitability of the firm. Other factors mediate the relationship and make it an intricate decision.
Research about impact of high or low leverage on financial performance without considering the
firm specific and environmental factors may have little or no practical value.
It is an established view that efficient utilization of capital is imperative for the financial
efficiency and effectiveness of the firm. Financial policy of the firm does affect the performance of
the firm in various ways (Margaritis, and Psillaki, 2007). Capital structure efficiency is not directly
observable from the capital structure ratios. The capital structure in absolute terms does not indicate
efficiency. Thus the impact of capital structure or financial performance may indicate the nature of
relationship but may have methodological questions.
The proponents of tradeoff theory have consensus that firms have target level of capital
structure and firms actively pursue that target level (Myers, 1984). Firms target to what? The answer
is optimal capital structure which is mix of debt and equity where the cost of capital is low. The
adjustment speed allows firms to bring their actual capital structure closer to the target level which
is optimal for that particular firm. The positive relationship between adjustment speed and firms’
performance is consistent with dynamic tradeoff model. Firms closer to their target (Optimal) capital
structure are considered financially efficient. By deploying debt, which is cheaper source of capital
compared to equity, firms can carve out bigger slice of profit for the equity holders. The dynamic

62
tradeoff theory appears to have more implications for volatile economies. In accordance with the
dynamic tradeoff theory it is hypothesized a positive relationship between the adjustment speed and
firms performance.
H15: There is positive relationship between the capital structure adjustment speed and financial
performance of the firm.
2.9 COST AND AVAILABILITY OF CAPITAL: A GLOBAL PERSPECTIVE
On the analogy of law of supply, the cost of capital to certain extent depends on availability
of the capital. The cost of the capital to the firms operating in illiquid and segmented capital markets
cannot be compared with those operating in the liquid and non-segmented capital markets. Due to
the difference in the availability of capital and difference in financing options, technically called
depth and width of capital markets, the firms’ capital structure and the capital structure decisions
would have a significant difference as reported by Booth et al.( 2002). The domestic firms operating
in illiquid and segmented capital markets may find it difficult or/and costly to adjust the proportion
of debt or equity in their capital mix. The optimal or appropriate capital structure at one time may
not be optimal at any other time due to many changes in the parameters of the firms on which the
decision was initially made (Mukherjee and Wang, 2013). With this handicap the firms may not be
able to adjust their capital according to the changing market conditions unless the incentive for
adjustment greater than the cost of adjustment. Generalizing the capital structure theories to the
developing economies like Pakistan without considering the fundamental differences in the nature
and character of the capital markets would have little value in understanding the theory of capital
structure. The context of the theory is one thing and the theory itself is another thing for complete
understanding both elements should be understood completely. Theory without context is not helpful
for understanding the underlying claim of the theorist. It is pertinent to develop a context and

63
reference point for the issue under debate. This section will serve as context for capital structure
theory and also to this research.
The only constant in this world is change. Many of the theories of social science which were
advanced in the twentieth century have been obsoleted due to the rapid developments in the
communication and information technologies. The developments in the technology and more
specifically the information and communication technology have brought revolutionary changes in
every field of life. The revolution in the field of Information and Communication Technologies has
also affected the way corporations finance their long term investments and growth. The highest
degree of global integration of capital markets as witnessed in the last few decades, which is clearly
a result of the growing technologies. This global integration has enhanced the access of the firms to
cheaper sources of funding and better availability. The global integration has also affected the
liquidity of the small domestic capital markets as well as the financial environment. With this
advancement domestic firms have more liberty and ease in capital restructuring and capital
improvements if they have formulated and implemented proper strategy. This global integration of
capital markets has also provided an opportunity to the firm access new avenues for financing which
were previously not available. Due to globalization the financial environment has also changed. With
this emerging environment and financial setups the nature of the capital structure question has
changed. The flexibility in the restructuring of the capital is the one of the major determinants of the
organizational success in the short run as well as in the long run.
2.9.1 The duality of debt finance
The conventional wisdom of capital structure signifies that in the presence of the tax
advantage of debt, the firm can increase its value by employing a debt for financial assets and growth
opportunities. The tax benefit of debt is an established factor to employ debt in the capital structure.

64
In many countries, including Pakistan interest is a tax deductible expense. The tax deductibility of
interest expense reduces the taxable income of the levered firms, which results in lower taxes and
higher cash flows compared to unlevered firms. The return on equity of the levered firms is higher
under certain conditions which lead to higher values of the firm. The other major advantage of debt
financing is a control mechanism. Debt financing requires repayment of interest and principles which
reduces the room for the management to make investment decisions in their personal interests (e.g.,
Jensen and Meckling, 1976; He, 2011; Hart and Zingales, 2011; Degryse, Goeij and Kappert, 2012).
In the presence of the debt management is compelled to generate positive cash flows to meet their
financial obligations. Thus, debt reduces the agency problem which exists between shareholders and
management.
The cost of financial distress which is also referred as cost of actual or expected bankruptcy
is attributed to the debt. The creditors can demand liquidation if the firm is unable to meet its
financial obligations. The probability of bankruptcy increases with the increase level of debt,
especially for the firms which are operating in a risky environment (Molina, and Preve, 2012). Even
if the actual bankruptcy does not happen the firm may lose value during the period of financial
distress which is called indirect cost of financial distress. Since the cost of debt is a fixed cost it
increases the financial leverage ratio, which is an indicator of financial risk and the cost of debt
increase proportionately (Elkamhi, Ericsson, and Parsons, 2012). To compensate the financial risk
creditors demand higher returns. With the increased level of debt in capital structure the cost of debt
increases.
Another perspective of agency problem is the use of borrowed funds by management in risky
activities to generate more returns for the shareholders contrary to the debt covenants. The demand
of creditors for strict compliance of the debt covenants may also reduce the effectiveness of the

65
financial decisions (e.g., Mauer, and Sarkar, 2005; Miao, 2005; Berger, and Di Patti, 2006;).
Therefore, it is considered that the actual agency relationship exists between the lenders and the
management. The debt covenants reduce the financial flexibility of the firms. Firms operating in
uncertain environment may not able to forecast their future financial needs. To meet the
contemporary financial needs management has to pay the higher cost of debt. Information
asymmetry is another significant cost of debt; management may not disclose the business
information to the creditors for business reasons. This asymmetry of information may lead to higher
cost of debt (e.g., Gaud, Hoesli, and Bender, 2005; Bharath, Pasquariello and Wu, 2009; Halov and
Heider, 2011). Creditors need security for their funds in form of collaterals. Lack of collateral assets
may increase the cost of debt. These indirect costs make debt financing costly under certain set of
conditions.
Due to the fact, tax advantage of debt increases the cash flow, which results in increased
value of the firm. The Tax advantage of debt after specific level decreases the marginal benefit and
gradually turned to negative due to the increased level of risk. The cost of excessive debt in the
capital structure swallows the tax advantage (Korteweg, 2010). The breakeven point of the cost and
benefit of debt is called optimal capital structure. If it would be possible to objectively measure these
costs and benefits, the issue would be easy to resolve. At present the impact of debt on the business
firms is beyond the scope of any model. Therefore the optimal level of debt is still an abstract and
has not got the shape of understandable and testable theory (e.g., Blouin, Core, and Guay, 2010;
Graham and Tucker, 2006; Binsbergen et.al, 2010). The whole debate on capital structure revolves
around this hypothetical optimality which is still unclear.

66
2.9.2 Capital structure puzzle
The theorists tried to calibrate the complete set of common parameters for this complex and
highly significant agenda of finance research. Beside all the sincere endeavors of theorist the capital
structure issue is still unresolved. No any theory fully capable to provide a comprehensive
explanation of capital structure and empirical model which can provide uniform statistical evidences.
The theoretical explanations of financing decisions appear very appealing and convincing, but
empirical evidences are more often contradictory and confusing. Some basic reasons of this
dichotomy are inferred after extensive literature review. One of the reasons for this disparity is the
implied assumption of the theorist that the financial system is fully capable to cater the financing
needs of the firms and firms are free to make adjustments in capital structure on the basis of preferred
sources of financing (Barclay, and Smith, 2005). This is also a debatable issue that how these
preferences are shaped and reshaped but primarily theorists assume that firms have no environmental
bounding in financial decisions. Agency theory, however, to some extent considers this binding, but
from some other perspective. Another important reason of discrepancy between theory and its
empirical results is the fact that capital structure decision is not static (Ju et.al, 2005). To give one
point optimal level of leverage is practically not possible as the optimality is subject to many
cognitive and personality factors of the decision maker and environmental factors (Antonczyk and
Salzmann, 2014). This is pertinent to mention here that psychological and cognitive factors become
more effective with the level of ownership concentration and control. The strong control provides
room for autocratic decisions as argued by Jensen and Meckling (1976).
2.9.3 Towards the solution of capital structure puzzle
Under the aforementioned form of discussion, it is inferred that capital structure is the result
of financing decisions consciously made by management to optimize the leverage which is consistent

67
with the contemporary financial system. The intended optimal capital structure which is also referred
as target capital structure is strived to achieve. The target or desired capital structure is unique to
every firm and at an aggregate level to every industry. Firm specific factors influenced by the
environment can help to estimate the target capital structure. Firms strive to achieve optimal level of
capital structure by balancing the cost and benefit of debt financing keeping in view the financial
environment. The outcome of capital structure is the weighted average cost of capital, which in turn
becomes the basic parameter for investment decisions. A proper mix of debt and equity reduces the
cost of doing business and helps to achieve the ultimate objective of business firm i.e. maximization
of owners’ wealth. We assume that decision makers are better aware of the unique optimality which
changes over time and optimality is firm and time variant phenomenon. Optimality is shaped and
reshaped by the changes in the financial environment and firm specific factors, for instance the
specific cost of debt for a particular firm can affect the optimality. Finance managers cannot be
considered ignorant of this fact, the results of many studies indicate that the managers targets optimal
debt equity ratio see for example Graham and Harvey (2001) and Brounan et al (2004). They strive
to achieve this optimal level of financial mix by revising their capital structure on the basis of
screening and analysis of firm specific and environmental factors. The speed of achieving desired
capital structure, which is of course optimal for the firm, depends on the firm specific and
environmental factors. This study imperially explores the dynamic adjustments towards capital
structure and reports the results on the basis of firm level and industry level data.
Existing literature on the capital structure focuses on the parameters for the capital structure
decisions by using different methodologies and the theoretical perspectives. This study empirically
investigates the factors determining the target (desired) capital structure. The determinants of capital
structure are portable to every economy depending on the socioeconomic environment of that

68
particular economy. Through the analysis of large pooled data set most reliable and consistent firm
specific factors of target capital structure choices have been found. The adjustment speed towards
target capital structure been observed and linked to the macroeconomic indicators and firm’s
attributes.
The organizational structure of the business firms is an important reference point in financial
structure decisions (Michaelas, Chittenden and Poutziouris, 1999). The parameters and standards for
financial structure decisions in public companies, private companies, single member companies,
family controlled business units, partnerships and sole proprietorships cannot be considered the same
(Hoshi, Kashyap, and Scharfstein, 1991). Different organizational structures give different degrees
of control to the parties affected by such decisions. Organizations like the partnership and the sole
proprietorship higher degree of the control rests with the owners who are residual beneficiaries
(Berger and Udell, 2002). The agency problem is less severe in such organizations and thus financial
structure decisions are easy to make and execute (Ang, Cole, and Lin, 2000). In the business
organizations where the financial decisions are made by the agent (management) on behalf of the
principle (ownership) financial decisions become more complex and challenging. Most of the studies
on capital structure have been done in the non-financial corporate sector. One of the reasons to focus
this segment is the fact that agency problem is much severe in case of corporations than any other
form of business organizations. In presence of agency issue the financial structure decisions are more
complex and critical because decision makers have not only to balance the capital structure, but also
have to balance the personal interests with the financial performance of the firm.
69
CHAPTER NO.4
METHODOLOGY
This chapter presents the research philosophy, research strategy, nature of data, sampling
method, techniques and procedures. Positivism and interpretivism are the two broad philosophical
research paradigms in the business and economics research. However, pragmatism and realism have
also emerged as preferred research philosophies in various business and economics studies. The
choice of research philosophy is mainly determined by the research objectives and practical
implications of the study. Even, the quantitative studies in economics and finance have significant
philosophical difference depending on the data and methods applied in research. The selection of
any particular research philosophy has been subject of considerable debate for many decades.
Therefore it is difficult to justify the selection of research philosophy in precise manners. After the
brief introduction of various research doctrines the selection of the research philosophy and
epistemology has been justified in this chapter.
4.1 RESEARCH PHILOSOPHY
The four major philosophical research doctrines are; (1) Positivism (2) interpretivism (3) pragmatism
and (4) realism. Positivist believe that all knowledge is objectively testable by observation and facts
eternally exist. On the other hand the interpretivism also called antipositivism adheres the belief that
social realm is not necessarily objective rather there are subjectivities stemming from cognitive
abilities of the researcher. Positivism and antipositivism paradigms are two contrary doctrines about
the creation and acquisition of knowledge. However, pragmatism and realism are moderate views
towards the nature and source of knowledge. Pragmatists hold the view that only the concepts

70
supported by human actions are acceptable and there is no any universal way of describing the facts
rather there are multiple ways to describe the fact. Similar to positivism, realism as a research
philosophy base on the principle that reality is independent to the researcher.
Literature suggests that there are certain principles to guide the researcher about the philosophical
division of the research. If the scholar is independent to the observed phenomenon, human interests
does not affect the research findings, research used deductive approach, the concepts can be
quantified, units of analysis could be simplified to the generally observable level, the results could
be generalized through statistical probability and sample consists of large numbers randomly
selected. According to the aforementioned guideline this study merits the positivism. This study is
based on the quantifiable observations which are empirically analyzed and tested. The conclusions
drawn from the empirical analysis are objective therefore the personal judgment of the scholar does
not affect the research findings. This study adheres to the philosophy of positivism. Keeping in view
the methods and objectives of this research we classify this study as deductive research. A deductive
approach has been applied as the testable hypothesis are developed in accordance to the capitals
structure theory.
4.2 DATA AND SAMPLING
Dataset consists of financial data of non-financial companies listed at Karachi Stock
Exchange during 1999 to 2011. During the period of study Economy of Pakistan has passed through
various economic and political eras. The period offers a great opportunity to study corporate
financial policy in highly volatile economic conditions. Financial data was extracted from "Balance
Sheet Analysis" of non-financial companies published by SBP (State Bank of Pakistan). SBP
publishes a comprehensive analysis of annual audited financial statements of the public listed
companies every year. In Pakistan, Balance Sheet Analysis is considered trusted and convenient

71
source of data of public listed non-financial companies. For this publication SBP uses the KSE's
industrial classification except small economic groups Tobacco, Jute, Vanaspati and Allied and
others which are clustered as miscellaneous. The same classification has been adopted for analysis
in this research.
Few companies were not consistently listed throughout the thirteen year period were
excluded from the data set. The total companies included in BSA by the end of 2011 were 399, out
of these 312 companies qualified as a sample of this study. Total public listed companies by end of
year 2011 were 616 and selected companies are approximately 50% of the total public listed
companies which is good representation of non-financial sector. The data was sorted annually and
industry wide and analysis were conducted accordingly. The data of few companies were missing in
some years. The data of such companies were included for estimation of determinants of target
capital structure. Estimation of adjustment speed is only done with data of thirteen years. There were
about 4000 firm/year observations. Some extreme values in a particular year may appear because of
unusual or extra ordinary reasons; inclusion of such values may distort the overall results. For
statistical accuracy and robustness of the results certain adjustments in the sample were made. To
exclude outliers from the data various methodologies could be applied. One frequently used
technique to remove data outliers is Winsorization. This approach restricts the observed values to
the specified limits of the distribution tails. The values beyond that limit are converted to the value
of the value at specified limit that can be 5% or 10%. The other approach is to exclude the extreme
observed values to the acceptable limit which is normally two standard deviations plus-minus. The
former approach is used when the number of observation is limited and researcher doesn't want to
decrease the observation. When number of observation are more the second approach yields robust
results. For this study we have used two times standard deviation plus minus to the mean value

72
approach. This technique excludes certain values but do not affect the robustness of the results. The
values under the later technique are real values and thus true representatives. Thus we used two
standard deviation from the mean value method because of its advantage over the Winsorization.

73
Table 4.1: Sector wise list of companies in BSA and selected sample of the study
Source: Balance sheet analysis of non-financial companies from year 1999 to 2011, published by SBP *From 2010 to onward Sugar sector has been merged with food sector.
Economic Groups 1999 2000 2001 2002 2003 2004 2005 2006 2007 2008 2009
2010
2011 Sample
Cotton and Other Textiles 239 232 225 208 199 189 182 181 180 182 167
164
155 150
Chemicals 39 39 38 36 38 36 34 34 34 35 36 33
35 29
Engineering 47 48 47 46 44 42 41 41 41 40 38 36
32 30
Sugar and Allied 38 38 37 37 37 35 35 35 36 36 36
54*
54* 30
Paper and Board 14 14 14 14 13 12 12 10 10 10 9 9
8 8
Cement 21 21 22 22 22 22 22 22 20 21 21 22
22 14
Fuel and Energy 28 27 26 24 24 25 28 28 27 27 27 25
25 22
Transport 6 7 7 7 7 13 15 12 12 12 13 13
11 5
Miscellaneous 98 94 90 87 79 77 74 73 77 74 67 65
67 24
Total: 530 520 506 481 463 451 443 436 437 437 414 411
399 312
74
Financial sector include companies engaged in banking and non-banking financial business
like insurance, mutual funds, investment banking, specialized financial institutions etc. Parallel to
other capital structure studies, it is presumed that the parameters of capital structure decisions in
financial sectors are significantly different than non-financial sector (Ittner et.al, 2003; Michaelas,
Chittenden and Poutziouris, 1999). Financial sector is more regulated than non-financial sector
therefore capital structure decisions are affected by exogenous factors. It is well documented in
capital structure studies that financial decisions of financial firms are more sensitive to the country
specific regulations and global practices (see Amelet et. al, 2004; Pasiouras,Tanna and Zopounidis,
2009: Berge, 2000). Therefore, capital structure of the financial firms and non-financial firms are
not directly comparable in terms of objectivity and operations. To avoid inconsistency and increase
inter industry comparability financial sector has been excluded from the scope of study. Exclusion
of financial sector do not necessarily mean that the results of this study cannot be generalized to the
financial sector in principal. The results may be generalized to the financial sector and public sector
organizations with structural adjustments.
Financially distressed firms have been excluded from the scope of the study. The equity
turned negative when accumulated losses swallow net worth of the firms. It is conventional wisdom
that negative equity firms suffer financial distress and lose financial liberty in making decisions. The
decisions of financially distressed firms are influenced by many factors other than firm specific
economic factors (Sudarsanam and Lai, 2001). Return on Equity, for negative equity firms, is
meaningless and not directly comparable with normal firms. Therefore firms having negative equity
and persistently negative returns were considered outlier and excluded from the dataset for reliable
and robust results.

75
Industrial classification is done with different schemas depending on need and purpose of
classification. Different constituencies classify firms in different ways; most widely used
classification is Standard Industrial Classification (SIC). SIC codes are globally recognized and used
besides that many countries use their own classification. In Pakistan multiple methods for
classification of the industries are used. However, for this study State Bank of Pakistan’s industrial
classification has been used to group the dataset into industry.
Sample of this study is all non-financial companies which remain listed during the study period
and qualify the following criteria.
1- Non-Financial Firm listed on the Karachi Stock Exchange.
2- Firm which remained listed for the period of 1999 to 2011
3- Firms which have included in BSA over the period of study
Firm level data was taken from the BSA, which contains annual accounting data of the audited
financial statements of non-financial companies listed on Karachi Stock Exchange. Accounting data
has its own advantages and disadvantages, significant number of the studies of capital structure have
used accounting data because of the fact that financial decisions are made on the basis of accounting
information (Hopwood, 1972). This study aims to elucidate the implication of capital structure in
some designated point in time, retrospectively. Market values are forward looking and may have the
bias of future expectations therefore the book values are intentionally used to avoid any such biasness
(Beaver and Ryan, 2000; Sloan, 1996; Kothari and Shanken, 1997). One observation consists of all
variables of study for one year of a specific company. All the variables are ratio scale variables.
Macroeconomic data is taken from the World Bank MATADATA database of countries
macroeconomic data. The database is maintained and updated by World Bank. The data is exported
from the site in M.S Excel format. More than 400 variables are included in the database and various

76
measures have been taken for individual variables. Out of these measures more consistent measures
have been selected on the basis of literature review and variable diagnostic methods.

77
4.1 GRAPHICAL PRESENTATION OF THE MODEL
Profitability (t-1)
Collateral Value
of Assets (t-1)
Firm Specific
Interest Rate (t-
Growth
Opportunities(t-1)
Non-Debt Tax
Shield (t-1)
Spontaneous
finance (t-1)
Liquidity(t-1)
Size of Firm (t-
1)
Actual Capital
structure at
time "t"
E
s
t
i
m
a
t
i
o
n
Target Capital
structure
Actual Capital
structure
Auto Regressive
model
Speed of Adjustment
Banking Sector
performance
Distance between
Target and Actual
GDP Growth Rate
Market
Capitalization
Inflation Rate
Interest Rate
Determinants of
Speed
Financial
performance of
Firms
GMM Regression for
pooled data to estimate
Coefficients of
parameters

78
4.4 ESTIMATION SCHEME
The considered model in this study is a multi-tier, holistic model of financial policy of the
Pakistani firms. The study aims to investigate the dynamics of target capital structures. Target capital
structure is not directly observable therefore parameter coefficients are estimated for the target
capital structure by Pool Data Regression method as a first tier. It is assumed that all variances are
not constant over time and across firms. Thus random effect model was used to estimate the
parameter coefficients. The estimated coefficients were used to estimate the target capital structure
of the individual firm i for time t. As a second tier, by applying autoregressive model the speed of
adjustment is estimated for every period separately by applying cross sectional data of that particular
time period. An overall corporate level annual adjustment speed as well industry level annual
adjustment speed is estimated by running separate regression equations. At the third level the
determinants of adjustment speed are estimated by balance panel data technique. The annual
adjustment speed of five industrial group forms a balanced panel of independent variable and various
macroeconomic factors and industry specific factors as independent variable. The determinants are
estimated through fix effect model; industry fix effect is estimated and reported as an evidence of
industries' specific factors affecting adjustment speed of the firms. The last tier is for impact of
adjustment speed on the financial performance of the firm. The debate is concluded with the
discussion of effectiveness of adjustment speed. For various tiers of the study various estimation
techniques and econometric model are specified based on the underlying objectives and nature of
the data. The models are discussed separately with due justification in subsequent sections.

79
4.1.1 Variables Factors affecting target capital structure have been selected after extensive literature review.
Only those firm specific factors which have proved most powerful determinates of the capital
structure by the existing literature are considered. The variables used in different research studies
other than the set of variables given below were not included on the basis of their inherited statistical
limitations. For instance age of firm, income volatility and ownership concentration are reported
explanatory variable of the capital structure. Inclusion of these variables at face value without
adjusting for autocorrelation and hetroscedasticity may affect the robustness of results and
estimations. Since, the study already includes time proved representative set of regressors the
exclusion of such variables do not affect the results seriously.
Table 4.2: List of Variables Variable Symbol Measurement Scheme
1 Size SIZE Natural Log of Total Assets
2 Profitability ROA Net profit After taxes over Total Assets
3 Collateral value of Assets CVA Net fixed assets over total assets
4 Firm specific Interest Rate FSIR Financial charges over sum of fixed liabilities
and negotiated finance
5 Growth opportunities GRTH Percentage change in sales from previous year
6 Non-debt tax shield NDTS Non-cash expenses over sum of net fixed assets
7 Trade credits SPTF Spontaneous finance over total liabilities
8 Short term solvency STS Current Assets over current liabilities
9 Long term debt to assets LDA Long term debt over total assets
10 Total debt to Assets TDA Total debt over total assets
11 Contracted debt to assets CDA Contractual debt over total assets
4.1.2 Statistical Model
In various econometric models the impact of predictor on the predictand is not simultaneous,
especially when the predictand is not directly observable. The explanatory variable in such cases
80
have more explanatory power with period-lags. With lagged explanatory variables the desired or
unobservable explained variable is estimated. Dynamic econometric models like autoregressive and
distributed-lag models are applied in such cases. Target capital structure is not directly observable,
it is the expected value based on the past experiences. Thus following Flannery and Rangan (2004)
and Huang and Ritter (2009) one period lagged firm specific time variant factors have been regressed
with the capital structure to estimate the parameters of target capital structure. The justification for
use of one period lagged determinant is the assumption that Finance Manger is well aware of the
determinants at the time of making capital restructuring decisions. Second, use of one period lagged
variable can reduce the problem of endoginity, if exists. Third normally finance goals like capital
structure and earnings are budgeted for one accounting period.
Following Drobetz and Wanzenried (2007), Hovakimian (2011), Oztekin and Flannery
(2012), the following model to estimate the target capital structure is considered. Let the target
capital structure “���∗ ” of a particular firm at time t be a linear function of firm-specific factors
from X1 to Xn. which were previously tested as determinates in cross sectional studies.
Mathematically the model can be expressed as follows:
���∗ = �(��, ��, �� … … … . ��) (1)
���∗ represents here the target apital structure as a function of various time and firm specific
factors. In absence of adjustment cost, information asymmetries and transactions costs the observed
capital structure ���,� should be just equal to target capital structure i.e ���,� = ��,�(����,�∗ . If the
adjustment is costly the firm may partly adjust to the dynamic target. The model implies that the
target capital structure may vary over time and across firm. The data consists of a larger pool of
approximately 300 cross section, belonging to five different economic sectors, observations of
individual firms over 13 years period. It cannot be presumed in pooled data that coefficients are

81
constant over time and across firms. Thus OLS do not yield robust results as the basic assumption
of OLS is the constant coefficients and singular residual error. Fix Effect Model are efficient for
small pool data where number of cross sections and periods are less. In case of large pool, larger
numbers of dummy variables are needed to incorporate to capture the fix effect, which mostly result
biased results due to notorious dummy trap. Therefore Error Component Model (ECM) is used for
coefficient estimation.
����,�∗ = �� + ��,���,�,� + ��,� + (1-A)
Where ����,�∗ is the target capital structure which is assumed equal to actual capital structure, if there
is no adjustment cost, asymmetric information and transaction cost; �� is constant; ��,� are “j”
number of capital structure determinant parameters of firm i; ��,�,� are j number of firm specific
factors of firm “i” at time “t” and ��,� is the residual error.
Alternatively
����,�∗ = �� + ���1�,� + ���2�,� + ���3�,� … … … + �����,� + ɯ�,� (1-B)
Where:
ɯ�,�=�� + ��,�
Where, “�1�,�“represents the firm specific time variant vector, ��mean constant, �� through
�� are coefficients of parameters and ��,� is the error term. The subscript i is the ith cross sectional
observation and t represents the time period. The parameters were estimated by using equation 1-C.
Generalized Method of Moments (GMM) estimation procedures have been applied for statistical
analysis due to some advantages over OLS. GMM is normally applied in the statistical models
where the parameters are infinite dimensional. Literature suggests that semi parametric model yields
robust results in case of unknown shape of distribution function. GMM is highly recommended when
the number of cross sections are more than the number of time series observations. The literature

82
suggest that GMM is capable to resolve the heterogeneity problem, endogeneity problem and
omitted variable bias (Caselli et al., 1996). Estimation of target capital structure by specifying the
large number of moment conditions can result the best estimates by using semi parametric model if
specified correctly. The literature also suggests that GMM estimators are more consistent, efficient
and asymptotically normal among the available linear and non-linear estimators which don’t use
additional information other than the moment conditions specified in the data. With the suitable data
and number of observations the GMM estimators provide the best estimate of the true parameters.
GMM overcome the shortcomings of ordinary least square methods in multiple ways. It allows
finding closer to true model parameters by processing the sample conditions movement only with
maximum possible accuracy.
����,�∗ = �� + �������,��� + ������,��� + ������,��� + �������,��� + �������,��� +
�������,��� + �������,��� + ������,���+ɯ�,� (1-C)
Where:
����,�∗ Target Capital Structure ROA Profitability
�� Mean constant coefficient CVA Collateral Value of Assets
��to �� Slop coefficient FSIR Firm Specific Interest Rate
I ith cross section observation GRTH Growth Opportunities
T t period observation NDTS Non-debt Tax Shield
ɯ�,� Composite Error Term SPTF Spontaneous Finance
SIZE Size of firm
Variables are instrumetnalized by taking one period lagged values of explanatory variables.
By regressing one period lagged variable with the capital structure of the firm, parameters coefficient
were estimated. The prime objective of the study is to estimate adjustment speed and its implication.
Therefore, the nature of relationship between dependent and independent variables has not been
specified in this section. However the magnitude and significance of the relationship is area of prime

83
concern. For estimation of parameter coefficients pool of time and firm variant vectors of 312 firms
over 13 years period was used. Pooled regression has various econometric applications broadly fall
into two main categories Least Square Dummy Variable (LSDV) regression and Error Component
Model (ECM). LSDV is recommended when the number of cross sections or time series is less
otherwise one have to compromise on the degree of freedom. In case of large sample with large
number of cross sections and time series researcher can pray of dummy variable trap. Therefore, in
case large sample with more cross sections and time series in the data ECM or also called Random
Effect Model is preferred due to various statistical reasons. In case of fix effect model due to the
existence of dummy regressors the chances of multicollinearity is higher. In OLS residual error is
assumed to be normal and independent of regressors µit ~ N(0,σ2), this assumption is rarely met by
Dummy Variables. Therefore Error Component Model is used to estimate the unbiased coefficients
of Target Capital structure parameters. Hausman test is used to determine the estimating efficiency
of the model.
4.5 ESTIMATION OF ADJUSTMENT SPEED:
Jalivand and Harris (1984) were among the pioneers to apply dynamic models to study the
financial policy of the firms. Banerjee, Hashmati and Wihlborg (2000) developed a dynamic
adjustment model to estimate the adjustment speed towards the dynamic target. Their model got
considerable attention and lot of studies have been conducted which applied their partial adjustment
model (See e.g., Lööf, 2004; Flannery and Rangan, 2006; Drobetz and Wanzenried, 2006; Huang
and Ritter, 2009; Cook and Tang, 2010; Hovakimian and Li, 2011; Öztekin and Flannery, 2012)
Partial adjustment model is used to estimate the adjustment speed of capital structure towards the
target level. Econometric literature suggest that distributed-lag model and autoregressive models,
which are often referred to as dynamic models, best capture the impact of stimulus on the response

84
when the dependence is not simultaneous. Various considerable options were available including Ad
Hoc Estimation of Distributed-Lag Models, KOYCK Approach to Distributed-Lag Models with
Adaptive Expectations and Rational Expectation, and Partial Adjustments. Partial adjustment model
has vast application in finance literature especially for CAPM and capital structure adjustment
hypothesis. Partial adjustment model On the basis of peculiar merits Partial Adjustment Model is
applied for estimation of Adjustment speed. The Desired Capital structure which is referred to as
target capital structure is not directly observable. Therefore it is estimated through estimated
coefficients of target capital structure in section 4.4.
In the capital structure adjustment speed models it is assumed that firm’s target capital
structure is just equal to actual capital structure in absence of asymmetric information, adjustment
cost and transaction cost. Thus, without friction, the actual capital structure is assumed to be equal
to the target capital structure. In normal discourse, the company management strives to achieve that
level by making dynamic adjustments in the existing capital structure. All the firms may not succeed
to adjust their capital as desired due to the cost of capital and limitation from the financial system.
Adjustment speed may vary across the firms and industry as a whole. The adjustment speed is
observed by the following equation.
���,��� − ���,� = ��,�(����,�∗ − ���,�) (2)
Where: ���,���is the observed capital structure of firm i at time t+1,; ���,�is the observed
capital structure of firm i at time t,; ��,�presents the annual adjustment speed if its value is 1 it means
100% adjustment if the value is 0 it means zero adjustment in one particular year. ����,�∗ is the fitted
value of capital structure of firm i at time t. The extant literature show that both single step and two
step approaches are used by scholars to estimate the adjustment speed. In two steps the target capital

85
structure is estimated in first place and the speed of adjustment in second step. Some studies have
used single step to estimate the adjustment speed.
With mathematical transformation in the above equation we come up with the following
equation. This form provides better understanding and ease of interpretation.
���,��� = ���,� + ��,�(����,�∗ − ���,�) + ��,� (2-B)
The value of ��,�is always between “0” to “1”. Zero implies that there is no adjustment in
the capital structure towards target and 1 means that 100% adjustment. Hundred percent adjustment
is not possible when there are frictions in the market. Therefore there is always a gap between actual
and target capital structure. By replacing the ����,�∗ with the left hand side of equation 1-A, we get
the equation 2-C:
���,��� = ���,� + ��,�(�� + ��,���,�,� − ���,�) + ��,� (2-C)
Alternatively we can write equation 2-C:
���,��� = ����,� + �1 − ��,�����,� + ��,���,���,�,� + ��,� (2-D)
Where;��,�is adjustment speed measured as parameter for the direction and magnitude of adjustment
in capital structure during a specific period of time and of a particular industry. ��,�,� are the
determinants of the target capital structure thus the slop parameters of target capital structure
equation represents the short term reaction to the adjustment speed and the constant in target capital
structure represents the long run reaction.
From equation 2-D we can draw the following parameter estimates:
(1) ��,���,� presents the short-run reaction of capital structure to a unit change in the determinates of
target capital structure.
(2) �� represents the long run reaction and

86
(3) If we divide the coefficient ��,���,� with one minus the estimate of (1- �) we can also get the
estimate of ��
4.6 DETERMINANTS OF ADJUSTMENT SPEED
The adjustment speed is a function of set of variables affecting the adjustment process. Firm
specific and macro-economic variables have been regressed with the adjustment speed estimated
from the equation 2-B. The estimated speed of adjustment was estimated industry wise and for every
year. The yearly values of the dependent and independent variables used in the following equation.
And the parameters are estimated by regressing firms specific and macroeconomic factors with the
annual adjustment speed of every sector.
��,� = Z(�,� + �,� + �,� + �,� + �,�) (3)
The functional form of equation with specified variables is as follows by which determinants of
adjustment speed are estimated.
��,� = �� + �������,� + �������,� + �������,� + �������,�+�������,� + �������,�+εi,t
(3-A)
Where:
��,� Capital Structure Adjustment speed of an Industrial sector i at time t �� Is constant ��to�� Coefficients of independent variables BSPR Banking Sector performance measured as reciprocal of non-performing loans. DIST Absolute distance between target and actual capital structure at time t GDPG Gross Domestic Product growth rate MCAP Market Capitalization as a ratio of GDP INFL Inflation rate INTR Interest rate
Annual adjustment speed is estimated by cross section of industrial sector separately. For a
single sector there are 12 yearly adjustment speed observations and total five sectors hence, a
balanced panel of sixty observations. Macro-economic sector data of last thirteen years along with

87
the firm specific factor has regressed with the annual adjustment speed to estimate the determinants
of the adjustment speed.
4.7 IMPACT OF ADJUSTMENT SPEED ON FINANCIAL PERFORMANCE:
It is theorized that the companies who are able to adjust their capital structure to their target
level have better financial performance as compared to the companies having low adjustment speed.
Equation 4 captures the impact of adjustment speed on the financial performance of the firm.
��,� = �� + ����,� + �������,� + �������,� + �������,���.� (4)
Where ��,� is the financial performance of the industry i at time t and ��,� is the adjustment
speed of the firms in a particular industry, ���� is average size of the firms in the industry, GRTH
is the average growth of a particular industrial sector and SPTF is the average Spontaneous Finance
of that particular industry. A positive relationship of dependent and independent variable was
expected. Various measures of financial performance have been used by different scholars including
Return on Assets, Return of Capital Employed, Return on Investment, Return on Equity and DuePont
formula. All the aforementioned measures have their peculiar implications. This study is a pursuit
to investigate the dynamics of capital structure from firm's perspective. Since the residual
stakeholders are the owners, firms strive to maximize the return on equity by various ways. Optimal
mix of debt and equity is one of the deliberate endeavors to maximize shareholder's wealth.
Therefore firm's performance for this study is measured as the Return on Equity.
ROE has been regressed with the adjustment speed of the firms in a particular industry and
it would be find out how adjustment speed affects the ROE.

88
CHAPTER NO. 5
RESULTS AND DISCUSSIONS
This chapter presents the empirical results. The chapter is organized according to the model
presented in the previous chapter. The research findings are discussed in light of supported theories
and underlying research objectives. This chapter also presents the brief account of the data used in
the empirical analysis.
5.1 AGGREGATE DESCRIPTIVE STATISTICS:
The summary statistics indicates that over the period of thirteen years from 1999 to 2011,
non-financial corporate sector of Pakistan has witnessed average 10.66% growth rate per annum.
Growth is measured as percentage change in sales revenue from previous year to current year by
chain base method. However, the aggregate variation of growth rate as indicated by Std.D is
relatively high. During this thirteen years period Pakistan has passed through two political regimes
and both regimes have discernible difference in economic policies. Therefore, the high rate of
variation in growth may simply be attributed to the macroeconomic conditions of Pakistan coupled
with the global economic conditions.

89
Table 5.1: Summary Statistics Mean Median Mode Std. D Min Max
SIZE 3.120 3.000 2.700 0.700 0.400 5.200
ROA 0.071 0.090 0.030 0.592 -0.640 0.608
CVA 0.560 0.500 0.900 0.200 0.000 1.000
FSIR 0.108 0.079 0.067 0.309 0.000 0.710
GRTH 0.107 0.079 0.000 0.087 -4.700 3.067
NDTS 0.042 0.037 0.000 0.039 0.000 0.989
SPTF 0.310 0.280 0.220 0.430 0.000 0.845
STS 0.900 1.000 0.100 1.600 0.000 2.710
SDA 0.430 1.000 1.000 4.900 0.000 2.150
LTDA 0.210 0.100 0.000 0.200 0.000 2.700
TDA 0.630 0.700 1.800 0.500 0.000 9.100
CDA 0.190 0.300 0.000 0.300 0.000 2.800
NCDA 0.440 0.300 0.200 0.400 0.000 8.500
Source: Author's own calculations
During this period aggregate profitability of the non-financial corporate sector was 7.11%,
again with significantly high variation. The volatility can be attributed to the aforementioned country
specific and global factors. The average 8% returns on Assets compared to the rest of the world is
reasonably good. However the causes of this volatility may be questioned and investigated, which
is another research topic in itself.

90
Figure 5.1: Average Return on Assets of Corporate Sector over thirteen year period
Source: Author’s own calculations
The average annual Return on Assets show 2004 was an extra ordinary year when the
aggregate return was more than 11% which is highest figure during this thirteen years period. Year
2004 to onward the decreasing trend is observed. During 2011 the returns were at lowest point i.e.
less than 5%. The decrease in the returns may be attributed to the various economic and political
challenges that Pakistan faced during this period including energy crises and political and economic
uncertainty.
Firm specific interest rate is calculated as percentage financial charges to interest bearing
debt which is called contractual debt. Contractual debt includes both negotiated short-term finance
and various forms of long term interest bearing debt including debt securities, mortgage loan and
financial leases. Overall effective interest rate of the non-financial corporate sector is about 10.84%.
Effective interest rates vary across firms and across industries depending on debt covenants and
financial structure. This firm specific factor has been included as the determinant of target capital
structure due to its theoretical significance for the capital restructuring decisions. Firm specific
0
2
4
6
8
10
12
1999 2000 2001 2002 2003 2004 2005 2006 2007 2008 2009 2010 2011
ROA

91
interest rate affects the capital restructuring decisions in various ways. Firms with high effective
interest rates try to minimize the financial charges by lowering debt or revising the debt covenants
or shift from one costly sources of debt to cheaper sources, if allied firm specific factors permit. It
is observed that firms with significantly high leverage have more costly debt in their capital structure.
The reason of this phenomenon is quite logical, financially distressed companies are desperate for
funds to finance their operations and meet other financial obligations. The situation turn more intense
when internally generated funds are not enough for such firms to meet their financial needs;
therefore, their last resort is borrowing. Due to inherited risk, lenders charge higher interests from
such firms to compensate for higher risk. The aforementioned argument supports our findings that
firms with higher leverage ratios have higher effective interest rates than their counterparts.
On average total debt in the financial structure of the non-financial corporate sector is 70%
in Pakistan. Out of which major proportion is short term debt which stands approximately 50% of
the total assets. Out of this 50%, spontaneous financing is 38% and only 12% is negotiated financing.
Overall contractual debt is 30% of the total assets and non-contractual debt is 40% of the total assets.
These results indicate that Pakistani firms heavily rely on spontaneous financing which is the
cheapest source of financing, nearly zero direct financing cost.
It was a difficult trade off to exclude any measure of financial structure for further in depth
analysis therefore it was tried that maximum possible depth of analysis is reported. Multiple
measures have been analyzed and reported including contractual debt, long term debt and total debt
for robustness. The results of multiple measures enable comparison of various forms of debt
financing and will provide better understanding of the financial structure dynamics of non-financial
corporate sector of Pakistan. The results would be helpful in concluding the debate of representative
measure of capital structure.

92
Table 5.2: Correlation Matrix SIZE ROA CVA FSIR GRTH NDTS SPTF STS
SIZE 1.000
ROA 0.068 1.000
CVA -0.014 -0.253 1.000
FSIR -0.020 -0.044 -0.023 1.000
GRTH -0.018 -0.009 -0.014 0.003 1.000
NDTS -0.068 0.016 0.210 0.030 -0.008 1.000
SPTF -0.163 0.007 -0.115 0.014 -0.024 0.028 1.000
STS 0.028 0.172 -0.404 -0.017 -0.001 -0.121 -0.263 1.000
Source: Author’s own calculations
Drobetz and Wanzenried (2006) indicated the problem of representative measure of capital
structure. They applied two definitions of capital structure in other words calculated capital structure
by two ratios namely total debt to asset ratio and the second interest bearing debt to capital employed
following Rajan and Zingales (1995) who also applied these two definitions of leverage in their
study. In this study debt has been thoroughly analyzed all aspect of debt has been discussed including
the negotiated finance, interest bearing long term debt which is referred here as contractual debt and
total debt including short term contractual debt and long term debt. The correlation among the
various measures of the capital structure is not shown in the above table because they are not
regressed in any single equation rather they are discussed and analyzed separately.
The correlation metrics indicates there is no strong correlation among the variables except
CVA and LDA which is relatively high but cannot be considered high to the objectionable level. The
results indicate that variables of the study are orthogonal and no problem of multicollinearity. The
results of the model would be robust and would lead to the correct inferences.
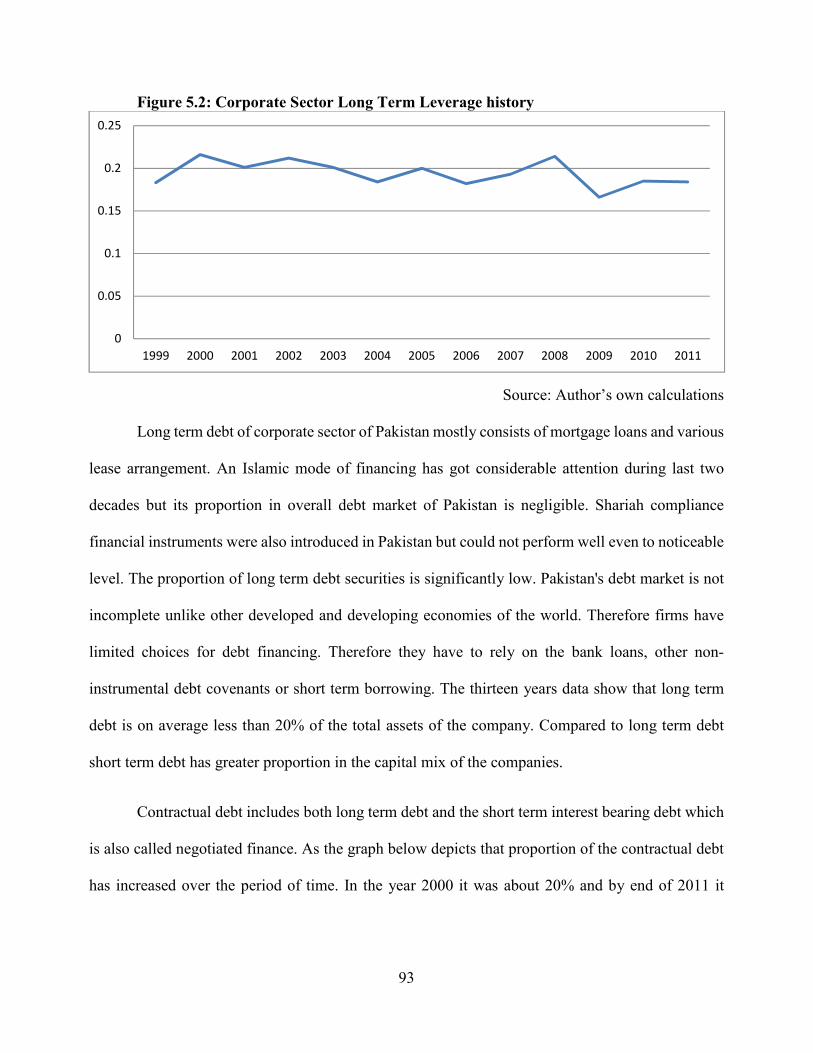
93
Figure 5.2: Corporate Sector Long Term Leverage history
Source: Author’s own calculations
Long term debt of corporate sector of Pakistan mostly consists of mortgage loans and various
lease arrangement. An Islamic mode of financing has got considerable attention during last two
decades but its proportion in overall debt market of Pakistan is negligible. Shariah compliance
financial instruments were also introduced in Pakistan but could not perform well even to noticeable
level. The proportion of long term debt securities is significantly low. Pakistan's debt market is not
incomplete unlike other developed and developing economies of the world. Therefore firms have
limited choices for debt financing. Therefore they have to rely on the bank loans, other non-
instrumental debt covenants or short term borrowing. The thirteen years data show that long term
debt is on average less than 20% of the total assets of the company. Compared to long term debt
short term debt has greater proportion in the capital mix of the companies.
Contractual debt includes both long term debt and the short term interest bearing debt which
is also called negotiated finance. As the graph below depicts that proportion of the contractual debt
has increased over the period of time. In the year 2000 it was about 20% and by end of 2011 it
0
0.05
0.1
0.15
0.2
0.25
1999 2000 2001 2002 2003 2004 2005 2006 2007 2008 2009 2010 2011

94
reached to 50%. The graph shows an overall increasing trend in the proportionate contractual debt
to assets ratio.
Figure 5.3: Corporate Sector Contractual Debt history
Source: Author’s own calculations
Total debt to asset ratio is about 65% aggregate, however it change over time. Total debt
includes both short term debt and long term debt. The graph of average annual values of total debt
ratio show overall increasing trend. The proportion of debt financing is increasing over time the
increase in proportion of debt in the capital mix can be attributed to various factors. The
developments in the Islamic financing over last two decades cannot be ignored. Pakistan is an Islamic
state with majority Muslim population. As per Islamic teachings interest is prohibited, Shariah
Compliance Islamic banking has provided an opportunities to the people who previously avoided
debt financing due to religious reasons.
0
0.05
0.1
0.15
0.2
0.25
0.3
0.35
0.4
0.45
0.5
1999 2000 2001 2002 2003 2004 2005 2006 2007 2008 2009 2010 2011

95
Figure 5.4: Corporate Sector Total Debt history
Source: Author’s own calculations
The following table shows descriptive analysis of annual data of three alternate measures of
capital structure. The results show that total debt of non-financial corporate sector is on average
more than 60% throughout the thirteen years period. Maximum value is 67% in the year 2011. Long
term debt on other hand lowest proportion in the capital mix it is around 20% of the total assets of
the corporate sector. Contractual debt has medium proportion; it is around 30% of the total assets
over the period of thirteen years. From the results it can be easily infer that the Contractual debt has
comparatively more variation than the other two measures of capital structure. It indicate that debt
covenants are more sensitive to the market conditions and firms adjust their negotiated finance more
frequently in response to the changes in capital markets or firm specific dynamics.
0.59
0.6
0.61
0.62
0.63
0.64
0.65
0.66
0.67
0.68
1999 2000 2001 2002 2003 2004 2005 2006 2007 2008 2009 2010 2011

96
Table 5.3: Descriptive Statistics of Three Capital Structure measures
Year CDA LDA TDA
Mean S.D Mean S.D Mean S.D
1999 0.228 0.174 0.183 0.123 0.670 0.695
2000 0.200 0.160 0.216 0.127 0.622 0.626
2001 0.362 0.386 0.201 0.120 0.618 0.621
2002 0.402 0.418 0.212 0.146 0.631 0.643
2003 0.397 0.405 0.201 0.137 0.632 0.662
2004 0.396 0.396 0.184 0.124 0.644 0.647
2005 0.416 0.420 0.200 0.123 0.641 0.672
2006 0.413 0.427 0.182 0.128 0.650 0.686
2007 0.372 0.378 0.193 0.130 0.656 0.679
2008 0.413 0.430 0.214 0.120 0.667 0.679
2009 0.395 0.417 0.166 0.122 0.674 0.703
2010 0.459 0.490 0.185 0.125 0.665 0.693
2011 0.475 0.511 0.184 0.124 0.669 0.698 Source: Author's own calculations
5.2 PARAMETERS ESTIMATION
Generalized method of moments was originally introduced by Karl Pearson in 1894. The
method was later formalized and popularized by Lars Peter Hansen in 1982. GMM has great
application for various dynamic models of finance, like CAPM, dynamic models of capital structure.
This estimation technique, with small variation, has been used widely in economics and finance. The
advantage of GMM over other estimation techniques is that it relaxes various assumptions of OLS
regression. Generalized method of moments can estimate the unknown parameters by applying the
moment conditions within the sample. Literature suggests that for dynamic models estimation, semi
parametric models like GMM is highly recommended. It gives flexibility to avoid unnecessary and
irrelevant assumptions of OLS for instance specification of distribution of data and error term.
However there are number of issues which need to be addressed while applying GMM.
At the first place parameters were estimated by following equation.
����,�∗ = �� + �������,��� + ������,��� + ������,��� + �������,��� + �������,��� +
�������,��� + �������,��� + ������,���+ ɯ�,� Equation-1-C

97
Closer the target capital structure to the actual capital structure the parameter ��,� in equation
2-D representing the adjustment speed closer to one. Therefore the parameters �� through �� referred
as short term reaction. Whereas the constant �� represents the long run reaction to adjustment speed.
One period lagged variables were regressed with leverage to estimate parameters of target
capital structure. Following Getzmann Lang and Spremann, (2010) estimators were instrumentalist
by taking one period lagged independent variables. The parameters estimated by one period lagged
variable are used to estimate the target capital structure. As described in (section 1.2) firms are
knowledgeable about the firm specific factors prior to making capital restructuring decisions.
Therefore the target capital structure is associated with the current period's firm specific factors.
Three different measures of leverage namely Long Term Debt to Total Asset Ratio, Contractual Debt
(Interest bearing debt) to Total Asset Ratio and Total debt to Total Assets ratio were regressed using
the same equation for parameter estimation for robustness. Initially eleven independent variables
were identified out of which only eight variables were selected for final analysis. The remaining
three variables were dropped because of certain statistical problems.
The equation is estimated by applying GMM. The regression was run in E-views. Maximum
500 iterations were allowed and accuracy was prioritized over speed. Since it is un-balanced pooled
data therefore pre-whitening was allowed for unbiased estimation.
5.2.1 Significance of the target Contractual Debt ratio determinants
The given below table shows the impact of explanatory variables on the target contractual
debt ratio of the firm which consequently affect the adjustment speed. The equation is estimated by
regressing one period lagged independent variables with the contractual debt ratio. Estimated
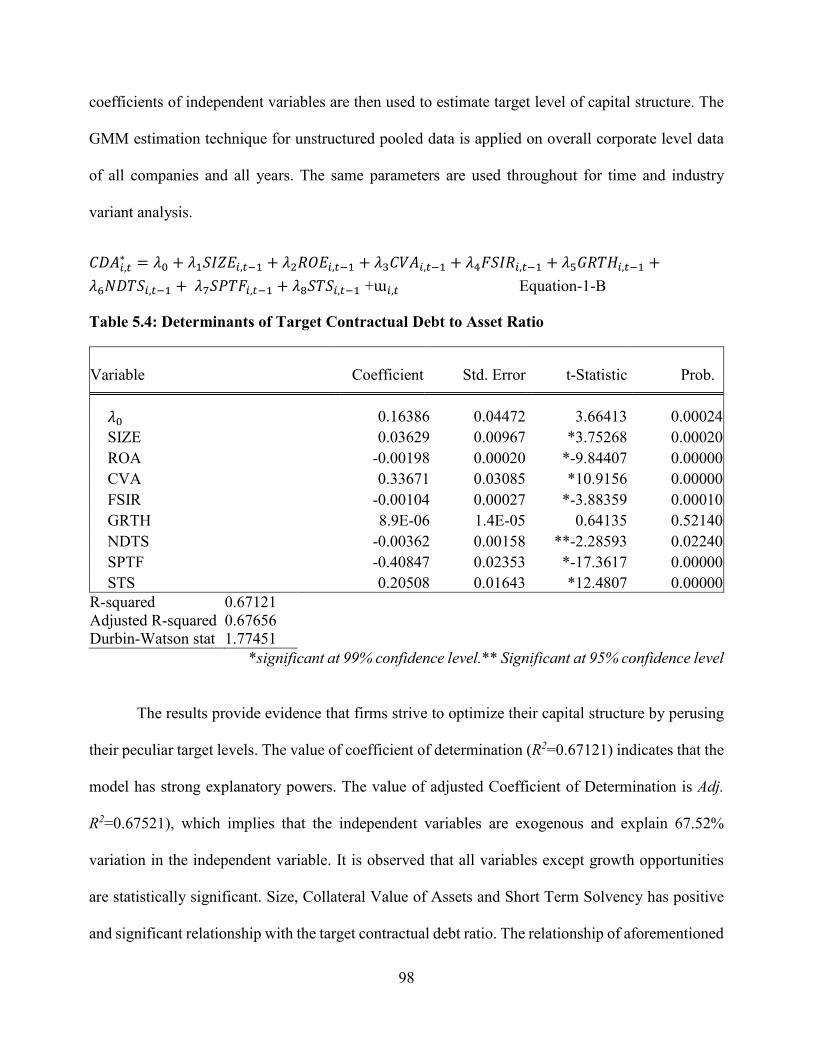
98
coefficients of independent variables are then used to estimate target level of capital structure. The
GMM estimation technique for unstructured pooled data is applied on overall corporate level data
of all companies and all years. The same parameters are used throughout for time and industry
variant analysis.
����,�∗ = �� + �������,��� + ������,��� + ������,��� + �������,��� + �������,��� +
�������,��� + �������,��� + ������,��� +ɯ�,� Equation-1-B
Table 5.4: Determinants of Target Contractual Debt to Asset Ratio
*significant at 99% confidence level.** Significant at 95% confidence level
The results provide evidence that firms strive to optimize their capital structure by perusing
their peculiar target levels. The value of coefficient of determination (R2=0.67121) indicates that the
model has strong explanatory powers. The value of adjusted Coefficient of Determination is Adj.
R2=0.67521), which implies that the independent variables are exogenous and explain 67.52%
variation in the independent variable. It is observed that all variables except growth opportunities
are statistically significant. Size, Collateral Value of Assets and Short Term Solvency has positive
and significant relationship with the target contractual debt ratio. The relationship of aforementioned
Variable Coefficient Std. Error t-Statistic Prob.
�� 0.16386 0.04472 3.66413 0.00024
SIZE 0.03629 0.00967 *3.75268 0.00020
ROA -0.00198 0.00020 *-9.84407 0.00000
CVA 0.33671 0.03085 *10.9156 0.00000
FSIR -0.00104 0.00027 *-3.88359 0.00010
GRTH 8.9E-06 1.4E-05 0.64135 0.52140
NDTS -0.00362 0.00158 **-2.28593 0.02240
SPTF -0.40847 0.02353 *-17.3617 0.00000
STS 0.20508 0.01643 *12.4807 0.00000 R-squared 0.67121 Adjusted R-squared 0.67656 Durbin-Watson stat 1.77451

99
factors is significant at 99% confidence level. The results are consistent with the existing studies and
approve the claim of Trade-Off theory (see e.g., Cook and Tang, 2010). The positive value of SIZE
coefficient (λ1=0.036286) along with T-Value (t-Stat = 3.752683) indicate a positive and statistically
significant relationship. It implies that larger firms have more debt in their capital structure compared
to smaller firms because of their power to negotiate and lower default risk. Larger firms also have
better prospects in financial markets and therefore capital structure adjustments are comparatively
convenient. As per the empirical results the value of CVA coefficient (λ3 =0.336713) and T-Value
(t-Stat = 10.91565) stipulate a positive and significant relationship. Collateral value of assets has
also positive impact on the target leverage ratio. Firms with proportionately more fixed assets with
collateral value can secure more debt. It is conventional wisdom that debt is normally sanctioned
against some kind of security. Thus collateral assets serve the purpose and firms may raise finance
against this considerable financial security. Therefore the empirical results a positive and significant
relationship between target debt ratio and the collateral value of assets. The relationship is significant
at 99% confidence level. It can be inferred that the relationship is consistent across firms and over
time.
However, Return on Assets, Firm Specific Interest Rate, Non-Debt Tax Shield and
Spontaneous Finance have negative relationship with firms target firms target contractual debt level.
The empirical results are consistent with theoretical notion and approve the theoretical explanations
by various capital structure theories. The negative value of ROA coefficient (λ2 = -0.001977) and T-
value (t-Stat = -9.844070) depicts statistically significant and strong negative relationship. Higher t-
value lay down that the relationship is strongly consistent across firms and over time and it is
significant at 99% confidence level. The results are parallel to the pecking order theory which claims
that firms preferred internally generated funds over the debt financing. The results specify that firms

100
with higher profits will have lower tendency towards debt financing and therefore will have lower
debt ratios. Profitable firms have lower targets debt ratios vice versa. Firm Specific Interest Rate
denoted by FSIR has negative coefficient (λ4 = -0.001043) and calculated T-Value (t-State = -
3.883589) greater than corresponding critical value. The results indicate statistically significant
negative relationship. Increase in firms' peculiar cost of debt reduces the appetite for debt financing.
Firms with higher actual interest cost have less incentive for increasing debt rather they try to adjust
downward by paying off debt or reducing their cost of debt by means of swap arrangements. The
higher gap between the prevailing market interest rate and the firm's specific interest rate instigate
the restructuring.
The biggest advantage of using debt into the capital mix of the firms is the deductibility of
interest (cost of debt) for tax calculations. This feature makes debt financing less costly than the
equity. Non-debt tax shield is ratio of non-cash tax deductible expenditures including depreciation,
amortization, depletion and set off and carry forward of losses. The negative coefficient value (λ6 =-
0.003618) and T-value (t-Stat = -2.285932) indicate an inverse and statistically significant
relationship. The relationship is significant at 95% confidence level as the calculated t-Stat is greater
than the corresponding tabulated value at 95% confidence level however the calculated T-Value is
less than the corresponding tabulated value at 99% confidence level. Still the results are significant
and contribute towards the explanatory powers of the model. If the firm has enough pool of
expenditures in a particular year which can reduces the tax burden of the firm the debt financing has
less incremental benefits. The negative relationship is in accordance with the generally accepted
notion. Spontaneous financing is the cheapest source of financing. If a firm is able to get sufficient
non-interest bearing funds to finance their operations interest bearing debt covenants is least desired.
Therefore a negative relationship is found which supplement the supposition. Negative coefficient

101
value ((λ6= -0.408467) and considerably higher T- Statistics i.e. (-17.36174) indicates statistically
significant negative relationship.
The relationship of growth opportunities and the target contractual debt ratio is positive but
insignificant. The calculated T-Value (0.641351) does not fall in the acceptable region at any
significant confidence level. This is analogous to the existing literature however the relationship is
not consistent therefore it's not statistically significant. The possible reason of this dichotomy is the
measurement problem. Different measures have been taken by different scholars. For this research,
chain base method of calculation of annual growth is applied. The variation due to chain base might
have distorted the results. Referred to the Table 5.1 showing descriptive statistics the standard
deviation of growth rate across firm and over time is considerably high i.e. 81 percent. This value is
considerably abnormal, economic instability and international factors may be attributed to this high
variation. Some scholars have used annual percentage growth of total assets which appears more
stable than the former method but the heteroscedasticity problem arise.
5.2.2 Coefficients of Target Long Term Debt ratio
The second equation is estimated by applying GMM for unstructured panel data technique.
The dependent variable is Long term debt to total asset target ratio. The independent variables were
instrumentalized by taking one period lag value. The results show that the model explains ~62%
variation in the dependent variable. From the small difference in unadjusted coefficient of
determination (R2) and the adjusted coefficient of determination (Adjusted R2), it is inferred that all
explanatory variables are orthogonal. Thus the model has strong explanatory powers.
����,�∗ = �� + �������,��� + ������,��� + ������,��� + �������,��� + �������,��� +
�������,��� + �������,��� + ������,���+ɯ�,� Equation-1B

102
Table 5.5: Determinants of Target Long Term Debt to Asset ratio
Variable Coefficient Std. Error t-Statistic Prob.
�� 0.219841 0.08983 2.44730 0.0132 SIZE 0.016378 0.00301 *5.44918 0.0000 ROA -0.000300 0.00011 *-2.77360 0.0056 CVA 0.345896 0.01607 *21.51905 0.0000 FSIR -0.001664 0.00039 *-4.21495 0.0000 GRTH 1.67E-05 6.46E-06 *2.58073 0.0099 NDTS -0.004137 0.00148 *-2.79283 0.0053 SPTF -0.153540 0.01181 *-13.00075 0.0000 STS 0.017580 0.00311 *5.65190 0.0000
R-squared 0.626350 Adjusted R-squared 0.614130 Durbin-Watson stat 1.839134
*significant at 99% confidence level.** Significant at 95% confidence level
All the results are similar to the results of Equation 1B. Empirical results reveal that size of
the firm has positive and statistically significant relationship with the long term debt targets. Size is
significant at 99% confidence level as the calculated value (5.449182) is greater than the
correspondent critical value, thus fall in the acceptable region. Collateral value of assets and
Spontaneous finance both have positive and highly significant relationship. Both aforementioned
variables affect the target long term debt to assets in positive way. With increase in size of the firm,
collateral value of assets and short term solvency increases the long term target debt ratio thus their
coefficients determines what target level of capital structure is? Interestingly the growth has positive
and statistically significant relationship with long term debt target ratio. The difference in results of
contractual debt and long term debt ratio indicates that only long term debt is affected by the growth
of the company. The small value of coefficient implies that growth opportunities have little impact
over target long term debt ratio. The relationship is significant at 99% confidence level. The variable
has small predictive power compared to other independent variables.

103
Profitability measured by Return on Assets ratio has negative and significant relationship
with long term leverage target ratio. The relationship is significant at 99% confidence level. The
relationship implies that profitable firms meet their financing needs from the internally generated
fund and prefers internally generated funds over external sources. This tendency attests the pecking
order theory. Collateral value of assets measured as the ratio of tangible fixed asset to total asset has
positive relationship with long term leverage. The relationship is significant at 99% confidence level.
The calculated t-value (21.51905) is greater than critical value at this degree of freedom. Firm
specific interest rate has negative impact on target adjustments of long term debt. Higher the firm
specific interest rate lowers the adjustments towards target. The relationship is significant at 99%
confidence level as indicated by t-State value of 4.214955. Like contractual debt, Firm specific
interest rate, non-debt tax shield and spontaneous finance has negative and significant relationship
with long term debt target ratios.
5.2.3 Coefficients of target Total Debt ratio
The third equation is estimated for target total debt ratio. The coefficients are estimated by
following equation. The results are consistent with second equation. It implies that both of the capital
structure measures have same parameters with immaterial variations in the value of coefficients. Yet
again growth has negative and statistically insignificant relationship with the target total debt ratio.
Other than the Growth opportunities all other variables have statistically significant relationship with
the target total debt to asset ratio.
����,�∗ = �� + �������,��� + ������,��� + ������,��� + �������,��� + �������,��� +
�������,��� + �������,��� + ������,���+ɯ�,� Equation-1C

104
Table 5.6: Determinants of Target Total Debt to Asset ratio
Variable Coefficient Std. Error t-Statistic Prob.
�� 0.245761 0.047491 *5.174896 0.0000
SIZE 0.036526 0.009661 *3.780696 0.0002
ROA -0.001977 0.000202 *-9.775987 0.0000
CVA 0.337058 0.030819 *10.93658 0.0000
FSIR -0.001050 0.000268 *-3.920079 0.0001
GRTH 8.77E-06 1.39E-05 0.628656 0.5296
NDTS -0.003696 0.001590 **-2.324578 0.0202
SPTF 0.591325 0.023516 *25.14580 0.0000
STS 0.204587 0.016442 *12.44262 0.0000 R-squared 0.539225 Adjusted R-squared 0.526393 Durbin-Watson stat 1.774325
*significant at 99% confidence level.** Significant at 95% confidence level
Firm Specific interest rate has significant negative relationship with all three measures of
capital structure. This result can be justified from two different perspectives. Firms having less
favorable debt covenants bear higher effective interest rate thus discourage more debt financing.
Other perspective is the fact that firms bearing less effective interest rate employee higher debt in
the capital structure for optimal use of capital.
Growth has positive impact on the long term target leverage however the magnitude of
relationship is very small. The relationship between growth and the long term debt to total assets is
statistically significant at 1% confidence level. It implies firms having growth opportunities employ
more debt in their capital mix to finance the growth opportunities. Growing firms exploit the degree
of financial leverage for profit maximization. Revenue growth in presence of fixed financial charges
results higher return on equity. The incremental positive returns on equity compensate the additional

105
risk associated with fix nature of interest payments. The relationship between growth opportunities
and the contractual debt is positive but statistically insignificant. Calculated t-value 0.64135 is
greater than the critical value.
Non debt tax shield has negative relationship with leverage. The relationship is significant at
1% confidence level. The inverse relationship between long term leverage and non-debt tax shield
implies that firms having more tax deductible non-cash expenditures and/or accumulated losses
employ less debt. The biggest advantage of the employing debt in the capital structure is the tax
deductibility of the interest expenses. If the firms have non-cash expenditures in terms of
depreciation, amortization and depletion may avoid taxes on income tax. Such firms have less
incentive to use leverage as tool for tax savings. Therefore the relationship between non-debt tax
shield and leverage is negative. Calculated t-value -2.792829 is greater than the critical t-value
therefore fall in the acceptable region.
Spontaneous financing, as an alternate source of financing, play important role in capital
structure decisions. Spontaneous financing is the cheapest sources of financing therefore preferred
by the firms if firm don’t have working capital issues. The empirical results show that spontaneous
financing has significant negative relationship with the long term debt. The relationship is significant
at 1% confidence level. The results attest the theoretical justification of the inverse relationship
between the spontaneous finance and long term debt.
Solvent firms have greater prospects of getting debt at cheaper rates because the default risk
in such firms is lower. The positive relationship between short term solvency and the capital structure
is attested by the empirical results. The positive relationship between short term solvency and the
capital structure is statistically significant at 1% confidence level.

106
5.3 CAPITAL STRUCTURE ADJUSTMENT SPEED
In estimation of adjustment speed two steps are involve. First step is to estimate the
determinants of target capital structure. Then these estimated coefficients are used to estimate target
capital structure. Second step is to estimate the speed of adjustment. Speed of adjustment is estimated
using dynamic regression model. The determinants of target capital structure discussed above were
used to estimate target level of capital structure of firm i in year t. Target capital structure of each
firm is computed by applying coefficients estimated through overall data. The yearly difference
between the capital structures is regressed with the difference of the estimated capital structure and
the actual capital structure at time t of firm i. The coefficient ϑ is called adjustment speed in this
model.
���,��� − ���,� = ��,�(����,�∗ − ���,�) Equation-2
Table 5.7 shows the corporate sector's overall Annual Adjustment Speed. The difference
between target and actual capital structure (����,�∗ − ���,�) of Firm i is regressed with the difference
in capital structure from previous year(���,��� − ���,�). The coefficient ��,� is referred to as the
adjustment speed. The adjustment speed is affected by the estimated parameters of target capital
structure. The reaction of adjustment speed towards the estimated parameters can be split into long
run and short run reaction as indicated by the equation 2-D.
���,��� = ����,� + �1 − ��,�����,� + ��,���,���,�,� + ��,� (2-D)
Where;��,�is adjustment speed measured as parameter for the direction and magnitude of adjustment
in capital structure during a specific period of time and of a particular particular. ��,�,� are the
determinants of the adjustment speed which represents the short term reaction to adjustment speed.

107
If the equation 2-D is estimated in two steps the parameters of equation 1-C can be interpreted as the
short run and long run reactions similar to equation 2-D.
By putting the estimated parameters in the equation we get the following results:
(1)Contractual debt
���,��� = 0.1638��,� + �1 − ��,�����,� + 0.03629 ��,����� − 0.00198 ��,����
+ 0.33671��,���� − 0.00104��,����� − 0.00362��,����� − 0.40847��,�����
+ 0.20508��,���� + ��,�
(2)Long term debt
���,��� = 0.219841��,� + �1 − ��,�����,� + 0.016378 ��,����� − 0.000300 ��,����
+ 0.345896��,���� − 0.001664��,����� + 0.000017��,�����
− 0.004137��,����� − 0.133540��,����� + 0.017580��,���� + ��,�
(3) Total debt
���,��� = 0.245761��,� + �1 − ��,�����,� + 0.036526 ��,����� − 0.001977 ��,����
+ 0.337058��,���� − 0.001050��,����� + 0.00009��,�����
− 0.003696��,����� + 0.591325��,����� + 0.204587��,���� + ��,�
The constant in the equation 1-C, which is symbolized as �� in equation 2-D. The analysis show that
value of Long run reaction as symbolized in the model ��=0.16386 which is significant at 99%
confidence level in case of contractual debt, the value of �� which represent the long run reaction is
0.219841 in case of long term debt to asset ratio and the parameter is significant at 95% confidence
level; the value of �� is 0.245761 in case of total debt to asset ratio. The short run reaction of
adjustment speed is already explained as the determinants of target capital structure in the relevant
sections.
108
The results indicate that over the period of thirteen years non-financial corporate sector of
Pakistan adjusts an average ~41% contractual debt, ~42% long term debt and ~25% total debt
towards their target ratios. Flannery and Rangan (2006) reported 35.5% annual adjustment towards
the target leverage in case of interest bearing debt ratio in other words contractual debt ratio. In case
of Pakistan the adjustment speed is 41% which is higher than the estimates of Flannery and Rangan
(2006). The higher speed can be attributed to the highly volatile economic condition of Pakistan.
Highest adjustment is observed in long term and the lowest adjustment in total debt. It is observed
that adjustment in contractual debt is moderate compared to total debt and long term debt. The lower
rate of adjustment in long term debt is in accordance with the notion that long term debt covenants
have higher adjustment cost. Normally long term debt is sought for long term investment projects
and the investment is comparatively difficult to alter in short run. However medium and short range
debt financing is comparatively less fix in nature thus restructuring is comparatively efficient.
5.3.1 Annual Adjustment Speed
The results indicate that over the period of thirteen years the annual adjustment towards the
target capital structure portrays a head and shoulder pattern. Starting from 1999 to 2003, the
adjustment speed was increasing over time. During 2004 and 2005 the adjustment towards target
capital structure was at highest point of period under study. From 2005 to onward the adjustment
speed is decreasing over time and thus shows a downward trend. During the year 2004 the corporate
sector financially outperformed. If the results are interpreted in light of the financial performance it
can be clearly observed that during financially prosperous periods capital adjustment was higher
compared to the other periods.

109
Figure 5.5: Capital Structure Adjustment speed of Overall
It is reported on the basis of results that highest adjustment in Contractual Debt was in year
2005 i.e. ~51% and the lowest adjustment in year 2009 i.e. ~27%. Same applies to Long term debt
where highest adjustment in year 2004. ~48% and lowest in year 2009. ~18%. It is observed that
lowest total debt is less likely to be adjusted compared to other two measures of capital structure.
However the adjustment patterns are similar to the former two measures of capital structure. 2004
was the year when Pakistan's corporate sector has made maximum adjustments in total debt i.e.
~35% and lowest adjustments are found in the year 2009 and 2011.
0
0.1
0.2
0.3
0.4
0.5
0.6
2000 2001 2002 2003 2004 2005 2006 2007 2008 2009 2010 2011
Annual Adjustment Speed
CDA LDA TDA

110
Table 5.7: Annual Capital Structure Adjustment Speed of Overall Year CDA LDA TDA Θ t-Stat Θ t-Stat Θ t-Stat 2000 0.281984 4.29764 0.242619 4.6939 0.180885 5.03075
2001 0.333036 6.38862 0.309989 6.59281 0.279301 5.34719
2002 0.319871 4.80915 0.282362 5.75388 0.228602 5.12841
2003 0.363810 3.37036 0.335193 4.65792 0.279709 5.06734
2004 0.506489 4.11557 0.483028 4.84052 0.345165 4.51625
2005 0.514715 4.96789 0.426692 5.12738 0.337719 5.71377
2006 0.329665 3.29592 0.302752 4.76981 0.246587 3.55276
2007 0.424273 4.57739 0.414244 5.85228 0.322047 5.10326
2008 0.303288 4.40886 0.256359 6.01732 0.204686 3.31571
2009 0.271812 4.34176 0.179597 3.98463 0.130459 3.21793
2010 0.381956 4.39394 0.361182 3.27818 0.306595 4.66853
2011
0.281955 3.66453 0.21647 4.19928 0.13622 4.34794
Average 0.359404 0.317541 0.249831
Source: Author’s own calculations
The results show highest adjustment speed in Contractual debt ratio the values disperse between
~27% to ~51% per annum. Moderate adjustment speed is found in Long term debt ratio which ranges
from ~18% to ~48% per annum. The adjustment speed of total debt ratio is found to be lowest
ranging from ~13% to ~35%. The annual adjustment speeds are computed from the cross sectional
data of all companies in all sectors for a particular year. For every year a separate equation is run
and adjustment speed is estimated apply GMM-sys technique. Higher T-values corresponding to
every value of adjustment speed indicates statistical significance. To T-values are also presented to
show the significance of the speed of adjustment.

111
5.3.2 Industry Adjustment Speed
Initially the data of firms from nine different industrial sectors were used for estimation of
parameters of determinants of adjustment speed and annual overall corporate adjustment speed.
Estimation of annual adjustment speed for each industry requires cross sectional data of that
particular industry in a particular period. One firm is one observation for estimation of adjustment
speed at industry level. Thus the industrial sector with less number of firms were merged and referred
to as Miscellaneous for this research purpose. The large industrial sectors with sufficient number of
firms have been analyzed and reported separately. The following table shows the descriptive
statistics of sector wise capital structure adjustment speed.
Table 5.8: Capital Structure Adjustment Speed summary statistics of individual economic sectors
Textile Chemical Sugar Engineering Miscellaneous
Mean 0.454 0.334 0.226 0.277 0.403
Median 0.493 0.299 0.245 0.267 0.377
Standard Deviation 0.166 0.152 0.094 0.125 0.073
Coef. Of Var 0.365 0.456 0.419 0.450 0.182
Range 0.538 0.508 0.293 0.403 0.221
Minimum 0.149 0.171 0.117 0.115 0.325
Maximum 0.687 0.680 0.410 0.518 0.546
The largest sector in Pakistan's corporate sector is Textile. The data of 155 companies was
available till 2011, out of which 5 companies were dropped due to missing data for some years. The
descriptive statistics of annual adjustment speed show that the values disperse between 68.7% to
15% per annum. On average textile sector of Pakistan adjusts ~45% towards target capital structure
annually. It implies that Textile sector takes approximately two years to fully adjust to its target level

112
if other things remain same. In the real world thing do not remains same thus the target is dynamic
and not static over time period. Thus higher the adjustment speed in a particular year is closed the
target ratio. Chemical sector at number two is second in the row with ~33% average adjustment
speed. The variation in adjustment speed is lower than the textile sector. The values disperse between
17% to 68%. Average 33% adjustment speed implies that chemical sector take approximately three
years to fully adjust to their target capital structure if other things remains same. Engineering sector
is third in the row and adjust capital structure ~28%. The dispersion in annual adjustment speed is
comparatively low values disperse between 11.5% to 58%. The lowest adjustment speed is found in
sugar sector with ~22% per annum. The dispersion is also lower than other bigger industrial sectors.
All other small sectors are grouped as miscellaneous. A moderate adjustment speed with minimum
dispersion is found in all other companies.
Figure 5.6 Sector wise annual capital structure adjustment speed
Source: Author’s own calculation
The above graph show that highest adjustment speeds in all industrial sectors was during
2004 and lowest during 2009. The results are more or less similar to the overall adjustment speed.
0.00000
0.10000
0.20000
0.30000
0.40000
0.50000
0.60000
0.70000
0.80000
2000 2001 2002 2003 2004 2005 2006 2007 2008 2009 2010 2011
Axi
s Ti
tle
Textile
Chemical
Sugar
Engineering
Miscelleneous

113
The graph clearly show that the maximum speed of adjustment is in textile sector consistently over
the period of 12 year. And the lowest adjustment speed in the sugar sector over the period from 2000
to 2011. Other sectors show a moderate adjustment speed during this period.
5.4 DETERMINANTS OF ADJUSTMENT SPEED
On average highest capital structure adjustment speed is observed in Contractual Debt target
Ratio. It entails that firms adjust their long term debt covenants to cope up the dynamics of financial
environment to minimize their financial cost. The cost of long term debt is relatively higher than
short term debt due to longer maturities. Therefore the effective interest rate of long term debt is
more sensitive to financial environment changes than the short term debt. Firms strive to bring their
effective interest rate at par with the prevailing market interest rate. To achieve this optimal mix of
capital, they strive to adjust their long term debt by issuing or redeeming debt securities or through
other swap arrangements.
Since all measures of capital structure have provided robust results in comparative analysis,
further analysis are performed only on long term debt ratio as measure of capital structure. We
specified in chapter two that adjustment speed is a function of various macro-economic and firm
specific factors. Table no. 5.9 shows that banking sector performance, the Distance between target
and actual capital structure Gross Domestic Product growth rate and Inflation are the significant
factor of the adjustment speed of the companies.
The annual adjustment speed was estimated for five industrial groups from year 2000 to
2011, which yielded a balance panel of 60 observations. Both industry fix effect and time fix effect
were used to control the data discrepancy, as the dependent variable adjustment speed was the
industry and time variant. Macroeconomic data is time variant therefore is same for all industries.
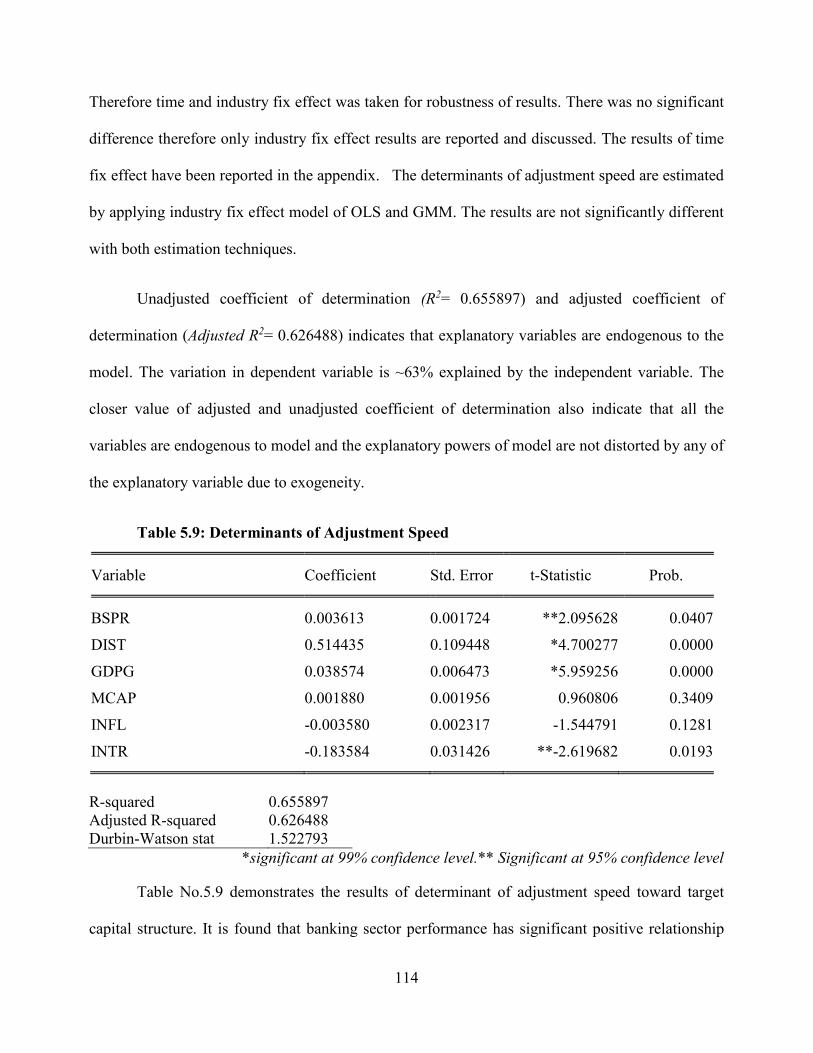
114
Therefore time and industry fix effect was taken for robustness of results. There was no significant
difference therefore only industry fix effect results are reported and discussed. The results of time
fix effect have been reported in the appendix. The determinants of adjustment speed are estimated
by applying industry fix effect model of OLS and GMM. The results are not significantly different
with both estimation techniques.
Unadjusted coefficient of determination (R2= 0.655897) and adjusted coefficient of
determination (Adjusted R2= 0.626488) indicates that explanatory variables are endogenous to the
model. The variation in dependent variable is ~63% explained by the independent variable. The
closer value of adjusted and unadjusted coefficient of determination also indicate that all the
variables are endogenous to model and the explanatory powers of model are not distorted by any of
the explanatory variable due to exogeneity.
Table 5.9: Determinants of Adjustment Speed
Variable Coefficient Std. Error t-Statistic Prob.
BSPR 0.003613 0.001724 **2.095628 0.0407
DIST 0.514435 0.109448 *4.700277 0.0000
GDPG 0.038574 0.006473 *5.959256 0.0000
MCAP 0.001880 0.001956 0.960806 0.3409
INFL -0.003580 0.002317 -1.544791 0.1281
INTR -0.183584 0.031426 **-2.619682 0.0193 R-squared 0.655897 Adjusted R-squared 0.626488 Durbin-Watson stat 1.522793
*significant at 99% confidence level.** Significant at 95% confidence level
Table No.5.9 demonstrates the results of determinant of adjustment speed toward target
capital structure. It is found that banking sector performance has significant positive relationship
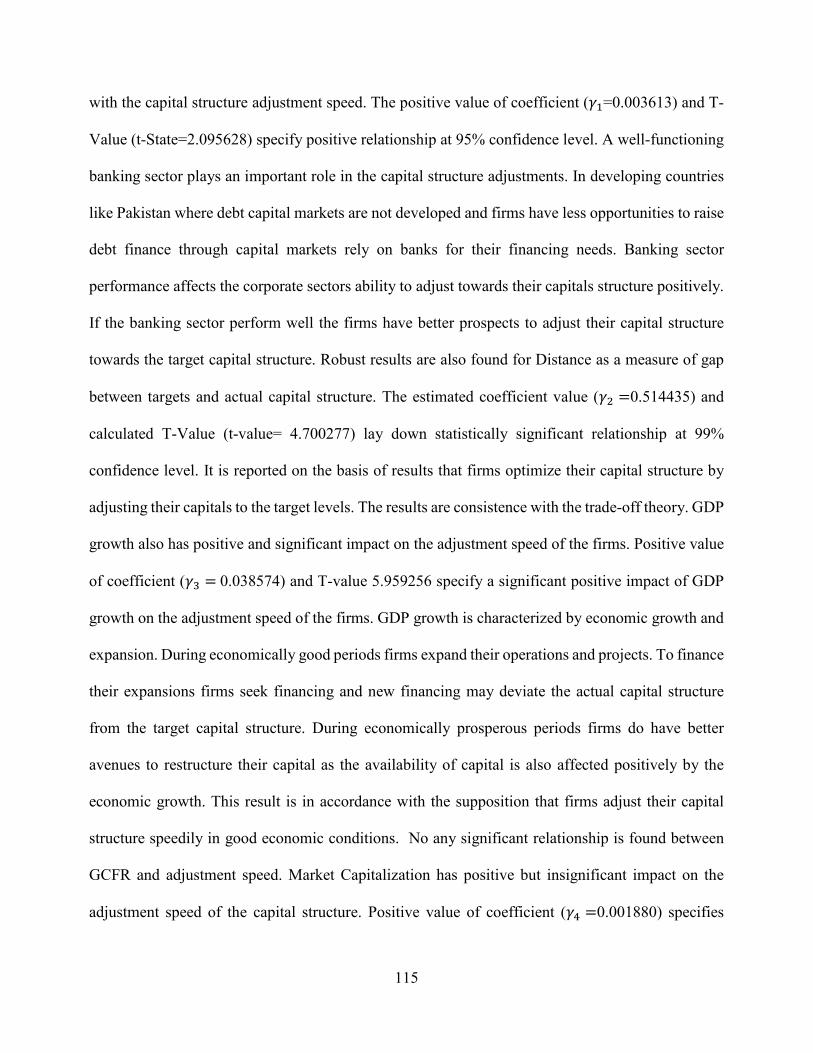
115
with the capital structure adjustment speed. The positive value of coefficient (��=0.003613) and T-
Value (t-State=2.095628) specify positive relationship at 95% confidence level. A well-functioning
banking sector plays an important role in the capital structure adjustments. In developing countries
like Pakistan where debt capital markets are not developed and firms have less opportunities to raise
debt finance through capital markets rely on banks for their financing needs. Banking sector
performance affects the corporate sectors ability to adjust towards their capitals structure positively.
If the banking sector perform well the firms have better prospects to adjust their capital structure
towards the target capital structure. Robust results are also found for Distance as a measure of gap
between targets and actual capital structure. The estimated coefficient value (�� =0.514435) and
calculated T-Value (t-value= 4.700277) lay down statistically significant relationship at 99%
confidence level. It is reported on the basis of results that firms optimize their capital structure by
adjusting their capitals to the target levels. The results are consistence with the trade-off theory. GDP
growth also has positive and significant impact on the adjustment speed of the firms. Positive value
of coefficient (�� = 0.038574) and T-value 5.959256 specify a significant positive impact of GDP
growth on the adjustment speed of the firms. GDP growth is characterized by economic growth and
expansion. During economically good periods firms expand their operations and projects. To finance
their expansions firms seek financing and new financing may deviate the actual capital structure
from the target capital structure. During economically prosperous periods firms do have better
avenues to restructure their capital as the availability of capital is also affected positively by the
economic growth. This result is in accordance with the supposition that firms adjust their capital
structure speedily in good economic conditions. No any significant relationship is found between
GCFR and adjustment speed. Market Capitalization has positive but insignificant impact on the
adjustment speed of the capital structure. Positive value of coefficient (�� =0.001880) specifies

116
positive relationship however the t-value=0.960806 indicates statistical insignificance of the
relationship. The results show that variation in equity market capitalization does not affect the
adjustment speed. Thus it is reported that capital structure adjustments are not affected by the market
capitalization. Firms raise equity capital from the by issuing new shares good market conditions only
make difference at the time of new issue. Existing capital stock is not affected by the market
conditions therefore market capitalization has no effect on the capital structure unless the firms issue
new equity. The results are may differ from the developed countries where firms consider equity
markets as an avenue for capital restructuring. Inflation rate was hypothesized a determinant of
adjustment speed. It was expected that inflation rate would have negative impact on the adjustment
speed of capital structure. The negative value of coefficient and the lower value of t-state i.e. -
1.544791 indicate that inflation has negative impact; however, the relationship is not highly
significant. It is significant at 85% confidence level which is not authoritative enough to establish
any conclusive statement. Interest rate is a robust determinant of adjustment speed. Prevailing
interest rate has negative impact on the adjustment speed as indicated by negative coefficient value
(��=-0.183584). The relationship is significant at ~99% confidence level. The inverse relationship
is in accordance with the common notion that higher interest rates reduce the speed of adjustment.
5.5 IMPACT OF ADJUSTMENT SPEED ON FINANCIAL PERFORMANCE
Firms make adjustments in capital structure for optimal utilization of capital or more
specifically equity capital. Debt is used to lever the returns on equity by exploiting the fix cost of
debt. This last section is to investigate the effectiveness of adjustment speed. The adjustment speed
is regressed with the commonly used financial performance indicator i.e. return on equity. Financial
decisions are made to achieve a common goal of maximize the shareholders wealth. No doubt the
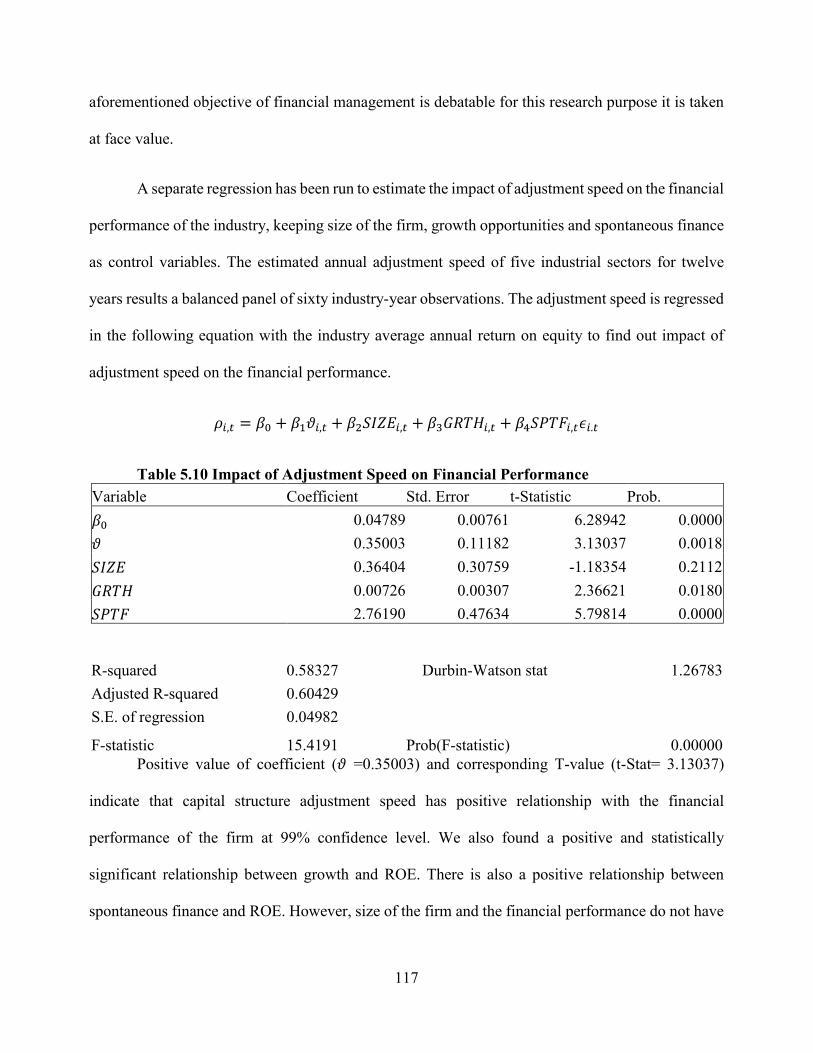
117
aforementioned objective of financial management is debatable for this research purpose it is taken
at face value.
A separate regression has been run to estimate the impact of adjustment speed on the financial
performance of the industry, keeping size of the firm, growth opportunities and spontaneous finance
as control variables. The estimated annual adjustment speed of five industrial sectors for twelve
years results a balanced panel of sixty industry-year observations. The adjustment speed is regressed
in the following equation with the industry average annual return on equity to find out impact of
adjustment speed on the financial performance.
��,� = �� + ����,� + �������,� + �������,� + �������,���.�
Table 5.10 Impact of Adjustment Speed on Financial Performance
Variable Coefficient Std. Error t-Statistic Prob.
�� 0.04789 0.00761 6.28942 0.0000
� 0.35003 0.11182 3.13037 0.0018
���� 0.36404 0.30759 -1.18354 0.2112
���� 0.00726 0.00307 2.36621 0.0180
���� 2.76190 0.47634 5.79814 0.0000
R-squared 0.58327 Durbin-Watson stat 1.26783
Adjusted R-squared 0.60429
S.E. of regression 0.04982
F-statistic 15.4191 Prob(F-statistic) 0.00000 Positive value of coefficient (� =0.35003) and corresponding T-value (t-Stat= 3.13037)
indicate that capital structure adjustment speed has positive relationship with the financial
performance of the firm at 99% confidence level. We also found a positive and statistically
significant relationship between growth and ROE. There is also a positive relationship between
spontaneous finance and ROE. However, size of the firm and the financial performance do not have

118
statistically significant relation. Firm fix effect model by applying panel least square methods and
keeping industry fix effect are presented in above table. Where R2 value 0.58327 implies that 58.32%
variation in ROE is explained by the independent variables in the equation. The minimum value of
R2 is found by applying GLS two way random effect model i.e. ~10%. On the basis of results it is
inferred that capital structure adjustment speed enhances the financial effectiveness of the firms.
Overall the results are consistent with prior research. Even with alternate methodologies and
alternate measures of variables the results are consistent with negligible variation. Dynamic tradeoff
theory best explains the financial policy of the corporate sector of Pakistan. The empirical results
indicate strong evidences in favor of dynamic trade off model.

119
CHAPTER NO.6
CONCLUSION AND RECOMMENDATIONS:
Financial policy of Pakistan's non-financial corporate sector is empirically investigated from
diverse perspectives, ranging from determinants of target capital structure to the effectiveness of the
financial policy. The investigation includes all non-financial sector companies listed on the KSE
from 1999 to 2011. The results provide strong evidence to report size, profitability, collateral value
of assets, firm specific interest rate, non-debt tax shield, spontaneous financing and liquidity robust
determinants of the target capital structure. Out of eight variables four variables are found inversely
related to the target capital structure namely ROA, Firm specific interest rate, non-debt tax shield
and spontaneous financing. On other hand firm size, collateral value of assets and liquidity has
positive impact on capital structure targets. The results are consistent with existing literature and
also with various capital structure theories.
It is reported on the basis of results that firm specific factors play an important role in shaping
financial policy of the Pakistani non-financial firms. Out of three alternate measures of capital
structure, contractual debt to assets target ratio is explained maximum by the explanatory variables
and least explained when total debt target ratio is regressed with the same repressors. The results are
consistent with an international study conducted by Getzmann and Spremann (2010). They applied
similar methodology and reported that determinants of target capital structure and adjustment speed
differ across countries. The results of this research are similar to their findings for Asian countries.
Annual speed of capital structure adjustment is estimated for overall corporate sector as well
as for various industries separately. It is found that adjustment speed of long term debt is highest and
of total debt is lowest. On average firms adjust 33% per annum to their capital structure toward target

120
level, it take around three years to fully adjust toward dynamic targets. The speed of adjustment vary
over time and across industries highest adjustment speed is found in Textile industry and lowest in
Sugar industry. The adjustment speed is dispersed between 14% to 58%, over time and across
industries.
Robust results are found for the determinants of adjustment speed. It is reported on the basis
of results that banking sector performance, GDP growth, distance from the target, inflation and
market interest rates are robust determinants of adjustment speed. Banking sector performance, GDP
growth and distance from the target are related positively to the adjustment speed. Inflation and
market interest rate are inversely related with adjustment speed. No significant relationship is found
between adjustment speed and gross capital formation. It is inferred that volatile inflation and high
market interest rates impedes the adjustment speed of non-financial firms. The results are consistent
with the theory and the results of empirical studies (e.g., Elsas, and Florysiak, 2013; Flannery and
Hankins, 2013; Antão and Bonfim, 2014).
It is found that capital structure adjustment play an effective role in levering returns to the
equity holders who have residual claim on the profits of the firm. Restructuring capital to achieve
the optimality is one of the essential strategies to magnify the returns to the ultimate owners of the
firm i.e. shareholders. It is concluded that good economic conditions and sound financial system
increase the firms' capability to achieve their financial structure targets. Firms closer to their dynamic
target capitals outperform compared to the firms far from their capital structure targets. A sound and
well performing corporate sector accelerates the economic development and growth of any country.

121
6.1 RECOMMENDATIONS
It is recommended on the basis of research findings that firms should keep revising the capital
structure targets in response to changes in firms' peculiar financial situation and changes in financial
environment. Firms which are more responsive to the deviations of capital structure from the target
level, outperform than the firms which are slow in reconciling the gap between target and actual
capital structure. The dynamic target capital structure should be achieved by all available means to
maximize the value of the firm.
The regulatory authorities should formulate policies to develop a well-functioning market of
corporate debt securities. Parallel to equity markets a complete and efficient debt security market is
essential for optimal utilization of the capital. Efficient utilization of capital by corporate sector will
ensure the proper placement of country's scarce resources. Thus state should pay close attention to
balance the growth of financial markets to provide full range of financing to the corporate sector and
more investment avenues to the investors. Corporate financial performance and well-functioning
capital markets play an important role in the economic development of a country therefore state
should give due consideration to this sector.
6.2 RESEARCH LIMITATIONS
Full range of longitudinal data of corporate sector of Pakistan is not readily available.
Especially, market data of corporate debt is scarce therefore market vale based variables could not
be included.
The analysis has been carried out in three articulated tiers. The second tier required analysis
of annual data of individual industrial sectors. Small industrial sectors with relatively small no of
companies like Transport, Electric Machinery, Petroleum and Mineral Products could not be

122
investigated separately due to small number of observations. Therefore industrial sectors with small
no of companies were merged as miscellaneous.
The scope of research has been kept limited to non-financial sector. Financial sector has not
been included in this investigation due to fundamental difference in nature of financial decisions and
regulatory requirements.
6.3 FUTURE RESEARCH
Research can be extended to investigate what other factors including corporate governance,
behavioral and financial factors impede the capital structure adjustment speed. The reason of
difference in adjustment speed across firms is also a significant dimension of capital structure
research. Research can also be further extended to explore that the convergence to target capital
structure is a mechanical process or is the deliberate choice of the firms and what behavioral,
economic and firm specific factors cause the deviation from the target capital structure.

123
REFERENCES
Afza, T., & Hussain, A. (2011). Determinants of Capital Structure across selected Manufacturing
sectors of Pakistan. International Journal of Humanities and Social Science, 1(12), 254-
262.
Agrawal, A. K., & Matsa, D. A. (2013). Labor unemployment risk and corporate financing
decisions. Journal of Financial Economics, 108(2), 449-470.
Aggarwal, R. (1981). International differences in capital structure norms: An empirical study of large
European companies. Management International Review, 21(1), 75-88.
Agrawal, A., & Mandelker, G. N. (1987). Managerial incentives and corporate investment and
financing decisions. Journal of Finance, 42(4), 823-837.
Ahmed, N., Ahmed, Z., & Ahmed, I. (2010). Determinants of Capital Structure: A Case of Life
Insurance Sector of Pakistan. European Journal of Economics Finance and Administrative
Sciences. 24(1), 7-12.
Ahmed, N., Ahmed, Z., & Ahmed, I. (2010). Determinants of capital structure: A case of life
insurance sector of Pakistan. European Journal of Economics, Finance and Administrative
Sciences, 24(1), 7-12.
Ahmed Sheikh, N., & Wang, Z. (2011). Determinants of capital structure: An empirical study of
firms in manufacturing industry of Pakistan. Managerial Finance, 37(2), 117-133.

124
Ahmad, H., Fida, B. A., & Zakaria, M. (2013). The co-determinants of capital structure and stock
returns: evidence from the Karachi stock exchange. The Lahore Journal of
Economics, 18(1), 81.
Ahmad, Y., & Zaman, G. (2013). Determinants of Capital Structure: A case for the Pakistani Textile
Composite Sector. Abasyn Journal of Social Sciences, 6(1), 91-10.
Alexander, D. (2006). Globalization of disaster: trends, problems and dilemmas. Journal of
International Affairs-Columbia University, 59(2), 1-22.
Al-Sakran, S. A. (2001). Leverage determinants in the absence of corporate tax system: the case of
non-financial publicly traded corporations in Saudi Arabia. Managerial Finance, 27(10), 58-
86.
Ali Ahmed, H. J., & Hisham, N. (2009). Revisiting capital structure theory: a test of pecking order
and static order trade-of model from Malaysian capital market. International research journal
of finance and economics, 30(1), 58-65.
Alti, A. (2006). How persistent is the impact of market timing on capital structure? The Journal of
Finance, 61(4), 1681-1710.

125
Amel, D., Barnes, C., Panetta, F., & Salleo, C. (2004). Consolidation and efficiency in the financial
sector: A review of the international evidence. Journal of Banking & Finance, 28(10), 2493-
2519.
Amihud, Y., &Mendelson, H. (2005).The liquidity route to a lower cost of capital. Journal of Applied
Corporate Finance, 12(4), 8-25.
Amidu, M. (2007). Determinants of capital structure of banks in Ghana: an empirical approach.
Baltic Journal of Management, 2(1), 67-79.
Amjed, S. (2007). The impact of financial structure on profitability: Study of Pakistan’s Textile
Sector. In Poster session presented at the Management of International Business and
Economic Systems Conference, Larissa, Greece. Available from Internet:
http://mibes.teilar.gr/proceedings/2007/poster/Amjed.pdf.
Anderson, R. (2002). Capital Structure, Firm Liquidity and Growth. National Bank of Belgium
Working Paper, (27).
Ang, J. S., Cole, R. A., & Lin, J. W. (2000). Agency costs and ownership structure. The Journal of
Finance, 55(1), 81-106.
Antonczyk, R. C., & Salzmann, A. J. (2014). Overconfidence and optimism: The effect of national
culture on capital structure. Research in International Business and Finance, 31(1), 132-151.

126
Antão, P., & Bonfim, D. (2014). The dynamics of capital structure decisions. Available at SSRN
2512249. http://dx.doi.org/10.2139/ssrn.2512249
Arif, M. (2007). Developing Bond Market in Pakistan. SBP Research Bulletin, 3(1), 26-58.
Aybar-Arias, C., Casino-Martínez, A., & López-Gracia, J. (2012). On the adjustment speed of SMEs
to their optimal capital structure. Small Business Economics, 39(4), 977-996.
Banerjee, S., Heshmati, A., & Wihlborg, C. (2000). The Dynamics of Capital Structure (No. 333).
Stockholm School of Economics.
Baker, M., & Wurgler, J. (2002).Market timing and capital structure. The Journal of Finance, 57(1),
1-32.
Bancel, F., & Mittoo, U. (2004). Cross-country determinants of capital structure choice: a survey of
European firms. Financial Management, 33(4), 103-132.
Barclay, M. J., & Smith, C. W. (2005). The capital structure puzzle: The evidence revisited. Journal
of Applied Corporate Finance, 17(1), 8-17.
Baron, D. P. (1974). Default risk, homemade leverage, and the Modigliani-Miller theorem. The
American economic review, 64(1), 176-182.

127
Beaver, W. H., & Ryan, S. G. (2000). Biases and lags in book value and their effects on the ability
of the book-to-market ratio to predict book return on equity. Journal of Accounting Research,
38(1), 127-148.
Bennett, M., & Donnelly, R. (1993). The determinants of capital structure: some UK evidence. The
British Accounting Review, 25(1), 43-59.
Berger, A. N., & Bonaccorsi di Patti, E. (2006). Capital structure and firm performance: A new
approach to testing agency theory and an application to the banking industry. Journal of
Banking & Finance, 30(4), 1065-1102.
Berger, A. N., DeYoung, R., Genay, H., & Udell, G. F. (2000). Globalization of financial
institutions: Evidence from cross-border banking performance. Brookings-Wharton papers on
financial services, 2000(1), 23-120.
Berger, A. N., & Udell, G. F. (2002). Small business credit availability and relationship lending: The
importance of bank organisational structure. The economic journal, 112(477), 32-53.
Bharath, S. T., Pasquariello, P., & Wu, G. (2009). Does asymmetric information drive capital
structure decisions?. Review of Financial Studies, 22(8), 3211-3243.
Binsbergen, V., Jules, H., GRAHAM, J. R., & YANG, J. (2010). The cost of debt. The Journal of
Finance, 65(6), 2089-2136.

128
Blouin, J., Core, J. E., & Guay, W. (2010). Have the tax benefits of debt been
overestimated?. Journal of Financial Economics, 98(2), 195-213.
Bogan, V. L. (2012). Capital structure and sustainability: An empirical study of microfinance
institutions. Review of Economics and Statistics, 94(4), 1045-1058.
Booth, L., Aivazian, V., Demirguc‐Kunt, A., & Maksimovic, V. (2002). Capital structures in
developing countries. The Journal of Finance, 56(1), 87-130.
Bokhari, H. W., & Khan, M. A. (2013). The Impact of Capital Structure on Firm’s Performance (A
case of Non-Financial Sector of Pakistan). European Journal of Business and
Management, 5(31), 111-137.
Boyle, G. W., & Eckhold, K. R. (1997). Capital structure choice and financial market liberalization:
evidence from New Zealand. Applied Financial Economics, 7(4), 427-437.
Bradley, M., Jarrell, G. A., & Kim, E. (1984). On the existence of an optimal capital structure:
Theory and evidence. The journal of Finance, 39(3), 857-878.
Brealey, R., Leland, H. E., & Pyle, D. H. (1977).Informational asymmetries, financial structure, and
financial intermediation. The journal of Finance, 32(2), 371-387.

129
Brennan, M. J. (1995). Corporate Finance Over the Past 25 Years. Financial Management, 24(2), 9-
22.
Brigham, E., & Houston, J. (2011). Fundamentals of financial management. Cengage Learning.
Brounen, D., De Jong, A., & Koedijk, K. (2004, March). Corporate finance in Europe confronting
theory with practice. In EFA 2004 Maastricht Meetings Paper (No. 2769).
Byoun, S. (2008). How and when do firms adjust their capital structures toward targets?.The Journal
of Finance, 63(6), 3069-3096.
Camara, O. (2012). Capital structure adjustment speed and macroeconomic conditions: US MNCs
and DCs. International research journal of finance and economics, 84(1), 106-120.
Castells, M. (2011). The rise of the network society: The information age: Economy, society, and
culture (Vol. 1). John Wiley & Sons.
Campello, M., & Giambona, E. (2013). Real assets and capital structure. Journal of Financial and
Quantitative Analysis, 48(05), 1333-1370.
Caselli, F., Esquivel, G., & Lefort, F. (1996). Reopening the convergence debate: a new look at
cross-country growth empirics. Journal of economic growth, 1(3), 363-389.
130
Chaganti, R., & Damanpour, F. (1991).Institutional ownership, capital structure, and firm
performance. Strategic Management Journal, 12(7), 479-491.
Chen, J. J. (2004). Determinants of capital structure of Chinese-listed companies. Journal of
Business research, 57(12), 1341-1351.
Cheng, B., Ioannou, I., & Serafeim, G. (2014). Corporate social responsibility and access to
finance. Strategic Management Journal, 35(1), 1-23.
Chirinko, R. S., &Singha, A. R. (2000).Testing static tradeoff against pecking order models of
capital structure: a critical comment. Journal of Financial Economics, 58(3), 417-425.
Chuhan, P., Claessens, S., & Mamingi, N. (1998). Equity and bond flows to Latin America and Asia:
the role of global and country factors. Journal of Development Economics, 55(2), 439-463
Cook, D. O., & Tang, T. (2010). Macroeconomic conditions and capital structure adjustment speed.
Journal of Corporate Finance, 16(1), 73-87.
Cox, J. C., Ingersoll Jr, J. E., & Ross, S. A. (1985). A theory of the term structure of interest
rates. Econometrica: Journal of the Econometric Society, 53(2), 385-407.
Delcoure, N. (2007). The determinants of capital structure in transitional economies. International
Review of Economics & Finance, 16(3), 400-415.
131
Deesomsak, R., Paudyal, K., & Pescetto, G. (2004). The determinants of capital structure: evidence
from the Asia Pacific region. Journal of Multinational Financial Management, 14(4), 387-405.
De Jong, A., Verbeek, M., & Verwijmeren, P. (2010).The impact of financing surpluses and large
financing deficits on tests of the pecking order theory. Financial Management, 39(2), 733-756.
DeAngelo, H., & Masulis, R. W. (1980).Optimal capital structure under corporate and personal
taxation. Journal of financial Economics, 8(1), 3-29.
DeAngelo, H., DeAngelo, L., & Stulz, R. M. (2010). Seasoned equity offerings, market timing, and
the corporate lifecycle. Journal of Financial Economics, 95(3), 275-295.
Desai, M. A., Foley, C. F., & Hines, J. R. (2004). A multinational perspective on capital structure
choice and internal capital markets. The Journal of Finance, 59(6), 2451-2487.
Degryse, H., de Goeij, P., & Kappert, P. (2012). The impact of firm and industry characteristics on
small firms’ capital structure. Small Business Economics, 38(4), 431-447.
Desai, M. A., Foley, C. F., & Hines, J. R. (2004). A multinational perspective on capital structure
choice and internal capital markets. The Journal of Finance, 59(6), 2451-2487.
Dieffenbach, B. C. (1975). A quantitative theory of risk premiums on securities with an application
to the term structure of interest rates. Econometrica: Journal of the Econometric Society, 431-
454.

132
Donaldson, G. (1961), Corporate Debt Capacity, Harvard University Press, 1961.
Drobetz, W., &Wanzenried, G. (2006). What determines the speed of adjustment to the target capital
structure? .Applied Financial Economics, 16(13), 941-958.
Dudley, E. (2007). Testing models of dynamic trade off theory. Available at SSRN 1030119.
Elkamhi, R., Ericsson, J., & Parsons, C. A. (2012). The cost and timing of financial distress. Journal
of Financial Economics, 105(1), 62-81.
Elsas, R., Flannery, M. J., & Garfinkel, J. A. (2014). Financing major investments: information about
capital structure decisions. Review of Finance,18(4), 1341-1386.
Eriotis, N., Vasiliou, D., & Ventoura-Neokosmidi, Z. (2007). How firm characteristics affect capital
structure: an empirical study. Managerial Finance, 33(5), 321-331.
Fama, E. F., & French, K. R. (2002).Testing trade‐off and pecking order predictions about dividends
and debt. Review of financial studies, 15(1), 1-33.
Fan, J. P., Wei, K. J., & Xu, X. (2011). Corporate finance and governance in emerging markets: A
selective review and an agenda for future research. Journal of Corporate Finance, 17(2), 207-
214.

133
Fan, J. P., Titman, S., & Twite, G. (2012). An international comparison of capital structure and debt
maturity choices. Journal of Financial and quantitative Analysis, 47(01), 23-56.
Faulkender, M., Flannery, M. J., Hankins, K. W., & Smith, J. M. (2008, January). Do adjustment
costs impede the realization of target capital structure. In AFA 2008 New Orleans Meetings
Paper.
Feld, L. P., Heckemeyer, J. H., & Overesch, M. (2013). Capital structure choice and company
taxation: A meta-study. Journal of Banking & Finance, 37(8), 2850-2866.
Fernandez, P. (2013). Optimal capital structure: Problems with the Harvard and Damodaran
Approaches. Available at SSRN 270833.
Fischer, E. O., Heinkel, R., & Zechner, J. (1989). Dynamic capital structure choice: Theory and tests.
The Journal of Finance, 44(1), 19-40.
Flannery, M. J., & Rangan, K. P. (2006). Partial adjustment toward target capital structures. Journal
of Financial Economics, 79(3), 469-506.
Flannery, M., & Hankins, K. (2007).A theory of capital structure adjustment speed. Unpublished
manuscript, University of Florida.

134
Flannery, M. J., & Hankins, K. W. (2013). Estimating dynamic panel models in corporate
finance. Journal of Corporate Finance, 19(1), 1-19.
Frank, M. Z., & Goyal, V. K. (2003).Testing the pecking order theory of capital structure. Journal
of Financial Economics, 67(2), 217-248.
Frank, M. Z., & Goyal, V. K. (2009). Capital structure decisions: which factors are reliably
important? Financial Management, 38(1), 1-37.
Gaud, P., Jani, E., Hoesli, M., & Bender, A. (2005). The capital structure of Swiss companies: an
empirical analysis using dynamic panel data. European Financial Management, 11(1), 51-69.
Galai, D., & Masulis, R. W. (1976).The option pricing model and the risk factor of stock. Journal of
Financial economics, 3(1), 53-81.
Getzmann, A., Lang, S., & Spremann, K. (2010). Determinants of the target capital structure and
adjustment speed–evidence from Asian capital markets. In European Financial Management
Symposium.
Ghosh, A., & Cai, F. (2004). Optimal Capital Structure Vs. Pecking Order Theory: A Further Test.
Journal of Business & Economics Research (JBER), 2(8), 1-13.
Graham, J. R., & Harvey, C. R. (2001). The theory and practice of corporate finance: Evidence from
the field. Journal of financial economics, 60(2), 187-243.

135
Graham, J. R., & Tucker, A. L. (2006).Tax shelters and corporate debt policy. Journal of Financial
Economics, 81(3), 563-594.
Graham, J. R., & Leary, M. T. (2011). A Review of Empirical Capital Structure Research and
Directions for the Future. Annual Review of Financial Economics,3(1), 309-345.
Grinblatt, M., & Titman, S. (2002). Financial markets and corporate strategy (Vol. 2). McGraw-
Hill/Irwin.
Gul, F. A. (1999).Growth opportunities, capital structure and dividend policies in Japan. Journal of
Corporate Finance, 5(2), 141-168.
Haas, R., & Peeters, M. (2006).The dynamic adjustment towards target capital structures of firms in
transition economies*.Economics of Transition, 14(1), 133-169.
Hackbarth, D., Miao, J., & Morellec, E. (2006). Capital structure, credit risk, and macroeconomic
conditions. Journal of Financial Economics, 82(3), 519-550.
Hall, G. C., Hutchinson, P. J., & Michaelas, N. (2004).Determinants of the capital structures of
European SMEs. Journal of Business Finance & Accounting, 31(5), 711-728.
136
Halling, M., Yu, J., & Zechner, J. (2014, November). Leverage dynamics over the business cycle.
In AFA 2012 Chicago Meetings Paper.
Halov, N., & Heider, F. (2011). Capital structure, risk and asymmetric information. The Quarterly
Journal of Finance, 1(04), 767-809.
Hart, O., & Zingales, L. (2011). A new capital regulation for large financial institutions. American
Law and Economics Review, 13(2), 453-490.
Huang, R., & Ritter, J. R. (2009). Testing theories of capital structure and estimating the speed of
adjustment. Journal of Financial and Quantitative analysis, 44(02), 237-271.
He, Z. (2011). A model of dynamic compensation and capital structure. Journal of Financial
Economics, 100(2), 351-366.
Helwege, J., & Liang, N. (1996). Is there a pecking order? Evidence from a panel of IPO firms.
Journal of Financial Economics, 40(3), 429-458.
Hennessy, C. A., & Whited, T. M. (2005).Debt dynamics. The Journal of Finance, 60(3), 1129-
1165.
Hirshleifer, J. (1966). Investment decision under uncertainty: Applications of the state-preference
approach. The Quarterly Journal of Economics, 80(2), 252-277.

137
Hijazi, S., & Tariq, Y. (2006). Determinants of capital structure: A case for Pakistani cement
industry. Lahore Journal of Economics, 11(1), 63-80.
Hochman, S., & Palmon, O. (1985).The Impact of Inflation on the Aggregate Debt‐Asset Ratio. The
Journal of Finance, 40(4), 1115-1125.
Hopwood, A. G. (1972). An empirical study of the role of accounting data in performance evaluation.
Journal of accounting research, 10(1), 156-182.
Hoshi, T., Kashyap, A., & Scharfstein, D. (1991). Corporate structure, liquidity, and investment:
Evidence from Japanese industrial groups. The Quarterly Journal of Economics, 106(1), 33-
60.
Hovakimian, A., Opler, T., & Titman, S. (2001).The debt-equity choice.Journal of Financial and
Quantitative analysis, 36(1), 1-24.
Hovakimian, A., & Li, G. (2011). In search of conclusive evidence: How to test for adjustment to
target capital structure. Journal of Corporate Finance,17(1), 33-44.
Hovakimian, A., Hovakimian, G., & Tehranian, H. (2004). Determinants of target capital structure:
The case of dual debt and equity issues. Journal of Financial Economics, 71(3), 517-540.

138
Hovenkamp, H. J. (2009). Neoclassicism and the Separation of Ownership and Control. Virginia
Law & Business Review, 4(1), 373-373.
Haque, N. U. (1997). Financial market reform in Pakistan. The Pakistan Development Review, 839-
854.
Huang, G., & Song, F. M. (2006). The determinants of capital structure: Evidence from China. China
Economic Review, 17(1), 14-36.
Huang, R., & Ritter, J. R. (2005).Testing the market timing theory of capital structure. Journal of
Financial and Quantitative Analysis. Working paper:
http://citeseerx.ist.psu.edu/viewdoc/summary?doi=10.1.1.458.7199
Huang, R., & Ritter, J. R. (2009). Testing theories of capital structure and estimating the speed of
adjustment. Journal of Financial and Quantitative analysis, 44(02), 237-271.
Ittner, C. D., Larcker, D. F., & Randall, T. (2003).Performance implications of strategic performance
measurement in financial services firms. Accounting, Organizations and Society, 28(7), 715-
741.
Ilyas, J. (2008). The determinants of capital structure: Analysis of non-financial firms listed in
Karachi stock exchange in Pakistan. Journal of Managerial Sciences, 2(2), 279-307.

139
Jalilvand, A., & Harris, R. S. (1984). Corporate behavior in adjusting to capital structure and
dividend targets: An econometric study. The Journal of Finance, 39(1), 127-145.
Jensen, M. C., & Meckling, W. H. (1976). Theory of the firm: Managerial behavior, agency costs
and ownership structure. Journal of financial economics, 3(4), 305-360.
Jõeveer, K. (2013). What do we know about the capital structure of small firms?. Small Business
Economics, 41(2), 479-501.
Ju, N., Parrino, R., Poteshman, A. M., & Weisbach, M. S. (2005). Horses and rabbits? Trade-off
theory and optimal capital structure. Journal of Financial and Quantitative Analysis, 40(2),
259-281.
Kayhan, A., & Titman, S. (2007). Firms’ histories and their capital structures. Journal of Financial
Economics, 83(1), 1-32.
Kayo, E. K., & Kimura, H. (2011). Hierarchical determinants of capital structure. Journal of Banking
& Finance, 35(2), 358-371.
Khalid, S. (2010). Financial reforms and dynamics of capital structure choice: a case of publically
listed firms of Pakistan. Available at SSRN 1653177.
http://dx.doi.org/10.2139/ssrn.1653177

140
Khan, A. G. (2012). The relationship of capital structure decisions with firm performance: A study
of the engineering sector of Pakistan. International Journal of Accounting and Financial
Reporting, 2(1), 230-245.
Klein, L. S., O’Brien, T. J., & Peters, S. R. (2002). Debt vs. equity and asymmetric information: A
review. Financial Review, 37(3), 317-349.
Kim, M. K., & Wu, C. (1988).Effects of inflation on capital structure. Financial Review, 23(2), 183-
200.
Korajczyk, R. A., Lucas, D. J., & McDonald, R. L. (1992). Equity issues with time-varying
asymmetric information. Journal of Financial and Quantitative Analysis, 27(03), 397-417.
Korajczyk, R. A., & Levy, A. (2003). Capital structure choice: macroeconomic conditions and
financial constraints. Journal of Financial Economics, 68(1), 75-109.
Korteweg, A. (2010). The net benefits to leverage. The Journal of Finance,65(6), 2137-2170.
Kothari, S. P., & Shanken, J. (1997). Book-to-market, dividend yield, and expected market returns:
A time-series analysis. Journal of Financial Economics, 44(2), 169-203.
Kraus, A., & Litzenberger, R. H. (1973).A STATE‐PREFERENCE MODEL OF OPTIMAL
FINANCIAL LEVERAGE. The Journal of Finance, 28(4), 911-922.

141
Leary, M. T., & Roberts, M. R. (2005). Do firms rebalance their capital structures? The Journal of
Finance, 60(6), 2575-2619.
Lee, K..l and Kwok, C.C.Y.( 1988.) Multinational Corporations vs. Domestic Corporations:
International Environmental Factors and Determinants of Capital Structure Journal of
International Business Studies,19( 2), 195-217,
Leland, H. E. (1994). Corporate debt value, bond covenants, and optimal capital structure.The
journal of finance, 49(4), 1213-1252.
Levy, A., & Hennessy, C. (2007). Why does capital structure choice vary with macroeconomic
conditions? Journal of Monetary Economics, 54(6), 1545-1564.
Lemmon, M. L., & Zender, J. F. (2010). Debt Capacity and Tests of Capital Structure
Theories. Journal of Financial and Quantitative Analysis, 45(05), 1161-1187.
Lewellen, W. G., & Mauer, D. C. (1988).Tax options and corporate capital structures. Journal of
financial and quantitative analysis, 23(04), 387-400.
Lipson, M. L., & Mortal, S. (2009). Liquidity and capital structure. Journal of Financial Markets,
12(4), 611-644.

142
Low, P. Y., & Chen, K. H. (2004). Diversification and capital structure: Some international evidence.
Review of Quantitative Finance and Accounting, 23(1), 55-71.
Lucas, D. J., & McDonald, R. L. (1990). Equity issues and stock price dynamics. The journal of
finance, 45(4), 1019-1043.
Maddison, A. (2013). Economic progress and policy in developing countries. Routledge.
Margaritis, D., & Psillaki, M. (2007). Capital structure and firm efficiency. Journal of Business
Finance & Accounting, 34(9‐10), 1447-1469.
Matsa, D. A. (2010). Capital structure as a strategic variable: Evidence from collective
bargaining. The Journal of Finance, 65(3), 1197-1232
Mauer, D. C., & Ott, S. H. (2000). Agency costs, underinvestment, and optimal capital structure:
The effect of growth options to expand. Project Flexibility, Agency, and Competition (Oxford
University Press, Oxford).
Mauer, D. C., & Sarkar, S. (2005). Real options, agency conflicts, and optimal capital
structure. Journal of banking & Finance, 29(6), 1405-1428.
Memon, F., Bhutto, N. A., & Abbas, G. (2012). Capital structure and firm performance: a case of
textile sector of Pakistan. Asian Journal of Business and Management Sciences, 1(9), 09-15.

143
Miao, J. (2005). Optimal capital structure and industry dynamics. The Journal of finance, 60(6),
2621-2659.
Michaelas, N., Chittenden, F., & Poutziouris, P. (1999). Financial policy and capital structure choice
in UK SMEs: Empirical evidence from company panel data. Small Business Economics, 12(2),
113-130.
Miles, D., Yang, J., & Marcheggiano, G. (2013). Optimal Bank Capital*. The Economic
Journal, 123(567), 1-37.
Miller, M. H. (1977). DEBT AND TAXES. the Journal of Finance, 32(2), 261-275.
Milne, F. (1981). The firm's objective function as a collective choice problem. Public Choice, 37(3),
473-486.
Morellec, E. (2001). Asset liquidity, capital structure, and secured debt. Journal of Financial
Economics, 61(2), 173-206.
Modigliani, F., & Miller, M. H. (1958).The cost of capital, corporation finance and the theory of
investment. The American economic review, 48(3), 261-297.
Modigliani, F., & Miller, M. H. (1963). Corporate income taxes and the cost of capital: a correction.
The American Economic Review,53(3), 433-443.

144
Molina, C. A., & Preve, L. A. (2012). An empirical analysis of the effect of financial distress on
trade credit. Financial Management, 41(1), 187-205.
Mukherjee, S., & Mahakud, J. (2010). Dynamic adjustment towards target capital structure: evidence
from Indian companies. Journal of Advances in Management Research, 7(2), 250-266.
Mukherjee, T., & Wang, W. (2013). Capital Structure Deviation and Speed of Adjustment. Financial
Review, 48(4), 597-615.
Mumtaz, R., Rauf, S. A., Ahmed, B., & Noreen, U. (2013). Capital structure and financial
performance: Evidence from Pakistan (Kse 100 Index). Journal of Basic and Applied
Scientific Research, 3(4), 113-119.
Myers, S. C., & Majluf, N. S. (1984). Corporate financing and investment decisions when firms have
information that investors do not have. Journal of financial economics, 13(2), 187-221.
Myers, S. C. (2001). Capital structure. Journal of Economic perspectives, 15(2), 81-102.
Nishat, M. (2012). Financial Reforms and Corporate Finance in Emerging Markets: An Analysis of
Dividend Policy among Public Listed Firms in Pakistan. IBA Business Review, 7(1), 54-63.
Nivorozhkin, E. (2004). The dynamics of capital structure in transition economies. Economics of
Planning, 37(1), 25-45.

145
Noguera Santaella, J. (2001). Inflation and Capital structure. CERGE-EI Working Paper, (180).
http://papers.ssrn.com/sol3/papers.cfm?abstract_id=1514470
Ooi, J. (1999). The determinants of capital structure Evidence on UK property companies. Journal
of Property Investment & Finance, 17(5), 464-480.
Ozkan, A. (2001). Determinants of capital structure and adjustment to long run target: evidence from
UK company panel data. Journal of Business Finance & Accounting, 28(1‐2), 175-198.
Öztekin, Ö., & Flannery, M. J. (2012). Institutional determinants of capital structure adjustment
speeds. Journal of financial economics, 103(1), 88-112.
Pasiouras, F., Tanna, S., & Zopounidis, C. (2009). The impact of banking regulations on banks' cost
and profit efficiency: Cross-country evidence. International Review of Financial Analysis,
18(5), 294-302.
Peng, M. W., Wang, D. Y., & Jiang, Y. (2008). An institution-based view of international business
strategy: A focus on emerging economies. Journal of International Business Studies, 39(5),
920-936.

146
Prasad, E., Rogoff, K., Wei, S. J., & Kose, M. A. (2003). Effects of financial globalisation on
developing countries: Some empirical evidence. Economic and Political Weekly, 38(41) 4319-
4330.
Qiu, M., & La, B. (2010).Firm characteristics as determinants of capital structures in Australia.
International Journal of the Economics of Business, 17(3), 277-287.
Rafiq, M., Iqbal, A., & Atiq, M. (2008). The determinants of capital structure of the chemical
industry in Pakistan. The Lahore Journal of Economics, 13(1), 139-158.
Rajan, R. G., & Zingales, L. (1995). What do we know about capital structure? Some evidence from
international data. The journal of Finance, 50(5), 1421-1460.
Rampini, A. A., & Viswanathan, S. (2013). Collateral and capital structure. Journal of Financial
Economics, 109(2), 466-492.
Raza, M. Wajid. (2013). Effect of financial leverage on firm performance. Empirical evidence from
Karachi Stock Exchange. (working paper)
Richard, S. F. (1978). An arbitrage model of the term structure of interest rates. Journal of Financial
Economics, 6(1), 33-57.

147
Romano, C. A., Tanewski, G. A., & Smyrnios, K. X. (2001). Capital structure decision making: A
model for family business. Journal of Business Venturing,16(3), 285-310.
Ross, S. A. (1977). The determination of financial structure: the incentive-signalling approach. The
Bell Journal of Economics, 8(3), 23-40.
Rubinstein, M. (2003). Great moments in financial economics: I. Present Value. Journal of
Investment Management, 11(1), 7-13.
Sadeghian, N. S., Latifi, M. M., Soroush, S., & Aghabagher, Z. T. (2012). Debt Policy and Corporate
Performance: Empirical Evidence from Tehran Stock Exchange Companies. International
Journal of Economics and Finance, 4(11), 217-226.
Sánchez-Vidal, J., & Martín-Ugedo, J. F. (2005).Financing preferences of Spanish firms: evidence
on the pecking order theory. Review of Quantitative Finance and Accounting, 25(4), 341-355.
Saeed, R. B. A., & Badar, R. (2013). Impact of capital structure on performance empirical evidence
from sugar sector of Pakistan. European Journal of Business and Management, 5(5), 78-
86.
Saleem, F., Rafique, B., Mehmood, Q., Irfan, M., Saleem, R., Tariq, S., & Akram, G. (2013). The
determination of capital structure of oil and gas firms listed on Karachi stock exchange in
Pakistan. Interdisciplinary journal of contemporary research in business, 4(9), 225.

148
Scott Jr, J. H. (1976). A theory of optimal capital structure. The Bell Journal of Economics, 7(1), 33-
54.
Shah, A., Hijazi, T., & Javed, A. Y. (2004). The Determinants of Capital Structure of Stock
Exchange-listed Non-financial Firms in Pakistan. The Pakistan Development Review, 43(4),
605-618.
Shah, S. A. (2007). Corporate Debt Policy—Pre-and Post-financial Market Reforms: The Case of
the Textile Industry of Pakistan. The Pakistan Development Review, 46(4), 465-478.
Shah, A., & Khan, S. (2007). Determinants of capital structure: Evidence from Pakistani panel data.
International Review of Business Research Papers, 3(4), 265-282.
Shaheen, S., & Malik, Q. A. (2012). The impact of capital intensity, size of firm and profitability on
debt financing in textile industry of Pakistan. Interdisciplinary Journal of Contemporary
Research in Business, 3(10), 1061-1066.
Sheikh, N. A., & Qureshi, M. A. (2014). Crowding-out or shying-away: impact of corporate income
tax on capital structure choice of firms in Pakistan. Applied financial economics, 24(19),
1249-1260.
Sheikh, N. A., & Wang, Z. (2011). Determinants of capital structure: An empirical study of firms in
manufacturing industry of Pakistan. Managerial Finance, 37(2), 117-133.

149
Shivdasani, A., & Zenner, M. (2005). How To Choose a Capital Structure: Navigating the Debt‐
Equity Decision. Journal of Applied Corporate Finance, 17(1), 26-35.
Shyam-Sunder, L., & C Myers, S. (1999). Testing static tradeoff against pecking order models of
capital structure. Journal of financial economics, 51(2), 219-244.
Sibilkov, V. (2009).Asset liquidity and capital structure. Journal of Financial and Quantitative
Analysis, 44(05), 1173-1196.
Sloan, R. (1996). Do stock prices fully reflect information in accruals and cash flows about future
earnings?(Digest summary). Accounting review,71(3), 289-315.
Stieglitz, J. E. (1969). A re-examination of the Modigliani-Miller theorem. The American Economic
Review,59(5) 784-793.
Strebulaev, I. A. (2007). Do tests of capital structure theory mean what they say? The Journal of
Finance, 62(4), 1747-1787.
Sudarsanam, S., & Lai, J. (2001). Corporate financial distress and turnaround strategies: An
empirical analysis. British Journal of Management, 12(3), 183-199.
Sundaresan, S., Wang, N., & Yang, J. (2015). Dynamic investment, capital structure, and debt
overhang. Review of Corporate Finance Studies, 4(1), 1-42.

150
Stewart C. Mayer. (2001). Capital Structure. Journal of economic perspectives, 15(2), 81-102.
Titman, S. (2002). The Modigliani and Miller theorem and the integration of financial markets.
Financial Management, 31(1), 101-115.
Titman, S., & Tsyplakov, S. (2007).A dynamic model of optimal capital structure. Review of
Finance, 11(3), 401-451.
Titman, S., & Wessels, R. (1988). The determinants of capital structure choice. The Journal of
Finance, 43(1), 1-19.
Voutsinas, K., & Werner, R. A. (2011). Credit supply and corporate capital structure: Evidence from
Japan. International Review of Financial Analysis, 20(5), 320-334.
Wagner, Nancy & Iakova, Dora. (2001) Financial Sector Evolution in the Central European
Economies: Challenges in Supporting Macroeconomic Stability and Sustainable Growth
(September 2001). IMF Working Paper, Available at SSRN: http://ssrn.com/abstract=879935
Wald, J. K. (1999). How firm characteristics affect capital structure: an international comparison.
Journal of Financial Research, 22(2), 161-187.
Weston, J. F. (1955). Toward theories of financial policy. The Journal of Finance, 10(2), 130-143.

151
Williams, J. B. (1938). The Theory of Investment Value, by John Burr Williams. Mass. Cambridge,
MA: Harvard University Press.
Yang, B. (2013). Dynamic capital structure with heterogeneous beliefs and market timing. Journal
of Corporate Finance, 22(1), 254-277.
Zeitun, R., &Tian, G. G. (2007). Capital structure and corporate performance: evidence from Jordan.
Australasian Accounting Business and Finance Journal, 1(4), 3.
Zhao, T., &Susmel, R. (2008).Testing the trade-off theory of capital structure: a Kalman Filter
approach. Available at SSRN 1303209. http://ssrn.com/abstract=1303209 or
http://dx.doi.org/10.2139/ssrn.1303209
Zoppa, A., & McMahon, R. G. (2002). Pecking order theory and the financial structure of
manufacturing SMEs from Australia’s business longitudinal survey. Small Enterprise
Research, 10(2), 23-41.

152
APPENDIX-I
DESCRIPTION OF ANNUAL DATA
The following three tables depict the annual mean values, median and standard deviation of the
dependent and independent variables over the period of study. Highest Return on asset in the year
2004
Table A- Annaul Accounting Data Summary Statistics precious
SIZE ROA CVA FSIR
Year Mean Med S.D Mean Med S.D Mean Med S.D Mean Med S.D
1999 3.077 3.060 0.586 6.503 9.400 26.375 0.546 0.555 0.181 10.521 9.900 4.805
2000 3.104 3.038 0.585 7.003 7.100 26.496 0.588 0.595 0.176 9.828 9.900 5.382
2001 3.178 3.136 0.575 8.138 7.900 27.170 0.580 0.582 0.169 10.579 11.100 5.167
2002 3.128 3.045 0.581 6.671 8.500 35.236 0.573 0.579 0.189 9.831 9.900 5.374
2003 3.087 2.983 0.585 7.926 5.250 32.274 0.581 0.599 0.186 10.058 9.100 5.968
2004 3.098 3.068 0.605 11.342 7.500 29.049 0.569 0.579 0.177 10.312 9.900 5.235
2005 3.216 3.118 0.662 6.668 7.350 25.374 0.569 0.585 0.179 10.263 9.900 5.179
2006 3.036 2.978 0.573 7.795 5.800 26.652 0.565 0.571 0.181 10.992 11.100 5.384
2007 3.130 3.017 0.608 6.591 6.350 29.671 0.568 0.579 0.178 11.374 9.900 5.931
2008 3.127 3.085 0.547 6.170 5.600 30.955 0.518 0.512 0.169 10.445 9.900 5.205
2009 3.104 3.220 0.530 7.768 8.300 31.363 0.558 0.570 0.180 11.616 11.200 6.355
2010 3.110 3.351 0.570 5.330 6.125 30.577 0.540 0.557 0.177 12.340 10.496 5.920
2011 3.190 3.051 0.568 4.540 5.949 30.815 0.560 0.555 0.177 12.760 10.552 5.998
GRTH NDTS SPTF STS
Year Mean Med S.D Mean Med S.D Mean Med S.D Mean Med S.D
1999 11.445 10.300 31.606 4.155 4.020 1.424 0.307 0.265 0.190 0.952 0.936 0.391
2000 10.944 9.600 32.528 4.225 3.993 1.623 0.292 0.251 0.175 0.892 0.911 0.371
2001 13.792 11.900 34.055 4.161 3.946 1.512 0.277 0.250 0.170 0.942 0.932 0.408
2002 7.581 7.200 37.710 4.110 3.899 1.629 0.305 0.272 0.183 0.919 0.905 0.430
2003 8.663 6.600 28.833 4.124 3.891 1.662 0.317 0.252 0.211 0.928 0.933 0.426
2004 14.527 10.000 35.101 4.222 3.999 1.651 0.304 0.278 0.181 0.925 0.894 0.400
2005 13.054 11.150 28.378 4.142 3.866 1.615 0.321 0.243 0.211 0.899 0.898 0.371
2006 11.461 6.800 36.594 4.202 3.944 1.632 0.323 0.272 0.200 0.889 0.875 0.403
2007 7.334 6.550 29.712 4.180 3.894 1.668 0.315 0.246 0.203 0.860 0.851 0.373
2008 11.414 7.850 33.656 3.895 3.822 1.445 0.319 0.270 0.199 0.982 1.004 0.370
2009 8.315 11.400 36.501 4.093 3.863 1.415 0.317 0.276 0.183 0.862 0.887 0.342
2010 9.630 8.279 33.876 4.560 3.836 1.320 0.310 0.267 0.190 0.780 0.900 0.410
2011 10.440 8.154 33.996 4.210 3.822 1.370 0.320 0.268 0.203 0.820 0.928 0.400

153
CDA LDA TDA
Year Mean Med S.D Mean Med S.D Mean Med S.D
1999 0.228 0.013 0.174 0.183 0.175 0.123 0.670 0.013 0.695 2000 0.200 0.011 0.160 0.216 0.194 0.127 0.622 0.012 0.626 2001 0.362 0.014 0.386 0.201 0.189 0.120 0.618 0.012 0.621 2002 0.402 0.013 0.418 0.212 0.180 0.146 0.631 0.012 0.643 2003 0.397 0.014 0.405 0.201 0.172 0.137 0.632 0.013 0.662 2004 0.396 0.013 0.396 0.184 0.187 0.124 0.644 0.012 0.647 2005 0.416 0.013 0.420 0.200 0.190 0.123 0.641 0.012 0.672 2006 0.413 0.013 0.427 0.182 0.146 0.128 0.650 0.012 0.686 2007 0.372 0.012 0.378 0.193 0.130 0.130 0.656 0.012 0.679 2008 0.413 0.013 0.430 0.214 0.139 0.120 0.667 0.012 0.679 2009 0.395 0.014 0.417 0.166 0.132 0.122 0.674 0.012 0.703 2010 0.459 0.013 0.490 0.185 0.131 0.125 0.665 0.012 0.693 2011 0.475 0.013 0.511 0.184 0.125 0.124 0.669 0.012 0.698

154
APPENDIX-II
Graphical presentation of historical values of the variables.
0
2
4
6
8
10
12
1999 2000 2001 2002 2003 2004 2005 2006 2007 2008 2009 2010 2011
ROA
3
3.05
3.1
3.15
3.2
3.25
1999 2000 2001 2002 2003 2004 2005 2006 2007 2008 2009 2010 2011
Axis Title
Size

155
0
2
4
6
8
10
12
14
1999 2000 2001 2002 2003 2004 2005 2006 2007 2008 2009 2010 2011
FSIR
FSIR
0
2
4
6
8
10
12
14
16
1999 2000 2001 2002 2003 2004 2005 2006 2007 2008 2009 2010 2011
GRTH
GRTH

156
3.4
3.6
3.8
4
4.2
4.4
4.6
4.8
1999 2000 2001 2002 2003 2004 2005 2006 2007 2008 2009 2010 2011
NDTS
NDTS
0
0.2
0.4
0.6
0.8
1
1.2
1999 2000 2001 2002 2003 2004 2005 2006 2007 2008 2009 2010 2011
STS
STS

157
0.25
0.26
0.27
0.28
0.29
0.3
0.31
0.32
0.33
1999 2000 2001 2002 2003 2004 2005 2006 2007 2008 2009 2010 2011
SPTF
SPTF
0
0.05
0.1
0.15
0.2
0.25
0.3
0.35
0.4
0.45
0.5
1999 2000 2001 2002 2003 2004 2005 2006 2007 2008 2009 2010 2011
CDA
CDA

158
0
0.05
0.1
0.15
0.2
0.25
1999 2000 2001 2002 2003 2004 2005 2006 2007 2008 2009 2010 2011
LDA
LDA
0.59
0.6
0.61
0.62
0.63
0.64
0.65
0.66
0.67
0.68
1999 2000 2001 2002 2003 2004 2005 2006 2007 2008 2009 2010 2011
Axi
s Ti
tle
TDA
TDA
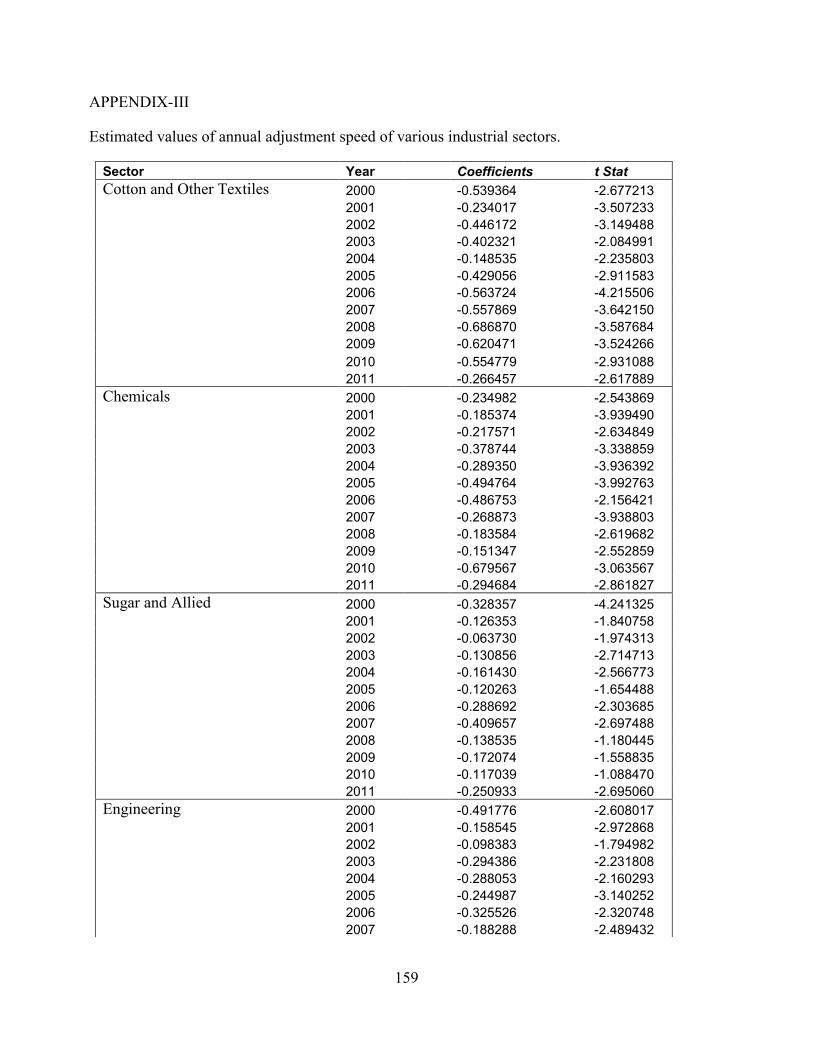
159
APPENDIX-III
Estimated values of annual adjustment speed of various industrial sectors.
Sector Year Coefficients t Stat
Cotton and Other Textiles 2000 -0.539364 -2.677213
2001 -0.234017 -3.507233
2002 -0.446172 -3.149488
2003 -0.402321 -2.084991
2004 -0.148535 -2.235803
2005 -0.429056 -2.911583
2006 -0.563724 -4.215506
2007 -0.557869 -3.642150
2008 -0.686870 -3.587684
2009 -0.620471 -3.524266
2010 -0.554779 -2.931088
2011 -0.266457 -2.617889
Chemicals 2000 -0.234982 -2.543869
2001 -0.185374 -3.939490
2002 -0.217571 -2.634849
2003 -0.378744 -3.338859
2004 -0.289350 -3.936392
2005 -0.494764 -3.992763
2006 -0.486753 -2.156421
2007 -0.268873 -3.938803
2008 -0.183584 -2.619682
2009 -0.151347 -2.552859
2010 -0.679567 -3.063567
2011 -0.294684 -2.861827
Sugar and Allied 2000 -0.328357 -4.241325
2001 -0.126353 -1.840758
2002 -0.063730 -1.974313
2003 -0.130856 -2.714713
2004 -0.161430 -2.566773
2005 -0.120263 -1.654488
2006 -0.288692 -2.303685
2007 -0.409657 -2.697488
2008 -0.138535 -1.180445
2009 -0.172074 -1.558835
2010 -0.117039 -1.088470
2011 -0.250933 -2.695060
Engineering 2000 -0.491776 -2.608017
2001 -0.158545 -2.972868
2002 -0.098383 -1.794982
2003 -0.294386 -2.231808
2004 -0.288053 -2.160293
2005 -0.244987 -3.140252
2006 -0.325526 -2.320748
2007 -0.188288 -2.489432
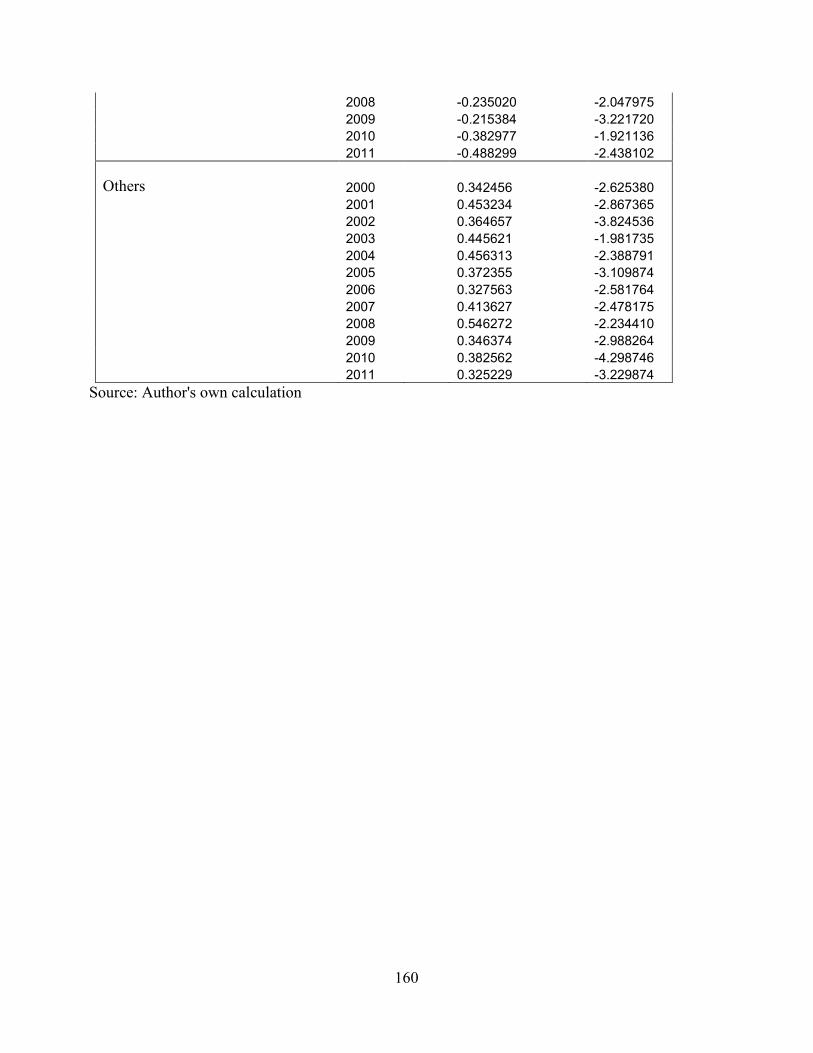
160
2008 -0.235020 -2.047975
2009 -0.215384 -3.221720
2010 -0.382977 -1.921136
2011 -0.488299 -2.438102
Others 2000
0.342456
-2.625380
2001 0.453234 -2.867365
2002 0.364657 -3.824536
2003 0.445621 -1.981735
2004 0.456313 -2.388791
2005 0.372355 -3.109874
2006 0.327563 -2.581764
2007 0.413627 -2.478175
2008 0.546272 -2.234410
2009 0.346374 -2.988264
2010 0.382562 -4.298746
2011 0.325229 -3.229874
Source: Author's own calculation

161
APPENDIX-IV
The following graphs show the Kernel Density of the individual variables. The graphs depicts that
none of the variable has serious distribution problem. Almost all the variables are normally
distributed. Normal distribution is one of most basic assumption of the regression. Spontaneous
finance and Long term Debt to Asset is little skewed to the right tail of the distribution hence within
the acceptable range.

162

163
0
1
2
3
4
-.2 .0 .2 .4 .6 .8
Den
sity
LDA
.0
.2
.4
.6
.8
1 2 3 4 5 6
Den
sity
SIZE
.000
.005
.010
.015
.020
.025
.030
-200 -100 0 100 200 300
Den
sity
ROA
0.0
0.5
1.0
1.5
2.0
2.5
-0.2 0.0 0.2 0.4 0.6 0.8 1.0 1.2
Den
sity
CVA
.00
.02
.04
.06
.08
.10
-10 0 10 20 30 40
Den
sity
FSIR
.000
.005
.010
.015
.020
-200 -100 0 100 200 300
Den
sity
GRTH
.0
.1
.2
.3
.4
0 2 4 6 8 10 12
Den
sity
NDTS
0.0
0.4
0.8
1.2
1.6
2.0
2.4
2.8
-0.2 0.0 0.2 0.4 0.6 0.8 1.0 1.2
Den
sity
SPTF
0.0
0.4
0.8
1.2
1.6
-0.5 0.0 0.5 1.0 1.5 2.0 2.5
Den
sity
STS

164