dynamical modeling of trench retreat driven by the slab ... · dynamical modeling of trench retreat...
TRANSCRIPT
Earth Planets Space, 59, 65–74, 2007
Dynamical modeling of trench retreat driven by the slab interaction with themantle transition zone
Michio Tagawa, Tomoeki Nakakuki, and Fumiko Tajima
Department of Earth and Planetary Systems Science, Graduate School of Science, Hiroshima University,1-3-1 Kagami-yama, Higashi-Hiroshima, 739-8526, Japan
(Received April 14, 2006; Revised September 4, 2006; Accepted October 2, 2006; Online published March 21, 2007)
We present the 2-D self-consistent dynamical model of interactions of a subducting slab with the 410-km and660-km phase boundaries to further our understanding of the relation between the slab stagnation/penetration andthe trench migration. Our model takes into account freely-movable plate boundaries and the difference betweentensional and compressional yield strengths in the lithosphere. For the case in which the tensional strength isweaker than the compressional one, the negative buoyancy of the subducting slab produces extension of theoverriding lithosphere and, accordingly, the trench retreats. Interactions with the 410-km and 660-km phase-transition boundaries further promote the trench retreat, and the dip angle of the slab is substantially decreased.This enhances the resistance of the 660-km phase boundary against the slab penetration. Slab weakening causedby the grain-size reduction in the transition zone may result in a horizontally-lying slab and trench retreat.Key words: Subduction, tensional strength, trench retreat, grain-size reduction.
1. IntroductionSeismic tomography models visualize variable images of
subducted slabs (e.g., van der Hilst et al., 1991; Fukao et al.,1992; van der Hilst, 1995; Fukao et al., 2001); some stag-nate horizontally in the mantle transition zone and otherspenetrate into the lower mantle through the 660-km seismicdiscontinuity. It is suggested that slab deformation abovethe 660-km discontinuity is often accompanied by trench re-treat, i.e., backward migration of the slab (van der Hilst andSeno, 1993). Tajima and Grand (1998) propose a relation-ship between trench retreat and a stagnant slab in the north-west Pacific. The 660-km seismic discontinuity is thoughtto be a phase-transition boundary with a negative Clapeyronslope which acts as a barrier for subduction of a cold slab(e.g., Turcotte and Schubert, 1982; Christensen and Yuen,1984). On the other hand, Heuret and Lallemand (2005)summarized the tectonics of back-arc spreading and showeda relationship between the dynamics of the subducted slaband the overriding plate. Rollback of a gravitationally un-stable slab (e.g., Molnar and Atwater, 1978; Garfunkel etal., 1986) is still an important candidate of the mechanism.
The relationship between trench retreat and slab defor-mation has been studied in laboratory experiments with achemical boundary (e.g., Kincaid and Olson, 1987; Funi-ciello et al., 2003). Christensen (1996) and Cizkova et al.(2002) employed kinematic models in their numerical stud-ies. To investigate the effects of the trench migration onthe slab interaction with the transition zone, they imposeda priori velocities on the trench migration and the subduct-ing plate. Zhong and Gurnis (1995) concentrated their ef-
Copyright c© The Society of Geomagnetism and Earth, Planetary and Space Sci-ences (SGEPSS); The Seismological Society of Japan; The Volcanological Societyof Japan; The Geodetic Society of Japan; The Japanese Society for Planetary Sci-ences; TERRAPUB.
forts on constructing dynamical plate models of mantle con-vection with a rigid overriding plate motion. The resultingtrench migration was produced dynamically by rollback ofthe slab interacting with the 660-km phase boundary. Ennset al. (2005) studied the effects of viscosity stratification onslab migration under the condition of no overriding plate.However, back-arc extension driven by dynamical plate mo-tions has not been reproduced in previous numerical mod-els. Therefore, the dynamical relationship between the slabstagnation with slab rollback and the generation of the back-arc basins has not been well understood.
In this study we construct 2-D dynamical models of sub-duction to understand the roles of slab gravitational insta-bility due to the interaction with the transition zone in theback-arc extension. In our model, the plate motion is gener-ated self-consistently without imposed velocity in the man-tle convection system of asymmetric subduction driven bythe internal buoyancy. We model subduction at the mov-able plate boundary under a deformable overriding plateconnected to a fixed continent. As a possible mechanismto produce extension of the overriding plate, we considera tensional yield strength of the lithosphere that is lowerthan compressional yield strength (e.g., Brace and Kohlst-edt, 1980; Kirby, 1980; Scholz, 1990). We also take into ac-count the rheological condition of grain-size reduction (e.g.,Rubie, 1984; Riedel and Karato, 1997; Yamazaki et al.,2005) after phase transitions in a cold temperature anomalyto induce the slab weakening and deformation in the tran-sition zone. We examine how slab rollback is generatedand affects the dynamics of the subducting and overridingplates when the slab subducts and interacts with the transi-tion zone.
65

66 M. TAGAWA et al.: SLAB INTERACTION WITH THE MANTLE TRANSITION ZONE
7000 km
Subducting plate
History-dependent rheology layer
?
?
660 km
410 km
Overriding plate
1320
km
Thermal anomaly (+ 200 K)
x
z
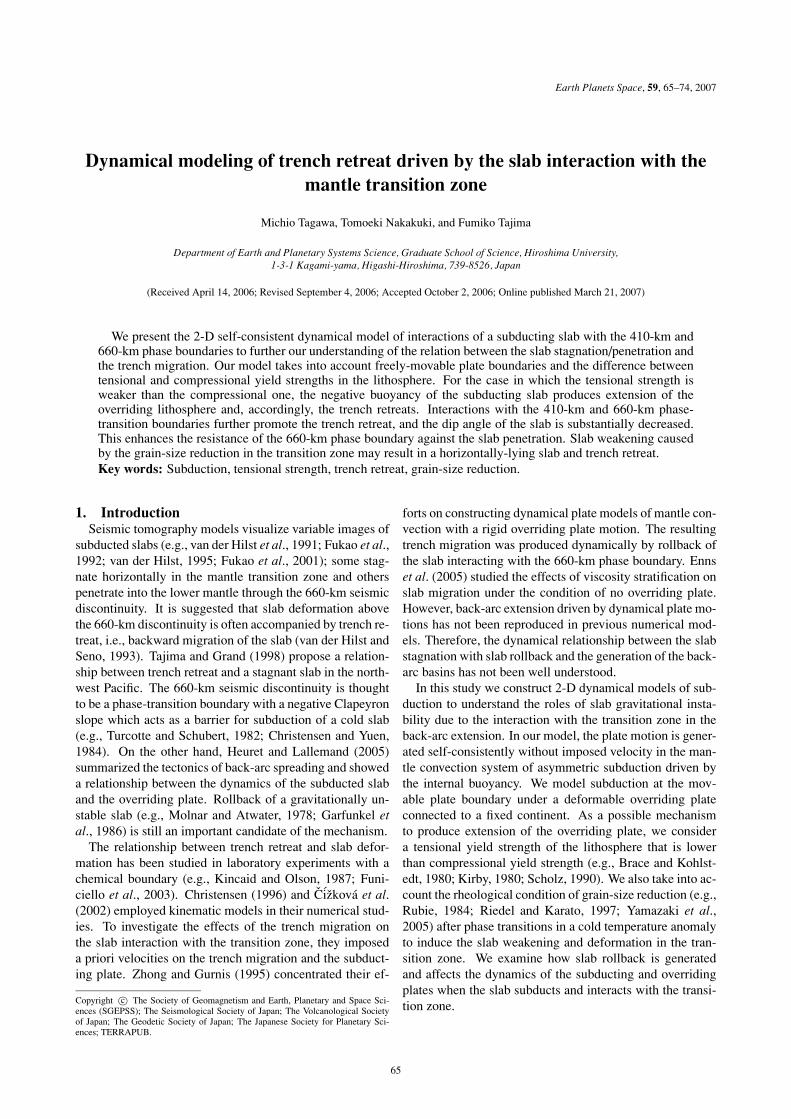
Fig. 1. Schematic illustration of the model. See the text for detail.
2. Model Setting and Basic Equations2.1 Model setup
The subducted slab interacts with the mantle transitionzone. We trace the evolution of plate subduction under adeformable overriding plate. We employ a 2-D internally-heated viscous fluid with 7000×1320 km in a Cartesian co-ordinate and apply an extended Boussinesq approximation(e.g., Christensen and Yuen, 1985). The viscous dissipationand the adiabatic temperature gradient are included in thenumerical calculations. Figure 1 shows a schematic viewof the model configuration. The top thermal boundary layerconsists of two “oceanic” plates that do not contain a buoy-ant crust; one of these behaves as a subducting plate andthe other behaves as an overriding plate. The side bound-aries are treated as reflective (i.e., impermeable), tangentialstress-free, and thermally insulating. The right-hand side-wall plays the role of an immobile continental plate. Thetop boundary is set to allow free slip so that the motions ofthe lithospheres are determined self-consistently by the in-ternal buoyancy. A constant temperature (273 K) is given tothe top thermal condition. The bottom boundary is set to befree slip and no heat flux. A thermal anomaly area (+200 K,width = 50 km, height = 400 km) is set at the bottom-leftcorner as a source of the mantle flow. We assume that thetemperature of the lithosphere in the initial condition is de-termined from a cooling half-space model. The position ofthe initial plate boundary is set at 4500 km from the left-hand side boundary. The age of the left-hand side platevaries from 0 Ma at x = 0 km to 100 Ma at x = 4500km. The right-hand side plate has a uniform thickness with20 Ma or 100 Ma. The underlying mantle has the adiabatictemperature profile with a potential temperature of 1553 K.
The transition zone is modeled with two phase transi-tions of olivine-series minerals: olivine to wadsleyite at adepth of 410 km, and ringwoodite to perovskite and mag-nesiowustite at a depth of 660 km. The Clapeyron slopesfor the 410-km and 660-km phase transitions are assumedto be +3 MPa K−1 and −3 MPa K−1 (Akaogi et al., 1989;Katsura and Ito, 1989; Akaogi and Ito, 1993), respectively.Although recent high-pressure experiments indicate gen-tler Clapeyron slopes for the 660-km phase transition (Kat-sura et al., 2003; Fei et al., 2004), the negative Clapey-ron slope employed in this study is consistent with seis-mological studies of the 660-km discontinuity depression(e.g., Tajima and Grand, 1995; Flanagan and Shearer, 1998;Tajima and Grand, 1998; Tonegawa et al., 2005). The den-
Table 1. Parameters used in this study.
c Friction coefficient 0.3
cF Friction coefficient of 0.004
the fractured segment
cp Specific heat 1.2 × 10³ J K−1 kg−1
E∗ Activation energy 2.4 × 10⁵ J mol−1
g Gravity acceleration 10 m s−2
H Internal heating 5.08 × 10⁻¹² W kg−1
k Thermal conductivity 4.68 W m−1 K−1
m Grain-size exponent 2
R Gas constant 8.31451 J mol−1 K−1
Ts surface temperature 273 K
V ∗ Activation volume 0.5 × 10⁻⁵ m3 mol−1
α Thermal expansivity 3.0 × 10⁻⁵ K−1
γ410 Clapeyron slope (410 km) +3.0 MPa K−1
γ660 Clapeyron slope (660 km) −3.0 MPa K−1
ρ0 Reference density 3.9 × 10³ kg m−3
�ρ410 Density contrast (410 km) 323.7 kg m−3
�ρ660 Density contrast (660 km) 304.2 kg m−3
τf Cohesive strength of 1 MPa
the fractured segment
τy Cohesive strength 10 MPa
τmax Yield strength of the brittle-ductile 400 MPa
transition layer
sity contrasts for the 410-km and 660-km phase transitionsare set to be 8.3% and 7.8%, respectively, based on thePREM model (Dziewonski and Anderson, 1981). Physicalparameters are shown in Table 1.2.2 Rheology
The lithosphere consists of three rheological segments(Kohlstedt et al., 1995), which are the brittle, brittle-ductiletransition, and ductile layers. Fractures and rapid deforma-tion of the brittle and brittle-ductile transition layers areexpressed by yielding. In this study, stress values, in-cluding the yield strength, are described by the definition( τ = 2η ε), which is usually employed in the fluid dynam-ics. Note that the differential stress, which is often used todescribe the lithospheric strength, is simply twice the stressvalue in a viscous fluid. The yield strength (τY) of the brit-tle layer is determined by a Byerlee’s law τY = τy + c ph,where τy (= 10 MPa) is the cohesive strength, c (= 0.3)the friction coefficient, and ph is the hydrostatic pressure.The friction coefficient and the cohesive strength used inthis study are small compared to that estimated by Byer-lee (1978). Because the friction coefficient changes thestrength of the shallower part of the lithosphere, the totallithospheric strength changes less than 20%. The cohesivestrength (on the order of 10 MPa) is much lower than theyield strength of the lithosphere interior (on the order of 100MPa). The change in these values does not affect our sub-duction modeling. The yield strength of the brittle-ductiletransition layer is set to be constant τmax (= 400 MPa),which is in the range estimated from the experimental study(Kohlstedt et al., 1995). The strength under tensional stressto generate a normal fault is lower than that under com-pressional stress to generate a thrust fault (e.g., Brace andKohlstedt, 1980; Kirby, 1980; Scholz, 1990). We intro-duce this as a possible mechanism to generate extension of

M. TAGAWA et al.: SLAB INTERACTION WITH THE MANTLE TRANSITION ZONE 67
the lithosphere. For simplicity purposes, the difference be-tween tensional and compressional strengths is modeled byswitching the values of c and τy depending on the condi-tion of the deviatric horizontal normal stress (τxx ). A ratio(Rt/c) of tensional strength to compressional strength is de-fined. If Rt/c is 1, the magnitude of the tensional strength isequal to the compressional strength; or if it is 1/3, the ten-sional strength is weaker than the compressional strength.When the plate is under the tensional stress (τxx > 0), thetensional strength is set to be Rt/c (τy + c ph).
Under the stress lower than τY, the viscosity (ηN) istreated as Newtonian with Arrhenius-type temperature (T )and depth (ph) dependence (e.g., Karato and Wu, 1993), as
ηN(T, ph) = min
[A0 exp
(E∗ + phV ∗
RT
), η0
], (1)
where A0 is a constant, E∗ the activation energy, V ∗ the ac-tivation volume, and R is the gas constant. A0 is determinedfor ηN to have the reference viscosity ηR (= 5 × 10²⁰ Pa·s),which is set to be the average viscosity of the upper mantle(Milne et al., 1999; Okuno and Nakada, 2001), at a depthof 410 km with the initial temperature. ηN is truncated atthe maximum η0 (= 3 × 1024 Pa·s) to simulate the effectiveviscosity of the plate (Gordon, 2000). This is for the accu-racy of numerical calculation. The values of E∗ and V ∗ arebased on Karato and Wu (1993).
We introduce grain-size reduction associated with thephase transitions in the cold slab (e.g., Rubie, 1984; Riedeland Karato, 1997; Yamazaki et al., 2005). In this case, theviscosity law depends on the grain size (d), assuming thediffusion creep as
ηdif =(
d
d0
)m
ηN(T, ph), (2)
where d0 is the grain size of the material before a phasetransition and m (= 2) is the exponent. The grain sizeis described as a linearized Arrhenius law (Cizkova et al.,2002),
d = dmin; at T ≤ Tmin,
ln
(d
d0
)= T − T0
T0 − Tminln
(d0
dmin
);
at Tmin < T < T0, (3)d
d0= 1; at T ≥ T0,
where dmin is the minimum grain size at T lower than theminimum temperature Tmin (= 773 K). The grain-size re-duction (Eq. (3)) progresses in the temperature range be-tween Tmin and T0 as the growth in grain size is slower un-der decreasing temperature. In this temperature range, theviscosity of the slab decreases because of the grain-size re-duction. The viscosity becomes lower with decreasing tem-perature. Here, d0/dmin is assumed to be 102 or 104. For themaximum temperature T0 in the region where the grain-sizereduction occurs, we test two values: 1073 K or 1873 K. Inthe case without the grain-size dependence, ηdif is set to beηN.
The effective viscosity (η) depending on the stress isdescribed as
η = ηdif (τII < τY), (4)
η = τY
2εII(τII = τY), (5)
where τII and εII are the second invariants of the deviatricstress tensor (τi j ) and the strain rate tensor (εi j ), respec-tively, and given by
τII =√√√√1
2
2∑i, j=1
τ 2i j , (6)
εII =√√√√1
2
2∑i, j=1
ε2i j . (7)
The plate boundary is generated by a layer with history-dependent rheology (Fig. 1) simulating lubrication by anwet oceanic crust. The history-dependent rheology layerwhich moves with the flow behaves like a passive marker.The thickness of this layer is set to be 20 km to maintainstable plate subduction. Once this layer fractures, the yieldstrength drops to a smaller value (τF = τf + cF ph) untilhealing. Here, τf (= 1 MPa) is the cohesive strength and cF
(= 0.004) is the friction coefficient of the fault zone. Thevalue of cF is estimated from the ratio between “ridge push”and “continent resistance” (Forsyth and Uyeda, 1975). Notethat the strength of this layer is determined by the historyof yielding. The segment that has the history-dependentrheology is set in the initial condition. The strength (τF)of the plate boundary is assumed to be weaker than that ofthe bulk of the lithosphere in the initial condition. As theyield strength at the spreading center is assumed to be lowbecause of partial melting (Sleep, 2000), it is also set to beτF.2.3 Basic equations
Basic equations are the equations of continuity, motion,and energy. Using a stream function (ψ), the equation ofmotion is described as(
∂2
∂x2− ∂2
∂z2
) {η
(∂2ψ
∂x2− ∂2ψ
∂z2
)}+ 4
∂2
∂x∂z
(η
∂2ψ
∂x∂z
)
= ∂ρ
∂xg, (8)
where x is the horizontal coordinate, z the vertical coordi-nate, ρ the density, and g is the gravity acceleration. ψ isdefined by
v = (u, w) ≡(
∂ψ
∂z, −∂ψ
∂x
), (9)
here (u, w) are the x- and z-components of the velocity vec-tor v. The equation of continuity is automatically satisfiedby the definition of the stream function. The vertical axisis positive in the downward direction. The equation of stateprovides the density as
ρ = ρ0(1 − αT ) + �ρ410�410 + �ρ660�660, (10)

68 M. TAGAWA et al.: SLAB INTERACTION WITH THE MANTLE TRANSITION ZONE
Table 2. Summary of cases.
Case Phase transitions Rt/c T0 (K) d0/dmin tp (Ma) Initial model
1 Off 1 − − 20 −2 Off 1/3 − − 20 −3 Off 1/3 − − 100 −4 On 1 − − 20 10.6 Myr (Case 1)
5 On 1 1073 104 20 10.6 Myr (Case 1)
6 On 1 1873 102 20 10.6 Myr (Case 1)
7 On 1/3 − − 20 8.8 Myr (Case 2)
8 On 1/3 1073 104 20 8.8 Myr (Case 2)
9 On 1/3 1873 102 20 8.8 Myr (Case 2)
10 On 1/3 − − 100 13.0 Myr (Case 3)
Rt/c, the ratio of tensional strength to compressional strength; T0 and d0/dmin, the parameters for the grain-size reduction (see the text); tp, the initialage of the overriding plate; initial models for the calculation with the phase transitions.
where ρ0 is the reference density, α the thermal expansivity,�ρ410 and �ρ660 the density contrasts associated with the410-km and 660-km phase transitions, respectively, and�410 and �660 are phase functions associated with the 410-km and 660-km phase transitions, respectively.
The equation of energy is
ρ0cp
(∂T
∂t+ v · ∇T − w
α g (T + Ts)
cp
)
−γ410�ρ410 (T + Ts)
ρ0
D�410
Dt
−γ660�ρ660 (T + Ts)
ρ0
D�660
Dt
= k ∇2T +2∑
i, j=1
τi j∂vi
∂x j+ ρ0 H, (11)
where Ts is the surface temperature, cp the specific heat, kthe thermal conductivity, γ410 and γ660 the Clapeyron slopesat the 410-km and 660-km phase transitions, respectively,and H is the internal heating.
The motions of the layer with the history-dependent rhe-ology (�o) and its fractured segment (�F) are controlled bythe equation of mass transport as
∂�l
∂t+ v · ∇�l = 0 (12)
where l is the index for the layers replaced by o or F. Thehistory-dependent rheology layer is represented by the po-sition where �o = 1. We determine �F, which remembersthe history of yielding, as follows: Before the first yielding,�F is set to be 0 in the oceanic crust. When the first yieldingtakes place, �F = 1 is imposed. We also assume that heal-ing of the failure zone occurs at a depth of 330 km where�F is reset to be 0.
We employ a finite difference method based on a controlvolume (CV) scheme to solve the equations. Here we useboth uniform and non-uniform grids of control volumes (adual-structure grid). The transport equations of energy (Eq.(11)) and mass (Eq. (12)) are discretized uniformly with the2 × 2-km CVs. The total number of CVs is 3500 × 660 inthe x- and z-directions. The equation of motion (Eq. (8))is discretized non-uniformly. The regions with intense de-formation (such as spreading center, subduction zone, andinterior of the plate) and phase boundaries are divided into
0
300
600
900
3500 4000 4500 5000 5500
0
300
600
900
3500 4000 4500 5000 5500
0
300
600
900
3500 4000 4500 5000 5500
(a) Case 1 10.6 Myr
3500 4000 4500 5000 55003500 4000 4500 5000 55003500 4000 4500 5000 5500
19.1 Myr
0
300
600
900
3500 4000 4500 5000 5500
0
300
600
900
3500 4000 4500 5000 5500
0
300
600
900
3500 4000 4500 5000 5500
(b) Case 2 8.8 Myr
3500 4000 4500 5000 55003500 4000 4500 5000 55003500 4000 4500 5000 5500
17.3 Myr
18 19 20 21 22 23 24 25
Fig. 2. Evolution of subducted slabs for the cases without phase tran-sitions. The viscosity (Pa·s) in the logarithmic scale is shown by thecontour lines and the gray scale. The contour interval is set to be 1. (a)Case 1 at 10.6 Myr and 19.1 Myr, (b) Case 2 at 8.8 Myr and 17.3 Myr.Each box shows part of the model within the width of 2000 km (hori-zontal) and the depth of 1000 km (vertical) surrounding the subductionzone. The initial position of the trench (x = 4500 km) is denoted by thereversed triangle.
2-km mesh spacings in each direction. Otherwise, the sizeof CVs varies from region to region, and is integer timeslarger than 2 × 2 km CVs in general. The total number ofCVs is 808×265 in the x- and z-directions. A direct methodfor a symmetric band matrix (a modified Cholesky decom-position method) is applied for the equation of motion. Thismakes numerical calculation stable against sharp viscosityvariations by more than 106 (Nakakuki et al., 1994). In or-der to avoid artificial diffusion and a phase error of the equa-tion of mass transport (Eq. (12)), the Cubic-InterpolatedPseudo-Particle (CIP) method (Takewaki et al., 1985) isadopted to solve the two advection equations for �o and�F. The CIP method is established as a valid method tosolve problems of computational fluid dynamics with sharpinterfaces.
3. ResultsThe cases of numerical experiments with varying param-
eters are summarized in Table 2. We first perform calcu-lations without phase transitions (Cases 1, 2, and 3). Inthese cases a slab does not exist in the beginning. In Case 1,the slab descends almost downward because of large plate

M. TAGAWA et al.: SLAB INTERACTION WITH THE MANTLE TRANSITION ZONE 69
0
300
600
900
3500 4000 4500 5000 5500
0
300
600
900
3500 4000 4500 5000 5500
0
300
600
900
3500 4000 4500 5000 5500
0
300
600
900
3500 4000 4500 5000 5500
0
300
600
900
3500 4000 4500 5000 5500
(a) Case 4 11.8 Myr
3500 4000 4500 5000 55003500 4000 4500 5000 55003500 4000 4500 5000 55003500 4000 4500 5000 55003500 4000 4500 5000 5500
16.3 Myr
0
300
600
900
3500 4000 4500 5000 5500
0
300
600
900
3500 4000 4500 5000 5500
0
300
600
900
3500 4000 4500 5000 5500
0
300
600
900
3500 4000 4500 5000 5500
0
300
600
900
3500 4000 4500 5000 5500
(b) Case 7 10.7 Myr
3500 4000 4500 5000 55003500 4000 4500 5000 55003500 4000 4500 5000 55003500 4000 4500 5000 55003500 4000 4500 5000 5500
14.1 Myr
0
300
600
900
3500 4000 4500 5000 5500
0
300
600
900
3500 4000 4500 5000 5500
0
300
600
900
3500 4000 4500 5000 5500
0
300
600
900
3500 4000 4500 5000 5500
0
300
600
900
3500 4000 4500 5000 5500
(c) Case 8 10.7 Myr
3500 4000 4500 5000 55003500 4000 4500 5000 55003500 4000 4500 5000 55003500 4000 4500 5000 55003500 4000 4500 5000 5500
14.5 Myr
0
300
600
900
3500 4000 4500 5000 5500
0
300
600
900
3500 4000 4500 5000 5500
0
300
600
900
3500 4000 4500 5000 5500
0
300
600
900
3500 4000 4500 5000 5500
0
300
600
900
3500 4000 4500 5000 5500
(d) Case 9 10.5 Myr
3500 4000 4500 5000 55003500 4000 4500 5000 55003500 4000 4500 5000 55003500 4000 4500 5000 55003500 4000 4500 5000 5500
13.5 Myr
18 19 20 21 22 23 24 25
Fig. 3. Evolution of subducted slabs for the cases with phase transitions.The viscosity (Pa·s) in the logarithmic scale is shown by the contourlines and the color scale. (a) Case 4 at 11.8 Myr and 16.3 Myr, (b) Case7 at 10.7 Myr and 14.1 Myr, (c) Case 8 at 10.7 Myr and 14.5 Myr, (d)Case 9 at 10.5 Myr and 13.5 Myr. The contour interval is the same asthat of Fig. 2. The 410-km and 660-km phase boundaries are also shownby the purple lines. The initial position of the trench (x = 4500 km) isdenoted by the reversed triangle.
bending at the trench (Fig. 2(a)). The trench is stationarybecause the overriding plate is not extended. In Case 2, theoverriding plate with weak tensional strength is stretchedby the gravitational instability of the subducting slab, andtrench retreat is induced (Fig. 2(b)). The yielding occurs ina broad area of the overriding plate. At that time, only partof the overriding plate near the trench behaves as a rigidbody. The trench retreat results in unbending of the sub-ducting slab that is once bent at the trench so that the dipangle of the subducting slab becomes shallow. In Case 3,extension of the overriding plate does not occur because ofthe thick overriding plate of older age.
In cases with phase transitions, the calculation is startedbased on the results of the cases without phase transitions.We have reasons for this treatment: the slab subduction isinitiated when the mantle flow produces reasonable basaldrag under the plate. In cases with phase transitions, theplume-driven flow cannot induce basal drag under the plate.When the slab reaches the depth of about 350 km (Table 2),phase transitions are imposed in the model domain. At thistime, the temperature change is also imposed to adjust to thelatent heat generation and absorption associated with phasetransitions.
Case 4 is a run with phase transitions, but without theweak tensional strength. In this case, the trench does notmigrate so that the structure of the subducted slab is about
the same as that in Case 1 (Fig. 3(a)). The subducted slabis almost vertical at depths deeper than the 410-km phaseboundary. Positive buoyancy at the 660-km phase boundarydoes not prevent the slab from penetrating into the lowermantle. In Cases 5 and 6, in which grain-size reduction isintroduced into the transition-zone slab, the weakened slabis deformed at the 660-km phase boundary (see Fig. A1(a)and (b)). The slab penetrates into the lower mantle, and thetrench does not migrate in both the cases.
In Case 7, the weak tensional strength is introduced withphase transitions (Fig. 3(b)). When the slab interacts withthe 660 km phase boundary, the positive buoyancy at the660 km phase boundary has an effect on flattening the slab.Nevertheless, the slab penetrates into the lower mantle. Thepositive and negative buoyancies at the two phase transi-tions generate an anticlockwise torque on the slab. This en-hances trench retreat so that the dip angle of the transition-zone slab becomes smaller than that in Case 2. In Case 10,the plate extension does not occur because of the thick over-riding plate even if the phase transitions are introduced (seeFig. A1(c)).
In Cases 8 and 9, we also consider the effects of grain-size reduction as well as the weak tensional strength. InCase 8 the viscosity in the center of the cold slab (<1073 K)sharply decreases due to grain-size reduction in the tran-sition zone (Fig. 3(c)). This makes the bending strengthof the transition-zone slab weaker. A horizontally-lyingslab is therefore formed above the 660-km phase bound-ary. In Case 9, the whole transition-zone slab becomes soft(Fig. 3(d)). In this case the slab is easily deformed and stag-nates horizontally above the 660-km phase boundary. Theslab rollback with extension of the overriding plate con-tinues during the slab interaction with the 660-km phaseboundary in both the cases.
Figure 4 shows the temperature and stress fields. Theshallow slab shows down-dip tension (DDT) because ofthe negative buoyancy due to the slab density and the 410-km phase transition. On the contrary, down-dip compres-sion (DDC) is generally observed in the slab between the410 and 660-km phase transitions because of the positiveand negative buoyancies. The detail of the stress structurechanges with the style of the slab deformation depends inparticular on the slab bending. In the case with the penetrat-ing vertical slab (Case 4), the stress is the most compressiveamong our models (Fig. 4(a)). High compressional stress isshown above and below the 660-km phase transition. In thecases with slightly and completely stagnant slabs (Cases 7and 8; Fig. 4(b) and (c)), both large DDT and DDC stressesare generated in the rim of the slab near the 660-km phaseboundary. This reflects the slab bending. In these cases thewhole layer of the slab becomes DDC in the depth rangeof 400 to 500 km. In Case 8, the stress in the center of theslab becomes small because of the low viscosity (Fig. 4(c)).In the case of the soft slab (Case 9), only weak stress is in-duced in the transition zone (Fig. 4(d)). On the other hand,large stress is generated in the center of the cold slab nearthe 660-km depth in Case 4 and near the 410-km depth inCase 7.
The evolution of the plate motion and the distance ofthe trench retreat with weak tensional strength are shown

70 M. TAGAWA et al.: SLAB INTERACTION WITH THE MANTLE TRANSITION ZONE
0
300
600
900
3500 4000 4500 5000 5500
0
300
600
900
3500 4000 4500 5000 5500
0
300
600
900
3500 4000 4500 5000 5500
(a) Case 4 16.3 Myr
3500 4000 4500 5000 55003500 4000 4500 5000 55003500 4000 4500 5000 5500
0
300
600
900
3500 4000 4500 5000 5500
0
300
600
900
3500 4000 4500 5000 5500
0
300
600
900
3500 4000 4500 5000 5500
(b) Case 7 14.1 Myr
3500 4000 4500 5000 55003500 4000 4500 5000 55003500 4000 4500 5000 5500
0
300
600
900
3500 4000 4500 5000 5500
0
300
600
900
3500 4000 4500 5000 5500
0
300
600
900
3500 4000 4500 5000 5500
(c) Case 8 14.5 Myr
3500 4000 4500 5000 55003500 4000 4500 5000 55003500 4000 4500 5000 5500
0
300
600
900
3500 4000 4500 5000 5500
0
300
600
900
3500 4000 4500 5000 5500
0
300
600
900
3500 4000 4500 5000 5500
(d) Case 9 13.5 Myr
3500 4000 4500 5000 55003500 4000 4500 5000 55003500 4000 4500 5000 5500
0 400 800 1200 1600 2000
T ( C)0 100 200 300 400
τII (MPa)
0
300
600
900
3500 4000 4500 5000 5500
0
300
600
900
3500 4000 4500 5000 5500
0
300
600
900
3500 4000 4500 5000 5500
0
300
600
900
3500 4000 4500 5000 5500
0
300
600
900
3500 4000 4500 5000 5500
0
300
600
900
3500 4000 4500 5000 5500
0
300
600
900
3500 4000 4500 5000 5500
0
300
600
900
3500 4000 4500 5000 5500
0
300
600
900
3500 4000 4500 5000 5500
0
300
600
900
3500 4000 4500 5000 5500
0
300
600
900
3500 4000 4500 5000 5500
0
300
600
900
3500 4000 4500 5000 5500
Compression Tension
Fig. 4. Temperature (T ) in ◦C shown by the color scale and the contour lines, second invariant of the stress tensor (τII) in MPa shown by the color scalewith the temperature contour lines, and principal stress axes directions (tension and compression) for (a) Case 4 at 16.3 Myr, (b) Case 7 at 14.1 Myr,(c) Case 8 at 14.5 Myr, (d) Case 9 at 13.5 Myr. The contour interval of the temperature is 200◦C.
for Cases 2, 7, 8, and 9 in Fig. 5. In Case 2 (no phasetransitions), the trench migrates at 4 cm yr−1 and finallyreaches the location 200 km left of the original point in 15Myr. The speed of the subducting plate motion increasesabruptly when the slab starts interacting with the 410-kmphase boundary (Cases 7, 8, and 9) and reaches the rate of20 cm yr−1. The motion of the overriding plate block be-having as a rigid body near the trench grows simultaneouslywith increasing subduction rate. The motion temporally de-creases after the subduction speed decreases. The slab roll-back still continues (e.g., by about 350 km in 4 Myr; Case7) with nearly constant speed after the slab starts interactingwith the 660-km phase boundary.
4. Discussion and SummaryWe have developed 2-D numerical subduction models
in which slab rollback is produced without imposed ve-locity conditions on the overriding/subducting plate. Wehave studied the slab interaction with the mantle transitionzone under the oceanic overriding plate and shown vari-
ous slab deformations in the transition zone. In particu-lar, with tensional yield strength and grain-size reduction, ahorizontally-lying slab (stagnant slab) can be formed abovethe 660-km phase boundary. Our numerical study suggeststhat the feedback effects of the slab interaction with thetransition zone are important in the following aspects: (1)The trench retreat is generated before the slab reaches the660-km phase boundary and significantly influences the dipangle of the subducting slab in the transition zone; (2) theinteraction of the subducted slab with the 660-km phaseboundary induces the slab rollback even when the slab pen-etrates into the lower mantle; (3) the rollback makes the slabangle even shallower.
In our model the mechanism (1) described above en-hances the effects of the positive buoyancy to prevent theslab from penetrating into the lower mantle. With the trenchmigration speed produced in our model (∼5 cm yr−1 whenthe slab reaches the 660-km phase boundary), slab penetra-tion into the lower mantle is prevented when the bendingstrength of the transition zone slab is weakened by the vis-

M. TAGAWA et al.: SLAB INTERACTION WITH THE MANTLE TRANSITION ZONE 71
-20
-10
0
10
20
30
Pla
te-m
otio
n ve
loci
ty (
cm y
r-1)
0 5 10 15Time (Myr)
-20
-10
0
10
20
30
Pla
te-m
otio
n ve
loci
ty (
cm y
r-1)
0 5 10 15Time (Myr)
410
660Subducting plate
Overriding plate
(a) Case 2No phase transitions
-20
-10
0
10
20
30
Pla
te-m
otio
n ve
loci
ty (
cm y
r-1)
0 5 10 15Time (Myr)
-20
-10
0
10
20
30
Pla
te-m
otio
n ve
loci
ty (
cm y
r-1)
0 5 10 15Time (Myr)
410
660Subducting plate
Overriding plate
(b) Case 7Case 2 + phase transitions
-20
-10
0
10
20
30
Pla
te-m
otio
n ve
loci
ty (
cm y
r-1)
0 5 10 15Time (Myr)
-20
-10
0
10
20
30
Pla
te-m
otio
n ve
loci
ty (
cm y
r-1)
0 5 10 15Time (Myr)
410
660Subducting plate
Overriding plate
(c) Case 8Case 7 + grain-size reduction (<1073 K)
0
100
200
300
400
500
Tre
nch
retr
eat (
km)
5 10 15Time (Myr)
410
660
0
100
200
300
400
500
Tre
nch
retr
eat (
km)
5 10 15Time (Myr)
410
660
0
100
200
300
400
500
Tre
nch
retr
eat (
km)
5 10 15Time (Myr)
410
660
-20
-10
0
10
20
30
Pla
te-m
otio
n ve
loci
ty (
cm y
r-1)
0 5 10 15Time (Myr)
-20
-10
0
10
20
30
Pla
te-m
otio
n ve
loci
ty (
cm y
r-1)
0 5 10 15Time (Myr)
410
660
Subducting plateOverriding plate
(d) Case 9Case 7 + grain-size reduction (<1873 K)
0
100
200
300
400
500
Tre
nch
retr
eat (
km)
5 10 15Time (Myr)
410
660
Fig. 5. Evolution of the plate-motion velocity (cm yr−1) in the left diagram, and the distance (km) of the trench retreat in the right diagram for (a) Case2, (b) Case 7, (c) Case 8, (d) Case 9. The positive value shows the speed of the subducting plate. The negative value shows the speed of the left edgeof the overriding plate (i.e., trench retreat). The times when the slab reaches depths of 410 km and 660 km are indicated by the vertical lines in eachfigure.
cosity reduction. This is consistent with previous numericalmodels (Christensen, 1996; Cizkova et al., 2002) in which,however, the plate velocities were imposed.
The interactions of the slab with the 660-km phase
boundary stimulate the slab rollback in this study. Thetrench migration continues for a period of over 10 Myr, aresult consistent with slab rollback observed when the slabstagnates above the chemical boundary in analog experi-

72 M. TAGAWA et al.: SLAB INTERACTION WITH THE MANTLE TRANSITION ZONE
ments (Kincaid and Olson, 1987; Funiciello et al., 2003).Our results have also demonstrated that the combination ofpositive and negative buoyancies due to the phase transi-tions stimulates the gravitational instability of the slab andchanges the slab dip angle.
We have not considered the power-law creep (e.g.,Ranalli, 1987) in this study. Effects of the power-law stressdependence are equivalent to reducing the temperature andpressure dependence (Christensen, 1984). Moreover, thepower-law creep is important in the shallow layer of themantle because the activation volume (V ∗) is much largerfor dislocation creep than that for diffusion creep (Karatoand Wu, 1993). The power-law creep is, therefore, expectedto reduce the mechanical thickness of a plate and to increaseviscosity gradient in the shallow mantle. These can increasethe speed of the subducting plate motion and trench migra-tion at an early stage of the subduction. The latter mayenhance the effect of the 660-km phase transition to pre-vent slab penetration. The following mechanisms, whichare not included in our model, may cause slab stagnation:the positive buoyancy due to metastable olivine (e.g., Yosh-ioka et al., 1997; Schmeling et al., 1999) and the viscousdrag caused by the upwelling superplume (Gurnis et al.,2000).
We compare the stress fields obtained in this study withobservations. The observation shows both DDT and DDCin the shallow slab and DDC in the transition-zone slab(Isacks and Molnar, 1971). In our model the shallow por-tion of the slab indicates DDT. Seno and Yoshida (2004)pointed out the relationship between the shallow slab stressand the mechanism of the back-arc spreading. However,such a relationship has not been reproduced in the presentstudy. The slab length may be important in a 3-D struc-ture to control the stress field in the shallow slab becausethe plate is driven by the total force of the dense slab. TheDDC of the shallow slab may indicate that the slab is pusheddown by the surface plate. DDC is reproduced in the cen-ter (i.e., cold area) of the slab at around a depth of 500 km.Gurnis and Hager (1988) showed that the viscosity jump iseffective to generate DDC. Our results also show that DDTand DDC coexist in the deformed and stagnant slabs aroundthe 660-km phase boundary because of their bending. Thelarge stress caused by the slab bending would not be impor-tant to generate deep earthquakes because the temperaturein this area is higher than in the slab center.
In a soft slab (Case 9) within the transition zone, thestress level is low. This is not likely to account for thepresence of deep seismicity. When the slab penetrates intothe lower mantle vertically (Case 4), the direction of theprincipal stress axes shows DDT in the shallow slab por-tion (depth: 100–200 km) and DDC in the deep slab por-tion (depth: >300 km) being consistent with the observa-tion in Mariana (e.g., Isacks and Molnar, 1971; Seno andYamanaka, 1998). Slabs that penetrate the 660-km phaseboundary (Cases 4 and 7) retain high stress levels in thelower mantle. This is in contrast to abrupt cessation ofseismic activity below a depth of ∼700 km (e.g., Frohlich,1989). Superplasticity (Ito and Sato, 1991; Karato et al.,1995) which reduces the slab viscosity in the lower mantlemay solve this discrepancy.
In our model, the extension of the overriding plate is gen-erated by the gravitational instability of the slab and ob-served in a broad area of the overriding plate. If the ex-tension occurs only locally, this would play an importantrole for back-arc spreading. Heuret and Lallemand (2005)summarized absolute motions of the overriding plates andthe subducted slabs. The speed of the trench migration isobserved between 5 and 10 cm yr−1 in our model. Theseare faster than the average trench migration speed, which iswithin ±5 cm yr−1 in most subduction zones (Heuret andLallemand, 2005). On the other hand, the trench migra-tion speed exceeds 10 cm yr−1 in some subduction zones,such as the New Hebrides arc or the Tonga-Kermadec arc(Heuret and Lallemand, 2005). In the marginal seas asso-ciated with these trenches (the North Fiji and Lau Basins),the spreading is supposed to be driven by the trench migra-tion because the spreading rate is much faster than that of atypical mid-oceanic ridge between “subductionless” plates(Forsyth and Uyeda, 1975). In these trenches one side of thetrench seems to be freely movable so that the fast slab roll-back would occur. Tomography studies indicate a gentlerangle in the transition zone than that in the shallower man-tle in the Tonga-Kermadec subduction zone (van der Hilst,1995). This may be explained by rollback of the slab inter-acting with the 660-km phase boundary. The relationshipbetween the slab dip angle evolution and the generation ofthe slab stagnation is pointed out in the Izu-Bonin subduc-tion zone (van der Hilst and Seno, 1993; Tajima and Grand,1998).
Acknowledgments. We thank Satoru Honda for his constructivediscussion and valuable comments. Comments by two anonymousreviewers helped to improve the manuscript. Most of the figures inthis paper were drawn using the Generic Mapping Tools (Wesseland Smith, 1998). This study was partly supported by the Grants-in-Aid for Scientific Research No. 16075207 from the Ministryof Education, Culture, Sports, Science and Technology, Japan,and No. 16340130 from the Japan Society for the Promotion ofScience.
Appendix A.We show the viscosity of Cases 5, 6, and 10 in Fig. A1.
In Cases 5 and 6 without the weak tensional strength (i.e.,Rt/c = 1), the grain-size reduction is considered. In Case10 with the weak tensional strength (i.e., Rt/c = 1/3), theoverriding plate is old (i.e., 100 Ma).
Appendix B.We used both uniform and non-uniform grids of con-
trol volumes (a dual-structure grid) in order to solve man-tle convection equations. We first divide the 2-D Cartesianbox into a uniform grid with the finest interval required forthe numerical calculation (e.g., 2 km in the present studyof subduction) for the equations of energy and mass trans-port. Next, we generate a non-uniform grid, in which in-tervals are set to be an integral proportion in size of theuniform grid, for the equation of motion. The equation ofmotion discretized in the non-uniform grid is described ac-cording to Kameyama (1998). The resolution of the non-uniform grid is determined depending on the expected vis-cosity structure. The number of the nodes is much lessthan that in the uniform grid so that the computation time

M. TAGAWA et al.: SLAB INTERACTION WITH THE MANTLE TRANSITION ZONE 73
0
300
600
900
3500 4000 4500 5000 5500
0
300
600
900
3500 4000 4500 5000 5500
0
300
600
900
3500 4000 4500 5000 5500
0
300
600
900
3500 4000 4500 5000 5500
0
300
600
900
3500 4000 4500 5000 5500
(a) Case 5 13.5 Myr
0
300
600
900
3500 4000 4500 5000 5500
0
300
600
900
3500 4000 4500 5000 5500
0
300
600
900
3500 4000 4500 5000 5500
0
300
600
900
3500 4000 4500 5000 5500
0
300
600
900
3500 4000 4500 5000 5500
(b) Case 6 15.6 Myr
0
300
600
900
3500 4000 4500 5000 5500
0
300
600
900
3500 4000 4500 5000 5500
0
300
600
900
3500 4000 4500 5000 5500
0
300
600
900
3500 4000 4500 5000 5500
0
300
600
900
3500 4000 4500 5000 5500
(c) Case 10 20.9 Myr
18 19 20 21 22 23 24 25
Fig. A.1. Snapshots of the subducted slabs. The viscosity (Pa·s) in thelogarithmic scale is shown by the contour lines and the gray scale. (a)Case 5 at 13.5 Myr, (b) Case 6 at 15.6 Myr, (c) Case 10 at 20.9 Myr.The contour interval is the same as that of Fig. 2. The phase boundariesare also shown by the gray lines. The initial position of the trench(x = 4500 km) is denoted by the reversed triangle.
Non-uniform gridUniform grid
(a)
Equation of motion Equation of energy Equation of mass transport
Non-uniform gridUniform grid
T(i, j)ψ(I, J) ψ(M, N)
T(m, n)
(b)
Fig. B.1. (a) Schematic view of the uniform grid (for the equations ofenergy and mass transport) and the non-uniform grid (for the equation ofmotion). (b) Control volumes and nodes for calculating the variables ofthe uniform grid and the non-uniform grid. The control volume of boththe grids has the same structure. ψ(I,J ) and T(i, j) are the stream functionand the temperature in the uniform grid, respectively. ψ(M,N ) and T(m,n)
are the stream function and the temperature in the non-uniform grid,respectively.
is greatly reduced. Figure B1(a) illustrates the grid pointsin which the variables are defined. Figure B1(b) showsa control volume of the non-uniform grid which containssome control volumes of the uniform grid. The stream func-
tion (ψ) is defined at nodes of the grid. The stream func-tion in the uniform grid is obtained by bilinear interpolationfrom the non-uniform grid. Because of the definition of thestream function, the conservation of mass is always provenin any interpolation scheme. The temperature (T ) and thefunctions for the equation of mass transport are defined atthe center of the control volumes in the uniform grid. Thesevalues are interpolated in the non-uniform grid taking a vol-umetric average of the values in the control volumes in theuniform grid.
ReferencesAkaogi, M. and E. Ito, Refinement of enthalpy measurement of MgSiO3
perovskite and negative pressure-temperature slopes for perovskite-forming reactions, Geophys. Res. Lett., 20, 1839–1842, 1993.
Akaogi, M., E. Ito, and A. Navrotsky, Olivine-modified spinel-spinel tran-sitions in the system Mg2SiO4-Fe2SiO4: Calorimetric measurements,thermochemical calculation, and geophysical application, J. Geophys.Res., 94, 15671–15685, 1989.
Brace, W. F. and D. L. Kohlstedt, Limits on lithospheric stress imposed bylaboratory experiments, J. Geophys. Res., 85, 6248–6252, 1980.
Byerlee, J. D., Friction of rocks, Pure Appl. Geophys., 116, 615–626, 1978.Christensen, U. R., Convection with pressure- and temperature-dependent
non-Newtonian rheology, Geophys. J. R. Astron. Soc., 77, 343–384,1984.
Christensen, U. R., The influence of trench migration on slab penetrationinto the lower mantle, Earth Planet. Sci. Lett., 140, 27–39, 1996.
Christensen, U. R. and D. A. Yuen, The interaction of a subducting litho-spheric slab with a chemical or phase boundary, J. Geophys. Res., 89,4389–4402, 1984.
Christensen, U. R. and D. A. Yuen, Layered convection induced by phasetransitions, J. Geophys. Res., 90, 10291–10300, 1985.
Cizkova, H., J. van Hunen, A. P. van den Berg, and N. J. Vlaar, Theinfluence of rheological weakening and yield stress on the interactionof slabs with the 670 km discontinuity, Earth Planet. Sci. Lett., 199,447–457, 2002.
Dziewonski, A. M. and D. L. Anderson, Preliminary reference Earthmodel, Phys. Earth Planet. Inter., 25, 297–356, 1981.
Enns, A., T. W. Becker, and H. Schmeling, The dynamics of subductionand trench migration for viscosity stratification, Geophys. J. Int., 160,761–775, 2005.
Fei, Y., J. Van Orman, J. Li, W. van Westrenen, C. Sanloup, W. Minarik, K.Hirose, T. Komabayashi, M. Walter, and K. Funakoshi, Experimentallydetermined postspinel transformation boundary in Mg2SiO4 using MgOas an internal pressure standard and its geophysical implications, J.Geophys. Res., 109, B02305, doi:10.1029/2003JB002562, 2004.
Flanagan, M. P. and P. M. Shearer, Global mapping of topography ontransition zone velocity discontinuities by stacking SS precursors, J.Geophys. Res., 103, 2673–2692, 1998.
Forsyth, D. W. and S. Uyeda, On the relative importance of the drivingforces of plate motion, Geophys. J. R. Astron. Soc., 43, 163–200, 1975.
Frohlich, C., The nature of deep-focus earthquakes, Ann. Rev. EarthPlanet. Sci., 17, 227–254, 1989.
Fukao, Y., S. Widiyantoro, and M. Obayashi, Stagnant slabs in the upperand lower mantle transition region, Rev. Geophys., 39, 291–323, 2001.
Fukao, Y., M. Obayashi, H. Inoue, and M. Nenbai, Subducting slabs stag-nant in the mantle transition zone, J. Geophys. Res., 97, 4809–4822,1992.
Funiciello, F., C. Faccenna, D. Giardini, and K. Regenauer-Lieb, Dynamicsof retreating slabs: 2. Insights from three-dimensional laboratory exper-iments, J. Geophys. Res., 108, 2207, doi:10.1029/2001JB000896, 2003.
Garfunkel, Z., C. A. Anderson, and G. Schubert, Mantle circulation and thelateral migration of subducted slabs, J. Geophys. Res., 91, 7205–7223,1986.
Gordon, R. G., Diffuse oceanic plate boundaries: Strain rates, verticallyaveraged rheology, and comparisons with narrow plate boundaries andstable plate interiors, in The History and Dynamics of Global PlateMotions, edited by M. A. Richards, R. Gordon, and R. van der Hilst,Geophys. Monograph Series 121, pp. 143–159, Am. Geophys. Union,Washington D.C., 2000.
Gurnis, M. and B. H. Hager, Controls of the structure of subducted slabs,Nature, 335, 317–321, 1988.

74 M. TAGAWA et al.: SLAB INTERACTION WITH THE MANTLE TRANSITION ZONE
Gurnis, M., J. Ritsema, H.-J. van Heijst, and S. Zhong, Tonga slab defor-mation: The influence of a lower mantle upwelling on a slab in a youngsubduction zone, Geophys. Res. Lett., 27, 2373–2376, 2000.
Heuret, A. and S. Lallemand, Plate motions, slab dynamics and back-arcdeformation, Phys. Earth Planet. Inter., 149, 31–51, 2005.
Isacks, B. and P. Molnar, Distribution of stresses in the descending litho-sphere from a global survey of focal-mechanism solutions of mantleearthquakes, Rev. Geophys., 9, 103–174, 1971.
Ito, E. and H. Sato, Aseismicity in the lower mantle by superplasticity ofthe descending slab, Nature, 351, 140–141, 1991.
Kameyama, M., Conditions for plate tectonics inferred from numerical ex-periments of mantle convection and shear zone formation, Ph.D. Thesis,University of Tokyo, 1998.
Karato, S. and P. Wu, Rheology of the upper mantle: A synthesis, Science,260, 771–778, 1993.
Karato, S., S. Zhang, and H.-R. Wenk, Superplasticity in the Earth’s lowermantle: Evidence from seismic anisotropy and rock physics, Science,270, 458–461, 1995.
Katsura, T. and E. Ito, The system Mg2SiO4-Fe2SiO4 at high pressures andtemperatures: Precise determination of stabilities of olivine, modifiedspinel, and spinel, J. Geophys. Res., 94, 15663–15670, 1989.
Katsura, T., H. Yamada, T. Shinmei, A. Kubo, S. Ono, M. Kanzaki, A.Yoneda, M. J. Walter, E. Ito, S. Urakawa, K. Funakoshi, and W. Utsumi,Post-spinel transition in Mg2SiO4 determined by high P-T in situ X-raydiffractometry, Phys. Earth Planet. Inter., 136, 11–24, 2003.
Kincaid, C. and P. Olson, An experimental study of subduction and slabmigration, J. Geophys. Res., 92, 13832–13840, 1987.
Kirby, S. H., Tectonic stresses in the lithosphere: Constraints providedby the experimental deformation of rocks, J. Geophys. Res., 85, 6353–6363, 1980.
Kohlstedt, D. L., B. Evans, and S. J. Mackwell, Strength of the lithosphere:Constraints imposed by laboratory experiments, J. Geophys. Res., 100,17587–17602, 1995.
Milne, G. A., J. X. Mitrovica, and J. L. Davis, Near-field hydro-isostasy:The implementation of a revised sea-level equation, Geophys. J. Int.,139, 464–482, 1999.
Molnar, P. and T. Atwater, Interarc spreading and Cordilleran tectonicsas alternates related to the age of subducted oceanic lithosphere, EarthPlanet. Sci. Lett., 41, 330–340, 1978.
Nakakuki, T., H. Sato, and H. Fujimoto, Interaction of the upwelling plumewith the phase and chemical boundary at the 670 km discontinuity:Effects of temperature-dependent viscosity, Earth Planet. Sci. Lett., 121,369–384, 1994.
Okuno, J. and M. Nakada, Effects of water load on geophysical signals dueto glacial rebound and implications for mantle viscosity, Earth PlanetsSpace, 53, 1121–1135, 2001.
Ranalli, G., Rheology of the Earth, 366 pp., Allen and Unwin, Boston,1987.
Riedel, M. R. and S. Karato, Grain-size evolution in subducted oceaniclithosphere associated with the olivine-spinel transformation and itseffects on rheology, Earth Planet. Sci. Lett., 148, 27–43, 1997.
Rubie, D. C., The olivine→spinel transformation and the rheology ofsubducting lithosphere, Nature, 308, 505–508, 1984.
Schmeling, H., R. Monz, and D. C. Rubie, The influence of olivinemetastability on the dynamics of subduction, Earth Planet. Sci. Lett.,165, 55–66, 1999.
Scholz, C. H., The Mechanics of Earthquakes and Faulting, 439 pp., Cam-bridge University Press, New York, 1990.
Seno, T. and Y. Yamanaka, Arc stresses determined by slabs: Implicationsfor mechanisms of back-arc spreading, Geophys. Res. Lett., 25, 3227–3230, 1998.
Seno, T. and M. Yoshida, Where and why do large shallow intraslab earth-quakes occur?, Phys. Earth Planet. Inter., 141, 183–206, 2004.
Sleep, N. H., Evolution of the mode of convection within terrestrial planets,J. Geophys. Res., 105, 17563–17578, 2000.
Tajima, F. and S. P. Grand, Evidence of high velocity anomalies in the tran-sition zone associated with southern Kurile subduction zone, Geophys.Res. Lett., 22, 3139–3142, 1995.
Tajima, F. and S. P. Grand, Variation of transition zone high-velocityanomalies and depression of 660 km discontinuity associated with sub-duction zones from the southern Kuriles to Izu-Bonin and Ryukyu, J.Geophys. Res., 103, 15015–15036, 1998.
Takewaki, H., A. Nishiguchi, and T. Yabe, Cubic interpolated pseudo-particle method (CIP) for solving hyperbolic-type equations, J. Comp.Phys., 61, 261–268, 1985.
Tonegawa, T., K. Hirahara, and T. Shibutani, Detailed structure of theupper mantle discontinuities around the Japan subduction zone imagedby receiver function analyses, Earth Planets Space, 57, 5–14, 2005.
Turcotte, D. L. and G. Schubert, Geodynamics: Applications of ContinuumPhysics to Geological Problems, pp. 450, John Wiley and Sons, NewYork, 1982.
van der Hilst, R., Complex morphology of subducted lithosphere in themantle beneath the Tonga trench, Nature, 374, 154–157, 1995.
van der Hilst, R. and T. Seno, Effects of relative plate motion on thedeep structure and penetration depth of slabs below the Izu-Bonin andMariana island arcs, Earth Planet. Sci. Lett., 120, 395–407, 1993.
van der Hilst, R., R. Engdahl, W. Spakman, and G. Nolet, Tomographicimaging of subducted lithosphere below northwest Pacific island arcs,Nature, 353, 37–43, 1991.
Wessel, P. and W. H. F. Smith, New, improved version of the GenericMapping Tools released, EOS Trans. Am. Geophys. Union, 79, 579,1998.
Yamazaki, D., T. Inoue, M. Okamoto, and T. Irifune, Grain growth kineticsof ringwoodite and its implication for rheology of the subducting slab,Earth Planet. Sci. Lett., 236, 871–881, 2005.
Yoshioka, S., R. Daessler, and D. A. Yuen, Stress fields associated withmetastable phase transitions in descending slabs and deep-focus earth-quakes, Phys. Earth Planet. Inter., 104, 345–361, 1997.
Zhong, S. and M. Gurnis, Mantle convection with plates and mobile,faulted plate margins, Science, 267, 838–843, 1995.
M. Tagawa (e-mail: [email protected]), T. Nakakuki,and F. Tajima