dynamic systems identification part 2 part 2 -- nonlinear...
TRANSCRIPT

Dynamic Systems IdentificationDynamic Systems IdentificationPart 2 Part 2 -- Nonlinear systems Nonlinear systems
Systems modelling from data 1
Reference:
J. Sjöberg et al. (1995):Non-linear Black-Box Model ing in System Identification: aUnified Overview, Automatica, Vol. 31, 12, str. 169 1 - 1724.

Nonlinear dynamic systemsNonlinear dynamic systems
•Static models
•Input/output data
•Interpolation or extrapolation
•Dynamic model
Z
Z
-n
-1
.
.
.
.
.
.
u(k-1)
u(k-n)
Gaussian Process Model y(k)
u(k)
^Nonlinear model
Systems modelling from data 2
•Dynamic model
•Input/output data expanded with delayed input and output data
• Learning for one-step-ahead prediction
•Validation for multi-step-ahead prediction
),...)1(),...,2(ˆ),1(ˆ()(ˆ −−−= kukykyfky
Z
Z
Z
-n
-2
-1
.
.
.
.
.
y(k-1)
y(k-2)
y(k-n)
^
^
^

RBF network RBF network –– ExampleExample2207 I/O data, 20 basis functions distributed randomly in operating area
Systems modelling from data 3
Original function Approksimation with 20 basisfunctions

EExxperimental modelperimental modelling ofling of nnonlinear onlinear systemssystems
�� 19199090ss: : ANNANN = = nonlinear systems nonlinear systems identifiidentificationcation�� RuleRule::
Do Do not estimate what you alreadynot estimate what you already knowknow!!
Systems modelling from data 4
�� white box model, grey box modelwhite box model, grey box model (physical (physical modelling, semimodelling, semi--physical modelling), physical modelling), black box black box modelmodel
�� NNonlinear blackonlinear black--box models: artificial neural box models: artificial neural networksnetworks, , fuzzy modelsfuzzy models, , wavelet models, etc.wavelet models, etc.

EExxperimental modelperimental modelling of nonlinear ling of nonlinear systemssystems
�� Used termsUsed terms (s(system theory vs. ANN/Machine ystem theory vs. ANN/Machine learninglearning::�� estimate, identifyestimate, identify = = train, learntrain, learn�� vvalidatealidate = = generalizegeneralize
Systems modelling from data 5
�� model structuremodel structure = = networknetwork�� estimation data, identification dataestimation data, identification data = = training settraining set�� validation datavalidation data = = generalization setgeneralization set�� overfitoverfit = = overtrainingovertraining

Some practical concerns about Some practical concerns about nonlinear systems identificationnonlinear systems identification
�� Identification procedure cannot/must not be fully Identification procedure cannot/must not be fully automatisedautomatised!!
Systems modelling from data 6
�� NeccessaryNeccessary: S/W, I/O : S/W, I/O datadata..
�� We need experience on similar identification casesWe need experience on similar identification cases..Computer simulations of similar casesComputer simulations of similar cases..

EExxperimental modelperimental modelling of ling of nnonlinear onlinear systemssystems
Nonlinear systems identification problem:Nonlinear systems identification problem:)(),...)2(),1(),...,2(),1(()( kvkykykukugky +−−−−=
ˆ ( | ) ( ( ), )y k g k=θ ψ θ
Systems modelling from data 7
ψψ((tt) = ) = vevector of regressorsctor of regressors
θθθθθθθθ = = vevecctor tor of of parametparameteerrss
�� 2 subproblems2 subproblems�� Selection of regressorsSelection of regressors ψψ((kk))
�� Selection of nonlinear mapping Selection of nonlinear mapping g(g(ϕϕϕϕϕϕϕϕ))
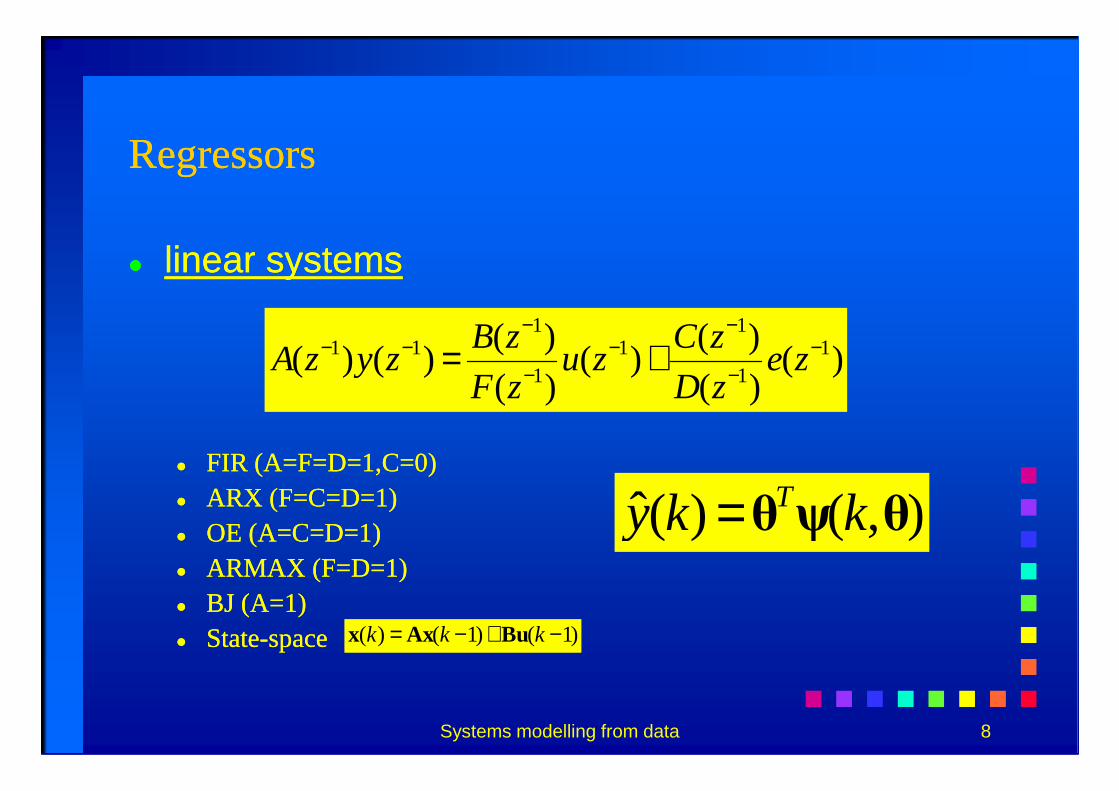
RegresRegresssororss
�� linear slinear systemsystems
)()(
)()(
)(
)()()( 1
1
11
1
111 −
−
−−
−
−−− += ze
zD
zCzu
zF
zBzyzA
Systems modelling from data 8
�� FIR (A=F=D=1,C=0)FIR (A=F=D=1,C=0)�� ARX (F=C=D=1)ARX (F=C=D=1)�� OE (A=C=D=1)OE (A=C=D=1)�� ARMAX (F=D=1)ARMAX (F=D=1)�� BJ (A=1)BJ (A=1)�� StateState--space space
ˆ( ) ( , )Ty k k=θ ψ θ
)1()1()( −+−= kkk BuAxx
)()( zDzF

RegresRegressorssors
�� nnononlinear slinear systemsystemsregresregressorssors ψψ determine different modelsdetermine different models::
�� NFIR: NFIR:
�� NARX: NARX:
ˆ( ) ( ( ), )y k g k= ψ θ
)(),( ikyiku −−
)( iku −
Systems modelling from data 9
�� NARX: NARX:
�� NOE:NOE:
�� NARMAX:NARMAX:
�� NBJ:NBJ:
�� StateState--spacespace
�� other possible regressorsother possible regressors
)(ˆ),( ikyiku −−
)(),( ikyiku −−
)(ˆ)()(),(),( ikyikyikikyiku −−−=−−− ε
)(ˆ)()(),(),(),( ikynkyikikikyiku nn −−−=−−−− εε

NNonlinear mappingsonlinear mappings
�� FourierFourier seriesseries (s(sccalaralar casecase))�� ggkk((ψψ)) is a basis functionis a basis function
( , ) ( )k kg gα=∑ψ θ ψ
Systems modelling from data 10
�� ggkk((ψψ)) is a basis functionis a basis function�� ““KnownKnown” stru” structuresctures::
�� wavelet functionswavelet functions�� B splinesB splines�� ARTIFICIAL NEURAL NETWORKSARTIFICIAL NEURAL NETWORKS
�� Multilayer perceptronMultilayer perceptron�� radial basis function networkradial basis function network�� etcetc
�� FUZZY MODELSFUZZY MODELS

Forms of known structuresForms of known structures::
�� NeNeural networks with ural networks with sigmoid asigmoid activation functionctivation function
�� Radial basis function networksRadial basis function networks
( ) ( )k k kg σ β γ= +ψ ψγ - position
β - direction scale
Systems modelling from data 11
�� Radial basis function networksRadial basis function networks
�� Fuzzy modelsFuzzy models
( ) ( ( ))k k kg r β γ= −ψ ψ
( ) ( ( ))j Aj
g y µ=∑ ∏ψ ψ
scale

�� Multilayer networksMultilayer networks
�� Recurrent networksRecurrent networks
( ) ( ( ), )k g k iϕ = −ψ θ
Z
Z
Z
Z
-n
-1
-2
-1
.
.
.
.
.
.
u(k-1)
u(k-n)
Nonlinear Process Mode l
y(k-1)
y(k-2)
y(k)
u(k)
^
^
Systems modelling from data 12
�� AlgoritAlgorithhmms for estimation of parameterss for estimation of parameters::�� GaussGauss--Newton algoritNewton algorithms are very efficienthms are very efficient,,�� OffOff--line identificationline identification, , as well as onas well as on--line (recursive)line (recursive),,�� GradientGradient optimisationoptimisation metmethodshods –– time consumingtime consuming..
Z-n
...y(k-n) ^

SSubproblemsubproblems::�� Systematic selection of regressorsSystematic selection of regressors
�� u(u(kk)) -- statistaticc nnonlinearityonlinearity�� u(u(kk--ii))�� u(u(kk--ii),y(),y(kk--ii))�� ......
�� Selection of basis functionSelection of basis function
Systems modelling from data 13
�� Selection of basis functionSelection of basis function�� Most of them are universal “approximators”Most of them are universal “approximators”�� There exist no exact criteria for basis function selection except There exist no exact criteria for basis function selection except
subjective onessubjective ones�� ““RadialRadial” fun” functions for low number of regressorsctions for low number of regressors
((e.g.e.g. wavelet function for max. 3 regressorswavelet function for max. 3 regressors))�� ““ridgeridge” ” functions for larger number of regressorsfunctions for larger number of regressors
((e.g. neural networks with e.g. neural networks with sigmoidsigmoid functionsfunctions))�� Fuzzy models, where heuristic knowledge exsistsFuzzy models, where heuristic knowledge exsists. .
�� Models order (2n+1, Takan’s theorem);Models order (2n+1, Takan’s theorem);

Measures of model qualityMeasures of model quality
�� Measure of model quality (example)Measure of model quality (example)
�� TThree sources of differences with true systemhree sources of differences with true system::
2 2
0( ) ( ) ( ( ), ) ( ( )) ( ( ), )V E y t g t E g t g tλ= − = + −θ ψ θ ψ ψ θ
Systems modelling from data 14
�� TThree sources of differences with true systemhree sources of differences with true system::�� noisenoisee(t)e(t); varianc; variancee λλ=E=E((ee22(t)(t)))
�� biasbias
�� VariancVariance of estimatione of estimation
2*0
ˆ( , ( )) ( ( ) )V E g t g tΝ= −θ ψ ψ
dimV
N= λ θ
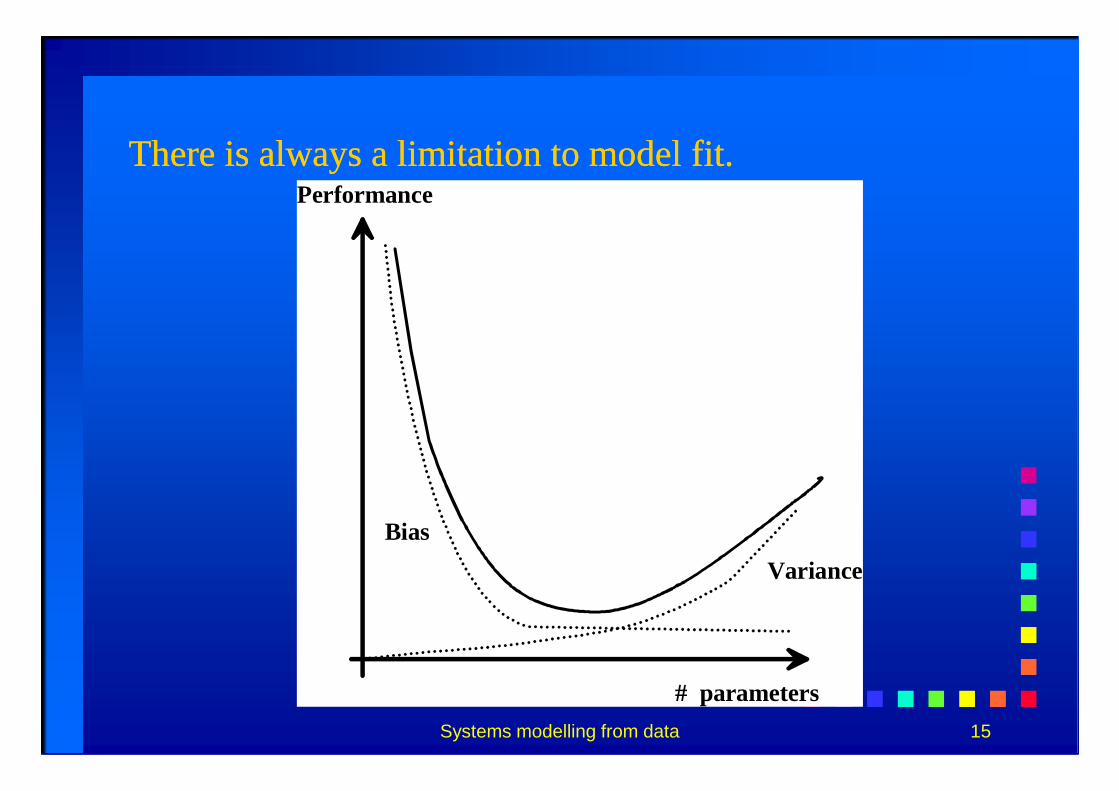
There is always a limitation to model fit.There is always a limitation to model fit.Performance
Systems modelling from data 15
# parameters
Bias
Variance

Recommendatins for practiceRecommendatins for practice::�� Look at the dataLook at the data
((detection of nonlinearity, time constantsdetection of nonlinearity, time constants))..�� Try simple things firstTry simple things first
((try simple structures and model orders firsttry simple structures and model orders first,,at first linear models and small number of at first linear models and small number of estimation parametersestimation parameters))..
Systems modelling from data 16
estimation parametersestimation parameters))..� Look into the physics (idea(ideas fors for regresregresssororss))..�� Validation and estimation dataValidation and estimation data..�� Center and scale the data.Center and scale the data.�� The biasThe bias--variance tradevariance trade--ofoff.f.�� The notion of efThe notion of effficient number of parametersicient number of parameters
(shrinking)(shrinking)..

�� Sampling time selection (same rule as for linear Sampling time selection (same rule as for linear systems).systems).
Sampling time should be selected to grasp all Sampling time should be selected to grasp all interesting process dynamics.interesting process dynamics.
�� Input signal selectionInput signal selection
(look at magnitude distribution and input/output (look at magnitude distribution and input/output
Systems modelling from data 17
(look at magnitude distribution and input/output (look at magnitude distribution and input/output distribution of the data)distribution of the data)
-2 -1 0 1 2 30
20
40
60
80
100
120
-1 -0.8 -0.6 -0.4 -0.2 0 0.2 0.4 0.6 0.8 1-0.4
-0.3
-0.2
-0.1
0
0.1
0.2
0.3
0.4
0.5
u
y
Vhodno /ihodni pari podatkovInput/output pairs of data
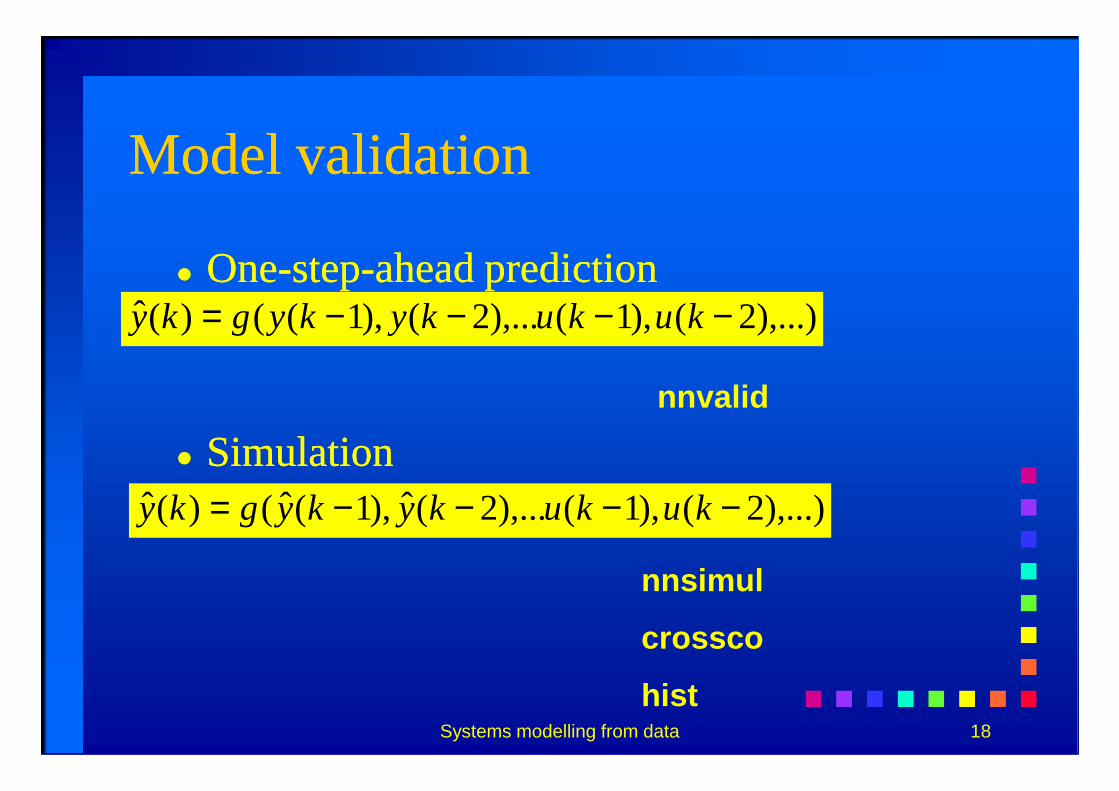
Model validationModel validation
�� OneOne--stepstep--ahead predictionahead prediction
nnvalid
),...)2(),1(),...2(),1(()(ˆ −−−−= kukukykygky
Systems modelling from data 18
�� SimulationSimulation
nnsimul
crossco
hist
nnvalid
),...)2(),1(),...2(ˆ),1(ˆ()(ˆ −−−−= kukukykygky
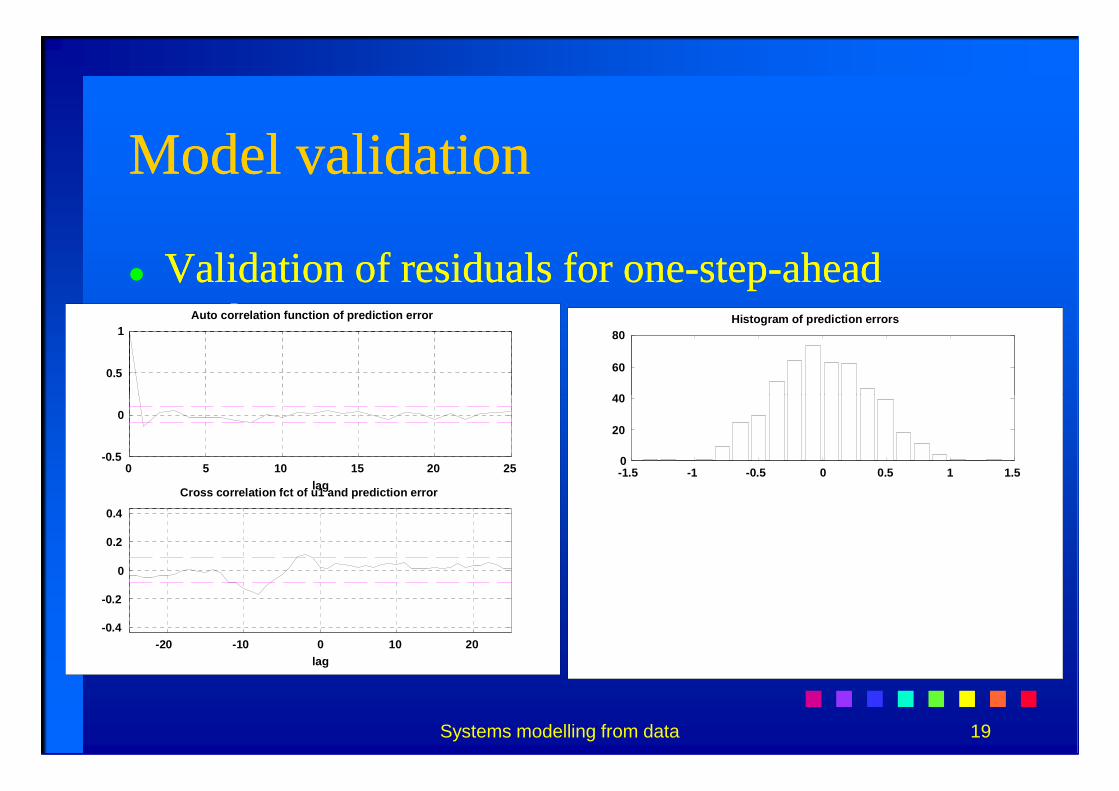
Model validationModel validation
�� Validation of residuals for oneValidation of residuals for one--stepstep--ahead ahead predictionprediction
0.5
1Auto correlation function of prediction error
40
60
80Histogram of prediction errors
Systems modelling from data 19
0 5 10 15 20 25-0.5
0
lag
-20 -10 0 10 20-0.4
-0.2
0
0.2
0.4
lag
Cross correlation fct of u1 and prediction error
-1.5 -1 -0.5 0 0.5 1 1.50
20
40

Model validationModel validation
�� The cThe consistenonsistency of input/output responsecy of input/output response�� OneOne--stepstep--ahead predictionahead prediction
��2
3Output (dashed) and simulated output (solid)
),...)2(),1(),...2(),1(()(ˆ −−−−= kukukykygky
Systems modelling from data 20
�� Simulation Simulation ��
0 100 200 300 400 500-4
-3
-2
-1
0
1
2
time (samples)
),...)2(),1(),...2(ˆ),1(ˆ()(ˆ −−−−= kukukykygky
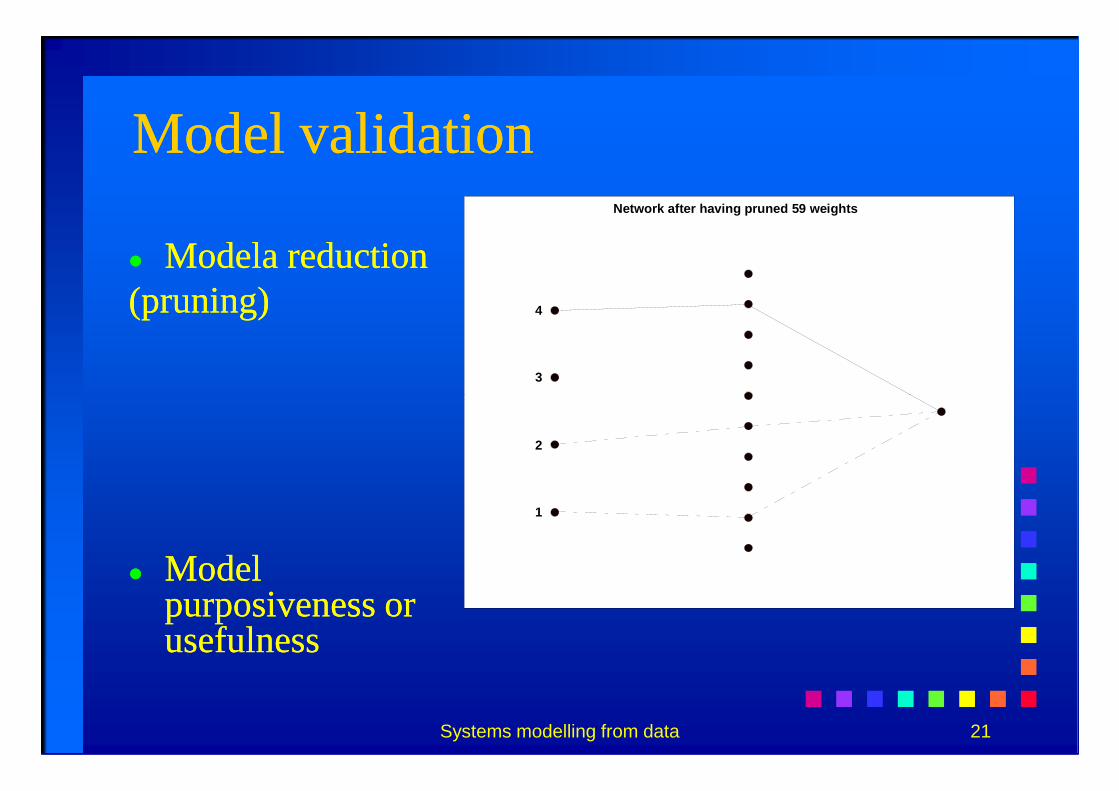
Model validationModel validation
�� MModelaodela reduction reduction (pruning)(pruning)
Network after having pruned 59 weights
3
4
Systems modelling from data 21
�� Model Model purposiveness or purposiveness or usefulnessusefulness
1
2

Example of identification of 1st Example of identification of 1st order systemorder system
Mathematical model of the process with Mathematical model of the process with parametersparameters
Systems modelling from data 22
parametersparameters
( )3)1()1(tanh5.0)1()( −+−−−= kukykykyu – input signal
y – output signal

Nonlinearity of the systemNonlinearity of the system
2
4y(
k+1)
Systems modelling from data 23
-3-2
-10
12
3
-2
0
2
-4
-2
0
u(k)y(k)
y(k+
1)

Estimation signal and responseEstimation signal and responseValidation signal and responseValidation signal and response
0 10 20 30 40 50 60 70 80 90 100-2
-1
0
1
2Vhodni signal za identifikacijo
Cas
1
2Odziv sistema za identifikacijo
2Vhodni signal za vrednotenje
Input estimation signal
Input validation signal
ResponseTime
Systems modelling from data 24
0 10 20 30 40 50 60 70 80 90 100-2
-1
0
Cas0 10 20 30 40 50 60 70 80 90 100
-2
-1
0
1
2
Cas
0 10 20 30 40 50 60 70 80 90 100-2
-1
0
1
2Odziv sistema za vrednotenje
Cas
Response
Time
Time
Time
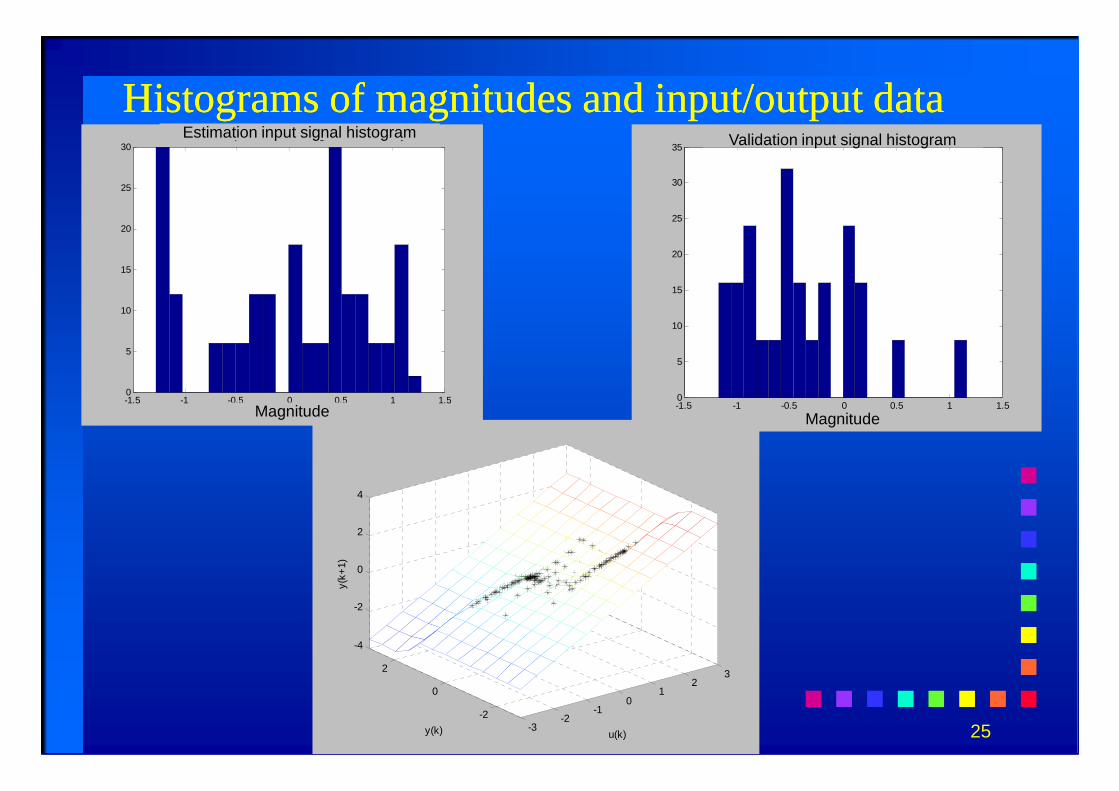
Histograms of magnitudes and input/output dataHistograms of magnitudes and input/output data
-1.5 -1 -0.5 0 0.5 1 1.50
5
10
15
20
25
30Porazdelitev amplitud na vhodnem signalu za identifikacijo
0
5
10
15
20
25
30
35Porazdelitev amplitud na vhodnem signalu za vrednotenjeEstimation input signal histogram Validation input signal histogram
Systems modelling from data 25
-1.5 -1 -0.5 0 0.5 1 1.50
Amplituda signala-1.5 -1 -0.5 0 0.5 1 1.50
Amplituda signala
-3-2
-10
12
3
-2
0
2
-4
-2
0
2
4
u(k)y(k)
y(k+
1)
Magnitude Magnitude

Neural network, regressors, structure and Neural network, regressors, structure and parametersparameters
Used software:NNSYSID Toolbox for Matlab
Regressors:y(k-1), u(k-1)
Structure:ARX (model error method)
2
Systems modelling from data 26
ARX (model error method)
Optimisation method:Levenberg-Marquardt
1
=
1.7123 1.3841 0.8411
1.8379 1.2029- 0.3366
0.4768 0.3190 1.5149-
0.8670- 0.0499 0.5155
1.9530- 2.0621- 0.5588-
1W[ ]0.0580- 1.4048 1.1704 0.0810 1.7784 1.2054 2 =W

Model validation (oneModel validation (one--stepstep--ahead prediction)ahead prediction)
-2
0
2
4
y(k+
1)
-2
0
2
4
y(k+
1)
Systems modelling from data 27
-3-2
-10
12
3
-2
0
2
-4
-2
u(k)y(k)-3-2
-10
12
3
-2
0
2
-4
-2
u(k)y(k)

Validation of residuals (oneValidation of residuals (one--stepstep--ahead ahead prediction)prediction)
0.5
1
Systems modelling from data 28
-3-2
-10
12
3
-2
0
2
-1
-0.5
0
0.5
u(k)y(k)
napa
ka

Model response and original system’s response on validation data (simulation, not one-step-ahead prediction)
1
1.5
2Odziv sistema na signal za vrednotenje - simulacijaSimulation response
Systems modelling from data 290 10 20 30 40 50 60 70 80 90 100
-2
-1.5
-1
-0.5
0
0.5
CasTime

Residuals of simulated valdiation Residuals of simulated valdiation datadata
0.5
1Avtokorelacija izhodnega pogreška
1Križna korelacija vhodnega signala in izhodnega pogreška
-0.6 -0.4 -0.2 0 0.2 0.4 0.6 0.80
20
40
60
80
100
120
140Porazdelitev pogreška
Residuals autocorrelation
Cross-correlation between e and u
Systems modelling from data 30
-100 -80 -60 -40 -20 0 20 40 60 80 100-0.5
0
Tau [s]
-100 -80 -60 -40 -20 0 20 40 60 80 100-1
-0.8
-0.6
-0.4
-0.2
0
0.2
0.4
0.6
0.8
Tau [s]
Examination assignmentExamination assignmentSelect a discrete nonlinear system of the 1st order, identify it and make a written report. The report should contain the following items:
� mathematical model of the original system with all parameters;
Simulation scheme or Matlab code that enables
Systems modelling from data 31
� Simulation scheme or Matlab code that enables rerun of data acquisition (no masks);
� Show the nonlinearity of the system in 3D plot;
� Estimation signal and response, sampling time;
� Validation signal and response, sampling time;

� Histograms of magnitudes and input/output data pairs;
� Type of neural network and optimisation method;
� Figure of the final network structure;
� Values of parameters (weights);
� Figure of comparison between original system simulation response and model simulation response on validation signal.
Systems modelling from data 32
� Simulation residuals validation on validation data
(the figure of residuals, residuals histogram, φee, φue ).
Eksperiments should be repeatable based on your report only. Reports should not be longer than 6 pages.