dynamic study of blood-brain barrier closure after its
TRANSCRIPT

HAL Id: cea-00739117https://hal-cea.archives-ouvertes.fr/cea-00739117
Submitted on 5 Oct 2012
HAL is a multi-disciplinary open accessarchive for the deposit and dissemination of sci-entific research documents, whether they are pub-lished or not. The documents may come fromteaching and research institutions in France orabroad, or from public or private research centers.
L’archive ouverte pluridisciplinaire HAL, estdestinée au dépôt et à la diffusion de documentsscientifiques de niveau recherche, publiés ou non,émanant des établissements d’enseignement et derecherche français ou étrangers, des laboratoirespublics ou privés.
Dynamic study of blood-brain barrier closure after itsdisruption using ultrasound: a quantitative analysis.
Benjamin Marty, Benoit Larrat, Maxime van Landeghem, Caroline Robic,Philippe Robert, Marc Port, Denis Le Bihan, Mathieu Pernot, Mickael
Tanter, Franck Lethimonnier, et al.
To cite this version:Benjamin Marty, Benoit Larrat, Maxime van Landeghem, Caroline Robic, Philippe Robert, et al..Dynamic study of blood-brain barrier closure after its disruption using ultrasound: a quantitativeanalysis.. Journal of Cerebral Blood Flow and Metabolism, Nature Publishing Group, 2012, 32 (10),pp.1948-58. �10.1038/jcbfm.2012.100�. �cea-00739117�

Confidential: For Review O
nly
Dynamic study of blood brain barrier closure after its
disruption using ultrasound: a quantitative analysis.
Journal: Journal of Cerebral Blood Flow and Metabolism
Manuscript ID: Draft
Manuscript Type: Original Articles
Date Submitted by the Author: n/a
Complete List of Authors: Marty, Benjamin; CEA/DSV/I2BM/NeuroSpin, LRMN Larrat, Benoit; CEA/DSV/I2BM/NeuroSpin, LRMN Van Landeghem, Maxime; PPMD, ESPCI ParisTech, CNRS UMR 7615 Robic, Caroline; Guerbet, Research Department Robert, Philippe; Guerbet, Research Department Port, Marc; Guerbet, Research Department Le Bihan, Denis; CEA/DSV/I2BM/NeuroSpin, LRMN Pernot, Mathieu; Institut Langevin, ESPCI ParisTech, CNRS UMR 7587, INSERM U979 Tanter, Mickael; Institut Langevin, ESPCI ParisTech, CNRS UMR 7587, INSERM U979 Lethimonnier, Franck; CEA/DSV/I2BM/NeuroSpin, LRMN Mériaux, Sébastien; CEA/DSV/I2BM/NeuroSpin, LRMN
Keywords: MRI, Molecular imaging, Pharmacology, Ultrasound, Blood brain barrier
Journal of Cerebral Blood Flow and Metabolism

Confidential: For Review O
nly
1
Dynamic study of blood brain barrier closure after its disruption using
ultrasound: a quantitative analysis.
Benjamin Marty1 (MSc), Benoit Larrat1,2 (PhD), Maxime Van Landeghem3 (PhD), Caroline
Robic4 (PhD), Philippe Robert4
(PhD), Marc Port4 (PhD), Denis Le Bihan1 (MD, PhD),
Mathieu Pernot2 (PhD), Mickael Tanter2 (PhD), Franck Lethimonnier1 (PhD) and Sébastien Mériaux1 (PhD)
1NeuroSpin, I2BM, Commissariat à l’Énergie Atomique, Gif-sur-Yvette, France 2Institut Langevin, ESPCI ParisTech, CNRS UMR 7587, INSERM U979, Paris, France 3PPMD, ESPCI ParisTech, CNRS UMR 7615, Paris, France 4Guerbet Research Division, Roissy-Charles de Gaulle, France
Running title: Study of BBB closure US-induced disruption
Corresponding author:
Sébastien Mériaux, [email protected]
CEA Saclay, DSV/I2BM/NeuroSpin, Bâtiment 145 – Point courrier 156
91191 Gif-Sur-Yvette CEDEX
Phone : +33169089423
Fax : +33169087980
Grant sponsor:
Iseult/Inumac French-German project.
Page 1 of 33 Journal of Cerebral Blood Flow and Metabolism
123456789101112131415161718192021222324252627282930313233343536373839404142434445464748495051525354555657585960

Confidential: For Review O
nly
2
Abstract
Delivery of therapeutic or diagnostic agents to the brain is majorly hindered by the
blood-brain barrier (BBB). Recently, many studies have demonstrated local and transient
disruption of the BBB using low power ultrasound sonication combined with intravascular
microbubbles. However, BBB opening and closure mechanisms are properly understood,
especially the maximum gap that may be safely generated between endothelial cells and the
duration of opening of the BBB. Here we studied BBB opening and closure under MR
guidance in a rat model. First, MR contrast agents (CA) of different hydrodynamic diameters
(1 – 65 nm) were employed to estimate the largest molecular size permissible across the
cerebral tissues. Secondly, to estimate the duration of the BBB opening, the CA were injected
at various times post-BBB disruption (12 min – 24 h). A T1 mapping strategy was developed
to assess CA concentration at the US focal point. Based on our experimental data and BBB
closure modeling, a calibration curve was obtained to compute the half closure time as a
function of CA hydrodynamic diameter. These findings and the model provide an invaluable
basis for optimal design and delivery of nanoparticles to the brain.
Key words: BBB disruption, MR contrast agent, MRI, T1 mapping, ultrasound, nanoparticles
Page 2 of 33Journal of Cerebral Blood Flow and Metabolism
123456789101112131415161718192021222324252627282930313233343536373839404142434445464748495051525354555657585960
Confidential: For Review O
nly
3
Introduction
Cerebral tissues are isolated from circulating blood by the blood brain barrier (BBB)
(Rubin and Staddon 1999). This physiological barrier consists of a lining of tightly packed
vascular endothelial cells, different from the peripheral blood vessels (Hawkins and Davis
2005). The tight junctions between these cells restrict the diffusion of microscopic objects
(e.g. bacteria) and of large, hydrophilic molecules (>400 Da) from blood to brain
parenchyma, while allowing the passage of small, hydrophobic molecules such as O2, CO2,
proteins, and metabolites (Pardridge 2005). Because of the neuroprotective nature of the BBB,
delivery of potentially important diagnostic and therapeutic agents is a major challenge in the
treatment of most brain disorders. Strategies to design specific drugs targeted to the brain
involve finding an efficient mode of drug delivery across the BBB.
Recently, it has been demonstrated that the use of low power focused ultrasound
combined with a systemic injection of lipid- (or polymer-) shelled microbubbles enables a
non-invasive, local and transient disruption of the BBB (Hynynen et al 2001). Many studies
were then carried out to (i) establish optimal ultrasound parameters that permit adequate
tissular penetration without causing tissue damage (Choi et al 2006; Hynynen et al 2005;
O'Reilly et al 2010; O'Reilly et al 2011a; O'Reilly et al 2011b; Sheikov et al 2008), (ii)
quantify permeability of the disrupted brain tissue (Vlachos et al 2010; Vlachos et al 2011),
and (iii) evaluate responses to treatments of particular brain disorders including tumors (Chen
et al 2010; Liu et al 2010; Treat et al 2009) and Alzheimer’s disease (Jordao et al 2010;
Raymond et al 2008). Most of these studies used magnetic resonance contrast agents (MR-
CA) for monitoring the processes.
Despite a rapidly growing number of studies, the mechanism of ultrasound-induced
BBB opening is understood only poorly. In particular, the maximum space that can be safely
generated (ensuring reversibility) between endothelial cells, and the duration for which this
Page 3 of 33 Journal of Cerebral Blood Flow and Metabolism
123456789101112131415161718192021222324252627282930313233343536373839404142434445464748495051525354555657585960

Confidential: For Review O
nly
4
opening lasts, have not been measured. The knowledge of these parameters is crucial for the
current development of brain targeted nanoparticles. Functionalized MR-CA for instance, are
available in a wide range of hydrodynamic diameters: gadolinium chelates, a few nm
(Wadghiri et al 2003), iron nanoparticles, 25-100 nm (Mendonca Dias and Lauterbur 1986;
Renshaw et al 1986), gadolinium based emulsions or liposomes, 200-300 nm (Devoisselle et
al 1988), and have very different vascular remanences, ranging from a few minutes to tens of
hours. An estimate of the time window during which a molecule of a given size may be
delivered across the BBB would be useful to monitor the amount of drug released to cerebral
tissue and to adjust the dosage. For example, it has been shown that 3 – 8 nm wide particles
are able to cross BBB 20 min after its ultrasound-induced disruption, but not particles of size
50 nm (Choi et al 2010). Additionally, as the brain is unprotected while the BBB is open, it is
important to know the time-to-recovery to limit any possible brain damages induced by
tissular penetration of pathogenic agents.
The quantification of the amount of MR-CA crossing the BBB requires development
of molecular imaging sequences via imaging techniques that are sensitive (high field MRI)
and provide outputs that can be correlated with the MR-CA concentration. Contrast agent
(CA) quantification is one of the principal challenges for MR molecular imaging. Unlike
other techniques such as fluorescence or nuclear imaging where the received signal comes
directly from the CA, MR signal comes from the surrounding water protons and is therefore
indirectly related to the presence of an exogenous probe. To quantify the CA concentration
using MRI, it is necessary to model its interaction with the surrounding water molecules.
Paramagnetic complexes interact with the surrounding water protons by decreasing their
relaxation times (Swift and Connick 1962). CA concentration can be linked to the T1 or T2
relaxation time decrease (in ms). In this study, we adapted a T1 mapping sequence proposed
by Deichmann and colleagues (Deichmann and Haase 1992; Deichmann et al 1999) that
Page 4 of 33Journal of Cerebral Blood Flow and Metabolism
123456789101112131415161718192021222324252627282930313233343536373839404142434445464748495051525354555657585960

Confidential: For Review O
nly
5
permitted estimation of a wide range of T1 values with a good accuracy, and high spatial and
temporal resolutions.
In this study, a calibrated BBB opening procedure was performed in healthy young
adult rats under MR guidance. Five MR-CA were used (3 paramagnetic and 2 super-
paramagnetic) with different hydrodynamic diameters (from 1 to 65 nm) to investigate the
maximum permissible size of the gaps induced in the endothelial wall under safe conditions.
Then, using the T1 mapping strategy for the 3 paramagnetic CA we quantified the amount of
particles crossing the BBB when injected at different times after ultrasound-induced BBB
disruption. This enabled quantitative monitoring of the dynamics of BBB closure for each
given molecular size. Lastly, we present a theoretical model to fit the experimental data and
derive a calibration curve to predict duration of BBB opening as a function of the
hydrodynamic diameter of a given CA.
Materials and Methods
Animal Preparation
All experiments were performed in accordance with the recommendations of the
European Community (86/609/EEC) and the French legislation (decree no. 87/848) for use
and care of laboratory animals. A total of 36 Sprague Dawley male rats (80-100 g, Janvier,
France) were used. Their head was shaved to ensure proper coupling of the ultrasound beam
to the brain. Rats were anesthetized with 1.5% isoflurane in a mixture of air and oxygen and
placed in a cradle in prone position. A catheter (25 G needle) was positioned in the caudal
vein to inject microbubbles and MR-CA from outside the scanner with minimal dead volume.
10% heparin was added to all injected solutions to avoid clot formation in the catheter. Body
temperature and respiration rate were continuously monitored during the experiments.
Page 5 of 33 Journal of Cerebral Blood Flow and Metabolism
123456789101112131415161718192021222324252627282930313233343536373839404142434445464748495051525354555657585960
Confidential: For Review O
nly
6
MR-CA
MR-CA of different hydrodynamic diameters were provided by Guerbet Research
(France). Main characteristics and injected doses of these nanoparticles are summarized in
Table 1. After each MR-CA injection, the bolus was flushed by injection of 100 µl of saline
solution. Three of the five MR-CA were paramagnetic Gd-chelates (Dotarem®, P846, and
P792) and were detected and quantified using T1 strategies (Kang et al 2010; Protti et al 2010;
Yankeelov et al 2006). The other two CA (P904 and P03680) were USPIO. A T2 -weighted
sequence was use to detect them in cerebral tissues (Hyodo et al 2009; Philippens et al 2004).
Longitudinal r1 and transverse r2 relaxivities were measured in vitro at 7T using galleries of
tubes containing different concentrations of CA diluted in a 0.3% agar matrix, and maintained
at 37°C.
Ultrasound equipment
A MR-compatible focalized transducer (central frequency 1.5 MHz, diameter 30 mm,
focal depth 20 mm, Imasonic, France) driven by a programmable function generator was used
to produce ultrasound waves. It was coupled to the rat skull using a latex balloon filled with
deionized and degassed water. Electrical power sent to the transducer was monitored during
the BBB opening session. Main characteristics of the transducer (focal point size
0.6×0.6×3 mm3, transcranial acoustic transmission factor 52 ± 5 %) were estimated in a
previous study [40].
BBB opening
BBB disruption was performed during MR imaging session thanks to a dedicated
holder maintaining the ultrasound transducer above rat head. Its position was monitored
using the ARFI sequence and the right thalamus in the brain was chosen as a target for BBB
Page 6 of 33Journal of Cerebral Blood Flow and Metabolism
123456789101112131415161718192021222324252627282930313233343536373839404142434445464748495051525354555657585960

Confidential: For Review O
nly
7
disruption. Sonovue® microbubbles (Bracco, Italy) were administrated via a bolus (1.5 × 10⁸
bubbles/ml, 200 µl, 2 s) approximately 5 s before the beginning of ultrasound session. The
bolus was flushed by injection of 100 µl of saline solution. Sonication was performed with
3 ms bursts every 100 ms for one minute (Choi et al 2011). The peak negative acoustic
pressure at the ultrasound focal point was calibrated to 0.45 MPa, a level sufficiently low to
ensure safe and reversible BBB opening (Larrat et al 2011; Chopra et al 2010). Anatomical
images were acquired at the end of each MRI session to verify integrity of the brain tissues.
MRI acquisitions
MRI was performed on a 7T/90 mm Pharmascan scanner (Bruker, Germany). A saddle
coil was specially designed in-house for excitation and signal reception. The geometry and
size of the resonator (diameter 30 mm) were optimized to maximize the overall signal-to-
noise ratio over the whole brain while allowing the ultrasound beam to propagate from the
transducer to the rat brain.
A multislice spin-echo sequence was modified to include additional motion-sensitizing
gradients, and synchronized to ultrasonic bursts so that the phase signal was proportional to
local acoustic intensity (Larrat et al 2010; McDannold and Maier 2008). This ARFI sequence
was acquired with the following parameters: TE/TR = 40/1700 ms, Tacq = 4 min,
R = 0.5×0.5×1 mm3, duration of the motion encoding gradients = 13.3 ms, duration of the
sonication = 3 ms.
A high spatial resolution T2-weighted RARE sequence (TEeff/TR = 32/4200 ms, R =
0.125×0.125×0.3 mm3) was used to detect the presence of USPIOs, and also for acquiring
images at the end of every experiment to confirm lack of haemorrhages or edema due to
Page 7 of 33 Journal of Cerebral Blood Flow and Metabolism
123456789101112131415161718192021222324252627282930313233343536373839404142434445464748495051525354555657585960
Confidential: For Review O
nly
8
ultrasound. T1-weighted MSME sequence (TE/TR = 8/300 ms, R = 0.250×0.250×1 mm3) was
acquired to detect paramagnetic Gd-chelates.
To measure concentration of Gd-chelates, a T1 mapping sequence was acquired before
and after MR-CA injection. It consisted in a segmented series of fast gradient echo (FGE)
images acquired at different time points after magnetization inversion in order to follow the
entire T1 recovery curve [24, 25]. Sequence parameters were: TR1, 5 ms, TE, 2.5 s, 6
segments, 60 inversion times (from 64 to 5800 ms), flip angle, 5°, and R = 0.2×0.2×1 mm3.
Repetition time between the acquisitions of two segments, TR2, was 9 s, and total acquisition
time is 12.5 min. A centric encoding of the k-space was chosen in order to avoid T2 effects
during echo trains at the acquisition of central lines.
Data analysis
Data were analyzed using dedicated codes written in Matlab software (MathWorks,
USA). Maps of acoustic pressure index (IPac) were deduced from ARFI sequence using the
following equation:
th
OFFON
acP
IPϕϕϕϕϕϕϕϕ −−−−
∝∝∝∝ (1)
where φON (respectively φOFF) is the phase of ARFI signal acquired with ultrasound
(respectively without ultrasound), and Pth is the expected acoustic pressure at the focal point
in case of an ideal ultrasound coupling. In a previous study (Larrat et al 2010), we verified the
linearity between acoustic intensity and MR-ARFI phase signal using the same setup. In
another study (Larrat et al 2011), we also characterized and verified the linearity between
acoustic pressure and the amount of MR-CA crossing the BBB in the range of acoustic
pressure values applied here.
Page 8 of 33Journal of Cerebral Blood Flow and Metabolism
123456789101112131415161718192021222324252627282930313233343536373839404142434445464748495051525354555657585960
Confidential: For Review O
nly
9
To generate T1 maps, the MRI signal measured with the FGE sequence was fitted as a
function of the inversion time pixel by pixel as proposed by Deichmann and colleagues [24,
25]. MR-CA concentration maps (C) were then calculated from the T10 and the T1 maps after
MR-CA injection using the following equation (Swift and Connick 1962), considering that
relaxivities r1 measured in vitro in agar matrix hardly differ from the ones in rat brain tissues:
−−−−====
1011
111
TTrC (2)
Signals from different manually drawn ROIs were analyzed. A ROIspot of 0.6×0.6×3 mm3
corresponding to the transducer focal point size was drawn in the right thalamus. To analyze
the effect of BBB disruption, a similar ROIcontra was taken in the corresponding contralateral
(left thalamus) region of the brain. This enabled correction for the residual vascular
concentration of MR-CA during imaging. Another control ROI was drawn in an extracerebral
region in the cheek muscles (ROImuscle). For each rat, a corrected MR-CA concentration at the
focal point (C* without unit) was calculated as given below, based on the concentration
measured at the ROIspot (CROIspot) and that at the control spots (CROIcontra and CROImuscle), and
the index of deposited acoustic pressure (IPac):
acmuscleROI
contraROIspotROI
IPC
CCC
.
*−−−−
==== (3)
This processing step was mandatory to ensure the correction of the bias introduced by unequal
injected volumes (unequal plasmatic concentrations) and the bias introduced by variations in
acoustic wave penetration through the skull. These corrections allowed comparing MR-CA
concentrations among animals.
Results
Low power, pulsed, ultrasound for localized disruption of BBB
Page 9 of 33 Journal of Cerebral Blood Flow and Metabolism
123456789101112131415161718192021222324252627282930313233343536373839404142434445464748495051525354555657585960

Confidential: For Review O
nly
10
In a rat model, BBB was opened transiently with the use of ultrasound, immediately
followed by intravenous injection of Dotarem® (gadolinium (Gd)-chelate) and measurement
of the amount of the MR-CA delivered across the BBB (Figure 1). Before the ultrasound
sonication, acoustic radiation force imaging (ARFI) was performed to obtain the acoustic
pressure map in the brain (Figure 1-A). This sequence was used to verify that the ultrasound
beam was focused at the desired point in the right thalamus, and to estimate the acoustic
pressure at this focal point prior to microbubbles injection, ensuring that the acoustic pressure
remains below a predetermined safety threshold (Chopra et al 2010; Larrat et al 2011). Once
the transducer was set at the desired position, Sonovue® microbubbles were injected
intravenously via a catheter positioned in the caudal vein, and the BBB was disrupted by
pulsed sonication for one minute. Dotarem® was then injected using the same catheter. To
measure the concentration of Dotarem® delivered, T1 maps were acquired before and after
MR-CA injection (Figure 1-B). There was high tissue perfusion of the CA (strong T1
decrease) in the cheek and neck muscles, but not in the brain tissue due to the BBB. As
expected, the ultrasound focal point (red arrow) was the only area of the brain exhibiting a
strong T1 decrease indicating BBB disruption. Based on T1 mapping, CA concentration maps
were obtained at the three selected regions of interest (ROIs): ultrasound focal point, ROIspot
(n°1), a control region contralateral to the ultrasound focal point, ROIcontra (n°2) and a region
in cheek muscles ROIcheeks (n°3) (Figure 1-C).
Maximum gap between endothelial cells after reversible ultrasound-induced disruption
of the BBB
In order to determine the size of gaps generated after ultrasound-induced disruption of
the BBB, we chose five different MR-CA of varying hydrodynamic diameters (Table 1) and
verified their passage across BBB at the ultrasound focal point. The CA were intravenously
Page 10 of 33Journal of Cerebral Blood Flow and Metabolism
123456789101112131415161718192021222324252627282930313233343536373839404142434445464748495051525354555657585960
Confidential: For Review O
nly
11
injected (n=1 rat for each CA) directly after ultrasound-induced BBB disruption. T1-weighted
(T1w) images were obtained for the 3 paramagnetic CA and T2-weighted (T2w) images for the
two ultrasmall superparamagnetic iron oxide (USPIO) CA (Figure 2). For all three Gd-
chelates, a positive contrast was clearly visible on T1w images at the ultrasound focal point,
revealing the presence of the CA. Student’s t-test performed on the measured MR signals
confirmed that signal differences between ROIspot and ROIcontra were significant (p < 0.01).
For the 25 nm USPIO, a negative contrast appeared on T2w images after its injection
suggesting that BBB was permeable to molecules of this size. Signal differences with
contralateral region were also significant (p < 0.01). However, the largest USPIO (65 nm) was
detected only at the very focal point of the transducer as its penetration was significantly
hindered compared to the smaller USPIO. The signal differences between ROIspot and
ROIcontra for this USPIO were not significant (p > 0.01) if the ROI was of the standard size
(0.6×0.6×3 mm3), but the differences became significant (p < 0.01) if the size of the ROIspot
was decreased to 0.2×0.2×1 mm3 around the focal point. These results suggest that 65 nm is
close to the maximal gap between endothelial cells that is attainable after BBB disruption
with this protocol.
Quantification of MR-CA concentration
Rats were injected with Dotarem® at increasing doses (375, 750 and 1500 µmol/kg,
n=1 rat per dose) following BBB disruption. Concentration maps acquired by T1 mapping
were overlaid on the anatomical T2w images (Figure 3-A). Additionally, a T1-weighted
MSME sequence was also acquired. The estimated CA concentration at the ultrasound focal
point was found to be proportional to the injected dose (C375 < C750 < C1500) (Figure 3-B). In
contrast, the T1w signals did not exhibit the same behavior and even saturated at high CA
injected doses (Figure 3-C). These observations confirm the high interest of our protocol to
Page 11 of 33 Journal of Cerebral Blood Flow and Metabolism
123456789101112131415161718192021222324252627282930313233343536373839404142434445464748495051525354555657585960

Confidential: For Review O
nly
12
precisely quantify small variations of CA concentration, and that quantitative analysis based
on T1w signals alone can be misleading. Hence, results presented in the following sections of
this study were all derived from quantitative data obtained using the T1 mapping sequence
(Equation 3).
Quantitative study of BBB closure dynamics
The BBB closure dynamics was assessed using paramagnetic CA of different
molecular sizes, administrated at different times after ultrasound-induced disruption. Rats
were injected with the following CA: Dotarem® (n=10 rats), P846 (n=10 rats) and P792 (n=8
rats) from 0 to 24 hours after ultrasound sonication. The reproducibility of CA delivery was
verified by measuring both the injected dose and the acoustic power deposited at the
ultrasound focal point. CA concentrations measured in the cheek muscles in each animal were
directly correlated with the injected dose since no permeability barrier like BBB exists in
muscles (Figure 4-A). Mean values were: 0.345 ± 0.034 mM for Dotarem® group,
0.061 ± 0.008 mM for P846 group and 0.040 ± 0.002 mM for P792 group. Variabilities
observed within the above three groups (10%, 13% and 5%, respectively) could be explained
by experimental errors during injection and also by slight variations in the weight or
metabolism of the animals. An index of the acoustic pressure (IPac) deposited at the focal
point was estimated from ARFI sequence (Figure 4-B) and was 1.13 ± 0.06 for Dotarem®
group, 1.00 ± 0.05 for P846 group and 0.97 ± 0.13 for P792 group. Variabilities observed
within the above three groups (5%, 5% and 13%, respectively) was mainly explained by slight
differences in the placement of the transducer on the heads. Variations in the incidence angle
of the ultrasound beam or in the thickness of the skull could have a significant impact on
attenuation of the beam during its passage through the skull and lead to variations of the peak-
negative acoustic pressure at the focal point.
Page 12 of 33Journal of Cerebral Blood Flow and Metabolism
123456789101112131415161718192021222324252627282930313233343536373839404142434445464748495051525354555657585960

Confidential: For Review O
nly
13
Corrected CA concentrations (C*) measured at the ultrasound focal point were plotted
as a function of the time elapsed between BBB disruption and MR-CA injection (Figure 4-C).
For Dotarem® (1 nm particle), the BBB was permeable for several hours post-BBB
disruption. A significant amount of CA was detectable in the brain even when injected 8 or 9
hours after disruption. Around 24 h post-disruption, the BBB had apparently recovered its
whole integrity, as very few CA were detectable in brain tissues. P846 (4 nm particle) was
delivered across the BBB only if injected within 2 hours post-BBB disruption. For P792
(7 nm particle), the duration of CA delivery to the brain was even shorter than for P846. One
hour post-BBB disruption, the amount of CA crossing the BBB was about 30% of its initial
value and dropped to undetectable levels after 90 minutes.
These findings confirmed that the duration of BBB crossing decreases when
increasing CA hydrodynamic diameter. Secondly, it appears from the shape of the time-
dependent concentration curve (Figure 4-C) that the BBB permeability decreased at a faster
rate initially and at a lesser rate later on.
A model for BBB closure dynamics
Based on the experimental observations, the BBB closure dynamics was modelled as
follows. First, it was assumed that each individual gap generated in the BBB by ultrasound
returns to its equilibrium position (i.e. closed) as a harmonic oscillator damped by fluid
friction. The gap diameter as a function of the time was therefore expressed as d(t) = d0e–kt,
where d0 is the gap diameter just after BBB disruption and k a time constant representative of
individual gap closure speed.
Next, the initial size distribution of gaps was assumed to be a hemi-Gaussian function
centered on 0 with a standard deviation σ0. These two conditions imply a distribution of gap
sizes as a function of time expressed as follows:
Page 13 of 33 Journal of Cerebral Blood Flow and Metabolism
123456789101112131415161718192021222324252627282930313233343536373839404142434445464748495051525354555657585960

Confidential: For Review O
nly
14
kte
x
kte
etxN
220
2
2
0
1),(
−−−−−−−−
−−−−∝∝∝∝ σσσσ
σσσσ (4)
For each time t, the amount QCA(t) of CA of hydrodynamic diameter dH crossing the
BBB in a unit volume post-disruption is proportional to the inflow flux only, since the
outflow of CA from brain to blood is assumed to be negligible due to high concentration in
the blood compartment. Assuming a hard sphere behavior for CA molecules, QCA(t) can be
expressed as follows:
∫∫∫∫+∞+∞+∞+∞
∝∝∝∝Hd H
CA dxd
xtxNtQ
2
).,()( (5)
The CA diffusion in brain outside of the BBB disrupted region is also neglected since the CA
tissular concentration is quantified within a few minutes after CA intravenous injection. A
previous study from our team (Marty et al 2010) showed that the Gd-chelates used in this
study do not diffuse fast enough in brain parenchyma to make this effect significant: for
example, the diffusion coefficient of Dotarem® (1 nm particle) was estimated around 46
µm2.s-1 (Table 1).
Integration of equation 5 gives:
++++
−−−−∝∝∝∝
−−−−−−−−
−−−−−−−−
−−−−kt
H
e
d
kt
H
kt
H
H
kt
CA ee
d
e
derf
d
etQ
220
2
2
00
220
21
2)(
σσσσ
σσσσσσσσππππσσσσ
(6)
All experimental data (n=28 rats) were used to fit this theoretical BBB closure model
and determine the two parameters: a characteristic gap diameter σ0 = 1.54 nm, and BBB
closure rate k = 1.54×10⁻⁵ s-1.
The half closure time (t1/2) was then defined as the time after disruption when the
concentration of CA crossing the BBB was 50% of the maximal concentration obtained
immediately after disruption. t1/2 was then calculated as the numerical solution of the
following equation:
Page 14 of 33Journal of Cerebral Blood Flow and Metabolism
123456789101112131415161718192021222324252627282930313233343536373839404142434445464748495051525354555657585960

Confidential: For Review O
nly
15
++++
−−−−====
++++
−−−−
−−−−−−−−
−−−−−−−−−−−−
−−−−2/122
0
2
2/12/1
2/120
2
2
00
22
00 21
221
22
1 kt
HH
e
d
kt
H
kt
Hkt
d
HH ee
d
e
derfee
dderf
σσσσσσσσ
σσσσσσσσππππ
σσσσσσσσππππ (7)
From the fitted parameters (σ0 and k), half closure times could be estimated as a
function of hydrodynamic diameters of the molecules by numerically solving equation 7
(Figure 5, black circles). The calculated half closure time was ~ 5.5 h for a 1 nm particle;
~ 1.5 h for a 4 nm particle and about 30 min for a 7 nm particle. These values were close to
those estimated experimentally for Dotarem®, P846 and P792, which were 5.2 h, 1.2 h and 45
min, respectively (Figure 5, red crosses).
For larger molecules, half closure times were greatly reduced (around 3 min for a
25 nm particle and only few seconds for a 65 nm particle). These results match the qualitative
results obtained with USPIOs (Figure 2). Therefore, to deliver a significant amount of larger
molecular size CA across the BBB their intravenous circulation should coincide with the end
of ultrasound sonication.
Lastly, it appears that the following analytical formula fits reasonably well the
numerical solution of equation 7, enabling to directly estimate half closure time as a function
of hydrodynamic diameter:
22/1.1 HdB
At
++++==== (8)
with A = 2.35×10⁴ s and B = 0.2106 nm-2 (Figure 5, solid line).
Discussion
Ultrasound-induced BBB disruption
Drug delivery to the brain remains a major challenge for the treatment of most brain
diseases. Although pathologies such as cancer degrade BBB integrity (Liu et al 2012), it was
proven that endothelial wall permeability is still poorer in these regions than in vessels of
Page 15 of 33 Journal of Cerebral Blood Flow and Metabolism
123456789101112131415161718192021222324252627282930313233343536373839404142434445464748495051525354555657585960

Confidential: For Review O
nly
16
other organs. Recently, ultrasound-induced BBB disruption was demonstrated to be an
effective method of significantly increasing permeability of the blood-tumor barrier in a
controlled manner (Chen et al 2010). Another study reported that vessel wall permeability
after ultrasound-induced BBB disruption was comparable to permeability values for
unprotected organs (Vlachos et al 2010). Our study further demonstrates that ultrasound
combined with intravenous injection of microbubbles is a reliable, reproducible and non-
invasive technique to deliver nanoparticles with hydrodynamic diameters up to 65 nm.
Moreover, in our protocol, no edema or hemorrhages were detected on T2w images following
ultrasound sonication. Animals kept alive for several weeks after undergoing BBB disruption
showed no adverse effects. The observation of a return to basal permeability within 24 hours
for the smallest available CA (1 nm) further proved that the disruption was transient and
reversible.
MR guidance
The ultrasound-induced BBB disruption described here was performed entirely under
high-field MRI guidance. This is a challenge as it requires integrating a stereotactic frame, a
MR-compatible ultrasound transducer adapted to the geometry of the rodent head and a
dedicated radiofrequency (RF) coil fitted into the 8.5 cm bore of a preclinical MRI scanner.
The optimized RF coil allowed the quantification of Gd MR-CA at a micromolar range, with
sufficient signal homogeneity over the whole brain and the ability for the ultrasound beam to
propagate through the coil.
The anesthetized animal was placed inside the MRI scanner just before the start of the
BBB disruption procedure till recovery. Thus, it was possible to obtain an acoustic intensity
map before BBB disruption. This ensured a proper positioning of the ultrasound focal spot in
the right thalamus and a precise in situ calibration of the acoustic pressure to avoid
Page 16 of 33Journal of Cerebral Blood Flow and Metabolism
123456789101112131415161718192021222324252627282930313233343536373839404142434445464748495051525354555657585960

Confidential: For Review O
nly
17
irreversible tissue damage. Furthermore, microbubbles were injected to cause ultrasound-
induced BBB disruption followed by injection of MR-CA via the same the catheter, which
allowed imaging of the early events post-BBB disruption.
Maximum gap obtained between endothelial cells
CA of increasing hydrodynamic sizes were tested, and the maximum gap width
generated between endothelial cells after BBB disruption was estimated with our acoustic
parameters. Gaps slightly above 65 nm could be generated safely, and the BBB recovered full
integrity within 24 h. The mechanical index of our set-up was 0.37 which is below the
standard value proposed by other studies for reversible BBB opening (McDannold et al
2008). This result is particularly interesting from the view of development of targeted CA.
Using a similar sonoporation protocol, it would be possible to deliver nanoparticles such as
USPIOs, functionalized to target tissular biomarkers. In contrast, larger objects like emulsions
or liposomes that typically have hydrodynamic diameters >100 nm, would be difficult to
deliver to the brain using this technique, assuming a purely paracellular pathway. In general,
an estimate of the maximum possible gap diameter would be helpful when the technique is
applied to deliver therapeutic molecules. Several therapeutic drugs could benefit from this
information: for instance chemotherapeutic drugs such as Avastin® (dH ~ 10 nm),
recombinant adeno-associated virus (rAAV) vectors for gene therapy (dH ~ 20 nm),
monoclonal antibodies such as anti-β-amyloid (dH of few nm), and vectorized short interfering
RNA (siRNA) used for gene expression modulation (dH ~ 50 nm).
The maximum gap diameter measured in this study is probably dependent of the
sonication parameters, in particular ultrasound frequency, pulse duration and duty cycle, total
sonication time and size distribution of injected microbubbles (Sonovue® has a broad
distribution between 1-8 µm). Here, we chose well established parameters that have been
Page 17 of 33 Journal of Cerebral Blood Flow and Metabolism
123456789101112131415161718192021222324252627282930313233343536373839404142434445464748495051525354555657585960

Confidential: For Review O
nly
18
proposed by others (Choi et al 2011). Several groups have studied the influence of acoustic
parameters (O'Reilly et al 2011a) and microbubbles size (Samiotaki 2011) on BBB opening.
An optimization of parameters based on the knowledge gained from these studies may allow
generation of pores larger than 65 nm wide.
BBB closure dynamics
In this study, the concentration of paramagnetic CA delivered at the ultrasound focal
point was quantitatively measured, based on which, the duration of passage across the BBB
was estimated for molecules of different sizes. This duration decreased rapidly as a function
of hydrodynamic diameter of the CA. For instance, small molecules (around 1 nm) continued
to cross the BBB for more than 10 h, whereas large iron oxide particles (around 25 nm) had a
time window of only a few minutes. Therefore, to maximize the amount of extravasation in
the brain, large molecules should be injected right after or even during ultrasound sonication.
The results presented here also suggest a closure of the BBB at a progressively
decreasing rate. We present a simple, damped, elastic model assuming an exponential decay
of individual gap sizes to semi-quantitatively describe the observed dynamics of BBB closure.
The experimental data were fed in the model to derive important physiological parameters,
such as the typical closure time constant k that was estimated to be 1.54×10⁻⁵ s-1. This
parameter is an indirect measurement of rate of endothelial cell relaxation after contraction. It
could be used as a physio-pathological index of vessel integrity.
This model assumes a paracellular passage of injected molecules with an inflow
limited by the size of the molecule relative to the size of the pores. Our results support the
notion that most of the crossing happens between endothelial cells rather than through them.
This reinforces the hypothesis that during ultrasound-induced BBB opening sonicated
Page 18 of 33Journal of Cerebral Blood Flow and Metabolism
123456789101112131415161718192021222324252627282930313233343536373839404142434445464748495051525354555657585960
Confidential: For Review O
nly
19
microbubbles exert a mechanical stress on endothelial cells which makes them contract on
themselves and loosen the junctions between them creating gaps (Vykhodtseva et al 2008).
Limitations of the study
The proposed BBB closure model has certain limitations. It does not take into account
potential increased permeability of endothelial cell membranes (transcellular BBB crossing).
It does not distinguish between hydrophilic and lipophilic molecules although it is known that
lipophilic agents present an increased ability to cross the BBB via transcytosis (Pardridge
2005). This concurrent release pathway could explain the observed differences between
experimental data of P846 and P792 and predictions from the theoretical model.
The three Gd-chelates compared in this study have similar but not equal vascular
remanences (Table 1). The tissular concentrations were measured within 12.5 minutes after
CA injection, which is not a negligible time delay as the plasmatic half-life of the CA are
between 26 and 51 min (Fries et al 2009). Although during data processing the differences in
overall injected plasmatic concentration were corrected for each CA (Equation 3), temporal
variations of vascular concentrations during the T1 mapping acquisition could be different
from one CA to the other, none of them remaining strictly steady. The impact of these
variations may be low since the MRI mapping acquisition was performed with a centric
encoding scheme. Nevertheless, it may explain the differences between the theoretical model
and the experimentally measured closure dynamics for the different molecules.
Conclusion
In this study, we developed a complete methodology for noninvasive, reversible and
controlled ultrasound-induced BBB disruption under MR-guidance that permitted precise
quantification of the amount of MR-CA delivered to brain parenchyma in a rat model. The
Page 19 of 33 Journal of Cerebral Blood Flow and Metabolism
123456789101112131415161718192021222324252627282930313233343536373839404142434445464748495051525354555657585960

Confidential: For Review O
nly
20
two key parameters in designing drug delivery across the BBB, namely, the largest
deliverable molecular size of the agent, and the time window for delivery of an agent of a
given molecular size, were estimated for the first time.
Acknowledgements
Authors would like to thank M. Leopoldie for providing animal care, B. Bresson for
RF coil support and Dr. A. Alahari for editing this manuscript.
Disclosure/Conflict of interest
Authors declare no conflict of interest.
Page 20 of 33Journal of Cerebral Blood Flow and Metabolism
123456789101112131415161718192021222324252627282930313233343536373839404142434445464748495051525354555657585960

Confidential: For Review O
nly
21
References
Chen P-Y, Liu H-L, Hua M-Y, Yang H-W, Huang C-Y, Chu P-C, Lyu L-A, Tseng IC, Feng L-Y, Tsai H-C, Chen S-M, Lu Y-J, Wang J-J, Yen T-C, Ma Y-H, Wu T, Chen J-P, Chuang J-I, Shin J-W, Hsueh C, Wei K-C (2010) Novel magnetic/ultrasound focusing system enhances nanoparticle drug delivery for glioma treatment. Neuro-Oncology 12:1050-60 Choi JJ, Small SA, Konofagou EE (2006) Optimization of blood-brain barrier opening in mice using focused ultrasound. 2006 IEEE Ultrasonics Symposium (IEEE Cat
No06CH37777) Choi JJ, Wang S, Tung Y-S, Morrison B, III, Konofagou EE (2010) Molecules of various pharmacologically-relevant sizes can cross the ultrasound-induced Blood-Brain Barrier opening in vivo. Ultrasound Med Biol 36:58-67 Choi JJ, Selert K, Gao Z, Samiotaki G, Baseri B, Konofagou EE (2011) Noninvasive and localized blood-brain barrier disruption using focused ultrasound can be achieved at short pulse lengths and low pulse repetition frequencies. J Cereb Blood Flow Metab 31:725-37 Chopra R, Vykhodtseva N, Hynynen K (2010) Influence of exposure time and pressure amplitude on bloodbrain-barrier opening using transcranial ultrasound exposures), vol. 1(5): ACS Chem Neurosci, 391-8 Deichmann R, Haase A (1992) Quantification of T1 values by Snapshot-Flash NMR imaging. J Mag Reson 96:608-12 Deichmann R, Hahn D, Haase A (1999) Fast T1 mapping on a whole-body scanner. Magn
Reson Med 42:206-9 Devoisselle JM, Viondury J, Galons JP, Confortgouny S, Coustaut D, Canioni P, Cozzone PJ (1988) Entrapment of Gadolinium-DTPA in liposomes - Characterization of vesicles by P-31 NMR-Spectroscopy. Invest Radiol 23:719-24 Fries P, Runge VM, Bucker A, Schurholz H, Reith W, Robert P, Jackson C, Lanz T, Schneider G (2009) Brain Tumor Enhancement in Magnetic Resonance Imaging at 3 Tesla Intraindividual Comparison of Two High Relaxivity Macromolecular Contrast Media With a Standard Extracellular Gd-Chelate in a Rat Brain Tumor Model. Invest Radiol 44:200-6 Hawkins BT, Davis TP (2005) The blood-brain barrier/neurovascular unit in health and disease. Pharmacol Rev 57:173-85 Hynynen K, McDannold N, Vykhodtseva N, Jolesz FA (2001) Noninvasive MR imaging-guided focal opening of the blood-brain barrier in rabbits. Radiology 220:640-6 Hynynen K, McDannold N, Sheikov NA, Jolesz FA, Vykhodtseva N (2005) Local and reversible blood-brain barrier disruption by noninvasive focused ultrasound at frequencies suitable for trans-skull sonications. Neuroimage 24:12-20
Page 21 of 33 Journal of Cerebral Blood Flow and Metabolism
123456789101112131415161718192021222324252627282930313233343536373839404142434445464748495051525354555657585960

Confidential: For Review O
nly
22
Hyodo F, Chandramouli GVR, Matsumoto S, Matsumoto K-I, Mitchell JB, Krishna MC, Munasinghe JP (2009) Estimation of tumor microvessel density by MRI using a blood pool contrast agent. Int J Oncol 35:797-804 Jordao JF, Ayala-Grosso CA, Markham K, Huang Y, Chopra R, McLaurin J, Hynynen K, Aubert I (2010) Antibodies targeted to the brain with image-guided focused ultrasound reduces amyloid-beta plaque load in the TgCRND8 mouse model of Alzheimer's disease. PloS one 5:e10549 Kang C-K, Park C-A, Kim K-N, Hong S-M, Park C-W, Kim Y-B, Cho Z-H (2010) Non-Invasive Visualization of Basilar Artery Perforators With 7T MR Angiography. J Magn
Reson Imaging 32:544-50 Larrat B, Pernot M, Aubry JF, Dervishi E, Sinkus R, Seilhean D, Marie Y, Boch AL, Fink M, Tanter M (2010) MR-guided transcranial brain HIFU in small animal models. Phys Med Biol
55:365-88 Larrat B, Marty B, Pernot M, Tanter M, Lethimonnier F, Mériaux S (2011) MR-Acoustic Radiation Force Mapping can Quantitatively Predict Drug Delivery following Ultrasound-Induced Blood Brain Barrier Disruption in Rats at High Field). ISMRM, Montreal, Canada Liu H-L, Hua M-Y, Chen P-Y, Chu P-C, Pan C-H, Yang H-W, Huang C-Y, Wang J-J, Yen T-C, Wei K-C (2010) Blood-Brain Barrier Disruption with Focused Ultrasound Enhances Delivery of Chemotherapeutic Drugs for Glioblastoma Treatment. Radiology 255:415-25 Liu H-L, Yang H-W, Hua M-Y, Wei K-C (2012) Enhanced therapeutic agent delivery through magnetic resonance imaging-monitored focused ultrasound blood-brain barrier disruption for brain tumor treatment: an overview of the current preclinical status. Neurosurg
focus 32:E4 Marty B, Flament J, Giraudeau C, Robic C, Port M, Lethimonnier F, Boumezbeur F, Valette J, Le Bihan D, Mériaux S (2010) Apparent diffusion coefficient of Gd-based contrast agents assessed in vivo in the rat brain using dynamic T1 mapping). ISMRM, Stockholm, Sweden McDannold N, Maier SE (2008) Magnetic resonance acoustic radiation force imaging. Med
Phys 35:3748-58 McDannold N, Vykhodtseva N, Hynynen K (2008) Blood-brain barrier disruption induced by focused ultrasound and circulating preformed microbubbles appears to be characterized by the mechanical index. Ultrasound Med Biol 34:834-40 Mendonca Dias MH, Lauterbur PC (1986) Ferromagnetic particles as contrast agents for magnetic resonance imaging of liver and spleen. Magnetic resonance in medicine : official
journal of the Society of Magnetic Resonance in Medicine / Society of Magnetic Resonance in
Medicine 3:328-30 O'Reilly MA, Huang Y, Hynynen K (2010) The impact of standing wave effects on transcranial focused ultrasound disruption of the blood-brain barrier in a rat model. Phys Med
Biol 55:5251-67
Page 22 of 33Journal of Cerebral Blood Flow and Metabolism
123456789101112131415161718192021222324252627282930313233343536373839404142434445464748495051525354555657585960

Confidential: For Review O
nly
23
O'Reilly MA, Waspe AC, Ganguly M, Hynynen K (2011a) Focused-Ultrasound disruption of the Blood-Brain Barrier using closely-timed short pulses: Influence of sonication parameters and injection rate. Ultrasound Med Biol 37:587-94 O'Reilly MA, Yuexi H, Hynynen K (2011b) Standing Waves in Small Animal Models Investigating Ultrasound Disruption of the Blood-Brain Barrier. AIP Conference Proceedings 1359 Pardridge WM (2005) The blood-brain barrier: bottleneck in brain drug development. NeuroRx : the journal of the American Society for Experimental NeuroTherapeutics 2:3-14 Philippens MEP, Garnbarota G, Pikkemaat JA, Peeters WJM, van der Kogel AJ, Heerschap A (2004) Characterization of late radiation effects in the rat thoracolumbar spinal cord by MR imaging using USPIO. MAGMA 17:303-12 Protti A, Sirker A, Shah AM, Botnar R (2010) Late Gadolinium Enhancement of Acute Myocardial Infarction in Mice at 7T: Cine-FLASH Versus Inversion Recovery. J Magn Reson
Imaging 32:878-86 Raymond SB, Treat LH, Dewey JD, McDannold NJ, Hynynen K, Bacskai BJ (2008) Ultrasound Enhanced Delivery of Molecular Imaging and Therapeutic Agents in Alzheimer's Disease Mouse Models. Plos One 3 Renshaw PF, Owen CS, McLaughlin AC, Frey TG, Leigh JS (1986) Ferromagnetic contrast agents - A new approach. Magn Reson Med 3:217-25 Rubin LL, Staddon JM (1999) The cell biology of the blood-brain barrier. Annual Review of
Neuroscience 22:11-28 Samiotaki G, Vlachos, F., Tung, Y.-S. and Konofagou, E. E. (2011) A quantitative pressure and microbubble-size dependence study of focused ultrasound-induced blood-brain barrier opening reversibility in vivo using MRI: Magn Reson Med
Sheikov N, McDannold N, Sharma S, Hynynen K (2008) Effect of focused ultrasound applied with an ultrasound contrast agent on the tight junctional integrity of the brain microvascular endothelium. Ultrasound Med Biol 34:1093-104 Swift TJ, Connick RE (1962) NMR-Relaxation mechanisms of 017 in aqueous solutions of paramagnetic cations and lifetime of water molecules in first coordination sphere. J Chem
Phys 37:307-& Treat LH, Zhang Y, McDannold N, Hynynen K (2009) Impact of Focused Ultrasound-enhanced Drug Delivery on Survival in Rats with Glioma. In: 8th International Symposium on
Therapeutic Ultrasound (Ebbini ES, ed), vol. 1113, 443-7 Vlachos F, Tung YS, Konofagou EE (2010) Permeability assessment of the focused ultrasound-induced blood-brain barrier opening using dynamic contrast-enhanced MRI. Phys
Med Biol 55:5451-66
Page 23 of 33 Journal of Cerebral Blood Flow and Metabolism
123456789101112131415161718192021222324252627282930313233343536373839404142434445464748495051525354555657585960

Confidential: For Review O
nly
24
Vlachos F, Tung Y-S, Konofagou E (2011) Permeability Dependence Study of the Focused Ultrasound-Induced Blood-Brain Barrier Opening at Distinct Pressures and Microbubble Diameters Using DCE-MRI. Magn Reson Med 66:821-30 Vykhodtseva N, McDannold N, Hynynen K (2008) Progress and problems in the application of focused ultrasound for blood-brain barrier disruption. Ultrasonics 48:279-96 Wadghiri YZ, Sigurdsson EM, Sadowski M, Elliott JI, Li YS, Scholtzova H, Tang CY, Aguinaldo G, Pappolla M, Duff K, Wisniewski T, Turnbull DH (2003) Detection of Alzheimer's amyloid in Transgenic mice using magnetic resonance microimaging. Magn
Reson Med 50:293-302 Yankeelov TE, DeBusk LM, Billheimer DD, Luci JJ, Lin PC, Price RR, Gore JC (2006) Repeatability of a reference region model for analysis of murine DCE-MRI data at 7T. J
Magn Reson Imaging 24:1140-7
Page 24 of 33Journal of Cerebral Blood Flow and Metabolism
123456789101112131415161718192021222324252627282930313233343536373839404142434445464748495051525354555657585960

Confidential: For Review O
nly
25
Titles and legends to figures
Figure 1: Different steps of MRI-guided ultrasound-induced disruption of blood-brain
barrier (BBB). BBB disruption was achieved by intravenous injection of microbubbles via a
catheter in the tail vein, in conjunction with transcranial ultrasound sonication. This was
followed by injection of MRI contrast agent (CA) via the same catheter. The entire procedure
was performed inside a 7T MRI scanner. A. Index of deposited acoustic pressure map derived
from ARFI images acquired before injection of microbubbles revealed the ultrasound focal
point. B. T1 maps (in ms) acquired before (Baseline) and after MR-CA injection. C. MR-CA
concentration map (in mM) derived from corresponding T1 maps. Concentrations from three
regions of interest (ROIs) were analyzed: ultrasound focal point (n°1), contralateral control
region (n°2) and extra-cerebral control region in the cheek muscles (n°3).
Figure 2: Ultrasound-induced localized delivery in rat brain of MRI contrast agents
(CA) with different hydrodynamic diameters. Paramagnetic CA (Dotarem®, P846 and
P792) or ultrasmall superparamagnetic iron oxide (USPIO) CA (P904 and P03680) were
injected in rats immediately after ultrasound-induced BBB disruption, and the signal
intensities were measured within 5 minutes at the ultrasound focal point. T1w images of the
paramagnetic CA (A, B and C) revealed a positive contrast, while T2w images of the USPIO
revealed a negative contrast (D and E). Comparison of the signal enhancement in arbitrary
units (a.u.) in the region of interest of ultrasound focal point (ROIspot, n°1) and that in the
control contralateral region (ROIcontra, n°2) is given next to the scan corresponding to each CA
(n = 1 rat for each CA). Differences between the two regions were considered significant for
p-values < 0.01 (*) using a Student’s t-test.
Page 25 of 33 Journal of Cerebral Blood Flow and Metabolism
123456789101112131415161718192021222324252627282930313233343536373839404142434445464748495051525354555657585960
Confidential: For Review O
nly
26
Figure 3: Comparison of T1-weighted (T1w) and T1 mapping strategies to assess the
amount of Gadolinium (Gd)-chelate crossing the BBB. Dotarem® was injected at different
doses just after ultrasound-induced BBB disruption in the right thalamus, followed by the
acquisition of one T1 mapping sequence (to produce a concentration map) and one T1w
sequence. A. Overlay of CA concentration maps on the corresponding anatomical T2w images
after injection of increasing doses of Dotarem® (375 , 750 and 1500 µmol/kg, n = 1 rat per
dose). Purple arrows indicate the ultrasound focal spot where the BBB was disrupted. B. CA
concentration as estimated using T1 mapping strategy at the ultrasound focal point showing
linear dependence on the injected dose. C. T1w signal of the CA at the ultrasound focal point
as a function of the injected dose showing a saturation effect.
Figure 4: BBB closure dynamics after ultrasound induced disruption for MR-CA of
different molecular sizes. Paramagnetic CA were injected at different times (0 to 24h) after
BBB disruption. A. Concentrations of the three paramagnetic CA in the region of interest in
the cheek muscles CROImuscle were measured. B. Index of delivered acoustic pressure at the
ultrasound focal point in the right thalamus in the brain. The maximum variability within each
group (CA) for these two parameters was 13 %. C. Corrected concentration (C*) of the CA at
the ultrasound focal point in the brain was plotted as a function of the time elapsed between
ultrasound-induced BBB opening and the MR-CA injection (n = 1 rat per time point). All
experimental data (n=28 rats) were used to fit the theoretical BBB closure model and
determine the two parameters (σ0 = 1.54 nm, k = 1.54×10⁻⁵ s-1) (Equation 6); dashed lines
correspond to the fitted data for each MR-CA.
Figure 5: Prediction of the time window of BBB passage for a given nanoparticle size.
Based on the theoretical model proposed here, half closure time, t1/2 (the time after
Page 26 of 33Journal of Cerebral Blood Flow and Metabolism
123456789101112131415161718192021222324252627282930313233343536373839404142434445464748495051525354555657585960
Confidential: For Review O
nly
27
ultrasound-induced BBB disruption that is required for the delivery of 50% of the maximal
dose to the predetermined ultrasound focal point in the brain) was calculated as a function of
the hydrodynamic diameter of the nanoparticle (Equation 7) (black circles). Red crosses
correspond to experimental data on the paramagnetic nanoparticle contrast agents used here
(Dotarem® 1 nm; P846 4 nm; and P792 7 nm) and the solid line represents the best fit with
analytical function: t1/2 = A / (1 + B.dH2), where dH is the hydrodynamic diameter of the
injected CA (in nm) and A and B are constants, A = 2.35×10⁴ s and B = 0.2106 nm-2.
Page 27 of 33 Journal of Cerebral Blood Flow and Metabolism
123456789101112131415161718192021222324252627282930313233343536373839404142434445464748495051525354555657585960

Confidential: For Review O
nly
28
Table 1: Principal features of the paramagnetic and superparamagnetic nanoparticle
contrast agents (CA) used in this study. Hydrodynamic diameters (dH) were measured by
light scattering, longitudinal (r1) and transverse (r2) relaxivities were estimated at 7T in 0.3%
agar gels maintained at 37°C, vascular remanences were taken from literature (34) and
diffusion coefficients in brain parenchyma were estimated in a previous work (28). The
paramagnetic CA were imaged using T1w/T1 mapping sequences, while the superparamagnetic
using T2w sequences.
dH
(nm) r1
(mM-1.s-1) r2
(mM-1.s-1) Dose
(µmol/kg body weight)
Vascular remanence
(min)
Diffusion coefficient (× 10-11 m2.s-1)
Paramagnetic MR-CA
Dotarem® <1 3.4 4.8 1500 26 4.6
P846 4 10.3 37 95 51 1.4
P792 7 4.9 42 210 32 0.8
Superparamagnetic MR-CA
P904 21 1.4 88 1030 - -
P03680 65 2.0 80 258 - -
Page 28 of 33Journal of Cerebral Blood Flow and Metabolism
123456789101112131415161718192021222324252627282930313233343536373839404142434445464748495051525354555657585960

Confidential: For Review O
nly
Different steps of MRI-guided ultrasound-induced disruption of blood-brain barrier (BBB). BBB disruption was achieved by intravenous injection of microbubbles via a catheter in the tail vein, in conjunction with transcranial ultrasound sonication. This was followed by injection of MRI contrast agent (CA) via the same catheter. The entire procedure was performed inside a 7T MRI scanner. A. Index of deposited acoustic
pressure map derived from ARFI images acquired before injection of microbubbles revealed the ultrasound focal point. B. T1 maps (in ms) acquired before (Baseline) and after MR-CA injection. C. MR-CA
concentration map (in mM) derived from corresponding T1 maps. Concentrations from three regions of interest (ROIs) were analyzed: ultrasound focal point (n°1), contralateral control region (n°2) and extra-
cerebral control region in the cheek muscles (n°3). 160x46mm (300 x 300 DPI)
Page 29 of 33 Journal of Cerebral Blood Flow and Metabolism
123456789101112131415161718192021222324252627282930313233343536373839404142434445464748495051525354555657585960
Confidential: For Review O
nly
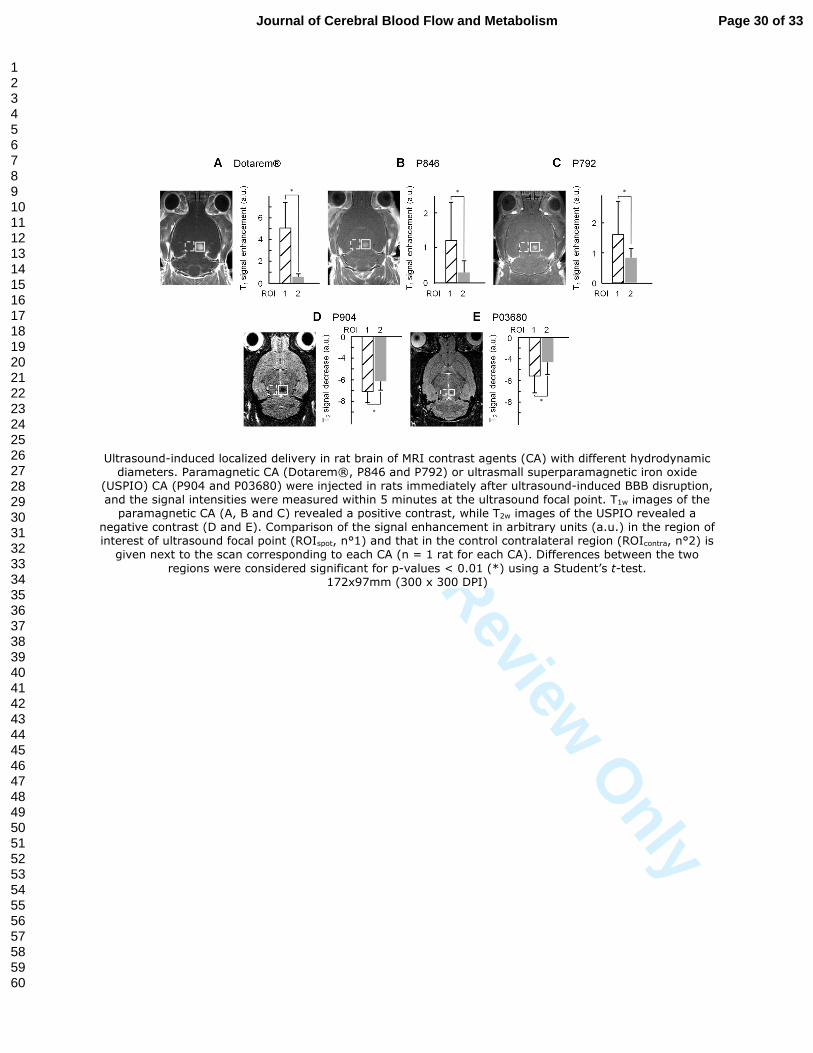
Ultrasound-induced localized delivery in rat brain of MRI contrast agents (CA) with different hydrodynamic diameters. Paramagnetic CA (Dotarem®, P846 and P792) or ultrasmall superparamagnetic iron oxide
(USPIO) CA (P904 and P03680) were injected in rats immediately after ultrasound-induced BBB disruption, and the signal intensities were measured within 5 minutes at the ultrasound focal point. T1w images of the
paramagnetic CA (A, B and C) revealed a positive contrast, while T2w images of the USPIO revealed a negative contrast (D and E). Comparison of the signal enhancement in arbitrary units (a.u.) in the region of interest of ultrasound focal point (ROIspot, n°1) and that in the control contralateral region (ROIcontra, n°2) is
given next to the scan corresponding to each CA (n = 1 rat for each CA). Differences between the two
regions were considered significant for p-values < 0.01 (*) using a Student’s t-test. 172x97mm (300 x 300 DPI)
Page 30 of 33Journal of Cerebral Blood Flow and Metabolism
123456789101112131415161718192021222324252627282930313233343536373839404142434445464748495051525354555657585960

Confidential: For Review O
nly
Figure 3: Comparison of T1-weighted (T1w) and T1 mapping strategies to assess the amount of Gadolinium (Gd)-chelate crossing the BBB. Dotarem® was injected at different doses just after ultrasound-induced BBB
disruption in the right thalamus, followed by the acquisition of one T1 mapping sequence (to produce a concentration map) and one T1w sequence. A. Overlay of CA concentration maps on the corresponding
anatomical T2w images after injection of increasing doses of Dotarem® (375 , 750 and 1500 µmol/kg, n = 1 rat per dose). Purple arrows indicate the ultrasound focal spot where the BBB was disrupted. B. CA concentration as estimated using T1 mapping strategy at the ultrasound focal point showing linear
dependence on the injected dose. C. T1w signal of the CA at the ultrasound focal point as a function of the
injected dose showing a saturation effect. 124x112mm (300 x 300 DPI)
Page 31 of 33 Journal of Cerebral Blood Flow and Metabolism
123456789101112131415161718192021222324252627282930313233343536373839404142434445464748495051525354555657585960

Confidential: For Review O
nly
Figure 4: BBB closure dynamics after ultrasound induced disruption for MR-CA of different molecular sizes. Paramagnetic CA were injected at different times (0 to 24h) after BBB disruption. A. Concentrations of the three paramagnetic CA in the region of interest in the cheek muscles CROImuscle were measured. B. Index of
delivered acoustic pressure at the ultrasound focal point in the right thalamus in the brain. The maximum variability within each group (CA) for these two parameters was 13 %. C. Corrected concentration (C*) of
the CA at the ultrasound focal point in the brain was plotted as a function of the time elapsed between ultrasound-induced BBB opening and the MR-CA injection (n = 1 rat per time point). All experimental data (n = 28 rats) were used to fit the theoretical BBB closure model and determine the two parameters (σ0 =
1.54 nm, k = 1.54×10⁻⁵ s-1) (Equation 6); dashed lines correspond to the fitted data for each MR-CA. 172x162mm (300 x 300 DPI)
Page 32 of 33Journal of Cerebral Blood Flow and Metabolism
123456789101112131415161718192021222324252627282930313233343536373839404142434445464748495051525354555657585960

Confidential: For Review O
nly
Prediction of the time window of BBB passage for a given nanoparticle size. Based on the theoretical model proposed here, half closure time, t1/2 (the time after ultrasound-induced BBB disruption that is required for the delivery of 50 % of the maximal dose to the predetermined ultrasound focal point in the brain) was
calculated as a function of the hydrodynamic diameter of the nanoparticle (Equation 7) (black circles). Red crosses correspond to experimental data on the paramagnetic nanoparticle contrast agents used here (Dotarem® 1 nm; P846 4 nm; and P792 7 nm) and the solid line represents the best fit with analytical
function: t1/2 = A / (1 + B.dH2), where dH is the hydrodynamic diameter of the injected CA (in nm) and A and
B are constants, A = 2.35×10⁴ s and B = 0.2106 nm-2. 80x68mm (300 x 300 DPI)
Page 33 of 33 Journal of Cerebral Blood Flow and Metabolism
123456789101112131415161718192021222324252627282930313233343536373839404142434445464748495051525354555657585960