dynamic simulation model of a two-fluids heat exchanger ... · dynamic simulation model of a...
TRANSCRIPT
Dynamic Simulation Model of a Two-Fluids Heat Exchanger Based on a Numerical Discretization Method
STEFANO BRACCO, ILKA FACCIOLI, MICHELE TROILO
DIMSET (Department of Machinery, Energy Systems and Transportation) University of Genoa – Engineering Faculty
Via Montallegro 1, 16145 Genoa ITALY
Abstract: The present paper deals with both the steady-state and dynamic simulation of a double-pipe heat exchanger, in parallel-flow or counterflow arrangement. In particular, the article describes the thermodynamic model that has been implemented in the Matlab/Simulink environment; the main hypotheses and physical parameters, which characterize the simulation model, are listed. The paper is focused on the discretization of the heat exchanger which has been divided into N cells, each modeled by means of the energy balance equation. It’s important to point out that the model considers the storage of thermal energy in the metal parts and the method of discretization, that has been adopted, gives just acceptable results dividing the heat exchanger in a small number of cells. The paper shows some results of the steady-state simulation of a counterflow heat exchanger, as a function of the number of cells, and the effects of some typical transient operating conditions are described. Key-Words: Double-pipe Heat Exchanger, Discretization, Dynamic Simulation, Parallel-flow, Counterflow
Nomenclature Symbol Description [Units] A Heat Exchange Area [m2] c Specific Heat [J/kg⋅K] C Specific Heat Capacity [W/K] D Diameter [m] h Heat Transfer Coefficient
[W/m2⋅K] k Thermal Conductivity [W/m⋅K] m Mass [kg] m& Mass Flow Rate [kg/s ] L Length [m] N Number of cells NTU Number of Transfer Units Nu Nusselt Number Pe Peclet Number Pr Prandtl Number Re Reynolds Number S Surface [m2] t Time [s] T Temperature [K] TH Thickness [m] U Overall Heat Transfer
Coefficient [W/m2⋅K] v Fluid Speed [m/s] V Volume [m3]
Greek Symbol Description [Units] ε Effectiveness Φ Thermal flux [W] µ Viscosity [Pa⋅s] ρ Density [kg/m3] Subscript Description ccs Circular Cross Section cf Counterflow ext External F1 Fluid 1 F2 Fluid 2 h Hydraulic in Inlet int Internal j Index for the jth cell lm Log-mean max Maximum min Minimum pf Parallel-flow out Outlet w Wall
1 Introduction Nowadays heat exchangers are used in a wide variety of applications and they have to be designed in order to increase their effectiveness without
6th WSEAS International Conference on SYSTEM SCIENCE and SIMULATION in ENGINEERING, Venice, Italy, November 21-23, 2007 285

neglecting the costs associated with their life cycle. It’s important to predict the heat exchanger behaviour, for both steady-state and transient operating conditions, during the design phase, in order to reduce future possible failures and, consequently, the maintenance costs. The transient simulation is very useful to anticipate some extreme operating conditions which could determine thermal stresses in the metal parts of the heat exchanger. In this framework the simulation model, described in this paper, represents a flexible Matlab application which can help designer engineers to simulate a double-pipe heat exchanger under different operating conditions, solving the “rating problem” that is the heat exchanger performance analysis [1]. In fact, knowing the heat exchanger surface geometry and dimensions, fluid flow rates and inlet temperatures, the simulator permits to evaluate the fluid outlet temperatures and the total heat transferred. It is also possible to easily change the inputs, listed above, for the optimal sizing of the heat exchanger which fit a set of desired outlet temperatures. 2 The Double-pipe Heat Exchanger In the present study a double-pipe heat exchanger has been considered. It consists of two concentric circular tubes: as shown in Fig. 1, one fluid flows inside the inner tube (fluid 1), while the other flows through the annular space (fluid 2).
Fig. 1 The double-pipe counterflow heat exchanger The present analysis considers a double-pipe heat exchanger used to cool, by means of cold water, the lubricating oil, for example in a large industrial gas turbine or a reciprocating internal combustion engine. The water flows inside the inner tube while the oil flows through the annular passage, also called “annulus” [1]. 2.1 The discretization of the heat exchanger In order to simulate the heat exchanger, it has been divided into N cells [2] [3]. Each of them includes: the cold fluid volume, the metal wall of the inner tube, the hot fluid volume and the metal wall of the
outer tube. The geometric dimensions considered in the model are: − L = length of the heat exchanger − D1 = inside diameter of the inner tube − D2 = inside diameter of the outer tube − THint = thickness of the inner tube − THext = thickness of the outer tube In the model the heat exchanger is plugged at the ends by means of a circular cross section drilled plate. 3 The Thermodynamic Model This section lists the equations used to model the heat exchange between the hot fluid and the cold one inside each of the N cells. The thermodynamic model of the heat exchanger is based on the following assumptions: − the potential and kinetic energy changes of the
two fluids are neglected − the pressure drops inside the tubes are not taken
into consideration − the heat exchanger is insulated from its
surroundings − the fluids do not undergo a phase change − the heat exchanger walls are made of a single
material, specifically carbon steel − the temperature of each fluid is uniform over
every flow cross section − the specific heat at constant pressure is constant
for each fluid − the overall heat transfer coefficient is constant
throughout the heat exchanger − inlet temperatures and mass flow rates are
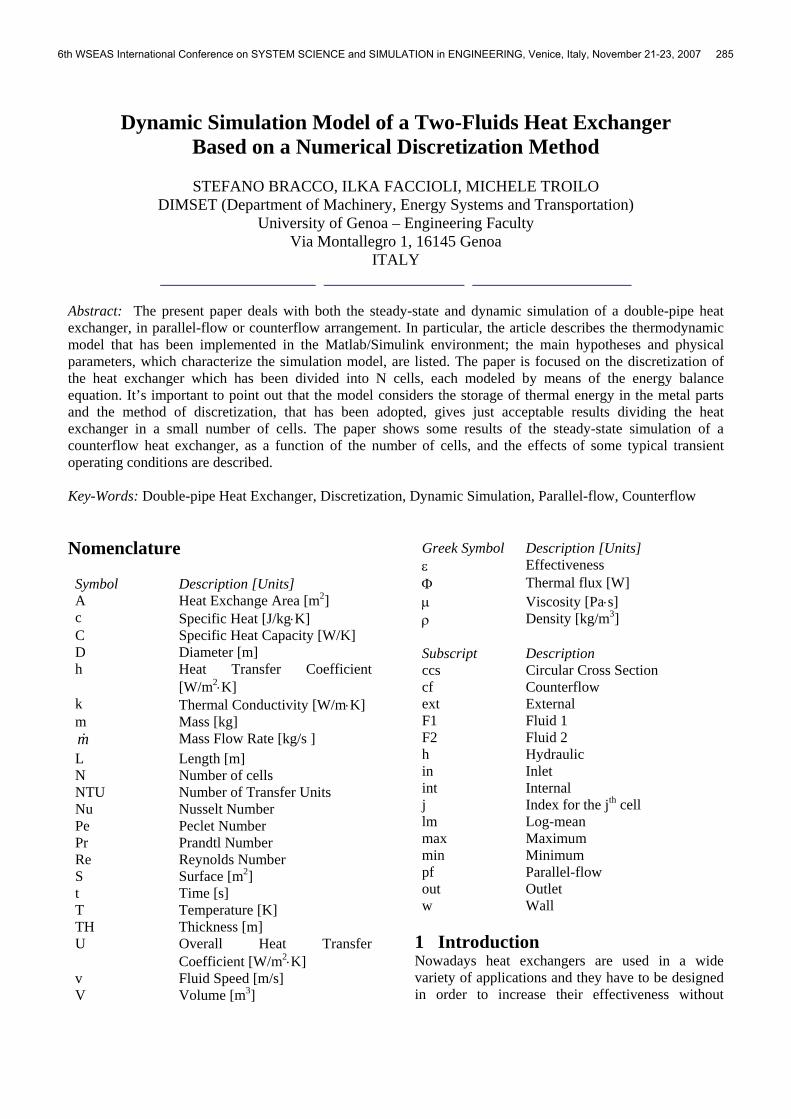
known. 3.1 The cold fluid equations Fig. 2 shows the simplified scheme that has been adopted to model the mass and heat transfer for the cold fluid in the jth cell. The conservation of energy, in transient conditions, for this subsystem can be written as:
( )t
TcmTTcm j_1F
1F1Fj_w_1Fj_out_1Fj_in_1F1F1F int ∂
∂=+− φ& (1)
considering the heat flux coming from the internal wall as:
( )jFjwFwFjwF TTSh _1int__1int__1__1 int−⋅⋅=φ (2)
Sw int F1 is the heat exchange area between the fluid 1 and the wall of the inner tube:
NLDS Fw ⋅⋅= 11int__ π (3)
6th WSEAS International Conference on SYSTEM SCIENCE and SIMULATION in ENGINEERING, Venice, Italy, November 21-23, 2007 286
and mF1 is the mass of fluid 1 inside each cell:
⎟⎠⎞
⎜⎝⎛⋅⎟
⎠⎞
⎜⎝⎛⋅⋅=⋅=
NL
2DVm
21
1F1F1F1F πρρ (4)
The model considers that the fluid 1 temperature and the wall temperature of the inner tube inside each cell vary with time only and are constant at the (L/N) length [2]. In order to calculate the heat transfer coefficient hF1 the following equation has been adopted:
1
1F1F1F D
Nukh ⋅= (5)
considering a fully developed turbulent flow characterized by the Nusselt number calculated by the Dittus-Boelter correlation:
3.01F
8.01F1F PrRe023.0Nu ⋅⋅= (6)
where the Reynolds and Prandtl numbers are respectively:
1F
11F1F1F
DvReµ
ρ ⋅⋅= (7)
1F
1F1F1F k
cPr µ⋅= (8)
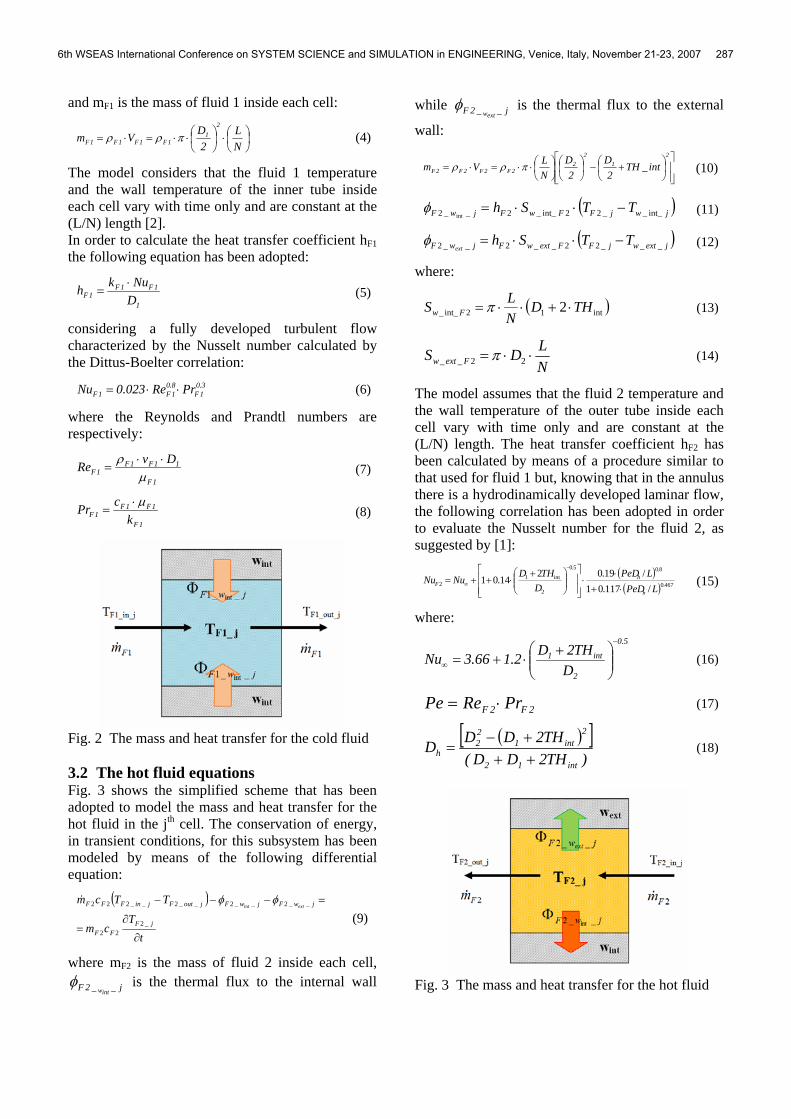
Fig. 2 The mass and heat transfer for the cold fluid 3.2 The hot fluid equations Fig. 3 shows the simplified scheme that has been adopted to model the mass and heat transfer for the hot fluid in the jth cell. The conservation of energy, in transient conditions, for this subsystem has been modeled by means of the following differential equation:
( )
tT
cm
TTcm
jFFF
jwFjwFjoutFjinFFF ext
∂
∂=
=−−−
_222
__2__2__2__222 intφφ&
(9)
where mF2 is the mass of fluid 2 inside each cell, j__2F intw
φ is the thermal flux to the internal wall
while j__2F extwφ is the thermal flux to the external
wall:
⎥⎥⎦
⎤
⎢⎢⎣
⎡⎟⎠⎞
⎜⎝⎛ +−⎟
⎠⎞
⎜⎝⎛
⎟⎠⎞
⎜⎝⎛⋅⋅=⋅=
21
22
2F2F2F2F int_TH2
D2
DNLVm πρρ
(10)
( )jwjFFwFjwF TTSh int___22int__2__2 int−⋅⋅=φ (11)
( )jextwjFFextwFjwF TTShext ___22__2__2 −⋅⋅=φ (12)
where:
( )int12int__ 2 THDNLS Fw ⋅+⋅⋅= π (13)
NLDS Fextw ⋅⋅= 22__ π (14)
The model assumes that the fluid 2 temperature and the wall temperature of the outer tube inside each cell vary with time only and are constant at the (L/N) length. The heat transfer coefficient hF2 has been calculated by means of a procedure similar to that used for fluid 1 but, knowing that in the annulus there is a hydrodinamically developed laminar flow, the following correlation has been adopted in order to evaluate the Nusselt number for the fluid 2, as suggested by [1]:
( )( ) 467.0
8.05.0
2
int12 /117.01
/19.0214.01
LPeDLPeD
DTHD
NuNuh
hF
⋅+
⋅⋅
⎥⎥⎦
⎤
⎢⎢⎣
⎡⎟⎟⎠
⎞⎜⎜⎝
⎛ +⋅++=
−
∞
(15)
where:
5.0
2
int1
DTH2D2.166.3Nu
−
∞ ⎟⎟⎠
⎞⎜⎜⎝
⎛ +⋅+= (16)
2F2F PrRePe ⋅= (17)
( )[ ])TH2DD(
TH2DDDint12
2int1
22
h +++−
= (18)
Fig. 3 The mass and heat transfer for the hot fluid
6th WSEAS International Conference on SYSTEM SCIENCE and SIMULATION in ENGINEERING, Venice, Italy, November 21-23, 2007 287

3.3 The internal and external wall equations The thermodynamic model considers, for each cell, the storage of thermal energy in the metal parts and so it is possible to evaluate the wall temperature dynamics by the calculation of the thermal fluxes which enter or exit from each portion of the metal wall [4]. Fig. 4 shows a simplified scheme which reports the thermal fluxes for both the internal (inner tube) and external (outer tube) walls.
Fig. 4 The thermal fluxes for the internal and external walls As mentioned above, an uniform wall temperature has been considered for each cell, both for the internal and the external wall. The energy balance equation for the inner tube wall in the jth cell is given by:
tT
cm jwww
jwjwjwjwjwFjwF
∂∂
=
=−+− −+
int__int_
1__1__1__2 int_int_int_int_intintφφφφ
(19)
( )jint__w1jint__wint_ccswjw_1jw TTALNk
int_int_−⋅⋅⎟
⎠⎞
⎜⎝⎛⋅= ++φ (20)
( )1jint__wjint__wint_ccsw1jw_jw TTALNk
int_int_ −− −⋅⋅⎟⎠⎞
⎜⎝⎛⋅=φ (21)
Accs-int is the circular cross section area of the inner tube wall while mw-int is the metal mass of the internal wall within the cell. On the other hand, the energy balance equation for the outer tube wall in the jth cell is given by:
tT
cm jextwwextw
jwjwjwjwjwF extextextextext
∂
∂=
=−+ −+
___
1__1__2 ____φφφ
(22)
( )j_ext_w1j_ext_wext_ccswjw_1jw TTALNk
_ext_ext−⋅⋅⎟
⎠⎞
⎜⎝⎛⋅= ++φ (23)
( )1j_ext_wj_ext_wext_ccsw1jw_jw TTALNk
_ext_ext −− −⋅⋅⎟⎠⎞
⎜⎝⎛⋅=φ (24)
Accs-ext is the circular cross section area of the outer tube wall while mw-ext is the metal mass of the external wall within the cell. It’s necessary to remember that the external wall is insulated from its surroundings and at the two ends of the heat exchanger, due to the circular cross section drilled plate, the heat exchange between the internal wall and the external wall has been taken into consideration. 3.4 The heat exchanger effectiveness calculation The thermodynamic model of the heat exchanger permits also to calculate the log-mean temperature difference ∆Tlm and so to evaluate the total heat transfer rate Φ as a function of the overall heat transfer coefficient U and the total heat transfer area.
lmTAU ∆⋅⋅=Φ (25)
where the log-mean temperature difference is calculated by means of two following equations, respectively for the counter-flow (cf) and parallel-flow (pf) heat exchanger [5].
( ) ( )
⎟⎟⎠
⎞⎜⎜⎝
⎛
−−
−−−=
in_1Fout_2F
out_1Fin_2F
in_1Fout_2Fout_1Fin_2Fcf_lm
TTTT
ln
TTTTT∆
(26)
( ) ( )
⎟⎟⎠
⎞⎜⎜⎝
⎛
−−
−−−=
out_1Fout_2F
in_1Fin_2F
out_1Fout_2Fin_1Fin_2Fpf_lm
TTTT
ln
TTTTT∆
(27)
Knowing the inlet and outlet temperatures of the two fluids, at steady-state operating conditions, the total heat flux has also been calculated as:
21 FF Φ=Φ=Φ (28)
)(
)(
_1_111
_1_111
inFoutFFF
inFoutFFF
TTcm
TTC
−=
=−⋅=Φ
& (29)
)(
)(
_2_222
_2_222
outFinFFF
outFinFFF
TTcm
TTC
−=
=−⋅=Φ
& (30)
The heat exchanger effectiveness (ε) has been calculated varying the number of cells in order to compare the effectiveness of the counterflow heat exchanger with the parallel-flow one:
maxΦΦ
=ε (31)
where:
)( _1_2minmax inFinF TTC −⋅=Φ (32)
wint
wint
wext
wext
6th WSEAS International Conference on SYSTEM SCIENCE and SIMULATION in ENGINEERING, Venice, Italy, November 21-23, 2007 288

Then the ε-NTU Method has been applied in the simulator, considering the effectiveness as a function of the Number of Transfer Units (NTU) and the ratio (Cmin/Cmax) [5] [6] [7].
⎟⎠⎞⎜
⎝⎛=
max
min, CCNTUεε (33)
minCAUNTU ⋅
= (34)
The correlations used for the calculation of the heat exchanger effectiveness are listed below [5].
⎟⎟⎠
⎞⎜⎜⎝
⎛+
−=
⎥⎥⎦
⎤
⎢⎢⎣
⎡⎟⎟⎠
⎞⎜⎜⎝
⎛+⋅−
max
min
1
1
1 max
min
CC
e CC
NTU
pfε (35)
⎥⎥⎦
⎤
⎢⎢⎣
⎡⎟⎟⎠
⎞⎜⎜⎝
⎛−⋅−
⎥⎥⎦
⎤
⎢⎢⎣
⎡⎟⎟⎠
⎞⎜⎜⎝
⎛−⋅−
⋅⎟⎟⎠
⎞⎜⎜⎝
⎛−
−=
max
min
max
min
1
max
min
1
1
1
CC
NTU
CC
NTU
cf
eCC
eε (36)
4 The Simulation Model The thermodynamic model of the heat exchanger has been implemented in Matlab/Simulink. Two simulators have been created: one for the counterflow heat exchanger and the other for the parallel-flow one. Then, in both simulators, the heat exchanger has been divided in N cells (in particular five, ten, fifteen and twenty cells) and the discretization process stopped when simulation results seemed to be quite insensitive to the increase of the cells number. For example, Fig. 5 shows the main window of the simulator for the heat exchanger divided into 5 cells.
Fig. 5 The main window of the simulator Analyzing the above scheme it follows that the main inputs of the simulation model are: − the cold fluid mass flow rate
− the hot fluid mass flow rate − the cold fluid inlet temperature − the hot fluid inlet temperature. Then the simulator needs a file input which contains other data such as the heat exchanger geometrical dimensions, the fluids properties (density, thermal conductivity, viscosity, specific heat), the metal properties (density, thermal conductivity, specific heat) and the initial conditions for the integrator blocks that are the fluids and walls temperatures inside each cell at the simulation start time. On the other hand, the outputs of the simulator are: − the exit temperature of the cold fluid − the exit temperature of the hot fluid − the cold fluid temperature inside each cell − the hot fluid temperature inside each cell − the internal and external wall temperatures inside
each cell − the heat flux exchanged between the two fluids − the speed of the two fluids. It is possible to plot all these outputs as a function of time and then the simulator evaluates the heat exchange coefficients by means of the correlations mentioned in Section 3. 4.1 The simulation model of the elementary cell Fig. 6 shows the simplified scheme of the Simulink block that has been created in order to simulate the jth cell of the heat exchanger
Fig. 6 The elementary cell in the simulation model The inputs of the jth cell block are: − the fluid 1 mass flow rate − the fluid 2 mass flow rate
6th WSEAS International Conference on SYSTEM SCIENCE and SIMULATION in ENGINEERING, Venice, Italy, November 21-23, 2007 289
− the temperatures of the fluids at the cell inlet − the internal and external wall temperatures in the
(j-1)th cell − the internal and external wall temperatures in the
(j+1)th cell − the temperatures of the fluids at the cell outlet. The outputs of the jth cell block are: − the internal and external wall temperatures inside
the jth cell − the fluid 1 and fluid 2 temperatures inside the jth
cell − the temperatures of the fluids at the cell outlet. The state variables of the jth cell block are: − the internal and external wall temperatures inside
the jth cell − the fluid 1 and fluid 2 temperatures inside the jth
cell. The fluid 1 and 2 temperatures at the jth cell outlet are assumed to be equal to the fluids temperatures inside the jth cell, that is the state variables. Fig. 7 shows the sub-blocks which the elementary cell block consists of. In particular, the sub-blocks called “F1_cell j” and “F2_cell j” solve the Equations (1) and (9) while the sub-blocks “Internal wall_ cell j” and “External wall_ cell j” are related to the Equations (19) and (22).
Fig. 7 The elementary cell sub-blocks 5 The Simulation Results This paragraph reports some examples related to several simulations that have been done considering the heat exchanger divided into a variable number of cells; in particular the results refer to four different discretization processes: 5, 10, 15 and 20 cells. The heat exchanger that has been taken as a reference is characterized by [8] [9]: − L = 10 m it is an “equivalent” length because
in real operating conditions the heat exchanger is shorter and composed of more than two tubes
− D1 = 0.015 m; D2 = 0.03 m
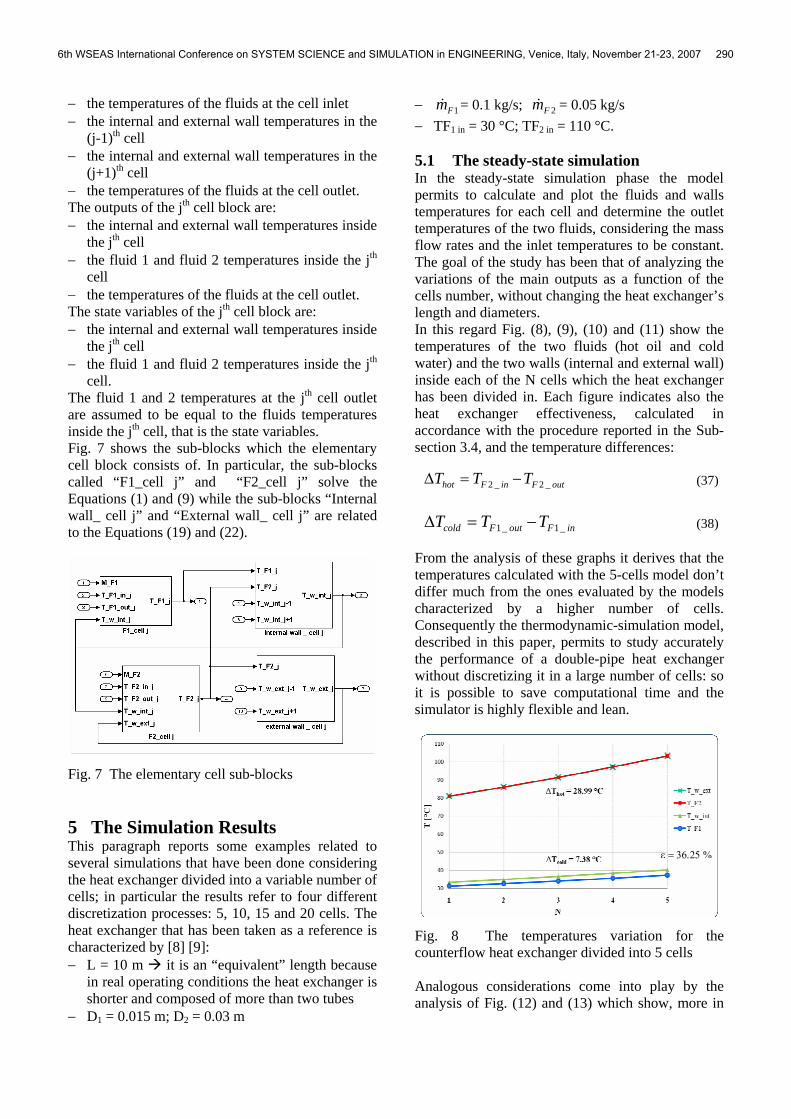
− 1Fm& = 0.1 kg/s; 2Fm& = 0.05 kg/s − TF1 in = 30 °C; TF2 in = 110 °C. 5.1 The steady-state simulation In the steady-state simulation phase the model permits to calculate and plot the fluids and walls temperatures for each cell and determine the outlet temperatures of the two fluids, considering the mass flow rates and the inlet temperatures to be constant. The goal of the study has been that of analyzing the variations of the main outputs as a function of the cells number, without changing the heat exchanger’s length and diameters. In this regard Fig. (8), (9), (10) and (11) show the temperatures of the two fluids (hot oil and cold water) and the two walls (internal and external wall) inside each of the N cells which the heat exchanger has been divided in. Each figure indicates also the heat exchanger effectiveness, calculated in accordance with the procedure reported in the Sub-section 3.4, and the temperature differences:
outFinFhot TTT _2_2 −=∆ (37)
inFoutFcold TTT _1_1 −=∆ (38) From the analysis of these graphs it derives that the temperatures calculated with the 5-cells model don’t differ much from the ones evaluated by the models characterized by a higher number of cells. Consequently the thermodynamic-simulation model, described in this paper, permits to study accurately the performance of a double-pipe heat exchanger without discretizing it in a large number of cells: so it is possible to save computational time and the simulator is highly flexible and lean.
Fig. 8 The temperatures variation for the counterflow heat exchanger divided into 5 cells Analogous considerations come into play by the analysis of Fig. (12) and (13) which show, more in
ε = 36.25 %
6th WSEAS International Conference on SYSTEM SCIENCE and SIMULATION in ENGINEERING, Venice, Italy, November 21-23, 2007 290

detail, the temperatures variation of the two fluids as a function of the tube’s length considering different number of cells. It is possible to notice that the fluid temperatures vary less and less at the increase in the number of cells.
Fig. 9 The temperatures variation for the counterflow heat exchanger divided into 10 cells
Fig. 10 The temperatures variation for the counterflow heat exchanger divided into 15 cells
Fig. 11 The temperatures variation for the counterflow heat exchanger divided into 20 cells
Similar simulations have been done regarding the parallel-flow heat exchanger and even in that case the output results have shown that the model didn’t need a large number of cells in order to predict, with accuracy, the heat exchanger performance under different operating conditions. For instance, Fig. 14 shows the temperatures variation for the parallel-flow heat exchanger divided into 15 cells. In comparison with the counterflow arrangement, the effectiveness is lower as well as the hot and cold fluids temperature variations along the heat exchanger.
Fig. 12 The cold fluid temperatures variation along the counterflow heat exchanger
Fig. 13 The hot fluid temperatures variation along the counterflow heat exchanger
ε = 37.07 %
ε = 37.35 %
ε = 37.5 %
0
0
6th WSEAS International Conference on SYSTEM SCIENCE and SIMULATION in ENGINEERING, Venice, Italy, November 21-23, 2007 291

Fig. 14 The temperatures variation for the parallel-flow heat exchanger divided into 15 cells 5.2 The transient simulation The simulator can also predict the heat exchanger behaviour, in terms of outlet temperatures of the two fluids and heat fluxes exchanged, for transient operating conditions. For example, it is useful to determine the response of the system to inputs changes such as the increase/decrease of the inlet temperatures or the fluid mass flow rates. It is also possible to evaluate the heat exchanger performance changes considering different wall materials or geometric dimensions. In this Sub-section the simulation of the oil inlet temperature variation is reported [2]. A transient consisting of a step variation of the hot fluid inlet temperature, from 110 °C to 100 °C, has been considered. Consequently, the decrease of the hot fluid outlet temperature has been noticed, from 81 °C to 74.6 °C, as shown in Fig. 15.
Fig. 15 The hot fluid outlet temperature variation due to the decrease of the hot fluid inlet temperature As a consequence of this temperature variation, there is a remarkable variation of all the other temperatures in the heat exchanger: the graphs in
Fig. (16), (17) and (18) outline the internal and external wall temperatures variation as a function of time as well as the decrease in the cold fluid outlet temperature.
Fig. 16 The internal wall temperatures variation due to the decrease of the hot fluid inlet temperature
Fig. 17 The external wall temperatures variation due to the decrease of the hot fluid inlet temperature
Fig. 18 The cold fluid outlet temperature variation due the decrease of the hot fluid inlet temperature In some real operating conditions it is necessary to keep almost constant the hot fluid outlet temperature in spite of extreme flow variations upstream. For the transient above analyzed a PID controller (Fig. 19) has been implemented in order to maintain costant the hot fluid outlet temperature at about 81 °C by varying the cold fluid mass flow rate. The PID controller automatically finds the correct cold fluid mass flow rate (Fig. 20) that keeps the hot fluid outlet temperature steady at the set-point.
ε = 36.79 %
6th WSEAS International Conference on SYSTEM SCIENCE and SIMULATION in ENGINEERING, Venice, Italy, November 21-23, 2007 292

Fig. 19 The PID controller in the Simulink model
Fig. 20 The cold fluid mass flow rate variation which permits to keep constant the hot fluid outlet temperature
Fig. 21 The hot fluid exit temperature as a function of time
Fig. 22 The cold fluid exit temperature as a function of time The hot fluid outlet temperature initially decreases, according to the lower inlet temperature, then
increases because of the cold fluid mass flow rate variation. Fig. 21 plots this temperature variation while Fig. 22 shows the increase in the cold fluid exit temperature. 6 Conclusions The Simulink model, described in this paper, permits to study the heat exchange between two fluids which flow in a double-pipe heat exchanger, that has been divided in N cells in order to be simulated. The simulation results, in steady-state and transient conditions, show that the model behaves like a real system just considering a limited number of cells. Then it is also possible to investigate the response of the heat exchanger to the inputs variation; with regard to the transient simulation, a PID controller has been introduced in the model in order to regulate the hot fluid outlet temperature by means of the cold fluid mass flow rate. References: [1] S. Kakac, H. Liu, Heat Exchangers: Selection,
Rating and Thermal Design, Second Edition, CRC Press, 2002
[2] M.R. Ansari, V. Mortazavi, Simulation of dynamical response of a countercurrent heat exchanger to inlet temperature or mass flow rate change, Applied Thermal Engineering, 26 (2006), pp. 2401-2408
[3] A. Zavala-Rìo, R. Santiesteban-Cos, Reliable compartmental models for double-pipe heat exchangers: an analytical study, Applied Mathematical Modelling, 31 (2007), pp. 1739-1752
[4] A. W. Ordys, A. W. Pike, M. A. Johnson, R. M. Katebi, M. J. Grimble, Modelling and Simulation of Power Generation Plants, Springer-Verlag, London, 1994
[5] G. Guglielmini, C. Pisoni, Elementi di Trasmissione del Calore, Editoriale Veschi, Milano, 1990
[6] G. Comino, G. Cortella, G. Croce, Energetica Generale, IV Edizione, Servizi Grafici Editoriali snc, Padova, 2005
[7] C. Bonacina, A. Cavallini, L. Mattarolo, Trasmissione del Calore, Cleup Editore, Padova, 1992
[8] G. Cornetti, Macchine a Fluido, Edizioni Il Capitello, Torino, 1997
[9] G. Guglielmini, E. Nannei, C. Pisoni, Problemi di Termodinamica Tecnica e di Trasmissione del Calore, Ecig, Genova, 1993.
6th WSEAS International Conference on SYSTEM SCIENCE and SIMULATION in ENGINEERING, Venice, Italy, November 21-23, 2007 293