dynamic responses of a steel composite bridge subjected to ... · development of a high speed...
TRANSCRIPT
Dynamic responses of a steel composite bridge subjected to a moving high speed train load in comparison with a PSC box girder bridge
S. Kim1, H. Kim1 & J. Lee2 1High-Speed Railroad System Research Center, Korea Railroad Research Institute, South Korea 2Department of Civil and Environmental Engineering, Dankook University, South Korea
Abstract
Dynamic responses of a high speed railroad steel composite bridge have been investigated experimentally and compared with responses of a prestressed concrete box girder bridge which is one of the most typical types in the Korean high speed railroad. A two I-shaped steel composite girder bridge (1@40m) and a prestressed concrete box girder bridge (2@40m) have same span length of 40m, but one is simply supported and the other is continuous. Therefore, for direct comparison, the fictitious steel composite continuous bridge (2@40m) was numerically modeled based on a nominated design process. A set of experimental tests were performed during the operation of KTX, and dynamic responses (vertical accelerations and vertical displacements) were measured. Measured responses show that the vertical displacements of tested bridges all satisfy requirements for passenger comfort, but vertical acceleration responses were also found to be very close to the limit value for traffic safety. It was found that most of the excessive acceleration responses occurred when the passing speed of the train is close to the critical speed which causes resonance. Keywords: high speed railroad bridge, bridge-train interaction, moving load.
1 Introduction
The possibility of resonance occurring due to the cyclic dynamic load is extremely high for a high speed railroad bridge. For this reason, safety
High Performance and Optimum Design of Structures and Materials 127
doi:10.2495/HPSM140121
www.witpress.com, ISSN 1743-3509 (on-line) WIT Transactions on The Built Environment, Vol 137, © 2014 WIT Press
evaluation and dynamic movement evaluation are both critical elements in the development of a high speed railway bridge. Most of the bridges along Korea’s Gyeong-bu High Speed Railway consist of 2-span continuous PSC box girder bridges, with each span at a length of 40 meters. In parts where the railway passes through the city or roads, the bridges are mostly 2-girder steel plate girder bridges with 40 m to 55 m spans. PSC box girder bridges are dominant because there is a general consensus that concrete bridges are better than steel bridges in terms of vibration and noise. At the same time, research on the dynamic behavior of the bridge caused by the moving train load has been pursued since the 1960s. In the study of railway bridges, the emphasis on this type of research has been increasing because of the possibility of resonance caused by the cyclic load of the train (Yang et al. [1]). Resonances occur in bridges when the exciting frequency of the train is equal to the natural frequency of the bridge. This resonance is directly related to instability in dynamic behavior, and can have a very bad influence on the ride comfort of the train passengers (Sogabe et al. [2]). However, thus far there has been little research on the behavior of actual high speed rail bridges while a train is moving along the bridge. Furthermore, there has of yet been no research results presented comparing the dynamic behavior of concrete and steel high speed railway bridges. In the present study, field experiments on the dynamic characteristics are performed for a 2-girder steel composite bridge (Ewon bridge) and a prestressed concrete box girder bridge (Yeonjae bridge) on Gyeong-bu High Speed Railway. A two I-shaped steel composite girder bridge (1@40m) and prestressed concrete box girder bridge (2@40m) have same span length of 40m, but one is simply supported and the other is continuous. Therefore, for direct comparison, the fictitious steel composite continuous bridge (2@40m) was numerically modeled based on a nominated design process. We then compared the results with the standard dynamic behavior requirements set forth by Eurocode and Korean High Speed Railway. Through interpretative analysis, we quantitatively compared the steel bridge to the PSC box girder bridge.
2 Field tests
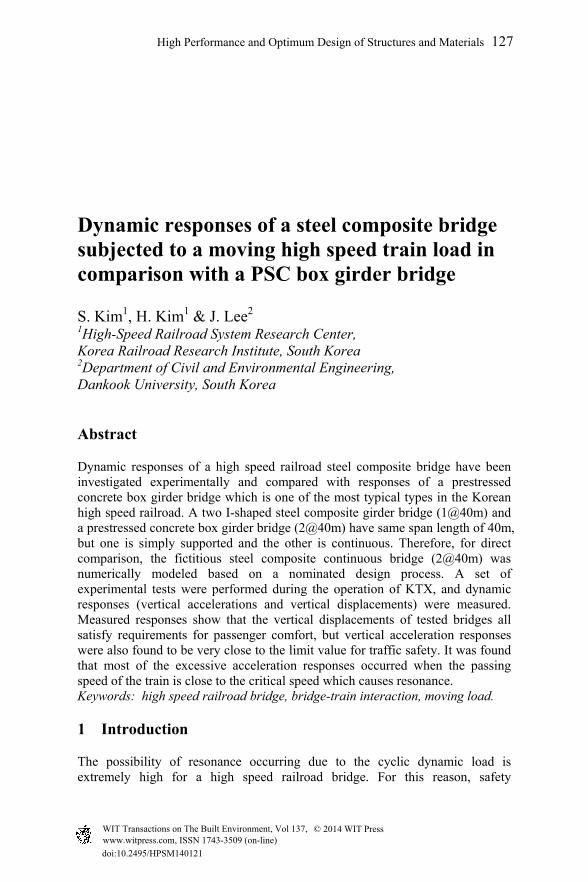
Field tests of two bridges were performed. Figure 1 shows the picture of these bridges. The first bridge was the 40 m simple span 2-girder steel composite bridge between the 59th pier and the abutment of Ewon Bridge. The second bridge is a PSC box girder bridge with 2@40 m span, and is like the majority of the bridges on the Gyeong-bu High Speed Railway. Girder depth is 3 m for Ewon bridge and 3.5m for Yeonjae bridge and total bridge width is 14.0 m. Eurocode [3] and the specification of Korean High Speed Railway [4] used to evaluate the traffic safety and ride comfort criteria. Vertical deflection and vertical acceleration of the bridge deck are two major criteria. To determine whether the dynamic performances of our test bridges satisfied the requirements of the standard, we measured the acceleration and displacement at the center of the span. In addition, we placed vertical direction accelerometers
128 High Performance and Optimum Design of Structures and Materials
www.witpress.com, ISSN 1743-3509 (on-line) WIT Transactions on The Built Environment, Vol 137, © 2014 WIT Press
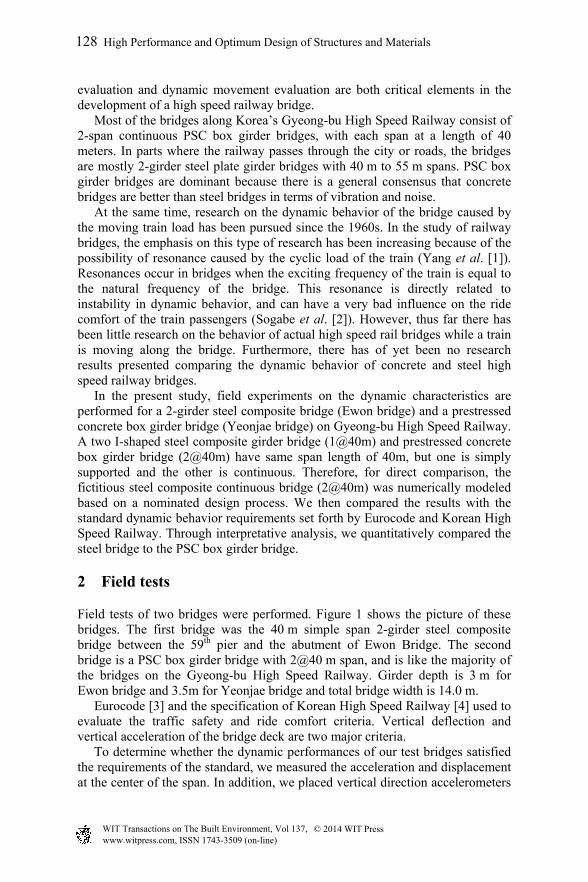
at constant intervals to measure specific dynamic characteristics (natural frequency, mode shape and damping ratio). The sensors used and their placements are shown in table 1 and fig. 2. Total 27 sets of measured data for Ewon bridge and total 42 sets of measured data for Yeonjae bridge can be obtained.
Figure 1: Ewon bridge and Yeonjae bridge.
(a) L/2 section view
(b) Plan view
Figure 2: Sensor disposition map (Ewon bridge).
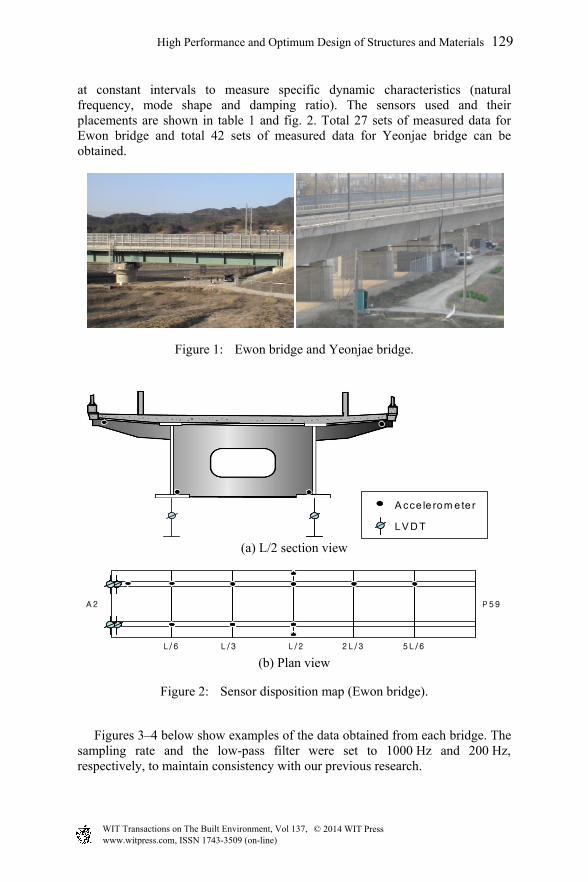
Figures 3–4 below show examples of the data obtained from each bridge. The sampling rate and the low-pass filter were set to 1000 Hz and 200 Hz, respectively, to maintain consistency with our previous research.
A cce le rom e te r
LV D T
A 2 P 5 9
L /6 L /3 L /2 2 L /3 5 L /6
High Performance and Optimum Design of Structures and Materials 129
www.witpress.com, ISSN 1743-3509 (on-line) WIT Transactions on The Built Environment, Vol 137, © 2014 WIT Press
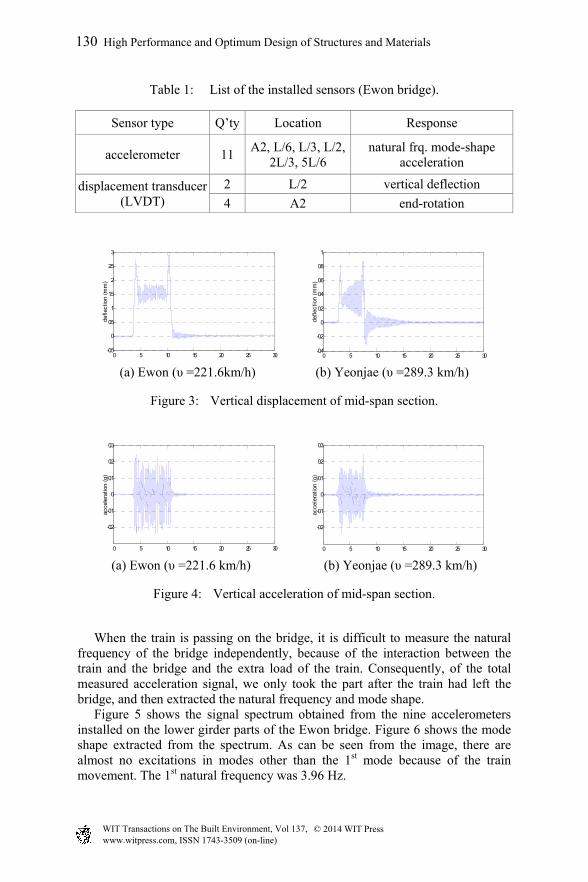
Table 1: List of the installed sensors (Ewon bridge).
Sensor type Q’ty Location Response
accelerometer 11 A2, L/6, L/3, L/2,
2L/3, 5L/6 natural frq. mode-shape
acceleration
displacement transducer (LVDT)
2 L/2 vertical deflection
4 A2 end-rotation
(a) Ewon (υ =221.6km/h) (b) Yeonjae (υ =289.3 km/h)
Figure 3: Vertical displacement of mid-span section.
(a) Ewon (υ =221.6 km/h) (b) Yeonjae (υ =289.3 km/h)
Figure 4: Vertical acceleration of mid-span section.
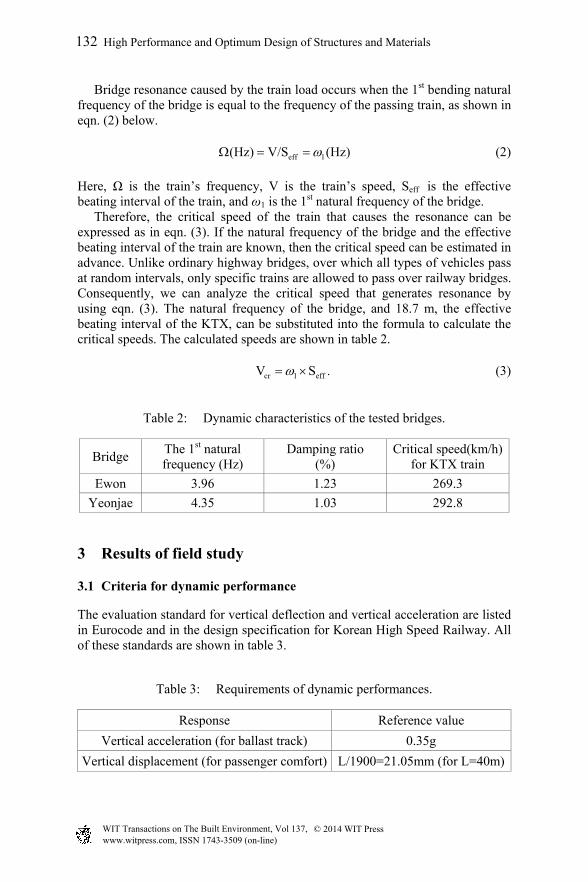
When the train is passing on the bridge, it is difficult to measure the natural frequency of the bridge independently, because of the interaction between the train and the bridge and the extra load of the train. Consequently, of the total measured acceleration signal, we only took the part after the train had left the bridge, and then extracted the natural frequency and mode shape. Figure 5 shows the signal spectrum obtained from the nine accelerometers installed on the lower girder parts of the Ewon bridge. Figure 6 shows the mode shape extracted from the spectrum. As can be seen from the image, there are almost no excitations in modes other than the 1st mode because of the train movement. The 1st natural frequency was 3.96 Hz.
0 5 10 15 20 25 30-0.5
0
0.5
1
1.5
2
2.5
3
defle
ctio
n (m
m)
0 5 10 15 20 25 30-0.4
-0.2
0
0.2
0.4
0.6
0.8
1
defle
ctio
n (m
m)
0 5 10 15 20 25 30
-0.2
-0.1
0
0.1
0.2
0.3
acce
lera
tion
(g)
0 5 10 15 20 25 30
-0.2
-0.1
0
0.1
0.2
0.3
acce
lera
tion
(g)
130 High Performance and Optimum Design of Structures and Materials
www.witpress.com, ISSN 1743-3509 (on-line) WIT Transactions on The Built Environment, Vol 137, © 2014 WIT Press
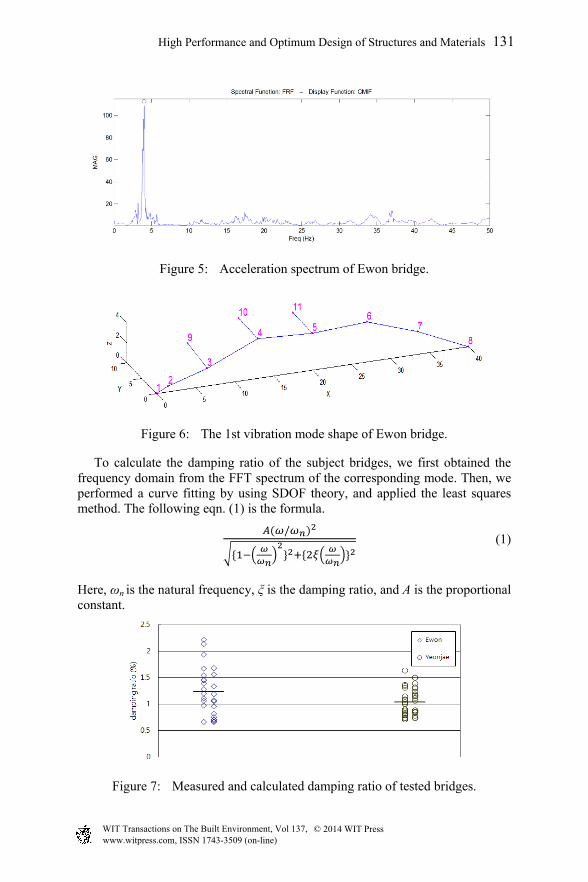
Figure 5: Acceleration spectrum of Ewon bridge.
Figure 6: The 1st vibration mode shape of Ewon bridge.
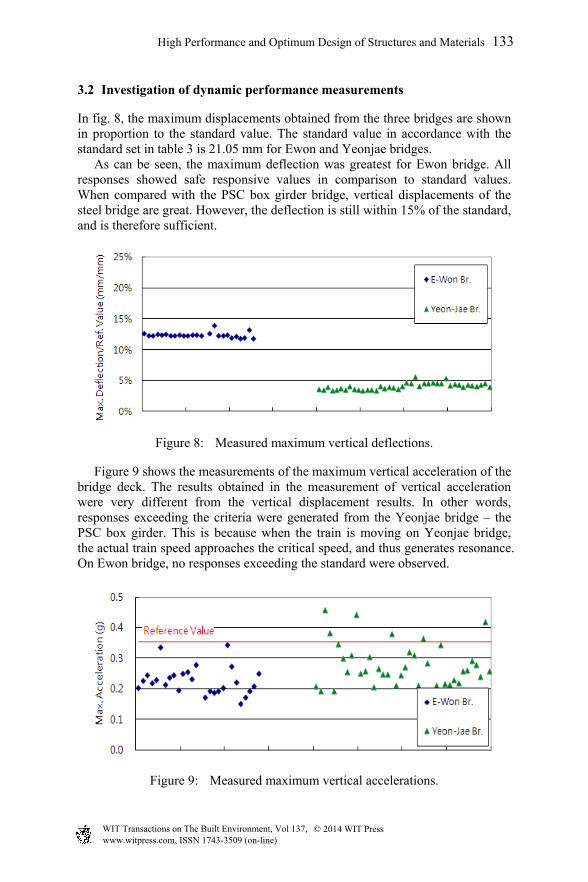
To calculate the damping ratio of the subject bridges, we first obtained the frequency domain from the FFT spectrum of the corresponding mode. Then, we performed a curve fitting by using SDOF theory, and applied the least squares method. The following eqn. (1) is the formula.
/ (1)
Here, ωn is the natural frequency, ξ is the damping ratio, and A is the proportional constant.
Figure 7: Measured and calculated damping ratio of tested bridges.
High Performance and Optimum Design of Structures and Materials 131
www.witpress.com, ISSN 1743-3509 (on-line) WIT Transactions on The Built Environment, Vol 137, © 2014 WIT Press
Bridge resonance caused by the train load occurs when the 1st bending natural frequency of the bridge is equal to the frequency of the passing train, as shown in eqn. (2) below.
eff 1(Hz) V/S (Hz) (2)
Here, Ω is the train’s frequency, V is the train’s speed, Seff is the effective beating interval of the train, and ω1 is the 1st natural frequency of the bridge. Therefore, the critical speed of the train that causes the resonance can be expressed as in eqn. (3). If the natural frequency of the bridge and the effective beating interval of the train are known, then the critical speed can be estimated in advance. Unlike ordinary highway bridges, over which all types of vehicles pass at random intervals, only specific trains are allowed to pass over railway bridges. Consequently, we can analyze the critical speed that generates resonance by using eqn. (3). The natural frequency of the bridge, and 18.7 m, the effective beating interval of the KTX, can be substituted into the formula to calculate the critical speeds. The calculated speeds are shown in table 2.
cr 1 effV S . (3)
Table 2: Dynamic characteristics of the tested bridges.
Bridge The 1st natural frequency (Hz)
Damping ratio (%)
Critical speed(km/h) for KTX train
Ewon 3.96 1.23 269.3
Yeonjae 4.35 1.03 292.8
3 Results of field study
3.1 Criteria for dynamic performance
The evaluation standard for vertical deflection and vertical acceleration are listed in Eurocode and in the design specification for Korean High Speed Railway. All of these standards are shown in table 3.
Table 3: Requirements of dynamic performances.
Response Reference value
Vertical acceleration (for ballast track) 0.35g
Vertical displacement (for passenger comfort) L/1900=21.05mm (for L=40m)
132 High Performance and Optimum Design of Structures and Materials
www.witpress.com, ISSN 1743-3509 (on-line) WIT Transactions on The Built Environment, Vol 137, © 2014 WIT Press
3.2 Investigation of dynamic performance measurements
In fig. 8, the maximum displacements obtained from the three bridges are shown in proportion to the standard value. The standard value in accordance with the standard set in table 3 is 21.05 mm for Ewon and Yeonjae bridges. As can be seen, the maximum deflection was greatest for Ewon bridge. All responses showed safe responsive values in comparison to standard values. When compared with the PSC box girder bridge, vertical displacements of the steel bridge are great. However, the deflection is still within 15% of the standard, and is therefore sufficient.
Figure 8: Measured maximum vertical deflections.
Figure 9 shows the measurements of the maximum vertical acceleration of the bridge deck. The results obtained in the measurement of vertical acceleration were very different from the vertical displacement results. In other words, responses exceeding the criteria were generated from the Yeonjae bridge – the PSC box girder. This is because when the train is moving on Yeonjae bridge, the actual train speed approaches the critical speed, and thus generates resonance. On Ewon bridge, no responses exceeding the standard were observed.
Figure 9: Measured maximum vertical accelerations.
High Performance and Optimum Design of Structures and Materials 133
www.witpress.com, ISSN 1743-3509 (on-line) WIT Transactions on The Built Environment, Vol 137, © 2014 WIT Press

3.3 The importance of actual running speed
When a high speed railway bridge has a high likelihood of resonance when the train is operating at its normal speeds, then the train may cause the dynamic instability of the bridge when operating at critical speeds. The behavior at this time is controlled by the damping ratio. Therefore, the actual running speed of the train is very important in relation to the dynamic characteristics of the bridge. Figure 10 shows train speeds on the Yeonjae bridge, a PSC box girder (2@40) and on the steel composite bridges Ewon bridge (1@40).
Figure 10: Critical speeds and train-passing speeds.
As it can be seen in the figure, the actual running speed on the Yeonjae bridge is very close to the critical speed, while for Ewon bridge, the running speed is quite far from the critical speed. Figure 3 shows the time history curve of vertical displacements on Yeonjae and Ewon bridges. As can be seen in the figure, the curve of Yeonjae bridge is similar to that of a resonance wave, while for Ewon, the curve is a typical vertical displacement time history curve caused by the KTX. The tested two bridges have sufficient surplus displacements. In the case of the Yeonjae bridge, because of the high rigidity of the PSC box girder bridge, it has sufficient surplus displacement, even if resonance does occur. However, continuous resonance waves can shorten bridge life. Also, in the case of vertical acceleration, the Yeonjae bridge is shown to have higher acceleration results than the steel composite bridges because of the generation of resonance. Generally, steel composite girders are known to be more vulnerable to noise and vibration than concrete bridges. Our results, however, show that when the bridges have the same level of static/dynamic performance, what matters more than the form of the bridge are its dynamic characteristics. We also discovered that the actual running speed of the train can have a great influence on the bridge.
134 High Performance and Optimum Design of Structures and Materials
www.witpress.com, ISSN 1743-3509 (on-line) WIT Transactions on The Built Environment, Vol 137, © 2014 WIT Press
4 Numerical simulation
4.1 Numerical simulations of varying train speed
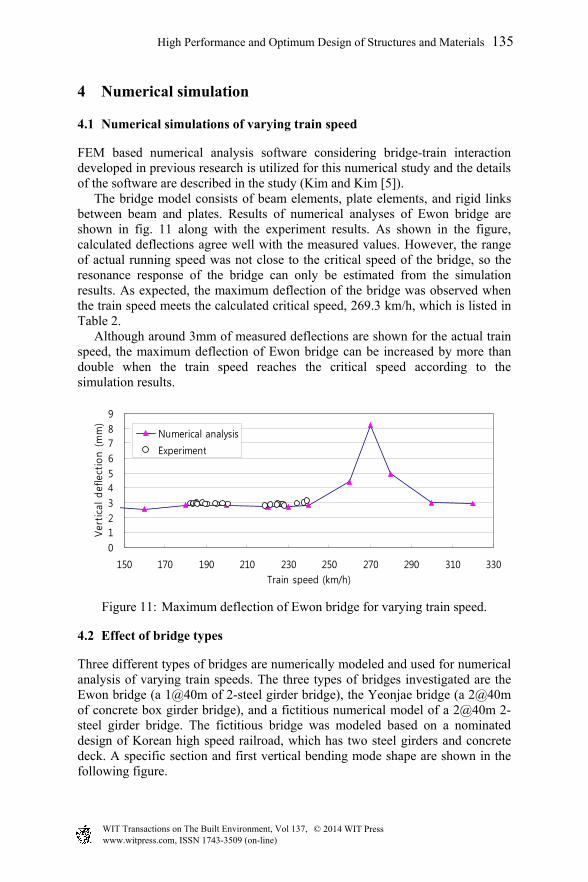
FEM based numerical analysis software considering bridge-train interaction developed in previous research is utilized for this numerical study and the details of the software are described in the study (Kim and Kim [5]). The bridge model consists of beam elements, plate elements, and rigid links between beam and plates. Results of numerical analyses of Ewon bridge are shown in fig. 11 along with the experiment results. As shown in the figure, calculated deflections agree well with the measured values. However, the range of actual running speed was not close to the critical speed of the bridge, so the resonance response of the bridge can only be estimated from the simulation results. As expected, the maximum deflection of the bridge was observed when the train speed meets the calculated critical speed, 269.3 km/h, which is listed in Table 2. Although around 3mm of measured deflections are shown for the actual train speed, the maximum deflection of Ewon bridge can be increased by more than double when the train speed reaches the critical speed according to the simulation results.
Figure 11: Maximum deflection of Ewon bridge for varying train speed.
4.2 Effect of bridge types
Three different types of bridges are numerically modeled and used for numerical analysis of varying train speeds. The three types of bridges investigated are the Ewon bridge (a 1@40m of 2-steel girder bridge), the Yeonjae bridge (a 2@40m of concrete box girder bridge), and a fictitious numerical model of a 2@40m 2-steel girder bridge. The fictitious bridge was modeled based on a nominated design of Korean high speed railroad, which has two steel girders and concrete deck. A specific section and first vertical bending mode shape are shown in the following figure.
0123456789
150 170 190 210 230 250 270 290 310 330Train speed (km/h)
Ver
tica
l def
lect
ion (
mm
)
Numerical analysis
Experiment
High Performance and Optimum Design of Structures and Materials 135
www.witpress.com, ISSN 1743-3509 (on-line) WIT Transactions on The Built Environment, Vol 137, © 2014 WIT Press
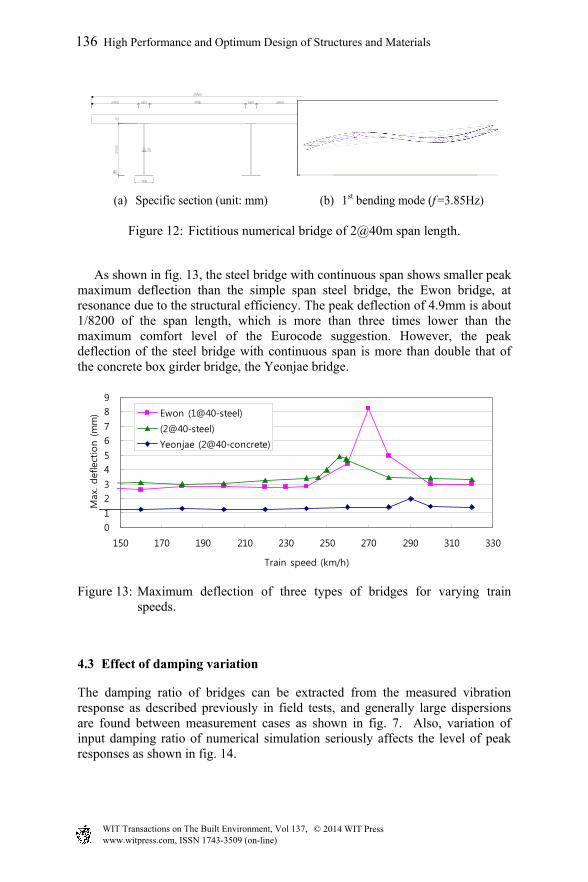
(a) Specific section (unit: mm) (b) 1st bending mode (f =3.85Hz)
Figure 12: Fictitious numerical bridge of 2@40m span length.
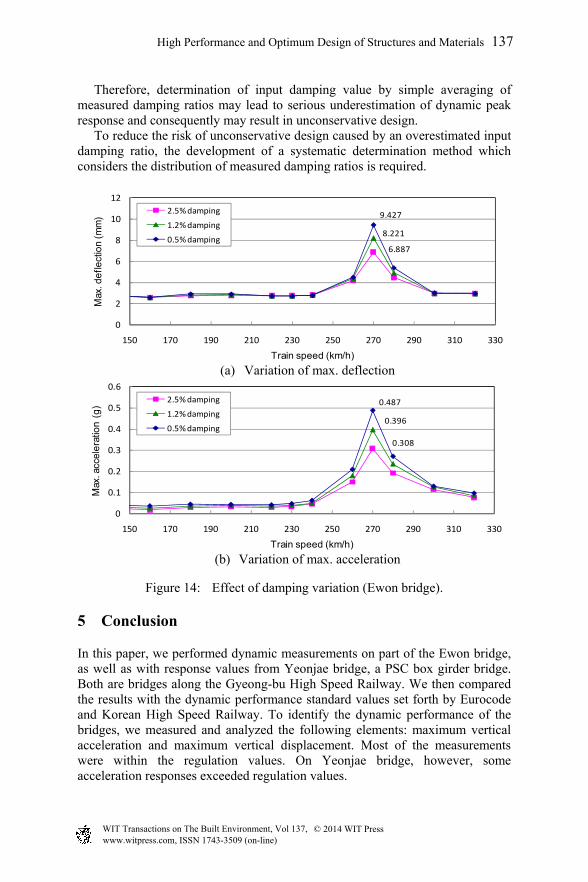
As shown in fig. 13, the steel bridge with continuous span shows smaller peak maximum deflection than the simple span steel bridge, the Ewon bridge, at resonance due to the structural efficiency. The peak deflection of 4.9mm is about 1/8200 of the span length, which is more than three times lower than the maximum comfort level of the Eurocode suggestion. However, the peak deflection of the steel bridge with continuous span is more than double that of the concrete box girder bridge, the Yeonjae bridge.
Figure 13: Maximum deflection of three types of bridges for varying train speeds.
4.3 Effect of damping variation
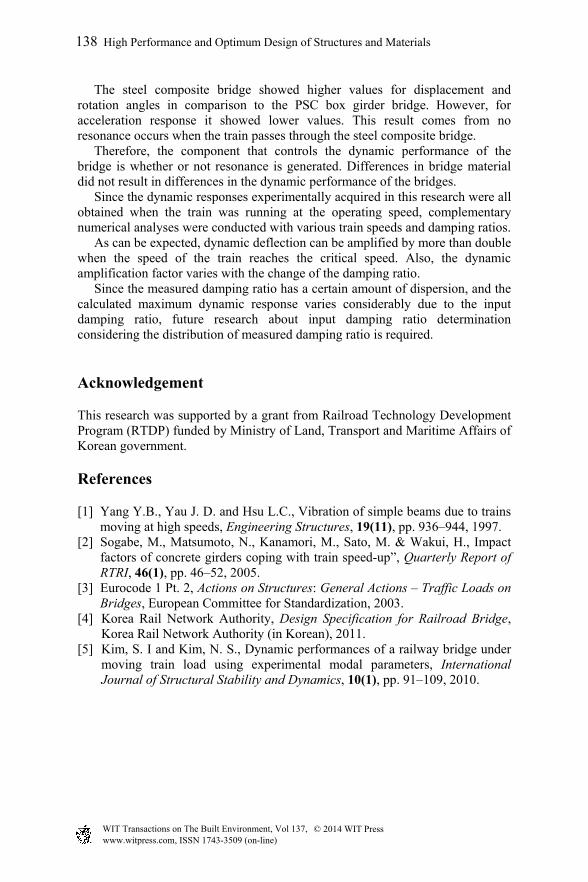
The damping ratio of bridges can be extracted from the measured vibration response as described previously in field tests, and generally large dispersions are found between measurement cases as shown in fig. 7. Also, variation of input damping ratio of numerical simulation seriously affects the level of peak responses as shown in fig. 14.
01
23
45
67
89
150 170 190 210 230 250 270 290 310 330
Train speed (km/h)
Max
. def
lect
ion (m
m) Ewon (1@40-steel)
(2@40-steel)
Yeonjae (2@40-concrete)
136 High Performance and Optimum Design of Structures and Materials
www.witpress.com, ISSN 1743-3509 (on-line) WIT Transactions on The Built Environment, Vol 137, © 2014 WIT Press
Therefore, determination of input damping value by simple averaging of measured damping ratios may lead to serious underestimation of dynamic peak response and consequently may result in unconservative design. To reduce the risk of unconservative design caused by an overestimated input damping ratio, the development of a systematic determination method which considers the distribution of measured damping ratios is required.
(a) Variation of max. deflection
(b) Variation of max. acceleration
Figure 14: Effect of damping variation (Ewon bridge).
5 Conclusion
In this paper, we performed dynamic measurements on part of the Ewon bridge, as well as with response values from Yeonjae bridge, a PSC box girder bridge. Both are bridges along the Gyeong-bu High Speed Railway. We then compared the results with the dynamic performance standard values set forth by Eurocode and Korean High Speed Railway. To identify the dynamic performance of the bridges, we measured and analyzed the following elements: maximum vertical acceleration and maximum vertical displacement. Most of the measurements were within the regulation values. On Yeonjae bridge, however, some acceleration responses exceeded regulation values.
6.887
8.221
9.427
0
2
4
6
8
10
12
150 170 190 210 230 250 270 290 310 330
Max
. de
flect
ion
(mm
)
Train speed (km/h)
2.5% damping
1.2% damping
0.5% damping
0.308
0.396
0.487
0
0.1
0.2
0.3
0.4
0.5
0.6
150 170 190 210 230 250 270 290 310 330
Max
. acc
ele
ratio
n (g
)
Train speed (km/h)
2.5% damping
1.2% damping
0.5% damping
High Performance and Optimum Design of Structures and Materials 137
www.witpress.com, ISSN 1743-3509 (on-line) WIT Transactions on The Built Environment, Vol 137, © 2014 WIT Press
The steel composite bridge showed higher values for displacement and rotation angles in comparison to the PSC box girder bridge. However, for acceleration response it showed lower values. This result comes from no resonance occurs when the train passes through the steel composite bridge. Therefore, the component that controls the dynamic performance of the bridge is whether or not resonance is generated. Differences in bridge material did not result in differences in the dynamic performance of the bridges. Since the dynamic responses experimentally acquired in this research were all obtained when the train was running at the operating speed, complementary numerical analyses were conducted with various train speeds and damping ratios. As can be expected, dynamic deflection can be amplified by more than double when the speed of the train reaches the critical speed. Also, the dynamic amplification factor varies with the change of the damping ratio. Since the measured damping ratio has a certain amount of dispersion, and the calculated maximum dynamic response varies considerably due to the input damping ratio, future research about input damping ratio determination considering the distribution of measured damping ratio is required.
Acknowledgement
This research was supported by a grant from Railroad Technology Development Program (RTDP) funded by Ministry of Land, Transport and Maritime Affairs of Korean government.
References
[1] Yang Y.B., Yau J. D. and Hsu L.C., Vibration of simple beams due to trains moving at high speeds, Engineering Structures, 19(11), pp. 936–944, 1997.
[2] Sogabe, M., Matsumoto, N., Kanamori, M., Sato, M. & Wakui, H., Impact factors of concrete girders coping with train speed-up”, Quarterly Report of RTRI, 46(1), pp. 46–52, 2005.
[3] Eurocode 1 Pt. 2, Actions on Structures: General Actions – Traffic Loads on Bridges, European Committee for Standardization, 2003.
[4] Korea Rail Network Authority, Design Specification for Railroad Bridge, Korea Rail Network Authority (in Korean), 2011.
[5] Kim, S. I and Kim, N. S., Dynamic performances of a railway bridge under moving train load using experimental modal parameters, International Journal of Structural Stability and Dynamics, 10(1), pp. 91–109, 2010.
138 High Performance and Optimum Design of Structures and Materials
www.witpress.com, ISSN 1743-3509 (on-line) WIT Transactions on The Built Environment, Vol 137, © 2014 WIT Press