dynamic response of a composite propeller blade subjected ... · dynamic response of a composite...
TRANSCRIPT
Journal of Fluids and Structures, 2015
DOI: 10.1016/j.jfluidstructs.2015.01.012
1
Dynamic Response of a Composite Propeller Blade Subjected to Shock and Bubble Pressure Loading
Chao-Tsung Hsiao1 and Georges L. Chahine
DYNAFLOW, INC.
10621-J Iron Bridge Road, Jessup, MD 20794
Abstract
The interaction between an underwater explosion and a composite propeller involves
several physical phenomena that an accurate numerical simulation needs to capture. These
include proper description of the initial explosion shock wave, of its propagation in the water,
and of its interaction with the propeller blades and any other neighboring boundaries. In this
work, a numerical procedure which links a compressible flow solver with an incompressible flow
solver is applied to capture both shock and bubble phases efficiently and accurately. Both flow
codes solve the fluid dynamics while intimately coupling the solution with a finite element
structure code thus enabling simulation of full fluid-structure interaction. This numerical
approach is applied to the simulation of the interaction between an underwater explosion and a
multi-layered propeller blade made of a set of composite materials. Fiber orientation in the
various layers is studied to understand which combinations of materials and fiber orientations
give the strongest resistance in terms of both bending and twisting of the blade.
Keywords Fluid Structure Interaction, Underwater Explosion, Shock, Bubble Dynamics, Composite
Material, Dynamic Response
1 Corresponding author Tel: (301) 604-3688 Email address: [email protected]

Journal of Fluids and Structures, 2015
DOI: 10.1016/j.jfluidstructs.2015.01.012
2
1 INTRODUCTION The interaction of an underwater explosion (UNDEX) with a neighboring structure has
been an area of interest for the fluids and structures communities for a long time (Cole, 1948;
Taylor, 1963; Chahine et al., 1996; Wardlaw et al., 2000; Geers and Hunter, 2002; Shin, 2004,
Liang and Tai, 2006; Young, et al., 2009; Zhang and Zong, 2011; Farhat et al., 2013; Wang et
al., 2013). The complex dynamics is the result of an initial shock wave created by the detonation,
followed by the growth and collapse of a bubble with very strong dynamics, and the interaction
of the shock and the bubble with the structure. While the shock has a very short duration
(microseconds), the dynamics of the bubble produces a long duration load with pulses, which
could strongly excite the natural frequency of the structure. This could result in large motions
and strains and the survival of the structure to the initial shock may not be a sufficient design
constraint for a composite propeller.
While there are many studies on the dynamics response of ships (e.g. Liang and Tai,
2006; Sprague and Geers, 2006; Zong et al., 2008; Zhang and Zong, 2011), submarines (e.g. Kim
and Shin, 2008, ), and propellers (Young, et al., 2009) to the shock loading from underwater
explosions (UNDEX), fewer studies in the open literature consider the effects of UNDEX bubbles
on ships (Chahine et al., 1996; Wardlaw et al.; 2000, Zong et al., 2008) and we are not aware of
any studies that have addressed UNDEX bubbles interaction with propellers. Also, several studies
have considered the response to UNDEX shock of composite structures such as composite
cylinders (McCoy and Sun 1997), laminated pipeline (Lam et al. 2003,) and clamped composite
plates (Fleck and Deshpande, 2004; Qiu et al., 2004; Rathbun et al., 2006). The focus of these
studies has been on the response of the considered structure to the compression phase during
shock wave impact and less attention was given to UNDEX bubble effects. Analytical modeling
of a clamped sandwich panel response to the UNDEX shock decomposes the events into three
stages (Fleck and Deshpande, 2004). The first is due to momentum transfer of the liquid to the
beam, the second is due to the core compression, and the third is due to plate bending and
stretching. Although such assumptions work well for plane waves, additional considerations are
needed for the response of the structure to the UNDEX bubble which requires fully coupled FSI
simulations (Chahine et al., 1996; Wardlaw et al., 2000).
Several researchers have conducted investigations evaluating the performance of
composite propellers in other aspects than survivability to underwater explosions. Composite
propellers have similar speed, fuel consumption, operating life, and horsepower requirements as
their metal counterparts (Lin, 1991a) while having the advantage of lower weight to size ratio.
Lin (1991b) calculated the stresses and deformations of a composite marine propeller and
compared them to an isotropic NAB propeller. The NAB propeller was found to have 50% less
elastic deformation compared to a composite propeller made of multiple layers of braided fiber.
Lin and Lin (1996) coupled a 3-D Finite Element Method (FEM) with a vortex lattice method
(VLM) and later they added an algorithm to their FEM coupled with VLM procedure to evaluate
the optimum stacking sequence of the fiber composites (Lee and Lin, 2004). A more recent study
(Young, 2008) used a combined Boundary Element Method (BEM) with FEM to study fluid-
structure interaction of flexible composite propellers in sub-cavitating and cavitating flows. The
study demonstrated that inclusion of FSI was crucial in determining the blade deformation and
the fundamental frequencies of the propeller. Similar work for fiber-reinforced plastic composite
propellers studied the bending-twisting coupling effects of anisotropic composites and load-
dependent self-adaption behavior for performance improvement (Motley et al., 2009).
Journal of Fluids and Structures, 2015
DOI: 10.1016/j.jfluidstructs.2015.01.012
3
In the present study, the numerical procedure developed to study the interaction of an
underwater explosion and a composite propeller blade during both the UNDEX shock and bubble
phases is described in the Numerical Approach section. The study of a propeller blade made of
several layers of composite materials with different fiber orientations is then presented and its
response to a close-by small explosion is investigated to understand which materials and fiber
orientations improve performance. A conventional UNDEX configuration is then studied and the
effect of fiber orientations to improve propeller resistance analyzed.
2 Numerical Approach In the present study, a time decomposition scheme is utilized to solve numerically the different stages of
an UNDEX interaction with a composite propeller. This scheme combines the advantages of both a
compressible code and an incompressible solver to capture the shock and bubble phases. As
illustrated in Fig. 1, two time domains are considered both involving fluid structure interaction
computations. The initial shock phase dominated by compressibility is modeled using a multi-
material compressible Euler equation solver, GEMINI (Wardlaw et al., 2003). This is applied to
properly capture the shock wave phase. After the shock moves out of the computational domain,
the liquid becomes virtually incompressible and the flow filed is controlled by the bubble
dynamics. This phase is then modelled with a BEM approach.
Although GEMINI can accurately predict both UNDEX shock and bubble dynamics
phases, it requires very fine gridding and significant computational resources to capture the full
period of the bubble up to the point of touchdown, given the wide differences between the shock
propagation time scale and the bubble dynamics time scale. To facilitate the simulations, a
special link procedure is developed to transfer the solution of the compressible flow solver to
become the initial conditions for the bubble flow modeling. The bubble dynamics phase involves
mostly incompressible fluid dynamics and is modeled using a liquid boundary element method
(BEM) potential flow solver, which has been shown to be very efficient in modeling underwater
explosion and cavitation bubble dynamics problems (Chahine and Perdue, 1989; Zhang et al.,
1993; Kalumuck et al., 1995; Chahine et al., 1996, 2003; Chahine and Kalumuck, 1998;
Jayaprakash et al., 2012; Chahine, 2014). The following phases involving liquid compressibility,
such as reentrant jet impact or rebound with a shock, can be solved again with the compressible
solver.
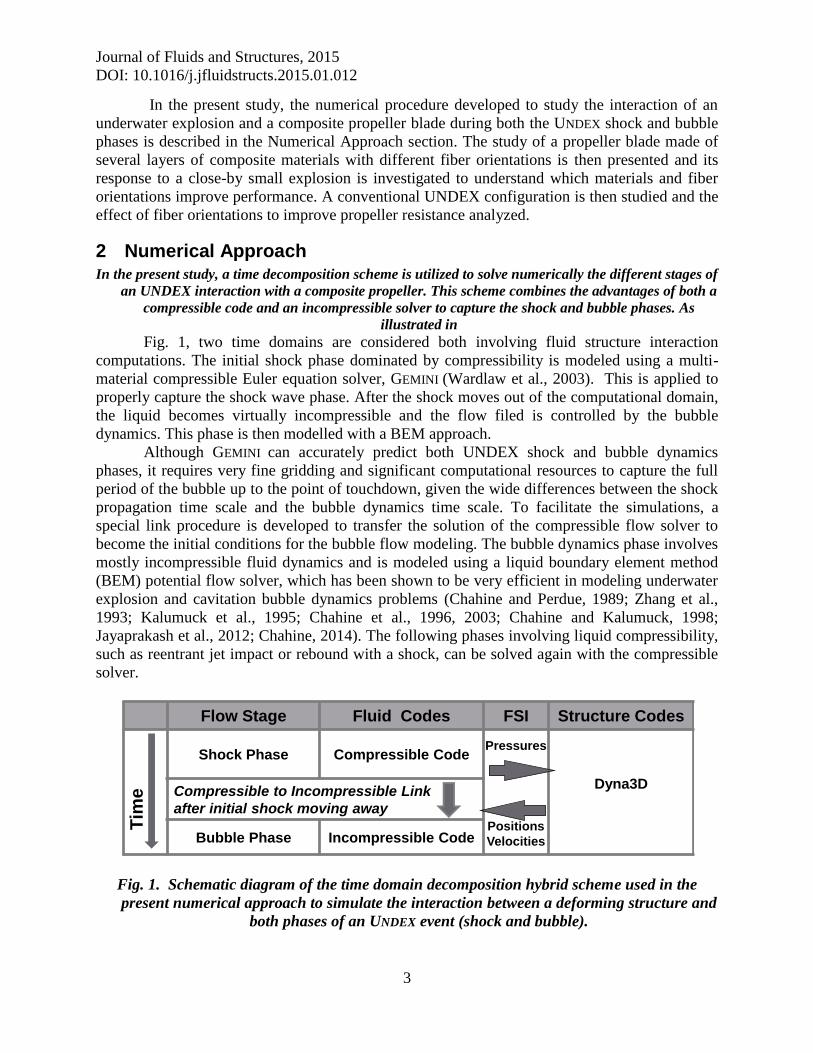
Fig. 1. Schematic diagram of the time domain decomposition hybrid scheme used in the
present numerical approach to simulate the interaction between a deforming structure and
both phases of an UNDEX event (shock and bubble).
Flow Stage Fluid Codes FSI Structure Codes
Shock Phase Compressible Code
Dyna3DCompressible to Incompressible Link
after initial shock moving away
Bubble Phase Incompressible Code
Tim
e
Pressures
Positions
Velocities

Journal of Fluids and Structures, 2015
DOI: 10.1016/j.jfluidstructs.2015.01.012
4
Both the compressible and incompressible fluid codes are coupled with the structure
dynamics code, DYNA3D (Whirley and Engelmann, 1993), which uses a finite element approach
not BEM and provides a full fluid structure interaction (FSI) solution for the full history of
interest to the UNDEX dynamics. More details of the above is presented below.
2.1 Compressible Flow Solver GEMINI is a multi-material compressible Euler equation solver developed by the Naval
Surface Warfare Center, Indian Head division, and is based on a finite difference scheme
(Wardlaw et al., 2003). The code solves continuity and momentum equations for a compressible
inviscid liquid in Cartesian coordinates. These can be written in the following format:
Q E F G
St x y z
, (1)
with
2
2
2
0
0
, , , , 0 ,
t t t t
u v w
vuu u p wu
Q v E uv F v p G wv S
w uw vw gw p
e gwe p u e p v e p w
(2)
where is the liquid density, p the pressure, and u, v, and w are the velocity components in the
x, y, and z directions respectively (z is vertical). g is the acceleration of gravity, and
et=e+0.5(u2+v
2+w
2) is the total energy with e being the internal energy.
Eq. (1) is applied to solve gas, liquid, or other media with an equation of state relating
pressure, density, and energy for a given material or phase. The code uses a high order Gudonov
scheme and employs the Riemann problem to construct a local flow solution between adjacent
cells. The numerical method is based on a higher order MUSCL scheme (Collella, 1985) and
tracks each material. To improve efficiency, an approximate Riemann problem solution replaces
the full problem. The MUSCL scheme is augmented with a Lagrange re-map treatment of mixed
cells. The code has been extensively validated by NSWCIH against UNDEX experiments
(Wardlaw et al., 2003).
2.2 Incompressible Flow Solver The incompressible flow solver, 3DYNAFS
©, for the simulation of three-dimensional
bubble dynamics is based on the boundary element method (BEM) developed in our earlier work
(Chahine et al. 1988, Chahine and Purdue, 1989; Chahine et al., 1996; Chahine and Kalumuck,
1998; Chahine et al., 2003). Although the BEM has been applied much earlier for structure and
axisymmetric bubble problems (e.g. Cruise and Rizzo, 1968; Brebbia et al., 1984 ), our early
work published in 1988 represents a pioneering work on the application of BEM to the full three-
dimensional unsteady evolving boundary bubble dynamics problem. The code solves the Laplace
equation, 2 0 , (3)
for the velocity potential, , with the velocity vector defined as u . The Laplace equation is
solved based on Green’s theorem:

Journal of Fluids and Structures, 2015
DOI: 10.1016/j.jfluidstructs.2015.01.012
5
2 2 .S
G G d G G dS
n (4)
In this expression is the domain of integration having elementary volume d. The boundary
surface of is S with elementary surface element dS, and includes the surfaces of the propeller,
surfaces of any nearby boundaries and the surface of the bubble. n is the local normal unit vector
to any point on the Surface S. is harmonic in the fluid domain , and G is Green's function,
If G is selected to be harmonic everywhere but at some discrete points, Eq. (4) simplifies
considerably. For instance, if
1
| x y |
G
, (5)
where x is a fixed point in the domain and y is a point on the boundary surface S. Eq. (4)
reduces to Green’s formula with being the solid angle under which x sees the domain, :
( ) ( ) ( , ) ( , ) ( ) ,S
Ga G dS
n n
x y x y x y y (6)
where a is the solid angle.
Eq. (6) provides a relationship between and /n at the boundary surface S. Thus, if
either of these two variables (e.g. ) is known everywhere on the surface, the other variable (e.g.
/n) can be obtained. To solve Eq. (6) numerically, the boundary element method, which
discretizes the surface of all objects in the computational domain into panel elements (Chahine et
al., 1996) is applied.
To advance the solution in time, the coordinates of the bubble and free surfaces nodes, x,
are advanced according to /d dt x , and on the bubble and free surface nodes is obtained
through the time integration of the material derivative of , i.e. d/dt , which can be written as
.d
dt t
, (7)
where /t can be determined from the Bernoulli equation:
1.
2lgz p p
t
(8)
where lp is the liquid pressure at the bubble surface or free surface, p is the hydrostatic
pressure at infinity at z=0, and z is the vertical coordinate.
While time integration of Eq. (7) provides for the bubble and free surface, /n on the
propeller blade surface is provided by the structure motion from the solution of the structure
dynamics during the time marching. Further discussion of the time stepping synchronization
between the fluid and the structure solvers is provided in a later section.
2.3 Structure Solver To model the dynamics of the propeller blade the finite element code DYNA3D (Whirley
and Engelmann 1993) is used. DYNA3D is a non-linear structure dynamics code developed at the
Laurence Livermore National Laboratory. Here it is used to compute the material deformation
resulting from the loading resulting from the UNDEX event and obtained by the solution of the
fluid problem.
DYNA3D uses a lumped mass formulation for efficiency. This produces a diagonal mass
matrix M, to express the momentum equation as:

Journal of Fluids and Structures, 2015
DOI: 10.1016/j.jfluidstructs.2015.01.012
6
2
ext int2,
d
dt
xM F F (9)
where Fext represents the applied external forces, and Fint the internal forces. The acceleration,2 2/d dta x , for each element is obtained through an explicit temporal central differencing
method. Additional details on the general formulation can be found in Whirley and Engelmann
(1993).
2.4 Compressible-Incompressible Link Procedure To proceed properly with the time decomposition approach in the present hybrid
numerical procedure, initial conditions need to be given to the BEM code following transfer of
the solution from the compressible code. These are provided by the solution of the compressible
flow at the transfer time and consist of all flow properties such as velocities, pressures, and
densities at the 3D grid points. These are then interpolated to the BEM surface grid. The steps of
the procedure can be described as follows:
A boundary element mesh is generated on the bubble liquid interface and any other
liquid free surfaces, which are identified based on the distribution of material
densities computed by the compressible solver (see Fig. 2).
The velocities on the BEM surface nodes are interpolated from the velocities obtained
in the compressible flow field solution at the volume grids (see Fig. 3) and the
component of the velocity normal to the interface, / n , is deduced using the local
normal vector at the BEM discretized surface (see Fig. 4).
Eq. (6) is then used to obtain the velocity potential values, , at all the BEM nodes
where / n is known.
These values of at the bubble and free surface nodes are then used to initialize the
BEM computation, which is thereafter marched in time using Eq. (7).
Fig. 2. BEM surface mesh generated on the gas/liquid interfaces using the density distribution
obtained by the compressible flow solution. This example is for an UNDEX bubble under a
free surface.

Journal of Fluids and Structures, 2015
DOI: 10.1016/j.jfluidstructs.2015.01.012
7
Fig. 3. Pressure contours and velocity vectors from the GEMINI compressible flow solution at
the time of transfer to the incompressible code 3DYNAFS. This example is for an UNDEX event
under a free surface.
Fig. 4. Color plot of the normal components of the velocities, /n, derived on the bubble and
free surface at the time of handoff. This example is for an UNDEX under a free surface.
2.5 Fluid Structure Interaction Fluid structure interaction effects are captured in the simulations by coupling at each time
step the corresponding fluid code (either Gemini or 3DYNAFS) and the structure code. The
coupling is achieved as follows:
At the end of a given fluid dynamics time step, the fluid code (either compressible or
incompressible depending on time in the UNDEX dynamics history) computes the pressure
distribution at the structure surface nodes.
This provides the loading to the structure code. In response, the structure code computes
material stresses and strains and provides the deformations and velocities of the structure

Journal of Fluids and Structures, 2015
DOI: 10.1016/j.jfluidstructs.2015.01.012
8
liquid interface in response to this loading. This includes any large deformations of the
structure and new positions of the solid liquid interfaces needed to continue the
computations.
The coordinates and the non-zero velocities of the structure surface wetted nodes then
provide new boundary conditions for the fluid code next time step.
The fluid code then solves the flow field and deduces the pressures at the surface using
the body boundary nodes positions and normal velocities as boundary conditions, and the
cycle continues
Additional details on the procedure can be found in (Kalumuck et al., 1995, Chahine et al.,
2003, Wardlaw et al., 2003, Chahine, 2014).
2.6 Time Integration and FSI Coupling Stabilization Explicit time integration schemes are used for each of the three codes, i.e., 3DYNAFS,
GEMINI, and DYNA3D. In the BEM, an adaptive time step size, BEMt , is used. BEMt is selected
based on the ratio of the smallest panel size minl and the maximum local flow velocity, maxV :
minBEM
max f
l 1t ,
V T
(10)
where fT is a time scale factor similar to the Courant number. This selection enables the code to
slow down time stepping during bubble collapse where the velocities are very high and the panel
sizes reduce in size, and to speed up during bubble expansion where the opposite occurs. This
scheme has been shown to be very effective for many studies involving bubble dynamics such as
in (Chahine et al. 1989, 2003, Hsiao et al. 2014)
In GEMINI a higher order predictor-corrector method based on the Monotonic Upwind
Scheme for Conservation Law (MUSCL) is used. The overall predictor-corrector method
consists of a step to calculate the slopes of the primitive variables (i.e. density, velocity, and
energy), a predictor step to apply the method of characteristic, and a corrector step involving the
Riemann solver. The time step size, Gt , which is used in the predictor-corrector method is
determined according to the Courant number defined as
max( , , ) Gu u c u c tCFL
x
, (11)
where u is the local velocity, c is the local sound speed, and x is the local grid size. A fixed
CFL number of 0.45 is applied to compute the time step size required for each cell according to
Eq. (11). The minimum value of Gt is then used to march the time integration for all cells.
Concerning the structure code, DYNA3D, the time step is selected to also satisfy a
Courant criterion. This requires that the time step size be small enough to prevent elastic stress
waves from propagating during one step farther than the dimension of the smallest element.
Since stress wave propagation in a solid is usually faster than the sound speed in water, the time
step size for the structure code is smaller than that in the fluid codes if both fluid and structure
codes use similar grid sizes. In the present FSI coupling scheme, the fluid time step is selected
for both codes if it satisfies both solid and liquid time step limit criteria. Otherwise, each code
follows its own time stepping scheme and usually (when the requirement of time step size for the
structure code is smaller than that of fluid code) the fluid code waits while the structure performs
“sub-time” integrations and then provides the solution for the next fluid step.

Journal of Fluids and Structures, 2015
DOI: 10.1016/j.jfluidstructs.2015.01.012
9
In order to ensure the stability of time integration damping of high frequency numerical
oscillations is applied. To do so both the local structure surface grid velocities applied as
boundary condition to the fluid code and the fluid pressures loading the structure are filtered.
An adaptive recursive filter with the following form is applied 2 21, 1 , ,cut cutf t f tn n ny ax by a e b e (12)
where x is the original input value, y is the output filtered value and fcut is a filter cutoff
frequency. This recursive filter is a low pass filter but with a broad band, with the value of fcut
being an indicator of the upper limit of the frequencies kept in the system. In the present study
we have used fcut=250 Hz and found it adequate for preventing any artificial oscillations or
divergence of the solution.
3 Validation of Numerical Approach
The numerical approach presented here has been validated on many Navy related
problems (Chahine et al.1998, 2003, 2004, Hsiao et al. 2014). We present here as illustration a
comparison between the results given by the present approach and measurements conducted on a
floating shock platform subjected to an UNDEX. The floating shock platform has a rectangular
base of 4.9 m × 8.5 m and an initial draft of 1.3 m. The problem setup is shown in Fig. 5. An
explosive charge of 27.24 kg HBX is detonated at 7.3 m below the free surface and 6.1 m
horizontally away from the floating body. A total of 1,764 shell elements with stainless steel
material was used to model the floating platform as shown in Fig. 6.
The numerical predictions obtained with the numerical approach described above of the
vertical velocity of the platform center of gravity in response to the UNDEX are shown in Fig. 7
and are compared to the test measurements (Chahine et al. 2004). Also shown are the results
obtained by each GEMINI and 3DYNAFS when run alone for the full bubble period without the
time domain decomposition and compressible - incompressible link. It is seen that the solution
obtained by the BEM alone, which excludes shock wave effects, under-predicts the initial kick-
off velocity of the platform and misses the initial motion. Both GEMINI alone and the present
hybrid approach predict well the initial kick-off velocity wave as well as period of the body
motion due to the bubble dynamics. However, the CPU time required for the hybrid approach to
simulate the whole bubble period is ten times smaller than for the compressible code alone.
Fig. 5. Geometrical setup of the interaction of an UNDEX and a floating platform. The charge
is located at a depth of 7.3 m, 6.1 m away from a floating platform.
7.3 m
6.1 m
Floating Body
4.9 m
UNDEX Bubble
Free Surface

Journal of Fluids and Structures, 2015
DOI: 10.1016/j.jfluidstructs.2015.01.012
10
Fig. 6. Finite element model of the floating platform.
Fig. 7. Vertical velocity of monitored at the bottom center bodes of the floating platform.
Comparison of the results of the present code with the experimental measurements.
4 Propeller Finite Element Model
In this study, a finite element model with a total of 10,537 brick elements is used to
model the 3 meter radius propeller blade. This is illustrated in Fig. 8. Since a one-point Gauss
quadrature integration is used to speed up the computation for the brick elements, an hourglass
viscosity based on the viscous form derived by Hallquist (1998) is applied to control the
hourglass modes. Two types of blade material are considered in the computations presented
below. The first propeller is made of an isotropic elastic-plastic material representing Nickel-
Aluminum-Bronze (NAB), while the second is made of a composite material. Three layers made
of fiber material with properties close to Carbon fiber, Kevlar, and Glass fiber are considered and
are represented by orthotropic elastic models. Due to the anisotropic nature of the fiber materials,
the stress-strain relations are based on the local coordinates of each element as shown in Fig. 9.
The general strain, , and stress, , relation for each orthotropic linear elastic material is given
by:
MeasurementGemini aloneBEM aloneHybrid

Journal of Fluids and Structures, 2015
DOI: 10.1016/j.jfluidstructs.2015.01.012
11
1/ / / 0 0 0
/ 1/ / 0 0
/ / 1/ 0 0 0
0 0 0 1/ 0 0
0 0 0 0 1/ 0
0 0 0 0 0 1/
a a ab a ac a a
b ab a b bc b b
c ac a bc b c c
ab ab ab
bc bc bc
ca ca ca
E E E
E E E
E E E
G
G
G
, (13)
where aE , bE , and cE are the elastic moduli along directions a, b, and c. The subscript a is for
the fiber direction, while b and c are for the two perpendicular transverse directions. Since the b
and c directions possess symmetric properties, we have for the elastic moduli:
a b cE E E , (14)
and for the Poisson’s ratios:
, , , =ab baab ac ca ba bc cb
a bE E
. (15)
Table 1 lists the values of the moduli and Poisson’s ratios used in the present simulations.
Fiber
name
g/cm3)
Ea
(GPa)
Eb=Ec
(GPa)
ba cb Gab
(GPa)
Gbc
(GPa)
Carbon 1.782 126 11 0.07 0.28 6.6 4.29
Kevlar 1.48 87 6.5 0.01973 0.48 4.0 2.2
Glass 1.91 37.5 10 0.07465 0.32 0.38 0.3788
Table 1. Material properties for the DYNA3D simulations.
Fig. 8. Surface mesh of the finite element model used in Dyna3D to model the 6-meter
propeller blade.
Journal of Fluids and Structures, 2015
DOI: 10.1016/j.jfluidstructs.2015.01.012
12
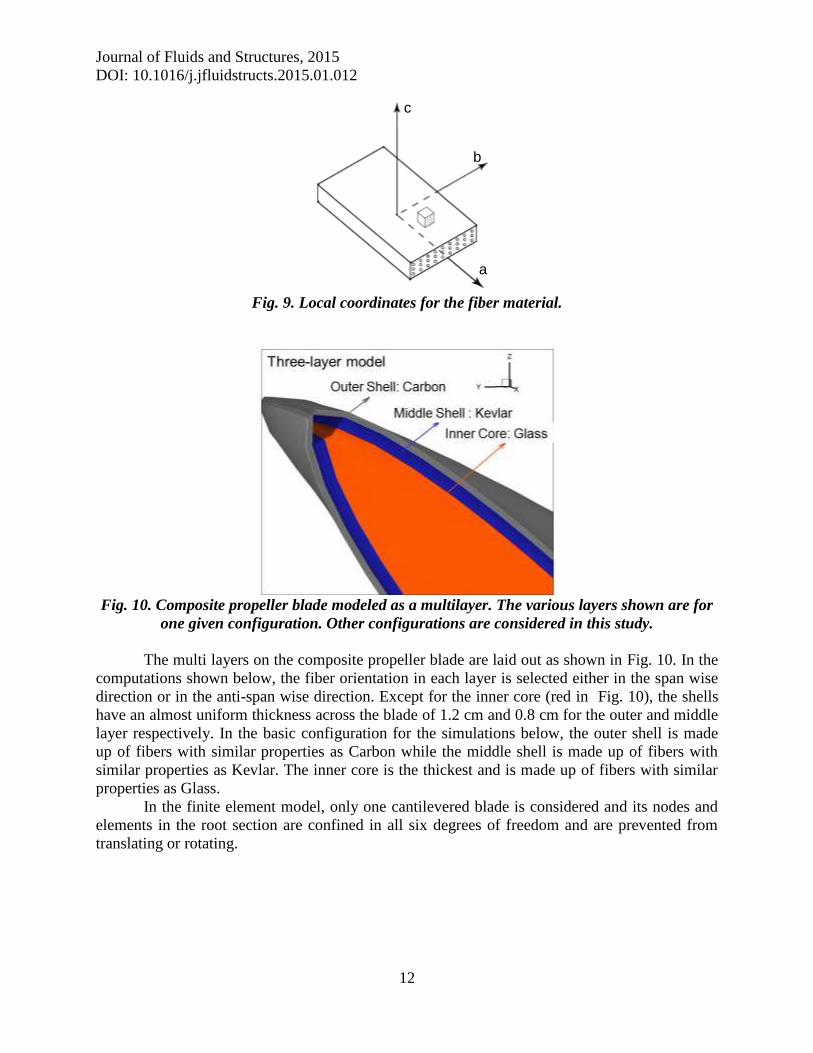
Fig. 9. Local coordinates for the fiber material.
Fig. 10. Composite propeller blade modeled as a multilayer. The various layers shown are for
one given configuration. Other configurations are considered in this study.
The multi layers on the composite propeller blade are laid out as shown in Fig. 10. In the
computations shown below, the fiber orientation in each layer is selected either in the span wise
direction or in the anti-span wise direction. Except for the inner core (red in Fig. 10), the shells
have an almost uniform thickness across the blade of 1.2 cm and 0.8 cm for the outer and middle
layer respectively. In the basic configuration for the simulations below, the outer shell is made
up of fibers with similar properties as Carbon while the middle shell is made up of fibers with
similar properties as Kevlar. The inner core is the thickest and is made up of fibers with similar
properties as Glass.
In the finite element model, only one cantilevered blade is considered and its nodes and
elements in the root section are confined in all six degrees of freedom and are prevented from
translating or rotating.
c
b
a
c
b
a

Journal of Fluids and Structures, 2015
DOI: 10.1016/j.jfluidstructs.2015.01.012
13
5 CLOSE-IN INTERACTION WITH A SMALL EXPLOSION
We consider first a small explosive charge of 0.454 kg TNT detonated at 9.75 m below
the free surface and at a standoff of one meter from the propeller hub ‘center’ (see Fig. 11). This
is meant to illustrate very strong interaction between an underwater explosion bubble and a
propeller blade.
Fig. 12 shows the GEMINI 3D fluid grid in the fluid region containing the explosion
center and the propeller blade. To capture properly the shock wave, the bubble dynamics, and the
fluid structure interaction physics, finer grids are used around the bubble and in the propeller
blade regions while stretched grids are used to extend the computational domain to the far field.
A total of 3 million grid points is used for the fluid computational domain which has domain
boundaries located 100 m away from the explosion center in all directions except for the
boundary on the top where a free surface located 9.75 m above the explosion center. Non-
reflective boundary conditions, i.e. the flow variables are extrapolated in the characteristic wave
direction, are imposed at all far field domain boundaries. A constant pressure is imposed at the
free surface.
Fig. 11. Geometrical setup for the propeller blade response to a 0.454 kg TNT UNDEX at a
charge depth of 9.75 m and at a standoff of 1 m.
Fig. 12. GEMINI Grid distribution for the simulation of an UNDEX near a propeller.

Journal of Fluids and Structures, 2015
DOI: 10.1016/j.jfluidstructs.2015.01.012
14
5.1 Interaction during Shock Phase The behaviors of both a Nickel Aluminum Bronze (NAB) blade and the composite blade
described above were investigated. In this section, all fibers in the composite blade were oriented
in the span direction. Fig. 13 and
Fig. 14 show the pressure contours at six time instances following detonation in the plane
X = 2 m cutting through the charge center for the NAB and the composite propeller blades,
respectively. The spherical shock wave emanating from the UNDEX moves towards the blade
(Fig. 13a and
Fig. 14a), impacts the propeller surface and is reflected as a compression wave back
towards the explosion bubble (Fig. 13b and
Fig. 14b) but is less intense for the more responsive composite blade deforming (Fig. 13c
and
Fig. 14c). Subsequently a low pressure region appears behind the front of the reflected
wave near the propeller around t=1.0 ms (see Fig. 13c and
Fig. 14c). It is then deviated and enhanced by the expansion wave reflected from the
bubble liquid interface (Fig. 13d,e and
Fig. 14d,e). The liquid in the low pressure regions, illustrated in white color in the
figures, cavitates (i.e. the pressure drops below the water vapor pressure and in the multiphase
GEMINI code vapor cells are generated). Cavitation appears behind the wave front and in the
expansion wave reflected from the bubble, as seen at t=1.2 and 1.4 ms (see frames d, e and f of
Fig. 13 and
Fig. 14).
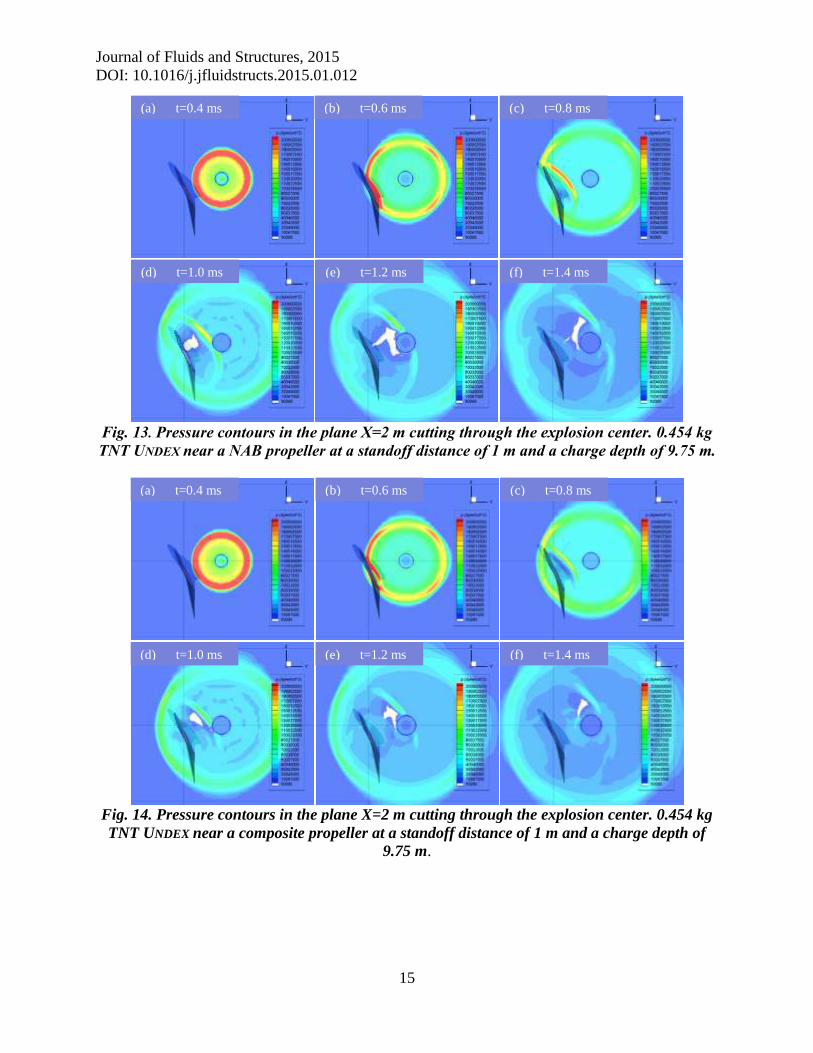
When comparing the shock wave patterns between the NAB and composite propeller,
one can observe lower intensity reflected shock waves for the composite propeller as seen
between t=0.6 and 0.8 ms. This is due to larger energy absorption of a part of the UNDEX energy
through motion and deformation of the composite material. Since the composite propeller is
much more deformable than the NAB propeller, more shock energy is dissipated through the
composite propeller deformation, resulting in a weaker reflected shock wave and a subsequent
lower pressure distribution on the propeller surface. This can also be observed by comparing the
cavitation regions (white regions in frame d, e, and f of Fig. 13 and
Fig. 14) which are smaller for the composite propeller than for the NAB propeller.
Journal of Fluids and Structures, 2015
DOI: 10.1016/j.jfluidstructs.2015.01.012
15
Fig. 13. Pressure contours in the plane X=2 m cutting through the explosion center. 0.454 kg
TNT UNDEX near a NAB propeller at a standoff distance of 1 m and a charge depth of 9.75 m.
Fig. 14. Pressure contours in the plane X=2 m cutting through the explosion center. 0.454 kg
TNT UNDEX near a composite propeller at a standoff distance of 1 m and a charge depth of
9.75 m.
(a) t=0.4 ms (b) t=0.6 ms
(d) t=1.0 ms (e) t=1.2 ms (f) t=1.4 ms
(a) t=0.4 ms (b) t=0.6 ms (c) t=0.8 ms
(d) t=1.0 ms (e) t=1.2 ms (f) t=1.4 ms
(c) t=0.8 ms
Journal of Fluids and Structures, 2015
DOI: 10.1016/j.jfluidstructs.2015.01.012
16
Fig. 15. Pressure contours, propeller blade deformation and bubble shape at nine time
instants during the UNDEX bubble period following detonation of a 0.454 kg TNT charge near
a NAB propeller blade at an initial standoff of 1m.
t= 0.1 ms t= 10.0 ms
t= 20.0 ms t= 60.0 ms
t= 1.0 ms
t= 100.0 ms
t= 120.0 ms t= 133.8 ms t= 132.8 ms

Journal of Fluids and Structures, 2015
DOI: 10.1016/j.jfluidstructs.2015.01.012
17
Fig. 16. Pressure contours, propeller blade deformation and bubble shape during the bubble
period following detonation of a 0.454 kg TNT charge near a composite propeller blade at an
initial standoff of 1m.
5.2 Interaction during Bubble Phase Fig. 15 and Fig. 16 show the pressure contours, the propeller blade deformation, and the
UNDEX bubble shapes at nine time instants during the first bubble period. These are obtained
during the incompressible phase of the computation using the 3DYNAFS BEM flow solver
coupled with the structure code. Fig. 15 shows the results of the interactions with the NAB
propeller blade while Fig. 16 shows the composite propeller blade. For both blades, the bubble
shapes are significantly influenced by gravity and by the presence of the blade. Consequently,
the bubble shape deviates significantly from a sphere even during the bubble growth phase and
no analytical description of the bubble dynamics can be properly used. It is know from previous
bubble dynamics studies (Blake and Gibson 1987, Zhang et al. 1993, Chahine et al., 2003) that a
bubble collapsing near a rigid wall will form a reentrant jet directed toward the wall. One the
other hand, when a bubble collapses near a free surface, the reentrant jet forms from the bubble
side closer to the free surface and moves away from it (Chahine, 1977). Here, the bubble surface
moves with the propeller blade as it deforms. The reentrant jet ends moving in the direction of
the blade and has a more distinct appearance in the case of the composite blade. This can be
seen by comparing the bubble shapes at t = 133.8 ms between Fig. 15 and Fig. 16.
As expected, the composite propeller blade deforms more significantly than the NAB
propeller in the blade tip region. Due to this deformation unloading occurs and the pressures on
the blade surface on the UNDEX side are significantly lower for the composite propeller than for
t= 0.1 ms t= 10.0 ms t= 1.0 ms
t= 20.0 ms t= 60.0 ms t= 100.0 ms
t= 120.0 ms
t= 133.8 ms
t= 132.8 ms

Journal of Fluids and Structures, 2015
DOI: 10.1016/j.jfluidstructs.2015.01.012
18
the NAB blade as can be seen around t = 133.8 ms. This also results in a slightly smaller
maximum equivalent bubble radius (spherical bubble of the same volume) and a slightly smaller
bubble period as shown in Fig. 17 (this is similar to the effect of a free surface on bubble
dynamics). It is also seen that the minimum bubble radius at collapse is larger resulting in a
lower bubble collapse pressure for the composite propeller blade than for the rigid blade as
shown in Fig. 18.
Fig. 17. Comparison of the time histories of the bubble equivalent radius following detonation
of a 0.454 kg TNT charge near a NAB and a composite propeller blade.
Fig. 18. Comparison of the time histories of field pressure monitored at the hub center
following detonation of a 0.454 kg TNT charge near a NAB and a composite propeller blade.

Journal of Fluids and Structures, 2015
DOI: 10.1016/j.jfluidstructs.2015.01.012
19
A quantitative comparison of the deformations of the two propellers is shown in Fig. 19.
The displacements of two selected nodes on the side of the blade facing the explosion, one at the
tip and the other at the mid-section of the propeller blade are represented versus time. The same
figure shows the bubble equivalent radius and enables correlating the motion of the blades with
the bubble dynamics. Due to its higher rigidity compared to the composite blade, the NAB
propeller blade undergoes displacement oscillations with a higher frequency and a much lower
amplitude than the composite blade. This is most pronounced near the tip where the deformation
is nearly five times smaller for the NAB, while the frequency is about twice higher. It can be
seen from Fig. 19 that the composite blade has an oscillation period close to that of the UNDEX
bubble while the oscillation frequency of the NAB blade is about twice.
Fig. 19. Comparison between a NAB and a composite propeller blade of the displacement in
the direction of the blast (perpendicular to the plane of the figure) at two node locations.
Response to a 0.454 kg TNT charge at a standoff of 1 m.
Fig. 20. Comparison between a NAB propeller blade and a composite blade of the equivalent
stresses in the direction of the blast at two node locations in response to a 0.454 kg TNT
charge at a standoff of 1 m.
Half section
Tip section

Journal of Fluids and Structures, 2015
DOI: 10.1016/j.jfluidstructs.2015.01.012
20
Fig. 20 compares the equivalent stresses at the same nodes as in Fig. 19, i.e. at the tip and
in the midsection halfway between the hub and the tip. The von Mises equivalent stress, e, is
defined as:
2 2 2 2 2 21
6 6 62
e x y y z z x yz zx xy , (16)
where x, y, z are the normal stress terms and xy, yz, zx are the shear stress terms in
Cartesian coordinates. The results clearly illustrate that the composite propeller blade, due to its
larger motion that relieves stress, experiences less stress than the NAB propeller at both
locations. The flexibility of the composite material enables the blade to flex and absorb some of
the UNDEX energy. It is also important to note that both propeller blades sustain much higher von
Mises stresses in response to the loads generated by the bubble dynamics rather than to those
resulting from the shock wave. The stresses reach the highest value at bubble collapse, which
imposes an additional high pressure load while the blade surface is still dynamically oscillating.
The equivalent stresses at five locations (shown in the insert of Fig. 21) along the central
span of the blade for the composite propeller blade are shown in Fig. 21. The blade reacting as a
cantilevered beam sustains more stresses in the sections closer to the root (near the hub) where
the blade is anchored rigidly, and cannot move as much as the tip to relieve the stress. Similarly,
the propeller deflects the least in the axial direction and sees the highest stresses. This is
illustrated in Fig. 22, which shows a comparison of the equivalent stresses at three locations at
mid span. Overall, the central region experiences higher stresses than the leading and trailing
edge areas in response to both a bending motion and a twisting motion.
Fig. 21. Comparison of the equivalent von Mises stresses at five locations along the mid-chord
of the blade for the composite propeller blade in response to a 0.454 kg TNT charge at a
standoff 1 m.
Half section
Quarter section
Three quarter section
Root section
Tip section
Half section
Quarter section
Three quarter section
Root section
Tip section
Journal of Fluids and Structures, 2015
DOI: 10.1016/j.jfluidstructs.2015.01.012
21
Fig. 22. Comparison of von Mises equivalent stresses at three locations along the blade mid-
span for the composite propeller blade in response to a 0.454 kg TNT charge at a standoff 1 m.
In order to examine whether failure occurs in the composite propeller during the UNDEX
event, we consider the Tsai-Wu failure criterion in plane stress (Tsai and Wu 1971), failure when
1,F where the parameter F is deduced from the stresses and the materials properties as
follows: 2 2 2
1 2 11 22 66 122 .a b a b ab a bF F F F F F F (17)
In (17) a, b are the normal stresses and ab is the shear stress term defined according to the
local fiber coordinate as shown in Fig. 9. The coefficients in Eq. (17) are determined by
1 2 11 22 66 12 11 222
1 1 1 1 1 1 1 1, , , , ,
2at ac bt bc at ac bt bc ab
F F F F F F F F
(18)
where at is longitudinal tensile strength of the composite lamina, ac is longitudinal compressive
strength, bt transverse tensile strength, bc transverse compressive strength, and ab shear
strength in ab plane. Table 2 lists the material properties in the present composite propeller used
to compute the Tsai-Wu failure parameter, F.
Fig. 23 shows the time history of the Tsai-Wu failure parameter, F, at the root section
computed used Eq. (17). It is seen that during the bubble collapse, the failure criterion, 1,F is
reached near t=138 ms and failure may occur at this time near the root section of the composite
blade. Comparison of the curves of F and the stresses in Fig. 21 show that the rise of F towards
failure is also predicted by the high rise in the equivalent stresses.
Fiber
name at
Mpa)
ac (MPa)
bt
(MPa)
bc (MPa)
ab (MPa)
Carbon 1448 600 52 206 93
Kevlar 1400 235 12 53 34
Glass 207 207 48 103 31
Table 2. Composite propeller material properties for the Tsai-Wu failure criterion
computation.
Center
Leading
Edge Trailing
Edge

Journal of Fluids and Structures, 2015
DOI: 10.1016/j.jfluidstructs.2015.01.012
22
Fig. 23. Comparison of the Tsai-Wu failure parameter, F in plane stress at five locations at
blade mid-span for the composite propeller blade in response to a 0.454 kg TNT charge at a
standoff 1 m.
Fig. 24. Geometrical setup for the study of the response of a propeller blade to a 27.24 kg TNT
UNDEX at a depth of 9.75 m and at a standoff of 15.24 m.
Fig. 25. GEMINI grid distribution in the liquid for the simulation of the response of a propeller
blade to a 27.24 kg TNT UNDEX at a depth of 9.75 m and a standoff distance of 15.24 m.
Standoff
15.24m (50ft)
60 lbs TNTHub center

Journal of Fluids and Structures, 2015
DOI: 10.1016/j.jfluidstructs.2015.01.012
23
6 RESPONSE TO A CONVENTIONAL UNDEX
To evaluate the performance of the composite propeller blade under a more conventional
scenario where the relative effect of the bubble loading would not be as strong, we consider in
this section the case of a 27.24 kg TNT explosive at a standoff of 15.24 m. The geometry is
illustrated in Fig. 24. Gridding is again selected to produce clustering around the blade and
around the UNDEX bubble as shown in Fig. 25.
6.1 Effects of Fiber Orientation This section illustrates the effect of the orientation of the fibers on the performance of the
composite blade. Two extreme cases are compared; one where the orientation of fibers in all
three layers is in the blade span wise direction and the other when the fibers are all in the anti-
span direction, as illustrated schematically in Fig. 26.
Fig. 26. Illustration of fiber direction in the composite propeller blade: all fibers in the span
wise direction (left) and all fibers in the anti-span wise direction (right). The arrows
schematically illustrate the fiber direction.
Fig. 27 shows a comparison between the two composite propeller configurations of blade
node displacements in the direction of the explosive charge for a node located in the blade mid-
section (see the figure insert for location). The initial UNDEX shock pushes the blade away from
the explosion center (y negative). This is followed by high frequency oscillations of the blade
displacement in both configurations with the span wise configurations trying to return to the
original position faster. For t>50 ms the flow field due to the UNDEX bubble starts acting on the
blade. The low pressures generated in the water during the bubble growth bring the blade back
towards the detonation center in the opposite direction to that resulting from the shock. Here
again the anti-span blade responds more readily and this results in a larger amplitude and higher
frequency response as seen in Fig. 27. Finally, a large repulsion from the bubble occurs for both
fiber orientations as the bubble collapses, and this moves the blade beyond its initial location.
During the whole dynamics the span wise fiber orientation results in stronger resistance,
smaller displacement, and higher frequency oscillations than the anti-span configuration. These
smaller displacements in the direction perpendicular to the blade lifting surface indicates a better
resistance in the bending motion. The differences in behavior between the two blades are
probably due to differences in the fibers’ alignment relative to the blade. The anti-span blade has
Journal of Fluids and Structures, 2015
DOI: 10.1016/j.jfluidstructs.2015.01.012
24
fibers running perpendicular to the longitudinal axis along the entire chord length of the blade,
while the span blade has variable fiber angle as the fibers follow the general geometry of the
blade.
Fig. 27. Comparison of the bending motion at a point at mid-span of the blade for a span wise
and an anti-span wise fiber orientation in response to a 27.24 kg TNT charge at a 50ft
standoff distance.
Fig. 28. Comparison of the twisting motion at mid-span between a span wise and an anti-span
wise fiber orientation propeller blade in response to a 27.24 kg TNT charge at a standoff of
15.24 m.
Pitch angle
Peak due to Bubble collapse
Peak due to shock
Half section

Journal of Fluids and Structures, 2015
DOI: 10.1016/j.jfluidstructs.2015.01.012
25
Since the pitch angle of the propeller blade considered here varies in the radial direction,
the pressure loading due to the UNDEX also causes a twisting motion in addition to the bending
motion. To evaluate this motion, we compare in Fig. 28 the time variations of the pitch angle at
mid-section for the two blades. We can see from the figure, that contrary to the bending motion,
the anti-span wise fiber orientation results in a slightly smaller twisting motion than the span
wise orientation.
The above results show that fiber orientation plays an important role on the deformation
resistance of a composite propeller blade. This implies that by arranging appropriately the fibers
in different layers, we may be able to reduce both bending and twisting motions. To explore this
concept we consider next the effects of alternating the fiber orientations. Fig. 29 shows the
bending and twisting motions in the mid-section of the propeller blade for three different
combinations of fiber orientations noted in the order inner layer to outer layer. The three
configurations considered are: span-span-span, span-antispan-span, and antispan-antispan-
antispan. Fig. 29 shows that the blade with a span-antispan-span fiber arrangement results in a
maximum bending deformation of the same order as for the span-span-span fiber orientation.
Similarly, the maximum twisting deformation is of the same order as the antispan-antispan-
antispan arrangement. Therefore, while the all-span blade is good at resisting the bending motion
it is not as good at resisting the twisting motion. On the other hand, the all antispan blade is good
at resisting the twisting motion it is not good at resisting the bending motion. By alternating the
fiber direction in different layers, the blade is seen here to resist bending motion as well as all-
span blade and resist twisting motion as well as all-antispan blade. It therefore inherits the
advantages of both extreme cases.
Fig. 29. Comparison of the bending and twisting motions at blade mid-span among three
different fiber orientation propeller blades in response to a 27.24 kg TNT charge at a standoff
of 15.24 m.
Fig. 30 shows a comparison of the equivalent stresses at the blade mid-section for the
three above combinations of fiber orientation. The alternating fiber orientation blade (span-
antispan-span) is seen to experience the highest equivalent stresses. However, from the
comparison of the Tsai-Wu failure criterion parameter F, as shown in Fig. 31, all three cases
Half Section

Journal of Fluids and Structures, 2015
DOI: 10.1016/j.jfluidstructs.2015.01.012
26
have values of F very small compared to 1 and all of the same order. This implies that failure
will not occur for the composite propeller in response to the UNDEX charge and standoff distance
studied in this case.
Fig. 30. Comparison of the von Mises equivalent stresses at the blade mid-span among three
different fiber orientation propeller blades in response to a 27.24 kg TNT charge at a standoff
of 15.24 m.
Fig. 31. Comparison of the Tsai-Wu failure parameter at the blade mid-span among three
different fiber orientation propeller blades in response to a 27.24 kg TNT charge at a standoff
of 15.24 m, a) the initial stage, b) the whole bubble period.

Journal of Fluids and Structures, 2015
DOI: 10.1016/j.jfluidstructs.2015.01.012
27
6.2 Effects of Composite Material Characteristics To further understand the effects of the characteristics of the composite materials on their
behaviors in response to the UNDEX pressure loading, a comparative study is made with the
response of isotropic material blades with the same Young’s moduli as the various composite
material layers studied above. For illustration, we consider two isotropic blades with Youngs’
moduli, 87 GPa and 6.5 GPa, respectively, and compare the results with composite blades having
as material properties (Ea= 87 GPa, Eb=Ec=6.5GPa) and two different fiber orientations, all span
wise and all anti-span wise.
Fig. 32. Comparison of the bending motion at the blade mid-span among four different
propeller blades in response to a 27.24 kg TNT charge at a standoff of 15.24 m.
Fig. 33. Comparison of the von Mises equivalent stresses of an element at the blade mid-span
among four different propeller blades in response to a 27.24 kg TNT charge at a standoff of
15.24 m.
t(sec)
Eq
uv
ale
nt
Str
es
s(M
Pa
)
0.01 0.015 0.02 0.025
0
1
2
3
4
5
E=87
Ea=87,E
b=E
c=6.5&Span
Ea=87,E
b=E
c=6.5&Anti
E=6.5

Journal of Fluids and Structures, 2015
DOI: 10.1016/j.jfluidstructs.2015.01.012
28
Fig. 32 and Fig. 33 compare the displacement and equivalent stresses between the above
propeller blades for the initial shock phase only. In the figures, the legend ‘Ea=87, Eb=Ec=6.5 &
Span’ means that the fibers are in the span wise direction and the principal axis Young’s
modulus is 87 GPa while the modulus in the other directions is 6.5GPa. The isotropic propeller
blade with a Young’s modulus of 87 GPa, has the highest stress and the span wise orientation
composite propeller with Ea=87 GPa has a comparable behavior in terms of both stresses and
bending motion. The composite propeller blade with the fibers in the anti-span wise direction has
lower stresses, a higher bending motion, and an overall behavior similar to the isotropic propeller
blade with E=6.5GPa. This comparison shows that the resistance of a composite propeller blade
to the primary deformation (bending) is similar to an isotropic propeller blade which has the
same Young’s modulus as the principal axis value. In other word, an orthotropic material can
perform similar to an isotropic material when the fiber orientation is properly aligned to resist the
primary bending motion.
6.3 Effects of Material Arrangement in the Layers In this section we consider the effect of the materials arrangement in the layers on the
performance of the composite propeller blade. We consider three different combinations of
materials arrangement in the layers, keeping all fiber orientations in the span wise direction. For
this comparison we keep the outer layer as Carbon while changing materials for the middle layer
and inner core. The three different material arrangements are: Carbon-Carbon-Carbon, Carbon-
Kevlar-Glass and Carbon-Glass-Glass ordered from the outer layer to the inner layer.
Fig. 34. Comparison of the nodal displacement and pitch angle variations at mid-span and
mid-chord of the propeller blade a among three different material arrangement propeller
blades in response to a 27.24 kg TNT charge at a standoff of 15.24 m.
Fig. 34 shows the nodal displacements and pitch angle variations at the propeller blade
mid-section to illustrate the bending and twisting motion for the three material arrangements.
Obviously, the blade with Carbon in all three layers can resist both bending and twisting best.
However, it is worth noting that the performance of the blade does not significantly degrade if
we have only one thin outer layer made of carbon (0.8 cm) while the rest of the propeller
Journal of Fluids and Structures, 2015
DOI: 10.1016/j.jfluidstructs.2015.01.012
29
thickness is made of Glass, since all curves in Fig. 34 retain the same order of magnitude of
bending and pitching motion. This illustrates that the deformation of the composite propeller
blade is strongly controlled by the material properties used to make the outer shell.
7 CONCLUSIONS
In this study we have used a hybrid numerical approach combining in a time
decomposition approach a compressible and an incompressible flow solver to model the two
main phases of an UNDEX event (shock and bubble loading) and simulate the dynamics response
of a propeller blade subject to an UNDEX charge. The main results can be summed up as follows:
A NAB propeller blade has smaller bending and twisting motions and higher stresses than a
composite propeller exposed to the same UNDEX charge.
The fiber orientation of a composite propeller has significant effects on the structural
dynamics of the propeller blade. A span wise fiber orientation helps reduce the bending
motion while an anti-span fiber orientation helps reduce the twisting motion. By selecting
appropriately various fiber directions in different layers one is able to reduce both the
bending and the twisting motion of a propeller during an UNDEX event.
A composite propeller blade made of fiber material with a given Young’s modulus in the
principal direction has a similar behavior as an isotropic propeller blade with the same
Young’s modulus.
Deformations and stresses of a composite blade are strongly controlled by the material used
in the outer shell.
The performance of the propeller blade was evaluated based on the material dynamics
response in terms of bending and twisting motions, von Mises equivalent stresses and application
of Tsai-Wu failure criterion. Unlike for a pure material, where a well-defined yield strength can
be compared against the maximum equivalent stress to provide a good criterion for failure, for a
composite material the failure can involve fiber breakage, delamination, matric cracking, and
matrix crushing. Using the Tsai-Wu failure criterion accounting only for in-plane stresses, we
found that failure would occur near the root section of the composite propeller for the close-in
small explosion case considered (0.454 kg TNT detonated at 1 meter) but not for an UNDEX
charge of 27.24 kg TNT explosive at a standoff of 15.24 m.
8 ACKNOWLEDGMENT
This study was supported by the Office of Naval Research, Dr. Ki-Han Kim monitor, under
Contract N00014-08-C-0721. We are grateful for this support. We also thank Mr. Greg Harris,
Naval Surface Warfare Center, Indian Head Division for providing us access to the DYSMAS
code.
9 REFERENCES
Blake, J.R. & Gibson, D.C. 1987 Cavitation bubbles near boundaries. Ann. Rev. Fluid Mech.,
19, 99-124.
Brebbia, C. A., Telles, J. C. F., & Wrobel, L. C. 1984. Boundary Element Techniques, Springer
Berlin Heidelberg, 47-108.
Journal of Fluids and Structures, 2015
DOI: 10.1016/j.jfluidstructs.2015.01.012
30
Chahine, G.L. 1977. Interaction Between an Oscillating Bubble and a Free Surface, ASME
Journal of Fluids Engineering, 99, 709-716.
Chahine, G. L., Perdue, T. O. and Tucker, C. B., 1988. Interaction between an Underwater
Explosion Bubble and a Solid Submerged Structure. DYNAFLOW, INC., Technical Report
89001-1.
Chahine, G.L. and Perdue, T.O. 1989. Simulation of the Three-Dimensional Behavior of an
Unsteady Large Bubble near a Structure, 3rd International Colloquium on Drops and
Bubbles, Monterey, CA.
Chahine G. L., Duraiswami, R. and Kalumuck, K.M. 1996. Boundary element method for
calculating 2-D and 3-D underwater explosion bubble loading on nearby structures, Naval
Surface Warfare Center, Weapons Research and Technology Department, Report
NSWCDD/TR-93/46, .
Chahine, G. L., Kalumuck, K.M. 1998. BEM software for free surface flow simulation including
fluid structure interaction effects. International Journal of Computer Application in
Technology, 11(3/4/5), 177-198.
Chahine, G.L., Kalumuck, K.M., and Hsiao, C-T. 2003. Simulation of surface piercing body
coupled response to underwater bubble dynamics utilizing 3DYNAFS, a Three-dimensional
BEM code. Computational Mechanics, 32, 319-326.
Chahine, G.L, Kalumuck, K.M., Tanguay, M., Galambos, J.P., Rayleigh, M., Miller, R.D. and
Mairs, C. 2004. Development of a Non-Explosive Ship Shock Testing System-SBIR Phase I
Final Report, DYNAFLOW, INC. Report 2M3030-1 DTRC.
Chahine, G.L., Annassami, R., Hsiao, C.-T., and Harris, G.S. 2006. Scaling Rules for the
Prediction on UNDEX Bubble Re-entering Jet Parameters. SAVIAC Critical Technologies in
Shock and Vibration, Ed 4, 1-12.
Chahine, G.-L. 2014. Modeling of Cavitation Dynamics and Interaction with Material, Chapter
6, in Kim, K-H, Chahine, G.L., Franc, J-P., Karimi, A. (eds): Advanced Experimental and
Numerical Techniques for Cavitation Erosion Prediction. Fluid Mechanics and its
Applications, Vol. 160, pp. 123-173. (ed.) Springer, Berlin.
Cole, R. H. 1948. Underwater Explosions, Princeton Univ. Press, Princeton.
Colella, P. 1985. A direct Eulerian MUSCL scheme for gas dynamics. SIAM Journal on
Scientific and Statistical Computing, 6(1), 104-117.
Cruise T.A. and Rizzo F.J., 1968, A direct formulation and numerical solution of the general
transient elasto-dynamic problem, I, J. Math. Anal. Appl. 22 (1968), 244-259.
Farhat, C., Wang, K. G., Main, A., Kyriakides, S., Lee, L. H., Ravi-Chandar, K., & Belytschko,
T. 2013. Dynamic implosion of underwater cylindrical shells: Experiments and
Computations. International Journal of Solids and Structures, 50(19), 2943-2961.
Fleck, N and Deshpande, V. 2004. The resistance of clamped sandwich beams to shock loading.
Journal of applied mechanics, 71, 386.
Geers, T.L., Hunter, K. S. 2002. An integrated wave-effects model for an underwater explosion
bubble. Journal of the Acoustic Society of America, 111(4), 1582-1601.
Hallquist, J. O. 1998. LS-DYNA3D Theoretical Manual. Livermore, CA, LSTC.
Hsiao, C.-T. & Chahine, G.L. 2013. Development of compressible-incompressible link to
efficiently model bubble dynamics near floating body. Advances in Boundary Element &
Meshless Techniques XIV, 141-152.
Hsiao, C.-T., Jayaprakash, A., Kapahi, A., Choi, J.-K., and Chahine, G.L. 2014. Modeling of
Material Pitting from Cavitation Bubble Collapse. Journal of Fluid Mechanics, 755, 142-175.

Journal of Fluids and Structures, 2015
DOI: 10.1016/j.jfluidstructs.2015.01.012
31
Kalumuck, K.M., Duraiswami, R. and Chahine, G.L. 1995. Bubble dynamics fluid-structure
interaction simulation on coupling fluid BEM and structural FEM codes. Journal of Fluids
and Structures, 9, (8), 861-883.
Kim, J. H., & Shin, H. C. 2008. Application of the ALE technique for underwater explosion
analysis of a submarine liquefied oxygen tank. Ocean Engineering, 35(8), 812-822.
Jayaprakash, A., Hsiao, C.-T., and Chahine, G.L. 2012. Numerical and experimental study of the
interaction of a spark-generated bubble and a vertical wall. Journal of Fluids Engineering
134, 031301-12.
Lam, K. Y., Zong, Z., & Wang, Q. X. 2003. Dynamic response of a laminated pipeline on the
seabed subjected to underwater shock. Composites Part B: Engineering, 34(1), 59-66.
Lee, Y-J., Lin, C.-C., 2004. Optimized design of composite propeller. Mechanics of Advanced
Materials and Structures, 11(1), 17-30.
Liang, C. C., & Tai, Y. S. 2006. Shock responses of a surface ship subjected to noncontact
underwater explosions. Ocean Engineering, 33(5), 748-772.
Lin, G. 1991a. Comparative stress-deflection analyses of a thick shell composite propeller blade.
Technical Report, David Taylor Research Center, DTRC/SHD-1373-01.Lin, G. 1991b. Three
dimensional stress analyses of a fiber-reinforced composite thruster blade. Symposium on
Propellers Shafting, Society of Naval Architects and Marine Engineers, Virginia Beach,
Virginia.
Lin, H., Lin., J., 1996. Nonlinear hydroelastic behavior of propellers using a finite element
method and lifting surface theory. Journal of Marine Science and Technology, 1 (2), 114-
124.
McCoy R.W., Sun C.T. 1997. Fluid-structure interaction analysis of a thick section composite
cylinder subjected to underwater blast loading. Comput. Struct., 37, 45–55.
Motley, M., Liu, Z., Young, Y. 2009. Utilizing fluid-structure interactions to improve energy
efficiency of composite marine propellers in spatially varying wake. Composite Structures
90(3): 304-313.
Qiu, X., Deshpande, V. and Fleck, N. 2004. Dynamic response of a clamped circular sandwich
plate subject to shock loading. Journal of Applied Mechanics, 71, 387-645.
Rathbun, H., Radford, D., Xue, Z., He, M., Yang, J., Deshpande, V., Fleck, N., Hutchinson, J.,
Zok, F., Evans, A. 2006. Performance of metallic honeycomb-core sandwich beams under
shock loading. International journal of solids and structures 43(6), 1746-1763.
Shin, Y.S. 2004. Ship shock modeling and simulation for far-field underwater explosion.
Computers and Structures, 82, 2211-2219.
Sprague, M. A., & Geers, T. L. 2006. A spectral-element/finite-element analysis of a ship-like
structure subjected to an underwater explosion. Computer methods in applied mechanics and
engineering, 195(17), 2149-2167.
Taylor, G.I., 1963. The pressure and impulse of submarine explosion waves on plates. The
Scientific Papers of G.I. Taylor, Vol. 3, Cambridge University Press, Cambridge, 287-303.
Tsai, S. W. and Wu, E. M. 1971. A general theory of strength for anisotropic materials. Journal
of Composite Materials. 5, 58–80.
Wang, K., Grétarsson, J., Main, A., & Farhat, C. 2012. Computational algorithms for tracking
dynamic fluid–structure interfaces in embedded boundary methods. International Journal for
Numerical Methods in Fluids, 70(4), 515-535.
Wardlaw, A.B. Jr. & Luton, A.J. 2000. Fluid structure interaction for close-in explosion. Shock
and Vibration, 7, 265-275.
Journal of Fluids and Structures, 2015
DOI: 10.1016/j.jfluidstructs.2015.01.012
32
Wardlaw, A.B., Luton, J.A., Renzi, J.R., Kiddy, K.C. & McKeown, R.M. 2003. The Gemini
Euler solver for the coupled simulation of underwater explosions. Indian Head Technical
Report 2500.
Whirley, R.G. & Engelmann, B.E. 1993. DYNA3D: A nonlinear, explicit, three-dimensional
finite element code for solid and structural mechanics – user manual. Lawrence Livermore
National Laboratory, Report UCRL-MA-107254 Rev. 1.
Young, Y. 2008. Fluid-structure interaction analysis of flexible composite marine propellers.
Journal of Fluids and Structures 24(6): 799-818.
Zhang S., Duncan J. H. & Chahine G. L. 1993. The final stage of the collapse of a cavitation
bubble near a rigid wall. J. Fluid Mech., 257, 147-181.
Zong, Z., He, L., & Sun, L. Q. 2008. Numerical study of loading on the surface ship near an
underwater explosion bubble. Journal of Ship Mechanics, 12(5), 733-739.