dynamic load balancing based on constrained k-d tree ... · blocks during the run, ... as...
TRANSCRIPT
Dynamic Load Balancing Based on Constrained K-D Tree
Decomposition for Parallel Particle Tracing
Jiang Zhang, Hanqi Guo, Member, IEEE, Fan Hong, Xiaoru Yuan, Senior Member, IEEE,
and Tom Peterka, Member, IEEE
Abstract—We propose a dynamically load-balanced algorithm for parallel particle tracing, which periodically attempts to evenlyredistribute particles across processes based on k-d tree decomposition. Each process is assigned with (1) a statically partitioned,axis-aligned data block that partially overlaps with neighboring blocks in other processes and (2) a dynamically determined k-d treeleaf node that bounds the active particles for computation; the bounds of the k-d tree nodes are constrained by the geometries ofdata blocks. Given a certain degree of overlap between blocks, our method can balance the number of particles as much as possible.Compared with other load-balancing algorithms for parallel particle tracing, the proposed method does not require any preanalysis,does not use any heuristics based on flow features, does not make any assumptions about seed distribution, does not move any datablocks during the run, and does not need any master process for work redistribution. Based on a comprehensive performance studyup to 8K processes on a Blue Gene/Q system, the proposed algorithm outperforms baseline approaches in both load balance andscalability on various flow visualization and analysis problems.
Index Terms—Parallel particle tracing, dynamic load balancing, k-d trees, performance analysis.
1 INTRODUCTION
Distributed and parallel particle tracing, which computes the move-ments of many massless particles that are released in the flow field, isa fundamental technique in large-scale flow visualization and analy-sis. Applications include visualizing streamlines and pathlines, gener-ating streamsurfaces [9], computing finite-time Lyapunov exponents(FTLEs) and Lagrangian coherent structures (LCSs) [11], studyingteleconnections [17], and analyzing differences in numerical ensem-bles [13]. Parallel particle tracing enables these analyses to be run onclusters or supercomputers and to handle large-scale data generatedfrom computational fluid dynamics, combustion, climate, weather, andbiomedical simulations.
We focus on the load balance—a known hard problem and key toachieving scalability—in parallel particle tracing. The load-balancingproblem exists in both task-parallel and data-parallel particle tracingmethods, which are the two basic parallelism strategies. In the task-parallel methods, particles are statically distributed to parallel pro-cesses; each process has access to the whole data. Processes are un-balanced because of the early termination of some particles that travelout of the domain or hit critical points where the velocity is zero. Inthe data-parallel methods, the flow data are statically partitioned intoblocks and distributed to processes; particles exchange between pro-cesses to finish the tasks. Processes are unbalanced because someblocks may contain more complex features than others, such as vor-tices that trap particles locally.
In this paper, we propose a dynamically load-balanced algorithm forparallel particle tracing using k-d (short for k-dimensional) trees. Ourmotivation is based on the successful use of k-d trees to balance work-loads in N-body simulations [6], Delaunay tessellations [23], cluster-ing [10], and sort-first parallel rendering [21]. In these applications,k-d trees are used to evenly (re)distribute particles, data points, orpixels across parallel processes. As illustrated in a four-process run
• Jiang Zhang, Fan Hong, and Xiaoru Yuan are with Key Laboratory of
Machine Perception (Ministry of Education), School of EECS, Peking
University. E-mail: {jiang.zhang, fan.hong, xiaoru.yuan}@pku.edu.cn.
• Hanqi Guo and Tom Peterka are with the Mathematics and Computer
Science Division, Argonne National Laboratory, Lemont, IL 60439, USA.
E-mail: [email protected], [email protected].
Manuscript received xx xxx. 201x; accepted xx xxx. 201x. Date of Publication
xx xxx. 201x; date of current version xx xxx. 201x. For information on
obtaining reprints of this article, please send e-mail to: [email protected].
Digital Object Identifier: xx.xxxx/TVCG.201x.xxxxxxx
(Figure 1(a)), each process has a k-d tree leaf node, and particles areevenly distributed into different processes periodically. However, theredistribution requires full data duplication over all parallel processes,because processes may have particles that are located anywhere in thedata domain, making the algorithm not scale on supercomputers.
We overcame this problem by a novel redesign of k-d tree decompo-sition, namely, the constrained k-d tree, to redistribute particles in thedata-parallel particle tracing. In this design, each process is assignedwith (1) a statically partitioned, axis-aligned data block that partiallyoverlaps with neighboring blocks in other processes and (2) a dynam-ically determined k-d tree leaf node that bounds the active particlesfor computation. The bounds of k-d tree nodes are constrained by thegeometries of the data blocks. In static data partitioning, we initiallysubdivide the domain into n non-overlapping, equal-sized, and axis-aligned blocks, where n equals the number of processes. We then ex-pand the blocks to overlap with other blocks as much as possible, giventhe memory limit of the process. The expanded parts, called ghost lay-ers, essentially maximize the overlaps between blocks under the mem-ory limit and thus enable the k-d tree decomposition with constraints.During run time, we periodically redistribute particles based on theconstrained k-d tree decomposition to balance the workload. The split-ting planes in the k-d tree decomposition are limited to the overlappedregions of the ghost layers. Thus the decomposition ensures that the re-distributed particles are inside the bounds of the corresponding blocks,as shown in Figure 1(b). In the extreme case that each process canfit the whole data, our algorithm can evenly redistribute the particlesbecause there are no constraints.
The proposed method can improve load balancing in both full- andlocal-range flow visualization and analysis techniques for steady andunsteady flows. Full-range analyses such as FTLE computation needto trace densely-seeded particles over the whole domain, while local-range analyses such as source-destination queries place seeds only lo-cally in the domain. The constrained k-d tree can be used for bothstatic and time-varying flows in both 2D and 3D meshes.
We evaluate our method with various flow visualization and anal-ysis tasks on Vesta, a Blue Gene/Q supercomputer at Argonne Na-tional Laboratory. We show the performance benchmarks with up to8K parallel processes. Compared with the baseline data-parallel parti-cle tracing method, our constrained k-d tree approach significantly im-proves the performance in both load balancing and scalability. Com-pared with other load-balancing algorithms for parallel particle trac-ing, the proposed method does not require any preanalysis, does notuse any heuristics based on flow features, does not make any assump-

Initial distribution Redistribution Redistribution Redistribution
Initial distribution Redistribution Redistribution Redistribution
(a) General k-d tree decomposition
(b) Our constrained k-d tree decomposition
Fig. 1. Example of particle redistribution during parallel particle tracing through the general k-d tree decomposition and our constrained k-d treedecomposition, respectively. In (a) and (b), the solid lines split the particles as balanced as possible. In (b), the dashed lines show the overlappedregions of ghost layers that limit the splitting lines.
tions about initial particle distribution, does not move any data blocksduring the run, and does not need any master process for work redistri-bution.
In summary, the contributions of this paper are twofold:
• A dynamically load-balanced parallel particle tracing algorithmbased on the redesigned k-d tree decomposition that is con-strained by static data partitions;
• A comprehensive performance study of our algorithm with dif-ferent datasets on a Blue Gene/Q system.
In Section 2 we briefly introduce the background of this work. InSection 3, we give an overview of our method. The initialization andrun-time load-balanced parallel particle tracing are described in Sec-tion 4 and Section 5, respectively. A detailed performance analysis isgiven in Section 6 to demonstrate the effectiveness of our method, fol-lowed by discussion in Section 7. In Section 8, we conclude our paperand discuss future work.
2 RELATED WORK
In this section, we review related work on load balancing in parallelparticle tracing and on load-balancing algorithms based on k-d trees.We also review advection-based flow visualization and analysis appli-cations.
2.1 Load Balancing in Parallel Particle Tracing
Load-balanced parallel particle tracing in large-scale flow data is dif-ficult because of the varying computation and communication work-loads in both task- and data-parallel methods.
In task-parallel methods, particles are statically distributed to pro-cesses. The workload among the processes is unbalanced because theparticles have different trajectories. Work stealing and work request-ing [8, 24] can be used to redistribute tasks among processes. Thesemethods, however, require a central master process for scheduling,which becomes a bottleneck to scale up. Moreover, task-parallel meth-ods usually have higher I/O cost than data-parallel methods have, be-cause processes need to load data out of core when the data is largerthan the memory in each process. Our method is instead based on data-parallel methods. Compared with the task-parallel load-balancingmethods [8, 24], our method has much lower I/O overhead, and wedo not need any master processes to redistribute tasks.
In data-parallel methods, the input data is partitioned and dis-tributed to processes statically; particles are exchanged between pro-cesses to finish the tasks. Both static and dynamic load-balancing al-gorithms are proposed for data-parallel particle tracing. Static load-balancing algorithms usually require data preprocessing and flow fea-ture analysis. Nouanesengsy et al. [26] proposed a method to constructflow graphs that characterizes both workload and flow directions of thedata in preprocessing and then statically distributes the data blocksbased on the optimized partitioning of flow graphs. Chen and Fu-jishiro [7] instead partitioned the flow data in irregular shapes based onflow feature extraction. The irregular partitions can also be achievedby hierarchical clustering [34]. Dynamic load-balancing algorithmsredistribute and move data blocks periodically during the run. The ma-jor costs are twofold: from the scheduling algorithm that decides howblocks should be redistributed and from the data movement. For exam-ple, Peterka et al. [28] used a recursive coordinate bisection to repar-tition the distribution of data blocks. The repartitioning is performedperiodically, and data blocks are moved on the fly. Lu et al. [19] pro-posed a work-stealing approach to achieve dynamic load balancing instreamsurface generation. Data blocks are moved to the processes thathave lower workload.
To improve scalability, researchers have proposed hybrid methodsthat combine task and data parallelism, but the load-balancing issuesare not well studied in these methods. For example, Kendall et al. [17]proposed the DStep framework that schedules tasks in a multitieredmanner based on static data partitioning. DStep has also been extendedto visualize ensemble differences by pathline advection analysis [13]and to analyze multivariate unsteady flow data with Lagrangian-basedattribute space projection [12]. Zhang et al. [36] also modified theDStep framework to generate high-order access dependencies in adata-preprocessing stage.
We regard our load-balanced particle tracing algorithm as a hybridmethod that distributes data blocks statically and redistributes particlesdynamically. Comprehensive comparisons with previous methods arediscussed in Section 7.
2.2 Load Balancing Based on K-D Trees
A comprehensive review of load balancing for distributed and parallelcomputing in general is out of the scope of this paper. We insteadfocus on load-balancing algorithms that are based on k-d trees.
The k-d tree, which was invented by Bentley [4], is a data struc-

Block expansion with
data overlapping
Collective particle
redistribution
Initial data domain
partitioning
Independent
particle tracing
Flow data
(steady/unsteady)
Load-Balanced ComputationInitialization
Fig. 2. Workflow of our load-balanced parallel particle tracing method. The raw flow data is first partitioned into blocks in the initialization stage.These blocks are further expanded by adding ghost layers on them to maximize the overlap with other blocks as much as possible. In thecomputation stage, collective particle redistribution and independent particle tracing are alternately executed to achieve load balance dynamically.
ture that splits k-dimensional data for efficient range queries and k-neighbor queries. The k-d tree data structure is essentially a balancedbinary tree; each leaf node of the tree is a subdomain of its parent.
K-d trees have been used in load balancing of various applica-tions in computational sciences, database, data analysis, and visual-ization. In computational sciences, k-d trees are used to build hierar-chies of particles in order to improve scalability in large N-body cos-mology simulations [3, 6] and molecular dynamics simulations [31].In database applications, k-d trees can be used for fast query of im-ages [1]. In data analysis, k-d trees are widely used in distributed andparallel clustering algorithms, such as k-means [10] and the DBSCANalgorithm [27]. In visualization, the community has been extensivelyusing k-d trees to address various load-balancing problems. For ex-ample, Morozov and Peterka [23] proposed a load-balanced Delaunaytessellation algorithm. Input points are partitioned with k-d trees anddistributed to different processes for load-balanced computation. Thepositions of these points are statically fixed when performing the com-putation of Delaunay tessellation. In sort-first volume rendering, k-dtrees are used to split the image space to balance the parallel render-ing costs [21]. Bounding volume hierarchies [33] or particle distribu-tion schemes based on z-ordering [30] that are similar to k-d trees arealso used in parallel volume rendering. The path of each ray in thesevolume-rendering methods is determined by its initial position. Onthe contrary, in particle tracing, the positions of the particles alwayschange over time, making it difficult to achieve load balance statically.Our method addresses this problem by dynamically performing k-dtree decomposition during run time to redistribute particles.
The implementation of k-d trees must be efficient and scalablefor distributed applications. Serial k-d tree implementations includenanoflann
1, but they are not able to scale in parallel. The previousversion of our work [37] used nanoflann to implement k-d tree de-composition. Zhang et al. [35] proposed the first scheme to distributek-d trees in peer-to-peer systems. Morozov and Peterka [23] furtherimproved the algorithm to scale k-d tree decomposition for efficientDelaunay tessellation.
In our study, we redesigned the parallel tree construction algorithmfor constrained k-d trees. We further use the constrained k-d treesto balance the number of particles in parallel processes in order toachieve dynamic load balancing.
2.3 Advection-Based Flow Visualization and Analysis
We review advection-based flow visualization and analysis applica-tions that can benefit from scalable and parallel particle tracing.Advection-based flow visualization and analysis methods includetexture-based [18], geometry-based [20], and part of feature extractionand tracking techniques [29]. Based on the distribution of particle seedlocations, we subdivide the techniques into two categories: full-rangeanalysis and local-range analysis.
In local-range analyses, particles are seeded in sparse and local re-gions in order to understand part of the data. For example, seeds of astreamsurface are usually distributed on a line or curve in 3D flows [9].A source-destination query [17] needs to seed particles only in a localregion, instead of the whole domain.
In full-range analyses, particle are seeded densely in the entire datadomain in order to analyze and visualize comprehensive features in
1https://github.com/jlblancoc/nanoflann
the flow. For example, in texture-based visualization, line integral con-volution (LIC) [5] and unsteady flow LIC (UFLIC) [32] need to com-pute streamlines and pathlines, respectively, from all locations. Al-though methods have been proposed to reduce the computational costof tracing densely-seeded particles, such as partial path reuse [15] andadaptive refinement [2], comprehensive analysis of the computationof FTLEs and LCSs [14] still needs scalable and parallel tracing ofdensely-seeded particles [25].
Our study can be used to improve load balancing in both full- andlocal-range analyses. Our method is also compatible with both staticand time-varying flows. More details and evaluations are in the follow-ing sections.
3 OVERVIEW
As described in Algorithm 1 and illustrated in Figure 2, the pipeline ofour method consists of a initialization stage and a computation stage.
The initialization stage has several steps. We first partition the inputdata into non-overlapping, equal-sized, axis-aligned blocks and thenexpand the ghost layers of each block up to the memory limit of eachprocess. The blocks are loaded into memory, and the particles areinitialized in the corresponding blocks. More details are explained inSection 4.
The computation stage is an iterative process that alternately exe-cutes the particle redistribution and particle tracing. In the particleredistribution phase, the parallel processes collectively exchange un-finished particles based on the constrained k-d tree decomposition. Inthe particle tracing phase, each parallel process independently tracesits unfinished particles without communication. More details are givenin Section 5.
Algorithm 1 Main function of each parallel process in our method,where comm is the communicator, and local block and local particlesare the block and particles that are distributed to the process, respec-tively.
initialize(comm, local block, local particles) ⊲ Section 4while !all done do
redistribute particles(comm, local particles) ⊲ Section 5.1trace particles(local block, local particles) ⊲ Section 5.2
end while
4 ALGORITHM INITIALIZATION
We initialize data blocks and particles for the dynamically load-balanced parallel particle tracing.
Domain partitioning We partition the input data by iterativelysplitting the domain in each dimension; the order of dimensions isconsistent with that of k-d tree decomposition. Without loss of gener-ality, we assume the number of processes n is a power of 2; otherwisewe can subdivide each dimension based on the prime factorization ofthe number. For example, in 3D data we evenly subdivide the domainalong the x-axis into two blocks and then further evenly split eachblock along the y and z axes. After the z-axis, the next dimension tosubdivide is the x-axis. The iteration stops when the number of blocksequals n. Each process then owns single block. The outputs of thedomain partitioning are n non-overlapping, equal-sized, axis-aligneddata blocks.

(a) (b)
(c) (d)
Block 1Block 2
Block 3
Block 4
Ghost layer Ghost layer
Ghost layerGhost layer
Fig. 3. Illustration of four expanded blocks in 3D.
Overlapped regions
Non-overlapped regions
Splitting plane
Splitting plane
Splitting plane
Fig. 4. Illustration of constrained k-d tree decomposition in 3D. Thesplitting planes are constrained in the overlapped regions of ghost layers.
Block expansion We maximize the overlaps between blocks byadding ghost layers on these blocks. As shown in Figure 3, each blockis expanded in all dimensions so that the block overlaps with its neigh-bor blocks. The block expansion enables the k-d tree to split the do-main in the overlapped regions, as explained in the next section. Thethickness of the block is bounded by the available memory in the pro-cess. In the extreme case when the memory is large enough to fit thewhole dataset, each process keeps a complete copy of the data.
Block I/O We load the expanded data blocks in parallel. The par-allel I/O is handled by the block I/O layer (BIL) [16], which essentiallyuses parallel I/O to load expanded data blocks in a scalable manner.
Particle initialization We load input particles and distribute theminto different processes. Each particle is assigned to the block whose“core” region excluding ghost layers contains the particle.
5 LOAD-BALANCED PARALLEL PARTICLE TRACING
The computation stage (the loop in Algorithm 1) of our algorithm alter-nates the collective particle redistribution and the serial particle tracingfor dynamic load balancing.
5.1 Particle Redistribution Based on Constrained K-dTrees
Constrained k-d tree construction is illustrated in Figures 4 and 5. Thealgorithm cycles through each dimension to split the data domain. Foreach dimension, the algorithm attempts to find an axis-aligned medianplane that can split particles evenly. If the plane is not in the over-lapped regions between the two neighbor blocks, we use the boundaryof either block that can balance the number of particles. As shown inthe 2D example in Figure 5, if the coordinate of the plane is greaterthan the upper bound of the red block in x direction, we split the di-mension with the right boundary of the red block; if the coordinate ofthe plane is less than the lower bound of the blue block in x direction,we split the dimension with the left boundary of the blue block; other-wise we choose the median plane in the overlapped region of the twoblocks. The rule is similar in 3D, as illustrated in Figure 4.
We redesign the distributed k-d tree decomposition [23] to constrainthe splitting planes, as detailed in Algorithm 2. Each iteration has twokey parts: median selection and particle exchange. Initially, we groupall processes in a group. In the first iteration, each process computes alocal histogram of its particles and sends it to a designated root processwithin the group for gathering. The root process then picks up a me-dian plane that is constrained in the overlapped regions, as describedabove, and broadcasts it to all other processes within the group. Theselected median value splits all the particles into two parts, trying tomake each part have particles as even as possible under the geometryconstraints. For particle exchange, the processes are divided into twosubgroups. Each process from one subgroup chooses a partner fromthe other subgroup to exchange particles, so that half the processesreceive the particles whose projection onto the first coordinate is lessthan the picked median value, while the other half receives particleswhose projection is more than the value. Given n processes, the al-gorithm will repeat in each process subgroup by cycling through thecoordinates for splitting until log2 n iterations are executed.
The constrained k-d tree decomposition splits the particles as evenlyas possible while also ensuring that the particles are bounded in thedata block of the corresponding process. A thicker ghost layer leads tomore even decomposition of the number of particles and better work-load balance.
5.2 Particle Tracing within Processes
We trace particles inside the local block of each process independentlywithout communication, as shown in Algorithm 3. After tracing, eachparticle is either finished or unfinished. A particle is marked as fin-ished if it goes out of the data domain, hits a critical point where thevelocity is zero, or reaches the maximum integral steps required by thevisualization and analysis algorithm; otherwise the particle is markedas unfinished. Unfinished particles will be redistributed in the nextcycle, as detailed in the preceding subsection.
We limit the maximal number of integration steps (Nmax) that a par-ticle can be traced in the cycles. This is an important parameter in ourmethod because it indirectly defines the frequency of particle redistri-bution. If the redistribution is performed too frequently, the workloadcan be more balanced, but the redistribution cost will increase. On thecontrary, if the redistribution is performed infrequently, our methodcannot sufficiently balance the workloads. More discussion and evalu-ation on Nmax are in Sections 6 and 7, respectively.
6 PERFORMANCE ANALYSIS
We conducted a comprehensive performance study with three applica-tions: tracing densely-seeded streamlines in thermal hydraulics simu-lation (Nek5000) data, querying source-destinations in GEOS-5 simu-lation data, and computing FTLE of Hurricane Isabel data. The spec-ifications of the data are detailed in Table 1 and the following subsec-tions.
The implementation of our method is based on C++11. We use theDIY2 library [22], which wraps MPI for interprocess communication,to decompose the domain and exchange messages between processes.We also use the BIL library [16] to efficiently read disjoint data blocksfrom different NetCDF files collectively.

Original domain Initial partitioning Adding ghost layers
Splitting line Splitting line Splitting lineOverlapped region
Fig. 5. 2D example to show constrained k-d tree decomposition with data overlapping between blocks. The splitting line is limited in the overlappedregion of ghost layers.
Table 1. Datasets and analyses for the performance study.
Dataset Resolution Size Analysis Seeding Benchmark Alternating Conditions
Nek5000 10243 12 GB Streamlines Full-range Strong/weak scaling MGEOS-5 288×181×72×24 1.34 GB Source-destination Local-range Strong scaling M, Nmax
Isabel 500×500×100×48 13.4 GB FTLE Full-range Strong scaling M, k
Execution Time
communication
particle tracingI/O
12
4
6
8Max/Average Workload10
0 245.8s 485.3s
our methodbaseline method
Streamline Rendering
Fig. 6. Performance of 64 processes tested by downsampled Nek5000 data. We record the time for I/O, particle tracing computation, andcommunication in the Gantt charts and the load balance indicator in the line chart. Top: Gantt chart using the baseline method. Each row in theGantt chart represents a process. Middle: Line chart showing the evolution of workload balance. The dashed line represents the baseline method,while the solid line represents the k-d tree method. Bottom left: Gantt chart using our k-d tree method. The time axises of the two Gantt chartsand the line chart are aligned. Bottom right: Rendering result of the Nek5000 data with 2,000 streamlines. The color encodes the integration stepsduring the streamline generation.
The benchmark platform is Vesta, an IBM Blue Gene/Q system atArgonne National Laboratory. Vesta has 2,048 compute nodes: eachhas a 16-core 1.6 GHz PowerPC A2 processor and 16 GB of DDR3RAM. The interconnection between compute nodes is a 5D torus net-work. The storage of Vesta is GPFS (IBM General Parallel File Sys-tem). In our test, we execute 8 processes per compute node, and we
use up to 8,192 processes. We study the performance of our methodwith the following benchmarks.
• Load balancing We use the maximal workload divided by theaverage workload as the load-balancing indicator. The workloadin each process is evaluated as the number of numerical integral
512 1K 2K 4K 8K0
500
1,000
1,500
2,000
2,500
512 1K 2K 4K 8K0%
20%
40%
60%
80%
100%
512 1K 2K 4K 8K0
200
400
600
800
1,000
1,200
1,400
512 1K 2K 4K 8K0%
20%
40%
60%
80%
100%
Pe
rce
nta
ge
Performance Breakdown (Nek5000, Strong Scaling) Percentage Breakdown (Nek5000, Strong Scaling)
Performance Breakdown (Nek5000, Weak Scaling) Percentage Breakdown (Nek5000, Weak Scaling)
(a) (b)
(c)P
erc
en
tag
e(d)
Tim
e (
seco
nd
s)T
ime
(se
con
ds)
# Processes # Processes
# Processes # Processes
communicationparticle tracingI/O
communicationparticle tracingI/O
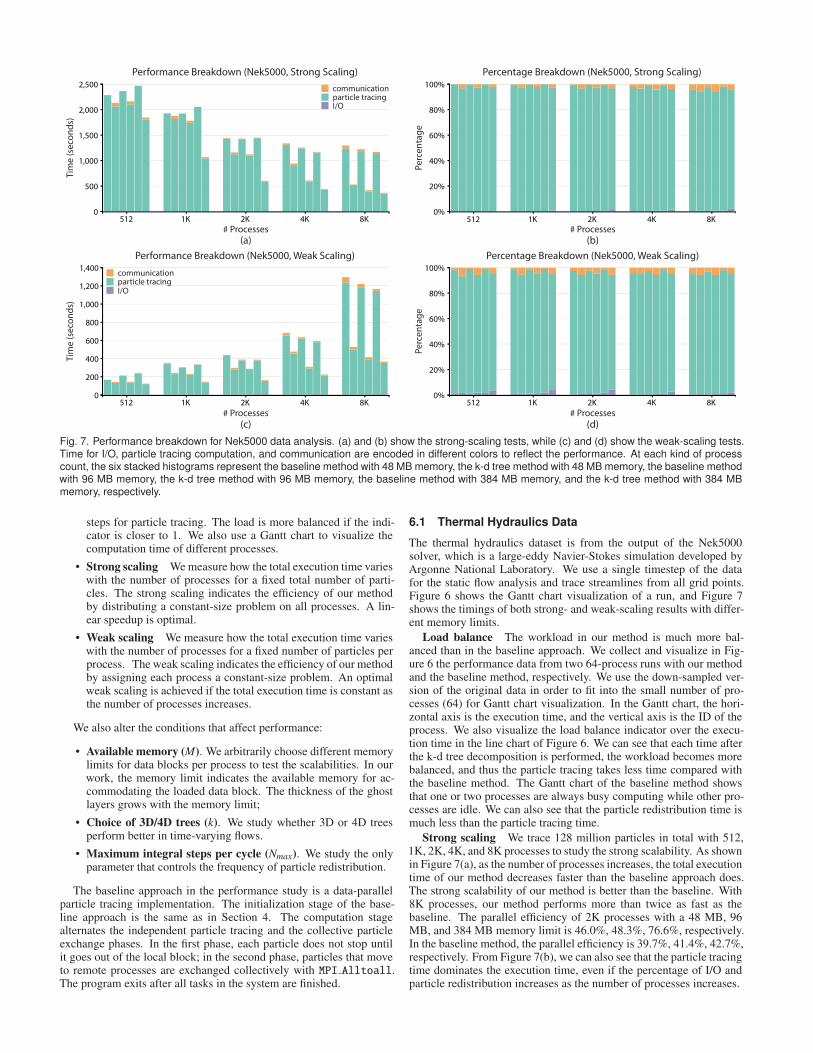
Fig. 7. Performance breakdown for Nek5000 data analysis. (a) and (b) show the strong-scaling tests, while (c) and (d) show the weak-scaling tests.Time for I/O, particle tracing computation, and communication are encoded in different colors to reflect the performance. At each kind of processcount, the six stacked histograms represent the baseline method with 48 MB memory, the k-d tree method with 48 MB memory, the baseline methodwith 96 MB memory, the k-d tree method with 96 MB memory, the baseline method with 384 MB memory, and the k-d tree method with 384 MBmemory, respectively.
steps for particle tracing. The load is more balanced if the indi-cator is closer to 1. We also use a Gantt chart to visualize thecomputation time of different processes.
• Strong scaling We measure how the total execution time varieswith the number of processes for a fixed total number of parti-cles. The strong scaling indicates the efficiency of our methodby distributing a constant-size problem on all processes. A lin-ear speedup is optimal.
• Weak scaling We measure how the total execution time varieswith the number of processes for a fixed number of particles perprocess. The weak scaling indicates the efficiency of our methodby assigning each process a constant-size problem. An optimalweak scaling is achieved if the total execution time is constant asthe number of processes increases.
We also alter the conditions that affect performance:
• Available memory (M). We arbitrarily choose different memorylimits for data blocks per process to test the scalabilities. In ourwork, the memory limit indicates the available memory for ac-commodating the loaded data block. The thickness of the ghostlayers grows with the memory limit;
• Choice of 3D/4D trees (k). We study whether 3D or 4D treesperform better in time-varying flows.
• Maximum integral steps per cycle (Nmax). We study the onlyparameter that controls the frequency of particle redistribution.
The baseline approach in the performance study is a data-parallelparticle tracing implementation. The initialization stage of the base-line approach is the same as in Section 4. The computation stagealternates the independent particle tracing and the collective particleexchange phases. In the first phase, each particle does not stop untilit goes out of the local block; in the second phase, particles that moveto remote processes are exchanged collectively with MPI Alltoall.The program exits after all tasks in the system are finished.
6.1 Thermal Hydraulics Data
The thermal hydraulics dataset is from the output of the Nek5000solver, which is a large-eddy Navier-Stokes simulation developed byArgonne National Laboratory. We use a single timestep of the datafor the static flow analysis and trace streamlines from all grid points.Figure 6 shows the Gantt chart visualization of a run, and Figure 7shows the timings of both strong- and weak-scaling results with differ-ent memory limits.
Load balance The workload in our method is much more bal-anced than in the baseline approach. We collect and visualize in Fig-ure 6 the performance data from two 64-process runs with our methodand the baseline method, respectively. We use the down-sampled ver-sion of the original data in order to fit into the small number of pro-cesses (64) for Gantt chart visualization. In the Gantt chart, the hori-zontal axis is the execution time, and the vertical axis is the ID of theprocess. We also visualize the load balance indicator over the execu-tion time in the line chart of Figure 6. We can see that each time afterthe k-d tree decomposition is performed, the workload becomes morebalanced, and thus the particle tracing takes less time compared withthe baseline method. The Gantt chart of the baseline method showsthat one or two processes are always busy computing while other pro-cesses are idle. We can also see that the particle redistribution time ismuch less than the particle tracing time.
Strong scaling We trace 128 million particles in total with 512,1K, 2K, 4K, and 8K processes to study the strong scalability. As shownin Figure 7(a), as the number of processes increases, the total executiontime of our method decreases faster than the baseline approach does.The strong scalability of our method is better than the baseline. With8K processes, our method performs more than twice as fast as thebaseline. The parallel efficiency of 2K processes with a 48 MB, 96MB, and 384 MB memory limit is 46.0%, 48.3%, 76.6%, respectively.In the baseline method, the parallel efficiency is 39.7%, 41.4%, 42.7%,respectively. From Figure 7(b), we can also see that the particle tracingtime dominates the execution time, even if the percentage of I/O andparticle redistribution increases as the number of processes increases.

Algorithm 2 redistribute particles(comm, local particles)
dim← 0rank← comm.rankdomain← data.domain ⊲ domain of the input flow datagroup←{0,1, . . . ,n−1} ⊲ n is the number of processesNr← log2n ⊲ number of iterationsfor i < Nr do
root← group[0] ⊲ rank of the root process in the grouplocal histogram← compute local histogram(local particles)global histogram← comm.gather(group, root, local histogram)
⊲ gather to the rootif rank = root then
range← compute overlapped region(domain, dim) ⊲
overlapped region of ghost layersmedian ← compute bounded median(global histogram,
range, dim)end ifmedian← comm.broadcast(group, root, median) ⊲ broadcast
from the rootpartner← root + (rank + group.size/2) mod group.size ⊲ rank
of the partner process in the groupparticles low← {p ∈ local particles | p[dim] < median}particles up← {p ∈ local particles | p[dim] > median}comm.sendrecv(rank, partner, particles low, particles up) ⊲
swap particlesif rank < group.size/2 then ⊲ bisect the group
local particles← particles lowgroup← {x ∈ group | x < group.size/2}
elselocal particles← particles upgroup← {x ∈ group | x > group.size/2}
end ifdomain← bisect domain(domain, median, dim)dim← (dim + 1) mod k ⊲ k is the dimensionality of k-d treei← i+1
end for
Algorithm 3 trace particles(local block, local particles)
for each particle p in local particles doN← 0while N 6 Nmax do
p← RK4(local block, p) ⊲ one single step of fourth-orderRunge-Kutta numerical integration
N← N +1if check finish(p) then ⊲ check if the particle goes out of
the domain or hits a critical pointlocal particles.remove(p)finish particle(p)
else if !local block.contains(p) then ⊲ check if the particlegoes out of the local block
breakend if
end whileend for
(b)(a)
Fig. 8. (a) Source-destination query on GEOS-5 data. 300 pathlines areshown in this visualization. (b) FTLE field of Isabel data at time steps 0within a finite time scope 12.
Weak scaling We trace 16K particles per process with 512, 1K,2K, and 8K processes in this test. As the number of processes in-creases, the execution time of the baseline approach increases muchfaster than that of our method does, as shown in Figure 7(c). In otherwords, the weak scalability of our method is also better than that ofthe baseline. The parallel efficiency of 2K processes with a 48 MB,96 MB, and 384 MB memory limit in our method is 47.8%, 50.2%,77.1%, respectively. In the baseline method, the corresponding paral-lel efficiency is 40.3%, 41.9%, 43.6%, respectively.
From all tests in Figure 7, we can see that our method performs bet-ter with larger memory limits. Although larger memory limits lead tothicker ghost layers and eventually result in higher I/O costs, I/O takesless than 10% of the total execution time in all cases. Larger mem-ory limits improve both strong and weak scalabilities, because thickerghost layers weaken the constraints in our k-d tree decomposition, al-lowing the particles to be redistributed more evenly.
6.2 GEOS-5 Simulation Data
The GEOS-5 data is from the simulation output of an atmosphericmodel developed by the NASA Goddard Space Flight Center. Thespatial resolution of the model is a 1°× 1.25° latitude-longitude gridwith 72 vertical pressure levels that ranges from 1 atm (near the terrainsurface) to 0.01 hPa (about 80 km). The dataset in our experiment con-sists of the monthly averaged output from January 2000 to December2001.
We conduct a source-destination query analysis with 8M particlesin the GEOS-5 data. The query results are shown in Figure 8(a). Inthis experiment, seeds are densely placed in North America, and wevisualize the distribution of the particle trajectories over time.
Strong scaling The first row of Figure 9 shows the strong-scalingtests of this case. The optimal scaling curves in this figure show thelinear speedup for reference. Figure 9(a) shows that our method scalesas the number of processes increases, whereas the scalability of thebaseline method is poor. With 8K processes, our method is 3.58 timesfaster than the baseline method. Figure 9(c) shows the overall levelof load balance in the run-time particle tracing. In our method, theload balance indicator slowly increases as the number of processesincreases. It is consistent with the time cost of the constrained k-dtree decomposition, as shown in Figure 9(b). We can also see that thecurves that represent our k-d tree method are lower and more stablethan those as the baseline method. These results demonstrate that com-pared with the baseline approach, our method has better load balanceand scalability.
Parameter Nmax We compare the timings and load balance usingdifferent maximal number of steps in each cycle of tracing (Nmax). Toevaluate the effect of the execution frequency of the constrained k-dtree decomposition, we use 64 MB memory limit for this test. In thesecond row of Figure 9, as Nmax increases, the total running time de-creases continually, and the workload becomes more balanced in mostcases, except when Nmax is 10. Although frequently performing theconstrained k-d tree decomposition can achieve more balanced work-load, it also brings larger overhead. In this case, the optimal Nmax is20. More discussion of Nmax is in the next section.

Total Time (GEOS-5)
#Processes
8K4K2K1K512
100
10
Tim
e (
seco
nd
s)
500
k-d tree, 64MB
k-d tree, 16MB
k-d tree, 8MB
baseline, 64MB
baseline, 16MB
baseline, 8MB
optimal scaling
(a)
K-D Tree Decomposition Time (GEOS-5)
#Processes
8K4K2K1K512
10
1
Tim
e (
seco
nd
s)
50
k-d tree, 64MB
k-d tree, 16MB
k-d tree, 8MB
(b)
Load Balance (GEOS-5)
#Processes
8K4K2K1K512
40
30
20
10
Ma
x/A
ve
rag
e W
ork
loa
d
1
50
k-d tree, 64MB
k-d tree, 16MB
k-d tree, 8MB
baseline, 64MB
baseline, 16MB
baseline, 8MB
optimal scaling
(c)
Total Time (GEOS-5)
#Processes
8K4K2K1K512
100
10
Tim
e (
seco
nd
s)
200
Nmax
= 60
Nmax
= 40
Nmax
= 20
Nmax
= 10
optimal scaling
(d)
K-D Tree Decomposition Time (GEOS-5)
#Processes
8K4K2K1K512
10
1
Tim
e (
seco
nd
s)
50
Nmax
= 60
Nmax
= 40
Nmax
= 20
Nmax
= 10
(e)
Load Balance (GEOS-5)
#Processes
8K4K2K1K512
9
8
7
6
5
4
3
2
1
Ma
x/A
vera
ge
Wo
rklo
ad
10
Nmax
= 60
Nmax
= 40
Nmax
= 20
Nmax
= 10
(f )
99.3
120.9
143.1
25.727.6
30.4
30.8
11.6
8.26.8
6.3
20.2
14.2
13.3
4.8
3.0
3.2
4.0
8.5
6.9
5.4
4.8
233.6229.1
227.4
186.5
153.2
99.3
143.4141.8
117.8
48.7
37.5
25.7
12.2
11.1
8.1
24.2
21.9
14.2
12.9
8.1
5.4
42.7
41.7
37.7
8.38.5
6.2
5.13.2
Fig. 9. Strong-scaling tests using GEOS-5 data with different number of processes. Panels (a), (b), and (c) show the tests with different memorylimits. The maximal number of tracing steps, Nmax, is set to 20 in panels (a), (b), and (c). Panels (d), (e), and (f) show the tests with different Nmax
under 64 MB memory limit.
6.3 Hurricane Isabel Data
The Isabel dataset is from an atmospheric simulation conducted bythe National Center for Atmospheric Research. The resolution of thismesh is 500× 500× 100, and the dataset has 48 time steps. We com-pute the FTLE field (shown in Figure 8(b)) based on the wind (U, V,and W components) by tracing 24 million particles that are uniformlyseeded in the domain. The optimal Nmax in this experiment is 50.
Strong scaling We also make strong-scaling tests of this case. Asshown in the first row of Figure 10, our method improves the perfor-mance and load balance. In this case, we extract the computation timeof particle tracing from the total running time in Figure 10(b). Thecomputation is 2.1 times faster compared with the baseline method us-ing 8K processes. From these results we can also see that the largermemory limit leads to higher I/O cost because the expanded blocksare larger, but our method scales better with larger memory limit ingeneral.
Choice of 3D/4D trees We test whether 3D or 4D tree can achievebetter load balance with our method. The results are shown in the sec-ond row of Figure 10. In general, we can see from Figure 10(e) that theperformance is better if we consider only the space dimensions in thisexperiment. As shown in Figure 10(f), we conclude that the workloadof using 4D trees is less balanced than using 3D trees, because the timeof spatiotemporal particles always increases and leads to imbalance inthe time dimension.
7 DISCUSSION
In this section, we first discuss the advantages of our method comparedwith other load-balancing methods. We then discuss the limitations ofour method.
7.1 Comparison with Other Methods
We compare our method with other load-balancing algorithms for par-allel particle tracing in different aspects, which are detailed in Table 2and below.
Data preprocessing Our method does not require any data pre-processing. In previous studies, such as flow graph-based workload
estimation [26] and irregular data partitioning [7, 34], the whole in-put dataset needed to be processed and analyzed in a pilot run beforethe actual particle tracing runs. As the data scale continues to growin present and future computing, however, it becomes prohibitive toperform the preprocessing because of high I/O costs.
Feature analysis Our method does not rely on any flow featureanalysis. Flow partitioning [7] and clustering [34] can be expensiveand sensitive to parameter selection. It is still an open challenge towell define features in fluid flows, especially time-varying datasets. Itis even harder to detect features in distributed environments with scala-bility. In contrast, our constrained k-d tree method is light-weight andscalable.
Seed distribution We make no assumptions about the initial par-ticle distribution. Most load-balancing algorithms in data-parallel par-ticle tracing [7, 26, 34] are designed for full-range analyses that tracedensely-seeded particles in the whole domain. Our method can handlearbitrary distributed seeds for load-balanced particle tracing.
Data dimensionality Our method supports both static and time-varying data in both 2D and 3D meshes, because k-d trees can de-compose spaces in arbitrary dimensions. To the best of our knowl-edge, most load-balancing algorithms in data-parallel settings are de-signed for static datasets. Task-parallel algorithms can support un-steady flows, but they require out-of-core I/O scheduling for large-scale data.
Data movement The data movement of our method is minimal.Unlike previous studies that move data blocks for dynamic load bal-ancing [19,28], we do not need to move flow data back and forth afterthe initialization. Moving data blocks can be expensive, especiallyfor clusters that have lower network bandwidths. As demonstrated inPeterka et al.’s study [28], the additional costs associated with datarepartitioning caused by data movement (including the exchange ofdata blocks and particles) and updating of data structures may lowerthe overall performance. The only data movement in our method is theparticle exchange, which is also necessary in all data-parallel particletracing algorithms.
Communication patterns The distributed k-d tree decomposi-tion is self-consistent and decentralized. In previous work-stealing [8]and work-requesting [24] algorithms for task-parallel particle tracing,

k-d tree, 384MB
k-d tree, 96MB
k-d tree, 48MB
baseline, 384MB
baseline, 96MB
baseline, 48MB
(c)
4D tree, 384MB
4D tree, 96MB
4D tree, 48MB
3D tree 384MB
3D tree, 96MB
3D tree, 48MB
(f )
Total Time (Isabel)
#Processes
8K4K2K1K51210
Tim
e (
seco
nd
s)
100
1000
k-d tree, 384MB
k-d tree, 96MB
k-d tree, 48MB
baseline, 384MB
baseline, 96MB
baseline, 48MB
optimal scaling
(a)
Total Time (Isabel)
#Processes
8K4K2K1K51210
Tim
e (
seco
nd
s)
100
1000
4D tree, 384MB
4D tree 96MB
4D tree, 48MB
optimal scaling
3D tree, 384MB
3D tree, 96MB
3D tree, 48MB
(d)
Computation Time (Isabel)
#Processes
8K4K2K1K512
100
10
Tim
e (
seco
nd
s)
1000
k-d tree, 384MB
k-d tree, 96MB
k-d tree, 48MB
baseline, 384MB
baseline, 96MB
baseline, 48MB
(b)
Computation Time (Isabel)
#Processes
8K4K2K1K512
100
10
Tim
e (
seco
nd
s)
1000
4D tree, 384MB
4D tree, 96MB
4D tree, 48MB
3D tree, 384MB
3D tree, 96MB
3D tree, 48MB
(e)
Load Balance (Isabel)
#Processes
8K4K2K1K512
30
20
10Ma
x/A
ve
rag
e W
ork
loa
d
40
1
Load Balance (Isabel)
#Processes
8K4K2K1K512
15
10
5Ma
x/A
vera
ge
Wo
rklo
ad
1
20
304.0
746.6
340.5
649.9
240.9
495.0
147.0
348.4
73.136.8
17.265.9
29.0
11.942.6
23.710.7
81.974.2
35.6
90.882.7
36.1
87.9
76.5
36.5
9.410.2
7.6
4.3
10.5
489.7
282.2
8.8
397.5
196.5
6.0
357.6
160.3
4.836.1
22.5
10.1
27.8
19.4
8.459.6
17.0
7.1
649.9
495.0
73.165.9
42.6
304.0
240.9
147.0 36.8
29.0
23.7
9.4
7.6
4.3
17.2
11.9
10.7
Fig. 10. Strong-scaling tests using Isabel data with different number of processes. Panels (a), (b), and (c) show the tests with different memorylimits that consider both space and time dimensions used for splitting (i.e., 4D trees), while panels (d), (e), and (f) show the comparison betweenconsidering both space and time dimensions for splitting (i.e., 4D trees) and considering only space dimensions for splitting (i.e., 3D trees).
Table 2. Comparison with other load-balancing algorithms for parallel particle tracing. The plus (+) means that the method meets a certain kind ofcategory or requirement, while minus (-) means that it does not meet the corresponding kind of category or requirement.
Our Work
Nouanesengsy et al. [26]
Chen and Fujishiro [7]
Yu et al. [34]
Lu et al. [19]
Peterka et al. [28]
Dinan et al. [8]
Müller et al. [24]
Category Requirement
Parallel over
Data
Parallel over
Seeds
Static Load
Balancing
Dynamic Load
Balancing
Data
Preprocessing
Heuristics on
Flow Features
Assumptions
about Seed
Distribution
Flow Data
Movement
Scheduler
Process
+ + - + - - - - -
+ - + - + - + - -
+ - + - + + + - -
+ - + - + + + - -
+ - - + - - - + -
+ - - + - - - + -
- + - + - - - - +
- + - + - - - - +
a dedicated process is necessary in order to schedule the workloadsin all other processes. Frequently requesting tasks and sending infor-mation for workload scheduling in work requesting [24] significantlyincrease the communication overhead. The 1-to-n communication pat-tern makes it difficult to scale in large systems. We instead do not needany master processes to schedule tasks.
7.2 Limitations
Our method does not guarantee optimal and perfect load balancing.First, we assume that an equal number of particles leads to the idealbalance, but it is only an approximation. In the independent particletracing phase, some particles may stop earlier than others, becausethey go out of the local bounds of the block or hit critical points. Thecomputation time may also vary because of data locality. As a result,processes have different workloads even if they are assigned the samenumber of particles. Second, the constrained k-d tree decompositiondoes not guarantee an even distribution of particles. Because the split-ting planes of k-d trees are limited to the overlapped regions of ghostlayers, the k-d tree could be imbalanced. If there are no constraintson the decomposition, that is, the entire data can fit into memory, wecan have optimal distribution. But at worst, when the ghost layers just
overlap, our method degenerates to the baseline method because thesplitting planes will be in fixed positions.
Our method needs the parameter configuration of Nmax. As the sin-gle important parameter, it determines how frequently the particles areredistributed. If Nmax is too small, the k-d tree decomposition maybring large overhead. If Nmax is too large, the workload will be un-even because the redistribution is not performed frequently enough.We have shown the optimal values in our experiments on Blue Gene/Qsystems, but the number may vary with different data and differentarchitectures.
Our method is bulk-synchronous. The constrained k-d tree decom-position is a collective operation that involves all processes in a syn-chronous manner. However, the cost of synchronization grows as thenumber of processes increases. We currently cannot overlap computa-tion with communication.
8 CONCLUSIONS AND FUTURE WORK
In this work, we present a novel approach to balance workloads inparallel particle tracing with constrained k-d trees. The static data par-titioning with partial data replication makes it possible to redistributethe unfinished particles during particle tracing through the k-d tree de-

composition. A balanced workload is achieved dynamically with ourmethod, which improves the performance of parallel particle tracing.We evaluate our method with different flow visualization and analy-sis problems through a comprehensive performance analysis. Resultsshow that the proposed method improves both load balance and scala-bility in particle tracing.
In the future, we will generalize our algorithm to handle unstruc-tured mesh data. Our method also has the potential to visualize andanalyze flows in situ. We would also like to combine our algorithmwith existing static load-balancing strategies. Furthermore, we plan torelax the synchronizations in the parallel k-d tree decomposition.
ACKNOWLEDGMENTS
We thank the anonymous reviewers for their comments. This workis supported by NSFC No. 61672055 and the National Program onKey Basic Research Project (973 Program) No. 2015CB352503. Thiswork is also supported by the U.S. Department of Energy, Office ofScience, under contract number DE-AC02-06CH11357.
REFERENCES
[1] M. Aly, M. Munich, and P. Perona. Distributed kd-trees for retrieval
from very large image collections. In Proceedings of the British Machine
Vision Conference (BMVC), pages 1–11, 2011.
[2] S. S. Barakat and X. Tricoche. Adaptive refinement of the flow map
using sparse samples. IEEE Transactions on Visualization and Computer
Graphics, 19(12):2753–2762, 2013.
[3] J. E. Barnes and P. Hut. A hierarchical O(N log N) force calculation
algorithm. Nature, 324(6096):446–449, 1986.
[4] J. L. Bentley. Multidimensional binary search trees used for associative
searching. Communications of the ACM, 18(9):509–517, 1975.
[5] B. Cabral and L. C. Leedom. Imaging vector fields using line integral
convolution. In Proceedings of SIGGRAPH 1993, pages 263–270, 1993.
[6] J. Carrier, L. Greengard, and V. Rokhlin. A fast adaptive multipole algo-
rithm for particle simulations. SIAM Journal on Scientific and Statistical
Computing, 9(4):669–686, 1988.
[7] L. Chen and I. Fujishiro. Optimizing parallel performance of streamline
visualization for large distributed flow datasets. In Proceedings of IEEE
Pacific Visualization Symposium 2008, pages 87–94, 2008.
[8] J. Dinan, D. B. Larkins, P. Sadayappan, S. Krishnamoorthy, and
J. Nieplocha. Scalable work stealing. In SC’09: Proceedings of the In-
ternational Conference for High Performance Computing, Networking,
Storage and Analysis, pages 53:1–53:11, 2009.
[9] M. Edmunds, R. S. Laramee, G. Chen, N. Max, E. Zhang, and C. Ware.
Surface-based flow visualization. Computers & Graphics, 36(8):974–
990, 2012.
[10] G. D. Fatta and D. Pettinger. Dynamic load balancing in parallel kd-tree
k-means. In Proceedings of the 10th IEEE International Conference on
Computer and Information Technology, pages 2478–2485, 2010.
[11] C. Garth, F. Gerhardt, X. Tricoche, and H. Hagen. Efficient computation
and visualization of coherent structures in fluid flow applications. IEEE
Computer Graphics and Applications, 13(6):1464–1471, 2007.
[12] H. Guo, F. Hong, Q. Shu, J. Zhang, J. Huang, and X. Yuan. Scalable
Lagrangian-based attribute space projection for multivariate unsteady
flow data. In Proceedings of IEEE Pacific Visualization Symposium 2014,
pages 33–40, 2014.
[13] H. Guo, X. Yuan, J. Huang, and X. Zhu. Coupled ensemble flow line ad-
vection and analysis. IEEE Transactions on Visualization and Computer
Graphics, 19(12):2733–2742, 2013.
[14] G. Haller. Distinguished material surfaces and coherent structures
in three-dimensional fluid flows. Physica D: Nonlinear Phenomena,
149(4):248–277, 2001.
[15] M. Hlawatsch, F. Sadlo, and D. Weiskopf. Hierarchical line integration.
IEEE Transactions on Visualization and Computer Graphics, 17(8):1148–
1163, 2011.
[16] W. Kendall, J. Huang, T. Peterka, R. Latham, and R. B. Ross. Toward a
general I/O layer for parallel-visualization applications. IEEE Computer
Graphics and Applications, 31(6):6–10, 2011.
[17] W. Kendall, J. Wang, M. Allen, T. Peterka, J. Huang, and D. Erickson.
Simplified parallel domain traversal. In SC’11: Proceedings of the In-
ternational Conference for High Performance Computing, Networking,
Storage and Analysis, pages 10:1–10:11, 2011.
[18] R. Laramee, H. Hauser, H. Doleisch, B. Vrolijk, F. Post, and D. Weiskopf.
The state of the art in flow visualization: Dense and texture-based tech-
niques. Computer Graphics Forum, 23(2):203–222, 2004.
[19] K. Lu, H.-W. Shen, and T. Peterka. Scalable computation of stream sur-
faces on large scale vector fields. In SC’14: Proceedings of the Interna-
tional Conference for High Performance Computing, Networking, Stor-
age and Analysis, pages 1008–1019, 2014.
[20] T. McLoughlin, R. Laramee, R. Peikert, F. Post, and M. Chen. Over two
decades of integration-based, geometric flow visualization. Computer
Graphics Forum, 29(6):1807–1829, 2010.
[21] B. Moloney, D. Weiskopf, T. Moller, and M. Strengert. Scalable sort-
first parallel direct volume rendering with dynamic load balancing. In
EGPGV07: Proceedings of Eurographics Symposium on Parallel Graph-
ics and Visualization, pages 45–52, 2007.
[22] D. Morozov and T. Peterka. Block-parallel data analysis with DIY2. In
Proceedings IEEE Symposium on Large Data Analysis and Visualization
2016, pages 29–36, 2016.
[23] D. Morozov and T. Peterka. Efficient delaunay tessellation through K-D
tree decomposition. In SC’16: Proceedings of the International Confer-
ence for High Performance Computing, Networking, Storage and Analy-
sis, pages 728–738, 2016.
[24] C. Muller, D. Camp, B. Hentschel, and C. Garth. Distributed parallel
particle advection using work requesting. In Proceedings of IEEE Sym-
posium on Large Data Analysis and Visualization 2013, pages 1–6, 2013.
[25] B. Nouanesengsy, T.-Y. Lee, K. Lu, H.-W. Shen, and T. Peterka. Paral-
lel particle advection and FTLE computation for time-varying flow fields.
In SC’12: Proceedings of the International Conference for High Perfor-
mance Computing, Networking, Storage and Analysis, pages 61:1–61:11,
2012.
[26] B. Nouanesengsy, T.-Y. Lee, and H.-W. Shen. Load-balanced parallel
streamline generation on large scale vector fields. IEEE Transactions on
Visualization and Computer Graphics, 17(12):1785–1794, 2011.
[27] M. M. A. Patwary, S. Byna, N. R. Satish, N. Sundaram, Z. Lukic,
V. Roytershteyn, M. J. Anderson, Y. Yao, Prabhat, and P. Dubey. BD-
CATS: big data clustering at trillion particle scale. In SC’15: Proceed-
ings of the International Conference for High Performance Computing,
Networking, Storage and Analysis, pages 6:1–6:12, 2015.
[28] T. Peterka, R. B. Ross, B. Nouanesengsy, T.-Y. Lee, H.-W. Shen,
W. Kendall, and J. Huang. A study of parallel particle tracing for steady-
state and time-varying flow fields. In IPDPS’11: Proceedings of IEEE
International Symposium on Parallel and Distributed Processing, pages
580–591, 2011.
[29] F. Post, B. Vrolijk, H. Hauser, R. Laramee, and H. Doleisch. The state of
the art in flow visualization: Feature extraction and tracking. Computer
Graphics Forum, 22(4):1–17, 2003.
[30] S. Rizzi, M. Hereld, J. A. Insley, M. E. Papka, T. D. Uram, and V. Vish-
wanath. Large-scale parallel visualization of particle-based simulations
using point sprites and level-of-detail. In Proceedings of Eurographics
Symposium on Parallel Graphics and Visualization 2015, pages 1–10,
2015.
[31] S. Seckler, N. Tchipev, H. Bungartz, and P. Neumann. Load balanc-
ing for molecular dynamics simulations on heterogeneous architectures.
In SC’16: Proceedings of the International Conference for High Perfor-
mance Computing, Networking, Storage and Analysis, pages 101–110,
2016.
[32] H.-W. Shen and D. L. Kao. UFLIC: A line integral convolution algo-
rithm for visualizing unsteady flows. In Proceedings of IEEE Visualiza-
tion 1997, pages 317–322, 1997.
[33] I. Wald, S. Boulos, and P. Shirley. Ray tracing deformable scenes using
dynamic bounding volume hierarchies. ACM Transactions on Graphics,
26(1):6, 2007.
[34] H. Yu, C. Wang, and K.-L. Ma. Parallel hierarchical visualization of large
time-varying 3D vector fields. In SC’07: Proceedings of the International
Conference for High Performance Computing, Networking, Storage and
Analysis, pages 24:1–24:12, 2007.
[35] C. Zhang, A. Krishnamurthy, and R. Y. Wang. Brushwood: Distributed
trees in peer-to-peer systems. In IPTPD’05: Proceedings of International
Workshop on Peer-to-Peer Systems, pages 47–57, 2005.
[36] J. Zhang, H. Guo, and X. Yuan. Efficient unsteady flow visualization
with high-order access dependencies. In Proceedings of IEEE Pacific
Visualization Symposium 2016, pages 80–87, 2016.
[37] J. Zhang, H. Guo, X. Yuan, and T. Peterka. Dynamic load balancing
based on constrained k-d tree decomposition for parallel particle tracing.

In Proceedings of IEEE Pacific Visualization Symposium 2017 (Posters),
pages 310–311, 2017.