dynamic ground-effect measurements on the f-15 … · f-15 stol and maneuver technology...
TRANSCRIPT

I 1
Ju_"---'-'--"_e1990
[] -..T_: C -a.-: - .., ---I.
r ...... .. f'5
. !
Dynamic Ground-EffectMeasurements on the .....F-15 STOL and Maneuver
Technology Demonstrator(S/MTD) Configuration
Guy T. Kemmerly
m!-(NA_A_T___On_: ) DYNAMIC G _U!J_O-cF_CT
I EASUR_MdNIS ON IHE F-15 ST_L AN0 MANFUVLRI TCCHNQLOGY DEMONSTRATOR (S/_TD)
ICONFIGURATInN (NASA) 37t p CSCL OIA uncl _sn _ " .
i
https://ntrs.nasa.gov/search.jsp?R=19900013215 2018-08-06T14:25:47+00:00Z

: _1
.......... L;.... . ......... ;.;=r __J -_
°
q

r-
NASATechnical
Paper3000
1990
National Aeronautics and
Space Administration
Office of Management
Scientific and TechnicalInformation Division
Dynamic Ground-EffectMeasurements on theF-15 STOL and Maneuver
Technology Demonstrator(S/MTD) Configuration
Guy T. Kemmerly
Langley Research Center
Hampton, Virginia


p-
Summary
A moving-model ground-effect testing method
has been used to study the influence of rate of
descent on the aerodynamic cilaracteristics of the
F-15 STOL and Maneuver Technology Demonstra-
tor (S/MTD) configuration for both the approachand rollout phases of landing. The approach phasewas modeled for three rates of descent and the re-
sults were compared with predictions from the F-15
S/MTD simulation data base (predictions based ondata obtained in a wind tunnel with zero rate of
descent). This comparison showed significant differ-ences due both to the rate of descent in the moving-
model test and to the presence of the ground bound-
ary layer in the static wind-tunnel test. Relative
to the simulation data base predictions, the moving-
model test showed substantially less lift increase in
ground effect, less nose-down pitching moment, and
less increase in drag. These differences became more
prominent at the larger thrust vector angles.
Over the small range of rates of descent tested us-
ing the moving-model technique, the effect of rate of
descent on longitudinal aerodynamics was relativelyconstant.
The results of this investigation indicate no
safety-of-flight problems with the lower jets vectoredup to 80 ° on approach. The results also indicate
that this configuration could employ a nozzle con-
cept using lower reverser vector angles up to 110 °
on approach if a "no-flare" approach procedure were
adopted and if inlet reingestion does not pose a
problem.
Introduction
With the renewed interest in the tactical advan-
tages of fighter/attack aircraft using short takeoffand landing (STOL) capabilities, aircraft designers
are seriously considering the use of vectored/reversed
thrust as a means of attaining short landings. How-
ever, the use of large thrust vectoring (including
thrust reversing) in close proximity to the ground has
been shown to strongly influence the flow field that
forms beneath an aircraft in ground effect (refs. 1,
2, and 3). Furthermore, recent ground-effect stud-ies at the Langley Research Center (LaRC) (ref. 4)
conducted to explore the effect of rate of descent
on aerodynamic ground effects have shown that the
use of thrust vectoring and reversing significantly in-
creases the influence of rate of descent on ground
effects. These results have generated strong research
interest in exploring the steady-state and dynamic
ground effects on a configuration representative of
the expected new generation of STOL fighters.
The F-15 STOL and Maneuver Technology
Demonstrator (S/MTD) is a current representative ofthis new vehicle class incorporating vectored thrust.
A description of this vehicle and the technology pro-
gram surrounding it is presented in reference 5. This
configuration was designed specifically to investigateand dcmonstrate the technologies for STOL fight-
ers. It incorporates a three-surface design (canards,
wings, and horizontal tails) and thrust vectoring and
reversing capabilities to enhance STOL performance.
Flight tests of this vehicle will provide a realistic as-
sessment of the impact of vectored thrust on ground
effects and may present the opportunity for compar-
ing predictions with flight results at a later date.These flight results will be invaluable for assessing
the proper methods needed to extrapolate (or scale)
the subscale dynamic ground-effect measurements to
full-scale applications. It was the purpose of the
present investigation to define the subscale dynamic
ground effects on the F-15 S/MTD configuration in
preparation for a comparison with the flight-test data
when they become available. A comparison of the
dynamic measurements with the static wind-tunnelground-effect measurements is also made.
Symbols
All moment data are referenced to the pointlocated at 0.2526_ on the model. All results are
presented in U.S. units. The coordinate systems used
are illustrated in figure 1.
b wing span, in
CA axial-force coefficient,
Axial force/_/S
CD drag coefficient, Drag/_/S
ACD incremental drag coefficient,
CD,instantaneou s - CD,oc
CL lift coefficient, Lift/_S
ACL incremental lift coefficient,
CL,instantaneou s -- CL,oo
Cm pitching-moment coefficient,
Pitching moment/0S_
ACre incremental pitching-moment
coefficient, Cm,instantaneou s - Cm,oo
mean aerodynamic chord, 15.9 in.
g Earth gravitational units
(lg _ 32.17 ft/sec 2)
h height of model over ground board
(referenced to 0.2526_), ft

h
Ix
5-
Iz
P
0
i"
S
V
X,Y,Z
X
ii
x, y, z
Y
6
P
Subscripts:
a
B
C
FF
rate of descent, ft/sec
moment of inertia about X-axis,
ff-lb-sec 2
moment of inertia about Y-axis,
ft-lb-sec 2
moment of inertia about Z-axis,
ff-lb-sec 2
roll acceleration, radians/sec 2
pitch acceleration, radians/sec 2
dynamic pressure, lb/ff 2
yaw acceleration, radians/sec 2
wing area, if2
velocity, ft/sec
body-axis system shown in figure 1
linear displacement along X-axis, ft
linear velocity in x-direction, ft/sec
linear acceleration in x-direction,
ft/sec 2
distance from model center of
gravity to balance moment center
linear displacement along Y-axis, ft
linear acceleration in y-direction,
ft/sec 2
linear displacement along Z-axis, ft
linear acceleration in z-direction,
ft/sec 2
angle of attack, deg
flight path angle (incidence ofmodel path relative to ground
plane), deg
deflection angle, deg
frequency of periodic perturbation
in configuration aerodynamics, Hz
density, slugs/ft 3
aileron
base
canard
flow field
FS full scale
f flap
h horizontal stabilizer
j jet
l lower
M model
osc oscillatory
SS steady state
u upper
oo free stream
Abbreviations:
AF axial force
LaRC Langley Research Center
NF normal force
PM pitching moment
psid pounds per square inch referenced
to atmospheric pressure
RM rolling moment
SF side force
S/MTD STOL and Maneuver TechnologyDemonstrator
STOL short takeoff and landing
VRF Vortex Research Facility
YM yawing moment
Facility
The Langley Vortex Research Facility (VRF)
(illustrated in fig. 2) was used for the present study.
In that facility the model is suspended on a variable-
length strut extending from the bottom of the over-head gasoline-engine-powered cart. The strut sup-
ports the model and air line assembly as well as the
instrumentation. The angle of attack was changed
by pitching the entire s-ti'ut and model assembly at
the point where the strut was attached to the cart.
Velocity was controlled by a cruise-control system on
the cart. High-pressure air bottles on the cart pro-
vided compressed air for the thrust simulators.
For the present test, the test region of the VRF
was modified to incorporate a 150-ft-long groundboard near the center of the test section. The
ground board consisted of two parts: a ramp inclined
upward 4° for a distance of 100 ft, and a horizontal
section following the ramp which extended for an
additional 50 ft. The height of the model over the
fixed horizontal portion of the ground board was set
"9

by adjusting the length of the model support strut.
As the model moved horizontally over the inclined
portion, the distance from the ground board to the
model reduced, thereby simulating an approach along
a glide slope of 4 °. The rate of descent was dependent
on the test velocity as given by the equation
/t = Vcc tan 4 °
After moving across the ramp, the model passed overthe horizontal section to simulate rollout or constant-
altitude flight. (See fig. 3.)In the VRF 24 channels of digital data are trans-
mitted from the cart through a modulated laser beam
to a photo receptor and a mass data storage unit.
The channels are sampled at a rate of 111 samples
per second for nearly 30 sec. The data are then con-
verted to engineering units using a Hewlett-Packard
HP 1000 A900 computer. For more information onthe data acquisition in the VRF, see reference 6.
Model
Three restrictions were placed on the investiga-tion because of facility limitations. The first of these
was a result of the width of the ground board in-
stalled in the facility. That ground board was con-
structed 8 ft wide. Using the VSAERO panel method
described in reference 7 showed that the model span
should be limited to approximately 3 ft to ensure
that the boundaries of the ground board would not
influence the ground effect on the configuration. For
the S/MTD configuration this corresponds to an
0.08-scale model. The second facility restriction was
that the model weight should be less than 80 lb be-cause of cart support system limitations. Third, and
finally, VRF testing is limited by maximum cart ve-
locity to 100 ft/sec. An available 0.083-scale, low-
speed, rotary-balance model of an F-15A aircraft waschosen based on these restrictions and was then mod-
ified to match the S/MTD configuration. This model
configuration is shown in figures 4 and 5. Because
that model was designed with a dynamic pressurelimit (0-limit) of 6 lb/ft 2, the upper limit of testing
became 70 R/see. This model had adjustable tailsurfaces, flaps, ailerons, and canards. The rangesof motion of these surfaces were sufficient to model
properly the approach and rollout configurations of
the S/MTD aircraft. The configurations tested are
detailed in table I. Landing gear were not modeledin this investigation.
The model was mounted on a blade that entered
the top of the model just behind the model refer-
ence point, 0.2526_. The cross section of the blade
was 5.5 in. long and 1 in. thick. The vectored thrust
simulator was held in place in the cavity behind the
model by two steel bars that attached to each side
of the support blade approximately 15 in. above the
model. The gaps between the vectored thrust simula-tor and the model and between the blade mount and
the model were bridged by a thin rubber sheet (den-
tal dam) to prevent flow inside the model. Becausethe distance was so small between the vectored thrust
simulator and the model, an electrically charged cop-
per strip (foul strip) was installed inside the cavityinto which the thrust vector simulator fit. Monitor-
ing the charge of the metal thrust vector simulatorindicated when contact was made with the model.
Once mounted on the support strut in the VRF,it was noted that the model was slightly twisted
along the X-axis. An attempt was made to level
the model around that axis to minimize the impact
of this model imperfection. The resulting roll devi-
ations from horizontal of the three principal aerody-namic surfaces are detailed in table II. These small
deviations were not expected to impact the results of
the program.To ensure that the flow on most of the model
would be turbulent, 1/8-in-wide transition strips of
No. 60 carborundum grit were placed on the model
1/2 in. back from the leading edges of the aerody-namic surfaces and 1 in. back from the nose.
Thrust simulation was supplied nonmetrically
(thrust loads not measured by the balance) usingthe vectored thrust simulator described in reference 8
and sketched in figure 6. This device was attached to
the sting and positioned (in the cutout in the model
shown in fig. 4) such that the location of the noz-
zles corresponded to the location of the rotating-vane
thrust reverser on the S/MTD. The jet was directed
by honeycomb inserts embedded in the plenum box
cover plate. Different plates directed the jet at dif-ferent angles.
Instrumentation
Model forces and moments were measured with
a six-component strain gauge balance (NASA LaRC
balance VORTEX-5 with a 10-1b axial beam). Model
accelerations necessary to remove the inertial loads
from the balance outputs (see the appendix) weremeasured by Setra Systems +159 linear accelerom-
eters calibrated over a range of ±lg. In the test
section during the cruise portion of the runs, +lg
was sufficient to encompass the accelerations of the
vibrating model. The details of how these accelera-tions were used to remove the inertial loads from the
balance data are given in the appendix.
In order to set the model jet conditions such
that full-scale jet conditions would be modeled prop-
erly, jet-exit total-pressure measurements were neces-
sary. These measurements were made statically and

werecalibratedagainsttotal-pressuremeasurementstakenin theplenum.Nozzle-exitpressuresweremea-suredusing+2-psidEndevcomodel8510pressuretransducers,and plenumpressuresweremeasuredusing-t-10-psid CEC Model 4-312 pressure transduc-
ers. Jet total temperatures were measured with iron-
constantan thermocouples located approximately 4 ft
upstream of the plenum. Measurements not specific
to this test such as vehicle velocity and atmospheric
conditions at the time of the test were taken using
the standard facility instrumentation, the details ofwhich can be found in reference 6.
Scaling Considerations
Because the objective of this investigation was to
model a dynamic event on a powered configuration,
it was important that the jet conditions be matched
to those at full scale and that the data be sampledand filtered such that information of interest to the
full-scale aircraft be captured in the subscale testing.
Based on the results reported in reference 9, jetvelocity was scaled using a ratio of dynamic pressures
(g-ratio) defined as qj/Ooc. The study reported inthat reference considered several scaling parametersand found that the q-ratio was most effective for
correlating the data taken at different test conditions.
For this investigation the condition tested was
qj,M _ qj,FS _ 45
qoc,M qoc,FS
based on the expected flight conditions for the
S/MTD. It is assumed that for the aircraft on ap-
proach, the engines will bc set such that the exhaust
nozzles will be choked. Therefore, it would have been
desirable to test using choked flow in the vectoredjets. However, to do so and match the full-scale
g-ratio of 45, a minimum test velocity of 166 if/seewas required. Both the facility limitations and the
model limitations made this impossible. With the
model load limit as the determining factor, the max-
imum Maeh number of the jet (for a 0-ratio matchedwith full scale) was 0.4. Since this is an unchoked
condition, the jet pressure was closely monitored and
no significant effects due to nozzle back pressuriza-tion were noticed.
On approach, the S/MTD will use both upperand lower vectored jets. In the VRF the vectored
jets were simulated using cold compressed air from
high-pressure bottles carried on the support vehicle.
This limited air supply made it necessary to block theupper ports during this test to minimize the total re-
quired mass flow. This is expected to have only a
small impact on the ground-effect data, however, be-
cause the interaction between the ground plane and
vectored thrust flow field is dominated by the lower
jets. This will, on the other hand, have an impact onthe overall aerodynamics of the configuration. There-
fore, the data are presented as increments (instead oftotal values) in aerodynamic coefficients relative to
the out-of-ground-effect values.It is also essential that the Strouhal number be
matched when trying to measure the dynamic effectson a subscale model and relate those to the full-scale
condition. To achieve this match,
or
bM bF._SS)_M _M ----)_FS VF S
bFSVM
"_M = )_FS bMVF s
where )_FS represents a frequency of an unsteadycharacteristic in the flow field to which the full-
scale aircraft would respond and AM represents that
frequency at the model scale. If "_FS is set to be themaximum frequency to which the full-scale aircraft
can respond, all frequencies above the resulting AM
can be filtered from the dynamic data without losinginformation about how the full-scale aircraft would
respond. This is particularly useful in the VRF
testing in which the model is driven through the
test section and is, therefore, subject to large high-frequency vibrations. The subsequent balance loads
(those at frequencies greater than )_M) can be filteredwithout removing the unsteady effects that would
influence the full-scale aircraft. With the followingfixed full-scale values
"_FS = 3 Hz
bFS = 40 ft
VFS = 197 ft/sec on approach
(as indicated by the manufacturer) and knowing the
model scale to be 0.083, AM is a function of the test
velocity for a particular run. The data acquired were
digitally filtered according to the above discussion.
Procedures
Vectored Thrust
Different thrust vector angles were simulated byattaching different nozzles to the plenum of the
thrust simulator. Prior to testing with a particular
nozzle, jet-exit total pressures in the center of each
nozzle were calibrated against total-pressure mea-
surements taken inside the plenum. After a correla-
tion relationship was established, the total-pressureprobes were removed from the nozzle exits and to-
tal pressures were computed from the measurements
in the plenum chamber. As indicated in table I, the
=
=
=
4

thrustvectoranglestestedin theapproachconfigu-ration were different from those tested in the rollout
configuration.
Model Balancing
Because of the nature of the testing in the VRF,
large inertial loads are contained in the balance out-
put. In order to remove these loads, the model ac-
celerations must be measured in all six componentsof motion. Once combined with the mass and mo-
ments of inertia of the model, the resulting inertial
loads can be subtracted from the balance data. (See
the appendix.) This technique can be greatly sim-plified by balancing the model along all three axes
such that the model center of gravity is driven to the
point in the model at which the balance center would
be located during the test. This was accomplished in
several steps. Once the proposed location of the bal-
ance moment center was identified in the model, theaecelerometers were mounted in the model in such
a way as to accurately measure all six componentsof acceleration of that point. A steel block, which
closely resembled the size and weight of only that
portion of the balance on the model side of the strain
gauge beams of the balance, was then mounted in
the model. The model was then suspended from the
proposed location of the balance moment center, and
weights were added to the inside of the fuselage until
the model was balanced at that point along all threeaxes.
The model was then weighed to determine itsmass, a quantity required for inertial load removal.
Because the inertial load equations were simplified to
an uncoupled system (as outlined in the appendix)by the balancing described above, the moments of
inertia could be measured directly through the data
acquisition system by shaking the model randomly
and recording the accelerations and balance loads.
When doing this it is necessary that the aerodynamicloads be assumed to be small. The equations needed
for these calculations can be found in the appendix.
Test Conditions
The model was tested primarily in two configu-
rations: the approach configuration and the rollout
configuration expected following touchdown. These
configurations are defined in table I. The approach
configuration was tested at 50, 60, and 70 ft/secto create three simulated rates of descent. The
rates of descent simulated from these velocities were
3.49, 4.19, and 4.88 ft/sec, respectively. All tests of
the rollout configuration were conducted at a velocity
of 60 ft/sec.
Test Procedure
The vehicle and model were started from rest at
one end of the facility and accelerated to the test
velocity within 900 ft. The vehicle then passed overthe enclosed test section while the model suspended
below the vehicle passed through the enclosed testsection isolated from the downwash of the vehicle.
(See fig. 2.) The test section is approximately 500 ft
in length. As the model entered the test section,the model air system was automatically activated
and the thrust simulator was powered. This allowed
the jets to stabilize before the model passed over the
ground board. As the model exited the test section,
brakes were applied automatically and stopped thevehicle in less than 100 ft.
Results
Data are presented for two configurations: ap-
proach and rollout. The approach configuration is
presented first for three rates of descent varying from
3.49 to 4.88 ft/sec while maintaining a _/-ratio of 45.
The data for the rollout configuration are then pre-sented. In table I note the differences between these
configurations in both the control surface settings
and the thrust vector setting. Of principal interest in
the data obtained in the approach configuration arethe results obtained over the inclined portion of the
ground board corresponding to the approach phase
of landing (i.e., h/b > 0.19). Of principal interest inthe rollout configuration data are the measurements
taken over the horizontal portion of the ground board
(h/b = 0.19) and indicated by the solid symbols onthe plots.
For both configurations the top thrust-vectoring
ports were blocked during this investigation because
of a limitation in the air supply capacity. As a
result, the aerodynamic coefficients measured are notexpected to be the same as those experienced by
the S/MTD aircraft during landing. However, it
is expected that the increments in the aerodynamic
coefficients due to ground effect are valid and useful
numbers, since the ground effects associated with the
top jets should be small in comparison with those
associated with the lower jets. For this reason, the
data are presented as increments from the out-of-
ground-effect values of lift, pitching moment, anddrag coefficients as functions of ground height. The
out-of-ground effect values were obtained at h/b >
3.0; however, since no change in aerodynamics was
seen that far above the ground board, the data are
plotted only out to h/b = 1.5.
Approach Configuration
For the approach condition, the S/MTD aircraft
is trimmed at _ = 12 ° , 5h = 1-88°, 5c = -12-85 ° ,
5

and5a= 5/= 20 ° with the upper and lower vectoredjets deflected symmetrically up to a deflection angleof 75 ° , as can be determined from the results found
in reference 10. In addition, the upper vectored jetcan be deflected an additional 10° if additional thrust
control is required; however, the lower jet will not be
deflected beyond 75 ° . The nominal approach thrust
vector setting is expected to be 64.3 °. This condition,trimmed at _ = 12 °, is noted on a representative lift
curve for the F-15 S/MTD in sketch A taken fromreference 10. The approach lift coefficient is seen to
be approximately 1.1. In this investigation, lower jet
vector angles 5j, l of 45 °, 60 °, and 80 ° were tested at
three rates of descent, and 5j, l = 110 ° was tested ata rate of descent of 4.19 ft/sec.
1.5
1.0
(C L)h/b=l.0
.5
8f/5 a ,,, 200/20 °
5c = -12.85 °5h = 1.88 o
8j,u/Sj,l = 64.3°/64.3 °h/b = 1.0
I I J. 1 I . I
2 4 6 8 10 12 14o_,deg
Sketch A
Figures 7 9 contain the increments from the out-
of-ground-effect values of the longitudinal coefficientsas a function of model height for various rates of
descent. Each plot contains three curved lines and
three solid symbols. The curved lines represent
the dynamic measurements of ground effect over the
inclined portion of the ground board at three rates
of descent. The solid symbols represent the steady-
state measurements of ground effect at minimum
ground height over the horizontal portion of the
ground board. In general, these measurements show
that over the small range of rates of descent tested,
there were no significant, consistent differences in the
ground effects measured at any of the thrust vectorangles. The fact that the small variation in rate of
descent did not generate a substantial difference in
longitudinal aerodynamics does not imply that therewere no effects due to rate of descent but that the
effects were relatively constant over the range tested.Because the effects were so consistent over the
range tested, only the data for a rate of descent/:t of
4.2 ft/sec are cross plotted for variations in the lower
jet vector angle. This rate of descent was chosen for
two reasons: 5j, l = 110 ° was tested only at that rateof descent and the rollout configuration data were
all obtained at 60 ft/sec--the forward speed used in
simulating/_ = 4.2 ft/sec.
The effect of the vector angle of the lower jetson the longitudinal aerodynamic coefficients is seen
in figure 10. For the lift coefficient at all jet angles
tested, the level increased slightly above the out-of-
ground-effect level beginning at about h/b = 1.0 and
remained relatively constant as the model descended
to a height of about h/b = 0.5 where the lift began
to increase sharply. The reason for this two-stageincrease is unclear.
For jet vector angles of 45 ° and 60 ° (measured
from the body axis aft horizontal), the ground effect
on the lift coefficient increment was essentially thesame; the lift coefficient increased by about 0.24
by minimum ground height. For 5j,t = 80 °, theincrement in lift coefficient was consistently higher
at ground heights below h/b = 1.0 than was seen for
5j,t = 45 ° and 60 °. This is true to an even greaterextent at a reverser angle of 110 °. Both of these
higher thrust vector angles are beyond the range of
those intended to be tested by the S/MTD aircraft
on approach. At 5j, l = 110 °, unlike the results atthe other thrust vector angles, the maximum liftcoefficient increase occurred before the model was
at the wheel touchdown height. At approximately
h/b = 0.22, the lift coefficient increment reached a
maximum value of 0.23 and then dropped to 0.21
by the touchdown height, h/b = 0.19. Once at this
minimum height, the lift. continued to drop (as it
transitioned to a steady-state situation) to a levelthat was actually slightly below the lift level out of
ground effect. Often, aircraft are flown such that
the sink rate is arrested near the ground. This is
referred to as "flaring" the aircraft. These results
indicate that such a maneuver could actually allow alift loss to develop on this configuration, and instead
of reducing the rate of descent, flaring would actuallycause it to increase. As a consequence, the thrust
reverser position of 110 ° could be used only if an
approach procedure were adopted in which the rate
of descent was not arrested near the ground.
The effect of the vector angle of the lower jet on
the pitching moment is presented in figure 10(b). For
all thrust vector angles, as the model moved closer to
the ground board and the horizontal stabilizer moved
into ground effect, the lift on that surface increased as
indicated by the nose-down pitching-moment incre-
ment. At higher thrust vector angles (Sj, t = 80 ° and110°), a ground vortex is able to develop under thehorizontal stabilizer and the low pressure associated
F
z
=
=
=
6
withagroundvortexinducesanincrementalnose-uppitchingmoment.Anexplanationofthegroundvor-texanditsdevelopmentcanbefoundin reference11.
Forthe threevectoranglesthat spanthe anglesexpectedto be flight tested(45°, 60°, and80°),thepitching-momentcoefficientcontinuedto decreasedownto theminimumgroundheight.Themagnitudeofthisnegativepitching-momentincrementincreasedslightlyasthejetswerevectoredfartherforwardfrom5j,t = 45 ° to 5j,l = 80 °. When the jets were vectored
to 5j, l = 110 °, the ground effect was somewhatdifferent. From h/b = 0.5 down to h/b = 0.28,
consistent with the other vector angles, pitching
moment decreased; however, the magnitude of this
decrease was slightly greater than that for the other
vector angles. At h/b = 0.28, though, the pitching
moment began to increase. The pitching moment
returned to its free-stream level by h/b = 0.25,continued to increase to ACre = 0.18 by touchdown
height, and then increased more to ACre = 0.20 over
the horizontal portion of the ground board.
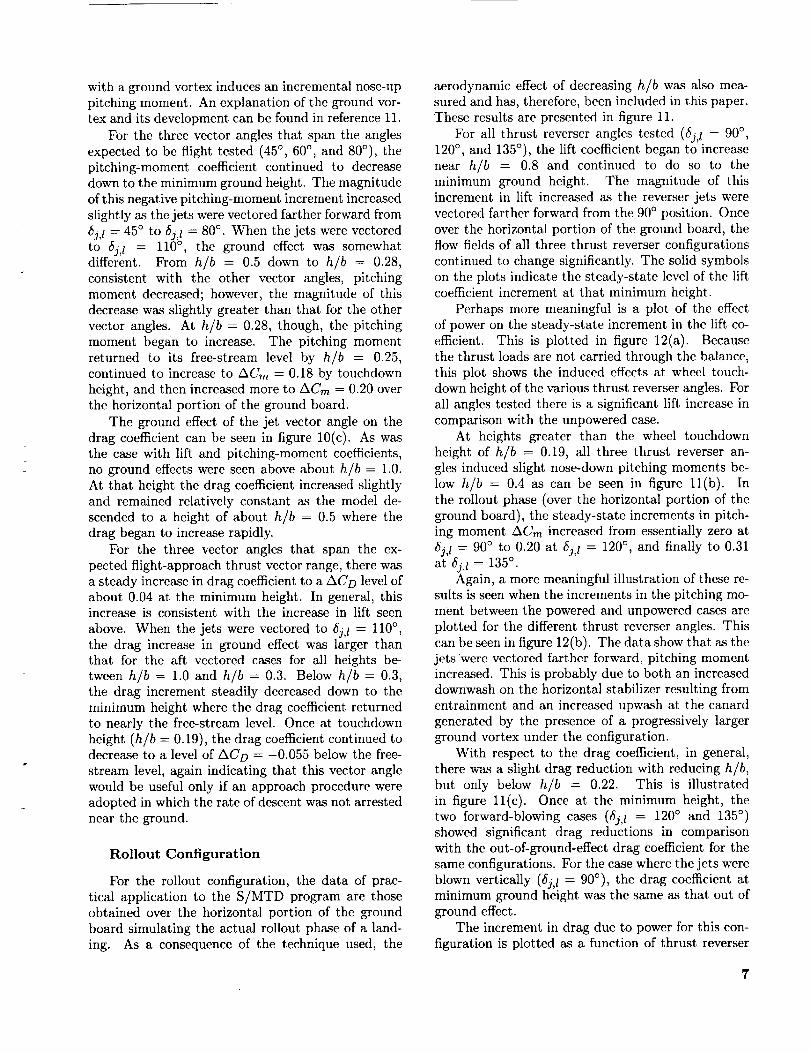
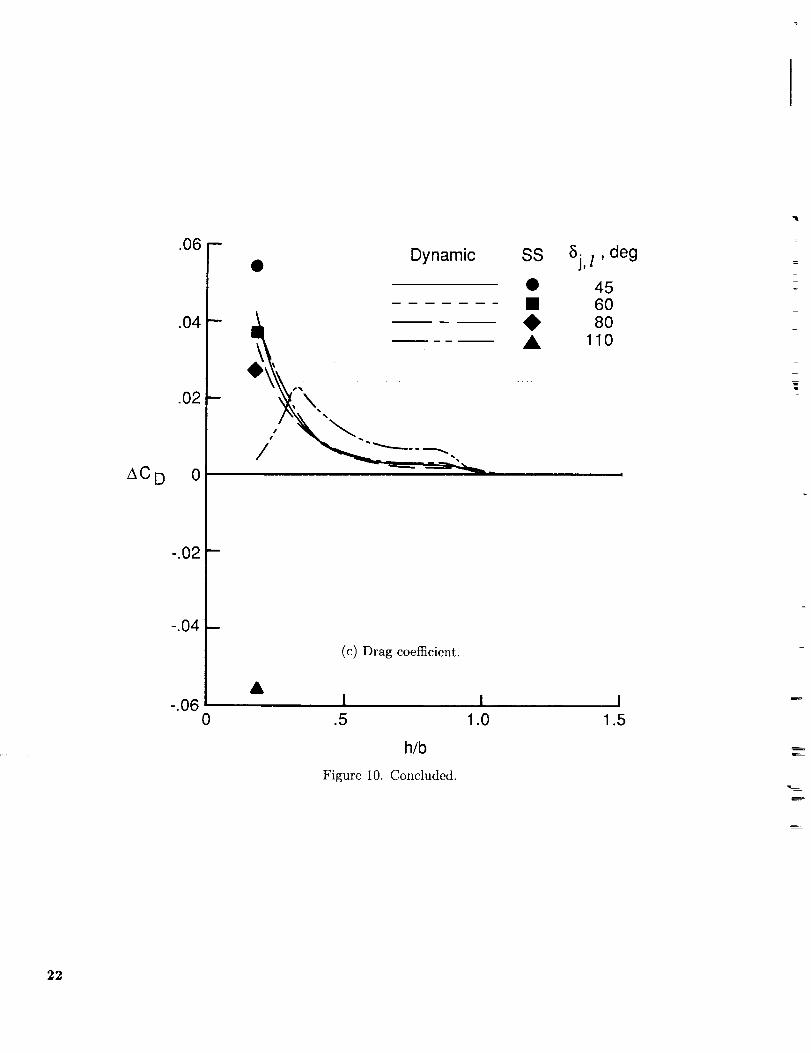
The ground effect of the jet vector angle on the
drag coefficient can be seen in figure 10(c). As was
the case with lift and pitching-moment coefficients,
no ground effects were seen above about h/b = 1.0.
At that height the drag coefficient increased slightly
and remained relatively constant as the model de-scended to a height of about h/b = 0.5 where the
drag began to increase rapidly.
For the three vector angles that span the ex-
pected flight-approach thrust vector range, there was
a steady increase in drag coefficient to a AC D level ofabout 0.04 at the minimum height. In general, thisincrease is consistent with the increase in lift seen
above. When the jets were vectored to 5j, l = 110 °,the drag increase in ground effect was larger thanthat for the aft vectored cases for all heights be-
tween h/b = 1.0 and h/b = 0.3. Below h/b = 0.3,
the drag increment steadily decreased down to the
minimum height where the drag coefficient returnedto nearly the free-stream level. Once at touchdown
height (h/b = 0.19), the drag coefficient continued todecrease to a level of ACD = --0.055 below the free-
stream level, again indicating that this vector angle
would be useful only if an approach procedure were
adopted in which the rate of descent was not arrested
near the ground.
Rollout Configuration
For the rollout configuration, the data of prac-
tical application to the S/MTD program are those
obtained over the horizontal portion of the ground
board simulating the actual rollout phase of a land-
ing. As a consequence of the technique used, the
aerodynamic effect of decreasing h/b was also mea-
sured and has, therefore, been included in this paper.
These results are presented in figure 11.
For all thrust reverser angles tested (Sj,/ -- 90 °,120 ° , and 135°), the lift coefficient began to increase
near h/b -- 0.8 and continued to do so to the
minimum ground height. The magnitude of this
increment in lift increased as the reverser jets were
vectored farther forward from the 90 ° position. Once
over the horizontal portion of the ground board, theflow fields of all three thrust reverser configurations
continued to change significantly. The solid symbols
on the plots indicate the steady-state level of the liftcoefficient increment at that minimum height.
Perhaps more meaningful is a plot of the effect
of power on the steady-state increment in the lift co-
efficient. This is plotted in figure 12(a). Because
the thrust loads are not carried through the balance,
this plot shows the induced effects at wheel touch-
down height of the various thrust reverser angles. Forall angles tested there is a significant lift increase in
comparison with the unpowered case.
At heights greater than the wheel touchdown
height of h/b = 0.19, all three thrust reverser an-
gles induced slight nose-down pitching moments be-
low h/b = 0.4 as can be seen in figure ll(b). In
the rollout phase (over the horizontal portion of the
ground board), the steady-state increments in pitch-ing moment ACre increased from essentially zero at
5j,t = 90° to 0.20 at 5j,t = 120°, and finally to 0.31
at 5j, l -- 135 °.Again, a more meaningful illustration of these re-
sults is seen when the increments in the pitching mo-
ment between the powered and unpowered cases are
plotted for the different thrust reverser angles. This
can be seen in figure 12(b). The data show that as the
jets were vectored farther forward, pitching momentincreased. This is probably due to both an increased
downwash on the horizontal stabilizer resulting from
entrainment and an increased upwash at the canard
generated by the presence of a progressively larger
ground vortex under the configuration.
With respect to the drag coefficient, in general,
there was a slight drag reduction with reducing h/b,
but only below h/b = 0.22. This is illustrated
in figure ll(c). Once at the minimum height, the
two forward-blowing cases (Sj,l = 120° and 135 °)
showed significant drag reductions in comparisonwith the out-of-ground-effect drag coefficient for the
same configurations. For the case where the jets were
blown vertically (Sj,l = 90°), the drag coefficient atminimum ground height was the same as that out of
ground effect.
The increment in drag due to power for this con-
figuration is plotted as a function of thrust reverser
7

vectoranglein figure12(c). Thesedatashowin-creaseddragdueto increasedlift at 6j, t = 90 °. Itis believed that as the jets were blown farther for-
ward, the increased downwash induced at the hori-zontal stabilizer and the increased upwash induced at
the canard generated the incremental aerodynamic
loads shown sketched in figure 13. Because of theorientation of these surfaces in the rollout configura-
tion, these increments reduced the drag on the con-
figuration. Since no flow visualization was available,however, these interpretations are strictly specula-
tive; yet, they do appear to explain the characteris-tics seen in the aerodynamic data.
Comparison With the Simulation DataBase
The static data used in this comparison were pro-
vided by the McDonnell Aircraft Company basedon a six-degree-of-freedom interpolation of the wind-tunnel data from reference 12 used in the construc-
tion of the simulation data base. There are two ma-
jor differences between that static wind-tunnel test
(the procedure described in ref. 12) and the moving-
model test performed at the VRF. First, the VRFdata were obtained while simulating a rate of descent.
Second, the wind-tunnel measurements wcrc made
in the presence of a ground boundary layer that has
been shown to have a significant impact on the devel-
opment of the ground vortex created by vectored jets
near a ground board. This impact is detailed in refer-ence 11. In short, the presence of a ground boundary
layer allows the ground vortex to penetrate signifi-cantly farther upstream (approximately 30 percent)
than would be possible in its absence. These twodifferences are believed to bc the source of the dif-
ferences between the two data sets discussed below.
Other differences considered less significant betweenthe tests are outlined in table III.
It should also be pointed out that the plots pre-
Sented for the wind-tunnel data at 6j,l = ll0° arebased largely on interpolations and, to some ex-
tent, extrapolations. For this nozzle design, reversedthrust is not intended to be used on approach. There-
fore, the wind-tunnel test of the approach configura-
tion of the S/MTD was not conducted through full
height transition with reversed thrust. The thrust
vector angle of 110 ° was tested out of ground effect
and at h/b = 0.35 in the approach configuration;however, at wheel touchdown height it was tested
only in the rollout configuration (i.e., with low an-
gles of attack and low lift configuration). The plots
represent the best approximation of the simulationdata base based on that information.
To a lesser extent, the other plots are also based
on interpolations of the data used in the simulation
data base. For example, the wind-tunnel data were
obtained at _j,l = 45°, 65°, 800, and 110 °, whereas
the moving-model data were obtained at _j,l = 45°,60 ° , 80 ° , and 110% For comparison, the wind-tunnel
results at 6j,l = 45° and 65 ° were interpolated to
_j,l = 60°"
In figure 14(a), the lift increment in ground ef-fect for the approach configuration has been plotted
for 6j,l = 45° and 60 °. As height decreases to touch-down height, the static wind-tunnel data consistently
predict a greater lift increment due to ground effect
than that predicted by the VRF data set. This dif-ference is attributed to the effects of rate-of-descent
modeling in the VRF. Once at the minimum ground
height for some time, the results from the VRF testsare seen to have the same steady-state lift-incrementlevels as those in the wind-tunnel data base.
Figure 14(b) illustrates the effect of vectoring the
jets farther forward. The presence of the ground
boundary layer is seen to have a greater effect. For
both _j,t ---- 80° and _j,l = 110°, not only is the liftincrement different as h/b reduces to the minimum
ground height but also the steady-state levels mea-sured once the models were at that minimum heightare different. The reason for the differences at the
minimum ground height is believed to be due to thepresence of a ground boundary layer in the wind-
tunnel testing. The differences at the other ground
heights are due to both the rate-of-descent modeling
in the VRF and the presence of a ground boundary
layer in the wind-tunnel testing--these two effectscannot be separated for this particular set of data.
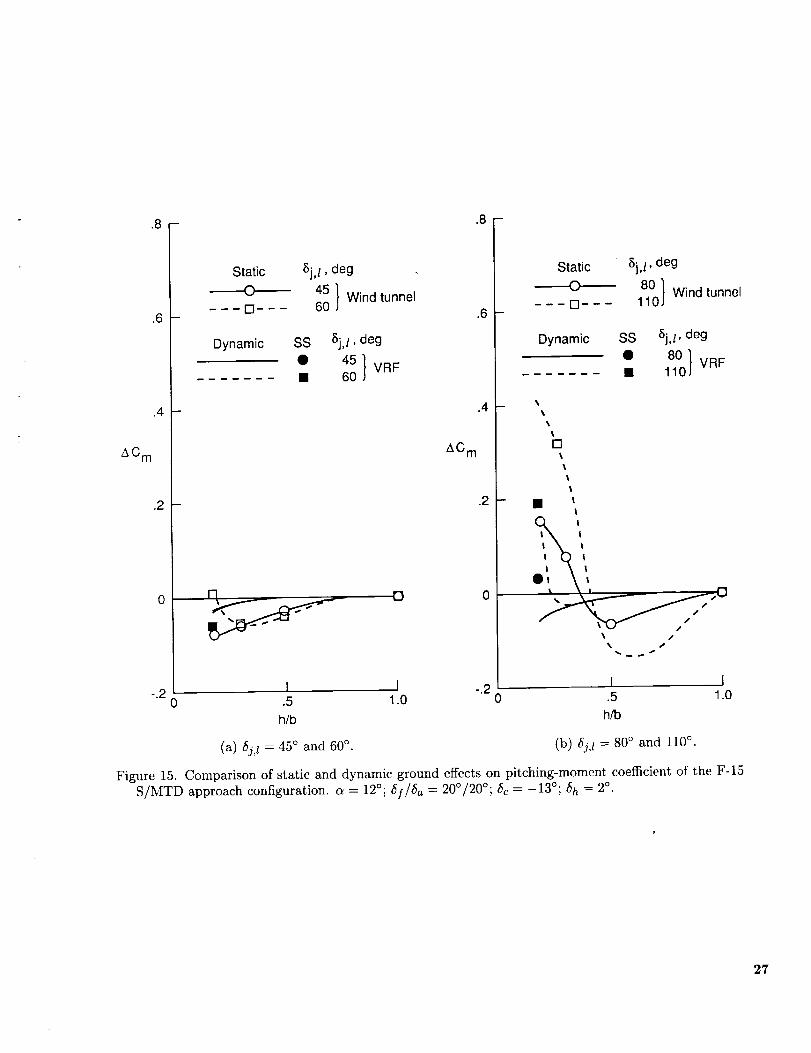
The differences in pitching moment are similarly
illustrated in figure 15. At 6j,l = 45°, much likethe results seen for the lift coefficient, the wind-
tunnel data base predicts a greater nose-down pitch-
ing moment than the dynamic measurements from
the VRF as the model height is reduced to the min-
imum ground height. However, once the model was
at that minimum height for some time and the VRFflow field transitioned to a steady state, the levels
of nose-down pitching moment measured by the two
test techniques are nearly equal. Again, this differ-ence at heights greater than that corresponding to
wheel touchdown is attributed to the modeling of a
rate of descent in the VRF testing.
As the jets were vectored further to 8j,l = 60°,the comparison is similar down to a model height
of approximately h/b = 0.3. Below that height thewind-tunnel data base indicates that the configura-
tion experienced progressively less nose-down pitch-
ing moment as the model approached the ground.This is, again, believed to be due to the presenee of
the ground boundary layer in the wind-tunnel test-
ing. This boundary layer allows the vectored jets
m
8

to penetratefartherupstreamalongthewallbeforeformingthegroundvortex.In thissituationit isbe-lievedthat the groundvortexhasdevelopedunderthe horizontalstabilizerand the low-pressurevor-tex hasreducedthe lift on that surface. Greaterpenetrationof thegroundvortexshouldalsoinducegreaterupwashat the wing. Thenet effectwouldbeasshownin figures14and 15: increasedsteady-statepitching-momentincrementandnodifferenceinlift incrementbetweentheVRF dataandthewind-tunneldatabase.
Theeffectof the groundboundarylayerisevenmorepronouncedasthe jets arevectoredfartherforward. In theseconfigurations,moreupwashisindicatedat thecanardin thewind-tunneldatabasethanwasindicatedin the VRF resultsbecausethegroundvortexcouldnot penetrateasfar upstreamin theabsenceof agroundboundarylayer.
Similarresultswerefoundin the dragmeasure-mentsasshownin figure16. Again,at ¢_j,l = 45°,where the jets are blown well aft, the presence of the
ground boundary layer in the wind-tunnel test hadlittle effect on the steady-state aerodynamics, but as
the thrust was directed progressively farther forward,
the boundary-layer effect was intensified as was seen
in both lift and pitching moment. For all settings, a
significant effect is evident because of rate-of-descent
modeling in the VRF at aI1 model heights greater
than the minimum height.
Concluding Remarks
A moving-model ground-effect testing method
has been used to study the influence of rate of de-
scent on the aerodynamics of the F-15 STOL and
Maneuver Technology Demonstrator (S/MTD) con-
figuration for both the approach and rollout phases
of landing. The approach phase was modeled forthree rates of descent, and over the small range
of rates of descent tested, no significant differences
could be seen in the results. However, a compar-
ison of the rate-of-descent results with predictions
from the F-15 S/MTD simulation data base (predic-tions based on data obtained in a wind tunnel with
zero rate of descent) showed significant differencesdue both to the rate of descent in the moving-model
test and to the presence of the ground boundary
layer in the static wind-tunnel test. Relative to the
simulation data base predictions, the rate-of-descent
modeling produced substantially less lift increase in
ground effect, less nose-down pitching moment, and
less increase in drag. These differences became morc
prominent at the larger thrust vector angles.The differences between the static and dynamic
ground-effect measurements are significant, and it
appears that the dynamic technique more accurately
represents aircraft approach conditions. This im-
plies a need for dynamic ground-effect testing on
future configurations that utilize vectored thrust on
approach.The results of this investigation indicate no
safety-of-flight problems with the lower jets vcctored
up to 80 ° on approach. The results also indicate that
this configuration could employ a nozzle concept us-
ing lower jet vector angles up to 110 ° on approach ifa "no-flare" approach procedure were adopted and if
inlet reingestion does not pose a problem.
NASA Langley Research CenterHampton, VA 23665-5225April 24, 1990
Acknowledgment
The author would like to thank Garrett Billman
of the McDonnell Douglas Corporation for providing
the predictions on the aerodynamic characteristics of
the F-15 S/MTD used for comparison in this report.These predictions were made based on the simulationdata base.
9

Appendix
Special Corrections
In moststeady-statewind-tunneltestsit isassumedthat
_ k Axi = F_ron
i=I
(assuming small interactions between channels) where k is the balance sensitivity constant, Ax
is the one-dimensional balance deflection, Facto is the aerodynamic force in the x-direction,
and n is the number of samples averaged for each point. The data are aVeraged t6:remove
high-frequency variations between points_ some_f which are caused by vibrations of the model.
In dynamic testing, however, averaging of samples is not desired because meaningful high-
frequency information can be lost. Making dynamic force and moment measurements on
a moving model presents a unique problem because the driving system imposes additional
vibrational loads on the model that can mask the meaningful measurements.
In this investigation, the system of the model, balance, and support system was treated as
a spring-mass-damper system and the various loads measured by the balance were computed
in an effort to remove the unwanted vibratory loads from the meaningful data. Following is a
derivation of the type of equation used. In this demonstration, the equation will be derived for
one degree of freedom only in this ease, the axial direction on the model.
According to Newton's second law of motion for a one-dimensional spring-mass-damper
system on a fixed base in a vacuum,
m_kM + cxM + kxM = 0
In this equation, m is the mass of everything on thc model side of the strain gauges of the
balance (the spring), c is the internal damping of the balance, and k is the spring constant
of the balance. The subscript M denotes the motions of the mass on the model side of the
balance. If the base of the systcm is allowed to move, the equation becomes
mx M T cjc M - c._ B + kx M - kx B =0
The subscript B refers to motions of the base of the system. These equations can be found
in reference 13. If the system is then placed in a homogeneous atmosphere, an aerodynamic
damping term is also included. For this one-dimensional study of the axial motion of the model,
this damping force is known to be of the form of the aerodynamic axial force defined as CAP_-_ 2
so that the equation becomes
C pS.2A _-XM -1-rnxM A- c A j2 A- k Ax = 0
If the flow field is then permitted to have an unsteady component (in this case due to the
effect of upwash as the model enters ground effect and the effects of thrust reversers near the
ground), this will also be represented as an aerodynamic damping term. The equation thentakes the form
Let C_4 = -CA_-, and then separate XM into a steady component XM,SS and an unsteady
component 2M,osc. This latter component represents the component of the velocity generated
by the model vibrations and results in unwanted aerodynamic loads that contaminate the
-i
K=
10

balanceoutput.The term XM,ss represents the steady-state forward velocity of the model and
is, on the other hand, meaningful. With these changes the equation becomes
Cp 4 (:_2M,SS + X'2FF) = k Ax + c Aj_ + rrtXM -- CAXM,os c'" 2
t .2The term CAXM,os c is very difficult to approximate because CA is most likely not constant
with time on an oscillating model. Reference 14 shows that because of viscosity, aerodynamic
effects require a finite amount of time to achieve a steady-state level. That is, in fact, the very
premise for the need for this test technique. Because of the inability to solve for this component,
no attempt was made to remove it from the results mathematically. The term _M, however,
was measured and the inertial term mxM can be removed from the data. If it is assumed that! "2
the balance damping is small with respect to the inertial term and that the term CAXM,os c will
be faired by hand from the resultant aerodynamic loads, the equation becomes
Faero = k Ax + m_ M
This is the form of the equation for a one-dimensional system. When this is expanded into
six degrees of freedom (and Faero in the axial direction is replaced by FAF), the matrix becomes
PNF
FpM
FRM
FyMYsv
AF
= PM
[SFJ
-m
0
+--m_
0
0
o-m 0]om m_ 0 rn_ 0-m_ -Iy 0 0
0 0 -Ix 0 -m_
m_ 0 0 Iz
0 0 m_ mS_ y
Clearly, this can be greatly simplified if the model center of gravity is driven to the moment
center of the balance (i.e., if 5: = _ = _ = 0). If done, the equations simplify to the linear
systemFNF = NF - rn_
FAF = AF + m_
FpM ----PM - Iyil
FRM = RM - Ixp
FyM = YM + I Zi"
FSF = SF + m_)
This is the form of the equations used in the data analysis. In this form the moments
of inertia Ix, Iy, and I Z could be measured directly through the data acquisition system
by shaking the model randomly and recording the accelerations and balance loads. If the
aerodynamic loads are assumed to be small, each moment of inertia is the relationship between
a particular balance output and a particular accelerometer output.
As mentioned earlier, an aerodynamic damping term still remains in the resultant forces and
moments, and therefore it is necessary to remove this by hand fairing the data. Also uncertain
is the effect of 5:M,os ¢ on :rFF. That is, how does the oscillating model influence the development
of the ground-effect flow field? The present investigation did not answer this question.
11
References
1. Schade, Robert O.: Ground Interference Effects. NASA
TN D-727, 1961.
2. Thomas, James L.; Hassell, James L., Jr.; and Nguyen,
Luat T.: Aerodynamic Characteristics in Ground Prox-
imity. Powered-Lift Aerodynamics and Acoustics, NASA
SP-406, 1976, pp. 145 158.
3. Kotansky, D. R.; and Glaze, L. W.: STOL Land-
ing Thrust Reverser Jet Flowfields. Proceedings of
the 1985 NASA Ames Research Center's Ground-Effects
Workshop, Kerry Mitchell, ed., NASA CP-2462, 1987,
pp. 289 308.
4. Kemmerly, Guy T.; and Paulson, John W., Jr.: Investiga-
tion of a Moving-Model Technique for Measuring Ground
Effects. NASA TM-4080, 1989.
5. Roberts, Franklin D.: The F-15 STOL and Maneuver
Technology Demonstrator (S/MTD) Program. Proceed-
ings of the International Powered Lift Conference, P-203,
Soc. of Automotive Engineers, Inc., 1988, pp. 705 714.
(Available as SAE Paper 872383.)
6. Satran, Dale R.; Neuhart, Dan; Holbrook, G. Thomas;
and Greene, George C.: Vortex Research Facility Im-
provements and Preliminary Density Stratification Effects
on Vortex Wakes. AIAA-85-0050, Jan. 1985.
7. Maskew, Brian: Prediction of Subsonic Aerodynamic
Characteristics: A Case for Low-Order Panel Methods.
J. Alter., vol. 19, no. 2, Feb. 1982, pp. 157-163.
8. Joshi, P. B.: Generic Thrust Reverser Technology for
Near Term Application. Volume 1. Background and Pro-
gram Overview. AFWAL-TR-84-3094-VOL. I, U.S. Air
Force, Feb. 1985. (Available from DTIC as AD B094 292L.)
9. Schwantes, E.: The Recirculation Flow Field of a VTOL
Lifting Engine. NASA TT F-14,912, 1973.
10. Kemmerly, Guy T.: A Comparison of the Ground Effects
Measured With and Without Rate-of-Descent Modeling
on the F-15 S/MTD Configuration. AIAA-89-3280-CP,
Aug. 1989.
11. Stewart, V. R.; and Kemmerly, G. T.: Characteristics of
the Ground Vortex Formed by a Jet Moving Over a Fixed
Ground Plane. AIAA-89-0650, Jan. 1989.
12. McDonnell Douglas Corp.: STOL and Maneuver Tech-
nology Demonstrator (S/MTD) Program. WRDC-TR-89-
3050, Volume II, U.S. Air Force, May 1989. (Available
from DTIC as AD B133 240.)
13. Gainer, Thomas G.; and Hoffman, Sherwood: Summary
of Transformation Equations and Equations of Motion
Used in Free-Flight and Wind- Tunnel Data Reduction and
Analysis. NASA SP-3070, 1972.
14. Ericsson, L. E.; and Reding, J. P.: Fluid Mechanics of
Dynamic Stall, Part I. Unsteady Flow Concepts. J. Fluids
_J Struct., vol. 2, no. 1, Jan. 1988, pp. 1 33.
L
5
12

Table I. Definition of Test Configurations
Configuration a, deg bf/ba, deg 6c, deg 6h, deg 6j, deg
Approach 12 20/20 -13 2 45
12 20/20 -13 2 60
12 20/20 -13 2 80
12 20/20 -13 2 110
Rollout 0 0/0 -10 10 90
0 0/0 -10 10 120
0 0/0 -10 10 135
Table II. Roll Deviations From Horizontal of Principal Surfaces
Roll angle from
Aerodynamic surface horizontal, degCanard ........... 0.40
Wing ............ _0.08Horizontal stabilizer ..... -0.38
Table III. Minor Differences in Testing ConditionsBetween the Wind Tunnel and the VRF
Variable Wind tunnel VRF
Model scale ......... 7.5 percent 8.3 percentTest Mach number ...... 0.18 0.05
Landing gear ........ On Off
Canopy type ......... Two seat Single seat
13

CL 5C
CD
V_
Y
CmZ
Figure 1. Coordinate system used for presentation of results.
Accelerationsection
Decelerationsection
-k
Enclosedtest section
Vehicle
Ground-effectmodel
=
=
Figure 2. Schematic diagram of tile "_F.
14

Support strut, sting,high-pressure air hne,
and inslrumentatio t
Test section ceiling /,1
Voo _-_---_--._-_{_ _ M°delp ath /
Test section floor \
Figure 3. Model passing through test section in the VRF.
37.5
63.75
Cutout for thrustreverser simulator
42.81
28.25c- 9
7.03
'_3 47"3oWing _ .78
Figure 4. Sketch of the F-15 S/MTD model. Linear dimensions are given in inches.
7: * 15

ORIG!NA[ PAGE'
BLACK AIxiD ;_I-I[TJ_ P_HO.][QG]7,_
Figure 5. The F-15 S/MTD model mounted in the VRF.
L-88-2598
16
ORIGINAL PAGE IS
OF POOR QUALITY

5j, l
(a) Side view.
Support block._)
X Air supply line
Choke basket _J
Forwardon model
___ blocSupport
)-- Honeycomb
inserts
Air supplylines
(b) Bottom view.
Figure 6. Sketch of vectored thrust simulator.
17

AC L
.3-
0
Dynamic SS ft/sec
3.54.2• • 4.9
"_ (a) _j,t= 45°.
.5 1.0
h/b
I
1.5
AC L
.3-
.2 --
(b) _,_= 60o.
0 .5 1.0 1.5
h/b
18
A C L 1 ' , . (c) 5j,l = 80 °.
I
0 .5 1.0 1.5
h/b
Figure 7. Effect of model height on incremental lift coefficient of the S/MTD approach configuration atthree rates of descent, a = 12°; (_f//t5 a --_ 20°/20°; 5c = -13°; 5h = 2°.

z_C m
.2-Dynamic SS ft/sec
• 3.5• 4.2_' 4.9
(a) 5j,.t = 45°.
-.2 _ ../
0 .5 1.0
h/b
,J
1.5
.2-
&C m 0
(b) _,z= 60°.
-.2 I I ]0 .5 1.0 1.5
h/b
.2--
AC m 0
(c) 6_,_= soo.
-.2 I I0 .5 1.0 1.5
h/b
Figure 8. Effect of model height on incremental pitching-moment coefficient of the S/MTD approachconfiguration at three rates of descent, a = 12°; 5f/6a = 20°/20°; 5c --- -13°; 5h _= 2o.
19

AC D
AC D
.O6
.O4
.O2
0
.06
.04 1
.02 -
n
0
i Dynamic SS
(a) 5j,t = 45°.
1""__
.5 1.0
h/b
.5 1.0
h/b
_J
ft/sec
3.54.24.9
I
1.5
1.5
.06 -
.04
AC D
.02
I
0 1.5
_, (c)_j,1= s0| o
.5 1.0
h/b
Figure 9. Effect of model height on incremental drag coefficient of the S/MTD approach configuration at
three rates of descent, c_= 12°; 5y/Sa = 20°/20°; 5c = -13°; 5h = 2°.
2O

.3--
r
AC L
.2
Dynamic SS 5j, l ' deg
• 45
80
• 11o
(a) Lift coefficient.
! I I-.1
0 .5 1.0 1.5
h/b
.2
0
\i
I
.((b) Pitching-moment coefficient.
-.2 I I I0 .5 1.0 1.5
h/b
Figure 10. Effect of model height on longitudinal aerodynamics of the S/MTD approach configuration at
four thrust reverser vector angles, a = 12°; 5f/Sa = 20°/20°; 5c = -13°; 5h = 2°.
21
I
AC D
.06 --
.04 --
.02 -
0
-.02 -
-.04 -
Dynamic
\
&
(c) Drag coefficient.
5
h/b
Figure 10. Concluded.
I10
SS 5j I ' deg
• 45
_ 6o80
A 11o
i15
%
=
22

AC L
.2-
.1-
0
Dynamic SS
\ •
--_ (a) Lift coefficient.
.5 1.0
h/b
5j,l, deg
90120135
I1.5
.4-
AC m
.2
0
-.20
- III
A
,_,.,,.. vf r
f
(b) Pitching-moment coefficient.
I I.5 1.0
h/b
i1.5
A C D -.02
0
II(c) Drag coefficient.
I I_04 L0 .5 1.0 1.5
h/b
Figure 11. Effect of model height on longitudinal aerodynamics of the S/MTD rollout configuration atthree thrust reverser vector angles. _ = 0°; 5.f/Sa = 0°/0°; 5c = -10°; 5h = 10 °-
23

.2O
ACL .16
.129O
.4
(a) Lift coefficient.
1 I I I
100 ii0 120 130
5j,l, deg
I
140
=
AC m
.3
.2
.1
090
ent.
1 I , i i i
100 110 120 130 140
5j,l, deg
AC D
.02,
0
-.02 -
(c) Drag coefficient.
-.04 I I I 1 I90 100 110 120 130 140
5j,/, deg
Figure 12. Steady-state effect on longitudinal aerodynamics of operating thrust reverser at wheel
touchdown height in rollout configuration, a = 0°; 5f/6a = 0°/0°; 5c = -10°; _h = 10°.
24

Thrust-reverser-induced
_. Thrust-reverser-,I- induced increment
(-
Figure 13. Incremental loads generated on canard and horizontal stabilizer due to thrust reverser operation
at wheel touchdown height in rollout configuration, c_ = 0°; 5$/Sa = 0°/0°; 5c = -10°; 5h = 10°.
25

AC L
.5 - .5-
.4 -
.3 --
.2 --
,1 --
0
-.1 --
-.2 --
l
Static
Om _ m Elm _ _
Dynamic
5j,l, deg45 Wind tunnel6O J
SS 5j,l, deg
• 45 I VRFJ• 60
AC L
.4
.3
.2
-.1
-.2
/
i I
I I
! I
! I
! I
I I
I I
!,, \ ',
) \',',). \',
0
Static 5j, 1, deg
__ 800 } Wind tunnel
Dynamic SS 5j,I, deg
•. 800} VRF
-.3 I 1 -.3 I I0 .5 1.0 0 .5 1.0
h/b h/b
(a) _j,l = 450 and 60 °. (b) 6j,t = 80° and 110 °.
Figure 14. Comparison of static and dynamic ground effects on lift coefficient of the F-15 S/MTD approach
configuration, a = 12°; _f/_Sa = 20°/20°; _c -- -13°; _h = 2°.
26
.8.8-
Static
Dynamic
$j,l, deg
4s160 Wind tunnel
SS 5j,l, deg
• 45 1• 60 VRF
-.2 0 I j
.6
.4
,_C m
.2
Static 5j, l , deg
ao1110 Wind tunnel
Dynamic SS 5j,l, deg
• 80 1• 110 VRF
[]t
t
t
• iI
'i% d
P
.5 1.0 -.2 I jh/b 0 .5 1.0
h/b(a) 5j,t = 4,5° and 60°.
(b) _j,l = 80 ° and 110%
Figure 15. Comparison of static and dynamic ground effects on pitching-moment coefficient of the F-15S/MTD approach configuration, a = 12o; 6//5 a = 20°/20°; 5c = -13°; 5h = 2°.
2?

.12 - .12 -
.10
.O8
.O6
.O4
.02
0
AC D
-.02
-.04 -
-.06 -
-.08 -
-.10 -
-.12 -
.10
.O8
- .06
_'__ .04
.020
AC D
-.02
Static 8j,l, degO 45 %
I Wind tunnel- - - El- - - 60 J
Dynamic SS 8j, 1 , deg
• 45 I VRFJ• 60
-.04
-.06
-.08
-.10
-.12
f%
-- X
I
I
Static
O
Dynamic
-.14 I I -.14 I I0 .5 1.0 0 .5 1.0
h/b h/b
8j,l, deg
80} Windtunne,
SS 5j,1, deg
•. 8°o}
(a) 5j,l = 45° and 60°. (b) 5j, l = 80 ° and 110°.
Figure 16. Comparison of static and dynamic ground effects on drag coefficient of the F-15 S/MTDapproach configuration, a = 12°; 5[/5a = 20°/20°; 5c = -13°; 5h = 2°,
=
28

Report Documentation PageNational Aeron3ul_CS and
Space Admin,strat_on
1, ReportNAsANO.TP_3000 [ 2. Government Accession No. 3. Recipient's Catalog No.
4, Title and Subtitle
Dynamic Ground-Effect Measurements on the F-15 STOL and
Maneuver Technology Demonstrator (S/MTD) Configuration
7. Author(s)
Guy T. Kemmerly
9. Performing Organization Name and Address
NASA Langley Research CenterHampton, VA 23665-5225
12.
5. Report Date
June 1990
Sponsoring Agency Name and Address 13.
National Aeronautics and Space Administration
Washington, DC 20546-0001 14.
6. Performing Organization Code
8. Performing Organization Report No.
L-16555
i0. Work Unit No.
505-61-71-02
11. Contract or Grant No.
Type of Report and Period Covered
Technical Paper
Sponsoring Agency Code
15. Supplementary Notes
16. Abstract
A moving-model ground-effect testing method has been used to study the influence of rate
of descent on the aerodynamic characteristics of the F-15 STOL and Maneuver Technology
Demonstrator (S/MTD) configuration for both the approach and rollout phases of landing. The
approach phase was modeled for three rates of descent and the results were compared with
predictions from the F-15 S/MTD simulation data base (predictions based on data obtained in a
wind tunnel with zero rate of descent). This comparison showed significant differences due both
to the rate of descent in the moving-model test and to the presence of the ground boundary layerin the static wind-tunnel test. Relative to the simulation data base predictions, the moving-model
test showed substantially less lift increase in ground effect, less nose-down pitching moment, and
less increase in drag. These differences became more prominent at the larger thrust vector angles.
Over the small range of rates of descent tested using the moving-model technique, the effect of rate
of descent on longitudinal aerodynamics was relatively constant. The results of this investigation
indicate no safety-of-flight problems with the lower jets vectored up to 80 ° on approach. The
results also indicate that this configuration could employ a nozzle concept using lower reverser
vector angles up to 1 l0 ° on approach if a "no-flare" approach procedure were adopted and if inlet
reingestion does not pose a problem.
17. Key Words (Suggested by Authors(s))
Ground effects
S/MTDGround testingThrust reverser
Dynamic testing
18. Distribution Statement
Unclassified--Unlimited
Subject Category 02
19. Security Classif. (of this report)Unclassified [[20. Security Classif. (of this page)Unclassified [ 21. No. of Pages [ 22. Price29 A03
NASA FORM 1626 OCT 86
For sale by the National Technical Information Service, Springfield, Virginia 22161-2171
NASA-Langley, 1990

Z