dynamic deformation measurement by the sampling moiré … · 2020-01-10 · research paper dynamic...
TRANSCRIPT

RESEARCH PAPER
Dynamic Deformation Measurement by the Sampling Moiré Methodfrom Video Recording and its Application to Bridge Engineering
S. Ri1 & H. Tsuda1 & K. Chang2& S. Hsu2
& F. Lo2& T. Lee3
Received: 25 July 2019 /Accepted: 5 December 2019# The Author(s) 2020
AbstractMeasuring accurate dynamic deformation distribution for large-scale structures inexpensively and efficiently is a crucial chal-lenge of structural health monitoring. In this study, a simple technique for measuring the deflection and vibration frequency froma captured video, based on the sampling Moiré method is developed. The striking advantage over conventional measurementusing sensors and other imaging techniques are that the developed technique allows accurate measurement of two-dimensionaldeformations at multiple locations as well as the natural frequency of the target structure. Joint Photographic Experts Group(JPEG)-formatted images encoded from the recorded video with Motion-JPEG (MJPEG) format reduced the file size signifi-cantly without degrading the measurement accuracy and applied to deformation measurement. The effectiveness of the devel-oped technique was confirmed through a field experiment of an old bridge in Taiwan. The field experiment demonstrated thatboth deflection and natural frequency of the bridge were successfully measured with higher 0.1 mm displacement accuracy and0.05 Hz frequecy comparable to a conventional microwave radar displacement sensor from 20 m distance.
Keywords Displacement measurement . Phase analysis . SamplingMoiré . Image compression . Bridge . Video record
Introduction
Measuring the static and dynamic displacement of in-servicestructures is an important issue for design validation, perfor-mance monitoring, and safety assessment [1, 2]. For the opti-mum design of structures and preventing unexpected accidents,and other failures, it is crucial to evaluate the displacementdistribution of the target structures in service. Notably, the dis-placement and vibration frequency information are useful tocheck the soundness of infrastructures such as bridges, tunnels,and high-building [3]. Besides, a long-term measurement
allows continuous monitoring of structures and permits safetyoversight so that an immediate warning can be issued if abnor-mal displacement behavior is detected. The commercial sensorssuch as strain gages, fiber Bragg gratings (FBGs) [4, 5], micro-wave radar displacement sensors [6], and laser Dopplervibrometers (LDVs) [7] have been conventionally used formeasuring the displacement and vibration of large-scale struc-tures. Displacement distribution measurement requires severalsensors since the conventional sensors measure at single-point,that leads problem of cost and time-consuming. Thus, the de-velopment of the full-field measurement method capable ofdistributed measurement is desirable.
One approach for measuring displacement distribution infull-field of large-scale structures is the use of image process-ing technique. For instance, Wahbeh et al. [8] presented avision-based approach for measuring displacements of vibrat-ing systems. They used a high-resolution digital camera andtwo high-resolution red light emitting diodes (LEDs) mountedon the measured targets. The center of the red LED spots wasdetermined from nonlinear Gaussian regression curve fit. Leeand Shinozuka [9] also presented a vision-based system forremote sensing of bridge displacement by image processing.The target has four white spots with known geometry andblack background. The center of four white spots was
* S. [email protected]
1 Research Institute for Measurement and Analytical Instrumentation,National Metrology Institute of Japan (NMIJ), National Institute ofAdvanced Industrial Science and Technology (AIST), 1-1-1Umezono, Tsukuba 305-8568, Japan
2 Center for Measurement Standards (CMS), Industrial TechnologyResearch Institute of Taiwan (ITRI), Bldg. 8, 321, Sec. 2, Kuang FuRd, Hsinchu 30011, Taiwan
3 Department of Civil Engineering, National Central University, No.300, Zhongda Rd., Zhongli Dist., Taoyuan City 32001, Taiwan
Experimental Techniqueshttps://doi.org/10.1007/s40799-019-00358-4

determined from the black and white image. In these imageprocessing techniques, however, the accuracy in detection ofthe central position of spots is limited.
Digital image correlation (DIC) technique is another kindof image processing technique for measuring displacementdistributions [10]. DIC technique using random or naturalpatterns can obtain the deformation of the surface by compar-ison of the digital images before and after deformation.Recently the DIC technique was applied to measure the de-flection of a bridge in static test [11] and dynamic test [12–14].This method requires no complicated optical setup. However,DIC technique has a disadvantage that it takes long analysistime to obtain high-resolution results from field experimentssusceptible to random noise and variation in light intensity.
Generally, the measurement accuracy of vision-based sys-tems depends on several parameters, e.g. camera-to-target dis-tance, target pattern features, lighting conditions, cameramounting stability and video-processing methods. Besides,the camera calibration including the camera intrinsic matrix,extrinsic matrix, scale factor, and lens distortion is an impor-tant procedure since the accuracy of camera calibration direct-ly influences the displacement measurement accuracy. Xu andBrownjohn [15] reported a review of machine-vision basedmethodologies for displacement measurement in civil struc-tures based on approximately one hundred papers appeared todate on this subject. According to their review paper, Khucet al. [16] investigated the measurement accuracy of a vision-based system in a laboratory and suggested an accuracy of0.04 mm in a short-range distance (< 14 m). Martins et al.[17] demonstrated the uncertainty evaluation of displacementmeasurement by a vision-based system on a long-span bridgemonitoring test and indicated a standard measurement accura-cy of 1.7 mm in the vertical direction.
In our previous study, a fast and accurate phase measure-ment technique called the samplingMoiré method [18, 19] formeasuring displacement distribution was developed. A regu-lar grating pattern with a known pitch placed on an object tobe measured is captured with a digital camera. The displace-ment is obtained from calculating the phase difference of theMoiré fringe before and after deformation. Unlike the vision-based approach, the sampling Moiré method does not requirecamera calibration and template matching. The camera intrin-sic matrix and extrinsic matrix, scale factor was not used tocalculate the displacement. For the sampling Moiré method,the grating pitch of a repeated pattern in physical size is ameasure to obtain the actual displacement amount.
Consequently, the sub-millimeter-order deflection of alarge crane 10 m long [20] and the thermal deformation ofhigh-temperature piping in a thermal power plant [21] wassuccessfully measured using the sampling Moiré method.These previous studies only utilize a series of photographssporadically taken in static test [20] or semi-static test [21].However, images captured with a high frame rate are
necessary to measure dynamic displacement and vibrationfrequency. Hence, a method for measuring dynamic displace-ment and vibration of structures using a commercial cinemacamera in this study is developed.
Recently, the functions of digital cameras have been re-markably improved in association with the enhancement ofresolution, quality, and frame rate of image. For instance, acommercial cinema camera (Canon, EOS-1Dx Mark II) canrecord 4 K image size (4096 × 2160 pixels) at 60 frames persecond (fps) in Motion-JPEG (MJPEG) format. On the otherhand, this progress causes a concern that the file size of therecorded image augments enormously compared to the con-ventional image processing technique. To overcome this prob-lem, a useful technique where the JPEG compressed imagewas used to reduce the file size is proposed. If an appropriatecompression rate is used, dynamic displacement can be mea-sured with high accuracy. Simulation results indicated that themeasurement accuracy showed no deterioration even if theimage quality was declined by up to 20%. Furthermore, itrevealed that the accuracy was slightly improved with de-creasing image quality in the case of the high noise level.The effectiveness of our developed method was confirmedthrough the application to the displacement and vibrationmea-surement of an old bridge in Taiwan.
Principle
Outline of the Sampling Moiré Method
The basic principle of the sampling Moiré method [18] ispresented in Fig. 1. When a grating of pitch p (in physicalscale, mm) is recorded by a digital camera as shown in Fig.1(a), the recorded intensity of a cosinusoidal grating (Fig.1(b)) with an initial phase can be presented in Eq. (1).
f x; yð Þ ¼ a x; yð Þcos 2πxPþ φ0
n oþ b x; yð Þ
¼ a x; yð Þcos φ x; yð Þf g þ b x; yð Þð1Þ
where a(x,y) and b(x,y) present the amplitude of the gratingintensity and the background intensity, respectively. P is therecorded grating pitch as pixel unit in the image plane, andφ(x, y) is the phase value of the grating.
After performing down-sampling (Fig. 1(c)) and intensityinterpolation (Fig. 1(d)), the multiple phase-shifted fringe pat-terns, fm(x, y, k), can be obtained, expressed as
f m x; y; kð Þ ¼ a x; yð Þcos 2π1
P−1
T
� �xþ φ0 x; yð Þ þ 2π
kT
� �
þb x; yð Þ ¼ a x; yð Þcos φm x; yð Þ þ 2πkT
� �
þb x; yð Þ; k ¼ 0; 1;⋯; T−1ð Þ
ð2Þ
Exp Tech

Then, the phase distribution of the Moiré fringe, φm(x, y),can be calculated by phase-shifting method using discreteFourier transform (DFT) algorithm, as presented in Eq. (3)
φm x; yð Þ ¼ −tan−1∑T−1
k¼0 f m x; y; kð Þsin 2πk=Tð Þ∑T−1
k¼0 f m x; y; kð Þcos 2πk=Tð Þ ð3Þ
In the same manner, the phase distribution of the Moiré
fringe after deformation, φ0m x; yð Þ, can be measured. Finally,
the in-plane displacement is directly obtained from the phasedifference of the phase difference distribution,
Δφm x; yð Þ ¼ φ0m x; yð Þ−φm x; yð Þ, of the Moiré fringe before
and after deformation.
δ x; yð Þ ¼ −p2π
Δφm x; yð Þ ð4Þ
where p is the grating pitch as mm unit in the physical size.Here, the key point of the sampling Moiré method is the
use of the phase information of the low-frequency of a repeat-ed pattern. Therefore, the sampling Moiré method is morerobust to random noise since the high-frequency componentscan be easily removed by a low-pass filter.
Dynamic Deformation Measurement from Video
In this study, the conventional measurement from the sam-pling Moiré method using photographs was extended to thedynamic measurement using video recording. The video anal-ysis allows us to measure dynamic deformation and the vibra-tion of the structures.
Video images of MJPEG format can be divided into eachJPEG image of time-series using FFmpeg [22] that is one ofthe powerful open-source libraries for handling video image.However, the huge file size of the video image compared withthat of the still image leads to difficulty in data handling.Figure 2 illustrates how the file size of the video image isdetermined. The video image size is represented by the mul-tiplication of image size, image quality, frame rate, and record-ing time. Because image size, frame rate, and recording timeare determined from the specification of the camera employedand the conditions of the experiment, only image quality canbe adjusted to diminish the file size. Focusing on the principleof JPEG compression, an approach to obtain an image of asmaller file size without losing measurement accuracy is pro-posed in this study.
Fig. 1 Principle of the samplingMoiré method for in-planedisplacement measurement. (a) Ablack-and-white grating patternwith pitch, p, overlapped with thepositions of CCD pixels (orangeopen squares). (b) Recordedintensity at CCD pixels. (c) FourMoiré fringe patterns by thin outevery four pixels with thesampling interval T (as anexample, T = 4). These patternsdiffer on the choice of thesampling point with the firstsampling point in the left-handside. The process corresponds tothe phase-shifting. (d) Phase-shifted Moiré fringe patterns afterlinear interpolation with twoadjacent sampled data in (c)
Exp Tech

Besides the MJPEG format, there are Motion JPEG,MPEG-4, H.264, and H.265 for standard video compressionin multimedia. MJPEG is a video compression format inwhich each image frame sequence is compressed separatelyas a JPEG image and no temporal compression. Differentfrom MJPEG, MPEG data is compressed spatially and tem-porally as well. In this study, we mainly focus on video datawith an MJPEG format. The application of another videocompression format such as MPEG-4, H.264, and H.265 forhigher file compression is for further study.
Algorithm of JPEG Compression
As well known, the JPEG compression algorithm [23] is oneof the digital image compression standards designed forcompressing both full-color and monochrome images. In theJPEG algorithm, the digital image is compressed bydiscarding the high-frequency components in the image be-cause the low-frequency components are more sensitive to thehuman eye. As well-known, JPEG compression is a wide-spread technique to reduce the image size for general digitalcameras. The compression time can be negligible due to theadvanced development of the image processing engine in thecamera chip for most cases. JPEG compression is achieved ina series of steps, as illustrated in Fig. 3.
Step 1. The pixels of the whole image are grouped intoblocks of 8 × 8 pixels for the RAW image with loss-less compression.
Step 2. A discrete cosine transform (DCT) is applied to eachblock, which generates 1 DC (background) and63 AC (amplitude) components of each spatial fre-quency. Then, each of the 64 DCT components isquantized by a division of the corresponding coeffi-cient in quantization matrix whose coefficients inupper left part are equal to 1 or more, but towardsthe lower right part they are getting larger.
Step 3. Each of the DCT components is rounded to an inte-ger after quantization. Then, many zeros for higherAC components that are close to the right bottompart of the matrix is obtained. The higher frequency
components classified by the threshold value arediscarded.
Step 4. The 64 quantized frequency components areencoded by using a combination of the Run-length encoding and the Huffman coding. Finally,a JPEG image compressed to small file size is gen-erated and saved. The image size depends on theimage quality (IQ).
Combination of the Sampling Moiré Method and JPEGImages
Based on the algorithm of JEPG image compression, the mea-surement accuracy of our methodmentioned in Sec. 2.1 seemsto be insusceptible to JPEG compression if the threshold is setappropriately. This is because repeated patterns used as thetarget marker can be presented by lower frequency compo-nents and the unnecessary higher frequency componentsresulting from noise can be eliminated in the process of imagecompression. The combination of our samplingMoiré methodusing repeated patterns and JPEG compressed images wouldsuit well to displacement distribution measurement. Thus, theJPEG compressed image for measuring the dynamic displace-ment to save the image file size was applied.
Figure 4 shows JPEG compression with a varyingthreshold value. In the DCT basic function consisting of8 × 8 pixels block, the top left corresponds to the DC com-ponent and the bottom right corresponds to the highestfrequency component as shown in Fig. 4(a). In the sam-pling Moiré method, the Moiré fringe pattern by down-sampling procedure against a repeated pattern is a spatiallyenlarged image of the original pattern. Thus, only relative-ly lower frequency components are used for deformationanalysis in the sampling Moiré method. The DC compo-nent (frequency zero) corresponding to the background aswell as higher-frequency components originated fromnoise can be eliminated as unnecessary information.
As shown in Figs. 4(b) and (c), setting the thresholdvalue to retain many frequency components can producea high-fidelity image, but the compression rate of the file
Fig. 2 The block diagram of the file size of video recording. The file sizedepends on the combination of the image size, the image quality, theframe rate, and the recording time. A large image size, high image
quality at high frame rate for a long time recording causes the file sizehuge and data handling difficult
Exp Tech

size becomes small. Conversely, higher data compressioncan be realized by retaining only low-frequency compo-nents. However, some low-frequency components that arerequired for displacement analysis in the sampling Moirémethod may also be eliminated if the threshold value is setinappropriately. The setting of the thresholding value de-termining the image quality and size is crucial in the sam-pling Moiré analysis. Thus, the optimum compression ratiois explored by computer simulations and a fieldexperiment.
Simulation
Simulation Condition
A two-dimensional grating pattern f (x, y) is simulated using Eq.(1) to investigate the relationship betweenmeasurement accuracyand JPEG IQ. The image size of the simulated grating is 256 ×256 pixels. The MATLAB “peaks” function (https://jp.mathworks.com/help/matlab/ref/peaks.html?lang=en) wasadded to the phase term to generate a distorted grating pattern.
Fig. 3 Algorithm and procedureof the JPEG image compression.The original image is compressedby a Discrete Cosine Transform(DCT) calculation and cut thehigh-frequency componentaccording to a thresholding value,i.e., the compression ratio
Fig. 4 Relationship between the remaining frequencies for differentthresholding value (i.e., compression ratio). (a) DCT basis functionsafter the DCT calculation for each 8 × 8 pixels block. The top leftcorresponds to the DC component (background of the image), and thebottom right corresponds to the highest frequency component (unwanted
noise for the SM). The low-frequency component (useful signal for theSM) is near the DC component. (b) High image quality for low imagecompression, and (c) Extremely low image quality for high imagecompression by changing the thresholding value
Exp Tech

f x; yð Þ ¼ 255 0:5þ 0:3cos 2πxPþ peaks
� �þ noise x; yð Þ
n o
ð5Þwhere x, y are the horizontal and the vertical coordinates in
the image plane, P is the grating pitch in the x-direction, andnoise (x, y) is the additive random noise. Three different grat-ing pitches of 6.1, 8.1, and 10.1 pixels are specified and thecorresponding down-sampling pitches T are set to 6, 8, and 10pixels, respectively. We assume the noise level (NL) has amean of zero with three different standard deviations of 0,10, and 20%. Besides, images are compressed with elevendifferent IQs of 100, 90, 80, 70, 60, 50, 40, 30, 20, 10 and5% for an original bitmap (BMP) grating image. The meanabsolute error (MAE), the maximum (MAX) and the rootmean square (RMS) phase error between the theoretical phaseand the analyzed phase in the central area with 200 × 200pixels were evaluated.
Simulation Results
Figure 5 shows the dependence of the simulated fringe patternon IQ. The images of Figs. 5(b) and 5(c) look almost the sameIQ as the original BMP image of Fig. 5(a). In the case of IQ =5% as shown in Fig. 5(d), however, the compressed image islargely distorted with striking patterns of the 8 × 8 pixels blocknoise, which can degrade the measurement accuracy.
Figure 6(a) shows the relationship between the image filesize and the different JPEG IQ and BMP file in the case ofnoise level (NL) = 10%. The file size of JPEG IQ = 100%(49 KB) is nearly 5 times smaller than that of the original
Fig. 6 Simulation results for peak = 1: (a) Relationship between theimage file size and the JPEG IQ in the case of NL = 10% with threedifferent pitches P, (b) Dependence of Root Mean Square (RMS) phaseerror on IQF in the case of NL = 10% with three different pitches P. Thetarget domain is the central area of 200 × 200 pixels, (c) Dependence ofthe RMS phase error on IQ in the case of P = 8.1 pixels with threedifferent noise levels. The shaded region shows RMS phase error ofless than 1% of the grating pitch
Fig. 5 Simulated fringe pattern for P = 8.1 pixel, peaks = 1, NL = 10%.(a) Original bitmap (BMP) format without image compression, imagequality (IQ) is (b) IQ = 100%, (c) IQ = 20%, (d) IQ = 5%
Exp Tech

BMP image (262 KB) regardless of pitch size P. The file sizeof JPEG IQ = 20% (5 KB) is 10 times smaller than that ofIQ = 100%. For the IQ range below 60%, the file size is ap-proximately linearly related to JPEG IQ. File sizes of largergrating pitch P are smaller than those of smaller P for all IQrange, but the file size dependence on P is substantially smallas compared the magnitude of file size. Thus, the influence ofthe grating pitch on the file size is negligible in this study.
Figure 6(b) illustrates the dependence of phase accuracy onIQ in the case of NL = 10%. Regardless of grating pitch P, theRMS phase error for the IQ larger than 20% is nearly the same asthat of BMP image as the reference. Notably, the measurementaccuracy of JPEG IQ = 100% is very close to that of the originalBMP image, even though the file size of JPEG IQ = 100% is 5times smaller than that of BMP image. For the IQ smaller than10%, the RMS phase error exceeds 1% of the grating pitch. Thismeans that file compression with IQ less than 10% is unsuitablefor the present image analysis. Table 1 showed the relationshipbetween the measurement accuracy including the MAE, MAXand RMS phase error and the JPEG image quality in the case ofnoise level (NL) = 10% with three different pitches P in details.The trend of the MAE and MAX are similar to the RMS phaseerror.
Figure 6(c) depicts the sensitivity of the RMS phase error toNL for P = 8.1 pixels. In the case of NL= 0%, the RMS phaseerror of JPEG IQ = 100% is almost the same as that of BMPimage. TheRMSphase error gradually increases as IQ decreases.In the case of NL = 10%, RMS phase error is comparable to oreven smaller than that of BMP for IQ larger than 20%. In the caseof NL= 20%, RMS phase error is also comparable to or evensmaller than that of BMP for IQ range larger than 20% althoughthe phase errors are larger than those ofNL = 10%. It is notewor-thy for cases of NL = 10% and 20% that phase errors of the
highly compressed image where IQ ranges from 20% to 60%is somewhat smaller compared with the highest JPEG imagequality of the IQ of 100%. However, when the IQ is equal toor less than 10%, the measurement accuracy is suddenly reducedsince the lower frequency components that are required in theimage analysis would be removed through the image compres-sion, as illustrated in Fig. 4(c). Besides, the relationship betweenthe measurement accuracy including the MAE, MAX and RMSphase error in case of P = 8.1 pixels with three different NL isshown in Table 2. It can be confirmed from these simulationresults that the most appropriate compression rate should be20% to save data amount without degrading the measurementaccuracy.
Field Experiment
Experimental Condition
To demonstrate the effectiveness of our developed method, afield experiment for measuring the deflection of an old bridgein Tawain was carried out. Figure 7 shows the experimentalsetup of the tested bridge in Taiwan. The span length of thebridge is 30mwith a width of 7.5 m. The distance between thecamera and the bridge was about 20 m. The Moiré marker hasa two-dimensional rectangular wave pattern with the pitch sizeof 50mm. A cinema camera (Canon, 1Dc) capable of 4 K-size(4096 × 2160 pixels) with a time resolution of 24 fps, and awide-angle cinema lens (Canon, CN-E24mm T1.5 LF) of afocal length of 24 mm was used to record video. During thefield experiment at night, the camera speed, the aperture, andthe ISO were set to 1/30 s, F2.8, and 500, respectively. Amicrowave radar displacement sensor was also installed tomeasure the displacement at 1/2 point of the inner beam to
Table 1 Relationship between the measurement accuracy including the mean absolute error (MAE), maximum (MAX) and root mean square (RMS)phase error and the JPEG image quality in the case of NL = 10% with three different pitches P
Phase error(rad), P = 6.1 Phase error(rad), P = 8.1 Phase error(rad), P = 10.1
MAE MAX RMS MAE MAX RMS MAE MAX RMS
JPEG Image quality (IQ) BMP 0.039 0.211 0.050 0.037 0.207 0.048 0.041 0.191 0.052
100 0.039 0.212 0.051 0.038 0.211 0.050 0.041 0.192 0.052
90 0.042 0.221 0.054 0.039 0.243 0.048 0.041 0.198 0.053
80 0.038 0.220 0.049 0.037 0.223 0.045 0.040 0.193 0.052
70 0.035 0.198 0.045 0.035 0.195 0.045 0.039 0.186 0.051
60 0.034 0.213 0.044 0.035 0.175 0.045 0.039 0.199 0.050
50 0.033 0.205 0.044 0.035 0.169 0.045 0.038 0.197 0.049
40 0.033 0.251 0.044 0.034 0.173 0.045 0.037 0.183 0.049
30 0.035 0.208 0.045 0.034 0.196 0.044 0.038 0.237 0.050
20 0.039 0.210 0.051 0.036 0.225 0.047 0.038 0.214 0.051
10 0.058 0.391 0.076 0.049 0.252 0.064 0.049 0.305 0.065
5 0.101 0.607 0.135 0.077 0.509 0.108 0.072 0.452 0.098
Exp Tech

compare the measurement accuracy between the sensor tradi-tionally employed and the sampling Moiré method. The usedmicrowave radar displacement sensor can measure the dis-placement with 0.01 mm to 0.1 mm accuracy and maximumdetection range of 150 m, and the maximum detection fre-quency is 20 Hz.
Figure 8(a) shows the overall view image of the testedbridge and the position of grid-pattern markers, and theanalyses image (3800 × 350 pixels) after trimming andgray-scale conversion from the original color JPEG imageis shown in Fig. 8(b). Six markers were attached to the sidewalls of the bridge, as shown in Figs. 8(c) and 8(d). Two
makers and three markers were attached on the outer andthe inner beam, respectively. One grid-pattern M1 was at-tached on the pier wall as the fixed point. Each grid-patternmarker was illuminated with LED light since the experi-ment was conducted at midnight. The videos were takenfrom the direction perpendicular to the bridge, as shown inFig. 7(c). Two trucks with a total weight of 40 tons ranthrough the bridge in parallel at a speed of 5 km/h or10 km/h in the test. The displacement during the truckpassage at the points where the grid-pattern markers wereattached was measured from analyzing the recorded video.We conducted a dynamic test two times under the same
Fig. 7 Experimental setup. (a)Side view, (b) Top view, and (c)Cross section of the bridge (right)and the configuration of thecamera, Moiré markers and theconventional microwave radardisplacement sensor. The distancebetween the camera and thebridge was 20 m. The verticaldisplacement was measured byusing a microwave radar underthe bridge and a corner reflectorattached on the inner beam
Table 2 Relationship between the measurement accuracy including the mean absolute error (MAE), maximum (MAX) and root mean square (RMS)phase error in the case of P = 8.1 pixels with three different NL
Phase error (rad), NL = 0% Phase error (rad), NL = 0% Phase error (rad) NL = 20%
MAE MAX RMS MAE MAX RMS MAE MAX RMS
JPEG image quality (IQ) BMP 0.017 0.069 0.023 0.037 0.207 0.048 0.068 0.335 0.087
100 0.017 0.072 0.023 0.038 0.211 0.048 0.068 0.340 0.087
90 0.018 0.087 0.024 0.039 0.243 0.050 0.069 0.336 0.089
80 0.019 0.090 0.025 0.037 0.223 0.048 0.072 0.338 0.093
70 0.019 0.105 0.026 0.035 0.195 0.045 0.071 0.341 0.092
60 0.021 0.135 0.028 0.035 0.175 0.045 0.067 0.366 0.087
50 0.022 0.116 0.029 0.035 0.169 0.045 0.064 0.337 0.084
40 0.024 0.144 0.032 0.034 0.173 0.045 0.062 0.347 0.080
30 0.027 0.158 0.036 0.034 0.196 0.044 0.059 0.326 0.076
20 0.031 0.211 0.042 0.036 0.225 0.047 0.056 0.316 0.073
10 0.047 0.243 0.061 0.049 0.252 0.064 0.056 0.359 0.073
5 0.077 0.509 0.106 0.077 0.509 0.108 0.079 0.489 0.108
Exp Tech

condition to confirm the reproducibility of the measure-ments. The road was closed during the field experimentfor safety and elimination of external disturbance.
Recorded movies in Motion JPEG format were convertedto the colored JPEG images with a size of 4 K in a time series.Then, the color JPEG image was converted into a gray-scaleimage. The central area of the trimmed gray-scale images with3800 × 350 pixels as shown in Fig. 8(b) was used to analyzedeformation from the sampling Moiré method. The imagesrecorded before the experiment were utilized as the referenceto evaluate the relative displacement between each marker ofM2 - M6 and marker M1 (as a fixed point) during the passageof the trucks.
Judging from the recorded image between two markerswith 14-m-long (M2 and M6) and it corresponds to 3280pixels; therefore, the spatial resolution of the recorded imagewas 0.234 pixel /mm, and the sampling pitch Twas set to 12pixels in the analysis. Figure 9 showed the image processingfor a 2-dimensional rectangular grating to a 1-dimensinalcosinusoidal grating prior apply to sampling Moiré method.Figures 9(a), 9(b) and 9(c) represented the original recordedmarker image, the smoothed image after SMA filter, and the
extracted horizontal grating after a low-pass filter (LFP)against x-direction was applied. The vertical displacement pat-tern from the two-dimensional grating marker is extracted byapplying a simple moving average (SMA) filter with a 3 × 3pixel filter size, and a low-pass filter with the half-kernel sizeof 12 pixels and the cut-off frequency of 0.1 rad.Consequently, a cosinusoidal grating pattern in the y-directioncan be obtained from a 2D rectangular Moiré marker. Then,the deflection can be analyzed by the sampling Moiré methodas mentioned in Sec. 2.1. The average displacements
Fig. 8 Photographs of the targetbridge: (a) overall view, (b)analyses image (3800 × 350pixels) after trimming and gray-scale conversion from the originalcolor JPEG image, (c) mountingposition of markers M1, M2, M3and M4, (d) mounting position ofmarkers M5 and M6. A cornerreflector was installed on the innerbeam (back ofM5) to measure thedeflection by the conventionalmicrowave radar displacementsensor, as shown in Fig. 8(a) and8(d)
Fig. 9 Image processing of the sampling Moiré method to measure thedeflection: (a) original recordedmarker image, (b) smoothed image after asimple moving average (SMA) filter with a 3 × 3 pixels filter size, (c)extracted horizontal grating after a low-pass filter (LFP) was applied
Exp Tech

measured from the central region with 35 × 35 pixels (evalu-ation area) in each marker were evaluated. Besides, displace-ment data was processed by a smooth moving average filterusing 48 data (2 s period) in time-series to obtain a smoothdisplacement curve.
Experimental Results and Discussion
Figure 10 shows the displacement measurements of dynamictest for the truck speed of 5 km/h. Figure 10 (a) shows thedeflection evaluated from the sampling Moiré method. Thesolid and dotted curves at 1/2 point correspond to the displace-ment of the inner and outer beam, respectively. As expected,the displacement was maximized at 1/2 point and declined inorder of 1/4 point and the pier. Displacement at 1/2 point of theouter beam was slightly smaller than that of the inner beam.This might be caused by the smaller weight of the truck on theouter beam than that on the inner beam. Figure 10 (b) showsthe displacement curve of the inner beam evaluated from themicrowave radar displacement sensor. Both displacement be-havior and the largest displacement measured from the con-ventional sensor agreed well with those measured from thesampling Moiré method. The relative difference between thelargest displacement evaluated from the sampling Moiré
method and the conventional sensor was only 0.04 mm or0.5%. The most striking advantage of the sampling Moirémethod is that one-time video recording allows the displace-ments of multiple points with the equivalent accuracy to theconventional sensor. Another dynamic test results under thesame condition are shown in Figs. 10(c) and 10(d). The dif-ference between the largest displacement evaluated from thesampling Moiré method and the conventional sensor was0.03 mm. The similarity with Figs. 10(a) and 10(c) indicateshigh reproducibility of the experiment and the robustness ofour developed method.
Figure 11 shows the deflection and vibration of the innerbeam during the dynamic test at a truck speed of 10 km/h. Thedisplacement curves without applying a smooth moving aver-age filter shown in Fig. 11(a) include both the deflection andvibration components. The time evolution of the deflectionbehavior looks similar to that when the truck speed was5 km/h (Figs. 10(a) or 10(c)). Displacement at 1/2 pointcorresponded well with that evaluated from the sensor shownin Fig. 11(b).
Figures 11(c) and 11(d) show the smoothed displacementcurves where vibration components are eliminated by apply-ing a smoothed moving average filter. The displacement eval-uated from the sampling Moiré method demonstrated similar
Fig. 10 Deflection measurementsof dynamic test for the truckspeed of 5 km/h. (a) measured y-directional displacement at 1/4point, 1/2 point, and the pier ofinner beam from the samplingMoiré method. The deflection at1/2 point of the outer beam isplotted as a broken line, (b)measured y-directionaldisplacement at 1/2 point of theinner beam from the conventionaldisplacement sensor. Anotherdynamic test results under thesame condition obtained by (c)the sampling Moiré method, and(d) the conventional displacementsensor
Exp Tech

behavior as observed when the truck speed was 5 km/h shownin Figs. 10(a) or 10(c) and the maximum displacement at 1/2point corresponded with that measured from the sensor. Thelargest displacements evaluated from the sampling Moirémethod and the conventional sensor were exactly the sameto the second decimal place.
The vibration components are shown in Fig. 11(e) and11(f) are obtained by subtracting the smoothed displacementcurve from the original displacement curve. Note that in thevibration measurement from the sensor shown in Fig. 11(f),vibration is barely observed before trucks approach. A notice-able vibration of two-cycle appears at 28 s when the deflection
Fig. 11 Deflection and vibrationmeasurement results of thedynamic test of a truck speed of10 km/h: (a) the raw displacementcurves at 1/4 point, 1/2 point andpier evaluated from the samplingMoiré method, (b) the rawdisplacement curve at 1/2 pointobtained with the conventionaldisplacement sensor, (c) simplemoving average (SMA) filtereddisplacement curves shown in (a),(d) smoothed displacement curveshown in (b), (e) and (f) vibrationat 1/2 point obtained bysubtracting the smootheddisplacement curve from the rawdisplacement curve, (g) and (h)frequency spectrum of (e) and (h),respectively
Exp Tech
at 1/2 point starts. Then, high-frequency vibration appearsfrom 32 s and continues until 57 s where the deflection dueto truck vanishes. After that, free vibration whose intensitydecreases gradually was observed. These features in vibrationalso are seen in the vibration curve obtained from the samplingMoiré method shown in Fig. 11(e) although high-frequencynoise is superimposed throughout the measurement. The high-frequency noise is considered to correspond to error resultingfrom the fluctuation in image measurement because the noisehas appeared since before trucks approach the measurementpoint. Such a measurement error seems to be inevitable in thepresent experiment conducted at midnight because the camerawas set to a high ISO.
Frequency spectra of the vibration of 1024 data whose timeperiod was depicted in Figs. 11(e) and 11(f) are shown inFigs. 11(g) and 11(h). Although the vibration obtained fromthe sampling Moiré method contained considerable noise,both vibration data have similar frequency characteristics,e.g., relatively high-frequency components ranging from 2 to3 Hz and the maximum frequency component at 2.7 Hz. Themaximum frequency corresponds to the primary natural fre-quency of the bridge. It is noteworthy that the peak power offrequency spectra by the sampling Moiré method is greaterthan that by the sensor, although the higher frequency noiseby the sampling Moiré method is much larger than that by thesensor. This indicates that the sampling Moiré method ismore useful to detect the natural frequency of bridges de-spite large high-frequency noise. In the case of the sam-pling Moiré method, vibration is defined from the relativedisplacement between 1/2 point and the pier. On the otherhand, the conventional sensor measures the vibration froma distance between the 1/2 point and the ground that mightlead to erroneous value owing to the vibration of theground.
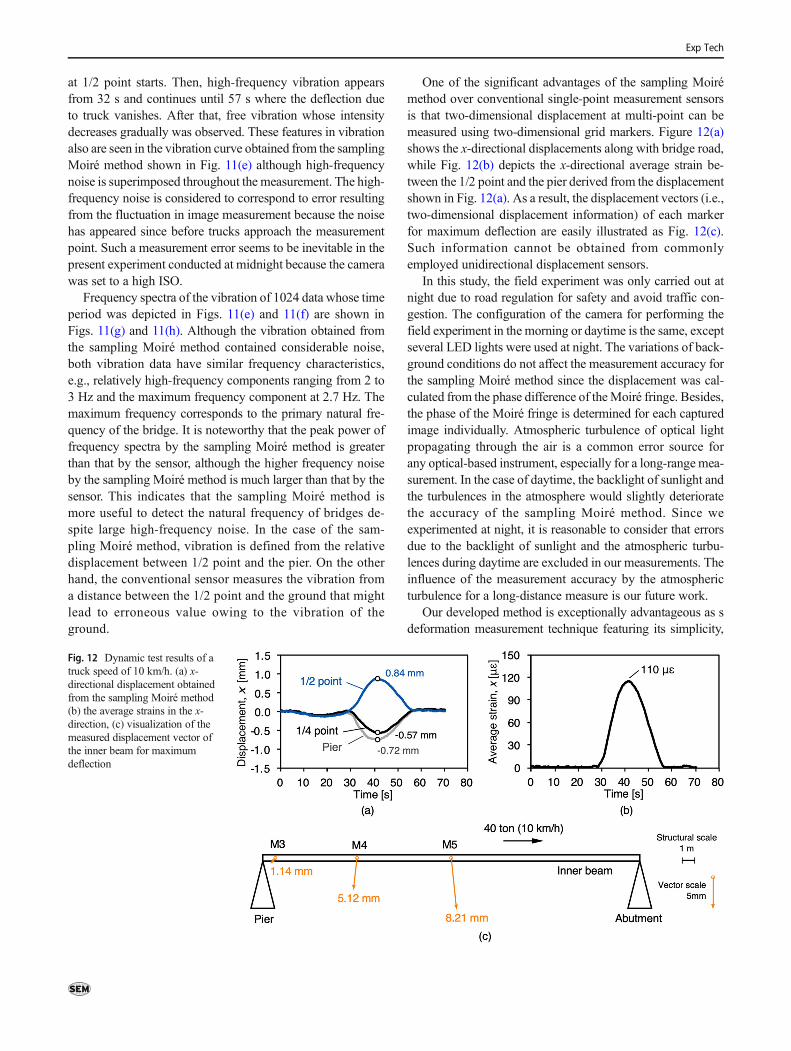
One of the significant advantages of the sampling Moirémethod over conventional single-point measurement sensorsis that two-dimensional displacement at multi-point can bemeasured using two-dimensional grid markers. Figure 12(a)shows the x-directional displacements along with bridge road,while Fig. 12(b) depicts the x-directional average strain be-tween the 1/2 point and the pier derived from the displacementshown in Fig. 12(a). As a result, the displacement vectors (i.e.,two-dimensional displacement information) of each markerfor maximum deflection are easily illustrated as Fig. 12(c).Such information cannot be obtained from commonlyemployed unidirectional displacement sensors.
In this study, the field experiment was only carried out atnight due to road regulation for safety and avoid traffic con-gestion. The configuration of the camera for performing thefield experiment in the morning or daytime is the same, exceptseveral LED lights were used at night. The variations of back-ground conditions do not affect the measurement accuracy forthe sampling Moiré method since the displacement was cal-culated from the phase difference of theMoiré fringe. Besides,the phase of the Moiré fringe is determined for each capturedimage individually. Atmospheric turbulence of optical lightpropagating through the air is a common error source forany optical-based instrument, especially for a long-range mea-surement. In the case of daytime, the backlight of sunlight andthe turbulences in the atmosphere would slightly deterioratethe accuracy of the sampling Moiré method. Since weexperimented at night, it is reasonable to consider that errorsdue to the backlight of sunlight and the atmospheric turbu-lences during daytime are excluded in our measurements. Theinfluence of the measurement accuracy by the atmosphericturbulence for a long-distance measure is our future work.
Our developed method is exceptionally advantageous as sdeformation measurement technique featuring its simplicity,
Fig. 12 Dynamic test results of atruck speed of 10 km/h. (a) x-directional displacement obtainedfrom the sampling Moiré method(b) the average strains in the x-direction, (c) visualization of themeasured displacement vector ofthe inner beam for maximumdeflection
Exp Tech

low-cost, and high accuracy in structural health monitoring.On the other hand, a large volume of the image file is one ofthe obstacles in the practical application, because our pro-posed method utilizes time-series image data that could reach35 MB/s at maximum. Thus, we also investigated how the IQof JPEG files influences on the accuracy of deformationmeasurement.
Figure 13(a) compares the image quality and file size withvarying IQ and the original image (top image). Figure 13(b)enlarges the repeated patterns and the random pattern ofZoom-A and Zoom-B indicated in Fig. 13(a). Though lowerIQ degrades the quality of the image, the feature of the imageseems to be retained up to IQ = 20%. In the case of IQ = 5%,the feature of the random pattern can be indiscernible althoughthe repeated pattern can be recognized. The influence of
compression rate on image quality indicates that samplingMoiré method is much more robust for high compression ratethan other optical methods such as DIC technique. Here, theconversion times from JPEG, IQ = 100% to JPEG, IQ = 50%,JPEG, IQ = 100% to JPEG, IQ = 20%, JPEG, IQ = 100% toJPEG, IQ = 5% were 0.0534, 0.0534, 0.0535 s per frame,respectively, by use of a free software called InfranVIEWoperated on a Windows 7 Professional OS (3.0 GHz IntelXeon CPU E5–2690 v2).
Figure 14 shows the deflection curves measured from im-ages with different IQ. As shown in Figs. 14(a), 14(b), and14(c) whose IQ is 100, 50, and 20%, respectively, the deflec-tion curves are changing smoothly. However, stepwise deflec-tion behavior appears in Fig. 14(d) whose IQ is 5%. Here wefocus on the maximum displacement, which is the most
Fig. 13 Recorded images withvarious image compression: (a)crop whole image (3800 by 350pixels) for displacement analysis,(b) comparison between arepeated pattern (upper) and anatural random pattern (lower) ina zoom area of 100 × 100 pixels
Exp Tech

important parameter in structural healthmonitoring of bridges.As shown in Fig. 10(b), the maximum displacement measuredfrom the conventional sensor was 8.41 mm. On the otherhand, those obtained from the sampling Moiré method was8.45 mm, 8.47 mm, 8.38 mm, and 8.31 mm for IQ = 100, 50,20, and 5%, respectively. Their relative errors for IQ = 100,50, 20, 5% against the maximum deflection of 8.41 mm mea-sured from the conventional sensor are 0.48, 0.71, −0.36, and− 1.19%, respectively. Similar to the simulation results de-scribed in Sec. 3.2, it can be confirmed that even in the caseof high compression rate of 20%, the sampling Moiré methodmeasured deformation with high accuracy less than the rela-tive error of 0.5%. In the case of IQ = 20%, the file size withthe original image size of 570 KB can be reduced to 44 KB,which is more than 90% smaller than the original size. It canbe concluded from these results that our developed method iseffective for measuring dynamic deformation with high accu-racy even if the image files with large compression are used inthe analysis.
Conclusion
In this study, an analytical method based on the samplingMoiré method is developed for measuring dynamic
deformation using a video image where image data aredownsized by appropriately chosen compression rate withoutdegrading measurement accuracy. The displacement resultscan be obtained for any location if there are repeated patternsonto the surface of the structures in the recorded image.Applying to the deformation measurement of the bridge, ourdeveloped method is advantageous to evaluate the deforma-tion and vibration of structures with simple procedures andhigh accuracy. Because there are many old concrete continu-ous beam bridges built on the riverbed in Taiwan, it is not easyfor maintenance staff to perform on-site inspections due toterrain restrictions. Therefore, it is very suitable to measurethe deflection of the bridge using the technology of this study.Themain results and contributions are summarized as follows:
(1) A dynamic multi-point displacement measurement tech-nique utilizing video data based on the sampling Moirémethod was developed.
(2) The developed method can accurately measure the de-flection and vibration frequency with an accuracy com-parable to conventional displacement sensors.
(3) The compressed images with an appropriate com-pression ratio are used in this technique to reducethe image size without deteriorating the measure-ment accuracy.
Fig. 14 Influence of imagecompression rate on evaluateddisplacement in dynamic test at atruck speed of 5 km/h: (a) JPEGIQ = 100%, (b) JPEG IQ = 50%,(c) JPEG IQ = 20%, and (d) JPEGIQ = 5%. The displacements atpositions of pier, 1/4 point and 1/2point of the inner beam are plotted
Exp Tech

(4) The JPEG image quality of 20% found to be a thresholdto balance the image size and measurement accuracyfrom the simulation and field experimental results.
(5) The developed technique was applied to deflection mea-surement of a bridge in Taiwan, and the effectivenesswas confirmed by field experiment.
Acknowledgements We thank Dr. Shoji Kusunoki at MeteorologicalResearch Institute in Japan for the stimulating discussion onmeasurementresults, and Ms. Yuri Noguchi for the figure preparation.
Open Access This article is licensed under a Creative CommonsAttribution 4.0 International License, which permits use, sharing, adap-tation, distribution and reproduction in any medium or format, as long asyou give appropriate credit to the original author(s) and the source, pro-vide a link to the Creative Commons licence, and indicate if changes weremade. The images or other third party material in this article are includedin the article's Creative Commons licence, unless indicated otherwise in acredit line to the material. If material is not included in the article'sCreative Commons licence and your intended use is not permitted bystatutory regulation or exceeds the permitted use, you will need to obtainpermission directly from the copyright holder. To view a copy of thislicence, visit http://creativecommons.org/licenses/by/4.0/.
References
1. Cowing MM, Pate-Cornell ME, Glynn PW (2004) Dynamicmodeling of the tradeoff between productivity and safety in criticalengineering systems. Reliab Eng Syst Saf 86(3):269–284
2. Markowski AS, Mannan MS, Kotynia A, Siuta D (2010)Uncertainty aspects in process safety analysis. J Loss PrevProcess Ind 23(3):446–454
3. Ri S, Tsuda H (2013) Measuring small deformations of large struc-tures using a digital camera. SPIE Newsroom. https://doi.org/10.1117/2.1201305.004877
4. Vohra ST, Todd MD, Johnson GA, Chang CC, Danver BA (1999)Fiber Bragg grating sensor system for civil structure monitoringapplications and field tests. Proc SPIE 3746:32–37
5. Ng JH, Zhou X, Yang X, Hao J (2007) A simple temperature-insensitive fiber Bragg grating displacement sensor. Opt Commun273(2):398–401
6. Li C, Peng Z, Huang T, Fan T,Wang F, Horng T, Munoz-Ferreras J,Gomez-Garcia R, Ran L, Lin J (2017) A review on recent progressof portable short-range noncontact microwave radar systems. IEEETransactions on Microwave Theory and Techniques 65(5):1692–1706
7. Kaito K, Abe M, Fujino Y (2005) Development of non-contactscanning vibration measurement system for real-scale structures.Struct Infrastruct Eng 1(3):189–205
8. Wahbeh AM, Caffrey JP, Masri SF (2003) Avision-based approachfor the direct measurement of displacements in vibrating systems.Smart Mater Struct 12(5):785–794
9. Lee JJ, Shinozuka M (2006) A vision-based system for remotesensing of bridge displacement. NDT&E Int 39(5):425–432
10. Sutton MA, Cheng M, Peters WH, Chao YJ, McNeil SR (1986)Application of an optimized digital correlation method to planardeformation analysis. Image Vis Comput 4(3):143–150
11. Yoneyama S, Kitagawa A, Iwata S, Tani K, Kikuta H (2007) Bridgedeflection measurement using digital image correlation. Exp Tech31(1):34–40
12. Pan B, Tian L, Song X (2016) Real-time, non-contact and targetlessmeasurement of vertical deflection of bridges using off-axis digitalimage correlation. NDT&E Int 79:73–80
13. Tian L, Pan B (2016) Remote bridge deflection measurement usingan advanced video deflectometer and actively illuminated LEDtargets. Sensors 16:1344
14. Hoag A, Hoult N, Take W, Moreu F, Le H, Tolikonda V (2017)Measuring displacements of a railroad bridge using DIC and accel-erometers. Smart Structures and Systems 19(2):225–236
15. Xu Y, Brownjohn J (2018) Review of machine-vision based meth-odologies for displacement measurement in civil structures. J CivStruct Heal Monit 8:91–110
16. Khuc T, Catbas FN (2017) Completely contactless structural healthmonitoring of real-life structures using cameras and computer vi-sion. Struct Control Health Monit 24:e1852
17. Martins LL, Rebordao JM, Ribeiro AS (2015) Structural observa-tion of long-span suspension bridges for safety assessment: imple-mentation of an optical displacement measurement system. J PhysConf Ser 588:12004
18. Ri S, Fujigaki M, Morimoto Y (2010) Sampling moiré method foraccurate small deformation distribution measurement. Exp Mech50(4):501–508
19. Ri S, Muramatsu T (2012) Theoretical error analysis of the sam-pling moiré method and phase compensation methodology forsingle-shot phase analysis. Appl Opt 51(16):3214–3223
20. Ri S, Muramatsu T, Saka M, Nanbara K, Kobayashi D (2012)Accuracy of the sampling moiré method and its application to de-flection measurements of large-scale structures. Exp Mech 52(4):331–340
21. Ri S, Saka M, Nanbara K, Kobayashi D (2013) Dynamic thermaldeformation measurement of large-scale, high-temperature pipingin thermal power plants utilizing the sampling Moiré method andgrating magnets. Exp Mech 53(9):1635–1646
22. FFmpeg. https://ffmpeg.org (Ver. 4.0.4, March 28 2019 Released)23. Pennebaker WB, Mitchellm JL (1993) JPEG still image data com-
pression standard. Springer Science & Business Media, New York
Publisher’s Note Springer Nature remains neutral with regard to jurisdic-tional claims in published maps and institutional affiliations.
Exp Tech