dynamic contrast-enhanced mr imaging applications in head and neck tumors halil Özer 1, ali yusuf...
TRANSCRIPT

Dynamic Contrast-Enhanced MR Imaging Applications in
Head and Neck TumorsHalil ÖZER 1, Ali Yusuf ÖNER 1, Atilla KOKURCAN 1, Merve YAZOL 1,
Utku AYDİL 2 , Yusuf KIZIL 2 , Ali Murat KOÇ 1 , Emin Turgut TALI1
1.Gazi University School of Medicine , Department of Radiology ,Ankara-Turkey
2.Gazi University School of Medicine , Department of Otorhinolaryngology ,Ankara-Turkey

Purpose
• Dynamic contrast-enhanced magnetic resonance imaging (DCE-MRI) has been used for the diagnosis and for monitoring therapeutic response in tumors.
• More recently, pharmacokinetic models have been used to extract parameters related to tumor microcirculation by using DCE-MR imaging in head and neck tumors.
• The purpose of this exhibit is to describe and illustrate feasibility and quantitative permeability values derived from DCE-MRI in different head and neck tumors.

Methods
• Supra- infrahyoid head and neck tumors including nasopharynx, hypopharynx, larynx, salivary glands, oral cavity, paranasal sinuses were included.
• DCE-MRI following intravenous administration of 0,01 mmol/kg of gadodiamide was performed for each patient with a 3T scanner.
• All data sets were transferred to a workstation for image evaluation.

Methods-II
• For quantitative DCE-MRI evaluation, after an image co-registration, a pooled arterial input function obtained from the vertebral artery, in regard of the gadolinium concentration, was used for the modeling procedure.

Methods-III
• For all data sets region of interests were defined within the tumor, muscle and vertebral artery with the help of conventional images.
• Additional ROI were defined for lymph nodes at differents stations bilaterally.
• Ktrans, Kep, Ve were then calculated from DCE-MRI respectively. DCE-MRI findings and quantitative permeability data were evaluated.
Findings-I
Upper Alveolar Ridge&Hard Palate Adenocarcinoma
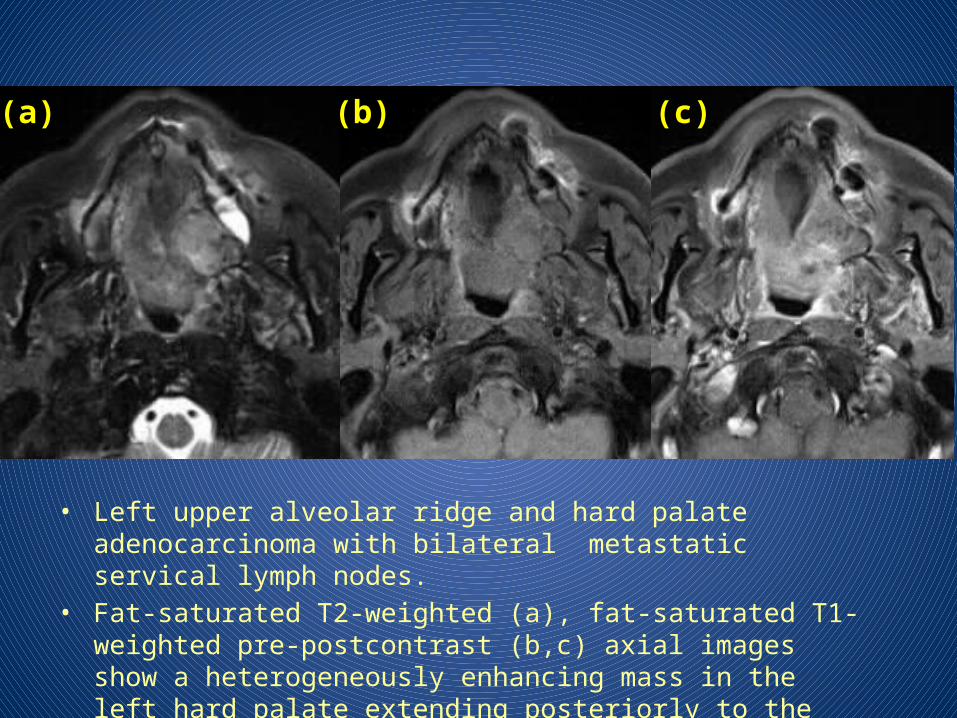
• Left upper alveolar ridge and hard palate adenocarcinoma with bilateral metastatic servical lymph nodes.
• Fat-saturated T2-weighted (a), fat-saturated T1-weighted pre-postcontrast (b,c) axial images show a heterogeneously enhancing mass in the left hard palate extending posteriorly to the upper alveolar ridge.
(a) (b) (c)

• Fat-saturated T2-weighted (d), fat-saturated T1-weighted pre-postcontrast (e.f) axial images show bilateral servical lymph nodes.
(d) (e) (f)
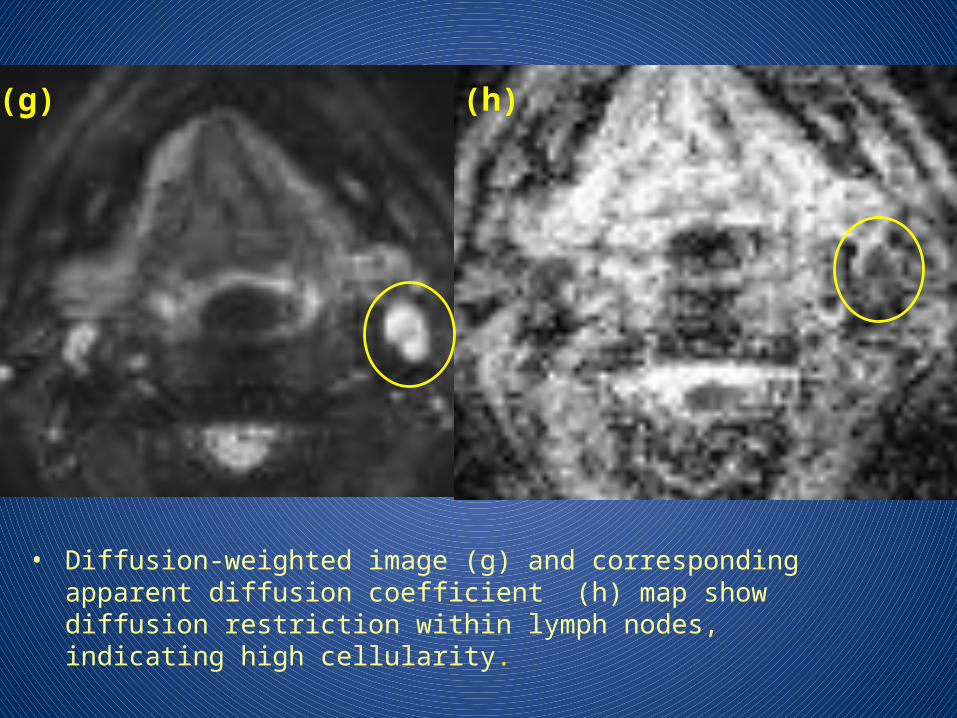
• Diffusion-weighted image (g) and corresponding apparent diffusion coefficient (h) map show diffusion restriction within lymph nodes, indicating high cellularity.
(g) (h)

• DCE-MR images in patient with pathologically confirmed hard palate adenocarcinoma and metastatic lymph nodes.
• Four time-intensity curves of tumor ROI , vertebral artery ROI , muscle ROI and lymph node ROI .
• Tumor time- intensity curve showing rapid early enhancement followed by sustained delayed enhancement. Metastatic lymph nodes time- intensity curve showing rapid early enhancement followed by plateau phase.

Mean Tumor Artery Muscle L.Node
Ktrans 0,194 0,342 0,038 0,167
Kep 0,272 0,832 0,694 0,578Ve 0,709 0,399 0,054 0,294
• Ktrans Map
Kinetic paraemeters derived from dynamic contrast enhanced series of the tumor and lymph node are higher than the referance muscle measurements, reflecting inceased tissue neovascularity.

Findings-II
Maxillary Sinus Squamous Cell Carcinoma
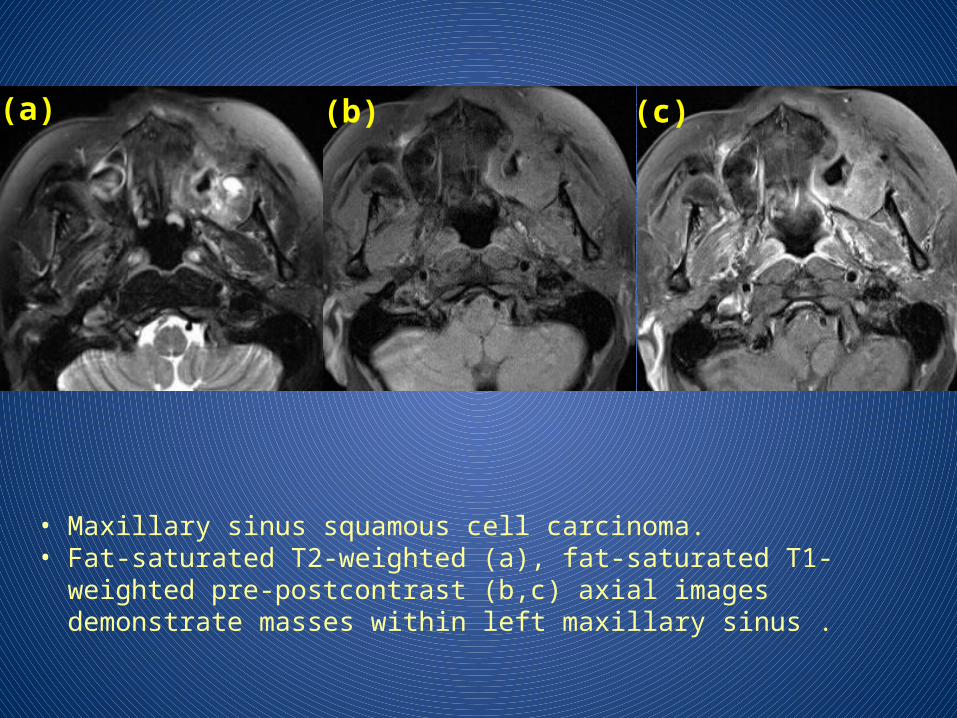
• Maxillary sinus squamous cell carcinoma. • Fat-saturated T2-weighted (a), fat-saturated T1-weighted pre-
postcontrast (b,c) axial images demonstrate masses within left maxillary sinus .
(a) (b) (c)

• DCE-MR images in patient with pathologically confirmed squamous cell carcinoma .
• Three time-intensity curves of tumor ROI , vertebral artery ROI and muscle ROI. Tumor time- intensity curve showing rapid early enhancement followed followed by plateau phase.

• Ktrans Map
Mean K trans , Kep and Ve of tumor values higher than muscle values.
Mean Tumor Artery Muscle
Ktrans 0,320 0,506 0,029
Kep 0,562 1,289 0,120Ve 0,583 0,399 0,313

Findings-III
Non-Hodgkin's lymphoma of maxillary sinus

• Non-Hodgkin's lymphoma of maxillary sinus : Fat-saturated T2-weighted (a), fat-saturated T1-weighted pre-postcontrast (b,c) axial images demonstrate masses within the right maxillary sinus .
(a) (b) (c)

• DCE-MR images in patient with pathologically confirmed non-Hodgkin’s lymphoma of maxillary sinus.
• Three time-intensity curves of tumor ROI , vertebral artery ROI and muscle ROI. Tumor time- intensity curve showing rapid early enhancement followed followed by washout.

• Ktrans Map
Mean K trans , Kep and Ve of tumor values higher than muscle values.
Mean Tumor Artery Muscle
Ktrans 0,317 0,547 0,079
Kep 0,711 1,797 0,306Ve 0,445 0,299 0,264
Findings-IV
Nasopharnygeal Carcinoma
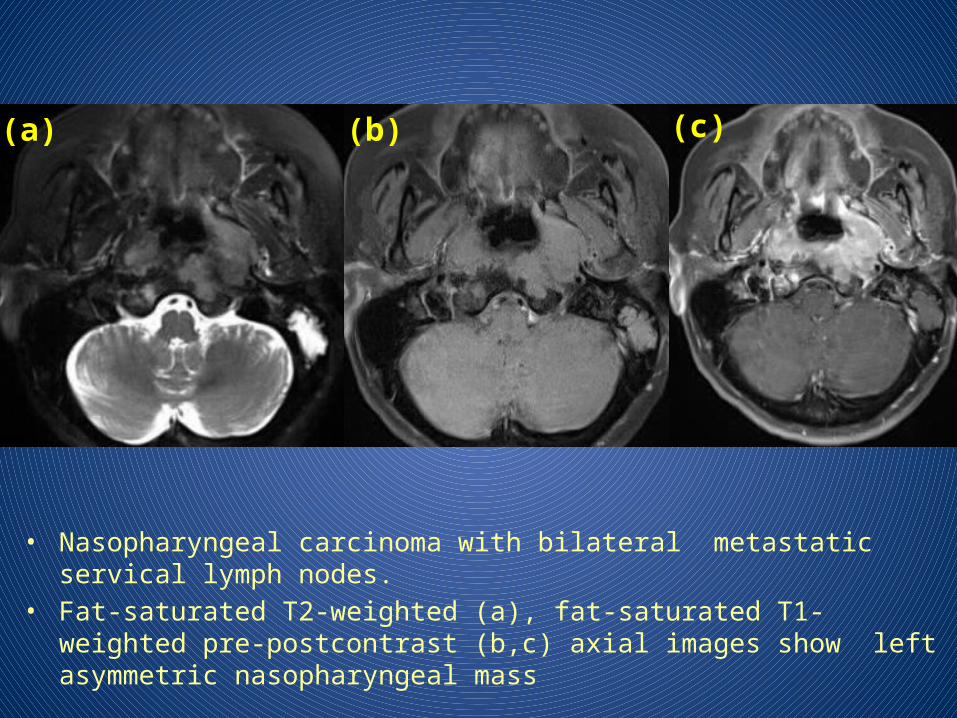
• Nasopharyngeal carcinoma with bilateral metastatic servical lymph nodes. • Fat-saturated T2-weighted (a), fat-saturated T1-weighted pre-postcontrast
(b,c) axial images show left asymmetric nasopharyngeal mass
(a) (b) (c)
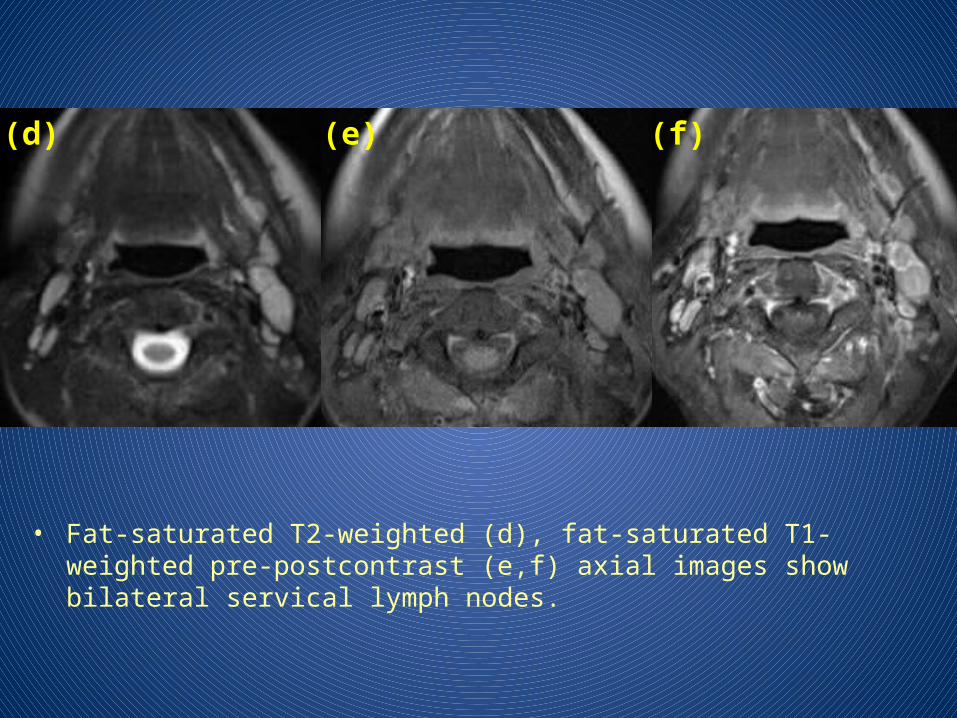
• Fat-saturated T2-weighted (d), fat-saturated T1-weighted pre-postcontrast (e,f) axial images show bilateral servical lymph nodes.
(d) (e) (f)

• Diffusion-weighted image (DWI) and corresponding apparent diffusion coefficient (ADC) map show diffusion restriction within lymph nodes, indicating high cellularity.
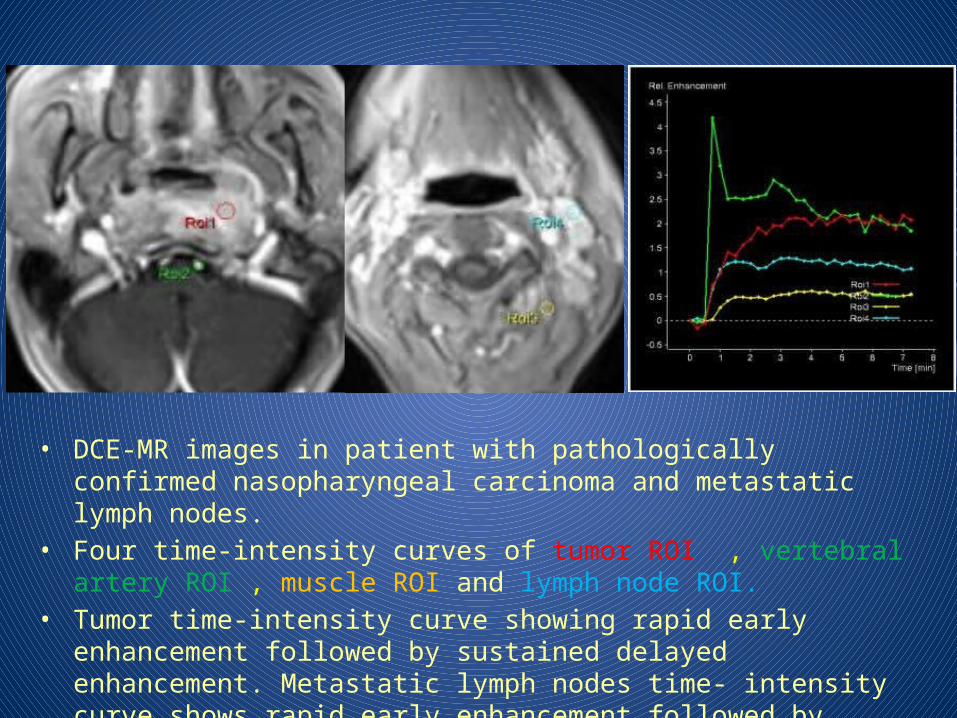
• DCE-MR images in patient with pathologically confirmed nasopharyngeal carcinoma and metastatic lymph nodes.
• Four time-intensity curves of tumor ROI , vertebral artery ROI , muscle ROI and lymph node ROI.
• Tumor time-intensity curve showing rapid early enhancement followed by sustained delayed enhancement. Metastatic lymph nodes time- intensity curve shows rapid early enhancement followed by plateau phase.

• Ktrans Map
Mean Tumor Artery Muscle L.Node
Ktrans 0,184 0,394 0,044 0,122
Kep 0,195 0,824 0,239 0,345Ve 0,942 0,502 0,215 0,355
Kinetic paraemeters derived from dynamic contrast enhanced series of the tumor and lymph node are higher than the referance muscle measurements, reflecting increased tissue neovascularity.
Findings-V
Supraglottic Squamous Cell Carcinoma

• Supraglottic squamous cell carcinoma. Fat-sat T2-weighted (a), fat-sat T1-weighted pre-postcontrast (b,c) axial images show a heterogeneously enhancing right supraglottic mass.
(a) (b) (c)
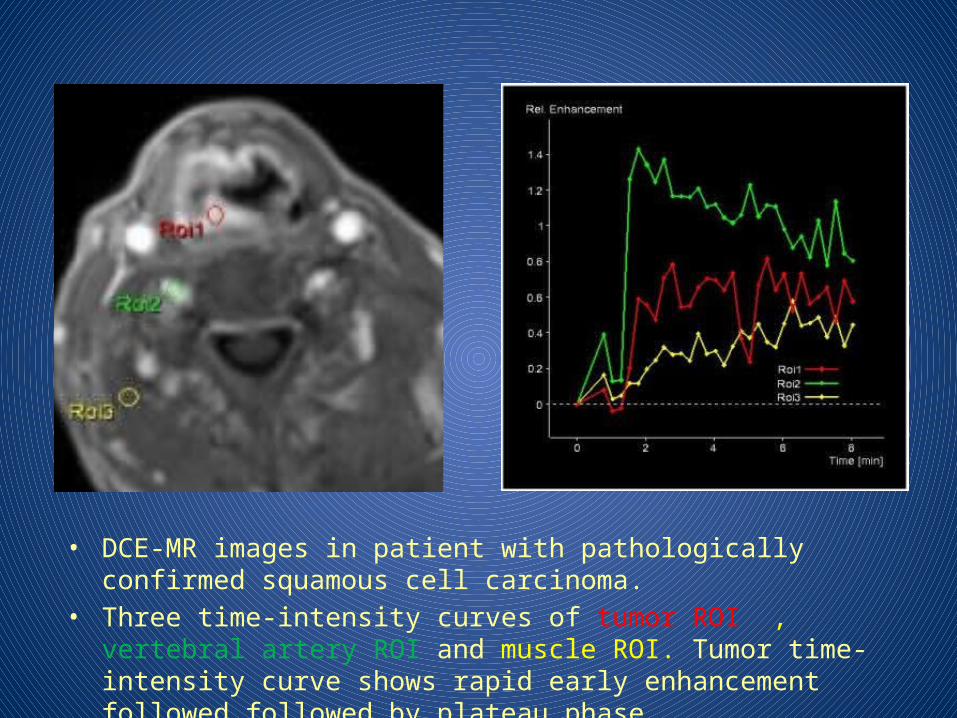
• DCE-MR images in patient with pathologically confirmed squamous cell carcinoma.
• Three time-intensity curves of tumor ROI , vertebral artery ROI and muscle ROI. Tumor time- intensity curve shows rapid early enhancement followed followed by plateau phase.
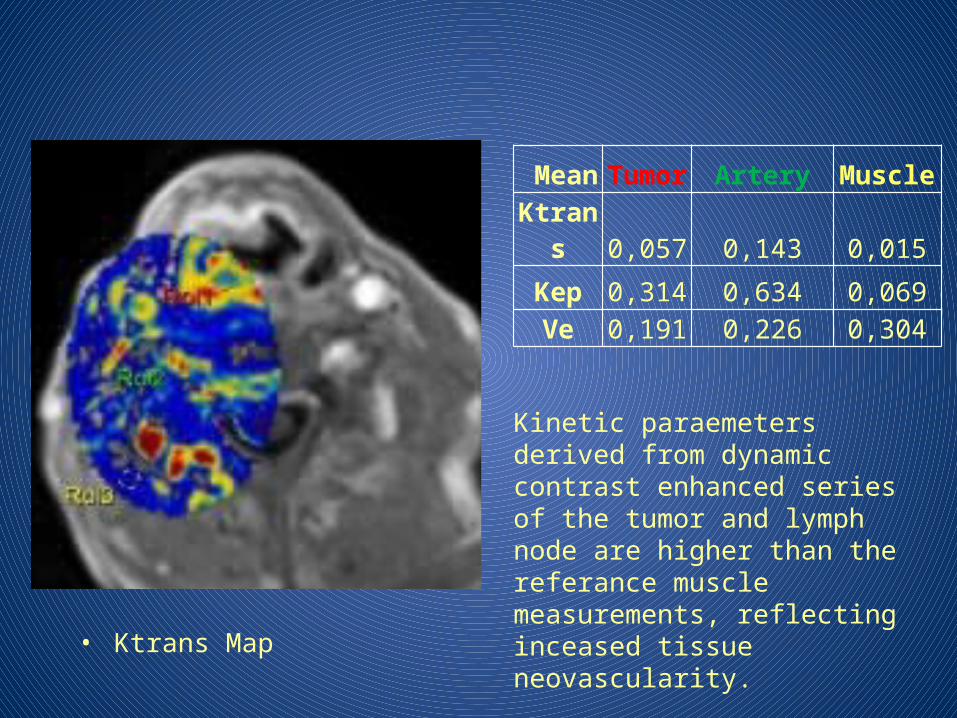
• Ktrans Map
Mean Tumor Artery Muscle
Ktrans 0,057 0,143 0,015
Kep 0,314 0,634 0,069Ve 0,191 0,226 0,304
Kinetic paraemeters derived from dynamic contrast enhanced series of the tumor and lymph node are higher than the referance muscle measurements, reflecting inceased tissue neovascularity.

Findings-VI
Glottic Squamous Cell Carcinoma

• Right glottic scc and metastatic lymph nodes. The glottic level is demonstrated by different sequences: Fat-sat TSE T2-weighted (a), fat-sat SE T1-weighted precontrast (b), fat-sat SE T1-weighted postcontrast (c). TSE, turbo spin echo.
(c)(a) (b)(a) (b) (c)
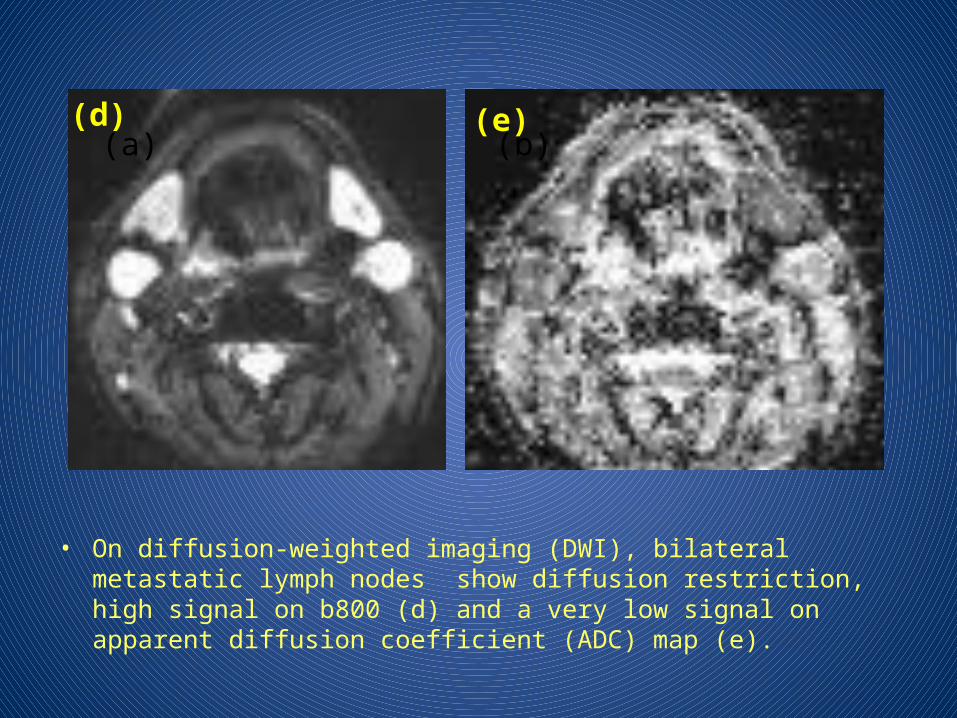
• On diffusion-weighted imaging (DWI), bilateral metastatic lymph nodes show diffusion restriction, high signal on b800 (d) and a very low signal on apparent diffusion coefficient (ADC) map (e).
(a) (b)(d) (e)
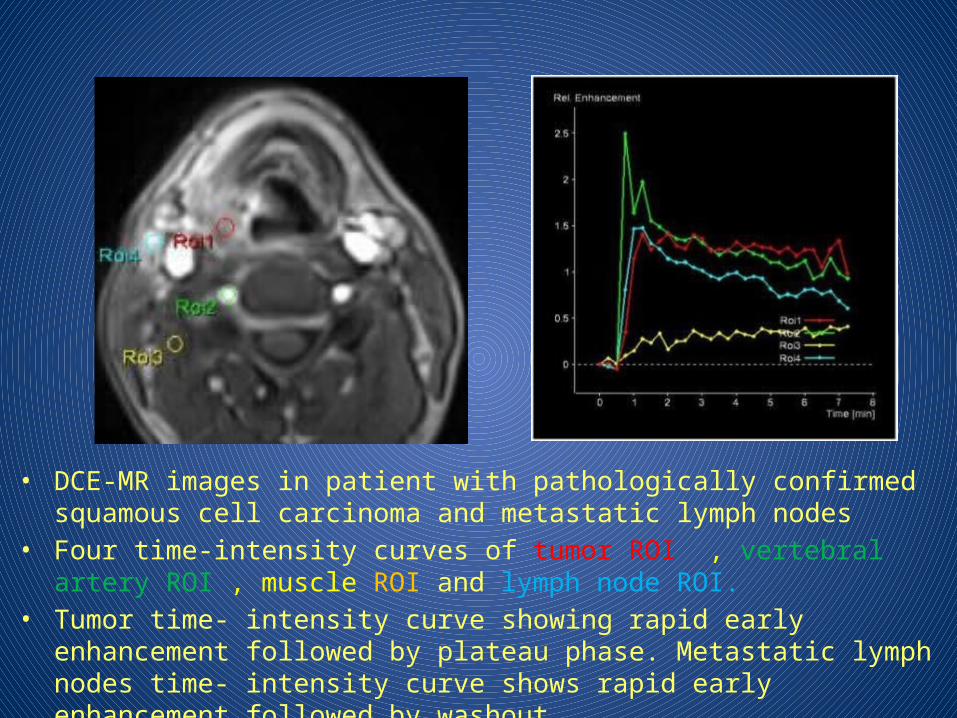
• DCE-MR images in patient with pathologically confirmed squamous cell carcinoma and metastatic lymph nodes
• Four time-intensity curves of tumor ROI , vertebral artery ROI , muscle ROI and lymph node ROI.
• Tumor time- intensity curve showing rapid early enhancement followed by plateau phase. Metastatic lymph nodes time- intensity curve shows rapid early enhancement followed by washout.
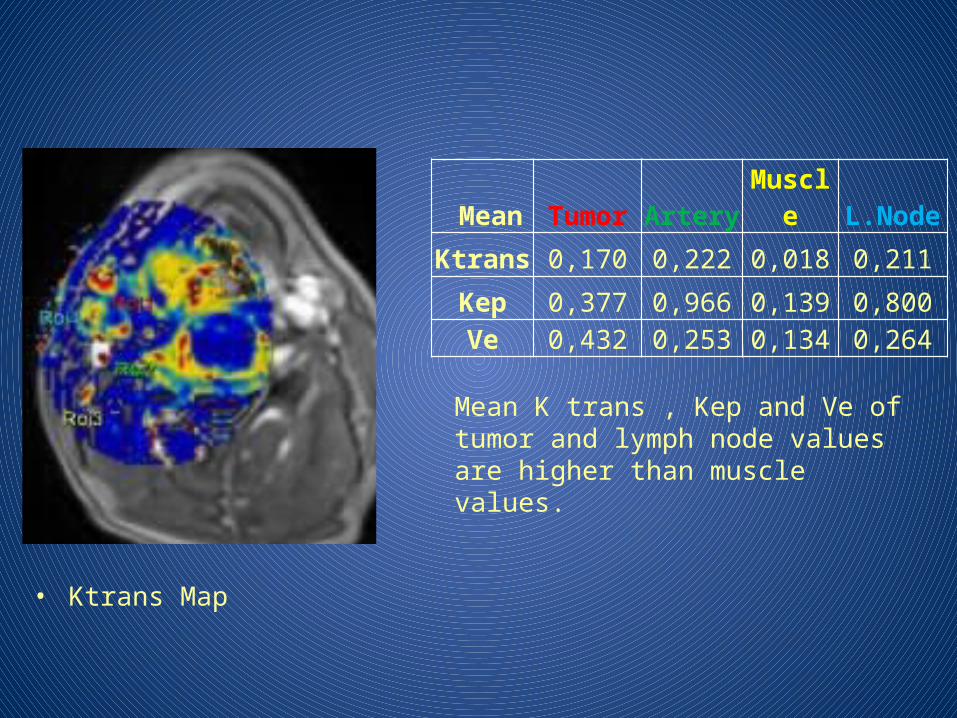
• Ktrans Map
Mean K trans , Kep and Ve of tumor and lymph node values are higher than muscle values.
Mean Tumor Artery Muscle L.Node
Ktrans 0,170 0,222 0,018 0,211
Kep 0,377 0,966 0,139 0,800Ve 0,432 0,253 0,134 0,264

Findings-VII
Pleomorphic Adenoma of Parotid Gland

• Pleomorphic adenoma in right parotid gland . • Fat-saturated T2-weighted (a), fat-saturated T1-weighted (b) axial
images demonstrate a well-circumscribed and lobulated mass in right parotid gland which enhances homogeneously on T1 post-contrast image (c).
(a) (b) (c)
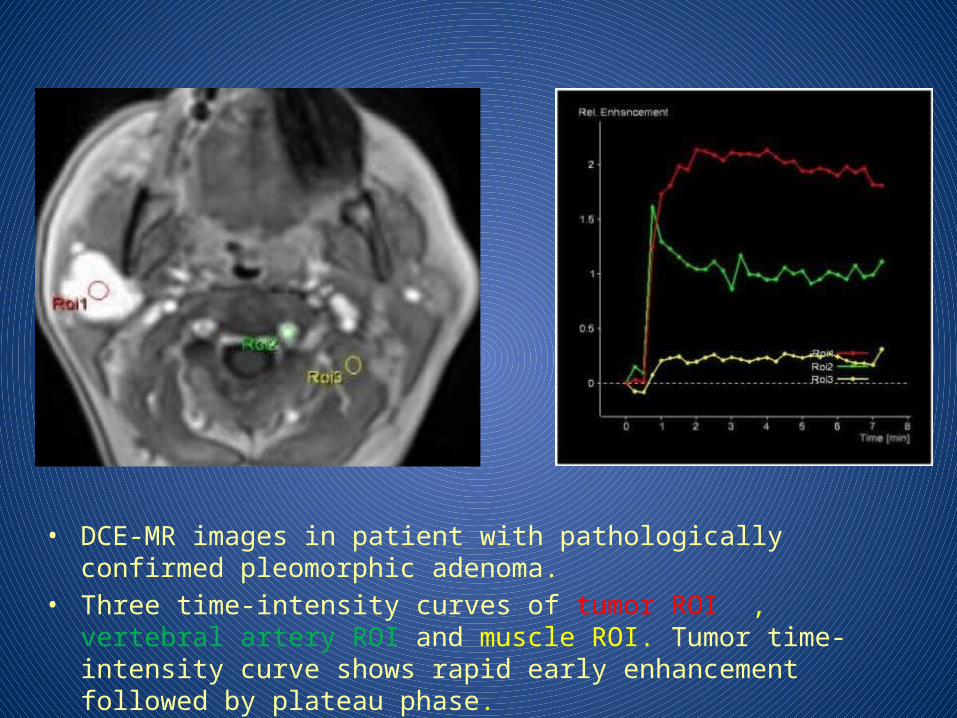
• DCE-MR images in patient with pathologically confirmed pleomorphic adenoma.
• Three time-intensity curves of tumor ROI , vertebral artery ROI and muscle ROI. Tumor time- intensity curve shows rapid early enhancement followed by plateau phase.

• Ktrans Map
• Mean K trans , Kep and Ve of tumor values higher than muscle values.
Mean Tumor Artery Muscle
Ktrans 0,238 0,115 0,032
Kep 0,353 0,472 0,432Ve 0,680 0,227 0,099

Discussion-I
• Architectural and functional abnormalities of blood vessels are a common feature in tumors.
• DCE-MRI enables the quantative assessment of tumor microcirculation properties,including vessel size and distribution,hyperpermeability, flow heterogenity and its spatial distribution.

• DCE-MRI findings and permeability measurements of different head and neck tumors shows favorable correlation in tumor depiction.
• Mean Ktrans, Kep, Ve of the lesion values in patients with head and neck tumors are significantly higher than muscle values.
• Same correlation is also present for metastatic lymph nodes compared to reactive ones and plays an important role in tumor staging.
Discussion-II

Conclusion
• DCE MRI is a straight forward technique that can easily be implemented in to the routine MRI evaluation of H&N tumors.
• Although robust in nature, DCE and derived kinetic parameters are extremely useful for characterising H&N tumors, and may be helpful as an adjunctive method in the evaluation of tumor vascularity and staging.
References
1) King AD, Bhatia KS. Magnetic rezonans imaging staging of nasopharygeal carcinoma in the head and neck World J Radiol 2010;2;159-165
2) Türkbey B. Thamosson D. Pang Y. Bernardo M. Choyke PL. The role of the dynamic contrast enhanced MRI in cancer diagnosis and treatment Diagnosınterv Radiaol 2010:16;186-192
3)Xiao WW. Lu TX, Zhao C. Su SF. İmpact of intencity-modulated radiotherapy on the 6th edition of UICC/AJCC staging system in nasopharygeal carcinoma Chin J Radiat Oncal 2010:181-184
4) Ovrebo Km, Hompland T, Mathiesen B, rofstad EK. Assessment of hypoxia and radiation response in intramuscular experimentaltumors by dynamic contrast –enhanced magnetic resonance imaging . Radiother oncol 2012,102;429-345
5)Comoretto M, Balestreri L,Borsatti E. Detection and restaging of residual and/or recurrent nasopharyngeal carcinoma after chemotherapy and radiation theraphy: comparisonof MR imaging and FDG PET/CT Radiology 2008;249;203-211
6)Ellingen C. Egeland TA. Gulliksrud K. Gaustad JV, Mathiesen B. Rofstad EK. Assessment of hypoxia in human cervical carcinoma xenografts by dynamic contrast-enhanced magnetic resonance imaging Int Radiat oncol Bio Phys 2009:73:838-845
7)Gulliksrud K. Hompland T.Galappathi K. Rofstad EK. Assesment of tumor hypoxia and interstitial flued pressure by gadomelitol-based dynamic contrast-enhanced magnetic rezonans imaging. Radiology Oncol 2011;101;217-222
8)Jansen JF Schoder H, Lee NY et all. Non-invasive assessment of tumor microenvironment using dynamic conrast enhanced magnetic resonans imaging and 18F-fluoromisonidazole pozitron emission tomography imaging in neck nodalmetastases. Int Jradiat Oncol Bio Phys 2010;77:1403-1410
9)Huang B, Wong CS, Whitcher B, at all. Dynamic conrast enhancedmagnetic resonans imaging for characterising nasopharygeal carcınoma; comparison of semiquantative and quantative parameters and correlation with tumour stage . Eur. Radiol 2013
10)Gaustad JV, Brurberg KG, et all Tumor Vascularity Assessed By Magnetic Resonance Imaging and Intravital Microscopy Imaging; Neoplasia (2008) 10, 354–362
11)Dechun Zheng D, Chen Yunbin, Chen Ying, et al. Dynamic contrast-enhanced MRI of nasopharygeal carcinoma: A preliminary study of the correlations between quantitative parameters and clinical stage J. Magn. Reson. Imaging 2014;39;940-948