dynamic conditional correlations
DESCRIPTION
DYNAMIC CONDITIONAL CORRELATIONS. Robert Engle UCSD and NYU and Robert F. Engle, Econometric Services. WHAT WE KNOW. VOLATILITIES AND CORRELATIONS VARY OVER TIME, SOMETIMES ABRUPTLY - PowerPoint PPT PresentationTRANSCRIPT

Robert EngleUCSD and NYU and Robert F. Engle, Econometric Services
DYNAMIC CONDITIONAL
CORRELATIONS
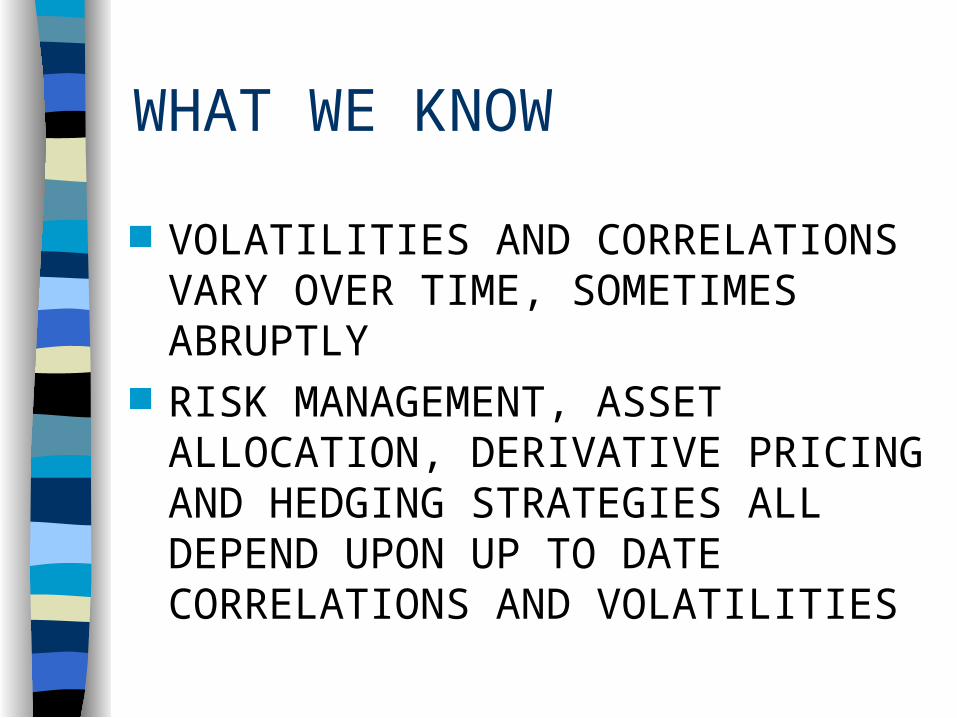
WHAT WE KNOW
VOLATILITIES AND CORRELATIONS VARY OVER TIME, SOMETIMES ABRUPTLY
RISK MANAGEMENT, ASSET ALLOCATION, DERIVATIVE PRICING AND HEDGING STRATEGIES ALL DEPEND UPON UP TO DATE CORRELATIONS AND VOLATILITIES

AVAILABLE METHODS
MOVING AVERAGES– Length of moving average determines
smoothness and responsiveness EXPONENTIAL SMOOTHING
– Just one parameter to calibrate for memory decay for all vols and correlations
MULTIVARIATE GARCH– Number of parameters becomes intractable for
many assets
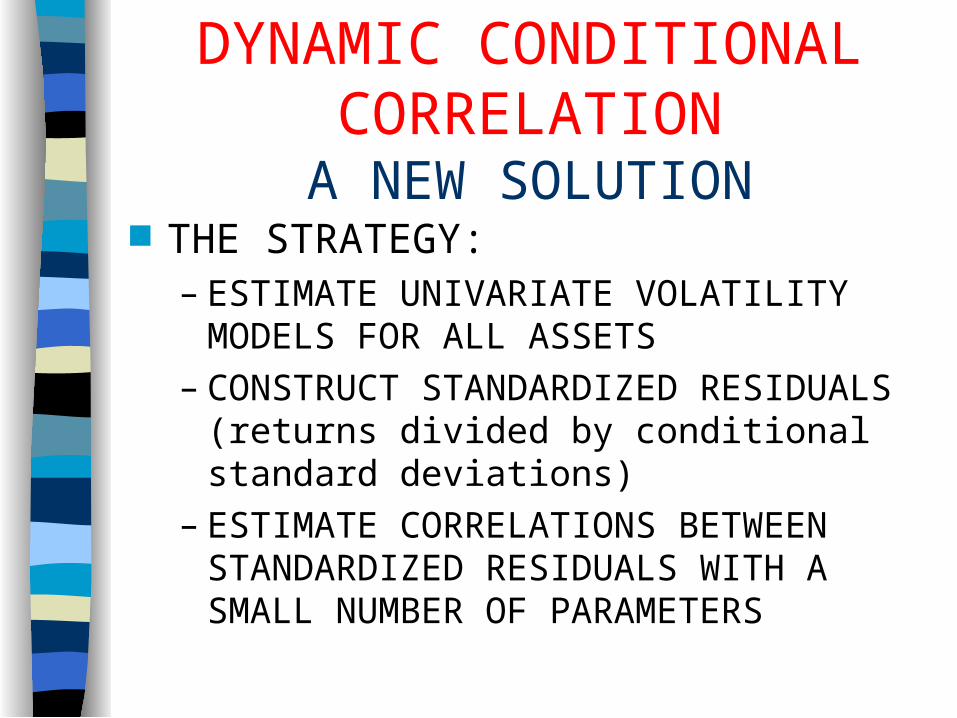
DYNAMIC CONDITIONAL CORRELATION
A NEW SOLUTION THE STRATEGY:
– ESTIMATE UNIVARIATE VOLATILITY MODELS FOR ALL ASSETS
– CONSTRUCT STANDARDIZED RESIDUALS (returns divided by conditional standard deviations)
– ESTIMATE CORRELATIONS BETWEEN STANDARDIZED RESIDUALS WITH A SMALL NUMBER OF PARAMETERS

MOTIVATION
Assume structure for conditional correlations
Simplest assumption- constancy Alternatives
– Integrated Processes– Mean Reverting Processes
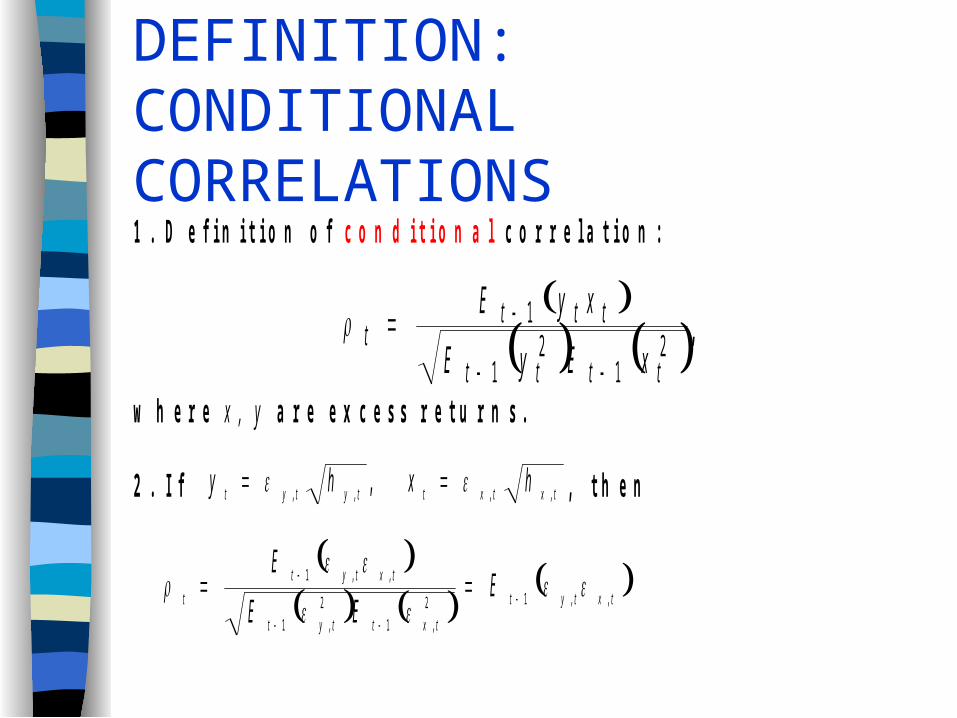
DEFINITION: CONDITIONAL CORRELATIONS1 . D e f i n i t i o n o f c o n d i t i o n a l c o r r e l a t i o n :
2
12
1
1
tttt
tttt
xEyE
xyE
,
w h e r e x , y a r e e x c e s s r e t u r n s .
2 . I f txtxttytyt hxhy ,,,, , , t h e n
txtyt
txttyt
txtyt
t EEE
E,,12
,1
2
,1
,,1

BOLLERSLEV(1990): CONSTANT CONDITIONAL CORRELATION
Assume conditional correlations are constant!i.e. t for all t.
Bollerslev proposed jointly estimating both GARCHmodels and the conditional correlation by maximumlikelihood. Here we propose doing this in two steps:
1. Estimate a GARCH model for each return2. Compute the correlation between the
standardized residuals.
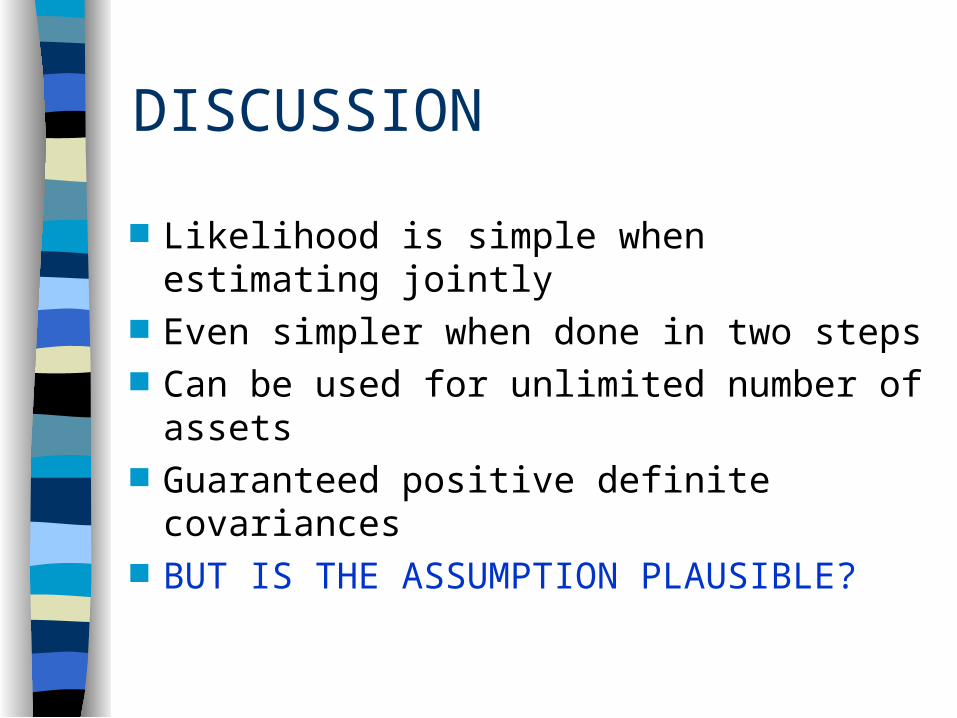
DISCUSSION
Likelihood is simple when estimating jointly Even simpler when done in two steps Can be used for unlimited number of assets Guaranteed positive definite covariances BUT IS THE ASSUMPTION PLAUSIBLE?

CORRELATIONS BETWEEN PORTFOLIOS
txtxtyty hhxyz ,,,,
txtxtyttxty
txtyttxtxz
hhhhh
hhh
,,,,2
,
,,,,,
2

HOWEVER
EVEN IF ASSETS HAVE CONSTANT CONDITIONAL CORRELATIONS, LINEAR COMBINATIONS OF ASSETS WILL NOT

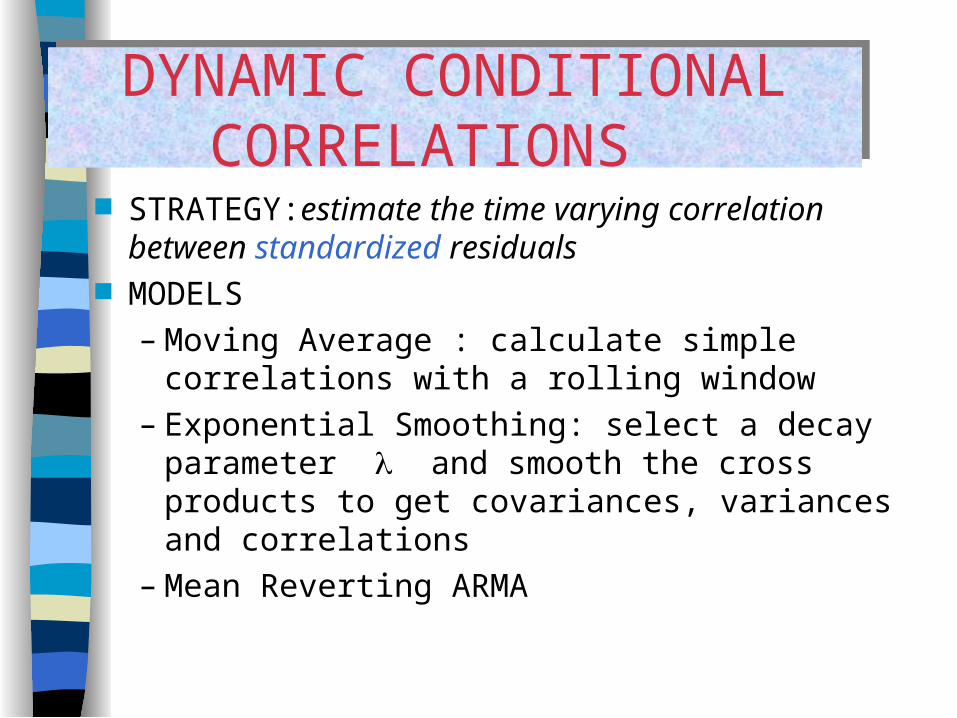
DYNAMIC CONDITIONAL CORRELATIONS
DYNAMIC CONDITIONAL CORRELATIONS
STRATEGY:estimate the time varying correlation between standardized residuals
MODELS– Moving Average : calculate simple correlations
with a rolling window– Exponential Smoothing: select a decay
parameter and smooth the cross products to get covariances, variances and correlations
– Mean Reverting ARMA

Multivariate FormulationMultivariate Formulation
Let r be a vector of returns and D a diagonal matrix with standard deviations on the diagonal
R is a time varying correlation matrix
tttttt DRDHHNr ),,0(~
ttttttt RErD ', 1
1

Log Likelihood
tttttt
ttttttttt
ttttt
RRD
rDRDrDRD
rHrHL
1
111
1
'loglog2)2log(2
1
'log)2log(2
1
'log)2log(2
1
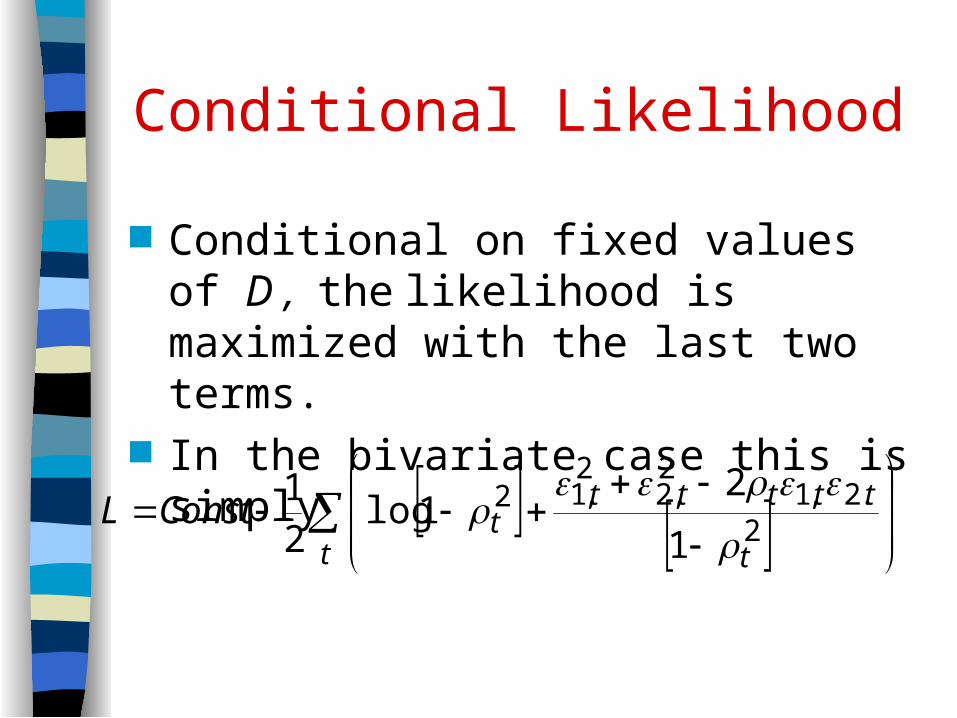
Conditional Likelihood
Conditional on fixed values of D , the likelihood is maximized with the last two terms.
In the bivariate case this is simply
t t
ttttttConstL
2.2,1
2,2
2,12
1
21log
21

Two Step Maximum Likelihood
First, estimate each return as GARCH possibly with other variables or returns as inputs, and construct the standardized residuals
Second, maximize the conditional likelihood with respect to any unknown parameters in rho

Specifications for Rho
Exponential Smoother
i.e.
T
sst
sT
sst
s
T
sstst
s
t
1
2,2
1
2,1
1,2,1
.1
where,
1,,1,1,,,
,2,2,1,1
,2,1
tjitjtitji
tt
tt
q
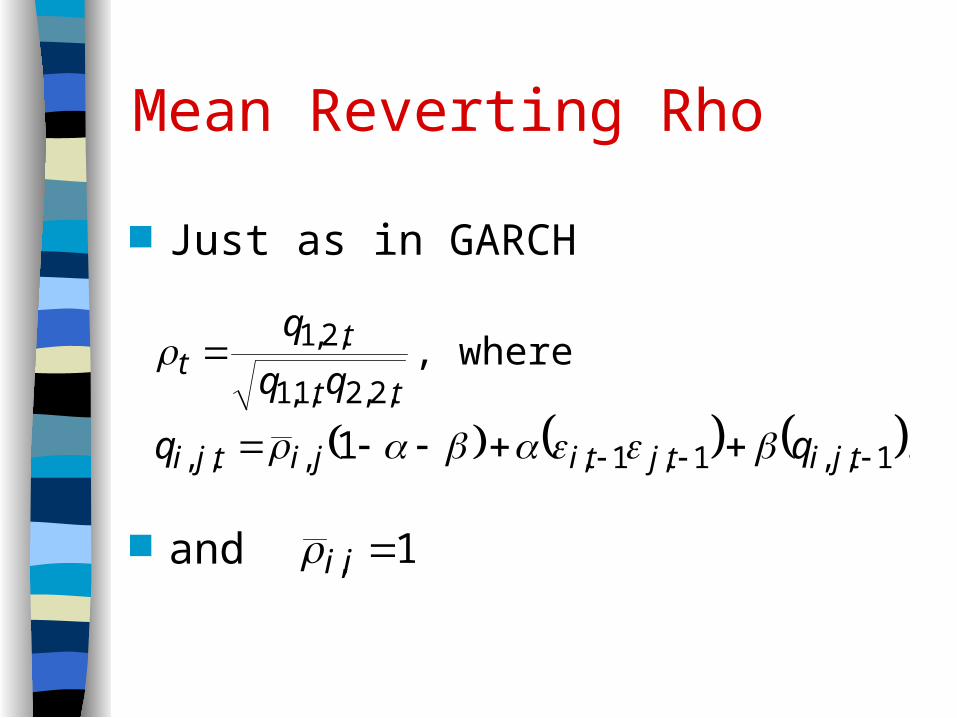
Mean Reverting Rho
Just as in GARCH
and
.1
where,
1,,1,1,,,,
,2,2,1,1
,2,1
tjitjtijitji
tt
tt
q
1, ii

Alternatives to MLE
Instead of maximizing the likelihood over the correlation parameters:
For exponential smoother, estimate IMA
For ARMA, estimate
t1tt,2t,1 uu1
tttttt uu 12,11,21,12,1,2,1


Monte Carlo Experiment
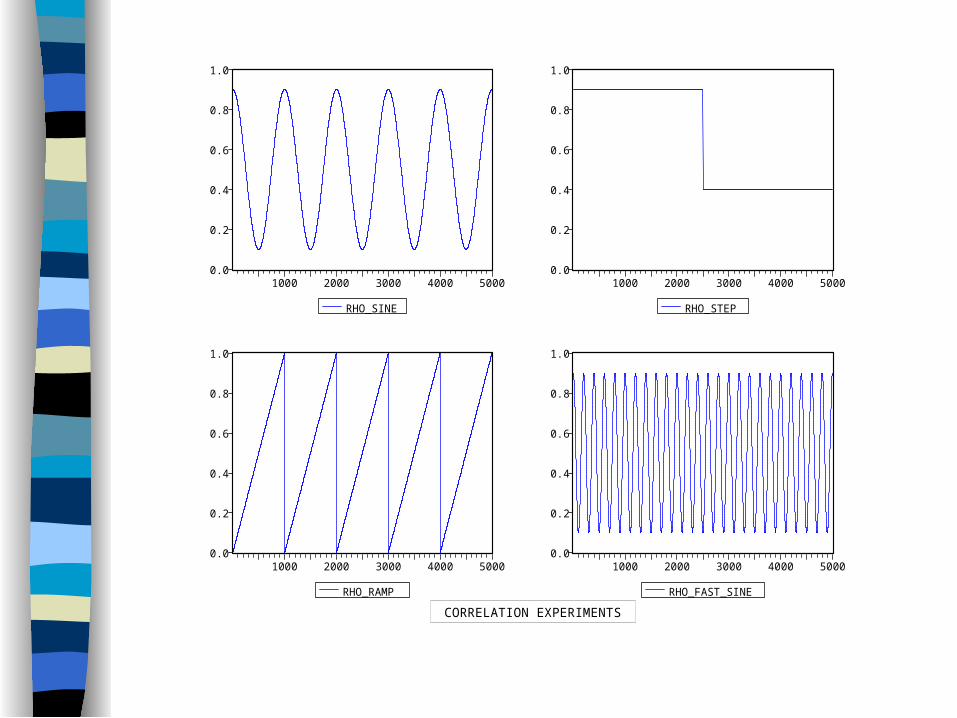
Six experiments - Rho is:– Constant = .9– Sine from 0 to .9 - 4 year cycle– Step from .9 to .4– Ramp from 0 to 1– Fast sine - one hundred day cycle– Sine with t-4 shocks
One series is highly persistent, one is not
DIMENSIONS
SAMPLE SIZE 1000 REPLICATIONS 200
0.0
0.2
0.4
0.6
0.8
1.0
1000 2000 3000 4000 5000
RHO_SINE
0.0
0.2
0.4
0.6
0.8
1.0
1000 2000 3000 4000 5000
RHO_STEP
0.0
0.2
0.4
0.6
0.8
1.0
1000 2000 3000 4000 5000
RHO_RAMP
0.0
0.2
0.4
0.6
0.8
1.0
1000 2000 3000 4000 5000
RHO_FAST_SINE
CORRELATION EXPERIMENTS

METHODS
SCALAR BEKK (variance targeting) DIAGONAL BEKK (variance targeting) DCC - LOG LIKELIHOOD WITH MEAN
REVERSION DCC - LOG LIKELIHOOD FOR
INTEGRATED CORRELATIONS DCC - INTEGRATED MOVING
AVERAGE ESTIMATION
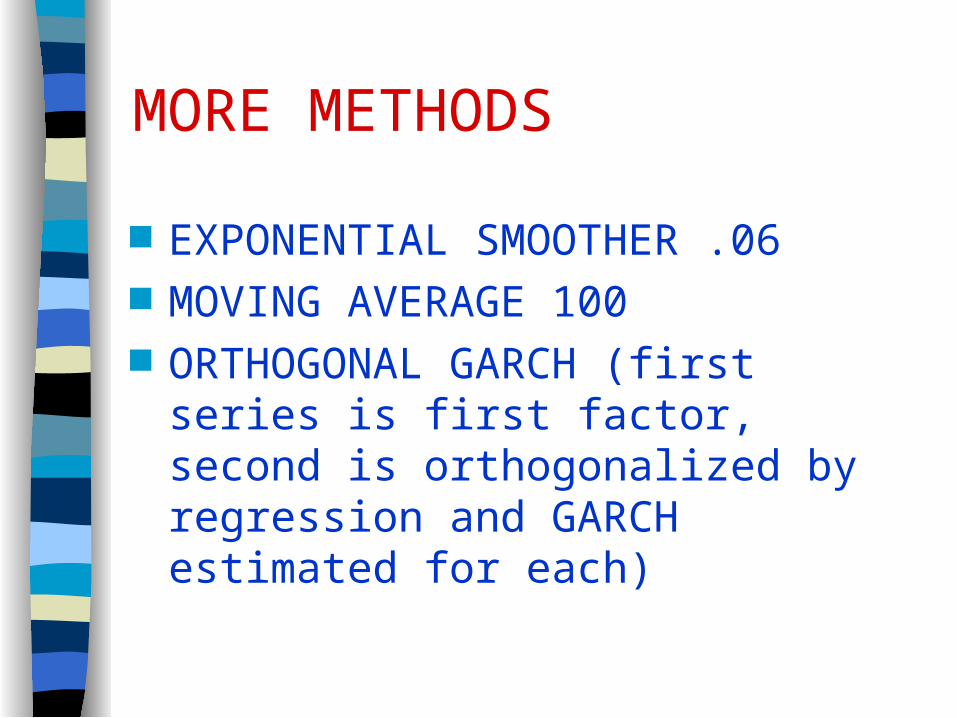
MORE METHODS
EXPONENTIAL SMOOTHER .06 MOVING AVERAGE 100 ORTHOGONAL GARCH (first series is
first factor, second is orthogonalized by regression and GARCH estimated for each)

CRITERIA
MEAN ABSOLUTE ERROR IN CORRELATION ESTIMATE
AUTOCORRELATION FOR SQUARED JOINT STANDARDIZED RESIDUALS - SERIES 2, SERIES 1
DYNAMIC QUANTILE TEST FOR VALUE AT RISK
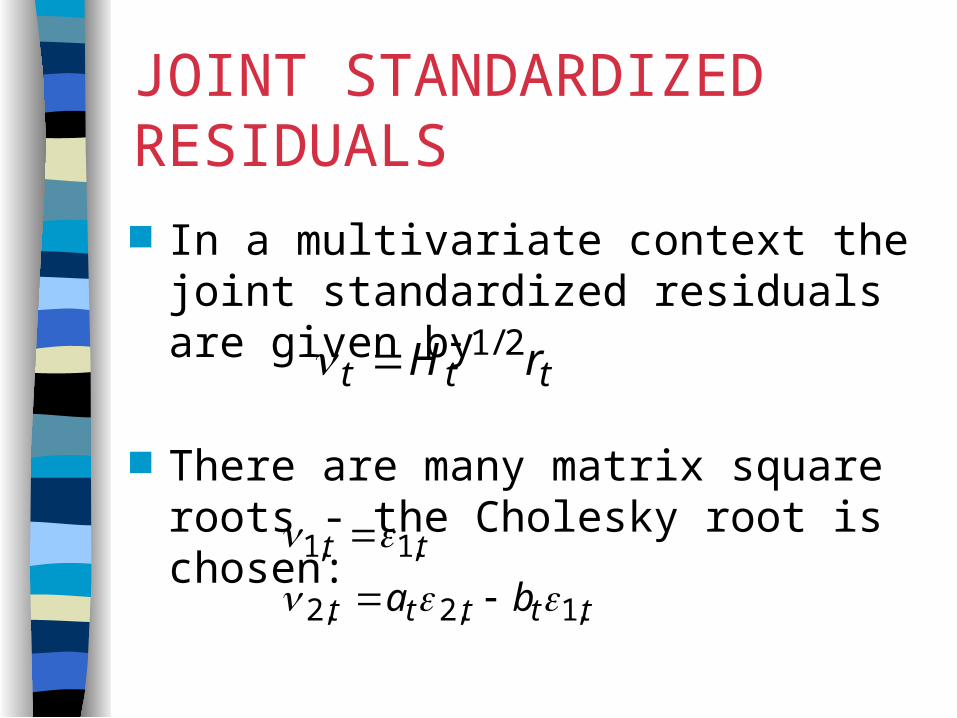
JOINT STANDARDIZED RESIDUALS In a multivariate context the joint
standardized residuals are given by
There are many matrix square roots - the Cholesky root is chosen:
ttt rH 2/1
ttttt
tt
ba ,1,2,2
,1,1
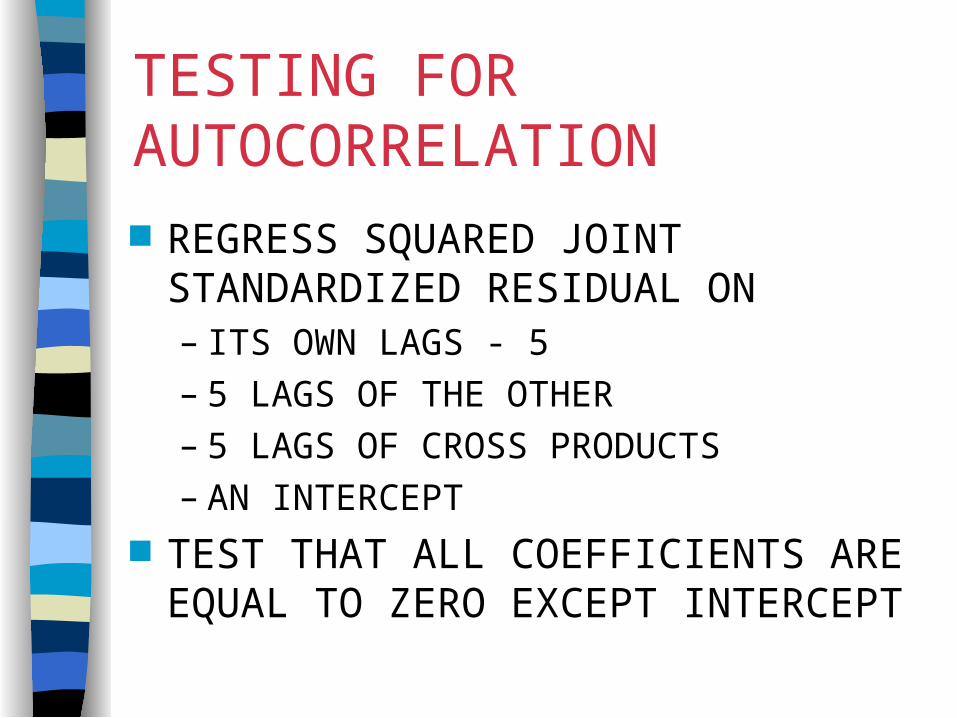
TESTING FOR AUTOCORRELATION REGRESS SQUARED JOINT
STANDARDIZED RESIDUAL ON– ITS OWN LAGS - 5– 5 LAGS OF THE OTHER – 5 LAGS OF CROSS PRODUCTS– AN INTERCEPT
TEST THAT ALL COEFFICIENTS ARE EQUAL TO ZERO EXCEPT INTERCEPT

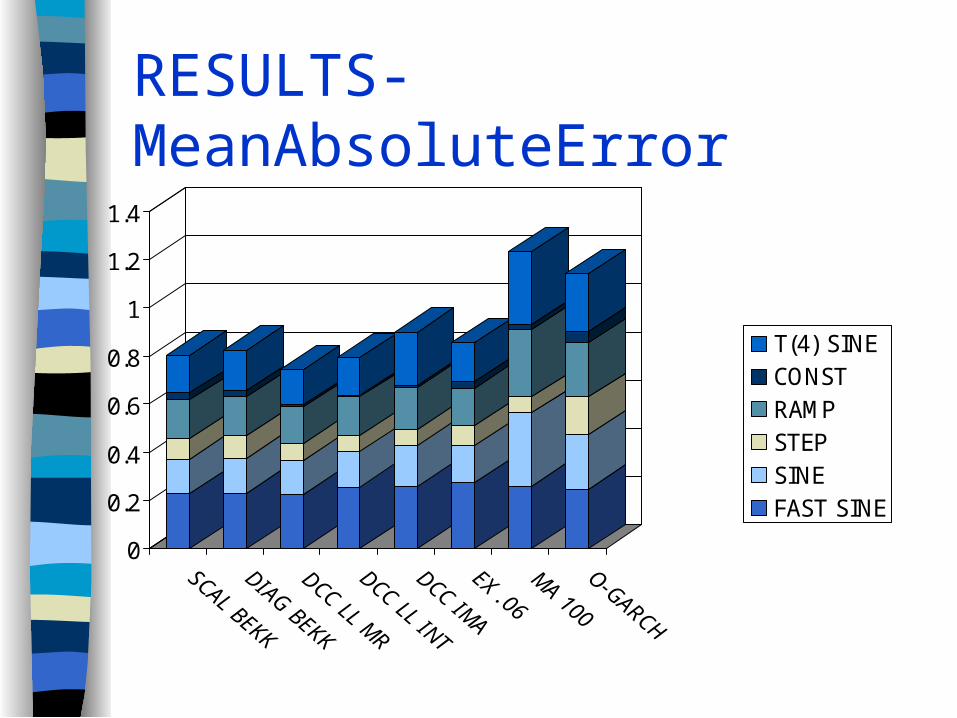
RESULTS-MeanAbsoluteError
0
0.2
0.4
0.6
0.8
1
1.2
1.4
T(4) SINECONSTRAMPSTEPSINEFAST SINE

FRACTION OF DIAGNOSTIC FAILURES(2)
0
1
2
3
4
5
6
SCAL BEKK
DIAG BEKK
DCC LL MR
DCC LL INT
DCC IMA
EX .06
MA 100
O-GARCH
T(4) SINECONSTRAMPSTEPSINEFAST SINE

FRACTION OF DIAGNOSTIC FAILURES (1)
0
0.05
0.1
0.15
0.2
0.25
T(4) SINECONSTRAMPSTEPSINEFAST SINE

DQT for VALUE AT RISK
00.050.1
0.150.2
0.250.3
0.350.4
0.450.5
T(4) SINECONSTRAMPSTEPSINEFAST SINE

CONCLUSIONS
VARIOUS METHODS FOR ESTIMATING DCC HAVE BEEN PROPOSED and TESTED
IN THESE EXPERIMENTS, THE LIKELIHOOD BASED METHODS ARE SUPERIOR
THE MEAN REVERTING METHODS ARE SLIGHTLY BETTER THAN THE INTEGRATED METHODS

EMPIRICAL EXAMPLES
DOW JONES AND NASDAQ
STOCKS AND BONDS
CURRENCIES
0.2
0.4
0.6
0.8
1.0
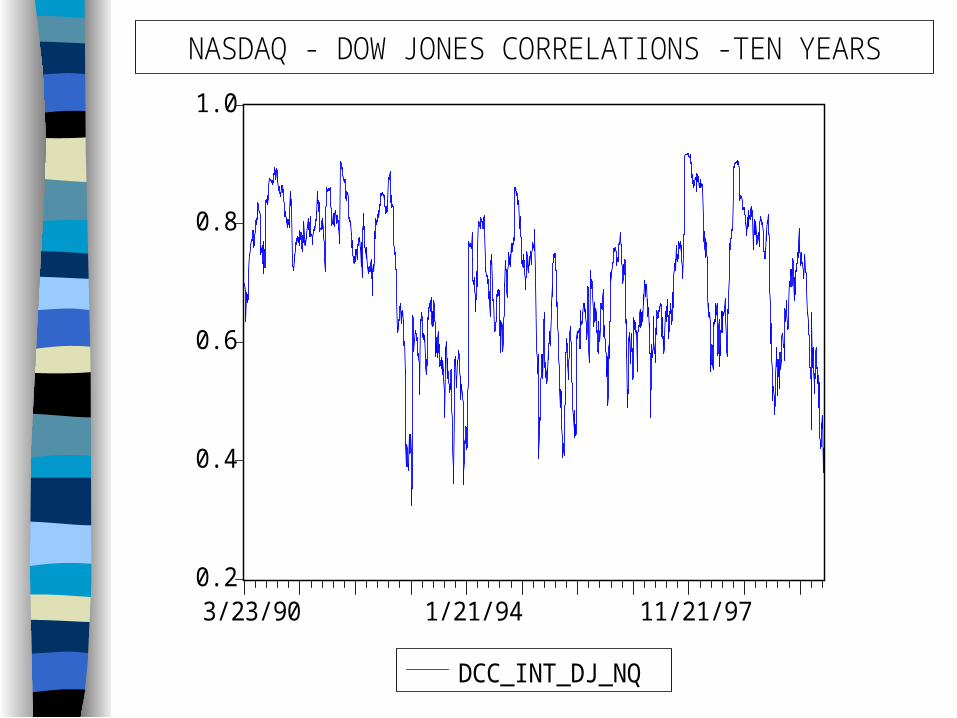
3/23/90 1/21/94 11/21/97
DCC_INT_DJ_NQ
NASDAQ - DOW JONES CORRELATIONS -TEN YEARS
0.2
0.4
0.6
0.8
1.0
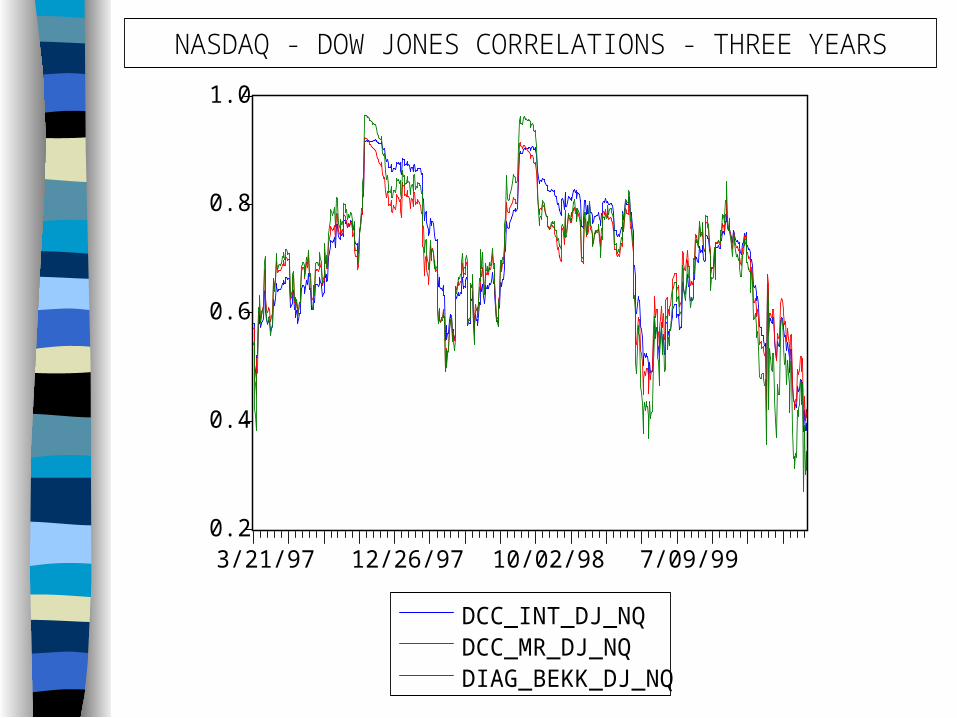
3/21/97 12/26/97 10/02/98 7/09/99
DCC_INT_DJ_NQDCC_MR_DJ_NQDIAG_BEKK_DJ_NQ
NASDAQ - DOW JONES CORRELATIONS - THREE YEARS

0.2
0.4
0.6
0.8
1.0
3/23/98 12/28/98 10/04/99
DCC_INT_DJ_NQOGARCH_DJ_NQ
DIAG_BEKK_DJ_NQDCC_MR_DJ_NQ
NASDAQ - DOW JONES CORRELATIONS - TWO YEARS
0.2
0.3
0.4
0.5
0.6
0.7
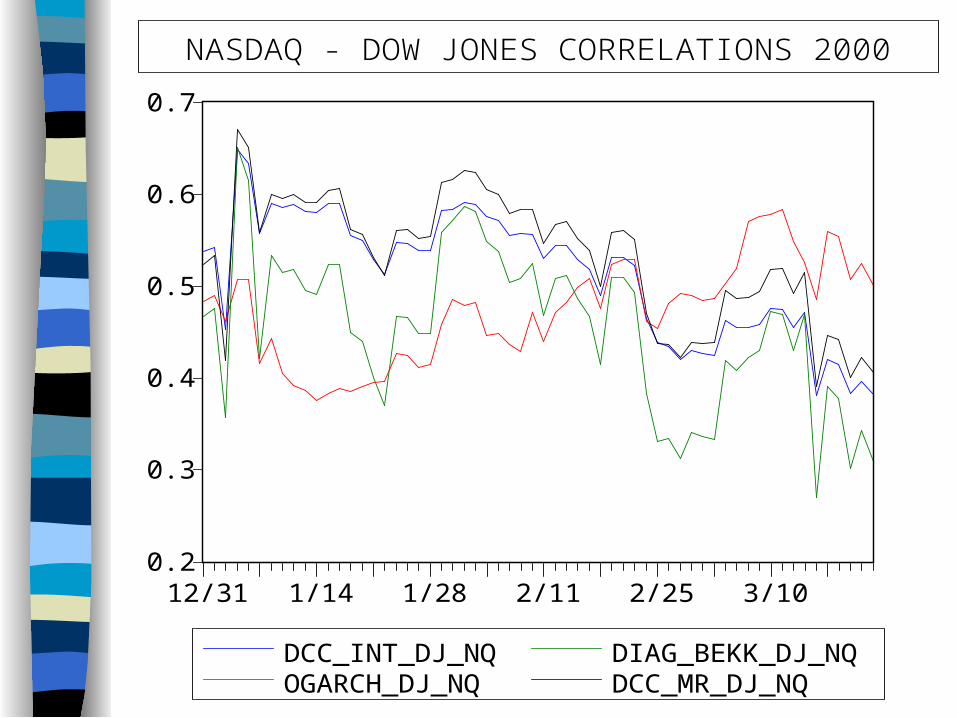
12/31 1/14 1/28 2/11 2/25 3/10
DCC_INT_DJ_NQOGARCH_DJ_NQ
DIAG_BEKK_DJ_NQDCC_MR_DJ_NQ
NASDAQ - DOW JONES CORRELATIONS 2000

0
10
20
30
40
50
60
3/23/90 2/21/92 1/21/94 12/22/95 11/21/97 10/22/99
VOL_DJ_GARCH VOL_NQ_GARCH
TEN YEARS OF VOLATILITIES

0
10
20
30
40
50
60
3/21/97 12/26/97 10/02/98 7/09/99
VOL_DJ_GARCH VOL_NQ_GARCH VOL_BOND_GARCH
STOCK - BOND VOLATILITIES - THREE YEARS

-0.6
-0.4
-0.2
0.0
0.2
0.4
0.6
0.8
3/21/97 12/26/97 10/02/98 7/09/99
DCC_INT_DJ_BOND DCC_INT_NQ_BOND
BOND CORRELATIONS - THREE YEARS

0.2
0.4
0.6
0.8
1.0
500 1000 1500 2000
DCC_INT_RDEM_RITL DIAG_BEKK_RDEM_RITL
CORRELATIONS BETWEEN DM AND LIRA 86-95

0.3
0.4
0.5
0.6
0.7
0.8
0.9
1.0
500 1000 1500 2000
DCC_INT_RDEM_RGBPDCC_INT_RFRF_RDEMDCC_INT_RDEM_RITL
DM CORRELATIONS - 86-95

-0.2
0.0
0.2
0.4
0.6
0.8
1.0
10/04/93 9/04/95 8/04/97
DCC_INT_RDEM_RFRFDCC_INT_RDEM_RITL
DCC_INT_RFRF_RITL
CURRENCY CORRELATIONS

CONCLUSIONS
VARIOUS METHODS FOR ESTIMATING DCC HAVE BEEN PROPOSED and TESTED
IN THESE EXPERIMENTS, THE LIKELIHOOD BASED METHODS ARE SUPERIOR
THE MEAN REVERTING METHODS ARE SLIGHTLY BETTER THAN THE INTEGRATED METHODS