dynamic calculus tools for visualizing calculus paul ... · this project seeks to help students...
TRANSCRIPT

1 © Paul Seeburger 2009
Dynamic Calculus Tools for Visualizing Calculus Paul Seeburger – Monroe Community College [email protected] www.monroecc.edu/wusers/pseeburger/ web.monroecc.edu/calcNSF/ In this paper, I will present a series of Java applets I have created to help student visualize Calculus. Over the past several years, I have developed a series of dynamic calculus applets to support both the Anton and Salas Calculus texts for John Wiley & Sons, a second series of applets to support Addison-Wesley’s Thomas Calculus text, and a third series of 44 applets to support Prentice Hall’s Varberg Calculus text. I am presently developing applets for Hughes-Hallett Calculus and new applets for Anton Calculus, so look for these to appear gradually in the next year or so. Some applets in this paper support these texts, but many of my best applets are found on my webpage and you can link to many from Anton there also. Additionally, there is a set of 6 applets supporting Larson Calculus that can be found on my Dynamic Calculus webpage.
I have received an NSF grant to create a multivariable calculus exploration applet in Java for the web. This project seeks to help students develop a better geometric understanding of multivariable calculus concepts. I will give you a tour of this new applet, and explain other aspects of this exciting project.
Calculus is the mathematics of change. The definitions of each of the basic concepts of Calculus, the limit, the derivative, and the integral are all dynamic. So, if we really want to understand the basic definitions and concepts of Calculus, we need to see them in motion… to see the change in a dynamic and living way. Seeing a few static diagrams can be helpful (I believe it is still very helpful to start our definitions on the chalk board in many cases), but if the diagrams come to life and we are allowed to manipulate them (and have fun with them!), our understanding of the relationships involved can improve dramatically. From what my students have told me, they find this approach to be interesting, very helpful, and many times even fun! As we explore Calculus using the explorations I am creating, I hope my students may also begin to appreciate some of the intricate and fascinating beauty of the mathematics of Calculus. In addition to simply watching me interact with the concepts dynamically, I also believe my students benefit greatly when they interact dynamically with these concepts themselves. I have designed these computer explorations to be used in both of these ways, as classroom demonstrations and also as student explorations outside of class. From my experience, in order for most students to make active use of this kind of exploration, it is very helpful to require them to complete guided exploration activities that I call “labs” outside class. I have created a number of these lab activities so far, and I will continue to create them, to help my students to get their hands “dirty” playing with the Calculus concepts visually. One of my major goals for this project is to develop my students’ geometric intuition about the concepts we cover in calculus, helping them to understand these concepts more deeply and make connections between them visually in a way that has been difficult without such software. Below I have included screenshots from a sampling of the Java applets I have created for calculus. I have also included some description for each one. Each is clearly marked with where you can find them. 1. Horizontal Motion (Varberg, in MyMathLab) This applet helps students to see a clear connection between the graph of a position function and the associated motion of a race car along a straight track. The connections between the graph of the position function and the corresponding velocity and acceleration functions can also be explored with this applet.
2 © Paul Seeburger 2009
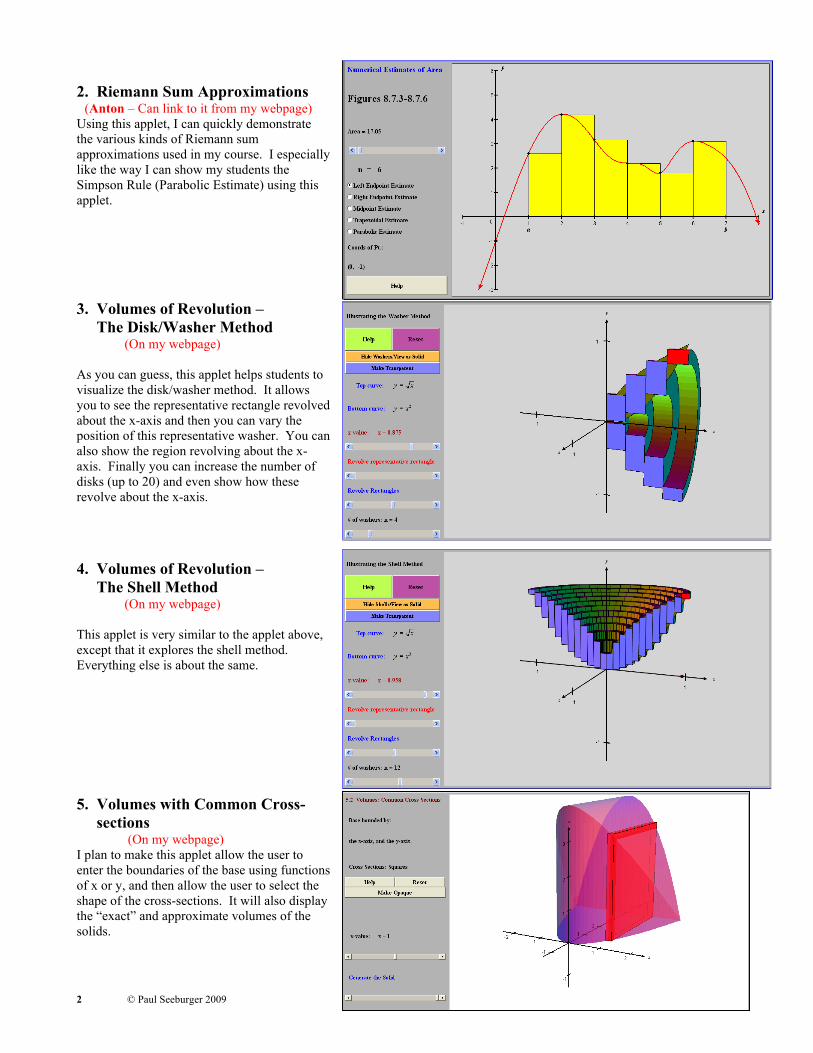
2. Riemann Sum Approximations (Anton – Can link to it from my webpage) Using this applet, I can quickly demonstrate the various kinds of Riemann sum approximations used in my course. I especially like the way I can show my students the Simpson Rule (Parabolic Estimate) using this applet. 3. Volumes of Revolution – The Disk/Washer Method
(On my webpage) As you can guess, this applet helps students to visualize the disk/washer method. It allows you to see the representative rectangle revolved about the x-axis and then you can vary the position of this representative washer. You can also show the region revolving about the x-axis. Finally you can increase the number of disks (up to 20) and even show how these revolve about the x-axis. 4. Volumes of Revolution – The Shell Method
(On my webpage) This applet is very similar to the applet above, except that it explores the shell method. Everything else is about the same. 5. Volumes with Common Cross- sections
(On my webpage) I plan to make this applet allow the user to enter the boundaries of the base using functions of x or y, and then allow the user to select the shape of the cross-sections. It will also display the “exact” and approximate volumes of the solids.

3 © Paul Seeburger 2009
6. Slope Field Exploration
(On my webpage) This applet allows you to enter any first order differential equation that can be solved for dy/dx. It will then display a slope field for this diff. eq. and allow you to enter a possible general (or particular), solution solved for y. If you include a C with the general solution, you can then vary the value of this constant to verify that all particular solutions actually fit through the slope field correctly. 7. Contour Plot Example (Varberg, but you can link to a similar applet for Anton from my webpage.) With this applet, you can demonstrate the relationship between the surface and its contours. I plan to create a general contour plotting applet sometime soon which will allow you to enter practically any function of two variables. 8. Level Surfaces Example (Anton – Can link to it from my webpage) The concept of level surfaces is a fairly difficult topic to visualize well without software. This applet allows students to see three level surfaces for a particular function of three variables simultaneously. These can be rotated and is you use the scroll bar at the bottom, you can see the level surfaces vary by value. 9. A Limit that does not Exist (Varberg, in MyMathLab) This applet helps illustrate a classic function of two variables whose limit does not exist at the origin.
4 © Paul Seeburger 2009
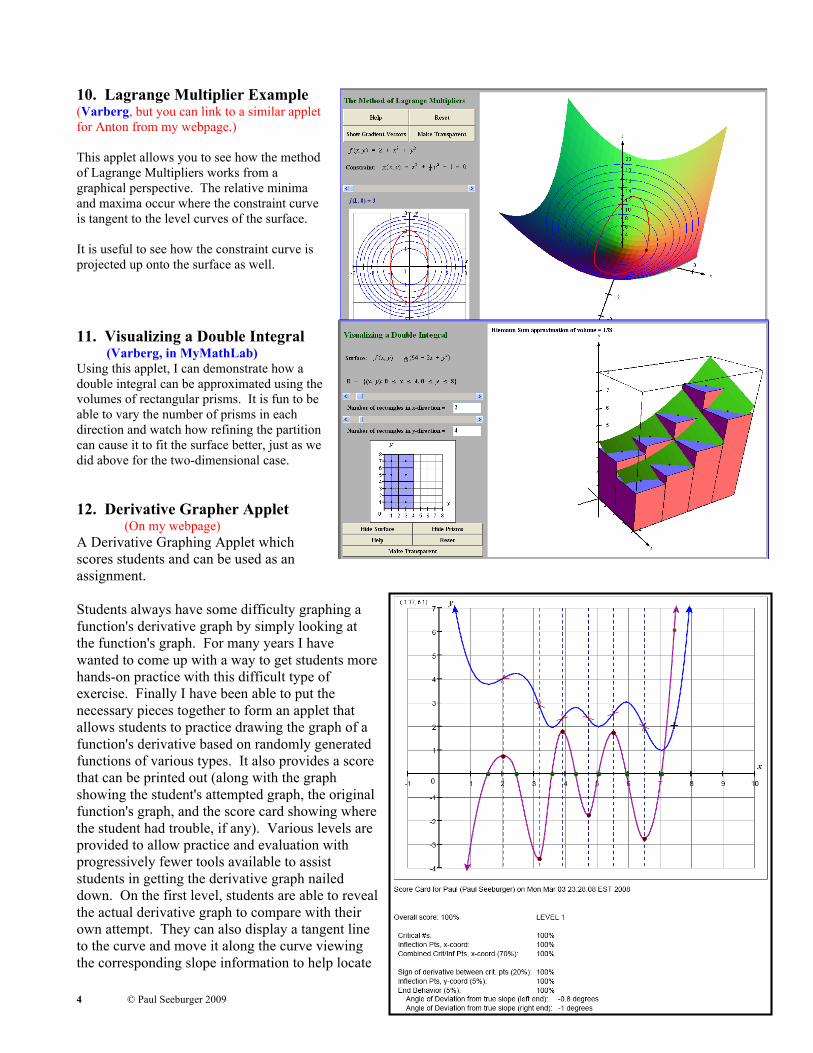
10. Lagrange Multiplier Example (Varberg, but you can link to a similar applet for Anton from my webpage.) This applet allows you to see how the method of Lagrange Multipliers works from a graphical perspective. The relative minima and maxima occur where the constraint curve is tangent to the level curves of the surface. It is useful to see how the constraint curve is projected up onto the surface as well. 11. Visualizing a Double Integral (Varberg, in MyMathLab) Using this applet, I can demonstrate how a double integral can be approximated using the volumes of rectangular prisms. It is fun to be able to vary the number of prisms in each direction and watch how refining the partition can cause it to fit the surface better, just as we did above for the two-dimensional case. 12. Derivative Grapher Applet
(On my webpage) A Derivative Graphing Applet which scores students and can be used as an assignment. Students always have some difficulty graphing a function's derivative graph by simply looking at the function's graph. For many years I have wanted to come up with a way to get students more hands-on practice with this difficult type of exercise. Finally I have been able to put the necessary pieces together to form an applet that allows students to practice drawing the graph of a function's derivative based on randomly generated functions of various types. It also provides a score that can be printed out (along with the graph showing the student's attempted graph, the original function's graph, and the score card showing where the student had trouble, if any). Various levels are provided to allow practice and evaluation with progressively fewer tools available to assist students in getting the derivative graph nailed down. On the first level, students are able to reveal the actual derivative graph to compare with their own attempt. They can also display a tangent line to the curve and move it along the curve viewing the corresponding slope information to help locate
5 © Paul Seeburger 2009
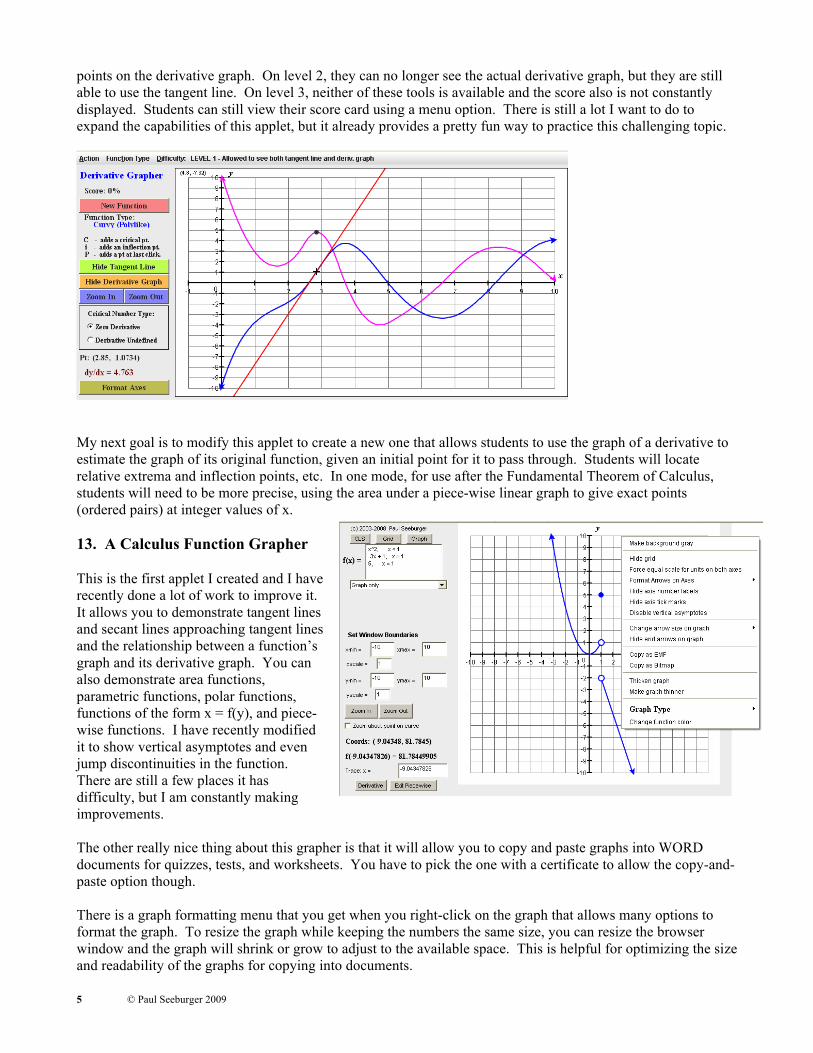
points on the derivative graph. On level 2, they can no longer see the actual derivative graph, but they are still able to use the tangent line. On level 3, neither of these tools is available and the score also is not constantly displayed. Students can still view their score card using a menu option. There is still a lot I want to do to expand the capabilities of this applet, but it already provides a pretty fun way to practice this challenging topic.
My next goal is to modify this applet to create a new one that allows students to use the graph of a derivative to estimate the graph of its original function, given an initial point for it to pass through. Students will locate relative extrema and inflection points, etc. In one mode, for use after the Fundamental Theorem of Calculus, students will need to be more precise, using the area under a piece-wise linear graph to give exact points (ordered pairs) at integer values of x. 13. A Calculus Function Grapher This is the first applet I created and I have recently done a lot of work to improve it. It allows you to demonstrate tangent lines and secant lines approaching tangent lines and the relationship between a function’s graph and its derivative graph. You can also demonstrate area functions, parametric functions, polar functions, functions of the form x = f(y), and piece-wise functions. I have recently modified it to show vertical asymptotes and even jump discontinuities in the function. There are still a few places it has difficulty, but I am constantly making improvements. The other really nice thing about this grapher is that it will allow you to copy and paste graphs into WORD documents for quizzes, tests, and worksheets. You have to pick the one with a certificate to allow the copy-and-paste option though. There is a graph formatting menu that you get when you right-click on the graph that allows many options to format the graph. To resize the graph while keeping the numbers the same size, you can resize the browser window and the graph will shrink or grow to adjust to the available space. This is helpful for optimizing the size and readability of the graphs for copying into documents.

6 © Paul Seeburger 2009
Excel Calculus Explorations – A series of Excel calculus explorations can be downloaded from my webpage for use in your classes. I have tried to update them for the new Excel 2007, but some of them work best in Excel 2003. Topics include: Riemann Sums, Derivative graphs, Arc Length, Related Rates – Balloon problem, and Taylor Polynomials. To download these Excel demonstrations you will need to become a “member” of my Dynamic Calculus website. This is partly so that I can have the ability to know how much interest there is in my Excel explorations, and perhaps ask you if you found them useful at some point. It also allows members to use the site to discuss the use of applets, etc. in the teaching of calculus. I would love to see more contributions to this discussion.
Dynamic Visualization Tools for Multivariable Calculus - a project funded in part by a grant from the National Science Foundation (NSF), DUE- CCLI #0736968.
The purpose of this project is to help students develop a better geometric understanding of the concepts in multivariable calculus. Above you can see a screenshot of this applet. As you can see in this example, you can graph up to four surfaces simultaneously, and add points, vectors, and as many space curves as you like to the 3D environment. You can also add 2D or 3D vector fields and regions/volumes of integration. There are four parts to this project:
1. To create the multivariable calculus exploration environment described above. 2. Developing a series of additional Java applets that demonstrate and explore the major three-
dimensional concepts of calculus, including volumes of revolution and volumes of common cross-sections, as well as specific topics in multivariable calculus.
3. Developing materials (guided exploration activities/labs) to be used with these applets in order to encourage faculty to require their students to make use of these tools outside of class.
4. Dissemination of these materials at math conferences and through the MathDL online. Please visit my NSF Multivariable Calculus website (http://web.monroecc.edu/calcNSF/) to find more detailed PDF descriptions of this project, to take a visual tour of CalcPlot3D (the main applet), and explore the applet itself.
A direct link to this part of my website is: web.monroecc.edu/pseeburger/

7 © Paul Seeburger 2009
I am also creating a series of assessment exploration activities to measure the benefits to student understanding from these visualization tools. If any of you are interested in helping me with this assessment phase, I would love to have you class-test these materials in your classes. You can choose to have your students do some of the assessments, and use the exploration applet in your teaching. At the end of the semester, I will ask you and your students to fill out a quick survey to assess your experience with these visualization tools in your class. This is also your opportunity to help shape this project, as I am always seeking to improve it through the suggestions of other faculty and students.
Here is one of the assessment pre-tests I give my students to check their understanding of velocity and acceleration vectors. These questions are meant to assess your current understanding of the concepts you will be exploring further in this exploration. Answer them carefully. After you complete this section, you will be asked to do the exploration. Once the exploration is over, you will be asked questions similar to these again to see whether the exploration helped you to improve your understanding of the concepts. 1. Which of these diagrams best represents the direction of the velocity vector at the given point on the given position curve?
a. b. c. d. e. I don't know.

8 © Paul Seeburger 2009
2. If the position function tracing this curve is r(t) = 3cos t i + 2sin t j, which of these diagrams best represents the direction of the acceleration vector at the given point on the given position curve?
a. b. c. d. e. I don't know.
3. If the speed of the particle is held constant on this path, which of these diagrams best represents the direction of the acceleration vector at the given point on this position curve?
a. b. c. d. e. I don't know.
4. (True or False) For any position function, the acceleration vector is always orthogonal to the velocity vector.
True
False 5. Which of the vectors in #3, if any, could NOT possibly be the acceleration of a particle on this path at the given point? (Select all that apply.)
a. b. c. d. All could be. So far, I have had at least 20 instructors including myself begin to class-test my multivariable calculus exploration applet. This includes instructors at Monroe Community College, Corning Community College, Onondaga Community College, SUNY Oneonta, two local high schools, Wake Tech Community College, West Chester University, and many other universities. A total of 301 students have completed the first exploration assessment on the geometric significance of the Dot Product. A total of 273 students have completed the Cross Product exploration, and 82 students have completed the Velocity-Acceleration Exploration/Assessment. From the results so far, it appears clear that students have definitely improved their geometric understanding of these concepts by using these explorations. Percentage of students correct on each question on the first two assessments increased from the Pre-test to the Post-test, quite dramatically, typically from about 60% to between 80% and 90%. There were also a lot of very positive comments given about how helpful the explorations were. Here are some comments from students who took the Dot Product Assessment: “Being able to see the vectors move and the associated dot products was really helpful.”

9 © Paul Seeburger 2009
“I did not really understand DOT products until this exercise.” “My answers were the same, but it took me less time to answer the questions and I was more confident in my answers. I did not have to actually calculate the dot products i.e. my understanding was the first time was merely mechanical and my understanding the second time was more intuitive.” “It solidified the thoughts that I had regarding vectors and their dot products. Before I was 85% sure about my answers; now I am 100% sure.” “Actually visualizing this exploration greatly increased my understanding of the dot product, so that made me really enjoy this.” Here are some student comments on the Cross Product Exploration/Assessment: “Being able to see the graphs and see the immediate results of moving the vectors, gave me a clearer view of the cross product.” “It gave a visual element not well shown on the chalk board.” “It allowed me to have a better visual representation of what the cross product really is.” “Seeing the visual in 3-D instead of on paper really helped.” I have many more assessments like these planned, and I also have a number of additional concepts I plan to include visualization tools for in my applets. If you have any suggestions, please feel free to let me know. This applet can be used in (at least) three different ways. First, it is very useful to use for quick demonstrations during lecture to make the concepts more intuitive. Second, it is ideal to get students using the applets by requiring that they use them for homework assignments. This can include printing out a visual verification of a problem they worked by hand and focused exploration activities like those designed for my assessments. Third, I have designed this applet so that you as instructors can use it to create your own graphics for tests, worksheets, and color overheads. Just hit Control-C after clicking on the plot window to copy the graphics image to the clipboard. Then you can paste this image into a document in WORD, etc. Some Final Reflections The detail, action and “living color” available on the computer make it a very helpful addition to the graphing calculators many of us already use in our classes. I do still use the TI-83 graphing calculators in my Calculus classes. But I strongly believe they will be able to use these tools more effectively and intelligently after experiencing the concepts in the colorful and interactive environment available in my Java applets I have developed for this purpose. My students have only had positive things to say about these demonstrations whenever I use them in my classes. I usually have a classroom equipped with a computer projector which makes this a lot easier to do. Students often tell me that they really began to understand what was going on when they saw the concepts in motion in my computer demonstrations. And these demonstrations are not just helping them to understand. These colorful dynamic and animated calculus concepts really get their attention and make exploring the concepts of calculus more fun! And honestly, they make presenting the concepts a lot of fun as well! I want to mention again how important I believe this kind of visual demonstration can be for many of our students. I believe it is a tool that will help the majority of our students understand the concepts of Calculus more fully (to develop their geometric intuition about the concepts), and help them to “smile and nod” with confidence in their understanding. I also hope they will come away with some sense of enjoyment in the beauty of the mathematics involved.