dynamic analysis of combat vehicle accidentsweb.mit.edu/smadnick/www/wp/2008-06.pdf · dynamic...
TRANSCRIPT
Dynamic Analysis of Combat Vehicle Accidents
Nathan A. Minami Stuart E. Madnick
Working Paper CISL# 2008-06
August 2008
Composite Information Systems Laboratory (CISL) Sloan School of Management, Room E53-320
Massachusetts Institute of Technology Cambridge, MA 02142

Dynamic Analysis of Combat Vehicle Accidents
Key Words: Safety, Accidents, Military
Nathan A. Minami
Instructor/ Analyst United States Military Academy
Department of Systems Engineering West Point, NY 10997
Email: [email protected] Phone: (845) 938-5525 (office)
Stuart Madnick
John Norris Maguire Professor of Information Technologies & Professor of Engineering Systems
Massachusetts Institute of Technology Sloan School of Management & School of Engineering
77 Massachusetts Ave. (E51-321) Cambridge, MA 02139-4307 E-mail: [email protected]
Abstract To the chagrin of well intentioned Army leaders, dozens of soldiers are killed each year as a result of combat vehicle accidents. The objective of this study is to look beyond the events and symptoms of accidents which normally indicate human error, and instead study the upper-level organizational processes and problems that constitute the actual root causes of accidents. After a short review of the literature we report on our development of a System Dynamics model. We then discuss the results of several simulations; which suggest that high-level decisions that balance mission rate and operations tempo with troop availability, careful management of the work-rest cycle for deployed troops, and improvement of the processes for evaluating the lessons learned from accidents, would lead to a reduction in Army combat vehicle accidents. 1. Introduction
An alarming number of soldiers die or are severely injured each year from accidents that could be prevented. Two of the major problem areas are vehicle safety (involving both military and privately owned vehicles) and the handling of weapons. While the focus of this study is on prevention of combat and motor vehicle accidents, a secondary goal is to develop a model that can be applied to a wide variety of safety concerns.
2
Currently, the Army uses a qualitative and methodical risk management process called Composite Risk Management to help manage operational and training risk (Department of the Army, 2006). While the Composite Risk Management process has produced tremendous improvements in preventing accidents, both it and the results of most Army accident investigations (the primary source of institutional safety learning) tend to focus predominantly on events and symptoms of accidents. Consequently, the results of most safety investigations indicate human error as the primary cause of accidents, and rarely examine the organizational processes and problems that constitute the actual root causes of accidents. The objective of this study is to develop a model that helps Army policy makers to better understand the effects of various dynamic feedback processes and delays involved with decision making, specifically in regards to accident prevention. This study focuses on high-level organizational factors that impact safety, which will help policy makers to better understand which levers in the system play the biggest role in risk mitigation. The general methodology used in this study was first to conduct a review of organizational and behavioral safety literature, System Dynamics modeling literature, and official U.S. Army safety publications and accident reports. Next, we developed a model and calibrated it using historical Army accident data, and a number of simulations were then conducted to see what new insights might be learned from the model. 2. Background & Context
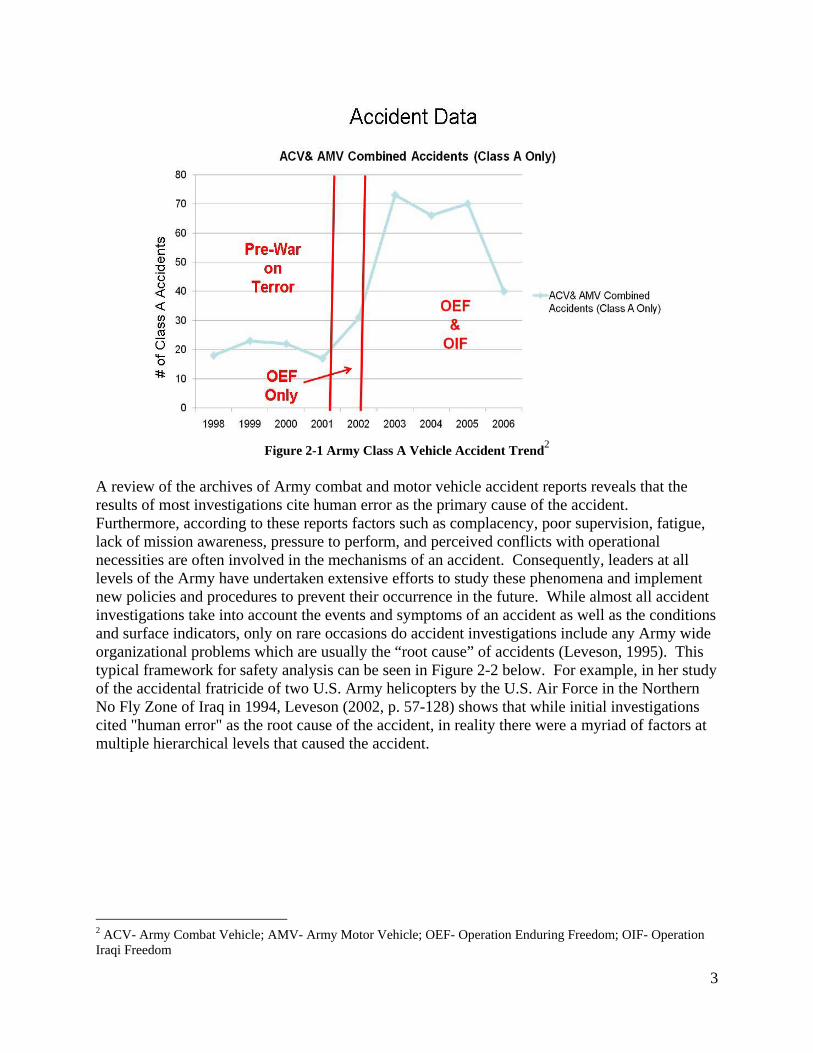
Since the beginning of the war in Iraq in 2003, approximately 20% of all U.S. soldiers killed in Iraq have been a result of accidents (over 600 total deaths from accidents as of May 2007). The biggest cause of these deaths has been combat vehicle accidents, which has accounted for a total of 250 deaths in Iraq. These numbers are significant and represent the number of accidents from Iraq only; they do not include other accidents within the Army nor those that occurred in Afghanistan. Furthermore, as can be seen in Figure 2-1, there has been a sharp increase in the number of Class A vehicle accidents since Operation Iraqi Freedom began (Class A accidents are those involving loss of life or costing more than $1Million).1 In 2006 the Army undertook new initiatives to reduce vehicle accidents, focusing on both job related and off duty accidents. One major component of this initiative was to have all soldiers and leaders complete mandatory on-line safety courses and to complete on-line risk assessments prior to going on leave. Consequently, there was a corresponding decrease in the number of class A vehicle accidents during 2006. Nevertheless, room for improvement remains.
1 There are also Class B, C and D accidents which involve less severe personnel injuries and lower monetary values in equipment damages. Class A accidents were used for this study because detailed reports and investigations on Class B, C and D vehicle accidents were not available. The Army conducts detailed and extensive investigations on Class A accidents, which typically involve loss of life for ground vehicle accidents (rarely is $1M in damage caused from ground vehicle accidents).
3
Figure 2-1 Army Class A Vehicle Accident Trend2
A review of the archives of Army combat and motor vehicle accident reports reveals that the results of most investigations cite human error as the primary cause of the accident. Furthermore, according to these reports factors such as complacency, poor supervision, fatigue, lack of mission awareness, pressure to perform, and perceived conflicts with operational necessities are often involved in the mechanisms of an accident. Consequently, leaders at all levels of the Army have undertaken extensive efforts to study these phenomena and implement new policies and procedures to prevent their occurrence in the future. While almost all accident investigations take into account the events and symptoms of an accident as well as the conditions and surface indicators, only on rare occasions do accident investigations include any Army wide organizational problems which are usually the “root cause” of accidents (Leveson, 1995). This typical framework for safety analysis can be seen in Figure 2-2 below. For example, in her study of the accidental fratricide of two U.S. Army helicopters by the U.S. Air Force in the Northern No Fly Zone of Iraq in 1994, Leveson (2002, p. 57-128) shows that while initial investigations cited "human error" as the root cause of the accident, in reality there were a myriad of factors at multiple hierarchical levels that caused the accident.
2 ACV- Army Combat Vehicle; AMV- Army Motor Vehicle; OEF- Operation Enduring Freedom; OIF- Operation Iraqi Freedom

4
Figure 2-2 Safety Analysis Framework
It is critical to note than many other studies cite this same tendency. In his study of high-
hazard industries, John Carroll notes that most accident investigations produce problem diagnoses that are worker centric, resulting in extensive written detailed procedures and discipline. This leads to added job complexity and a reduction in trust between workers and management, which leads to slower work speed, alienation of workers, and a reduced flow of information between supervisors and their subordinates. Naturally, this leads to increased problems and therefore, a cycle of accumulating problems, accidents, and worker resentment (Carroll, 1998). Consequently, it would be beneficial for not only the Army but also civilian industries to undertake studies that look beyond the immediate mechanisms and conditions that lead to accidents (i.e. poor risk assessments, faulty procedures, equipment failure, mechanical breakdown, excessive speed, lack of sleep, etc) and instead, examine the root causes of combat vehicle accidents; such as operations tempo, implications of funding decisions, budget constraints, institutionalized leader training, etc.
3. Modeling Vehicle Safety After developing background and framework for this problem, a more extensive literature review was conducted and data was collected to provide quantifiable measures for variables in the model, and to develop critical model parameters and equations. We began by reviewing 500 Army accident reports from the Combat Readiness Center. For each report, the key hierarchical factors that lead to each accident were carefully reviewed to find the underlying conditions that
Safety Analysis Framework Causal relations/ Levels of Analysis
Organizational Problems/ Root Causes
Conditions/ Surface Indicators
Events/Symptoms Accident
e.g. Shortage of Funding
e.g. Not enough Soldiers so Soldiers overworked/tired
e.g. Driver and TC Fall Asleep While Driving e.g. Vehicle Runs off
Road and Flips
Typical Conclusion of Accident Investigation: Human Error !
Categories
(Levels of
Analysis)
Most Safety InvestigationsLimited to thisDomain

5
were present in the system that contributed to the accident's occurrence. A hypothetical example of the hierarchical factors that contributed to an accident is shown in Figure 3-1.3.
Hypothetical Vehicle Safety Example: Consequences and Proceeding Actions
Not Enough Soldiers in Army
Vehicle Accident
Vehicle Fell Into Canal
Misjudged Width of Road
Failed to Ground Guide
In a Hurry
Tired, Burnt Out & Complacent
Deployed for 11 Months
Long Deployments
Troop to Task Ratio Imbalance
Shortage of Funding
More Money Spent on Accident Prevention
Events
Conditions
OrganizationalProblems“Root Cause”
Figure 3-1 Hypothetical Accident Scenario
In this example, a vehicle accident occurred because a vehicle fell into a canal, which was caused because a soldier misjudged the width of the road; the direct result of a leader failing to dismount the vehicle and ground guide the vehicle through the hazardous stretch of road on foot. These elements constitute the “Events” of the accident. It would be easy to stop the investigation at this point, and assign blame on the vehicle commander (TC) for not dismounting and ground-guiding the vehicle. A deeper analysis, however, would reveal more insights. It is possible the TC failed to ground guide because he was in a hurry due to feeling tired, burnt out and complacent. While now it might seem even easier to assign blame, a further inquiry might find that the TC was tired and complacent because he was in the 13th month of a 15 month deployment, which is a direct result of long deployments throughout the Army. These new elements were caused by higher level events and decisions in the hierarchy, and are the “Conditions” of an accident, or those elements that influence the occurrence of the actual events of an accident. These conditions, however, are not the root causes of the accident. By further inquiry, we might find that the long deployments are the result of a troop to task ratio imbalance, which is caused by having too many missions to accomplish and not enough Soldiers in the Army, and perhaps the Army cannot afford enough Soldiers because of a shortage of funding, which may partially be a result of too much money being spent on accident prevention and replacing lost/damaged vehicles and Soldiers from these accidents. Naturally, this example is describing a reinforcing feedback loop, which while hypothetical, is quite plausible. In addition, as described in Figure 2-2, almost all accident reports only focus on the events and some of the conditions of an accident, and
3 Note: this example does not show all of the hierarchical factors involved in the accident, only the elements involved in one of the many potential feedback loops.

6
therefore one would not be able to find this much information from an accident report or investigation, which limits institutional learning and the ability of high level policy makers to implement insightful policies that will help to reduce accidents.
Therefore, in examining the actual data as contained in the accident reports, we followed a similar process as described in the hypothetical example above. Once the events and conditions of each accident were identified, we then attempted to determine what the organizational root causes were that led to these hazardous conditions in the system. Wherever there appeared to be a high correlation between specific hazardous conditions and accidents, we then went back and examined the civilian literature of private and public industries to see if these same phenomena existed outside the military. A sample of the Army accident data collected is in Figure 3-2.
Figure 3-2 Example Accident Factors
As seen in Figure 3-2, some of the most common conditions that lead directly to accidents are Awareness of Safety Hazards and Complacency, followed by units that tend to be In A Hurry or perceive a Conflict with Operational Necessity. These are just a few of the key accident factors that were found in the literature, there were many others. For each factor, the safety reports were then carefully scrutinized to determine what other factors or variables were involved that caused the preceding ones to occur. This same iterative process was conducted many times over for each accident report similar to what is described in Figure 3-1. 3.1 Developing the Conceptual Model Before building our conceptual model, we conducted a study of the relevant System Dynamics literature to complement our domain specific review to see what previous modeling efforts might prove insightful to our project. Lyneis and Madnick (2008) developed a model that focused on the effect of task backlog and adherence to rules and procedures and showed that making safety a high priority by limiting production pressure is by far the highest leverage policy available to managers seeking to prevent accidents. Leveson and Cutcher-Gershenfeld (2007) developed a model examining the Space Shuttle Columbia accident and showed how a build-up of success
7
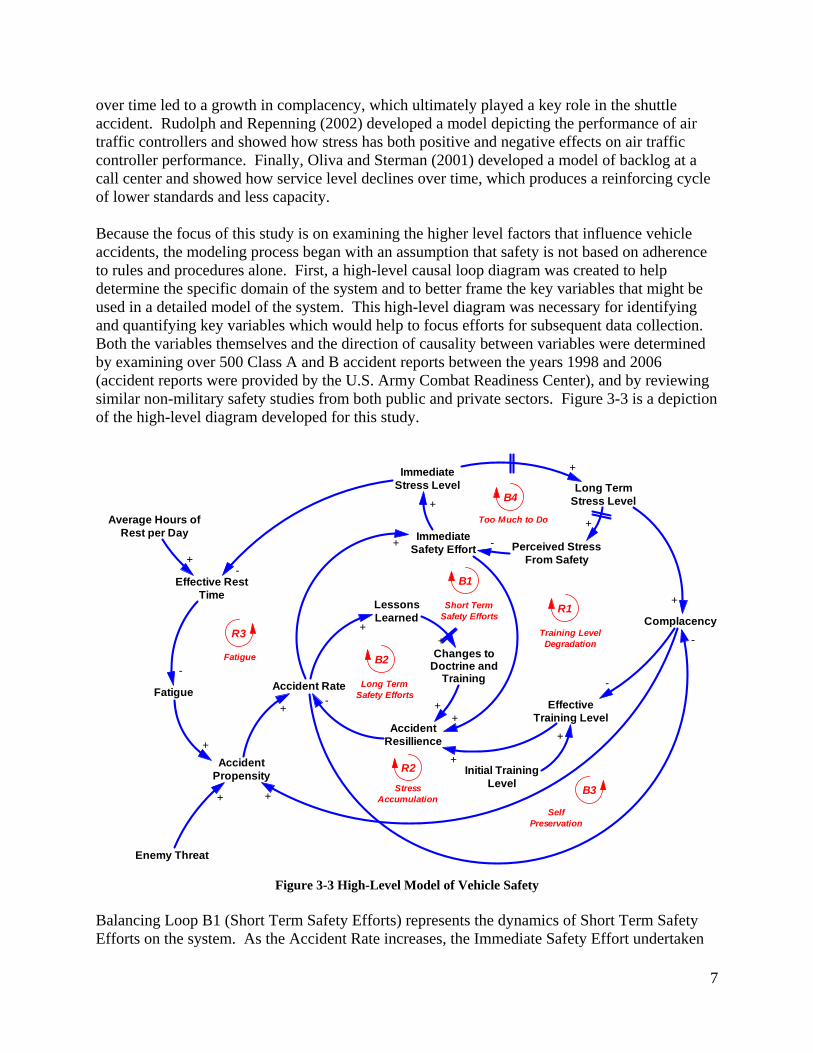
over time led to a growth in complacency, which ultimately played a key role in the shuttle accident. Rudolph and Repenning (2002) developed a model depicting the performance of air traffic controllers and showed how stress has both positive and negative effects on air traffic controller performance. Finally, Oliva and Sterman (2001) developed a model of backlog at a call center and showed how service level declines over time, which produces a reinforcing cycle of lower standards and less capacity. Because the focus of this study is on examining the higher level factors that influence vehicle accidents, the modeling process began with an assumption that safety is not based on adherence to rules and procedures alone. First, a high-level causal loop diagram was created to help determine the specific domain of the system and to better frame the key variables that might be used in a detailed model of the system. This high-level diagram was necessary for identifying and quantifying key variables which would help to focus efforts for subsequent data collection. Both the variables themselves and the direction of causality between variables were determined by examining over 500 Class A and B accident reports between the years 1998 and 2006 (accident reports were provided by the U.S. Army Combat Readiness Center), and by reviewing similar non-military safety studies from both public and private sectors. Figure 3-3 is a depiction of the high-level diagram developed for this study.
Accident Rate
ImmediateSafety Effort
AccidentResillience
+
+-
B1
Short TermSafety Efforts
LessonsLearned
Changes toDoctrine and
Training
++
+
B2
Long TermSafety Efforts
ImmediateStress Level Long Term
Stress Level
Complacency
EffectiveTraining Level
Initial TrainingLevel
+
+
+
+
-
+
R1
Training LevelDegradation
AccidentPropensity
+
+
R2
StressAccumulation
Enemy Threat
+
Average Hours ofRest per Day
Effective RestTime
Fatigue
+-
-
+
R3
Fatigue
Perceived StressFrom Safety
+
-
B4
Too Much to Do
B3
SelfPreservation
-
Figure 3-3 High-Level Model of Vehicle Safety
Balancing Loop B1 (Short Term Safety Efforts) represents the dynamics of Short Term Safety Efforts on the system. As the Accident Rate increases, the Immediate Safety Effort undertaken

8
by lower-level Army units increases, which leads to an increase in Accident Resilience and a corresponding decrease in the Accident Rate. Loop B1 is interesting because it describes the positive effects of knee-jerk reactions to a safety crisis (in this case an increase in the Accident Rate).4 Reinforcing Loop R1 (Training Degradation) represents the unintended consequence of the knee-jerk reactions seen in B1. It is important to note that there is a critical delay in this loop between the Immediate Stress Level and Long Term Stress Level. This loop is also important because it describes how Long Term Stress and Complacency erode an organization’s initial training level.5 Next, Reinforcing Loop R2 (Stress Accumulation) is very similar to loop R1, with the exception that it recognizes the direct link between Complacency and Accident Propensity. Thus, it represents the high role that Complacency plays in causing vehicle accidents. Indeed, not only does complacency decrease Accident Resilience by eroding the training level in an organization, but it also contributes directly to Accident Propensity by decreasing driver awareness of hazards and limiting leader supervision.6 Reinforcing Loop R3 (Fatigue) represents another unintended consequence of immediate knee-jerk safety efforts (Short Term Safety Efforts). This loop is significant because it shows that when more work (via increased safety efforts in this case) is created and more stress exists in an organization, workers will not use their rest time effectively and will have a need to “blow off steam” and relax some. In many cases, these burnt out/stressed out Soldiers will spend hours playing video games, talking on the phone and chatting on the internet in lieu of getting some effective sleep.7 Balancing Loop B2 (Long Term Safety Efforts) represents the dynamics of Long Term Safety Efforts or the process of institutional learning. While it appears that B2 is a helpful loop in reducing accidents, it is critical to note that there is a time delay between Lessons Learned and Changes to Doctrine and Training, which places a delay in the time it takes to see a reduction in the Accident Rate following an increase in the Accident Rate through this loop. In practice, this means it takes a lot longer to rectify safety deficiencies through careful study, consideration, and changes to training and doctrine at the highest levels of the organization. Therefore, this delay facilitates the tendency to make immediate knee jerk changes at unit level, which in most cases have a number of unintended side effects, are not well thought out solutions to the problem, and lead to increased levels of stress in a unit.8 Nevertheless, this loop is critical to the model because it allows for safety rules and procedures to change over time in reaction to environmental changes.
4 See Carroll, Rudolph and Hatakenaka “Learning From Experience in High-Hazard Organizations,” Carroll 1998, Dekker 2007, Cook 1999 and Cox 2006. 5 See Carroll, Rudolph and Hatakenaka “Learning From Experience in High-Hazard Organizations, Carroll 1998, Rudolph and Repenning 2002, Gunther 2002, Dorn “The Effects of Driver Training on Simulated Driving Performance,” Dekker 2007, Cook 1999, Murphy 1986, Selzer 1974, Homer 1985 and McKelvey 1988. 6 See Stave 1998, Slovic 1981, Carroll 1998 and Leveson “What System Safety Can Learn from the Columbia Accident.” 7 See Hefez 1987, Akerstedt 2002, Summala 1994, Dinges 1995, Chau 2002, Kirmil-Gray 1984, Kalimo 2000 and Brown 1994. 8 See Carroll, Rudolph and Hatakenaka “Learning From Experience in High-Hazard Organizations,” Garvin 1993, Huber 1991, Kock 1996, Leveson 1995 and Pate-Cornell 2004.

9
Balancing Loop B3 (Self Preservation) represents the dynamic relationship where as the Accident Rate increases, complacency decreases, which leads to a decrease in accident propensity and a decrease in the Accident Rate. This loop shows that as accidents occur more frequently, a larger proportion of Soldiers will be immediately impacted by the injuries or deaths that they witness. The closeness of these events plays an important role in increasing a Soldier’s tendency to execute their duties in a safer manner.9 Balancing Loop B4 (Too Much to Do) represents the loop where only so much Long Term Stress can build up before Soldiers begin to take matters into their own hands and eliminate the source of stress build up.10 It shows that as Immediate Safety Effort increases, the Immediate Stress Level will also increase, which will lead to an increase in the Long Term Stress Level and an increase in the Perceived Stress from Safety, which therefore will cause a decrease in the Immediate Safety Effort. Finally, it is important to note one of the critical exogenous variables in the model, Enemy Threat, which represents the idea that as the Enemy Threat increases, Soldiers’ perception of safety hazards decrease and therefore they are prone to violate safety regulations and procedures, which produces an increase in the Accident Propensity.
3.2 Proof of Concept Model After collecting the data, we created a Proof of Concept model. This process transformed the high-level concept model of Figure 3-3 into a low-level and more detailed model that uses model parameters for exogenous variables and equations for endogenous variables to create a mathematical model of the system that can be simulated by changing various exogenous variables over time. Appendix A shows a depiction of the low-level model as well as the equations (decision rules) used in the model. One of our key goals in developing the proof of concept model was to keep the model as simple as possible, focusing on the key endogenous loops that are most likely to bring out new insights regarding vehicle accident dynamics.
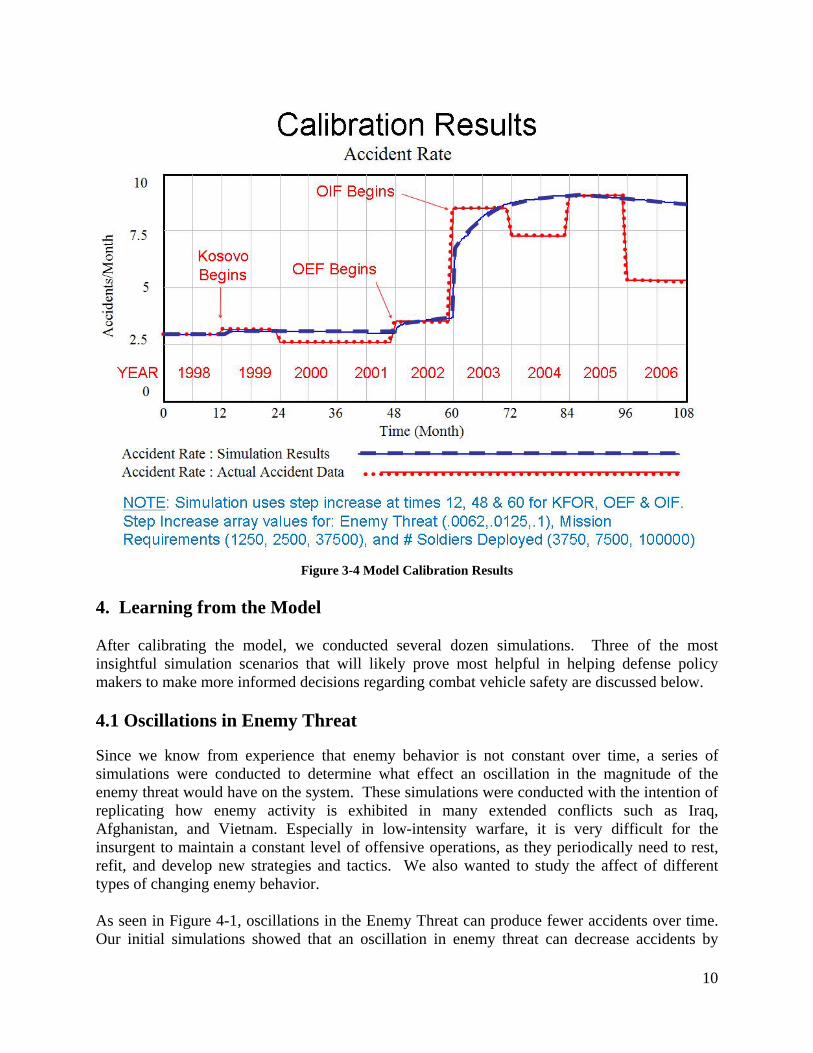
3.3 Calibrating the Proof of Concept Model In calibrating the model, the time period from 1998-2006 was used to validate the model. Time Step 12 shown in Figure 3-4 represents the rise of the Kosovo (KFOR) mission in 1999, time step 48 represents the invasion of Afghanistan (OEF-Operation Enduring Freedom) in 2002, and time step 60 represents the invasion of Iraq (OIF-Operation Iraqi Freedom) in 2003. Arrays of data were used to adjust the exogenous variables Enemy Threat, Mission Requirements, and Number of Soldiers Deployed across each of the three time steps. As can be seen in Figure 3-4, the simulated accident rate (the blue line) is very close to the actual historical accident rate (the red line). It is important to note that the historical data represents the annual average accident rate for each year, and therefore in reality would be more stochastic in nature.
9 See Stave 2005, Leveson “What System Safety Can Learn from the Columbia Accident,” Weinstein 1999, and Slovic 1981. 10 See Carroll, Rudolph and Hatakenaka “Learning From Experience in High-Hazard Organizations,” Carroll 1998, Murphy 1986, Selzer 1974 and Homer 1985
10
Figure 3-4 Model Calibration Results
4. Learning from the Model After calibrating the model, we conducted several dozen simulations. Three of the most insightful simulation scenarios that will likely prove most helpful in helping defense policy makers to make more informed decisions regarding combat vehicle safety are discussed below. 4.1 Oscillations in Enemy Threat Since we know from experience that enemy behavior is not constant over time, a series of simulations were conducted to determine what effect an oscillation in the magnitude of the enemy threat would have on the system. These simulations were conducted with the intention of replicating how enemy activity is exhibited in many extended conflicts such as Iraq, Afghanistan, and Vietnam. Especially in low-intensity warfare, it is very difficult for the insurgent to maintain a constant level of offensive operations, as they periodically need to rest, refit, and develop new strategies and tactics. We also wanted to study the affect of different types of changing enemy behavior. As seen in Figure 4-1, oscillations in the Enemy Threat can produce fewer accidents over time. Our initial simulations showed that an oscillation in enemy threat can decrease accidents by

11
7.5%. A careful study of the system showed that Long Term Stress Level does not accumulate to as great an extent when the threat oscillates as it does when the threat is constant, despite the same total threat over time. This is because the system has time to recover and “burn off” stress and fatigue when the Enemy Threat level is lower. This same phenomenon occurs with fatigue in the system.
Accident Accumulation Over Time Initial 36 Months 72 Months 108 Months
Base Line (No Increase in Enemy Threat) 0 102 204 306
Constant Threat Increase (5%) 0 178 423 668
Threat Increase of 5% with Oscillation 0 175 398 621
Figure 4-1 Impact of Oscillations in Enemy Threat
Figure 4-2 helps to explain why this is the case, as increased amplitudes in the enemy threat translates to more time being spent in smaller slope areas (specifically zones 1 and 3) on the graph of Relative Enemy Threat vs. Effect of Relative Enemy Threat on Accident Propensity. Because the relationship between these two variables is non-linear, there is a distinct tradeoff advantage for obtaining frequent periods of rest in return for similar periods of greater exposure to Enemy Threat.
Insights From an Oscillating Enemy Threat
Relative Enemy Threat
Effe
ct o
f Ene
my
Thre
at
on A
ccid
ent P
rope
nsity
Zone 1Zone 2
Zone 3
Figure 4-2 Relative Enemy Threat vs. Effect of Relative Enemy Threat on Accident Propensity
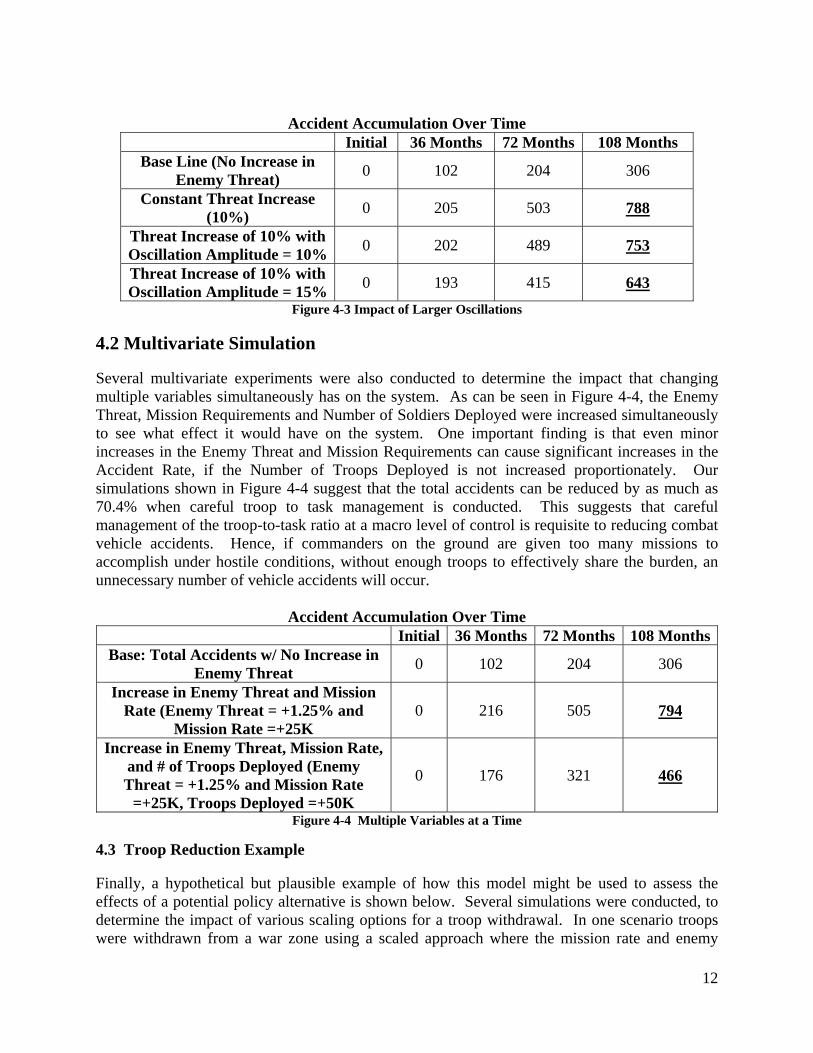
Figure 4-3 is an extension of this idea and shows that the same basic results apply among a wide range of values for amplitudes. The greatest improvements in the system occur when the greatest amplitudes are applied. This finding seems to suggest the importance of rotating Soldiers “off the line” and home on leave more frequently. Indeed, our simulation results shown in Figure 4-3 demonstrate that when oscillation in enemy threat is significant, accidents can be reduced by a total of 22.5% despite the same total enemy threat over time. This suggests that Soldiers who are exposed to high levels of enemy threat followed by equal periods of rest, where rest in this context is defined as non-exposure to an enemy threat, will be less likely to have accidents.
12
Accident Accumulation Over Time
Initial 36 Months 72 Months 108 Months Base Line (No Increase in
Enemy Threat) 0 102 204 306
Constant Threat Increase (10%) 0 205 503 788
Threat Increase of 10% with Oscillation Amplitude = 10% 0 202 489 753
Threat Increase of 10% with Oscillation Amplitude = 15% 0 193 415 643
Figure 4-3 Impact of Larger Oscillations
4.2 Multivariate Simulation Several multivariate experiments were also conducted to determine the impact that changing multiple variables simultaneously has on the system. As can be seen in Figure 4-4, the Enemy Threat, Mission Requirements and Number of Soldiers Deployed were increased simultaneously to see what effect it would have on the system. One important finding is that even minor increases in the Enemy Threat and Mission Requirements can cause significant increases in the Accident Rate, if the Number of Troops Deployed is not increased proportionately. Our simulations shown in Figure 4-4 suggest that the total accidents can be reduced by as much as 70.4% when careful troop to task management is conducted. This suggests that careful management of the troop-to-task ratio at a macro level of control is requisite to reducing combat vehicle accidents. Hence, if commanders on the ground are given too many missions to accomplish under hostile conditions, without enough troops to effectively share the burden, an unnecessary number of vehicle accidents will occur.
Accident Accumulation Over Time
Initial 36 Months 72 Months 108 MonthsBase: Total Accidents w/ No Increase in
Enemy Threat 0 102 204 306
Increase in Enemy Threat and Mission Rate (Enemy Threat = +1.25% and
Mission Rate =+25K 0 216 505 794
Increase in Enemy Threat, Mission Rate, and # of Troops Deployed (Enemy Threat = +1.25% and Mission Rate
=+25K, Troops Deployed =+50K
0 176 321 466
Figure 4-4 Multiple Variables at a Time
4.3 Troop Reduction Example Finally, a hypothetical but plausible example of how this model might be used to assess the effects of a potential policy alternative is shown below. Several simulations were conducted, to determine the impact of various scaling options for a troop withdrawal. In one scenario troops were withdrawn from a war zone using a scaled approach where the mission rate and enemy
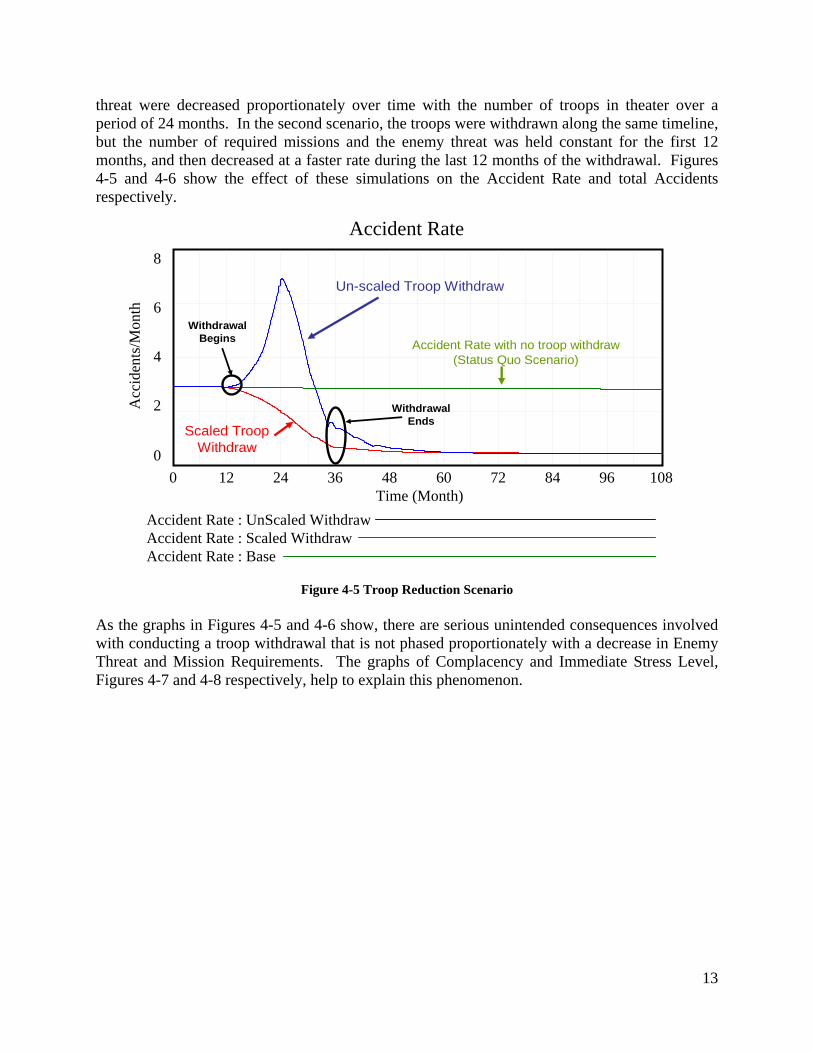
13
threat were decreased proportionately over time with the number of troops in theater over a period of 24 months. In the second scenario, the troops were withdrawn along the same timeline, but the number of required missions and the enemy threat was held constant for the first 12 months, and then decreased at a faster rate during the last 12 months of the withdrawal. Figures 4-5 and 4-6 show the effect of these simulations on the Accident Rate and total Accidents respectively.
Accident Rate8
6
4
2
00 12 24 36 48 60 72 84 96 108
Time (Month)
Acc
iden
ts/M
onth
Accident Rate : UnScaled WithdrawAccident Rate : Scaled WithdrawAccident Rate : Base
Scaled Troop Withdraw
Un-scaled Troop Withdraw
Accident Rate with no troop withdraw (Status Quo Scenario)
Withdrawal Begins
Withdrawal Ends
Figure 4-5 Troop Reduction Scenario
As the graphs in Figures 4-5 and 4-6 show, there are serious unintended consequences involved with conducting a troop withdrawal that is not phased proportionately with a decrease in Enemy Threat and Mission Requirements. The graphs of Complacency and Immediate Stress Level, Figures 4-7 and 4-8 respectively, help to explain this phenomenon.
14
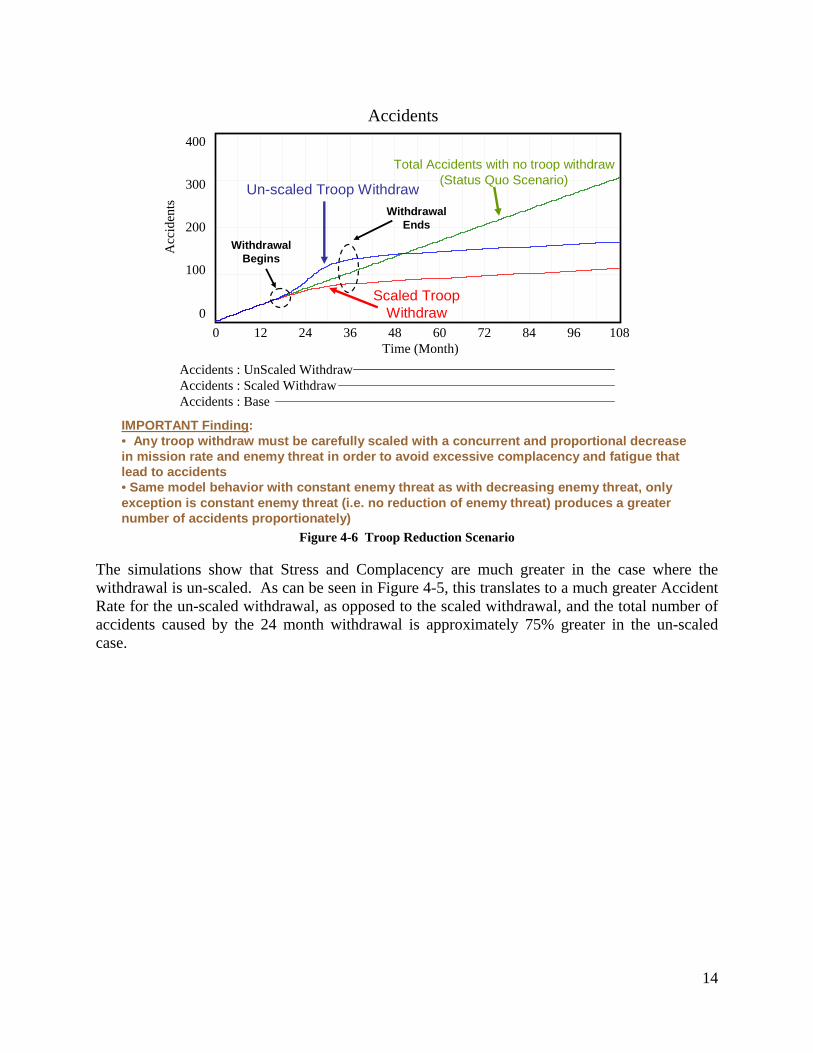
IMPORTANT Finding: • Any troop withdraw must be carefully scaled with a concurrent and proportional decrease in mission rate and enemy threat in order to avoid excessive complacency and fatigue that lead to accidents• Same model behavior with constant enemy threat as with decreasing enemy threat, only exception is constant enemy threat (i.e. no reduction of enemy threat) produces a greater number of accidents proportionately)
Accidents400
300
200
100
00 12 24 36 48 60 72 84 96 108
Time (Month)
Acc
iden
ts
Accidents : UnScaled WithdrawAccidents : Scaled WithdrawAccidents : Base
Scaled Troop Withdraw
Un-scaled Troop Withdraw
Total Accidents with no troop withdraw (Status Quo Scenario)
Withdrawal Begins
Withdrawal Ends
Figure 4-6 Troop Reduction Scenario
The simulations show that Stress and Complacency are much greater in the case where the withdrawal is un-scaled. As can be seen in Figure 4-5, this translates to a much greater Accident Rate for the un-scaled withdrawal, as opposed to the scaled withdrawal, and the total number of accidents caused by the 24 month withdrawal is approximately 75% greater in the un-scaled case.

15
Complacency2
1.5
1
0.5
00 12 24 36 48 60 72 84 96 108
Time (Month)
dmnl
Complacency : UnScaled WithdrawComplacency : Scaled WithdrawComplacency : Base
Scaled Troop Withdraw
Un-scaled Troop Withdraw
Complacency (Status Quo Scenario)
Withdrawal Begins Withdrawal
Ends
Figure 4-7 Complacency
It is also interesting to note that when the model is simulated for a troop withdrawal with a reduction in Mission Requirements only, and no reduction in Enemy Threat (a factor that often cannot be controlled), the model still exhibits the same behavior. The only exception occurs when the Enemy Threat is not reduced; in this case the total number of Vehicle Accidents will be greater than when the Enemy Threat is reduced over time.
Immediate Stress Level4
3
2
1
00 12 24 36 48 60 72 84 96 108
Time (Month)
dmnl
Immediate Stress Level : UnScaled WithdrawImmediate Stress Level : Scaled WithdrawImmediate Stress Level : Base
Scaled Troop Withdraw
Un-scaled Troop Withdraw
Immediate Stress level (Status Quo Scenario)Withdrawal
Begins
Withdrawal Ends
Figure 4-8 Stress
16
This model could be useful to a policy maker who is contemplating whether or not to conduct a troop withdrawal, and if so, how to conduct it. The results of this simulation would suggest that any troop withdrawal must be carefully scaled with a concurrent and proportional decrease in mission rate and enemy threat in order to avoid excessive complacency and fatigue that leads to accidents. 5. Conclusions The following conclusions are consistent with the findings in this study. The findings are derived from three sources; the literature review, construction of the model, and simulation using the model. Understanding Delays. Some of the greatest potential for improving safety can be found by understanding the dynamic effect of various delays in the system. In this model, these delays include the Time to Process Lessons, Lessons Implementation Time and Time to Implement Immediate Safety Effort. These are critical because they speed up the Long Term Safety Efforts Loop which would therefore facilitate a decrease in the Short Term Safety Efforts Loop. Balancing the Mission Rate/OPTEMPO with Availability of Troops is paramount to accident reduction. This must occur not only at lower-unit level (e.g. Battalion and Company levels), but also by war planners and decision makers at the highest levels of the military. This has a direct, but potentially unnoticed, impact on fatigue, complacency and stress which are major contributors to accidents. Troop Exposure to the Enemy Threat. Operating Environments with a fluctuating/oscillating enemy threat will produce fewer vehicle accidents than those with a constant (and proportional) enemy threat. This also suggests the benefit of rotating Soldiers out more frequently “off the line” or on “R&R”. In addition, shorter deployment times with more time off will have a critical impact on reducing complacency and fatigue which will lead to fewer accidents. Conduct of Accident Investigations. The Army has an outstanding After Action Review process that encourages continuous double loop learning throughout the organization. As Carroll, Rudolph and Hatakenaka (2005) describe, this process is made possible by open feedback of both positive and negative aspects of mission planning and execution by subordinates and superiors alike. While this process works well for learning from operations and training exercises where retribution is rarely taken for mistakes made, it is not the case with accident investigations. Since most soldiers believe that the purpose of an accident investigation is to assign blame, many soldiers and leaders involved in accident investigations are likely to remain silent. This is specifically the case with those most directly involved in the accident who have the most important information to share. Therefore, the Army should consider adopting a new approach to accident investigations that focuses on organizational learning in lieu of assigning blame. Therefore, perhaps the biggest contribution of this work is the idea that taking root causes up to the organizational level and focusing on organizational learning rather than assigning blame is critical to challenging and changing our pre-conceived mental models. This is critical in the military realm of thinking as our nation's security and the lives of our soldiers

17
depend on our ability to learn faster than our enemies, allowing us to constantly adapt to the new environments and challenges that we face. Finally, there are several lessons and policy recommendations that can be generalized for this study that apply beyond the military realm. First, this model can easily be parameterized for civilian domestic driving in the United States. For example, initial training for your average American driver is close to zero, and complacency is likely much greater than it is in the military context. In addition, the Lessons Learned loop in this model (Long Term Safety Efforts) could probably be deleted as there is no formalized system in the civilian sector for learning from vehicle accidents and then training or re-training the population. Further, civilian drivers are likely to get more hours of rest per day than the average soldier in combat. On the other hand, while the Enemy Threat may be different than in the military case, other drivers during rush hour who are eager to get home introduce a perhaps more dangerous and unpredictable variable than exists in even the military scenario. Therefore, many of the lessons that were discovered in the military context might easily apply to civilian vehicle safety. Major NATHAN MINAMI is an instructor of Systems Engineering at West Point. His education includes a B.S. from West Point and an M.S. from MIT. Major Minami has been deployed on numerous operational assignments around the world, including as an infantry company commander in Iraq. Dr. STUART MADNICK is the John Norris Maguire Professor of Information Technology and Professor of Engineering Systems at MIT. He has been a faculty member at MIT since 1972 and has served as the head of MIT's Information Technologies Group for more than twenty years. Dr. Madnick is the author or co-author of over 250 books, articles, or reports including the classic textbook, Operating Systems, and the book, The Dynamics of Software Development. Acknowledgements We would like to thank Nancy Leveson, John Sterman, Brian Sperling, Dan McCarthy, Kim Thompson, Thomas Moore, John Lyneis, Daniel Goldstein, Chris Bachmann and Keith DeGregory for reviewing and providing feedback on the model, slide-show presentation, and written report for this study. We also acknowledge and thank the reviewers of this paper for helpful comments and suggestions. Work reported herein was supported, in part, by the Singapore Defence Science and Technology Agency (DSTA) and the General Omar N. Bradley Research Fellowship in Mathematics.
References / Works Cited Akerstedt et al. “Sleep Disturbances, Work Stress and Work Hours: A Cross-Sectional Study.” Journal of Psychosomatic Research. 2002 Sep;53(3):741-8. Brown, I.D. “Driver Fatigue.” Human Factors. Vol 36, Iss 2; Jun 1994. pp. 298-314. Carroll, John S., J. Rudolph & S Hatakenaka. “Learning From Experience in High-Hazard Organizations.” Downloaded on 19 December, 2007. http://ocw.mit.edu/NR/rdonlyres/Aeronautics-and-Astronautics/16-

18
358JSpring-2005/09BD2DD3-A2FE-4589-99A7-4EE545C1689D/0/carroll1.pdf Carroll, John S. “Organizational Learning Activities in High-Hazard Industries: The Logics Underlying Self-Analysis.” Journal of Management Studies. 35:6 November 1998, p. 699-717. Chau et. al. “Relationships between Some Individual Characteristics and Occupational Accidents in the Construction Industry.” Journal of Occupational Health 2002; 44: 131-139. Cook, Richard I. “Two Years Before the Mast: Learning How to Learn About Patient Safety.” Health Care. National Patient Safety Foundation, Chicago IL, 1999. Cox, S. & Jones, B. “Behavioural Safety and Accident Prevention: Short-Term ‘Fad’ or Sustainable ‘Fix’?” Process Safety and Environmental Protection. Vol 84, Iss B3. Special Issue: Human Factors and Management. May 2006, pp. 164-170. Dekker, S.; Siegenthaleer, D.; Laursen, Tom. “Six Stages to the New View of Human Error.” Safety Science Monitor, Vol 11 Iss 1. 2007 Department of the Army. “Composite Risk Management.” FM 5-19, August 2006. https://crc.army.mil/RiskManagement/detail.asp?iData=64&iCat=453&iChannel=25&nChannel=RiskManagement Dinges, DF. “An Overview of Sleepiness and Accidents.” Journal of Sleep Research. 1995 Dec;4(S2):4-14. Garvin, David. A. “Building a Learning Organization.” Harvard Business Review. Jul/Aug 93, Vol. 71 Issue 4, p 78-91. Hefez, Metz & Lavie. “Long-term Effects of Extreme Situational Stress on Sleep and Dreaming.” Am J Psychiatry 1987; 144:344-347. Homer, John. “Worker Burnout: A Dynamic Model with Implications for Prevention and Control.” System Dynamics Review. Vol 1, Iss 1, Sum1985. Huber, George P. “Organizational Learning: The Contributing Processes and the Literatures.” Organizational Science. Vol. 2, No. 1 (1991), pp. 88-115. Kalimo, Tenkanen, Harma, Poppius & Heinsalmi. “Job Stress and Sleep Disorders: Findings From the Helsinki Heart Study.” Stress Medicine. Vol 15, Num 2, 2000. pp. 65-75. Kirmil-Gray, Eagleston, Gibson & Thoresen. “Sleep Disturbance in Adolescents: Sleep Quality, Sleep Havits, beliefs about Sleep, and Daytime Functioning.” Behavioral Science. Vol 13, Num 5; Oct 1984. pp. 375-384.

19
Kock Jr., McQueen, & Baker. “Learning and Process Improvement in Knowledge Organizations: A Critical Analysis of Four Contemporary Myths.” The Learning Organization. 1996. Vol. 3, Iss. p. 31. Leveson, Nancy. “Safeware: System Safety and Computers,” Addison-Wesley, 1995. pp.45-53. Leveson, Nancy G. "System Safety Engineering: Back to the Future." Aeronautics and Astronautics, Massachusetts Institute of Technology, June 2002. Downloaded from the Internet on 20 February, 2008. http://sunnyday.mit.edu/book2.pdf Leveson, Nancy G. & Joel Cutcher-Gershenfeld. “What System Safety Can Learn from the Columbia Accident.” Downloaded from the internet on 20 April, 2007. http://sunnyday.mit.edu/papers/issc04-final.pdf LSU Libraries Special Collections. Statistical Summary: America's Major Wars. Retrieved from the web August 21, 2007. http://www.cwc.lsu.edu/other/stats/warcost.htm Lyneis, John. & Madnick, Stuart. "Preventing Accidents and Building a Culture of Safety: Insights from a Simulation Model." Working Paper CISL #2008-03, Feb 2008. Downloaded from the internet on 5 June 2008, http://web.mit.edu/smadnick/www/wp/2008-03.pdf McKelvey, Thomas C. “How to Improve the Effectiveness of Hazard & Operability Analysis.” IEEE Transactions on Reliability, Vol 37, No 2. Jun 1988. pp. 167-170. Murphy, L. DuBois, D. & Hurrell, J. “Accident Reduction Through Stress Management.” Journal of Business and Psychology. Vol 1, Num 1. Sep 1986. pp. 5-18. Oliva, R. and Sterman, J. D. (2001). "Cutting Coreners and Working Overtime: Quality Erosion in the Service Industry." Management Science 47(7): 894-914. Pate-Cornell, M.E. “Learning from the Piper Alpha Accident: A Postmordem Analysis of Technical and Organizational Factors.” Risk Analysis; Vol 13, Iss 2, Apr 2004. pp. 215-232. Rudolph, J. and N. Repenning (2002). "Disaster Dynamics: Understanding the Role of Quantity in Organization Collapse." Administrative Science Quarterly 47: 1-30. Selzer, Melvin & Vinokur, Amiram. “Life Events, Subjective Stress, and Traffic Accidents.” The American Journal of Psychiatry. Vol 131, Aug 1974. pp. 903-906 Slovic, Fischhoff, Lichtenstein & Roe. “Perceived Risk: Psychological Factors and Social Implications.” Proceedings of the Royal Society of London. Vol 376, No. 1764 Apr. 30, 1981. pp. 17-34. Stave, Christina. “Safety As A Process.” Thesis For the Degree of Doctor of Philosophy. Chalmers University of Technology. Goteborg, Sweden, 2005.
20
Sterman, John D. “Business Dynamics: Systems Thinking and Modeling for a Complex World.” Chicago, IL: Irwin/McGraw Hill, 2000. Summala H. & Mikkola T. “Fatal Accidents Among Car and Truck Drivers: Effects of Fatigue, Age and Alcohol Consumption.” Human Factos,1994 Jun;36(2):315-26. Weick, Karl and Karlene Roberts. Collective Mind in Organizations: Heedful Interrelating on Flight Decks. Administrative Science Quarterly. Vol. 38, No. 3 (Sep 1999) Weinstein, Neil D. "What Does it Mean to Understand a Risk? Evaluating Risk Comprehension." Journal of the National Cancer Institute Monographs, No 25, 1999.

Appendix A (Low Level Model)
AccidentsAccident Rate
NormalAccident Ratio
Relative TimeSpent on Missions
ImmediateStress Level
+
<TIME STEP>
Time for StressLevel Change
Normal StressLevel
Long TermStress Level
+
DesiredImmediate Safety
Effort
NormalAccident Rate
Lookup forImmediate Safety
Effort
Lookup ForEnemy ThreatLookup For Imm
Safety Effort
Lookup For StressFrom MSNs
NormalImmediate Safety
Effort
<MissionRequirement>
<Enemy Threat>
Complacency
LessonsBeing
Studied
Changes toTraining and
DoctrineNew LessonsLearned
Process Rate
Lessons RatioTime to Process
Lessons
Effectiveness ofChanges to TNG &
Doctrine
ImplementedChanges to
TNG &Doctrine
ImplementationRateLessons
ImplementationTime
+
AccidentPropensity
AccidentResillience
<Enemy Threat>
+
Table for EnemyThreat on Accident
Propensity
Table forComplacency on
Accident Propensity
Table for ImmediateSafety Effort on
Accident Resillience
Normal EnemyThreat
PropensityResillience Ratio+
-
+
ImmediateSafety EffortChange in Imm
Safety Effort
Time to ImplementImm Safety Effort +
+
++
<NormalImmediate Safety
Effort>
<NormalImmediate Safety
Effort>
<Normal StressLevel>
Effect ofComplacency on
Training LevelLookup for Effect of
Complacency onTraining Level
Effective RelativeTraining Level
+
-
<RelativeTraining Level>
+
<Time Spent onMissions>
Normal TimeSpent on Missions
Effective RestTime
Effect of ImmediateStress Level on Rest
Time<Ave Hours ofRest Per Day>
+
Table for Effect of ImmStress Level on Fatigue
-
Effect of Rest onFatigue Accumulation
Table for Effect of Reston Fatigue
Accumulation
Relative RestTime
Normal RestTime
+
+
B1
Short TermSafety Efforts
B2
Long TermSafety Efforts
R1
Training LevelDegradation
R2
StressAccumulation
R3
Fatigue
Relative EnemyThreat
Effect of EnemyThreat on Accident
Propensity+
Effect ofComplacency on
Accident Propensity+
+
Effect of ImmediateSafety Effort on
Accident Resillience
RelativeImmediate Safety
Effort
+-
+
+
<AccidentRate>
<NormalAccident Rate>
Relative PerceivedAccident Rate
Effect of RelativePerceived Accident Rate
on ComplacencyTable for Effect ofAccident Rate on
Complacency
+
-
-
B3
SelfPreservation
PerceivedAccident
Rate Change inPerceived Accident
Rate-
Time to PerceiveChange in Accident
Rate
-
+
+
Relative LongTerm Stress Level
+
+
Effect of Long TermStress on Desired
Immediate Safety Effort
-
B4
Too Much to Do
RelativePerceived
Stress FromSafety Efforts
Time to PerceiveStress From Safety
+
+
Table for Stresson Safety Effort
+
RealizedEnemyThreat
Change inRealized Enemy
Threat
+
Time to RecognizeChange in Enemy
Threat
FatigueAccumulationChange in Fatigue
Accumulation
Time to AccumulateFatigue
Normal FatigueAccumulation
+
RelativeAccident Rate
Effect of Accident Rateon Desired Immediate
Safety Effort
MaximumEffectiveness
MinimumEffectiveness
Figure A-1. Low Level Model
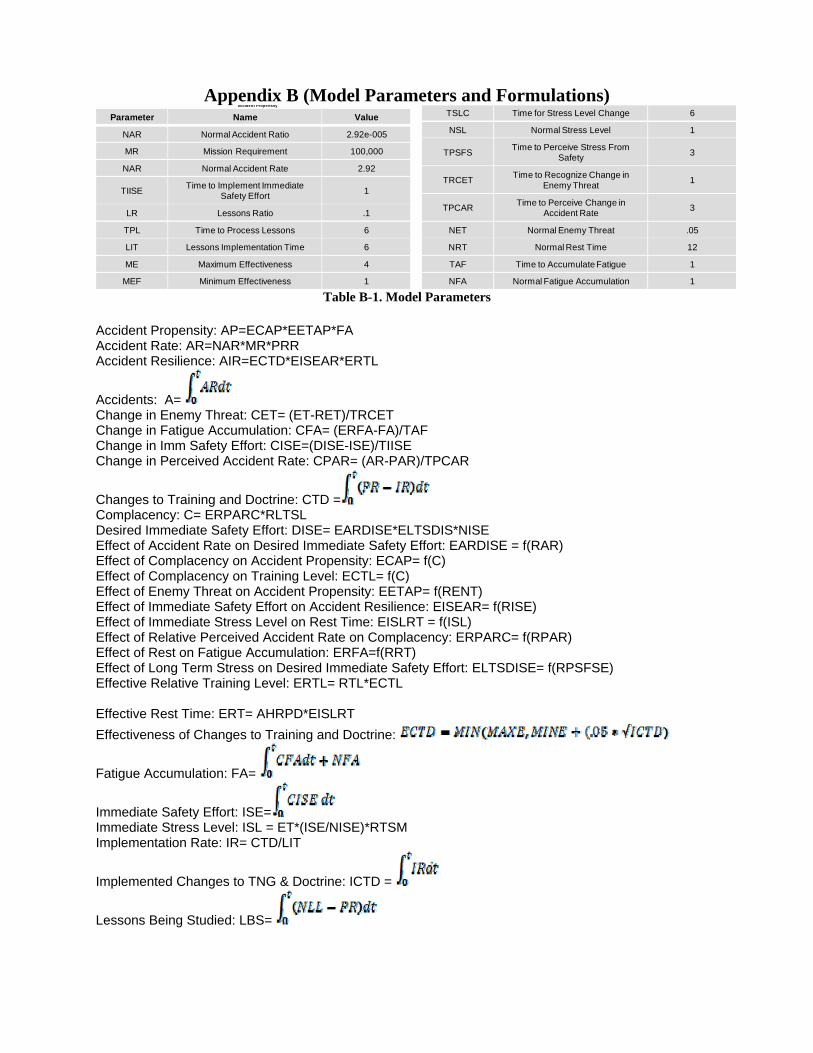
Appendix B (Model Parameters and Formulations) Parameter Name Value
NAR Normal Accident Ratio 2.92e-005
MR Mission Requirement 100,000
NAR Normal Accident Rate 2.92
TIISE Time to Implement Immediate Safety Effort 1
LR Lessons Ratio .1
TPL Time to Process Lessons 6
LIT Lessons Implementation Time 6
ME Maximum Effectiveness 4
MEF Minimum Effectiveness 1
TSLC Time for Stress Level Change 6
NSL Normal Stress Level 1
TPSFS Time to Perceive Stress From Safety 3
TRCET Time to Recognize Change in Enemy Threat 1
TPCAR Time to Perceive Change in Accident Rate 3
NET Normal Enemy Threat .05
NRT Normal Rest Time 12
TAF Time to Accumulate Fatigue 1
NFA Normal Fatigue Accumulation 1
Accident Propensity
Table B-1. Model Parameters Accident Propensity: AP=ECAP*EETAP*FA Accident Rate: AR=NAR*MR*PRR Accident Resilience: AIR=ECTD*EISEAR*ERTL
Accidents: A= Change in Enemy Threat: CET= (ET-RET)/TRCET Change in Fatigue Accumulation: CFA= (ERFA-FA)/TAF Change in Imm Safety Effort: CISE=(DISE-ISE)/TIISE Change in Perceived Accident Rate: CPAR= (AR-PAR)/TPCAR
Changes to Training and Doctrine: CTD = Complacency: C= ERPARC*RLTSL Desired Immediate Safety Effort: DISE= EARDISE*ELTSDIS*NISE Effect of Accident Rate on Desired Immediate Safety Effort: EARDISE = f(RAR) Effect of Complacency on Accident Propensity: ECAP= f(C) Effect of Complacency on Training Level: ECTL= f(C) Effect of Enemy Threat on Accident Propensity: EETAP= f(RENT) Effect of Immediate Safety Effort on Accident Resilience: EISEAR= f(RISE) Effect of Immediate Stress Level on Rest Time: EISLRT = f(ISL) Effect of Relative Perceived Accident Rate on Complacency: ERPARC= f(RPAR) Effect of Rest on Fatigue Accumulation: ERFA=f(RRT) Effect of Long Term Stress on Desired Immediate Safety Effort: ELTSDISE= f(RPSFSE) Effective Relative Training Level: ERTL= RTL*ECTL
Effective Rest Time: ERT= AHRPD*EISLRT Effectiveness of Changes to Training and Doctrine:
Fatigue Accumulation: FA=
Immediate Safety Effort: ISE= Immediate Stress Level: ISL = ET*(ISE/NISE)*RTSM Implementation Rate: IR= CTD/LIT
Implemented Changes to TNG & Doctrine: ICTD =
Lessons Being Studied: LBS=
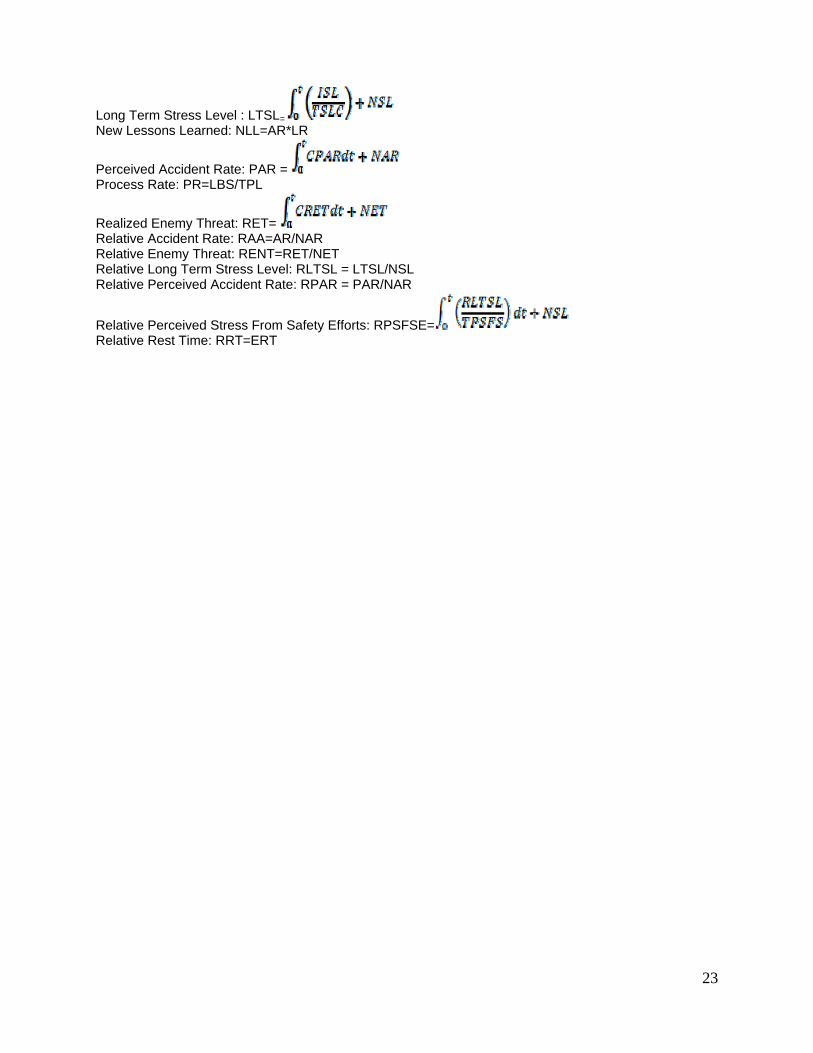
23
Long Term Stress Level : LTSL= New Lessons Learned: NLL=AR*LR
Perceived Accident Rate: PAR = Process Rate: PR=LBS/TPL
Realized Enemy Threat: RET= Relative Accident Rate: RAA=AR/NAR Relative Enemy Threat: RENT=RET/NET Relative Long Term Stress Level: RLTSL = LTSL/NSL Relative Perceived Accident Rate: RPAR = PAR/NAR
Relative Perceived Stress From Safety Efforts: RPSFSE= Relative Rest Time: RRT=ERT