dynamic analysis ii - cse.tkk.fi · • gdb • ida debugger • python debugger module for...
TRANSCRIPT

Protecting the irreplaceable | f-secure.com
Reverse Engineering MalwareDynamic Analysis of Binary Malware IIJarkko Turkulainen
F-Secure Corporation

Advanced dynamic analysis
• Debugger scripting
• Hooking and library injection
• Instrumentation frameworks
• Emulators
February 29, 20122

Debugger automation with scripting
• Debuggers can be extended with flexible scripting languages like python
• Any debugging task can be automated: unpacking, decrypting strings, etc.
• Debuggers that support python scripting:
• Immunity debugger
• GDB
• IDA debugger• IDA debugger
• Python debugger module for Windows:
• PaiMei, reverse engineering framework includes ”PyDbg” module
• F-secure proprietary python Win32 debugger using ctypes
February 29, 20123

Example debugger script: Sober.Y URL’s
• Sober was a family of email-worms, written in Visual Basic
• It updated itself using a set of dynamically generated URL’s
• Reversing the URL generation algorithm was very challenging
• Developing an automated debugging script was much faster
DEMO: Case Sober.YDEMO: Case Sober.Y
February 29, 20124

Hooking and Library Injection
• Basic tracing and troubleshooting techniques
• Can be used in dynamic analysis and reverse engineering very effectively
• Hooks are not using debug API:
• Fast execution
• Not confused by anti-debugging tricks
• Intrusive (will modify the target address space)• Intrusive (will modify the target address space)
• Tools can be quite complicated, but good general-purpose hooking library helps
• Executed on real hardware, not safe
• Example use: Trace file I/O, registry and networking for analyzing program functionality
• Example use: Detect dynamically generated code sections for unpacking
February 29, 20125

Inline hooking
• Simple way to instrument binaries dynamically, without need to recompile programs
• Usually done by inserting branches to the hooked (target) functions
• Hooking function gets the same parameters as target function
• After the analysis, target function gets back the control
• Analysis code in the hooking function needs memory space• Analysis code in the hooking function needs memory space
• Position-independent shellcode can be inserted anywhere in the memory space, but more common method is to provide code by injecting dynamically loaded library
February 29, 20126

Inline hooking on Intel x86
February 29, 20127

More x86 hooking details
• The branch requires 5 bytes from Target function (JMP opcode E9 + 4 bytes offset)
• Target function needs to be disassembled at least 5 bytes, up to next instruction boundary
• For example, in this Target, three instructions needs to be copied to the Trampoline:
February 29, 20128

Inline hooking on ARM
• Analogous to x86 procedure, use branch (B) and branch with link (BL) instead of JMP/CALL
• In theory, no need for disassembler as the instruction size is constant
• In practice, disassembler is needed for determining the code type (ARM/Thumb) of the Target
• Some caveats:
• ARM branches are PC-relative with +/- 32M range. If this is not enough, branch needs to be arranged with at least two instructions:
ldr pc, [pc, #-4] ; load pc with the address following
.word 0x11223344 ; trampoline absolute address
• ARM/Thumb transitions make things complicated (need to use Branch with eXchange BX/BLX)
February 29, 20129

PE IAT hooking
• Basic idea: hook by replacing the pointer in import address table (IAT) to the hooking function
• IAT can be easily parsed from the PE headers
• Hooking function in inserted in the address space by library injection
February 29, 201210
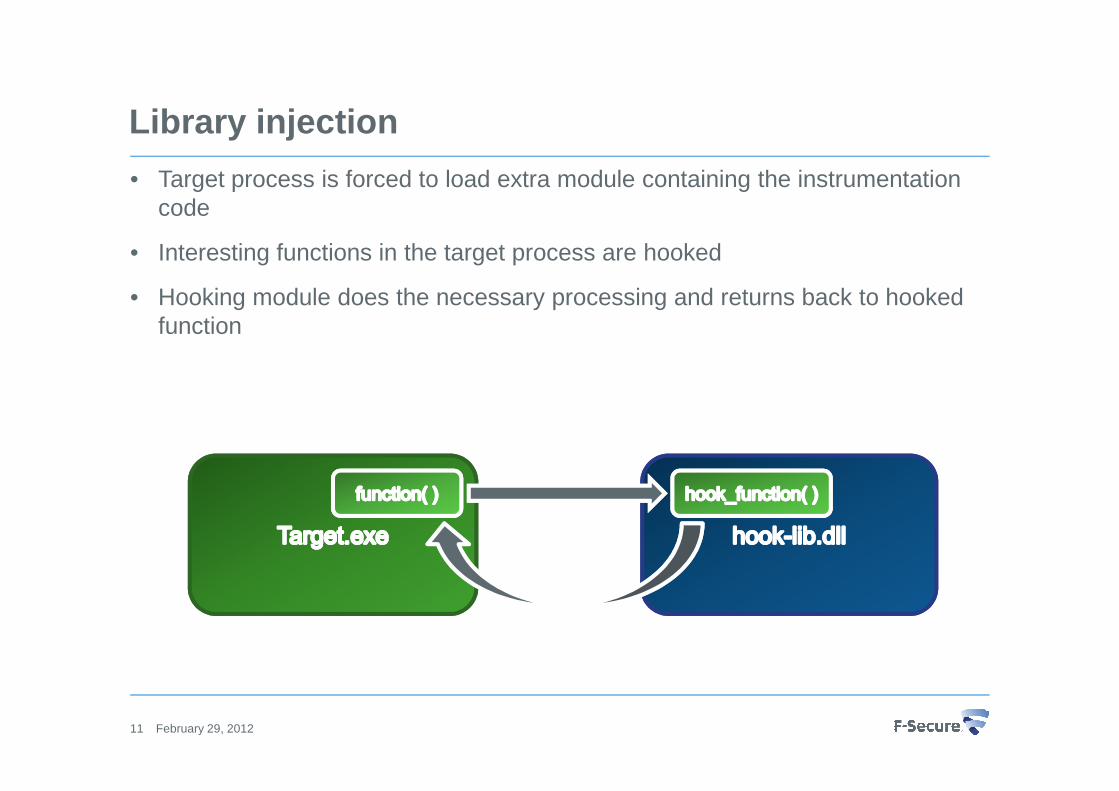
Library injection
• Target process is forced to load extra module containing the instrumentation code
• Interesting functions in the target process are hooked
• Hooking module does the necessary processing and returns back to hooked function
February 29, 201211

Library injection on Windows
• Simple procedure for injecting to running process on non-ASLR (Address Space Layout Randomization) platforms:
• Open process handle with OpenProcess()
• Allocate space from the target process with VirtualAllocEx()
• Write a name of the hook DLL in allocated buffer
• Determine the address of LoadLibrary() with GetProcAddress()
• Call CreateRemoteThread() with LoadLibrary() as entry point and allocated buffer as argument
• For ASLR-platforms:
• Another buffer contains a shellcode that will parse GetProcAdress() and LoadLibrary() entry points from the kernel32.dll and load the hook module. Shellcode prototype: void shellcode(char * hook_dll)
• CreateRemoteThread() is called with shellcode as entry point and buffer containing the hook DLL name as argument
February 29, 201212

Library injection on Windows continued
• Library injection for non-running process:
• Execute file with CreateProcess() , use CREATE_SUSPENDED in dwCreationFlags. This creates a process with suspended main thread.
• The process handle can be used for writing a library loading shellcode as explained in the previous slide
• Shellcode can be executed by inserting a jump to the entry point of the executableexecutable
• After the library has been loaded, entry point is fixed and process main thread is resumed with ResumeThread()
February 29, 201213

Library injection on Linux/Android
• Process manipulation with
long ptrace(enum __ptrace_request request, pid_t pid, void * addr, void * data);
• For non-ASLR:
• Attach to process with request PTRACE_ATTACH
• Get registers with PTRACE_GETREGS
• Get backup of original data and write a small library loading shellcode directly to the instruction pointer with PTRACE_PEEKDATA/PTRACE_POKEDATAinstruction pointer with PTRACE_PEEKDATA/PTRACE_POKEDATA
• Continue process with PTRACE_CONT
• Shellcode loads the hook module with dlopen() and dlsym() and executes breakpoint instruction
• Breakpoint is caught, original data is restored with PTRACE_POKEDATA, instruction pointer is restored with PTRACE_SETREGS and process is released with PTRACE_DETACH
• For ASLR:
• In the shellcode, dlopen() and dlsym() needs to rewritten by using Linux system calls
February 29, 201214

Example hooking library: Detours
• Microsoft Research hooking/injection library for x86/amd64/ia64 Windows
• Uses flexible inline hooking technique presented in slide 4
• Understands native functions and managed code (MSIL)
• Detours DLL is loaded with library injection:
• Dynamically, as explained in slide 9
• Statically, by modifying the target import table for loading the Detours DLL • Statically, by modifying the target import table for loading the Detours DLL before target entry point executes (DetourCreateProcessWithDLL() )
• Hooks are inserted conveniently with DetourAttach() and removed with DetourDetach()
February 29, 201215

Example tool: FIST
• FIST: F-secure Interactive System Trace
• Proprietary tool for generic unpacking on x86 Windows
• Hooks most kernel32.dll, advapi32.dll, msvcrt.dll, shell32.dll and user32.dll functions
• Hook functions compare the code in return address to the disk image
February 29, 201216
• If the return address was modified, the code is possibly near the original entry point
• Based on the fact that most non-trivial programs need to use Win32 API’s
DEMO

Instrumentation frameworks
• Dynamic manipulation of programs using binary instrumentation
• Good for profiling and debugging, but also writing reverse engineering tools
• More flexible than function hooking:
• Instrument instructions, basic blocks
• Instrument system calls
• Inspect memory read/write• Inspect memory read/write
• … And much more
• Major frameworks: DynamoRIO, Pin, Valgrind
• Problems with some packed files!
DEMO: DynamoRIO
February 29, 201217

Closer look at Valgrind
• Open source (GPL) instrumentation framework
• Supports Linux, Android and OSX
• Uses dynamic compiler for rewriting the code at runtime
• Plugins are written in C
• Valgrind core disassembles code blocks in intermediate representation, which is instrumented with the plugin, and then converted back to native codeis instrumented with the plugin, and then converted back to native code
• Resulting translation is cached for later use
• Only the user-mode code is translated
• System calls are executed directly
• For more information, see ”Valgrind: A Framework for Heavyweight Instrumentation” (http://valgrind.org/docs/valgrind2007.pdf)
February 29, 201218

Using emulators for tracing and instrumentation
• Emulators can be used for tracing by instrumenting code outside the OS
• By definition, it is non-intrusive
• Target executed on emulated hardware, more safe than debugging and hooking
• Instrumentation API:
• Interface for hooking up instructions, exceptions etc.• Interface for hooking up instructions, exceptions etc.
• Example: bochs instrumentation API
• Debugging API:
• Emulator can export standard debugger API, such as GDB
• Example: qemu GDB stub
February 29, 201219

Emulator types
• Hardware
• Emulator is sharing the hardware resources with the host machine
• CPU instructions run directly on real CPU
• Good performance
• Examples: VMWare, VirtualBox, Xen
• Software• Software
• Emulator implemented using software
• CPU instructions are interpreted or translated dynamically
• Can be quite slow
• Examples: Bochs, Qemu, FSSandbox
February 29, 201220

Emulator example: Bochs instrumentation API
• Bochs: open-source PC (x86/amd64) emulator
• Uses interpretation for emulating the instructions
• Interpretation makes Bochs very portable, it runs on any C++ environment
• Supports powerful instrumentation with C++
• Callbacks for
• CPU events, like interrupts and exceptions• CPU events, like interrupts and exceptions
• CPU instructions
• Support functions, such as memory I/O
February 29, 201221
Emulator example: Using the Qemu GDB stub
• Qemu: open-source multi-platform emulator
• Uses dynamic code translation for speeding up the emulation
• Supports debugging via the built-in GDB stub
• Qemu GDB stub features:
• Non-intrusive
• Breakpoints are implemented in the stub (”hardware”)• Breakpoints are implemented in the stub (”hardware”)
• VM time stops when the stub is waiting for input
• GDB supports python scripting
• Flexible system-level tracing tools
DEMO: Android system call trace
February 29, 201222

Emulator example: FSSandbox debugger plugin
• FSSandbox: F-secure proprietary sandbox environment for AV engines
• IDA plugin uses the IDA debugger API for interfacing FSSandbox
DEMO
February 29, 201223

Attacking emulators
• Malware has a lot of ways to detect emulators, roughly categorized as:
• Timing attacks
• OS implementation
• Hardware implementation
• Emulator-related software inside the OS, for example VMWare tools
• Emulators can also be attacked with denial of service attack:• Emulators can also be attacked with denial of service attack:
• Execute massive amount of instructions
• Emulators in AV engines cannot give too much clock cycles for the emulator
• Most dangerous attack on emulators is to escape from the emulated environment by using a bug in the emulator software
February 29, 201224

Detecting emulators: OS implementation
• If the emulator is not running full-blown OS, its API emulation can be easily detected
• Windows has huge amount of documented API’s and undocumented, still quite solid API’s
• Emulators try to return something even for unsupported API’s, just to keep execution ongoing
• Current malware uses a lot of API-related tricks to detect emulators• Current malware uses a lot of API-related tricks to detect emulators
• Some examples:
• Call API’s with bogus or unsupported parameters, verify return values
• Use of callback functions in the API’s for doing something useful
• Observe side-effects of API’s (register values, traces in stack etc.)
February 29, 201225

Detecting emulators: Hardware implementation
• Implementing a CPU emulator is a very complicated task:
• Intel x86/amd64 instruction set consists of ~500 instructions
• Paging and exception handling is complicated
• Full-blown PC emulator needs to implement a fair amount of hardware devices to be convincing
• Some examples for detecting emulator hardware:
• Detect missing CPUID information or inconsistencies (*)• Detect missing CPUID information or inconsistencies (*)
• Check implementation of complicated instructions, like CMPXCHG8B (*)
• Check non-zero Local Descriptor Table (LDT) to detect VMWare (*)
• Detect VMWare devices, for example ”VMWare PCI Express Root Port”
(*) Peter Ferrie: Attacks on More Virtual Machine Emulators (http://pferrie.tripod.com/papers/attacks2.pdf)
February 29, 201226

Emulator detection example: CPUID instruction
• CPUID is used to get the processor information:
• Vendor identification string, for example ”GenuineIntel”
• CPU type, family, model and stepping
• Supported instruction sets
• Other features, such as thermal and power management
• Software emulator needs to be consistent in CPUID return values and • Software emulator needs to be consistent in CPUID return values and features it can emulate
• Attacker can also check if such a CPU is really available in reality
• Almost all software emulators fail to be consistent
February 29, 201227

Emulator detection example: CPUID instruction
From Intel 64 and IA-32 Architectures Software Developer’s Manual:
February 29, 201228
