dw dm question bank solutions
TRANSCRIPT

8/7/2019 DW DM Question Bank Solutions
http://slidepdf.com/reader/full/dw-dm-question-bank-solutions 1/30
Data Warehousing and Data Mining Question Bank
1
Chapter 1 Introduction
1. With a simple block diagram, explain the steps involved in the process of knowledgediscovery. Or justify the statement Data mining is the process of discovering interesting
knowledge.
8/7/2019 DW DM Question Bank Solutions
http://slidepdf.com/reader/full/dw-dm-question-bank-solutions 2/30
Data Warehousing and Data Mining Question Bank
2
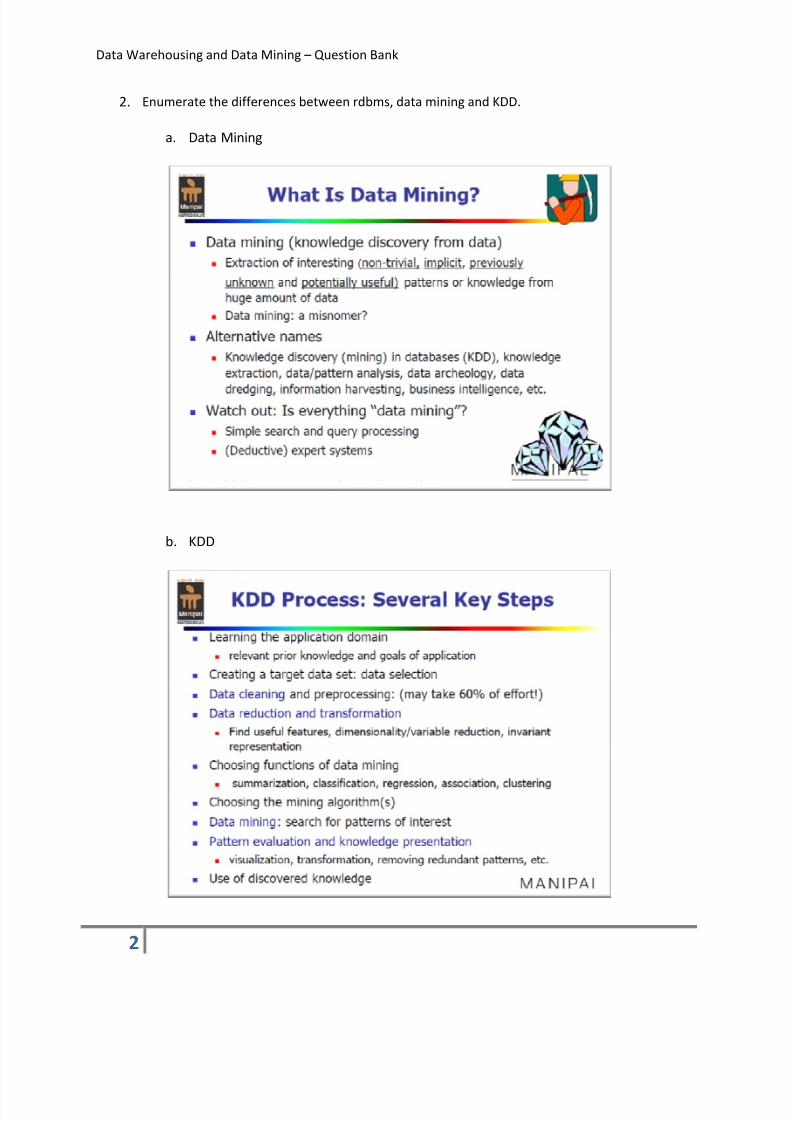
2. Enumerate the differences between rdbms, data mining and KDD.
a. Data Mining
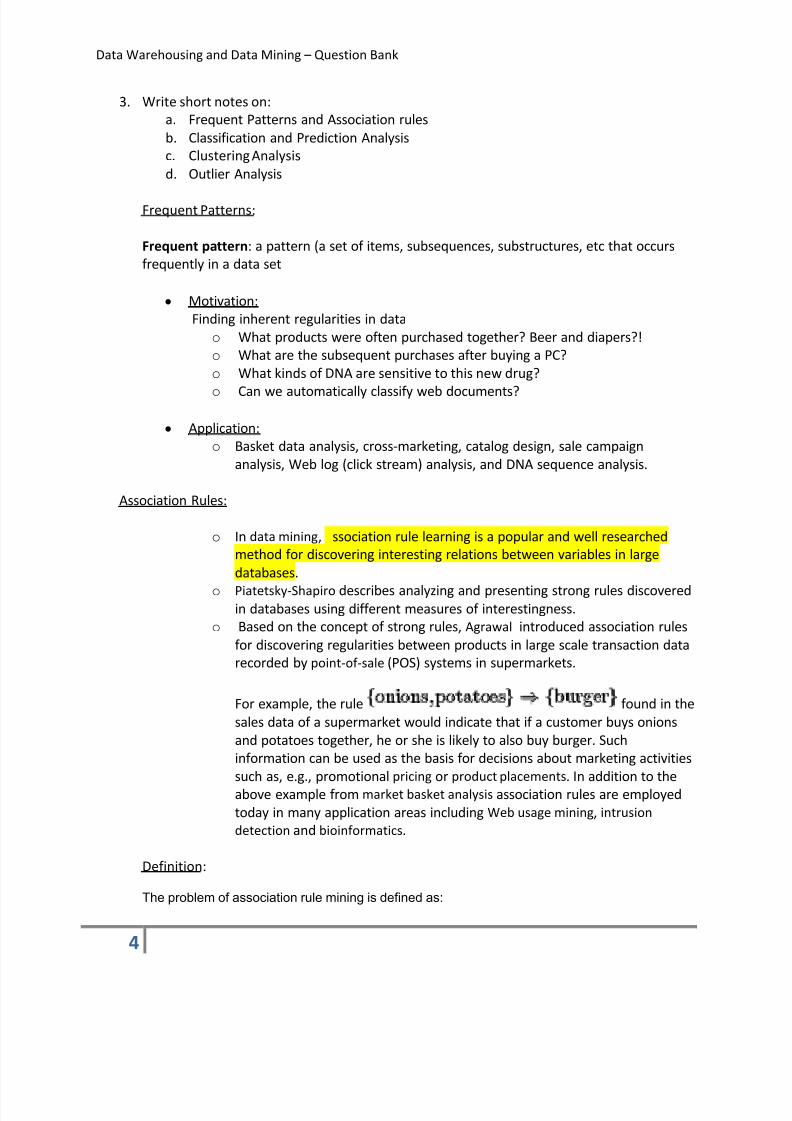
b. KDD

8/7/2019 DW DM Question Bank Solutions
http://slidepdf.com/reader/full/dw-dm-question-bank-solutions 3/30
Data Warehousing and Data Mining Question Bank
3
c. RDBMS:
8/7/2019 DW DM Question Bank Solutions
http://slidepdf.com/reader/full/dw-dm-question-bank-solutions 4/30
Data Warehousing and Data Mining Question Bank
4
3. Write short notes on:
a. Frequent Patterns and Association rules
b. Classification and Prediction Analysis
c. Clustering Analysis
d. Outlier Analysis
Frequent Patterns:
Frequent pattern: a pattern (a set of items, subsequences, substructures, etc that occurs
frequently in a data set
y Motivation:
Finding inherent regularities in data
o What products were often purchased together? Beer and diapers?!
o What are the subsequent purchases after buying a PC?
o What kinds of DNA are sensitive to this new drug?
o Can we automatically classify web documents?
y Application:
o Basket data analysis, cross-marketing, catalog design, sale campaign
analysis, Web log (click stream) analysis, and DNA sequence analysis.
Association Rules:
o In data mining, association rule learning is a popular and well researched
method for discovering interesting relations between variables in large
databases.
o Piatetsky-Shapiro describes analyzing and presenting strong rules discoveredin databases using different measures of interestingness.
o Based on the concept of strong rules, Agrawal introduced association rules
for discovering regularities between products in large scale transaction data
recorded by point-of-sale (POS) systems in supermarkets.
For example, the rule found in the
sales data of a supermarket would indicate that if a customer buys onions
and potatoes together, he or she is likely to also buy burger. Such
information can be used as the basis for decisions about marketing activities
such as, e.g., promotional pricing or product placements. In addition to the
above example from market basket analysis association rules are employed
today in many application areas including Web usage mining, intrusion
detection and bioinformatics.
Definition:
The problem of association rule mining is defined as:
8/7/2019 DW DM Question Bank Solutions
http://slidepdf.com/reader/full/dw-dm-question-bank-solutions 5/30
Data Warehousing and Data Mining Question Bank
5
o Let be a set of n binary attributes called items.
o Let be a set of m transactions called
the database. Each transaction in D has a unique transaction ID and contains
a subset of the items in I.
o A rule is defined as an implication of the
form where and .
o The sets of items (for short itemsets) X and Y are called antecedent (left-
hand-side or LHS) and consequent (right-hand-side or RHS) of the rule
respectively.
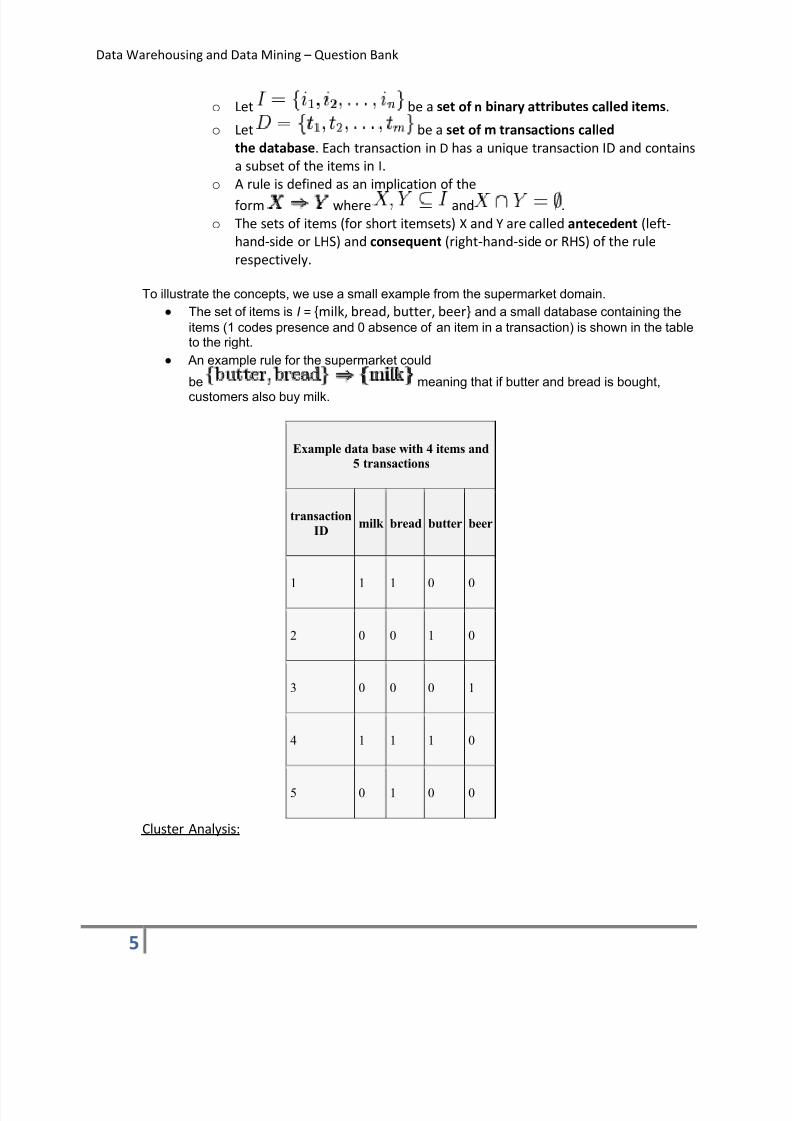
To illustrate the concepts, we use a small example from the supermarket domain.
y The set of items is I = {milk, bread, butter, beer} and a small database containing the
items (1 codes presence and 0 absence of an item in a transaction) is shown in the tableto the right.
y An example rule for the supermarket could
be meaning that if butter and bread is bought,
customers also buy milk.
Example data base with 4 items and
5 transactions
transaction
IDmilk bread butter beer
1 1 1 0 0
2 0 0 1 0
3 0 0 0 1
4 1 1 1 0
5 0 1 0 0
Cluster Analysis:

8/7/2019 DW DM Question Bank Solutions
http://slidepdf.com/reader/full/dw-dm-question-bank-solutions 6/30
Data Warehousing and Data Mining Question Bank
6
Outlier analysis:

8/7/2019 DW DM Question Bank Solutions
http://slidepdf.com/reader/full/dw-dm-question-bank-solutions 7/30
Data Warehousing and Data Mining Question Bank
7
4. Outline the major research challenges of mining in one specific application: Bioengineering
or Bio-informatics
Chapter 2: Data processing
5. Discuss the various methods of data cleaning and transformation

8/7/2019 DW DM Question Bank Solutions
http://slidepdf.com/reader/full/dw-dm-question-bank-solutions 8/30
Data Warehousing and Data Mining Question Bank
8

8/7/2019 DW DM Question Bank Solutions
http://slidepdf.com/reader/full/dw-dm-question-bank-solutions 9/30
Data Warehousing and Data Mining Question Bank
9
Handling noisy data:

8/7/2019 DW DM Question Bank Solutions
http://slidepdf.com/reader/full/dw-dm-question-bank-solutions 10/30
Data Warehousing and Data Mining Question Bank
10

8/7/2019 DW DM Question Bank Solutions
http://slidepdf.com/reader/full/dw-dm-question-bank-solutions 11/30
Data Warehousing and Data Mining Question Bank
11
Data Transformation

8/7/2019 DW DM Question Bank Solutions
http://slidepdf.com/reader/full/dw-dm-question-bank-solutions 12/30
Data Warehousing and Data Mining Question Bank
12
6. For the following data:
a. Use smoothing by bin means to smooth the data
b. How will you determine outliers?
c. What are the other methods existing for smoothing?
13, 15,16,16,19,20,20,21,22,22,25,25,25,25,25,30,33,33,35,35,35,36,40,45,46,52,70
a. Smoothing by bin means:
a. Put the entries in to equal bins (e.g. 9 each into 3 bins)
b. Find the mean of all the entries in the bin
c. Replace all the entries with the mean value in the bin
Bin1: 13, 15, 16, 16, 19, 20, 20, 21, 22
Bin2: 22, 25, 25, 25, 25, 25, 30, 33, 33
Bin3: 35, 35, 35, 36, 40, 45, 46, 52, 70
Mean for Bin1: 18
Mean for Bin2: 27
Mean for Bin3: 44
Smoothing by bin means yields:
y Bin1: 18, 18, 18, 18, 18, 18, 18, 18
y Bin2: 27, 27, 27, 27, 27, 27, 27, 27
y Bin3: 44, 44, 44, 44, 44, 44, 44, 44

8/7/2019 DW DM Question Bank Solutions
http://slidepdf.com/reader/full/dw-dm-question-bank-solutions 13/30
Data Warehousing and Data Mining Question Bank
13
b. Outliers are data objects that do not comply to the general behavior
c. Other smoothing techniques include:
a. Smoothing by equal frequency
b. Smoothing by bin means
c. Smoothing by bin boundaries
7. Discuss the various methods of data discretization and concept
hierarchies for numerical data

8/7/2019 DW DM Question Bank Solutions
http://slidepdf.com/reader/full/dw-dm-question-bank-solutions 14/30
Data Warehousing and Data Mining Question Bank
14
a. Binning Refer question #4 for explanation
b. Histogram analysis
c. Clustering

8/7/2019 DW DM Question Bank Solutions
http://slidepdf.com/reader/full/dw-dm-question-bank-solutions 15/30
Data Warehousing and Data Mining Question Bank
15
d. Entropy based discretization

8/7/2019 DW DM Question Bank Solutions
http://slidepdf.com/reader/full/dw-dm-question-bank-solutions 16/30
Data Warehousing and Data Mining Question Bank
16

8/7/2019 DW DM Question Bank Solutions
http://slidepdf.com/reader/full/dw-dm-question-bank-solutions 17/30
Data Warehousing and Data Mining Question Bank
17

8/7/2019 DW DM Question Bank Solutions
http://slidepdf.com/reader/full/dw-dm-question-bank-solutions 18/30
Data Warehousing and Data Mining Question Bank
18
e. Interval merge by X2 analysis
f. Segmentation by natural partitioning

8/7/2019 DW DM Question Bank Solutions
http://slidepdf.com/reader/full/dw-dm-question-bank-solutions 19/30
Data Warehousing and Data Mining Question Bank
19
8. Explain why normalization of data set is often required before it is
analyzed. Differentiate between min-max and z-score methods of data transformation for
the following dataset:
Sl. No Finger print feature Face recognition feature
1 0.57 120
2 0.28 122
3 0.15 85
4 0.72 27
5 0.91 12
6 0.40 51
The attribute data is scaled to fit in a specific range. There are many type of normalization
available:
a. Min-Max Normalization
b. Z-score normalization
Min Max Normalization:
It transforms a value A to B which fits in the range[C, D]. It is given the below formula

8/7/2019 DW DM Question Bank Solutions
http://slidepdf.com/reader/full/dw-dm-question-bank-solutions 20/30
Data Warehousing and Data Mining Question Bank
20
In the dataset given above, let [C, D] be equal to [0.0, 1.0]. The normalized values
are given below
E.g.
1. Finger print feature:
Let A = 0.28, Min (A) = 0.15, Max (A) = 0.91.
Hence B = ((0.28 -0.15) / (0.91 0.15) * (1-0)) + 0 = (0.13/0.76) * 1 = 0.17
Similarly fill in the values for other columns.
2. Face recognition feature
Let A = 85, Min (A) = 12, Max (A) = 122
Hence B = ((85 -12) / (122 12) * (1-0)) + 0 = (73/110) * 1 = 0.66
Similarly fill in the values for other columns.
Sl. No Finger print feature Face recognition feature
1 0.00
2 0.17
3 0.66
4
56
Z-score Method:
The standard score is
Where:
1. x is a raw score to be standardized;
2. is the mean of the population;
3. is the standard deviation of the population.
8/7/2019 DW DM Question Bank Solutions
http://slidepdf.com/reader/full/dw-dm-question-bank-solutions 21/30
Data Warehousing and Data Mining Question Bank
21
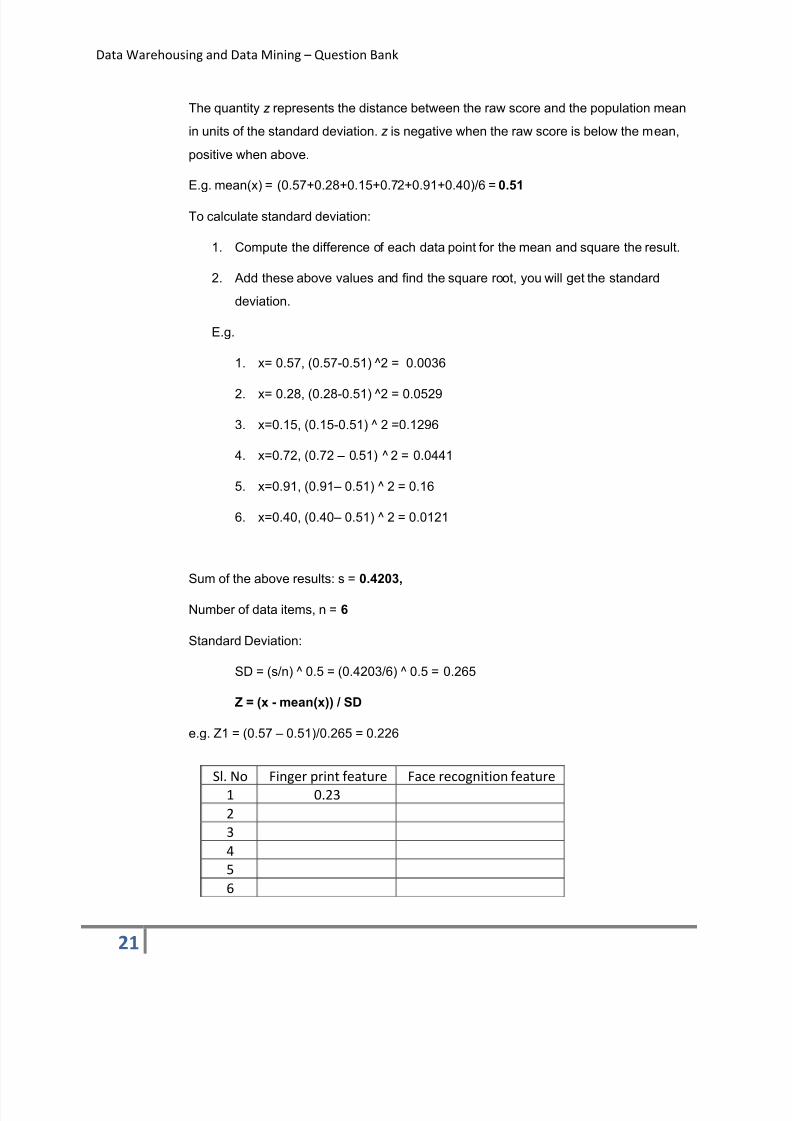
The quantity z represents the distance between the raw score and the population mean
in units of the standard deviation.z is negative when the raw score is below the mean,
positive when above.
E.g. mean(x) = (0.57+0.28+0.15+0.72+0.91+0.40)/6 =0.51
To calculate standard deviation:
1. Compute the difference of each data point for the mean and square the result.
2. Add these above values and find the square root, you will get the standard
deviation.
E.g.
1. x= 0.57, (0.57-0.51) ̂ 2 = 0.0036
2. x= 0.28, (0.28-0.51) ̂ 2 = 0.0529
3. x=0.15, (0.15-0.51) ^ 2 =0.1296
4. x=0.72, (0.72 ± 0.51) ^ 2 = 0.0441
5. x=0.91, (0.91± 0.51) ^ 2 = 0.16
6. x=0.40, (0.40± 0.51) ^ 2 = 0.0121
Sum of the above results: s = 0.4203,
Number of data items, n = 6
Standard Deviation:
SD = (s/n) ^ 0.5 = (0.4203/6) ^ 0.5 = 0.265
Z = (x - mean(x)) / SD
e.g. Z1 = (0.57 ± 0.51)/0.265 = 0.226
Sl. No Finger print feature Face recognition feature
1 0.23
2
3
4
5
6

8/7/2019 DW DM Question Bank Solutions
http://slidepdf.com/reader/full/dw-dm-question-bank-solutions 22/30
Data Warehousing and Data Mining Question Bank
22

8/7/2019 DW DM Question Bank Solutions
http://slidepdf.com/reader/full/dw-dm-question-bank-solutions 23/30
Data Warehousing and Data Mining Question Bank
23
Chapter 3: Data Warehousing
9. Compare and contrast database with data warehouse
y OLTP (On-line transaction processing) - Traditional Database systems
y OLAP (On-line analytical processing) Data Warehouse

8/7/2019 DW DM Question Bank Solutions
http://slidepdf.com/reader/full/dw-dm-question-bank-solutions 24/30
Data Warehousing and Data Mining Question Bank
24
10. Discuss 3 tier data warehouse architecture
The following are the 3 tiers of the dataware house:
a. Bottom tier Data warehouse database server
i. It has the data warehouse server
ii. Data is fed using back end tools and utilities
iii. Data is extracted using programs called gateways
iv. It also contains the meta data repository
b. Middle tier OLAP serveri. The middle tier is usually an OLAP server which is implemented using
either:
1. A relational OLAP model (ROLAP), i.e. an extended relational DBMS
that maps operations on multidimensional data to standard
relational operations.

8/7/2019 DW DM Question Bank Solutions
http://slidepdf.com/reader/full/dw-dm-question-bank-solutions 25/30
Data Warehousing and Data Mining Question Bank
25
2. A multidimensional OLAP model (MOLAP), i.e. a special purpose
server which directly implements the multidimensional data and
operations.
c. Top tier Front end tools
The top tier is a front end client layer that consists of querying and reporting tools,and /or data mining tools.
11. Clearly compare the following based on certain major issues: ROLAP,
MOLAP, and HOLAP.
In the OLAP world, there are mainly two different types:
a. Multidimensional OLAP (MOLAP)
b. Relational OLAP (ROLAP)
c. Hybrid OLAP (HOLAP) refers to technologies that combine MOLAP
andR
OL
AP.
MOLAP
This is the more traditional way of OLAP analysis. In MOLAP, data is stored in a
multidimensional cube. The storage is not in the relational database, but in proprietary
formats.
Advantages:
a. Excellent performance: MOLAP cubes are built for fast data retrieval, and are
optimal for slicing and dicing operations.
b. C an perform complex calculations: All calculations have been pre-generated when
the cube is created . Hence, complex calculations are not only doable, but they
return quickly.
Disadvantages:
a. C an handle only limited amount of data: Because all calculations are performed
when the cube is built, it is not possible to include a large amount of data in the
cube itself. This is not to say that the data in the cube cannot be derived from a
large amount of data.Indeed, this is possible. But in this case, only summary-level
information will be included in the cube itself.
b. Requires additional investment : Cube technologies are often proprietary and do not
already exists in the organization. Therefore, to adopt MOLAP technology, chances
are additional investments in human and capital resources are needed.
8/7/2019 DW DM Question Bank Solutions
http://slidepdf.com/reader/full/dw-dm-question-bank-solutions 26/30
Data Warehousing and Data Mining Question Bank
26
ROLAP
This methodology relies on manipulating the data stored in the relational database to give
the appearance of traditional OLAP's slicing and dicing functionality . In essence, each action
of slicing and dicing is equivalent to adding a "WHERE" clause in the SQ L statement.
Advantages:
a. C an handle large amounts of data: The data size limitation of ROLAP technology is
the limitation on data size of the underlying relational database. In other words,
ROLAP itself places no limitation on data amount.
b. C an leverage functionalities inherent in the relational database: Often, relational
database already comes with a host of functionalities. ROLAP technologies, since
they sit on top of the relational database, can therefore leverage these
functionalities.
Disadvantages:
a. P erformance can be slow: Because each ROLAP report is essentially a SQ L query (or
multiple SQ L queries) in the relational database, the query time can be long if the
underlying data size is large.
b. Limited by SQL functionalities: Because ROLAP technology mainly relies on
generating SQ L statements to query the relational database, and SQ L statements do
not fit all needs (for example, it is difficult to perform complex calculations using
SQ L), ROLAP technologies are therefore traditionally limited by what SQ L can do.
ROLAP vendors have mitigated this risk by building into the tool out-of-the-box
complex functions as well as the ability to allow users to define their own functions.
HOLAP
HOLAP technologies attempt to combine the advantages of MOLAP and ROLAP. For
summary-type information, HOLAP leverages cube technology for faster performance.
When detail information is needed, HOLAP can "drill through" from the cube into the
underlying relational data.
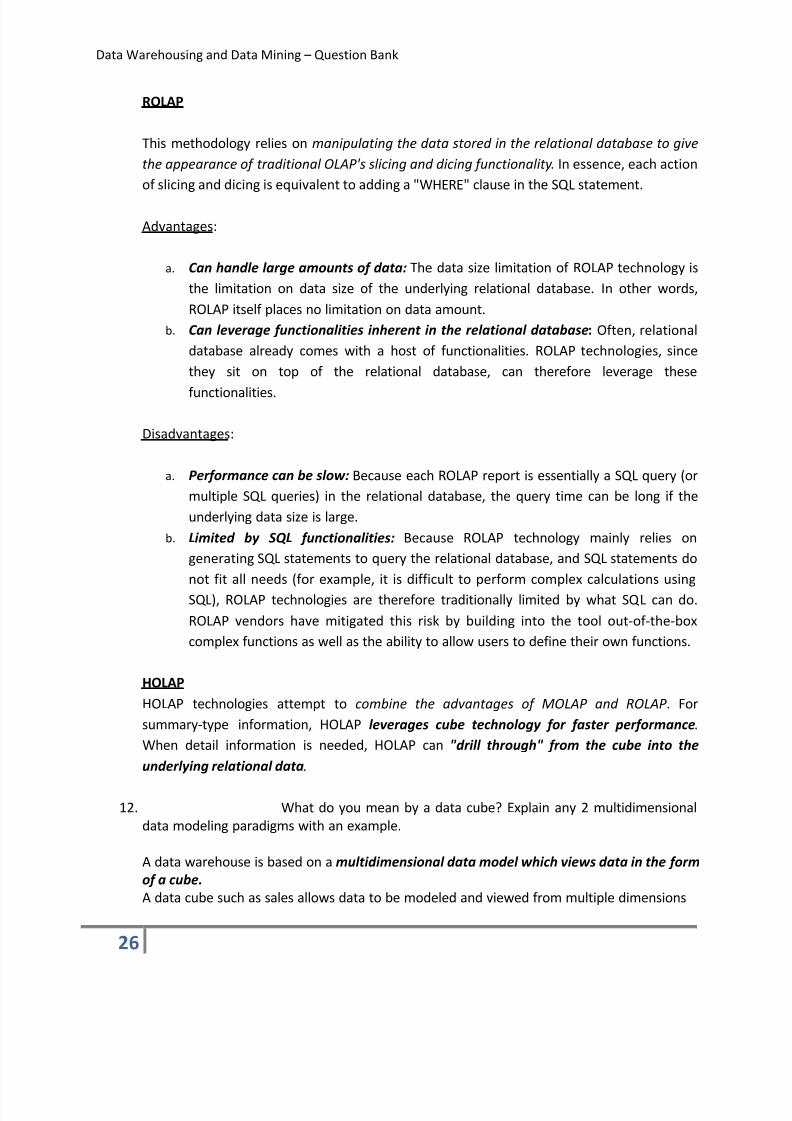
12. What do you mean by a data cube? Explain any 2 multidimensional
data modeling paradigms with an example.
A data warehouse is based on a multidimensional data model which views data in the form
of a cube.
A data cube such as sales allows data to be modeled and viewed from multiple dimensions

8/7/2019 DW DM Question Bank Solutions
http://slidepdf.com/reader/full/dw-dm-question-bank-solutions 27/30
Data Warehousing and Data Mining Question Bank
27
a. Dimension tables Item (item_name, brand, type) or time (day, week, month,
quarter, year). These tables represent the dimensions.
b. Fact table contains the measures (such as the dollars_sold) and keys to each of the
related dimension tables.
Multidimensional data modeling schemes:

8/7/2019 DW DM Question Bank Solutions
http://slidepdf.com/reader/full/dw-dm-question-bank-solutions 28/30
Data Warehousing and Data Mining Question Bank
28
8/7/2019 DW DM Question Bank Solutions
http://slidepdf.com/reader/full/dw-dm-question-bank-solutions 29/30
Data Warehousing and Data Mining Question Bank
29
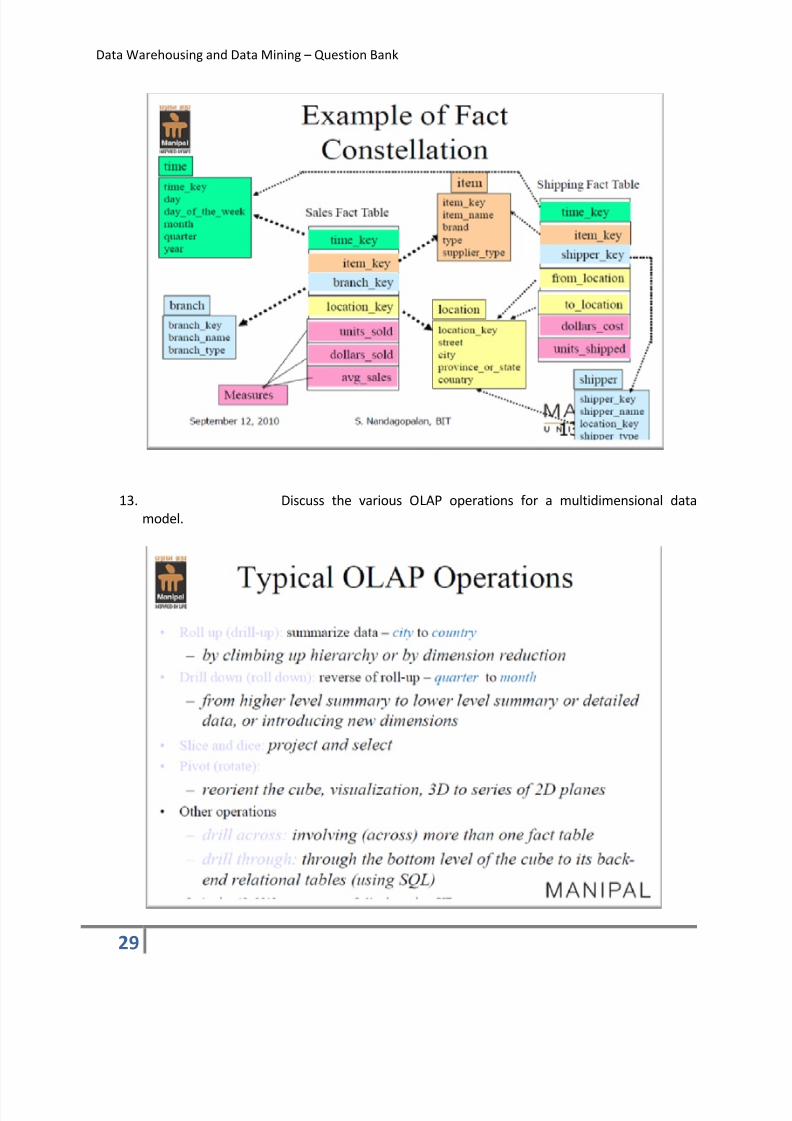
13. Discuss the various OLAP operations for a multidimensional data
model.

8/7/2019 DW DM Question Bank Solutions
http://slidepdf.com/reader/full/dw-dm-question-bank-solutions 30/30
Data Warehousing and Data Mining Question Bank
14. Suggest an integrated architecture for OLAM and OLAP for efficient
analytical processing of data cubes.