durham- scarborough bus rapid transit benefits case
TRANSCRIPT

DURHAM- SCARBOROUGH BUS RAPID TRANSIT BeNefITS CASeJune 2010
Durham-Scarborough Bus Rapid Transit Benefits Case
Final Report
June 2010
Prepared for: Prepared by:
Metrolinx 20 Bay Street, Suite 901 Toronto ON M5J 2N8
Steer Davies Gleave 970 - 355 Burrard Street Vancouver, BC V6C 2G8 In Association with: Economic Development Research Group Metropolitan Knowledge International

Durham-Scarborough Bus Rapid Transit Benefits Case
CONTENTS
EXECUTIVE SUMMARY............................................................................................. 1
PART A PROJECT RATIONALE ........................................................................... 1 Report Structure........................................................................................................................................... 2
Project Rationale ............................................................................................................................................ 2 Context and Need ........................................................................................................................................ 2 Project Objectives ....................................................................................................................................... 8
Project Overview ............................................................................................................................................ 9 Background.................................................................................................................................................... 9
Opportunities and Issues............................................................................................................................. 13 Local Transit Services................................................................................................................................ 13 GO Transit ................................................................................................................................................... 13 Scarborough – Durham Connection.......................................................................................................... 14 University of Ontario Institute of Technology and Durham College .................................................. 14
PART B OPTIONS.............................................................................................. 16
Project Options ............................................................................................................................................. 16
Base Case ........................................................................................................................................................ 16
Options ............................................................................................................................................................ 17 Option 1: Full BRT ...................................................................................................................................... 17 Option 2: BRT- Partial Exclusivity within Durham and Toronto ......................................................... 22 Option 3: BRT – Partial Exclusivity within Durham ............................................................................... 26
Summary of Options ..................................................................................................................................... 29
PART C ASSESSMENT ....................................................................................... 30
Evaluation Framework................................................................................................................................. 30
Transportation User Benefits..................................................................................................................... 30 Travel Time Savings ................................................................................................................................... 31 Automobile Operating Cost Savings ........................................................................................................ 31

Durham-Scarborough Bus Rapid Transit Benefits Case
Safety Benefits ........................................................................................................................................... 32 Qualitative Transportation Benefits ....................................................................................................... 32 Summary ...................................................................................................................................................... 32
Financial Account ......................................................................................................................................... 33 Ridership and Revenues ............................................................................................................................ 33 Capital and Operating Costs..................................................................................................................... 34 Summary ...................................................................................................................................................... 35
Comparing Benefits and Costs ................................................................................................................... 35
Environmental Impacts................................................................................................................................ 36 Greenhouse Gas Emissions........................................................................................................................ 36
Economic Development Impacts ............................................................................................................... 37 Temporary Economic Impacts During Construction.............................................................................. 37 Long-term Economic Impacts................................................................................................................... 38 Land Value Changes ................................................................................................................................... 39 Summary ...................................................................................................................................................... 41
Social Community Impacts.......................................................................................................................... 41 Land Use Shaping ....................................................................................................................................... 42 Road Network ............................................................................................................................................. 42 Construction................................................................................................................................................ 43
Sensitivity Analysis ....................................................................................................................................... 43
Summary of Results...................................................................................................................................... 44
FIGURES Figure 1 DurhAm region transit – potential Long-term Higher Order Transit corridors 3
Figure 2 DRT Ridership Levels 4
Figure 3 Highway 2 Corridor in Durham Region 5
Figure 4 Highway 2 – Ellesmere Corridor Regional Context 7
Figure 5 Urban Growth Centre - Pickering 10

Durham-Scarborough Bus Rapid Transit Benefits Case
Figure 6 Urban Growth Centre - Oshawa 11
Figure 7 Urban Growth Centre - Scarborough 12
Figure 8 Full BRT Cross-Section (illustrative) 17
Figure 9 Full BRT Cross-Section (illustrative) 23
Figure 10 Mixed Traffic BRT Cross-Section (illustrative) 23
TABLES Table 1 Option 1 Stops 19
Table 2 Option 1 – BRT Average Speeds and Travel times 20
Table 3 Option 1 Operating PLan 21
Table 4 Option 2 – BRT Average Speeds and Travel times 25
Table 5 Option 3 – BRT Average Speeds and Travel times 27
Table 6 Summary of Options 29
Table 7 Incremental Transportation User Benefits 33
Table 8 Passenger Forecasts (AM Peak Hour Load by direction, maximum) 33
Table 9 Capital and Operating Costs ($ Million) 35
Table 10 Incremental Costs and Revenues 35
Table 11 Comparison Benefits and Costs 36
Table 12 Reduction In CO2 Emissions 37
Table 13 Employment And Income Impacts During Construction 38
Table 14 Employment and income Impacts (2031) 39
Table 15 Property Value Uplift Factors 40
Table 16 Economic Development Impacts 41
Table 17 Discount Rate Sensitivity Analysis 44
Table 18 MAE Summary 46

Durham-Scarborough Bus Rapid Transit Benefits Case
1
Executive Summary
In 2006 the Province of Ontario created the Greater Toronto Transportation Authority, renamed
to Metrolinx in December 2007. The primary responsibilities of the new organisation are to provide leadership in the planning, financing and development of the Greater Toronto and
Hamilton Area’s (GTHA) multi-modal transportation network and to conform to the objectives and vision set out in the Province’s Greater Golden Horseshoe (GGH) Growth Plan.
Building on the Province’s $11.5 billion MoveOntario 2020 funding commitment for rapid transit expansion in the GTHA, Metrolinx developed the Regional Transportation Plan (RTP) to improve
mobility throughout the GTHA Region. The final RTP, entitled The Big Move, was approved by the
Metrolinx Board of Directors in November 2008. A new rapid transit line between Downtown Oshawa and Scarborough Centre along the Highway 2-Ellesmere corridor was identified as a Top
15 Priority Project in The Big Move.
In March 2008, the Province of Ontario committed a total of $82.3 million to Durham Region
through the Quick Wins initiative to support the implementation of Phase 1 BRT in the Highway 2
corridor. Key components of Phase 1 Highway 2 BRT include bus fleet expansion, improvements to six intersections, enhancing bus operations with Intelligent Transportation Systems (ITS)
infrastructure and expanding DRT maintenance facilities in Ajax and Oshawa, including a new central control centre. The Phase 1 BRT improvements are foundational components of the
broader Top 15 Priority Project proposed for the corridor in The Big Move.
As the rapid transit projects contemplated in The Big Move move closer to implementation, a
Benefits Case will be prepared for each project. The purpose of the Benefits Case is to undertake
a comparative analysis of feasible options for a specific rapid transit project and present the results in such a way that it will assist decision makers to select a preferred option for
implementation. The Benefits Cases help to identify the preferred project scope and inform project funding recommendations by the Metrolinx Board.
The Durham-Scarborough Bus Rapid Transit (BRT) initiative is one of the projects contemplated in MoveOntario 2020 and The Big Move, and was further identified in The Big Move as a Top 15
priority project. The project involves the provision of a higher order rapid transit service along
the Highway 2 corridor in Durham Region, linking Oshawa, Whitby, Ajax and Pickering, and along the Ellesmere Road corridor in Toronto to connect with the TTC’s rapid transit network at
Scarborough Centre.
The following three options have been identified for the Durham – Scarborough BRT project for
comparison against the Base Case. A summary description of each option is provided below.
I Base Case: Business as Usual
I Option 1: Full BRT – Centre Alignment with Significant Transit Priority

Durham-Scarborough Bus Rapid Transit Benefits Case
2
I Option 2: BRT – Centre Alignment with Partial Transit Priority within Durham and Toronto
I Option 3: BRT – Centre with Partial Transit Priority within Durham and Mixed Traffic Operations within Toronto
SUMMARY OF OPTIONS
Option 1 Option 2 Option 3
Opening Year 2015 2015 2015
Headway from Oshawa to Whitby (minutes) – 2021/2031
8 / 6 11 / 8 11 / 10
Headway from Whitby to Pickering (minutes) - 2021/2031
5 /3.5 7 / 5 7.5 / 6
Headway from Pickering to Scarborough (minutes) - 2021/2031
3 / 2.5 4 / 3 5 / 4
BRT Vehicles – 2021/2031 47 / 61 42 / 54 38 / 46
Travel time (end-to-end) 76.8 89.5 94.9
Capital Costs (2009 $) $498m $342m $277m
The assessment of the options is done using a Multiple Account Evaluation (MAE) methodology.
The MAE is a framework that provides a systematic identification and analysis of broader public
policy implications and criteria of an option, not only costs and user benefits. The MAE framework is based on a number of evaluation “accounts” that together address the most
significant project performance and policy considerations for a specific project:
I Transportation User Benefits
I Financial Impacts
I Environmental Impacts
I Economic Development Impacts
I Socio-Community Impacts
The assessment is done by comparing each option to the Base Case and identifying any
incremental impacts, costs or benefits that are generated by each option. The analysis is done over a 30-year period (2009-2038). In order to compare the options on a “like-to-like” basis the
monetized values are discounted to today’s value. The values are discounted at a real discount rate of 5% and expressed in net present value in 2009 dollars.

Durham-Scarborough Bus Rapid Transit Benefits Case
3
The analysis of the Durham-Scarborough BRT options reveals that the highest cost option (Option
1 – Full BRT), with estimated capital and operating costs of $444 million in net present value terms, yields transportation user benefits higher than the cost. The net present value of the
associated benefits is estimated at $525 million resulting in a benefit-cost ratio (BCR) of 1.2. Option 2 results in a slightly lower BCR of 1.1 compared to Option 1, with estimated capital and
operating costs of $307 million with an estimated $327 million in transportation user benefits.
Option 3 has the lowest estimated capital and operating costs at $246 million, but also yields the lowest benefits (estimated at $216 million), resulting in a BCR of 0.9.
Option 1 has the highest travel time savings (and highest ridership) due to the faster journey times offered by the exclusive BRT lanes along the entire length of the route, highlighting the
importance of the operating speed of the rapid transit system to the success of the project. Option 2 delivers less travel time savings than Option 1 but these are balanced by lower capital
and operating costs resulting in a slightly lower BCR. While Option 3 provides the lowest cost
option it also offers less benefits (reflected in lower BCR). The results demonstrate the impact of lower speeds due to mixed traffic operations along the Scarborough portion of the route under
Option 3, and conversely, the additional benefits provided by Options 1 and 2 exclusive bus lanes in this section of the route.
All of the options are relatively effective in attracting people out of their cars and reducing automobile usage. Option 1, which has the largest effect, will result in a reduction of greenhouse
gas emissions by approximately 6,600 tonnes annually by 2021 increasing to 9,600 tonnes annually
by 2031. In net present value terms, this equates to $3.8 million for Option 1 compared to $2.2 million and $1.1 million for Options 2 and 3 respectively.
Not surprisingly, the option with the highest capital costs generated the most significant economic development effects. Option 1, which has the highest capital cost, will have the largest
impact on employment, income and GDP during construction and is estimated to generate
approximately 1,903 person-years of employment (including direct and indirect effects). By contrast, the lowest cost option (Option 3) produces the lowest overall economic development
and employment benefits during construction as well as during the on-going operations (922 person-years).
The options support the land use and economic development objectives to revitalize the corridor by enhancing and supporting complementary planning and densification initiatives. However, the
effects are somewhat limited as the portion of the corridor in Durham Region is paralleled by the
existing Go Lakeshore East line. As well, research suggests BRT generally has less impact on property value uplift than rail-based rapid transit. The results show that Option 1 could provide
up to $59 million in property value uplift compared with up to $53 million for both Options 2 and 3.
Overall, the results indicate that a BRT transit route in the Ellesmere Road-Highway 2 corridor will generate transportation user, environmental and socio-economic benefits. The project

Durham-Scarborough Bus Rapid Transit Benefits Case
4
would also support the objectives of the GGH Growth Plan and The Big Move, including improving
linkages between three Urban Growth Centres, as well as supporting municipal planning objectives in the corridor. The higher level of BRT exclusivity under Options 1 and 2 result in
higher total benefits, reflecting the importance of enhanced transit service along the length of the corridor in both Scarborough and Durham Region.
The assumed route connecting the Hwy 2 corridor in Durham Region to the Ellesmere Corridor in
Toronto and station locations along the entire corridor in this Benefits Case Analysis does not
preclude other routing options and stop locations from being considered should the project proceed
to more advanced project development phases (e.g. preliminary design/engineering and
environmental assessment stages). Further opportunities to connect the Durham-Scarborough BRT
to existing and planned transit infrastructure within Toronto and Durham should also be explored in
future project development phases.
The table below summarizes the results from the MAE.
MULTIPLE ACCOUNT EVALUATION SUMMARY
Impact Option 1
Option 2
Option 3
Transportation User Account
Transportation User Benefits (PV $m) $525 $327 $216
Qualitative User Benefits
Financial Account
Costs (PV $m) $444 $307 $246
Benefits Less Costs (PV $m) $81 $20 ($30)
Benefit-Cost Ratio 1.2 1.1 0.9
Environmental Account
GHG Emissions (PV $m) 3.8 2.2 1.1
Economic Development Account
Economic Impacts During Construction
Employment (person-years)
GDP ($m)
Income ($m)
1,903
$166
$71.8
1,187
$104
$44.8
922
$81
$34.8
Long-term Economic Impacts (2031)
Employment (jobs)
39
30
26
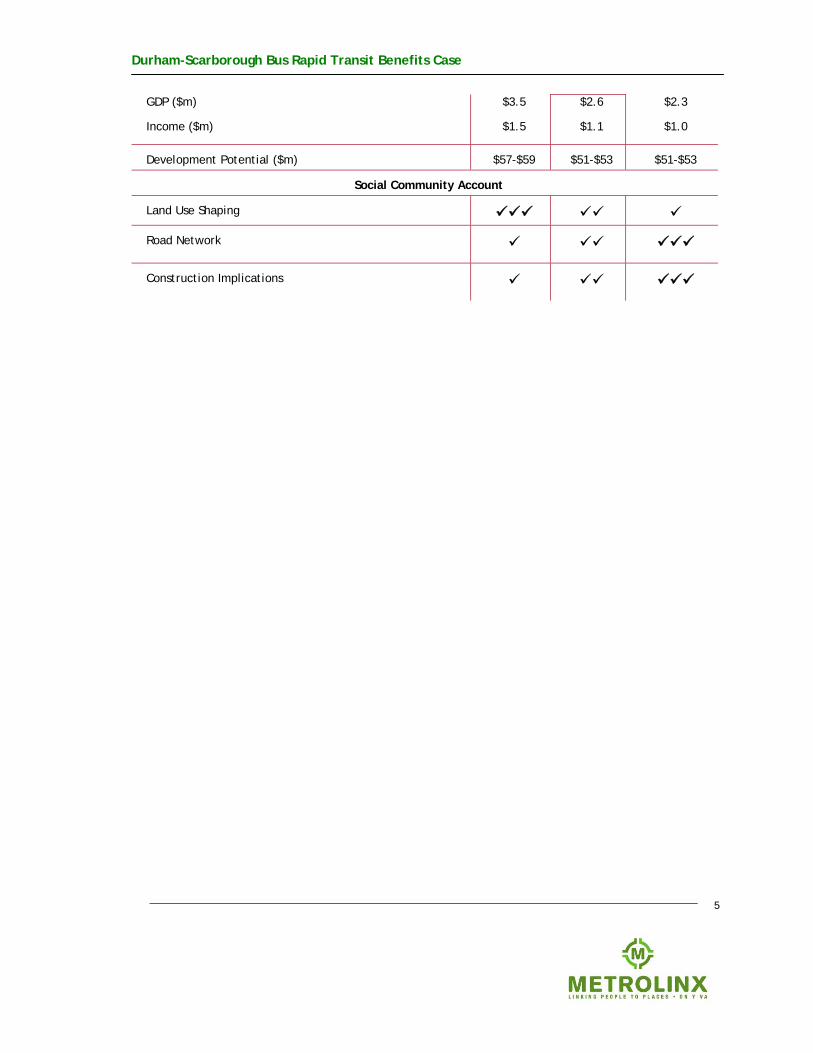
Durham-Scarborough Bus Rapid Transit Benefits Case
5
GDP ($m)
Income ($m)
$3.5
$1.5
$2.6
$1.1
$2.3
$1.0
Development Potential ($m) $57-$59 $51-$53 $51-$53
Social Community Account
Land Use Shaping
Road Network
Construction Implications

Durham-Scarborough Bus Rapid Transit Benefits Case
1
Part A Project Rationale
In 2006 the Province of Ontario created the Greater Toronto Transportation Authority, renamed
to Metrolinx in December 2007. The primary responsibility of the new organization is to provide leadership in the planning, financing and development of the Greater Toronto and Hamilton
Area’s (GTHA) multi-modal transportation network and to conform to the objectives and vision set out in the Province’s Greater Golden Horseshoe (GGH) Growth Plan.
Building on the Province’s $11.5 billion MoveOntario 2020 funding commitment for rapid transit expansion in the GTHA, Metrolinx developed the Regional Transportation Plan (RTP) to improve
mobility throughout the GTHA Region. The final RTP, entitled The Big Move, was approved by
the Metrolinx Board of Directors in November 2008. A new rapid transit line between Downtown Oshawa and Scarborough Centre along the Highway 2-Ellesmere corridor was identified as a Top
15 Priority Project in The Big Move.
In March 2008, the Province of Ontario committed a total of $82.3 million to Durham Region
through the Quick Wins initiative to support the implementation of Phase 1 BRT in the Highway 2
corridor. Key components of Phase 1 Highway 2 BRT include bus fleet expansion, improvements to six intersections, enhancing bus operations with Intelligent Transportation Systems (ITS)
infrastructure, and expanding DRT maintenance facilities in Ajax and Oshawa including a new central control centre. The Phase 1 BRT improvements are foundational components of the
broader Top 15 Priority Project proposed for the corridor in The Big Move.
As the rapid transit projects contemplated in The Big Move are closer to implementation, a
Benefits Case will be prepared for each project. The Benefits Case will describe a range of
feasible options for each project, be it different technology, capacity or length of alignment, and demonstrate the benefits and costs associated with each of the options.
The Durham-Scarborough Bus Rapid Transit (BRT) initiative is one of the projects contemplated in MoveOntario 2020 and The Big Move, and was further identified in The Big Move as a Top 15
priority project. The project involves the provision of a higher order rapid transit service along the Highway 2 corridor in Durham Region, linking Oshawa, Whitby, Ajax and Pickering, and along
the Ellesmere Road corridor in Toronto to connect with the TTC’s rapid transit network at
Scarborough Centre.
Three options have been identified for this corridor in collaboration with staff from Durham
Region, Durham Region Transit (DRT), the City of Toronto and the Toronto Transit Commission (TTC). This document presents the comparison of these options against the Base Case (Business
As Usual). The assessment of the options includes the relative strengths and weaknesses of each
option on people, the economy and the environment compared to the cost of implementing the option. The objective of the assessment is to clearly outline the trade-offs among the criteria to
enable decision makers to make an informed decision.

Durham-Scarborough Bus Rapid Transit Benefits Case
2
Report Structure
This report is structured as follows:
I Part A - Project Rationale: This section describes the policy context, the broader regional and project objectives, the characteristics of the corridor and the opportunities and issues to be addressed by the proposed project.
I Part B – Project Options: This section describes the options that are evaluated.
I Part C – Project Assessment: This section describes the evaluation methodology, the analysis and the summary results.
Project Rationale
Context and Need
Durham Region has experienced significant growth in recent years placing pressure on the local environment, municipal services and infrastructure. This growth is expected to continue over the
next decade and beyond. Based on projections in the GGH Growth Plan, the Region’s population is projected to grow to 810,000 by 2021 and 960,000 by 2031. Similarly, employment in the
Region is projected to grow to 310,000 by 2021 and 350,000 by 2031.
Recognizing the challenges associated with the population and employment growth and the desire to maintain the quality of life within the local communities, the Region has developed a strategy
to manage and support the anticipated growth in a sustainable manner. With this aim in mind, the Region identified transportation management as one of the most critical elements to the
success of their broader growth management strategy. In particular, the Region recognized the
need to build a comprehensive transit network as part of a broader strategic regional Transportation Master Plan (TMP) to support inter-regional transit connectivity, provide viable,
safe and competitive alternatives to auto travel, and attain its objectives with respect to regional development, economic growth and environment stewardship. The creation of DRT in
January 2006 was a first step to achieving the regional transit objectives. DRT was formed by the amalgamation of the municipal transit systems in Ajax/Pickering, Whitby, Oshawa and Clarington
as well as the Handi-Transit service.
Prior to the formation of DRT, the local transit authorities focused their service primarily around the GO commuter rail stations. While this provided service for transit patrons destined for points
along the GO Lakeshore corridor and the City of Toronto, the independent municipal services did not provide an integrated east-west service to connect the municipalities within Durham Region.
In response to this shortcoming, DRT developed a regional transit strategy entitled Connecting Communities which emphasized the importance of building an east-west and north-south grid
network of regional transit routes. In support of this plan DRT has a long-term vision to develop
higher order transit services on all major arterial roads as illustrated in Figure 1. By increasing

Durham-Scarborough Bus Rapid Transit Benefits Case
3
the transit market share DRT hopes to achieve a primary objective of the TMP; to reduce auto
use by as much as 15 percent by 2021. Given this aggressive target for auto use, DRT is therefore aiming to increase transit services in an effort to increase the transit mode share from 6 percent
to 10 percent during the same period.
FIGURE 1 DURHAM REGION TRANSIT – POTENTIAL LONG-TERM HIGHER ORDER TRANSIT CORRIDORS
To further develop the longer-term transit vision for the Region, through funding provided by the
provincial and federal governments under the FLOW initiative, Durham Region completed a Long-Term Transit Strategy (LTTS) in March 2010. The LTTS provides a comprehensive, long-term vision for advancing rapid transit in Durham Region within the context of the broader mobility goals of the Region. The strategy emphasizes rapid transit and its integral place within sustainable transportation options that will help the Region address anticipated transportation demands to 2031 and beyond (to 2056).1
1 More information on the goals and objectives of the LTTS can be found on the project website at www.durhamlongtermtransitstrategy.ca.

Durham-Scarborough Bus Rapid Transit Benefits Case
4
With the implementation of a more extensive transit network, DRT will dramatically improve
transit service within the Region to both enhance their current market share and capitalize on what is believed to be a significant latent demand for transit services.
Within its short history, DRT has experienced some early successes. As illustrated in Figure 2, DRT has managed to increase transit ridership from 6.85 million annual riders in 2005 to 8.51 million
annual riders in 2009, an increase of 24%. This success has been largely driven by the new U-Pass
ridership which required improvements to existing services, particularly increased service hours.
Fare-based initiatives have also played an important role in driving ridership increases, including
U-Pass for Durham College and University of Ontario Institute of Technology students previously mentioned and the “One Fare Anywhere” agreement which allows the use of both DRT and GO
Bus services within Durham Region with a valid DRT ticket, pass or transfer. However, ridership
growth has occurred in the absence of any higher order transit services. Based on this experience, it is anticipated that the implementation of higher order transit services along the higher demand
transit corridors will dramatically enhance the competitiveness, attractiveness and reliability of transit within Durham Region and thus lead to greater increases in ridership.
As indicated in Figure 2, DRT currently handles just over 8.5 million passengers per year, a 22 percent increase since the formation of DRT in 2006. With the implementation of BRT in the
region, ridership is expected to continue to steadily increase as service becomes more frequent
and reliable.
FIGURE 2 DRT RIDERSHIP LEVELS
6.85 6.94
7.62
8.50 8.51
6
6.5
7
7.5
8
8.5
9
Ride
rs (M
illio
ns)
2005 2006 2007 2008 2009
Year
DRT Ridership, 2005-2009

Durham-Scarborough Bus Rapid Transit Benefits Case
5
The Highway 2 corridor in Durham, illustrated in Figure 3, connects the municipalities of
Pickering, Ajax, Whitby and Oshawa. The corridor is an important east-west transportation route within Durham currently carrying over 40,000 vehicles per day at its peak point. The corridor is
one of the higher order rapid transit corridors identified by DRT illustrated in Figure 1. Highway 2 is commonly referred to as the “Main Street” of Durham, connecting major retail, commercial
and downtown destinations of Pickering, Ajax, Whitby and Oshawa. As a key east-west
transportation route through the Region, Highway 2 provides a direct connection to the Urban Growth Centres in Pickering and Oshawa and crosses the primary north-south corridors thus
providing transfer opportunities between the proposed higher order BRT service and DRT’s local north-south routes.
FIGURE 3 HIGHWAY 2 CORRIDOR IN DURHAM REGION
West of Pickering, the Durham-Scarborough BRT is proposed to operate along the Ellesmere
corridor within the City of Toronto to a western terminus at Scarborough Centre, where it would connect with the Scarborough Rapid Transit (SRT) line. This corridor has long been recognized as
an important transit corridor within the City of Toronto. As early as 1994 the Ellesmere corridor
was identified in the Metro Toronto Official Plan as a future higher-order rapid transit corridor. More recently, in 2006, the City of Toronto’s Official Plan identified the corridor as a Potential
GTA Transit Corridor with the potential for providing inter-regional high-order transit connections with Durham Region as shown in Figure 4.

Durham-Scarborough Bus Rapid Transit Benefits Case
6
More locally, the Scarborough Secondary Plan also emphasizes the importance of the corridor
within the context of increasing the use of transit in the vicinity of Scarborough Centre through the provision of additional rapid transit facilities. Furthermore Scarborough Centre has been
designated an “Urban Growth Centre” (UGC) under the GGH Growth Plan. UGCs are intended to accommodate a significant share of regional population and employment growth.

Durham-Scarborough Bus Rapid Transit Benefits Case
7
FIGURE 4 HIGHWAY 2 – ELLESMERE CORRIDOR REGIONAL CONTEXT
Highway 2 –Ellesmere Corridor
Durham-Scarborough Bus Rapid Transit Benefits Case
8
A terminus at the Scarborough Centre UGC provides an important anchor for the proposed
Durham-Scarborough BRT line, which would also serve significant destinations within Scarborough including the University of Toronto Scarborough campus and the Centenary Health Centre. In
addition, the residential development along the Ellesmere corridor will be well served by the proposed BRT line offering frequent service to destinations both within the City of Toronto and
Durham Region.
Historically, prior to the formation of DRT, municipal transit operators focussed on providing service to the GO Rail Stations for commuters travelling to Toronto. As a consequence, for many
residents traveling to a destination within Durham Region, transit may not be perceived as a viable and realistic alternative to the automobile. This lack of an integrated and seamless east-
west transit service continues to undermine the competitiveness of transit. For example DRT does not currently provide continuous local service along the Highway 2 corridor, offering transit
passengers only a limited number of local services along portions of the corridor.
However, continuous service is provided by GO Transit. Specifically, the Route 95 GO bus service offers peak hour weekday service along the corridor with service to the Scarborough Centre SRT
station and Finch GO bus terminal in Toronto. These GO buses provide frequent all-day service with peak headways as frequent as 15 minutes. In addition, the 94 GO bus offers service between
Oshawa GO station and the Yorkdale bus terminal with an intermediate connection to the GO Transit commuter rail station in Ajax.
The lack of an efficient east-west service along the Highway 2 corridor is recognized by DRT in
the LTTS. As part of this strategy, DRT proposes to implement high capacity rapid transit along the Highway 2 corridor as a key component of a proposed higher order transit network for
Durham Region. The Phase 1 BRT project supported through Quick Wins represents a foundational step towards this goal. The proposed Durham-Scarborough BRT would build on the Phase 1
improvements and fulfil a need for fast, efficient and reliable intra-regional transit service that is
currently only being served by GO Transit which services mainly inter-regional passengers. As such, the proposal to implement BRT along the corridor will require some rationalization of the
transit services offered by DRT and GO Transit.
Project Objectives
The Durham-Scarborough BRT project supports several strategic objectives in conjunction with
The Big Move including:
I Achieving local and regional environmental objectives;
I Promoting new development and investment in the area; and
I Promoting a sustainable community.
Specifically, the implementation of the proposed Durham-Scarborough BRT also supports the following objectives:

Durham-Scarborough Bus Rapid Transit Benefits Case
9
I Delivering improved access to activity centres across the region, including linking UGCs in Scarborough and Durham with high order transit; and
I Achieve community goals for improving the environment, the economy, and the quality of life of Durham and Scarborough residents.
In addition to these objectives, the proposed BRT service along the Highway 2 – Ellesmere corridor also aims to achieve more specific transit service goals including:
I Providing improved transit linkages between Durham Region communities and Scarborough, and with the TTC’s rapid transit network;
I Serving existing/latent demand and anticipated future demand;
I Increasing transit mode share (divert from auto); and
I Improving passenger comfort and safety.
Project Overview
Background
As indicated above Durham Region has undertaken considerable work to provide direction for the delivery of transit services within the region. Specifically, Connecting Communities focuses on
providing real and attractive alternatives to the private automobile. The analysis and public
consultation completed through the development of Connecting Communities brought to light the urgent need to enhance transit services in the Region, both to address existing and latent
demand for transit that is not being adequately served.
The GGH Growth Plan is a framework for implementing the Province’s vision for building
stronger, prosperous communities by better managing growth in the region to 2031. The plan outlines strategies for managing growth with emphasis on reducing dependence on the
automobile through the development of mixed use transit supportive and pedestrian friendly
environments. In addition, the plan establishes UGCs as locations for accommodating a significant share of population and employment growth. Downtown Oshawa, Downtown Pickering and
Scarborough Centre have been designated as UGCs. The location and boundaries of these UGCs are illustrated in Figures 5, 6 and 7. In addition to the designation of UGCs, the Province also
provides direction to municipalities to incorporate major transit station areas and intensification
corridors into their official plans.
For the purposes of this analysis, it is assumed that the Durham-Scarborough BRT service will
travel west from the Downtown Oshawa UGC via Bond Street, King Street, Dundas Street, Kingston Road and into Toronto where it will travel along Ellesmere Road, west from either
Meadowvale Road or Military Trail to connect with the Scarborough Centre SRT station within the Scarborough Centre UGC.

Durham-Scarborough Bus Rapid Transit Benefits Case
10
FIGURE 5 URBAN GROWTH CENTRE - PICKERING2
2 SOURCE: ‘Size and Location of Urban Growth Centres in the Greater Golden Horseshoe’ (2008), Ministry of Energy and Infrastructure

Durham-Scarborough Bus Rapid Transit Benefits Case
11
FIGURE 6 URBAN GROWTH CENTRE - OSHAWA3
3 SOURCE: ‘Size and Location of Urban Growth Centres in the Greater Golden Horseshoe’ (2008), Ministry of Energy and Infrastructure

Durham-Scarborough Bus Rapid Transit Benefits Case
12
FIGURE 7 URBAN GROWTH CENTRE - SCARBOROUGH4
4 SOURCE: ‘Size and Location of Urban Growth Centres in the Greater Golden Horseshoe’ (2008), Ministry of Energy and Infrastructure

Durham-Scarborough Bus Rapid Transit Benefits Case
13
The Durham-Scarborough BRT is proposed to operate along the Ellesmere corridor within the City
of Toronto to the western terminus of the new BRT line at the Scarborough Centre SRT Station. As discussed above in the Context and Need section, this corridor was identified as early as 1994
in the Metro Toronto Official Plan and continues to be designated for higher-order rapid transit in the 2006 City of Toronto Official Plan.
Opportunities and Issues
Local Transit Services
The proposed BRT service along the Highway 2 corridor will provide a frequent and reliable east-west transit service across Durham between Pickering and Oshawa. As a first step in the regional
plan to develop a grid of transit services, it is critical that efficient connections with local
services are developed to broaden the reach of transit to the north and south of the corridor. In order for BRT to continue to expand intra-regional ridership, feeder routes that service
destinations off the corridor must complement the efficient and reliable BRT service. The Region’s initiative to develop a rapid transit network is aimed at providing an alternative to the
single occupancy vehicle, making non-auto-oriented lifestyles possible for existing and future
residents and workers. Such a transit network would support Durham’s broad vision as a liveable community and would encourage more concentrated population and employment growth along
the Highway 2 corridor. An integrated transit service will provide efficient transit access to activity centres along the corridor and to the north and south of Highway 2 thereby expanding
the potential benefits of the initial investment in a higher order transit facility.
GO Transit
Given the proximity of the proposed Durham-Scarborough BRT service to the GO station at
Pickering, it may be possible to provide a convenient passenger connection between DRT’s rapid
transit network and the GO regional rail service. Such a connection would improve and facilitate the regional connectivity envisioned by The Big Move and support the vision outlined in
Connecting Communities which highlighted the crucial role that the Pickering GO station could play as a transit hub and portal for interregional transit trips entering Durham.
An integrated regional transit service is an important component of the broader transit network plan. At present, a number of Durham residents utilise the GO Transit service to travel to
regional destinations. This is particularly true for passengers destined for downtown Toronto who
currently utilise the Lakeshore East GO Transit rail service.
Currently less than one percent of GO transit riders use local transit to get to and from GO Train
stations. A convenient and efficient transit connection between the Durham-Scarborough BRT and GO Stations adjacent to the corridor could capture some of this market and reduce the reliance
on automobiles to access the GO Transit facilities.

Durham-Scarborough Bus Rapid Transit Benefits Case
14
In addition, the proposal in The Big Move to electrify the GO Lakeshore corridor could potentially
greatly enhance the commuter rail service and provide frequent and reliable two-way service to and from Durham Region. This proposed improvement would increase service frequencies and
decrease travel times making GO Transit an even more attractive alternative to the automobile for downtown Toronto destined passengers. Depending on the specific alignment, the new BRT
service has an opportunity to leverage this improved service in the longer-term by creating
convenient connections between the two services.5
Scarborough – Durham Connection
As proposed the Durham-Scarborough BRT will extend its services into Scarborough to provide a
connection with the TTC network at a western terminus at the Scarborough Centre SRT station. Extending the DRT operation into the TTC service area raises two policy considerations.
First, depending on the specific alignment chosen, the BRT could provide pick-up and drop-off services within the TTC service area and thereby expand the appeal of the BRT for both Toronto
and Durham residents travelling in either direction. However, such an open door operating policy
to allow for a non-TTC service pick-up and drop-off passengers within Toronto would be subject to an agreement between DRT and the TTC, and would require the approval of the City of
Toronto under the terms of the City of Toronto Act, 2006, In practice, a number of other implementation obstacles would also need to be resolved.
Second, the longer-term vision in The Big Move for an integrated regional fare policy amongst transit providers will have implications for the proposed BRT operation. While such a policy will
likely not be in affect when the Durham-Scarborough BRT is implemented, the new BRT service
will provide an opportunity to test such an initiative at some point in the future. In the absence of fare integration, passengers intending to transfer between DRT and TTC service would
continue to be subjected to an additional and separate fare regardless of their point of origin. The future implementation of the regional PRESTO fare card system will make such transfers
more convenient for passengers, but would not eliminate the need to pay separate fares on each system. Over the long-term however, an integrated fare policy would allow passengers to
transfer more seamlessly and would likely enhance the demand for the BRT service over the
length of the corridor.
University of Ontario Institute of Technology and Durham College
The University of Ontario Institute of Technology/Durham College campus is located
approximately 5 kilometres north of Highway 2 on Simcoe Street North in Oshawa and is a key transit destination within Durham Region. The campus population is currently over 10,000 and is
5 Metrolinx is currently undertaking a broader study of the potential costs and benefits of alternative technologies, including electrification, on all GO rail corridors. This study is expected to be complete by the end of 2010.

Durham-Scarborough Bus Rapid Transit Benefits Case
15
expected to grow to 15,000 in the near future. The provincial and federal governments also
recently announced an additional $74 million investment to add to the existing Automotive Centre of Excellence and to build an Energy Systems and Nuclear Science Research Centre.
Efficient and reliable connections to this key transit destination could have a significant positive impact on BRT and regional transit ridership.

Durham-Scarborough Bus Rapid Transit Benefits Case
16
Part B Options
Project Options The following three options have been identified for the Durham – Scarborough BRT Project for comparison against the Base Case. A summary description of each option is provided below.
I Base Case: Business as usual
I Option 1: Full BRT – Centre Alignment with Significant Transit Priority
I Option 2: BRT – Centre Alignment with Partial Transit Priority within Durham and Toronto
I Option 3: BRT – Centre Alignment with Partial Transit Priority within Durham and Mixed Traffic Operations within Toronto
Base Case For the purpose of this comparative assessment the Base Case assumes that the current DRT services along the Highway 2 corridor will remain unchanged from today. As discussed in Section
A of this report, DRT does not provide continuous local service on Highway 2 from Pickering to Oshawa, however, local buses in Pickering, Ajax, Whitby, and Oshawa currently serve portions of
Highway 2. These local services are assumed to remain in place and unchanged in the Base Case.
For the purpose of this analysis, the Quick Wins Phase 1 BRT improvements are not included in
the Base Case. The Phase 1 improvements are integral components of the larger Durham-
Scarborough BRT project and are therefore included within the scope of each of the three project options. This will help to ensure that the analysis adequately captures the benefits associated
with the project as a whole.
The regional service provided by the current Route 95 GO Bus service offers peak hour weekday
service along the Highway 2 corridor with service to the Scarborough Centre SRT station and
Finch GO Bus Terminal in Toronto. GO buses provide frequent all-day service with peak headways as frequent as 15 minutes. In addition the Route 94 GO Bus offers service between the Oshawa
GO station and the Yorkdale bus terminal with an intermediate connection to the GO Transit commuter rail station in Ajax. These GO Transit services are assumed to remain in place as a
component of the Base Case, along with the “One Fare Anywhere” agreement.
While DRT service is not continuous along the corridor, the combination of DRT and GO Transit
bus services does provide a peak hour capacity along the Highway 2 corridor between Altona Road
in Pickering and Courtice in Oshawa of approximately 300 passengers. The current average peak hour capacity provided by DRT along Highway 2 corridor is approximately 120 passengers although
this varies by section along the corridor where local bus routes overlap.
Durham-Scarborough Bus Rapid Transit Benefits Case
17
In addition to the GO Transit connections to Toronto, DRT buses also currently provide a
connection to the TTC service at the Rouge Hill GO Station. Rouge Hill Shuttle (Route 109) provides passengers in western Pickering with a connection to the Rouge Hill GO station.
Options
Option 1: Full BRT
This option includes an on-street BRT system running within an exclusive median transit way along the Highway 2 – Ellesmere Corridor from an eastern terminus immediately east of Simcoe
Street in Oshawa, across Durham Region and eastern Scarborough to a western terminus at the Scarborough Centre SRT station in Toronto.
Along the approximately 36 kilometre alignment, the BRT would connect Oshawa, Whitby, Ajax
and Pickering with Scarborough Centre in Toronto. Specific street names along the Highway 2 corridor change along the length of the alignment depending on the municipality they serve.
Travelling west from Oshawa, the proposed BRT specifically follows Bond Street, King Street, Dundas Street, and Kingston Road. Within the City of Toronto the alignment travels westward
along Ellesmere Road, from either Meadowvale Road or Military Trail, to the terminus station at
the Scarborough Centre SRT station.6
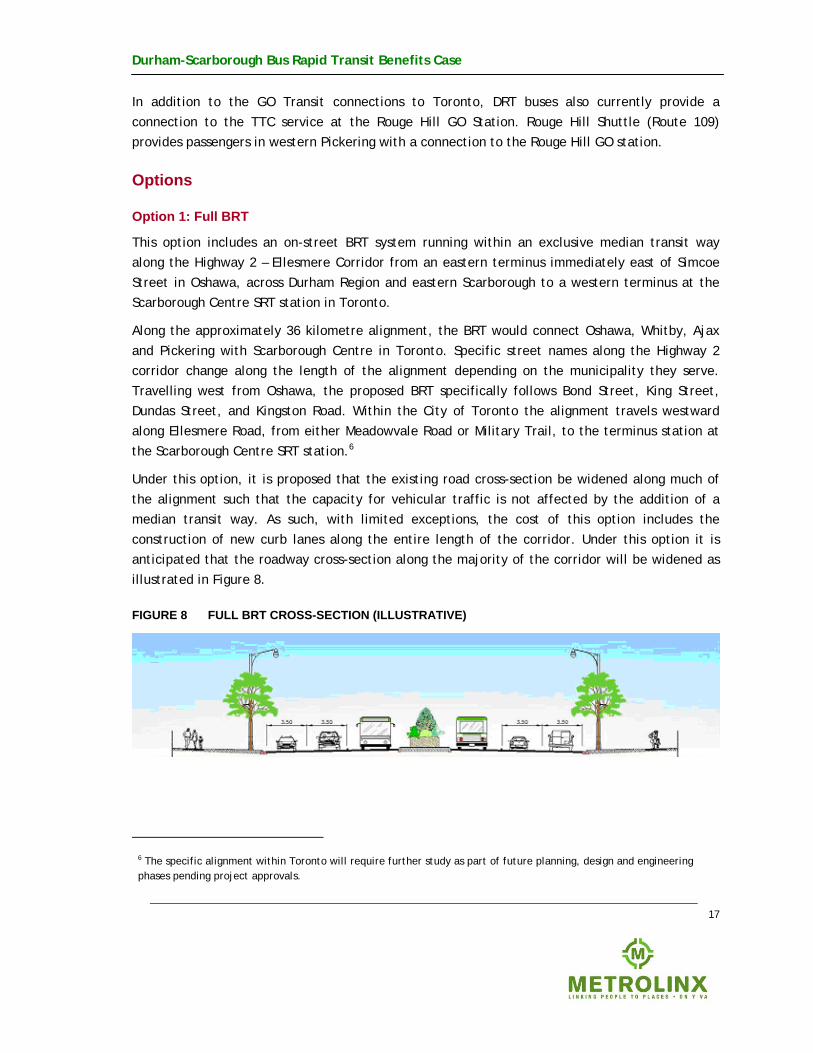
Under this option, it is proposed that the existing road cross-section be widened along much of
the alignment such that the capacity for vehicular traffic is not affected by the addition of a median transit way. As such, with limited exceptions, the cost of this option includes the
construction of new curb lanes along the entire length of the corridor. Under this option it is anticipated that the roadway cross-section along the majority of the corridor will be widened as
illustrated in Figure 8.
FIGURE 8 FULL BRT CROSS-SECTION (ILLUSTRATIVE)
6 The specific alignment within Toronto will require further study as part of future planning, design and engineering phases pending project approvals.

Durham-Scarborough Bus Rapid Transit Benefits Case
18
In areas where existing development constrains the ability to widen the road in a cost-effective
manner it is proposed that the BRT operate in mixed traffic. Areas where the BRT will operate in mixed traffic include:
I Downtown Oshawa along King Street and Bond Street between Waverly Street and Simcoe Street;
I Downtown Whitby between Ash Street and Kent Street; and
I Historic Pickering Village in Ajax.
With the exception of these constrained areas, the addition of the new traffic lanes is assumed to
be coordinated with the widening of specific intersections to improve the level of service with
additional right and left turn lanes where necessary and permit continuous unconstrained travel for transit vehicles.
BRT operations will also be enhanced with signal priority measures at key intersections along the corridor as necessary. Specifically, intersections within sections of the alignment where BRT is
proposed to operate in mixed traffic will include transit signal priorities in order to provide an
advantage for transit by limiting the impact of mixed traffic operations on BRT travel time and reliability.
At the present time, King Street and Bond Street in Oshawa operate as one-way streets. Despite the operational challenges and passenger inconvenience associated with operating a rapid transit
line along a split corridor, it is assumed for the purpose of this comparative assessment that the BRT route would run in mixed traffic in the direction of local traffic along this portion of the
corridor. Therefore within Oshawa, the eastbound BRT will transition from an exclusive median
alignment on King Street to a mixed traffic operation in the vicinity of Waverly Street. The eastbound BRT will continue to operate in mixed traffic along King Street to a terminus near
Simcoe Street. Similarly the westbound BRT will travel in mixed traffic from the Simcoe Street terminus along Bond Street before entering the exclusive median operation near the intersection
of King Street and Waverly Street. Consistent with other areas of mixed traffic operations, signal priority measures will be included to provide an operational advantage for the BRT service.
With the exception of GO Transit which provides rail and express bus service to a limited number
of destinations within Toronto, the current transit system in DRT does not provide a direct
connection to the TTC rapid transit network. DRT buses provide limited peak period service to a
transfer point at the Rouge Hill GO Station where DRT passengers may transfer to a TTC bus to
continue their journey. With the introduction of the BRT system proposed under this option,
Toronto-bound transit passengers may board the BRT in Durham Region and travel to the Scarborough Centre SRT station without a transfer. In addition to the western terminus of the
BRT service at the SRT station, this option proposes that the Durham – Scarborough BRT service

Durham-Scarborough Bus Rapid Transit Benefits Case
19
will also provide drop-off and pick-up services at six BRT stations at various points along the
route within Toronto between the Pickering border and the SRT station.
While The Big Move contemplated an integrated fare system enabling travellers to cross
municipal boundaries without fare duplication, a regional integrated fare system remains a longer-term objective and is beyond the scope of this analysis. To focus this analysis on the
transit service itself, integrated fares will not be assumed in either the Base Case or the options.
Therefore, for the purpose of this analysis, it is assumed that the Durham – Scarborough BRT service will operate with an open door policy for pick-up and drop-off within the TTC service
area. As a consequence, passengers transferring between DRT and TTC services will be subject to an additional fare.
The full BRT line includes 33 stations at the following proposed locations:
TABLE 1 OPTION 1 STOPS
Station Locations (East to West)
1. Simcoe Street
2. Park Road
3. Stevenson Road
4. Thornton Road
5. Kendalwood Road
6. Thickson Road
7. Anderson Street
8. Garden Street
9. Brock Street
10. Cochrane Street
11. McQuay Boulevard
12. Lakeridge Road
13. Alexander’s Cross
14. Salem Road
15. Harwood Avenue
16. Westney Avenue
17. Church Street
18. Notion Road
19. Brock Road
20. Valley Farm Road
21. Liverpool Road
22. Dixie Road
23. Fairport Road
24. Whites Road
25. Rosebank Road
26. Altona Road
27. Sheppard Avenue
28. Meadowvale Road
29. Military Trail (U of T)
30. Neilson Drive
31. Markham Road
32. McCowan Road
33. Scarborough Centre
The physical location and configuration of each station will vary depending upon the specific
characteristics and constraints at each location. Within the exclusive median, BRT stations will be located immediately adjacent to the transit way on the far side of the intersections. BRT stations
within the constrained areas including the downtown cores of Ajax, Whitby and Oshawa, are assumed to be located at the curb side.
As envisioned, the Durham – Scarborough BRT buses will be clearly branded to differentiate the BRT service from other local services. The buses will also be equipped with communications
capabilities which will enable real-time arrival information to be provided at BRT stations. The
stations themselves will also be clearly defined, with updated traveller information provided
through real-time messaging, and will accept payment by the PRESTO Card or exact

Durham-Scarborough Bus Rapid Transit Benefits Case
20
cash/transfers. BRT buses will not provide tickets (fares) to be bought or sold on board, which will
reduce the stop dwell times and improve the speed of the service.
The average speed of the BRT along the approximately 36 kilometre alignment is assumed to be 27 kph. The estimated travel time from end to end of the BRT line is approximately 77 minutes
(not including vehicle layover time at endpoint terminals). The segregated operations combined with signal priority at major intersections will help to minimize the potential delays to the BRT
service. However, despite these measures, at-grade crossings at intersections may still result in
service delays. The average speeds and travel times for each municipal section are provided in the following table:
TABLE 2 OPTION 1 – BRT AVERAGE SPEEDS AND TRAVEL TIMES
Distance
Segregation from Other Traffic by Segment
Number of Stations
Average Speed
Station Spacing
(m)
Travel Time
(minutes)
Oshawa (Simcoe St – Thickson Rd)
2.1 km
2.1 km
No
Yes
3
3
20 kph
30 kph
1050
1050
6.3
4.2
Whitby (Thickson Rd – Lakeridge Rd)
0.6 km
5.6 km
No
Yes 6
20 kph
30 kph 1120
1.8
11.2
Ajax (Lakeridge Rd- Church St)
1.5 km
4.8 km
No
Yes 5
20 kph
30 kph 1200
4.5
9.6
Pickering (Church St – Altona Rd)
7.8 km Yes 9 30 kph 980 15.6
Toronto (Altona Rd – SRT)
11.8 km Yes 7 30 kph 19700 23.6
TOTAL ROUTE 36.3 km 33 27 kph 1130 m 76.8 min
For the purposes of this assessment, it is assumed that articulated buses (18 metres in length) are
used with a capacity of 100 passengers per vehicle. This is consistent with service planning guidelines elsewhere in the GTHA and would provide a high-level service to the passengers. In the
year 2021, the following service frequencies has been assumed:
I 3 minute peak frequency between Scarborough and Pickering;
I 5 minute peak frequency between Pickering and Whitby; and
I 8 minute peak frequency between Whitby and Oshawa.

Durham-Scarborough Bus Rapid Transit Benefits Case
21
This results in a total requirement of 47 BRT vehicles including spares (20 percent spare ratio
assumed) and would provide a peak design load of 2000 passengers per hour per direction.
Similarly in 2031, the following service patterns have been assumed:
I 2.5 minute peak frequency between Scarborough and Pickering;
I 3.5 minute peak frequency between Pickering and Whitby; and
I 6 minute peak frequency between Whitby and Oshawa.
In 2031, a total of 61 BRT vehicles including spares would be required and would provide a peak
design load of 2400 passengers per hour per direction. This is assumed to be sufficient to meet the anticipated peak hour demand along the corridor.
TABLE 3 OPTION 1 OPERATING PLAN
Section Headway Capacity
2021
Oshawa- Whitby 8 minutes 750
Whitby- Pickering 5 minutes 1,200
Pickering- Scarborough 3 minutes 2,000
2031
Oshawa- Whitby 6 minutes 1,000
Whitby- Pickering 3.5 minutes 1,700
Pickering- Scarborough 2.5 minutes 2,400
Based upon the various planned headways by section for the BRT service as listed in Table 3, a
total of 47 BRT vehicles including spares would be required in 2021 and 61 vehicles in 2031. In addition to the new BRT vehicles, Durham Region will also require an operations and maintenance
facility to service and store the fleet. At the present time Durham Region is investigating
opportunities to expand their existing bus storage and maintenance facility in Ajax and rebuild their facility in Oshawa. For the purpose of this assessment it is assumed that the cost of these
improved facilities will be borne by the BRT project.
It is anticipated that the new BRT service will commence operations in 2015. At that time, the
existing local bus services will continue their current operations. Based on the results of the LTTS and other future planning initiatives, DRT will likely reorganize the local services to leverage the
benefits of the new east-west BRT corridor by improving north-south services and planned
connections with BRT and by eliminating unnecessary duplication of services along the Highway 2 corridor. For the purpose of this comparative analysis and in the absence of detailed future plans

Durham-Scarborough Bus Rapid Transit Benefits Case
22
for local services on connecting north-south routes, it is assumed that service levels on these
routes will remain unchanged.
Regional Bus services currently provided by GO Transit will be re-oriented or eliminated under
this option to avoid duplicating the services provided by the new BRT. Specifically, GO Transit Route 95 is assumed to be eliminated while Route 94 will be maintained in its current state. In
addition, under this option it is assumed that the Route 94 GO buses will not be permitted to use
the median travel lanes provided for the new BRT service and will continue to operate in mixed traffic along the corridor.
While a significant number of transit passengers in Durham are destined for downtown Toronto via GO Transit, it is assumed that these passengers will either access the GO stations via a north-
south Durham Transit route or will utilize the remaining regional GO Transit Bus service to reach their destinations. Based on this assumption, the BRT alignment as proposed does not deviate
from the Highway 2 corridor to provide a direct transfer to GO stations within any of the Durham
municipalities.7
Option 2: BRT- Partial Exclusivity within Durham and Toronto
This option envisions a BRT system operating along the same corridor and with the same general
station locations as described for Option 1 between Oshawa and Scarborough Centre. The vehicle communications and station amenities described under Option 1 also apply to this option.
Unlike Option 1 however, where the BRT operates in an exclusive median transit way for the majority of the alignment, this option proposes that the BRT operations vary more substantially
along the corridor between exclusive transit-only median operations and mixed traffic
operations. Therefore, unlike Option 1 where the majority of BRT stations are located in the centre of the roadway, a number of the BRT stations proposed under this option are located at
the curb.
7 This could be an area for further evaluation during a more detailed project definition phase should the project proceed.

Durham-Scarborough Bus Rapid Transit Benefits Case
23
Under this option, it is proposed that the existing road right-of-way be widened at key sections of
the corridor where the BRT operation would benefit most significantly from a transit-only lane. As with Option 1, sections of the alignment such as those in Oshawa, Whitby and Ajax referred to
above would not be widened and therefore the BRT would be required to operate in mixed traffic through these sections. Of the 36 kilometre alignment, this option proposes to widen the road to
provide transit-only median lanes along approximately 50 percent of the corridor. The typical
cross-section of the widened roadway with median operations is shown above under the description for Option 1 and illustrated again in Figure 9.8
FIGURE 9 FULL BRT CROSS-SECTION (ILLUSTRATIVE)
Where the BRT is expected to operate in mixed traffic, the roadway cross-section is envisioned as
shown in Figure 10.
FIGURE 10 MIXED TRAFFIC BRT CROSS-SECTION (ILLUSTRATIVE)
8 For the purpose of this comparative analysis median transit-only lanes have been assumed for the sections of roadway to be widened as part of this BRT Project. The feasibility of this assumption should be confirmed as part of the more detailed project definition phase to ensure that the proposed BRT operation can easily accommodate the required weaving between the exclusive median operation and the mixed traffic operations with curb side stations.

Durham-Scarborough Bus Rapid Transit Benefits Case
24
In addition to the sections of roadway proposed under this option, this option also proposes to
expand a number of key intersections along the corridor to limit the number of conflicts between the transit vehicles and general purpose vehicles making right turn movements at intersections.
Under this option, the proposed road widening and intersection improvements will be coordinated so as to provide the greatest travel time benefit for transit vehicles by avoiding
many of the current queuing delays associated with the right turn movements and traffic
congestion in general.
As with Option 1, the BRT operations proposed under this option will also be enhanced with signal
priority measures at key intersections along the corridor as necessary. With the increased exposure to mixed traffic operations under this option relative to Option 1, there are more
opportunities for BRT to benefit from the provision of signal priorities, both prior to and within areas where BRT is expected to operate within mixed traffic.
The key sections of road widening and intersections proposed for upgrading under this option are
outlined below:
I Oshawa – Widen roadway and intersections from Thornton Road to the Whitby border;
I Whitby – Widen roadway and intersections between the Oshawa border to Anderson Street;
I Ajax – Widen roadway and intersections between Salem Road and Westney Road;
I Pickering – Widen roadway and intersection between the Ajax border and Dixie Road and between Fairport Road and Rosebank Road; and
I Toronto – Widen roadway and intersections on Ellesmere Road between Military Trail and McCowan Road.9
Recognizing that mixed traffic operations along portions of the corridor and the potential for some delays caused by right weaving between mixed traffic and centre median transit-only lanes,
average speed of the BRT service for this option is assumed to be lower than the average speeds achieved under Option 1. The average speeds and travel times for each municipal section are
summarized in Table 4.
9 The specific areas for segregated BRT lanes within Toronto will need to be determined as part of a more detailed project definition phase should the project proceed. For the purpose of this comparative analysis, the proposed improvements are considered sufficient to enable a meaningful comparison as the upgrades within Toronto are intended to represent approximately 50 percent of the widening proposed under Option 1.

Durham-Scarborough Bus Rapid Transit Benefits Case
25
TABLE 4 OPTION 2 – BRT AVERAGE SPEEDS AND TRAVEL TIMES
Distance
Segregation from Other Traffic by Segment
Number of Stations
Average Speed
Station Spacing
(m)
Travel Time
(minutes)
Oshawa (Simcoe St – Thickson Rd)
2.1 km 2.1 km
No Partially
3 3
20 kph 25 kph
1050
1050
6.3 5.0
Whitby (Thickson Rd – Lakeridge Rd)
0.6 km 5.6 km
No Partially
6 20 kph 25 kph
1120 1.8 13.4
Ajax (Lakeridge Rd- Church St)
1.5 km 4.8 km
No Partially
5 20 kph 25 kph
1200 4.5 11.5
Pickering (Church St – Altona Rd) 7.8 km Partially 9 25 kph 980 18.7
Toronto (Altona Rd – SRT) 11.8 km Partially 7 25 kph 1970 28.3
TOTAL ROUTE 36.3 km 33 23.5 kph 1130 m 89.5 min
For the purpose of this assessment, it is assumed that the BRT vehicles used under this option are
the same 18-metre articulated buses as those proposed for Option 1. In the year 2021, the Option 2 service has been assumed to provide:
I 4 minute peak frequency between Scarborough and Pickering;
I 7 minute peak frequency between Pickering and Whitby; and
I 11 minute peak frequency between Whitby and Oshawa.
This results in a total requirement of 42 BRT vehicles including spares and would provide a peak design load of 1500 passengers per hour per direction. In 2031, in line with ridership growth, the headways reduce to the following:
I 3 minute peak frequency between Scarborough and Pickering;
I 5 minute peak frequency between Pickering and Whitby; and
I 8 minute peak frequency between Whitby and Oshawa.
This results in a total requirement of 54 BRT vehicles including spares (20 percent spare ratio assumed) and would provide a peak design load of 2000 passengers per hour per direction. The
one-way travel time under this option increases relative to Option 1 by approximately 13 minutes.
As with Option 1, an operations and maintenance facility will be required to accommodate the
BRT vehicles. For the purpose of this assessment, it is assumed that the facility planned under

Durham-Scarborough Bus Rapid Transit Benefits Case
26
Option 1 will be of sufficient size to accommodate the variation in the number of vehicles
required under this option. Again, as with Option 1, for the purpose of this assessment it is assumed that the cost of the planned facility upgrades will be borne by the BRT project.
Again it is assumed that the new BRT service will commence operations in 201510. Based on the results of the LTTS and other future planning initiatives, DRT may elect to rationalize or
reorganize their services so as to leverage the benefits of the new east-west BRT corridor by
improving north-south services and planned connections with BRT and by eliminating unnecessary duplication of services along the Highway 2 corridor. However, as in Option 1, for the purposes
of this comparative analysis it is assumed that existing local bus services will continue to operate as they do today in the absence of detailed service plans.
Also, as described under Option 1, the regional bus services currently provided by GO Transit will be re-oriented or eliminated under this option to avoid duplicating the services provided by the
new BRT. Specifically, GO Transit Route 95 is assumed to be eliminated while Route 94 will be
maintained in its current state. As with Option 1, Route 94 GO buses would be prohibited from using the median transit-only lanes proposed for the new BRT.
Also, as discussed under Option 1, to maximize the benefits associated with the proposed Durham - Scarborough BRT operation within the TTC service area, it is assumed that DRT will pick-up and
drop-off passengers within the TTC service area. Similar to Option 1, for the purpose of this assessment, it is assumed that transit fares between DRT and TTC are not integrated but that an
open-door passenger pick-up and drop-off policy is in effect.
For the purpose of this assessment it is also assumed that the BRT alignment and operation as proposed under this option does not deviate from the Highway 2 corridor to provide a direct
transfer to GO stations within any of the local Durham Region municipalities.11
Option 3: BRT – Partial Exclusivity within Durham
This option envisions a BRT system operating along the same corridor and with the same general
station locations as described for the other two options. The vehicle communications and station amenities described under Option 1 also apply to this option. Similar to Option 2, this option also
proposes that the BRT operations vary along the corridor between exclusive median transit-only
lanes and mixed traffic operations. Therefore BRT stations proposed under this option are located either in the median or at the curb depending on the operation proposed at each station location.
10 An opening date of 2015 is proposed for the purpose of this comparative analysis. It is recognized however that the construction requirements for this option are less than those required under Option 1 and therefore may be possible to commence operations earlier.
11 This could be an area for further evaluation during a more detailed project definition phase should the project proceed.

Durham-Scarborough Bus Rapid Transit Benefits Case
27
Under this option it is proposed that the roadway and intersection widening proposed within
Durham under Option 2 also apply to this option. However, unlike Option 2, Option 3 does not include any roadway improvements or transit exclusivity for the BRT within the City of Toronto.
As with Options 1 and 2, the BRT operations proposed under this option will also be enhanced with signal priority measures at key intersections along the corridor as necessary particularly
where the BRT operates in mixed traffic. With the increased exposure to mixed traffic operations
under this option relative to Option 1 and 2, there are more opportunities within Durham for BRT to benefit from the provision of signal priority, both prior to and within areas where BRT is
expected to operate within mixed traffic. It is assumed that the signal operations in Toronto will not be changed in response to the introduction of the BRT under this option.
This option will require that the BRT operate in mixed traffic along the majority of the corridor. As a consequence, the BRT will experience similar delays to that experienced by the general
purpose traffic. Average speeds for the BRT service under this option are therefore assumed to be
slightly lower than the average speeds achieved under Option 2 as the BRT is proposed to operate within mixed traffic in Toronto. The average speeds and travel times for each municipal section
under this option are summarized in Table 5.
TABLE 5 OPTION 3 – BRT AVERAGE SPEEDS AND TRAVEL TIMES
Distance
Segregation from Other Traffic by Segment
Number of
Stations
Average Speed
Station Spacing (m)
Travel Time
(minutes)
Oshawa (Simcoe St – Thickson Rd)
2.1 km 2.1 km
No Partially
3 3
20 kph 25 kph
1050
1050
6.3 5.0
Whitby (Thickson Rd – Lakeridge Rd)
0.6 km 5.6 km
No Partially
6 20 kph 25 kph
1120 1.8 13.4
Ajax (Lakeridge Rd- Church St)
1.5 km 4.8 km
No Partially
5 20 kph 25 kph
1200 4.5 11.5
Pickering (Church St – Altona Rd) 7.8 km
No Partially
9 25 kph 980 18.7
Toronto (Altona Rd – SRT) 11.8 km No 7 21 kph 1970 33.7
TOTAL ROUTE 36.3 km 33 23 kph 1130 m 94.9 min
For the purposes of this assessment, it is assumed that the BRT vehicles used under this option
are the same 18-metre articulated buses as those proposed for Options 1 and 2.

Durham-Scarborough Bus Rapid Transit Benefits Case
28
In the year 2021, the Option 3 service has been assumed to provide the following frequencies on
the various sections:
I 5 minute peak frequency between Scarborough and Pickering;
I 7.5 minute peak frequency between Pickering and Whitby; and
I 11 minute peak frequency between Whitby and Oshawa.
This results in a total requirement of 38 BRT vehicles including spares (20 percent spare ratio assumed) and would provide a peak design load of 1200 passengers per hour per direction.
Similarly in 2031, the following services patterns are assumed:
I 4 minute peak frequency between Scarborough and Pickering;
I 6 minute peak frequency between Pickering and Whitby; and
I 10 minute peak frequency between Whitby and Oshawa.
This results in a total requirement of 46 BRT vehicles including spares and would provide a peak design load of 1500 passengers per hour per direction. This operating scenario will result in a
longer one-way travel time of approximately 95 minutes due to mixed-traffic operation along the
majority of the corridor.
As with the other options, it is assumed that an operations and maintenance facility will be
required to accommodate the BRT vehicles. For the purpose of this assessment, it is assumed that the facility required for the Durham - Scarborough BRT will be of sufficient size to accommodate
the variation in the number of vehicles required under this option. Again, as with Options 1 and
2, for the purpose of this assessment it is assumed that the cost of any new or upgraded facilities will be borne by the BRT project.
The new BRT service proposed under this option is assumed to commence operations in 2015.12 Based on the results of the LTTS and other future planning initiatives, DRT may elect to
rationalize or reorganize their services so as to leverage the benefits of the new east-west BRT corridor by improving north-south services and planned connections with BRT and by eliminating
unnecessary duplication of services along the Highway 2 corridor. However, as with Options 1
and 2, for the purposes of this comparative analysis current local DRT bus service are assumed to be unchanged following the introduction of the BRT as proposed under this option in the absence
of detailed service plans.
12 An opening date of 2015 is proposed for the purpose of this comparative analysis. It is recognized however that the construction requirements for this option are less than those required under Options 1 and 2 and therefore it may be possible to commence operations earlier.

Durham-Scarborough Bus Rapid Transit Benefits Case
29
Also, as described under Options 1 and 2, the regional bus services currently provided by GO
Transit will also be re-oriented or eliminated under this option to avoid duplicating the services provided by the new BRT. Specifically, GO Transit Route 95 is assumed to be eliminated while
Route 94 will be maintained in its current state. Again, as with Options 1 and 2, the Route 94 GO buses will be prohibited from using the DRT transit-only lanes along the Highway 2 corridor.
Also, as discussed under Option 1, to maximize the benefits associated with the implementation
of the proposed Durham – Scarborough BRT operation within the TTC service area, it is assumed that DRT will pick-up and drop-off passengers with the TTC service area. As with the other two
options, it is again assumed that the transit fares for the DRT and TTC services will not be integrated when the service commences in 2015 but that an open-door passenger pick-up and
drop-off policy is in effect.
Similar to the other options, for the purpose of this assessment it is also assumed that the BRT alignment and operation as proposed under this option does not deviate from the Highway 2 corridor to provide a direct transfer to GO stations with any of the Durham municipalities.
Summary of Options
TABLE 6 SUMMARY OF OPTIONS
Option 1 Option 2 Option 3
Opening Year 2015 2015 2015
Headway from Oshawa to Whitby (minutes) – 2021/2031
8 / 6 11 / 8 11 / 10
Headway from Whitby to Pickering (minutes) - 2021/2031
5 /3.5 7 / 5 7.5 / 6
Headway from Pickering to Scarborough (minutes) - 2021/2031
3 / 2.5 4 / 3 5 / 4
BRT Vehicles – 2021/2031 47 / 61 42 / 54 38 / 46
Travel time (end-to-end) 76.8 89.5 94.9

Durham-Scarborough Bus Rapid Transit Benefits Case
30
Part C Assessment
Evaluation Framework The comparative analysis uses a Multiple Account Evaluation (MAE) methodology. The MAE is a framework that provides a systematic identification and analysis of broader implications and
criteria of an option. It systematically compares the impacts on costs, users, environment, economy and community and shows the trade-offs among the often conflicting criteria.
The MAE framework includes a number of evaluation accounts that together address the most
significant project performance and policy considerations for a specific project. The criteria and the accounts can be tailored for a project. The relevant accounts for the analysis of the Durham-
Scarborough project are:
I Transportation User Benefits;
I Financial Impacts;
I Environmental Impacts;
I Economic Impacts; and
I Socio-Community Impacts.
It is important to note that the options defined in this report have only been developed to a level
of technical detail sufficient to enable a comparative analysis for the purpose of selecting a preferred option. Project scope, costs and service plans need to be developed in more detail for
funding and implementation.
The assessment is done by comparing each option to the Base Case and identifying any
incremental costs or benefits that are generated by each option. Hence, the results should not be
interpreted as “total” values, but as the incremental impact compared to the Base Case.
The analysis is done over a 30-year period (2009-2038). Where possible the impacts are
monetized and quantified. In order to compare the options on a “like-to-like” basis and to reflect time value of money the monetized values are discounted to today’s value at a real
discount rate of 5%. These values, and other input variables used in this analysis are shown in Appendix A.
Transportation User Benefits This account considers the incremental benefits to the transportation users as a result of the investment in the Durham-Scarborough BRT project. The monetized benefits are measured in
travel time savings for both transit users and road users, automobile operating cost savings

Durham-Scarborough Bus Rapid Transit Benefits Case
31
achieved by individuals as their trip times or overall automobile usage declines, and reduction in
accidents as a result of declining automobile usage.
In addition to the monetized benefits, there are qualitative user impacts which may include
passenger comfort, accessibility and reliability. In most instances they are captured in the ridership and travel time savings, but in some instances they can be isolated and identified
separately if significantly different among the options.
Travel Time Savings
Travel time savings are included for both transit and non-transit users. The improvement of transit services along Highway 2 shows that the investment will generate significant time savings for existing transit users (those who currently use transit), new transit users and auto users. The value of time is estimated at an average of $13 per hour13 and is expected to grow, in real terms, by 1.6% per year over the period.
Option 1 delivers the highest transit incremental benefits, followed by Option 2 while Option 3 provides the lowest level of travel time savings. This is due to the journey time savings offered by the Full BRT option delivering significant additional benefits to transit users as result of improved travel times, which in turn attracts more new users. As a comparison Option 2 is considerably slower than Option 1 (by 13 minutes) while Option 3 is significantly slower than Option 1 (by 18 minutes) since it largely operates in mixed traffic along the corridor.
The present value of travel time savings for both transit and auto users over the evaluation
period (2009-2038) is largest for Option 1, the Full BRT option, estimated at $229 million in present value terms and greater than the travel time savings generated by Option 2 and Option 3
which are $154 million and $130 million, respectively.
Automobile Operating Cost Savings
Automobile operating costs savings are derived from a reduction in auto kilometres as a result of
the transit investment. The analysis shows that the Durham-Scarborough project will result in reduced auto usage and that reduction is linked to the travel time of each option. It is estimated
that the reduction in auto kilometres by 2031 ranges from 18 million vehicle kilometres for
Option 3 to more than 42 million kilometres for Option 1.
Translating these savings into monetary terms, the present value of the automobile operating
cost savings over the period are $269 million, $158 million and $78 million for Options 1, 2 and 3, respectively. The estimates for all options are shown in Table 7.
13 See Appendix A for details.

Durham-Scarborough Bus Rapid Transit Benefits Case
32
Safety Benefits
The reduction in collisions is based on fewer vehicle kilometres driven. The monetary savings
resulting from a reduction in collisions is calculated based on an assumed value of 7 cents per kilometre in reduced road travel (see Appendix A). The present value of safety benefits over the
period ranges between $27 million for Option 1 to $7 million for Option 3. The estimates for all options are shown in Table 7.
Qualitative Transportation Benefits
The major differences between the options from a user’s perspective are travel time, reliability, need for transfer and passenger comfort. Travel time and transfer requirements are largely
captured in the travel time savings estimates. Therefore, from a user’s perspective, the options
are differentiated by the degree to which service and schedule reliability are achieved and by passenger comfort. The BRT lanes will enhance the reliability of each option, with Option 1 likely
to provide the highest levels of reliability as a result of the highest level of exclusivity.
All options will likely experience some variability in travel time depending on traffic congestion
and cross-traffic at intersections as well as accidents. However in order to minimise travel times
the operating assumptions must include signal priority at intersections along the corridor to achieve the forecast speeds.
Finally, an important consideration for BRT systems is the need to maintain reliable and fast journey times and ensuring that these advantages are not ‘eroded’ as the project moves on to
detailed design by reductions in BRT lanes or signal priority.
Summary
Table 7 summarizes the incremental transportation user benefits associated with the Durham-
Scarborough project.

Durham-Scarborough Bus Rapid Transit Benefits Case
33
TABLE 7 INCREMENTAL TRANSPORTATION USER BENEFITS
All Values in NPV $m in 2009 prices Option 1
Option 2
Option 3
Travel Time Savings $229 $154 $130
Automobile Cost Savings $269 $158 $78
Accident / Collision Reductions $27 $16 $7
Transportation User Benefits $525 $328 $215
Financial Account This account includes the assessment of the direct incremental “cash” items, primarily costs and
revenues from the owner’s perspective, for each option over the assessment period. Costs include the incremental capital and operating costs incurred by each option compared to the
Base Case. For the purposes of this analysis, incremental revenues include fare revenues only. Any savings resulting from the implementation of the options are also included in this account.
Ridership and Revenues
Table 8 shows the peak hour demand by direction for the various options.
TABLE 8 PASSENGER FORECASTS (AM PEAK HOUR LOAD BY DIRECTION, MAXIMUM)
Option 1 Option 2 Option 3
EB WB EB WB EB WB
2021 AM Peak
Passengers 500 2,000 400 1,300 400 1,000
2031 AM Peak
Passengers 600 2,500 500 1,700 500 1,400
The table shows Option 1 attracts the highest demand levels. This is primarily because the journey times offered by Option 1 are significantly faster than Options 2 or 3 and therefore has
the ability to attract a greater mode shift from auto to transit. The forecasts show westbound flows are significantly higher than eastbound flows with passenger volumes increasing as the
route approaches Scarborough. This is a result of passengers’ desire to access the Pickering GO Station, the TTC rapid transit network and major destinations such as the University of Toronto’s
Scarborough campus.

Durham-Scarborough Bus Rapid Transit Benefits Case
34
Based on these ridership estimates, the analysis shows that in 2031 (from a system-wide
perspective) Option 1 would generate incremental annual fare revenues of around $2.3 million versus $1.6 million for Option 2 and $1.4 million for Option 3. In net present value terms over the
period of the analysis, incremental revenues are $25.3 million, $17.7 million and $15.3 million for Options 1, 2 and 3 respectively. The incremental fare revenues estimates are based on the
assumption of an open-door fare policy within the City of Toronto under all options, rather than
full fare integration, as discussed in Part B of this report.
Note that while The Big Move contemplated an integrated fare system enabling travellers to cross
municipal boundaries without fare duplication, a regional integrated fare system remains a longer-term objective and is beyond the scope of this analysis. To focus this analysis on the
transit service itself, integrated fares have not been assumed. As a consequence, passengers transferring between DRT and TTC services are subject to an additional fare.
Capital and Operating Costs
The capital costs include all costs associated with the construction and acquisition of the
infrastructure, revenue collection, vehicles, and maintenance centre. The estimates also include design, management & administration, insurance, environmental permitting, property, and
contingencies.
The construction period is assumed to be the same for all three options with start in 2011 and
completion by 2014 for opening of service in 2015. Predictably, Option 1 has the highest capital cost of the three options with an estimated cost of $498 million in 2009 dollars. Option 2 is
estimated to cost $342 million while the estimated capital cost for Option 3 is $277 million (all
costs excluding interest during construction).
For all options the vehicle costs have been distributed evenly over the years 2013-2014. It is
assumed that all buses are to be replaced in all options in the period 2026-27 reflecting a 12-year bus life cycle. Costs are also included for the additional vehicles required to provide increased
frequency by 2031. Property costs were estimated based on right of way requirements and the use of a generic property cost of $2.5m per hectare, which is based on assumptions used in the
development of the LTTS.
Table 9 shows the capital costs and operating costs for each option. All values are expressed in 2009 dollars.

Durham-Scarborough Bus Rapid Transit Benefits Case
35
TABLE 9 CAPITAL AND OPERATING COSTS ($ MILLION)
All Values in 2009 $m Option 1
Option 2
Option 3
Capital Costs $498m $304m $277m
Annual incremental operating costs (2021) $6.5m $5.1m $4.4m
Annual incremental operating costs (2031) $8.4m $6.9m $5.3m
Bus operating costs are based on estimates developed by DRT for the Durham Long-Term Transit
Strategy, which estimates operating costs of $92.58/hour for conventional mixed traffic operations, $108.32/hour for enhanced services (BRT Lite) and $118.01/hour for full BRT
services. These costs have been converted to operating costs for this analysis based on the length of route type under each option, resulting in estimated total operating costs of $115.07/hour for
Option 1, $106.50 for Option 2 and $99.69 for Option 3.
Summary
Table 10 shows the capital costs, operating costs and incremental fare revenues expressed in
present value for the period 2009-2038.
TABLE 10 INCREMENTAL COSTS AND REVENUES
All Values in NPV $m Option 1
Option 2
Option 3
Capital Costs $366 $244 $195
Operating Costs $78 $63 $51
Total Incremental Costs $444 $307 $246
Incremental Fare Revenues $25.3 $17.7 $15.3
Comparing Benefits and Costs Table 11 compares the results from the Transportation User Benefits and Financial accounts. As illustrated in the table Option 1 (Full BRT) generates the most benefits, but is also has the
highest costs, result in a benefit-cost ratio of approximately 1.2. Benefits for Option 2 are significantly less than Option 1, but as the cost are also comparably lower, the benefit-cost ration
for this option is approximately 1.1. While Option 3 is the lowest cost option, it also generates the lowest benefit-cost ratio of 0.9. The relatively poorer results for Option 3 are likely due in

Durham-Scarborough Bus Rapid Transit Benefits Case
36
large part to the slower speeds through the Scarborough portion of the route in mixed traffic
conditions, which reduces the overall attractiveness of the service.
TABLE 11 COMPARISON BENEFITS AND COSTS
All Values in NPV $m Option 1
Option 2
Option 3
Transportation User Benefits $525 $327 $216
Incremental Costs $444 $307 $246
Net Benefit (Cost) $81 $20 ($30)
Benefit-Cost Ratio 1.2 1.1 0.9
Environmental Impacts This account examines the environmental impacts of the Durham-Scarborough Transit options.
The major environmental impact with respect to urban transit projects is the ability of the project to reduce greenhouse gas emissions from reduced automobile usage.
Greenhouse Gas Emissions
As mentioned in the Transportation User Benefits section, all three options lead to an annual decline in automobile usage. By 2021, it is estimated that the number of kilometres travelled by
automobile will decline by almost 33 million kilometres annually under Option 1. The annual
reduction anticipated under Options 2 and 3 are approximately 18 million and 5 million kilometres respectively in 2021. By 2031 the annual reduction in vehicle kilometres increases to
42 million kilometres for Option 1 whereas Option 2 and 3 increase to around 27 million and 18 million kilometres respectively.
As shown in Table 12, this translates into an annual reduction of CO2 emissions ranging through 6,600 tonnes for Option 1, 3,600 tonnes for Option 2 and 1000 tonnes for Option 3. By the year
2031 these annual reductions increase to 9,600 tonnes for Option 1, 6,000 tonnes for Option 2
and 4,200 tonnes for Option 3.
The present value of the reduction in CO2 emissions over the period 2009-2038, based on an
average value of $0.01 per kilometre (see Appendix A), is estimated at $3.8 million for Option 1, $2.2 million for Option 2 and $1.1 million for Option 3. The value of a tonne of CO2 is currently a
subject of debate. These figures, regardless of the value assigned per tonne of CO2, are still very useful for comparison purposes among the options.
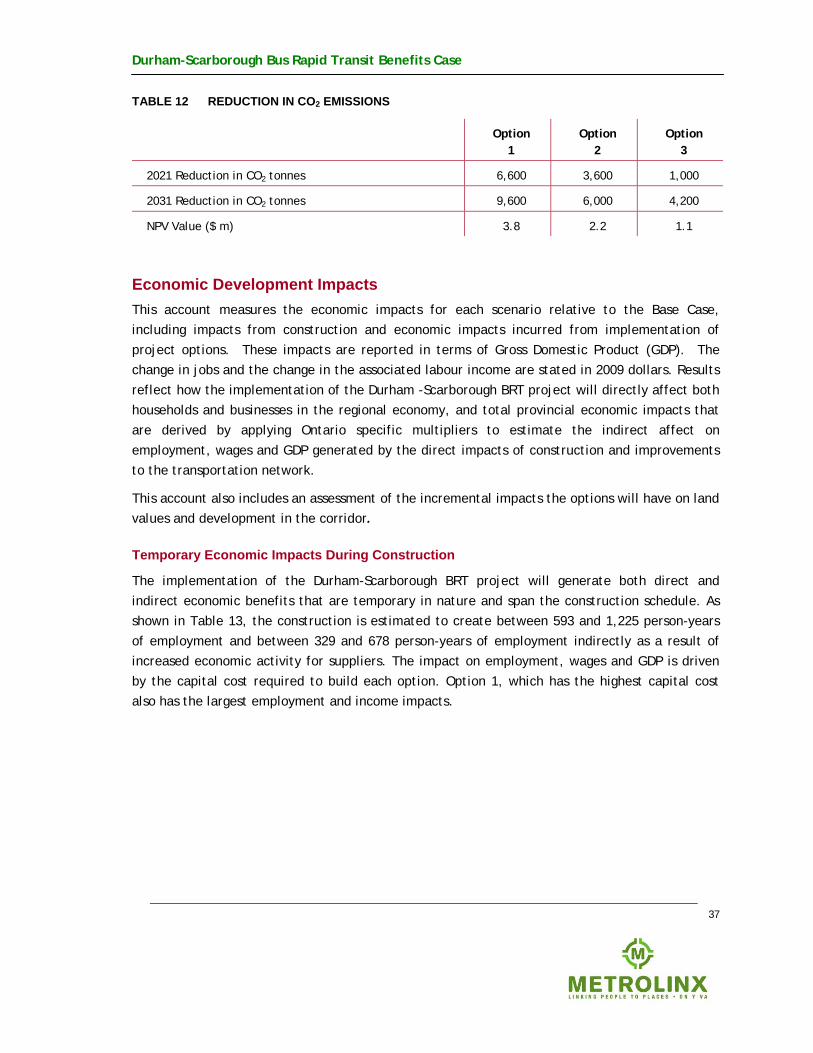
Durham-Scarborough Bus Rapid Transit Benefits Case
37
TABLE 12 REDUCTION IN CO2 EMISSIONS
Option 1
Option 2
Option 3
2021 Reduction in CO2 tonnes 6,600 3,600 1,000
2031 Reduction in CO2 tonnes 9,600 6,000 4,200
NPV Value ($ m) 3.8 2.2 1.1
Economic Development Impacts This account measures the economic impacts for each scenario relative to the Base Case, including impacts from construction and economic impacts incurred from implementation of
project options. These impacts are reported in terms of Gross Domestic Product (GDP). The change in jobs and the change in the associated labour income are stated in 2009 dollars. Results
reflect how the implementation of the Durham -Scarborough BRT project will directly affect both households and businesses in the regional economy, and total provincial economic impacts that
are derived by applying Ontario specific multipliers to estimate the indirect affect on
employment, wages and GDP generated by the direct impacts of construction and improvements to the transportation network.
This account also includes an assessment of the incremental impacts the options will have on land values and development in the corridor.
Temporary Economic Impacts During Construction
The implementation of the Durham-Scarborough BRT project will generate both direct and
indirect economic benefits that are temporary in nature and span the construction schedule. As shown in Table 13, the construction is estimated to create between 593 and 1,225 person-years
of employment and between 329 and 678 person-years of employment indirectly as a result of increased economic activity for suppliers. The impact on employment, wages and GDP is driven
by the capital cost required to build each option. Option 1, which has the highest capital cost also has the largest employment and income impacts.

Durham-Scarborough Bus Rapid Transit Benefits Case
38
TABLE 13 EMPLOYMENT AND INCOME IMPACTS DURING CONSTRUCTION
Direct Impacts Regional (Indirect) Impacts Option
Employment (person years)
Wages ($m)
GDP ($m)
Employment (person years)
Wages ($m)
GDP ($m)
Option 1 1,225 $46.2 $107 678 $25.6 $59
Option 2 764 $28.8 $67 423 $16.0 $37
Option 3 593 $22.4 $52 329 $12.4 $29
Long-term Economic Impacts
In the long-term there will be ongoing economic benefits as a result of the Durham-Scarborough
BRT project. These benefits reflect both households’ freed up vehicle operating expenditures
and transportation cost savings to area businesses. The former effect is simply a redirected consumption demand by households away from purchases of gas, parking, automotive parts and
services and into other consumer goods/services.
The latter reflects improved regional competitiveness for local businesses that now have lower
costs of doing business, including access to a larger labour market and encountering less congestion on roadways because people are choosing to use the transit system instead of driving.
The impact of the Durham-Scarborough Rapid Transit project will be different for each business.
Implementation of the project will also generate social benefits that can be monetized, including valuing time savings and emission benefits. These have already been captured above under
transportation user benefits.
As shown in Table 14, the Durham-Scarborough BRT project is expected to have an on-going and
positive impact on jobs, wages and the GDP once it is in operation. The impacts for each option are driven by transit and auto travel time savings provided by each option, although the benefits
are limited. Option 1 has the greatest employment and income impact with an estimated 27
direct jobs and 12 indirect jobs created in 2031 while the long term economic impacts of the other two options are smaller.

Durham-Scarborough Bus Rapid Transit Benefits Case
39
TABLE 14 EMPLOYMENT AND INCOME IMPACTS (2031)
Direct Annual Impacts Indirect Annual Impacts Scenario
Employm. (Jobs)
Wages ($m)
GDP ($m)
Employm. (Jobs)
Wages ($m)
GDP ($m)
Option 1 27 $1.03 $2.40 12 $0.46 $1.06
Option 2 21 $0.79 $1.82 9 $0.35 $0.81
Option 3 18 $0.68 $1.58 8 $0.30 $0.70
Land Value Changes
There is evidence from a number of different jurisdictions around the world that investment in
rapid transit can have a positive impact on property values in the general area of a new rapid
transit line and particularly within close proximity to station areas. This evidence also suggests that the rapid transit technology implemented is also a factor that affects the degree to which
property values may be influenced.
Table 15 presents the estimated value uplift factors based on ranges of value uplift found in a
number of research studies reviewed. The table shows the catchment area around a BRT station is estimated at 400 metres (compared to the slightly larger catchment area around a LRT station
estimated at 500 metres) and this is consistent with value uplift assumptions applied for other
rapid transit benefit cases undertaken in the region.
Table 15 shows the introduction of rapid transit will provide a modest lift in percentage terms to land values within the applicable area of station impact. Based upon the ranges shown, BRT has up to 3% property uplift for residential and commercial property. Note that these land uplift values are at the lower end of the range for property uplift as the corridor is already served to an extent by an express GO transit service. While the BRT project provides increased frequency and more stops it does not provide benefit in terms of travel time (compared to GO) and therefore may not be able to drive a substantive land value uplift.

Durham-Scarborough Bus Rapid Transit Benefits Case
40
TABLE 15 PROPERTY VALUE UPLIFT FACTORS
Technology BRT
Station Impact Area 400m
Low 1% Residential
High 3%
Low 2% Commercial
High 3%
Based on Table 15, land uses along the proposed route and the current property value data obtained from planning departments of Oshawa, Whitby, Ajax, Pickering and Toronto, the
potential land/property value uplift is estimated for the three implementation options currently under consideration. The following summarizes the assessment for each of the options.
Option 1 - Full BRT Under this option land value uplift is estimated to impact all 33 station areas within the 400
metre station impact area as discussed above.
Land value uplift is calculated by multiplying the percentage of value uplift typical for each land
use by the total assessment of lands within station areas in each land use category. Within the
land area impacted by Option 1, the average uplift is between 1.1% and 1.2%. It is estimated that the potential uplift in assessment value as a result of this Option would be approximately $57
million to $59 million.
Option 2 - BRT with Partial Exclusivity within Durham and Toronto Option 2 contemplates a BRT service using the same route, station spacing and station impact area as Option 1. While there is a travel time increase (17% increase over Option 1 for end to end
trips) this is unlikely to have a significant effect on land value uplift. For the purposes of this analysis, a discount factor of 10% off the uplift was applied to reflect the travel time differential.
Within the area impacted in Option 2, the average uplift is between 1.0% and 1.1%. It is
estimated that the potential uplift in assessment value as a result of this Option would be between $51 and $53 million.
Option 3 - BRT with Partial Exclusivity within Durham Option 3 considers a BRT service using the same route, station spacing and station impact area as
Options 1 and 2. There is a small travel time increase over Option 2 as result of reduced transit

Durham-Scarborough Bus Rapid Transit Benefits Case
41
exclusivity in Toronto but it is unlikely to have an effect on land value uplift and therefore the
same uplift as that estimated for Option 2 was applied.
Within the area impacted in Option 3, the average uplift is estimated in the range of 1.0% to
1.1%. It is estimated that the potential uplift in assessment value as a result of this Option would also be between $51 million and $53 million.
Summary
Table 16 summarizes the economic development impacts including direct and indirect impacts along with the land value uplift for each option.
TABLE 16 ECONOMIC DEVELOPMENT IMPACTS
Option 1
Option 2
Option 3
Total Impacts During Construction Period (direct and indirect):
Employment (Person-years) 1,903 1,187 922
GDP ($m) $166 $104 $81
Income ($m) $71.8 $44.8 $34.8
Impacts in 2031:
Employment (jobs) 39 30 26
GDP ($m) $3.5 $2.6 $2.3
Income ($m) $1.5 $1.1 $1.0
Land Value Increase
Low Estimate ($m) $57 $51 $51
High Estimate($m) $59 $53 $53
Social Community Impacts This account examines each option from the community perspective with specific consideration
given to the ability of each option to enhance the quality of life within a local community. This
may result from land use changes or developments that can occur in response to the introduction of a new rapid transit line, as well as the improvements brought about by the enhanced
accessibility, both locally and regionally, offered by the new transit alternative. This account

Durham-Scarborough Bus Rapid Transit Benefits Case
42
also considers the ability of each option to positively affect the overall health of the local
community and its residents through reduced auto congestion on local streets as well as the ability of transit to support a more balanced lifestyle for local residents along with enhanced
personal safety.
Land Use Shaping
Experience in other jurisdictions demonstrates that, when combined with complementary local
planning initiatives, the implementation of transit can positively support and influence development, particularly around rapid transit stations, and promotes more compact, mixed use
communities. The type and magnitude of the development is dependent upon a number of
factors including the general nature of the transit corridor and the surrounding neighbourhoods.
The investment in rapid transit is a tool to further support transit oriented development and
prevent urban sprawl. As mentioned in the section on Land Value Changes, investment in rapid transit can influence and direct both land and transit planning to encourage complementary
policies that support intensification of communities while reducing the dependence on the
automobile in both Durham Region and Scarborough. This is reinforced by the GGH Growth Plan which has identified three UGCs along the route in Downtown Oshawa, Downtown Pickering and
Scarborough Centre.
Although BRT generally has a lower impact on land values than other types of transit
technologies, in combination with supportive land use policies in both the Durham Region and Scarborough portions of the corridor and the permanence of BRT alignments, BRT can support and
accelerate the development of more compact and complete communities in the three UGCs. By
being a complete community with mixed use development it will encourage more walking and bicycling.
For the purpose of this analysis, it is assumed that, consistent with the land value uplift estimates presented earlier in this report, all three transit options are capable of promoting land
use changes to support the local planning initiatives and changes to the local zoning. With this in mind, the investment associated with more permanent BRT infrastructure proposed under Option
1 is more likely to result in positive land-use impacts along the corridor. In Durham Region, it will
help to achieve the objective of revitalizing the various downtowns and create a more densely developed, less car-dependent urban environments. In Scarborough, Option 1 will better realize
this corridor’s status as a future higher-order rapid transit corridor as identified in the City of Toronto Official Plan.
Road Network
A number of road widenings and intersection improvements will be required to accommodate the
BRT lanes in the median. The introduction of BRT lanes will provide Durham Region and the City of Toronto with the opportunity to create streetscapes which are more pedestrian-friendly along

Durham-Scarborough Bus Rapid Transit Benefits Case
43
the Ellesmere-Highway 2 corridor (e.g. improving walking and cycling environments, etc.) An
additional advantage of BRT lanes is that they create pedestrian refuges in the median improving the ability of pedestrians to cross the road, particularly for seniors. Option 1 would have the
greatest impact in this regard given the greater extent of the dedicated median bus lanes proposed under this option.
As proposed, the new rapid transit line will impact the local road network in two significant
ways. Firstly, based on the average transit speeds proposed for the corridor a significant level of signal priority will be required to support the transit operation. Secondly, depending on the
extent of signal priority required, there is the potential to negatively impact traffic at intersections where there are likely to be longer delays while priority is given to BRT. These
impacts will be highest under Option 1 the most due to the higher level of segregation, and these will be applied in the most congested sections of the route.
Construction
All three options will involve a certain degree of disruption to traffic, neighbouring commercial,
retail and residential properties during construction. While the specific construction impacts associated with the implementation of each option cannot be determined until the project is
defined in more detail, it is assumed that Option 1 will be the most disruptive as it requires the longest length of segregated lanes. Option 2 would be the next in terms of construction impacts
and traffic disruption while Option 3 would have the least construction impacts.
Sensitivity Analysis Since the analysis is based on discounted cash flow and subject to changes as the discount rate
changes, the robustness of the ranking of the options with respect to the benefit-cost ratio was tested under two alternative discount rates – 3% and 7%. As shown in Table 17, under all discount
rate tests Option 1 shows the highest NPV and BCR. The 3% test shows all options returning positive NPV and BCR above 1.0 while the 7% test shows all options showing a negative NPV and
only Option 1 provides BCR over 1.0.

Durham-Scarborough Bus Rapid Transit Benefits Case
44
TABLE 17 DISCOUNT RATE SENSITIVITY ANALYSIS
Discount Rate 3% 5% 7%
Option NPV $m BCR NPV $m BCR NPV $m BCR
Option 1 230 1.4 81 1.2 (10) 1.0
Option 2 103 1.3 20 1.1 (30) 0.9
Option 3 22 1.1 (30) 0.9 (59) 0.7
Summary of Results The analysis of the Durham-Scarborough BRT options reveals that the highest cost option (Option
1 - Full BRT), with estimated capital and operating costs of $444 million in net present value terms, yields transportation user benefits higher than the cost. These benefits are estimated at
$525 million resulting in a benefit-cost ratio of 1.2. Option 2 results in a slightly lower BCR of 1.1 in comparison to Option 1 with estimated capital and operating costs of $307 million with an
estimated $327 million in transportation user benefits. Option 3 has the lowest estimated capital and operating costs of $246 million but with an estimated $216 million in transportation user
benefits results in a BCR of 0.9.
Option 1 has the highest travel time savings (and highest ridership) due to the faster journey times offered by the exclusive BRT lanes along the entire length of the route, highlighting the
importance of the operating speed of the rapid transit system to the success of the project. Option 2 delivers less travel time savings than Option 1 but these are balanced by lower capital
and operating costs resulting in a slightly lower BCR. While Option 3 provides the lowest cost option it also offers relatively less benefits (reflected in lower BCR). This is a reflection of the
congestion levels in the Scarborough area and the additional benefits provided by Options 1 and 2
exclusive bus lanes in this section of the route.
All of the options are somewhat effective in attracting people out of their cars and reducing
automobile usage. Option 1, which has the largest effect, will result in a reduction of greenhouse gas emissions by approximately 6,600 tonnes annually by 2021 increasing to 9,600 tonnes by 2031.
In net present value terms, this equates to $3.8 million for Option 1 compared to $2.2 million and
$1.1 million for Options 2 and 3 respectively.
As expected, the option with the highest capital costs generated the most significant economic
development effects. Option 1, which has the highest capital cost, will have the largest impact on employment, income and GDP during construction and is estimated to generate approximately
1,903 person-years of employment (including direct and indirect effects). By contrast, the lowest

Durham-Scarborough Bus Rapid Transit Benefits Case
45
cost option (Option 3) produces the lowest overall economic development and employment
benefits during construction as well as during the on-going operations (922 person-years).
The options support the GTHA land use and economic development objectives to revitalize the
corridor by enhancing and supporting complementary planning and densification initiatives. However, the effects are somewhat limited as the portion of the corridor in Durham Region is
paralleled by the existing GO Lakeshore East line. As well, research suggests BRT generally has
less impact on property value uplift than rail-based rapid transit. The results show that Option 1 could provide up to $59 million in property value uplift compared with up to $53 million for both
Options 2 and 3.
Overall, the results indicate that a BRT transit route in the Ellesmere Road-Highway 2 corridor
will generate significant transportation user, environmental and socio-economic benefits. The project would also support the objectives of the GGH Growth Plan and The Big Move, including
improving linkages between three Urban Growth Centres, as well as supporting municipal
planning objectives in the corridor. The higher level of BRT exclusivity under Options 1 and 2 results in higher total benefits, reflecting the importance of enhanced transit service along the
length of the corridor in both Scarborough and Durham Region.
The assumed route connecting the Hwy 2 corridor in Durham Region to the Ellesmere Corridor in
Toronto and stations locations along the entire corridor in this Benefits Case Analysis does not
preclude other routing options and stop locations from being considered should the project proceed
to more advanced project development phases (e.g., preliminary design/engineering and
environmental assessment stages). Further opportunities to connect the Durham-Scarborough BRT
to existing and planned transit infrastructure within Toronto and Durham should also be explored in
future project development phases.
Table 18 below summarizes the results from the MAE.
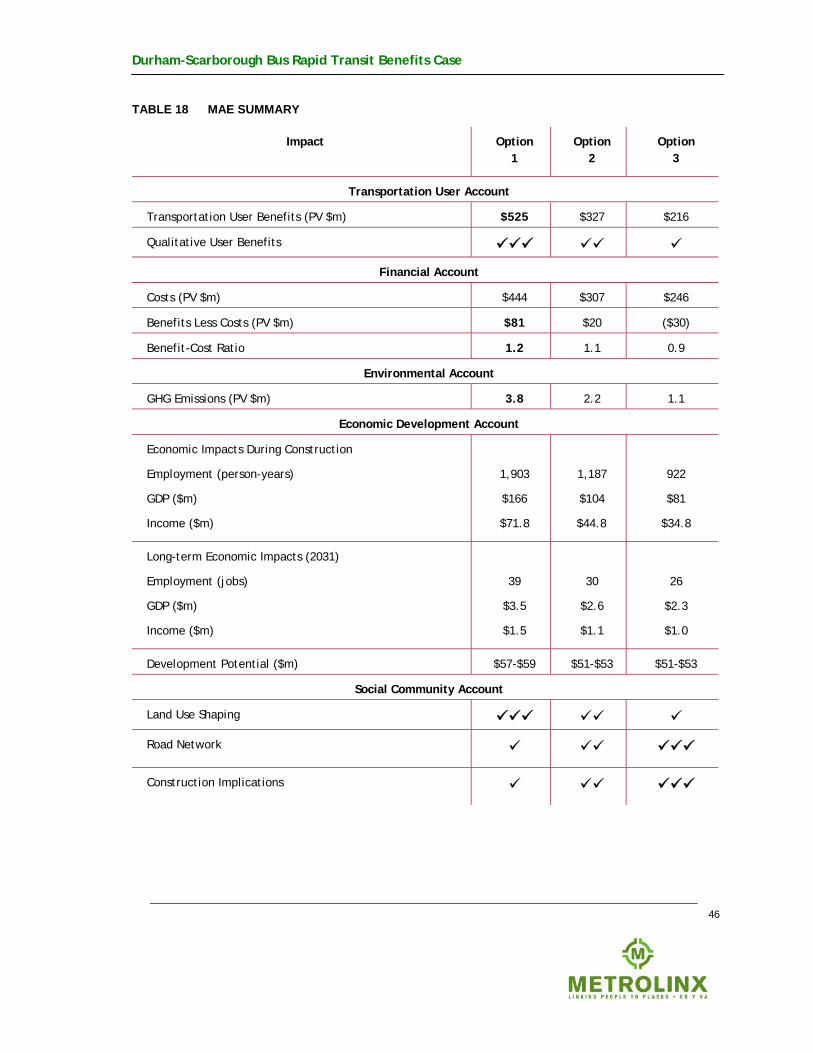
Durham-Scarborough Bus Rapid Transit Benefits Case
46
TABLE 18 MAE SUMMARY
Impact Option 1
Option 2
Option 3
Transportation User Account
Transportation User Benefits (PV $m) $525 $327 $216
Qualitative User Benefits
Financial Account
Costs (PV $m) $444 $307 $246
Benefits Less Costs (PV $m) $81 $20 ($30)
Benefit-Cost Ratio 1.2 1.1 0.9
Environmental Account
GHG Emissions (PV $m) 3.8 2.2 1.1
Economic Development Account
Economic Impacts During Construction
Employment (person-years)
GDP ($m)
Income ($m)
1,903
$166
$71.8
1,187
$104
$44.8
922
$81
$34.8
Long-term Economic Impacts (2031)
Employment (jobs)
GDP ($m)
Income ($m)
39
$3.5
$1.5
30
$2.6
$1.1
26
$2.3
$1.0
Development Potential ($m) $57-$59 $51-$53 $51-$53
Social Community Account
Land Use Shaping
Road Network
Construction Implications

Durham-Scarborough Bus Rapid Transit Benefits Case
47
APPENDIX
A
INPUT VARIABLES AND ASSUMPTIONS

Durham-Scarborough Bus Rapid Transit Benefits Case
48
Factor Value Source
Discount Rate Sensitivity Analysis
5% (real terms) 3% and 7%
Province of Ontario
Value of Time Business Other Weighted Average
$35.16 (2008$) $10.82 $13.02
Transport Canada, Greater Golden Horseshoe Model
Value of Time Growth 1.6% per annum Based on GDP per capita increases, GDP/ Population estimates from www.greatertoronto.org
Average Accident Cost $0.07 per km Collision Statistics: 2004 Canadian Motor Vehicle Traffic Collision Statistics, TP3322. Vehicle Kilometers: Statistics Canada, Catalogue No. 53–223–XIE, "Canadian Vehicle Survey"
Greenhouse Gas Emissions 2006 2021 2031
2.39 kg /l or 0.23 kg per km 2.35 kg /l or 0.21 kg per km2.35 kg /l or 0.20 kg per km
Urban Transportation Emissions Calculator, Transport Canada, Greater Golden Horseshoe Model
Average Cost of CO2 $0.01 per km
$40/tonne (median cost)
Several literature sources, Transport and Environment Canada, Greater Golden Horseshoe Model and http://envirovaluation.org/index.php/ 2007/09/06/university_of_hamburg_ forschungsstelle_n_1
Auto Operating Costs
In 2008$ + 2.0% p.a. increase 2007 - $0.50/km 2021 - $0.65/km 2031 - $0.79/km
Data in 2007 based on CAA calculation of average driving costs and includes operating and ownership costs (long-term costs).
Increase based on Greater Golden Horseshoe Model
Annualisation Factors: Metro / LRTRoad
Peak-daily/Daily-Annual 3 / 300 10 / 300
Greater Golden Horseshoe Model