durham e-theses transcriptional regulation of metabolic...
TRANSCRIPT

Durham E-Theses
Transcriptional Regulation of Metabolic Genes by the
Basic Leucine Zipper Transcription Factor Hac1ip and
Nutrient Stimuli
PARMAR, VIPULKUMAR,MOHANLAL
How to cite:
PARMAR, VIPULKUMAR,MOHANLAL (2012) Transcriptional Regulation of Metabolic Genes by the
Basic Leucine Zipper Transcription Factor Hac1ip and Nutrient Stimuli, Durham theses, DurhamUniversity. Available at Durham E-Theses Online: http://etheses.dur.ac.uk/3415/
Use policy
The full-text may be used and/or reproduced, and given to third parties in any format or medium, without prior permission orcharge, for personal research or study, educational, or not-for-prot purposes provided that:
• a full bibliographic reference is made to the original source
• a link is made to the metadata record in Durham E-Theses
• the full-text is not changed in any way
The full-text must not be sold in any format or medium without the formal permission of the copyright holders.
Please consult the full Durham E-Theses policy for further details.

Academic Support Oce, Durham University, University Oce, Old Elvet, Durham DH1 3HPe-mail: [email protected] Tel: +44 0191 334 6107
http://etheses.dur.ac.uk
2

Transcriptional Regulation of Metabolic
Genes by the Basic Leucine Zipper Transcription Factor Hac1ip and Nutrient
Stimuli
Vipulkumar Mohanlal Parmar
This thesis is submitted as part of the requirements for the
award of the Degree of Doctor of Philosophy
of the University of Durham
2012
i
ABSTRACT
Saccharomyces cerevisiae cells respond to nutrients in their environment by
altering their metabolic and transcriptional state in order to optimise the use
of available nutrients and decide which of the several developmental
pathways to pursue. In the yeast S. cerevisiae, meiosis and pseudohyphal
growth are two major differentiation outcomes in response to nitrogen
starvation. A central component of unfolded protein response pathway, the
bZIP transcription factor Hac1ip, negatively regulates meiosis and
pseudohyphal growth. The present study investigates this negative regulatory
mechanism at early meiotic genes by Hac1ip in nitrogen-rich conditions.
Regulation of transcription by Ume6p transcriptional regulator, Rpd3p-Sin3p
histone deacetylase complex and Isw2p-Itc1p chromatin remodelling
complex at URS1 was also investigated here. We also tested for induction of
pseudohyphal growth in diploids from SK1 genetic background in response to
nitrogen starvation conditions known to induce meiosis.
I constructed destabilised β-galactosidase reporters expressed from URS1-
CYC1-Ub-X-lacZ reporters to analyze transcriptional activity at URS1 site of
early meiotic genes in nutrient rich conditions. The data presented here
successfully demonstrates Hac1ip-mediated repression at URS1 sites in
nitrogen-rich conditions. URS1-CYC1-Ub-X-lacZ reporters were expressed in
mitotic repression machinery mutants (ume6Δ, rpd3Δ, sin3Δ, isw2Δ and
itc1Δ) under nitrogen rich conditions. The data presented here from these
experiments not only corroborates their known role in repression at URS1 but
also suggested regulation at additional sites in the minimal CYC1 promoter.
Deletion of Sin3p suggested independent repression function separable from
Rpd3p. Isw2p also acts independently of Itc1p at sites other than URS1. We
also show that pseudohyphal growth was stimulated by non-fermentable
carbon sources in sporulation efficient SK1 genetic background. The data
also indicates that stimulation of pseudohyphal growth by non-fermentable
carbon sources does not require respiration function or functional
mitochondrial RTG pathway.
ii
PUBLICATION
Ime1 and Ime2 are required for pseudohyphal growth of
Saccharomyces cerevisiae on nonfermentable carbon sources. Strudwick N, Brown M, Parmar VM, Schröder M.
Durham University, School of Biological and Biomedical Sciences, Durham
DH1 3LE, United Kingdom.
Abstract
Pseudohyphal growth and meiosis are two differentiation responses to
nitrogen starvation of diploid Saccharomyces cerevisiae. Nitrogen starvation
in the presence of fermentable carbon sources is thought to induce
pseudohyphal growth, whereas nitrogen and sugar starvation induces
meiosis. In contrast to the genetic background routinely used to study
pseudohyphal growth (Σ1278b), nonfermentable carbon sources stimulate
pseudohyphal growth in the efficiently sporulating strain SK1. Pseudohyphal
SK1 cells can exit pseudohyphal growth to complete meiosis. Two
stimulators of meiosis, Ime1 and Ime2, are required for pseudohyphal growth
of SK1 cells in the presence of nonfermentable carbon sources. Epistasis
analysis suggests that Ime1 and Ime2 act in the same order in pseudohyphal
growth as in meiosis. The different behaviors of strains SK1 and Σ1278b are
in part attributable to differences in cyclic AMP (cAMP) signaling. In contrast
to Σ1278b cells, hyperactivation of cAMP signaling using constitutively active
Ras2(G19V) inhibited pseudohyphal growth in SK1 cells. Our data identify
the SK1 genetic background as an alternative genetic background for the
study of pseudohyphal growth and suggest an overlap between signaling
pathways controlling pseudohyphal growth and meiosis. Based on these
findings, we propose to include exit from pseudohyphal growth and entry into
meiosis in the life cycle of S. cerevisiae.
Mol Cell Biol. 2010 Dec; 30(23):5514-30. (Reprint: Appendix I)

iii
ACKNOWLEDGEMENTS
I would like to thank Dr Martin Schröder for providing me the opportunity to
work in this exciting research area. I am also indebted to Dr D.J.Mohan and
Rakesh Sir for introducing me to the wonderful field of biology and making it
interesting. Many thanks to Natalie, Sergej, Claire, Saeed, Ewa, Monika,
Louise, David, Sid, Adina and Max from lab 2 for their good company and
tolerating me and also a word of thanks for Lesley, Prashant, Usha and
Paud. It was great working with you guys.
I am very grateful to all my family who have constantly supported me during
this research journey. Thanks to my nieces and nephews Ishii, Abeer,
Vishwanshi, Dheeya and Mitul and cousins Manya and Maitry, who have
always cheered me up. I would also like to thank my dear friends Jignesh,
Paramjeet, Priya, Kshitish and Sapan and their family. A special thanks to my
Late Father-in-law Mr. Tilak Raj Bajaj, whose humor, words of
encouragement and constant support have boosted me from time to time.
A very special word for my dear Wife Tanu, who has constantly and
unconditionally supported me in all my ups and downs, put up with my odd
hours and has been my inspiration. This work is dedicated to my wife and my
parents.
This acknowledgement would also be incomplete if I did not thank millions of
yeasts who sacrificed their life in the process of generating data this thesis.
Thank you yeast.

iv
Declaration
No material contained herein has been previously submitted for any other
degree.Except where acknowledged, all material is the work of the author.
Statement of Copyright
The copyright of this thesis rests with author. No quotation from it should be
published without his prior written consent and information derived from it
should be acknowledged.

v
TABLE OF CONTENTS
ABSTRACT .................................................................................................. i
PUBLICATION ............................................................................................. ii ACKNOWLEDGEMENTS ........................................................................... iii
DECLARATION ........................................................................................... iv TABLE OF CONTENTS ............................................................................... v LIST OF FIGURES ....................................................................................... ix
LIST OF TABLES ......................................................................................... xi
LIST OF ABBREVIATIONS......................................................................... xii Chapter 1 INTRODUCTION
1.1 Nutrient signalling pathways in S. cerevisiae ...................................... 1
1.1.1 Carbon source ................................................................................... 2
1.1.2 Nitrogen source ................................................................................. 3
1.1.3 Amino acid ......................................................................................... 6
1.1.4 TOR signalling pathway ..................................................................... 7
1.2 Differentiation responses in S. cerevisiae............................................. 9
1.2.1 Meiosis ......................................................................................... 11
1.2.1.1 Nutritiona regulation of meiosis induction .............................. 11
1.2.1.2 Cell type control ..................................................................... 15
1.2.1.3 Regulation of early meiotic genes.......................................... 16
1.2.2 Pseudohyphal growth ................................................................. ..22
1.2.2.1 Nutrient sensing and pseudohyphal growth .......................... 22
1.2.2.2 Pathways regulating pseudohyphal growth ........................... 24
vi
1.2.2.2.1 The MAP kinase pathway ................................................... 24
1.2.2.2.1.1 Related MAP kinase pathway and their signalling
specificity ........................................................................................... 25
1.2.2.2.1.1.1 Crosstalk between FG and PH MAPK modules
.......................................................................................................... 26
1.2.2.2.1.1.2 Crosstalk between FG and HOG MAPK modules .. 27
1.2.2.2.1.1.3 Crosstalk between PH and HOG MAPK modules .. 28
1.2.2.2.2 The PKA pathway .............................................................. 29
1.2.2.2.3 Other pathways involved in filamentous differentiation ...... 32
1.2.2.2.4 Other proteins involved in regulation of pseudohyphal
growth…………………………………………………………………………...35
1.3 N-end rule ......................................................................................... 37
1.4 Unfolded protein response pathway as regualtor of nutritional and
developmental pathways .......................................................................... 40
1.4.1 UPR pathway in yeast .............................................................. 40
1.4.2 Mammalian UPR pathway ........................................................ 41
1.4.3 Role of UPR in nutrient sensing and differentiation of yeast ..... 45
1.4.4 Basal UPR pathway in yeast .................................................... 46
1.4.5 Role of UPR in nutrient sensing and differentiation in higher
eukaryotes ......................................................................................... 48
1.4.5.1 Glucose regulated events in pancreatic β-cells and plasma
B-cells ............................................................................................... 48
1.4.5.2 UPR and insulin signalling .................................................. 49
1.5 Aims and Objectives ........................................................................... 53
Chapter 2 MATERIALS AND METHODS
2. 1 Chemicals, reagents and commercial kits ......................................... 56
2. 2 List of primers and oligonucleotides .................................................. 64
2. 3 List of plasmids ................................................................................ 65
2. 4 List of strains ..................................................................................... 67
2. 5 Stock solutions .................................................................................. 71

vii
2. 6 Yeast and bacteriological media ....................................................... 75
2. 7 Protocols ........................................................................................... 87
2.7.1 Microbiology ................................................................................. 87
2.7.2 Yeast genetics ............................................................................. 90
2.7.3 Cell Biology .................................................................................. 92
2.7.4 Protein Biochemistry .................................................................... 93
2.7.5 Molecular biology ......................................................................... 96
Chapter 3 DESTABILISED β-GALACTOSIDASE REPORTERS: CONSTRUCTION, VALIDATION AND TRANSCRIPTIONAL REGULATION OF URS1 CONTROLLED EARLY MEIOTIC GENES
3. 1 CYC1-lacZ reporters for monitoring transcriptional activity under
nutrient-rich conditions ........................................................................... 116
3. 2 Demonstration of Hac1ip mediated negative regulation of EMGs
through URS1 ......................................................................................... 121
3. 3 Construction of URS1-CYC1-Ub-X-lacZ reporters .......................... 124
3. 4 Validation of URS1-CYC1-Ub-X-lacZ reporters ............................... 140
3. 5 Discussion ....................................................................................... 143
3. 6 Demonstration of Hac1ip mediated negative regulation through URS1
using URS1-CYC1-Ub-X-lacZ reporters ................................................. 144
3. 7 Disruption of Hac1ip mediated negative regulation in hac1Δ strain . 147
3. 8 Discussion ....................................................................................... 149
Chapter 4 TRANSCRIPTIONAL REGULATION OF METABOLIC GENES UNDER NUTRIENT RICH CONDITIONS
4. 1 Ume6p in regulation of URS1 controlled genes .............................. 150
4. 2 Rpd3p-Sin3p histone deacetylase in regulation of URS1-controlled
genes under nutrient-rich conditions ...................................................... 152
4. 3 Role of ISW2-ITC1 chromatin remodelling complex in regualtion of
URS1-controlled genes .......................................................................... 156
4. 4 Discussion ....................................................................................... 160

viii
Chapter 5 PSEUDOHYPHAL GROWTH ON NON-FEREMENTABLE CARBON SOURCES
5. 1 Pseudohyphal growth on non-fermentable carbon sources…. ........ 163
5. 2 Role of mitochondrial retrograde signalling pathway in regulation of
pseudohyphal growth………….. ............................................................. 167
5. 3 Discussion ...................................................................................... 170
Chapter 6 CONCLUSIONS AND FUTURE WORK
6.1 Conclusions and future work .......................................................... 172
REFERENCES ......................................................................................... 175
APPENDIX I .............................................................................................. 212

ix
LIST OF FIGURES
Figure 1.1 Nutritional signalling pathways in S cerevisiae. ............................ 4
Figure 1.2 Yeast growth, development and regulation of IME1 promoter ... 10
Figure 1.3 Interplay of transcriptional regulators, histone-modifying enzymes
and chromatin remodelling complexes in regulation of early meiotic genes 17
Figure 1.4 MAPK and PKA signalling cascade in pseudohyphal growth ..... 31
Figure 1.5 HAC1 mRNA splicing in S. cerevisiae ........................................ 34
Figure 1.6 Unfolded protein response pathway in yeast and mammalian cells
..................................................................................................................... 43
Figure 1.7 UPR as a nutrient sensor regulating differentiation events in yeast
..................................................................................................................... 47
Figure 3.1 CYC1-lacZ reporter constructs used to study transcriptional
activity ........................................................................................................ 119
Figure 3.2 Steady state levels of β-galactosidase encoded by CYC1-lacZ
containing zero, one and two URS1 sites expressed in vegetative growth
medium……………………………………………………………………………120
Figure 3.3 Inducible expression of Hac1ip does not repress β-galactosidase
driven by URS1 encoded by URS1-CYC1-lacZ reporters .......................... 123
Figure 3.4 Cloning strategy for URS1-CYC1-Ub-X-lacZ reporter plasmids 127
Figure 3.5 Cloning strategy for URS1-CYC1-Ub-X-lacZ reporter plasmids
using gap repair in yeast ............................................................................ 128
x
Figure 3.6 Confirmation of URS1-CYC1-Ub-X-lacZ reporter plasmids by
restriction digestion analysis and sequencing ..................................... 131-139
Figure 3.7 Decreased steady state levels of β-galactosidase expressed by
URS1-CYC1-Ub-X-lacZ reporters and repression by URS1 in vegetative
growth conditions ....................................................................................... 142
Figure 3.8 Expression of URS1-CYC1-Ub-X-lacZ reporters in the presence
of Hac1ip .................................................................................................... 146
Figure 3.9 Repression is relieved in the absence of Hac1ip ...................... 148
Figure 4.1 Ume6p in the regulation of URS1-controlled genes ................. 151
Figure 4.2 Role of Rpd3p in regulation of URS1 ....................................... 154
Figure 4.3 Role of Sin3p in regulation of URS1-CYC1-Ub-X-lacZ reporters
................................................................................................................... 155
Figure 4.4 Role of Isw2p in regulation of URS1 mediated repression ....... 158
Figure 4.5 Itc1p is involved in regulation of URS1 mediated repression ... 159
Figure 5.1 Non-fermentable carbon sources induce pseudohyphal growth
and respiratory function is not required for induction of pseudohyphal growth.
................................................................................................................... 166
Figure 5.2 Role of RTG signalling pathway in induction of pseudohyphal
growth on non-fermentable carbon source ................................................ 169

xi
LIST OF TABLES
Table 1.1 Destabilisation of β-galactosidase proteins by N-end rule in S.
cerevisiae ..................................................................................................... 39
Table 2.1 List of Chemicals ......................................................................... 56
Table 2.2 Media reagents ............................................................................ 59
Table 2.3 List of Reagents/Enzymes/Antibiotics ......................................... 60
Table 2.4 List of Commercial kits ................................................................. 61
Table 2.5 List of amino acids and media supplements ................................ 62
Table 2.6 List of primers and oligonucleotides............................................. 64
Table 2.7 List of plasmids ............................................................................ 65
Table 2.8 List of strains ............................................................................... 67
Table 2.9 Stock solutions ............................................................................ 71
Table 2.10 Liquid media for Escherichia coli ............................................... 75
Table 2.11 Solidified media for Escherichia coli .......................................... 76
Table 2.12 Liquid media for Saccharomyces cerevisiae .............................. 78
Table 2.13 Solidified media for Saccharomyces cerevisiae ......................... 82
Table 3.1 List of cloning strategies for the construction of destabilized URS1-
CYC1-Ub-X-lacZ reporters ......................................................................... 129
Table 4.1 Microarray data showing expression of HAP genes in UME6 and
ume6Δ strains of SK1 genetic background ................................................ 161
Table 5.1 Microarray data showing transcript profile in terms of raw intensity
expressed from Σ1278b and SK1 genetic backgrounds ............................ 171

xii
LIST OF ABBREVIATIONS A600nm Absorbance measured at 600nm wavelength ATP Adenosine 5’-triphosphate BSA bovine serum albumin CHCl3 Chloroform CIAP Calf intestine alkaline phosphatase C-SPO medium Complete sporulation medium DAG Diacylglycerol DNA deoxyribonucleic acid dNTP deoxynucleoside triphosphate DOC Deoxycorticosterone EDTA Ethylenediamine tetraacetic acid ER Endoplasmic reticulum EtOH Ethanol GRE Glucocorticoid response elements H2O Hydrogen dioxide or water IPTG isopropyl-β-D-thiogalactopyranoside Kb Kilobases kDa kilo Dalton (unit in mass) KOAc Potassium acetate LB Lennox broth or lysogeny broth LiOAc Lithium acetate M Molar mM millimolar mg milligrams MgCl2 Magnesium chloride min minutes ml millilitre NAD+ nicotinamide adenine dinucleotide Na2CO3 Sodium carbonate ng nanogram Ø diameter ºC degree celsius PCR Polymerase chain reaction PEG4000 Polyethylene glycol 4000 PSP2 Presporulation medium RAS2 GTP binding protein RLB Reporter lysis buffer RNA Ribonucleic acid RNase A Ribonuclease A RPI Roche protease inhibitor rpm revolutions per minute RT Room temperature s Seconds SD Synthetic dextrose meduium SDS Sodium dodecyl sulfate SLA synthetic low ammonium TE Tris ethylene diaminetetratetraacetic acid

xiii
Tris tris(hydroxymethyl)aminomethane Tris·HOAc tris acetic acid Tris-HCl tris hydrochloric acid Tween 20 Polysorbate 20 U Units Ub Ubiquitin X-gal 5-bromo4-chloro-3-indolyl-β-D-galactopyranoside YPAc Yeast extract peptone Acetate medium µgm microgram µM micromolar µm micrometer or micron or 1x10⁻⁶ of a meter YNB Yeast nitrogen base YPAc Yeast extract peptone acetate medium YPD Yeast extract peptone dextrose medium β-gal β-galactosidase Δ Deletion λ wavelength μl microlitre Genes and pathways CYC1 Cytochrome c, isoform 1 GPCR G protein coupled receptor HAC1 Homologue of ATF/CREB1 HOG High osmolarity gylcerol IME1 Initiator of meiosis 1 IRE1 Inositol requiring enzyme 1 ISW2 Imitation switch protein 2 ITC1 Isw2 complex subunit MAPK Mitogen activated protein kinase PKA Protein kinase A RPD3 Histone deacetylase of RPD3-SIN3 complex SIN3 Switch InUAS Upstream activating sequence
dependent 3, transcriptional regulator
UPR Unfolded protein response UPRE Unfolded protein response element URS1 Upstream repressing site 1

Chapter 1
Introduction

1
INTRODUCTION
Organisms respond to a number of stimuli in their environment ranging from
temperature, osmolarity, pH, nutrition, etc. The budding yeast Saccharomyces
cerevisiae also responds to its nutritional environment in different ways to a number
of different nutritional cues. Limitation of one or more key nutrients can trigger a
variety of developmental responses. S. cerevisiae diploids undergo meiosis in
response to nutrient starvation and form spores which stay dormant until they
germinate in favourable conditions. Alternatively the diploid cells can form
pseudohyphae, which are synchronously growing elongated cells branching out from
an edge of the colony to forage for nutrients. Similar responses in haploids are
termed as filamentation, which is marked by invasive growth that is capable of
invading the underlying medium and increased cell-cell adhesion. Haploid or diploid
cells can stop mass accumulation, arrest cell cycle progression and enter G0 state.
These differentiation events require a lot of metabolic, transcriptional and
morphological, reprogramming. The role of nutrient sensing and signalling is to sense
the nutritional state of the cell and its environment and initiate signalling that would
allow accumulation of cell mass. Nutrient signalling pathways also optimize the
nutrient conversion to cell mass and indirectly regulate cell proliferation and
developmental pathways. These processes are performed by various signalling
cascades initiated in response to specific nutritional niches and cross talk between
these pathways executes the cell’s response. There has been considerable advance
in understanding of the components of different signalling pathways but we do not, as
of yet, understand completely the molecular mechanisms behind how cells sense
nutrients and respond into signals to decide its cell fate.
1.1 Nutrient signalling pathways in S. cerevisiae:
Diploid S. cerevisiae cells respond to nutrients in their environment by altering their
metabolic and transcriptional state to optimise the use of available nutrients and to
decide which of the several developmental pathways to pursue. There are number of
signalling pathways that respond to availability and type of carbon source, nitrogen
source, amino acids and other nutritional cues and mediate cell’s response (Figure 1.1). The first step towards signalling is sensing of cell’s extracellular nutritional

2
environment and intracellular concentration of nutrients. Carbon source, nitrogen
source and amino acid as nutrients have been discussed here.
1.1.1 Carbon source
S. cerevisiae can grow readily on fermentable carbon sources by fermentation and
utilise non-fermentable carbon sources by respiration. Glucose is preferred over
other fermentable carbon source sources and more so over non-fermentable carbon
sources. This repression of utilization of other carbon sources including the non-
fermentable carbon sources is called glucose repression (Gancedo, 1998). Glucose
sensing occurs through the G-protein coupled receptor (GPCR) Gpr1p, which
interacts with the G protein α-subunit Gpa2p and transmits the signal [Figure 1.1 and
(Kraakman et al., 1999; Xue et al., 1998; Yun et al., 1997; Yun et al., 1998)]. Besides
GPCRs, S. cerevisiae also express a family of hexose transporters that are involved
in sugar sensing or transport. RGT2 and SNF3 are members of this family, which
encode transmembrane proteins that act as low affinity and high affinity sensors of
glucose and initiate signalling of a pathway that controls the expression of hexose
transporter genes (Özcan et al., 1996). However, direct binding of glucose has not
been shown for both the proteins. Hexose kinases Hxk1p, Hxk2p and Glk1p are
intracellular proteins that bind to glucose and phosphorylate it at C6 (Bianconi, 2003;
Clifton et al., 1993; Lobo and Maitra, 1977; Walsh et al., 1983). This is the first step in
metabolism of glucose to form glucose 6-phosphate (Rose et al., 1991). Two
signalling pathways respond to glucose, the first through PKA mediated monomeric
Ras GTPases and a second using a Gα homolog, Gpa2p and a putative G-protein
coupled receptor, Gpr1p (Batlle et al., 2003; Broach and Deschenes, 1990;
Harashima et al., 2006; Rolland et al., 2002). Snf1p kinase is essential for growth on
less preferred fermentable carbon sources such as sucrose, galactose and maltose
or non-fermentable carbon sources like glycerol and ethanol. Besides its requirement
for growth in the absence of glucose, Snf1p is also required in a number of processes
such as meiosis, ageing, glycogen accumulation, inositol growth and pseudohyphal
growth (Ashrafi et al., 2000; Honigberg and Purnapatre, 2003; Kuchin et al., 2002;
Shirra and Arndt, 1999). Snf1p is a member of the AMP-activated protein kinase
family that responds to AMP:ATP ratio. In the absence of glucose, the Snf1p

3
serine/threonine protein kinase activates Cat8p and Sip4p and represses Mig1p
regulating transcriptional changes associated with glucose derepression (Hong et al.,
2003; Lesage et al., 1996; Nath et al., 2003; Rahner et al., 1996; Randez-Gil et al.,
1997). Protein kinase A (PKA), Snf1p, and the Rgt2p-Snf3p glucose sensors play
redundant and overlapping roles in carbon source signalling (Rolland et al., 2002).
1.1.2 Nitrogen source
Yeast cells respond to the availability and type of nitrogen source. Preferred nitrogen
sources are metabolised over less preferred nitrogen sources. These favourable
nitrogen sources enhance growth rate and repress metabolism of less preferred
nitrogen source. Ammonium and glutamine are preferred nitrogen sources and their
addition to cells growing on alternate nitrogen source results in repression of large
collection of genes involved in the nitrogen catabolism. This is also called nitrogen
discrimination pathway (NDP) or nitrogen catabolite repression (NCR) (Hofman-
Bang, 1999). The quality of nitrogen sources and their availability informs metabolic
processes and influences the developmental decisions of the cell. The presence of
high quality nitrogen sources prevents pseudohyphal growth or invasive growth and
the presence of any nitrogen source prevents meiosis and sporulation. Mep1p,
Mep2p and Mep3p are the ammonium transporters in S. cerevisiae that sense
extracellular nitrogen (Figure 1.1). Mep2p, and Mep1p are required for nitrogen
sensing and activation of cAMP-PKA pathway following addition of nitrogen source to
nitrogen starved cells (Van Nuland et al., 2006). Overexpression of Mep2p under
nitrogen replete condition activates transcriptional profile consistent with activation of
MAPK pathway (Lorenz and Heitman, 1998a; Rutherford et al., 2008). The activity of
Mep2p, but not Mep1p or Mep3p is required for induction of pseudohyphal growth
(Lorenz and Heitman, 1997). However the details of Mep2p signalling are not fully
elucidated. Nitrogen starvation induces GPR1 transcription and Gpa2p-Gpr1p has
been implicated in nitrogen sensing as gpa2 and gpr1 strains show a defect in
pseudohyphal differentiation (Kübler et al., 1997; Lorenz and Heitman, 1997; Lorenz
et al., 2000b; Tamaki et al., 2000). But the primary function of Gpr1p is glucose
sensing as Gpr1p binds to glucose with low affinity and Gpr1p may be integrating
glucose and nitrogen signals in the pseudohyphal pathway.

Gat1
Hxt1p
Carbon source
Glucose-6- phosphate
Glycolysis
Sch9
Gap1 Mep2 Gpr1
Gpa2
Rgt2 Snf3
Nitrogen Amino acids
cAMP
PKA
Stress response genes
Fermentative growth
HXT Tap42
Gln3 Stp2 Stp1
MAPK
Pseudohyphal growth
High Low Ssy1
Ssy5
Ptr3 TORC1
Amino acid permease
genes
Rapamycin
Gcn2
Gcn4
Amino acid/ Purine
biosynthesis
eIF2α
NH4+
glutamine
Glu
Amino acids
Uncharged tRNAs
Rim11
Meiosis
Rim101
Rim15
Cdc25
Ribosome biogenesis
Rtg2
TCA cycle genes Glyoxylate cycle genes
Rtg1/3
Glucose
Figure 1.1 Nutritional signalling pathways in S cerevisiae. Nutrients are sensed by S. cerevisiae through different sensors to initiate signalling pathways that may function separately or communicate with each other and may converge evoking a specific response. Carbon and nitrogen sources form major signalling pathways that regulate growth, metabolism, stress response and developmental pathways. Sensing and subsequent response to change in carbon sources are shown here. In presence of glucose plasma membrane sensing proteins Snf3p, Rgt2p, Gpr1p and Hxk2p lead to metabolic changes like glycolysis, induce differentiation pathways like meiosis or
NCR genes
4
Hxk2 Glk1
Hxk1
Glucose repressed genes
Respiration Sporulation
Snf1
Glucose
Alternate/ Non fermentable Carbon source
Cat8, Sip4 Mig1
Protein synthesis
Poor Nitrogen source
Amino acid uptake
Sch9
P

pseudohyphal growth. Snf1p is activated in presence of alternate carbon source or non fermentable carbon sources to induce expression of glucose repressed genes. Nitrogen sources are sensed through ammonium permease Mep2p and possibly through Gpa2p-Gpr1p. The SPS (Ssy1p-Ptr3p-Ssy5p) system senses extracellular amino acid concentration and upregulates amino acid permease gene expression, while the intracellular amino acid is sensed by a mechanism involving uncharged tRNAs and Gcn2p thereby activating GCN pathway. As a result general protein synthesis is repressed by phosphorylated eIF2α with the selective exception of Gcn4p to upregulate amino acid biosynthesis. General amino acid permease Gap1p is stabilised in absence of a high quality nitrogen source to induce uptake of amino acids. Growth on poor nitrogen sources also activates Gln3p and Gat1p to induce nitrogen catabolite repression (NCR) genes. Under nutrient-rich conditions, TORC1 inhibits the function of transcriptional activators that are involved in nitrogen catabolite-repression (Gat1p, Gln3p), retrograde response (Rtg1p, Rtg3p) while activates those involved in ribosome biosynthesis (Sch9p). Black arrows indicate transcriptional upregulation or downregulation. See text for further details.
5

6
1.1.3 Amino acid
The sensing of amino acid availability both for incorporation into protein and as
nitrogen source in biosynthetic reactions occurs through signalling cascades in yeast.
The SPS (Ssy1p-Ptr3p-Ssy5p) signalling system senses external amino acid
concentrations (Forsberg and Ljungdahl, 2001). The Ssy1p sensor protein, which
resembles an amino acid permease, signals to two transcription factors Stp1p and
Stp2p, targeting mainly genes that encode amino acid metabolizing enzymes and
amino acid transporters (Andreasson and Ljungdahl, 2002). Internal amino acids are
sensed by general control of amino acid biosynthesis (GCN). This intracellular
nitrogen sensing mechanism involves association of uncharged tRNA and Gcn2p
kinase leading to its activation. Gcn2p phosphorylates eIF2α in response to amino
acid starvation and other stimuli, reducing global protein synthesis (Cherkasova and
Hinnebusch, 2003; Dever, 2002; Hinnebusch, 2005; Hinnebusch and Natarajan,
2002). However, GCN4 mRNA is upregulated by Gcn2p through upstream open
reading frames (Mueller and Hinnebusch, 1986) and Gcn4p upregulates genes for
biosynthesis of amino acids, the nitrogen source in the medium. The presence of
preferable nitrogen source or high concentration of amino acids represses general
amino acid permease Gap1p (Magasanik and Kaiser, 2002). Upon nitrogen limitation
Gap1p expression is induced by two GATA transcription factors Gln3p and Gat1p
(Stanbrough and Magasanik, 1996; Stanbrough et al., 1995). Gap1p is also
implicated in activation of the PKA pathway that involves the protein Sch9p kinase
on addition of amino acids to nitrogen starved cells (Donaton et al., 2003; Thevelein
et al., 2005). Gln3p is a master regulator under alternative nitrogen sources along
with Gat1p acting as transcriptional activators while Dal80p and Gzf3p acting as
transcriptional repressors of NCR sensitive genes (Coffman et al., 1996; Cooper,
2002; Magasanik and Kaiser, 2002; Scherens et al., 2006). Limiting glutamine and
TOR inhibitor rapamycin also activate Gln3p (Beck and Hall, 1999; Crespo et al.,
2002). Glutamate and α-ketoglutarate are very important for nitrogen assimilation and
therefore the pathways regulating the levels of glutamate are closely related to
nitrogen regulation. The Retrograde (RTG) signalling pathway is one such pathway
that regulates the genes of TCA cycle maintaining glutamate homeostasis in the cell.
It is activated in response to mitochondrial defects or inactivation of key tricarboxylic
acid (TCA) cycle enzymes (Butow and Avadhani, 2004; Liu and Butow, 1999) This
7
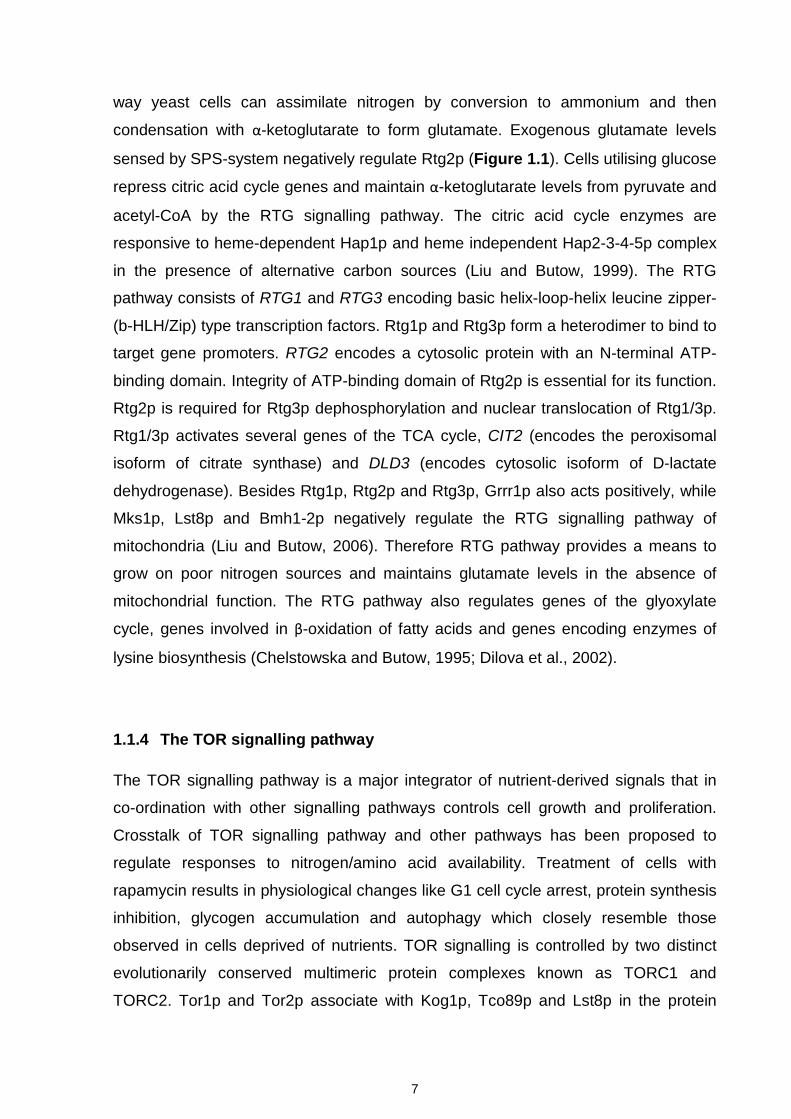
way yeast cells can assimilate nitrogen by conversion to ammonium and then
condensation with α-ketoglutarate to form glutamate. Exogenous glutamate levels
sensed by SPS-system negatively regulate Rtg2p (Figure 1.1). Cells utilising glucose
repress citric acid cycle genes and maintain α-ketoglutarate levels from pyruvate and
acetyl-CoA by the RTG signalling pathway. The citric acid cycle enzymes are
responsive to heme-dependent Hap1p and heme independent Hap2-3-4-5p complex
in the presence of alternative carbon sources (Liu and Butow, 1999). The RTG
pathway consists of RTG1 and RTG3 encoding basic helix-loop-helix leucine zipper-
(b-HLH/Zip) type transcription factors. Rtg1p and Rtg3p form a heterodimer to bind to
target gene promoters. RTG2 encodes a cytosolic protein with an N-terminal ATP-
binding domain. Integrity of ATP-binding domain of Rtg2p is essential for its function.
Rtg2p is required for Rtg3p dephosphorylation and nuclear translocation of Rtg1/3p.
Rtg1/3p activates several genes of the TCA cycle, CIT2 (encodes the peroxisomal
isoform of citrate synthase) and DLD3 (encodes cytosolic isoform of D-lactate
dehydrogenase). Besides Rtg1p, Rtg2p and Rtg3p, Grrr1p also acts positively, while
Mks1p, Lst8p and Bmh1-2p negatively regulate the RTG signalling pathway of
mitochondria (Liu and Butow, 2006). Therefore RTG pathway provides a means to
grow on poor nitrogen sources and maintains glutamate levels in the absence of
mitochondrial function. The RTG pathway also regulates genes of the glyoxylate
cycle, genes involved in β-oxidation of fatty acids and genes encoding enzymes of
lysine biosynthesis (Chelstowska and Butow, 1995; Dilova et al., 2002).
1.1.4 The TOR signalling pathway
The TOR signalling pathway is a major integrator of nutrient-derived signals that in
co-ordination with other signalling pathways controls cell growth and proliferation.
Crosstalk of TOR signalling pathway and other pathways has been proposed to
regulate responses to nitrogen/amino acid availability. Treatment of cells with
rapamycin results in physiological changes like G1 cell cycle arrest, protein synthesis
inhibition, glycogen accumulation and autophagy which closely resemble those
observed in cells deprived of nutrients. TOR signalling is controlled by two distinct
evolutionarily conserved multimeric protein complexes known as TORC1 and
TORC2. Tor1p and Tor2p associate with Kog1p, Tco89p and Lst8p in the protein

8
complex TORC1. In TORC2, Tor2p associates with Lst8p, Avo1p, Avo2p, Avo3p,
Bit61p and Bit2p as a separate complex (Chen and Kaiser, 2003; Loewith et al.,
2002; Reinke et al., 2004; Wedaman et al., 2003). TORC1 is rapamycin sensitive and
is involved in nutrient signalling, while TORC2 is rapamycin insensitive and is
involved in spatial control of cell growth, but a clear distinction of separate functions
is not possible as the TORC1 component Kog1p also regulates actin polarization
(Aronova et al., 2007; Loewith et al., 2002; Wang and Jiang, 2003). Tap42p is a
direct target of TORC1 phosphorylation and regulates repression of stress regulated
genes, nitrogen catabolite repression and retrograde signalling as well as crosstalk
between TORC1 and general amino acid control (GAAC) response [Figure 1.1 and
(Cherkasova and Hinnebusch, 2003; Duvel et al., 2003; Rohde et al., 2004)]. During
growth in preferred nitrogen sources, Gln3p is cytosolic but translocates to the
nucleus by Sit4p-dependent phosphorylation when cells are shifted to poor nitrogen
sources or upon rapamycin treatment and activates transcription of genes required
for utilisation of less preferable nitrogen sources (Beck and Hall, 1999; Cardenas et
al., 1999). Sit4p and Tap42p act in concert to dephosphorylate downstream targets in
response to rapamycin, thus making Tap42p a positive regulator of phosphatase
activity. Tap42p also acts in a similar fashion in rapamycin activation of RTG target
genes (Duvel et al., 2003). The TORC1 protein kinase phosphorylates Sch9p and
phosphorylation is required for activation of Sch9p (Urban et al., 2007). Sch9p plays
a significant role in connecting TOR-dependent nutrient sensing to ribosome
biogenesis and a major role in coupling the cell size to cell division (Figure 1.1).
Sch9p is a protein kinase that induces ribosome biogenesis and represses genes
involved in carboxylic acid metabolism when overexpressed and regulates a similar
set of functions as Ras-PKA (Jorgensen et al., 2004; Zaman et al., 2009). Sch9p is
rapidly dephosphorylated in response to rapamycin, carbon or nitrogen starvation,
while Sch9p restores phosphorylation when shifted from ammonium to urea and
addition of missing nutrient rapidly (Urban et al., 2007). Diminished Sch9p activity or
deletion of GPR1 induces genes required for sterol and cell wall biosynthesis. It has
also been suggested that Sch9p mitigates the signalling activity of Gpa2p (Zaman et
al., 2009). These results hint a possible crosstalk between TOR pathway and Gpa2p-
PKA pathway through Sch9p. The Tor pathway often works in parallel with the
cAMP-PKA pathway to control common targets and also intersects with other
signalling networks, such as the GAAC response (Chen and Fink, 2006; Hinnebusch,

9
2005; Marion et al., 2004; Roosen et al., 2005; Urban et al., 2007; Zurita-Martinez
and Cardenas, 2005). Several newly identified Tor substrates, Sch9p, Ypk1p and
Slm1p, Slm2p, further link TOR function to amino acid signalling, actin organization,
control of cell integrity and stress responses (Audhya et al., 2004; Bultynck et al.,
2006; Daquinag et al., 2007; Fadri et al., 2005; Kamada et al., 2005; Mulet et al.,
2006; Urban et al., 2007).
1.2 Differentiation responses in Saccharomyces cerevisiae:
Differentiation responses in S. cerevisiae are heavily regulated by the extracellular
and intracellular nutrient environment. S. cerevisiae produce mitotic daughters when
the nutrients are plentiful. However when the nutrients are scarce normal cell growth
and mitosis ceases. The nitrogen starvation can induce two different responses in a/α
diploid S. cerevisiae. In the presence of fermentable carbon sources yeast form can
undergo morphological change to form pseudohyphae (Gimeno et al., 1992), while
non-fermentable carbon source induces the a/α diploid cell to undergo meiosis and
form an ascus (Herskowitz, 1988), which can again germinate when the nutrients are
plentiful (Herman and Rine, 1997). Meiosis or sporulation plays an important role in
the sexual life cycle of budding yeast S. cerevisiae and it is critical in generating
genetic diversity while conserving the functional genome (Marston and Amon, 2004)
and surviving nutrient starvation (Kupiec et al., 1997). Pseudohyphal growth allows
immobile cells to forage for nutrients and escape nitrogen limiting conditions. When
cells in pseudohyphal growth form face severe starvation, the cells can undergo
sporulation. The a and α haploid cells on depletion of nutrients enter into a no-
metabolic and quiescent stage with G1 arrest in the mitotic cycle. When carbon
source is limiting, haploid cells can form filamentous growth known as haploid-
invasive growth, which is characterised by elongated cell morphology, altered
budding pattern and invasion of agar. Thus the differentiation responses are
regulated depending on cell type and nutritional availability at each stage of yeast life
cycle, except for mating (Figure 1.2A).

Acetate Glucose
IME1
Vegetative growth
Vegetative growth
Go Cell cycle arrest (N or C starvation)
Go Cell cycle arrest (N or C starvation)
Meiosis/Sporulation (N and C starvation)
Filamentous growth (Haploid invasive growth)
[Rich media]
Pseudohyphal growth [N starvation]
B
A
Figure 1.2 Yeast growth, development and regulation of IME1 promoter. A - Once every cycle, haploid and diploid cells must choose to enter into one of the four developmental pathways. All of the developmental outcomes, with the exception of mating pathway are regulated by nutrition and cell type. B - The cell type and nutritional signals mediate the transcriptional regulation of IME1.
Conjugation (Pheromone dependent)
HAPLOID DIPLOID
UCS4 UCS3
Mat a / Mat α
Rme1p
UASru URSu IREu UASv URSd UASrm IREd
Nutritional control Cell type control
UCS1
UCS2
Nitrogen
10

11
1.2.1 Meiosis
Meiosis is the cellular program that transforms diploid a/α cell into four haploid
progenies (a or α) in an ascus. The process of meiosis requires a transcriptional
program of approximately 1000 genes and can be divided roughly in three stages:
early, middle and late stage depending on temporal expression of genes required for
meiosis (Chu et al., 1998; Primig et al., 2000). Firstly, the key meiotic regulatory
genes are expressed as cells exit the G1 phase of mitotic growth and enter the
meiotic program. Secondly, on activation of early meiotic genes the cells undergo
DNA replication, meiotic recombination and lastly, two sequential rounds of
chromosome segregation to form four haploid products. During meiotic prophase,
pair of homologous chromosomes become physically associated along the length by
a large protein structure referred to as synaptonemal complexes (Page and Hawley,
2004). The process of meiosis and spore formation combined is called sporulation.
The entry into meiosis is regulated by the IME1 gene (Initiator of Me
iosis 1) in
response to nutritional and cell type controls. The master regulator of meiosis Ime1p
is induced in MATa/MATα cells under nitrogen starvation in the presence of a non-
fermentable carbon source starting a transcriptional programme to ensue meiosis
(Sagee et al., 1998). The positive and negative regulatory sequences in the IME1
promoter control IME1 transcription in response to nutritional cues and cell type
control. Presence of even low levels of glucose represses sporulation while non-
fermentable carbon source like acetate induce sporulation in nitrogen starved
diploids (Kassir et al., 2003).
1.2.1.1 Nutritional regulation of meiotic induction
Meiotic induction of S. cerevisiae depends on nutritional control and cell type control.
For cells to enter the meiotic program they need two specific nutritional cues. One,
the environment must lack one essential growth nutrient, mainly nitrogen limitation,
which causes G1 arrest in the mitotic cycle. Second, is the absence of glucose, as
this can inhibit meiotic initiation and promote differentiation into pseudohyphal
growth. The cell type control means that only diploid yeast undergoes meiosis while
haploids are prevented from undergoing meiosis. Upon nitrogen and glucose
12
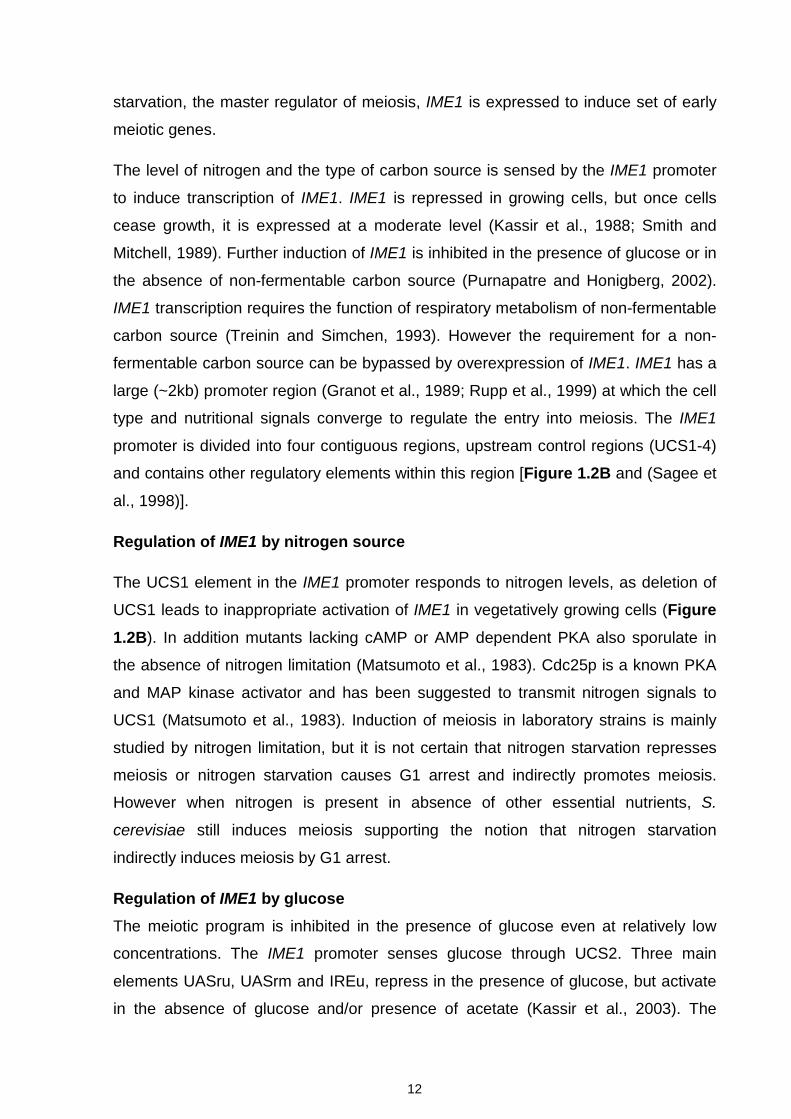
starvation, the master regulator of meiosis, IME1 is expressed to induce set of early
meiotic genes.
The level of nitrogen and the type of carbon source is sensed by the IME1 promoter
to induce transcription of IME1. IME1 is repressed in growing cells, but once cells
cease growth, it is expressed at a moderate level (Kassir et al., 1988; Smith and
Mitchell, 1989). Further induction of IME1 is inhibited in the presence of glucose or in
the absence of non-fermentable carbon source (Purnapatre and Honigberg, 2002).
IME1 transcription requires the function of respiratory metabolism of non-fermentable
carbon source (Treinin and Simchen, 1993). However the requirement for a non-
fermentable carbon source can be bypassed by overexpression of IME1. IME1 has a
large (~2kb) promoter region (Granot et al., 1989; Rupp et al., 1999) at which the cell
type and nutritional signals converge to regulate the entry into meiosis. The IME1
promoter is divided into four contiguous regions, upstream control regions (UCS1-4)
and contains other regulatory elements within this region [Figure 1.2B and (Sagee et
al., 1998)].
Regulation of IME1 by nitrogen source
The UCS1 element in the IME1 promoter responds to nitrogen levels, as deletion of
UCS1 leads to inappropriate activation of IME1 in vegetatively growing cells (Figure
1.2B). In addition mutants lacking cAMP or AMP dependent PKA also sporulate in
the absence of nitrogen limitation (Matsumoto et al., 1983). Cdc25p is a known PKA
and MAP kinase activator and has been suggested to transmit nitrogen signals to
UCS1 (Matsumoto et al., 1983). Induction of meiosis in laboratory strains is mainly
studied by nitrogen limitation, but it is not certain that nitrogen starvation represses
meiosis or nitrogen starvation causes G1 arrest and indirectly promotes meiosis.
However when nitrogen is present in absence of other essential nutrients, S.
cerevisiae still induces meiosis supporting the notion that nitrogen starvation
indirectly induces meiosis by G1 arrest.
Regulation of IME1 by glucose The meiotic program is inhibited in the presence of glucose even at relatively low
concentrations. The IME1 promoter senses glucose through UCS2. Three main
elements UASru, UASrm and IREu, repress in the presence of glucose, but activate
in the absence of glucose and/or presence of acetate (Kassir et al., 2003). The

13
elements UCS1, UASru, IREu and UASv (UAS activity in vegetative growth) integrate
several signalling pathways to repress IME1 transcription in the presence of glucose
(Figure 1.2B). Thus the block on meiosis by glucose is mediated by a number of
signalling pathways. Snf1p kinase, which is inhibited by glucose under the glucose
repression pathway, is required for expression of IME1 and IME2, an early meiotic
gene. The glucose sensors Rgt2p and Snf3p act upstream of Snf1p and are required
for repression of IME1 in the presence of glucose. Activated PKA inhibits IME1 and
IME2 and promotes growth. Gpa2p also binds directly to Ime2p to inhibit its kinase
activity (Donzeau and Bandlow, 1999). Also transient activation of Ras pathway has
also been suggested to repress meiotic initiation indirectly through activation of PKA
pathway. The Rim15p kinase promotes the association of Ime1p to Ume6p
(transcriptional activator of EMGs) to induce the early meiotic genes. But glucose
represses RIM15 expression and PKA directly inhibits Rim15p by phosphorylation.
IME1 may also be repressed by the PKA pathway through the Msn2p-Msn4p
transcription complex inhibition by phosphorylation (Garreau et al., 2000). Msn2p-
Msn4p activates transcription of many stress responsive genes by binding to stress
responsive element (STRE) present in the promoters of these genes. TPS1
(trehalose phosphate synthethase 1), one such stress responsive gene is required for
induction of IME1 (De Silva-Udawatta and Cannon, 2001). Also a STRE site is
present in the IME1 promoter region. PKA may also regulate the Msn2p-Msn4p
complex by phosphorylating Sok2p, which is thought to bind to Msn2p-Msn4p and
convert it to a transcriptional repressor (Shenhar and Kassir, 2001). The regulation of
IME1 is very important as is evident from the complex IME1 promoter and interplay of
negative and positive regulatory proteins. Thus, there are a number of pathways that
regulate the expression of IME1, but complete mechanism of meiotic initiation is
partially known.
Regulation of IME1 by non-fermentable carbon source In the presence of non-fermentable carbon source IME1 is expressed at low levels,
resulting from the competition of the repressive action of UCS1, URSu, URSd, IREd
and positive action of UASru, IREu, UASrm and UASv (Figure 1.2B). Upon nitrogen
depletion, relief of UCS1 repression promotes the increase of transcription (Kassir et
al., 2003). Meiotic induction has also been shown to be dependent on the alkalization

14
of the media. Metabolism of non-fermentable carbon sources produce CO2, which
creates alkaline conditions in the medium (Ohkuni and Yamashita, 2000). Further
RIM101 is required both for adaptation to extracellular alkalization and for IME1
transcription (Lamb et al., 2001).
Activation of meiosis by G1 arrest and CLN3
In S. cerevisiae the cells require G1 arrest to undergo meiosis (Hirschberg and
Simchen, 1977). Cln3p, a G1 cyclin is present at constant levels during cell cycle and
functions primarily to promote transition from G1 to S phase. When G1 arrest occurs,
Cln3p levels decline rapidly and this decline is required partly for meiotic induction
because Cln3p inhibits IME1 expression and Ime1p localization to nucleus (Colomina
et al., 1999; Gallego et al., 1997; Parviz and Heideman, 1998).
Return to growth
Nitrogen and glucose starvation is not only required to initiate meiosis, but also to
complete the process because addition of rich media can inhibit sporulation even
after meiotic S phase, meiotic recombination, and synapotenemal complex formation
have taken place (Esposito and Esposito, 1974; Friedlander et al., 2006; Honigberg
et al., 1992; Honigberg and Esposito, 1994; Sherman and Roman, 1963; Simchen et
al., 1972; Zenvirth et al., 1997). Moreover such refed cells can exit the sporulation
program and return to mitotic growth as long as the commitment point has not
passed. Commitment occurs after premeiotic DNA replication and recombination, but
before meiosis I and cells cannot return to vegetative growth after this point.
Overproduction of IME1 in stationary phase cultures can induce meiotic
recombination and synaptonemal complex formation, but glucose can stall further
progression into late prophase, suggesting that nutritional signals can control later
steps in the program through an IME1-independent pathway (Lee and Honigberg,
1996).

15
1.2.1.2 Cell type control
Cell type control ensures that IME1 is not induced in haploid cells under any
nutritional condition. RME1 (Repressor of IME1) represses transcription of IME1 in
haploids and inhibits meiosis so haploids cannot undergo meiosis. Rme1p is
expressed at much higher levels in haploids than diploids and represses IME1 by
binding to Rme1p repressor element (RRE1) site in UCS4 of IME1 [Figure 1.2B, (Covitz et al., 1991; Covitz and Mitchell, 1993)]. Rme1p also binds to a similar site in
the promoter of CLN2, which encodes a G1 cyclin, to activate its transcription and
Cln2p inhibits IME1 expression (Purnapatre et al., 2002). Only MATa/MATα cells can
undergo meiosis as a1-α2, the heterodimer produced in diploids binds to an operator
site in the RME1 promoter repressing its transcription (Covitz and Mitchell, 1993;
Herskowitz et al., 1992). In addition to repression of RME1, a1-α2 also promotes
IME1 expression by activation of IME4 (Shah and Clancy, 1992). IME4 is also a
positive regulator of meiosis and is only expressed in a/α diploid cells. Though IME4
is an early meiotic gene it is not under the regulation of Ime1p. IME4 encodes a
putative mRNA N6-adenosine methyltransferase required for entry into meiosis
(Clancy et al., 2002). Expression of IME4 is induced under starvation conditions
(Shah and Clancy, 1992) and IME4 can transcribe sense and antisense mRNA. The
antisense promoter of IME4 is stronger than the sense promoter in haploids and
causes inhibition of sense transcript by antisense transcript thereby inhibiting entry
into meiosis. Conversely in diploids the sense IME4 transcript is produced as the
antisense promoter is inhibited by a1-α2 heterodimer (Hongay et al., 2006). IME4 is
essential for IME1 accumulation and sporulation (Shah and Clancy, 1992). An rme1
mutation does not alter the regulation of IME4 expression by a1-α2 but the rme1
mutation can suppress an ime4 insertion mutation to permit expression of IME1.
Moreover a1-α2 represses RME1 expression directly. These data suggest that RME1
and IME4 may act in parallel pathways to activate IME1 (Covitz et al., 1991; Shah
and Clancy, 1992).

16
1.2.1.3 Regulation of early meiotic genes
IME1 encodes a transcriptional activator, which once induced is required for
transcription of early meiotic genes (EMGs) (Kassir et al., 2003; Mandel et al., 1994;
Smith et al., 1993). An IME1 null mutation leads to loss of expression of all meiotic
genes except IME4 (Kassir et al., 2003; Kupiec et al., 1997). Ime1p associates with
Ume6p, a transcriptional repressor of early meiotic genes under vegetative growth
and a transcriptional activator under meiosis inducing conditions. Ume6p interaction
with Ime1p leads to expression of early meiotic genes like IME2, SPO13 and HOP1
(Malathi et al., 1997; Rubin-Bejerano et al., 1996). Rim11p, GSK3 family protein
kinase activated in response to starvation by nitrogen limitation (Xiao and Mitchell,
2000) phosphorylates Ime1p to stabilise Ime1p-Ume6p association (Malathi et al.,
1997; Malathi et al., 1999).This association can be destabilised by presence of
glucose through repressing expression of Rim15p (Vidan and Mitchell, 1997). Ume6p
is a C6-zinc cluster DNA binding protein that binds to 9-bp upstream repressing site 1
(URS1) present in promoters of early meiotic and non-meiotic genes (Anderson et al.,
1995; Strich et al., 1994). Deletion of UME6 induces the expression of genes
containing URS1 in vegetative growth conditions (Bowdish and Mitchell, 1993; Strich
et al., 1994). ume6Δ cells arrest during prophase early in meiosis and display delay
in induction of mid and late genes (Steber and Esposito, 1995). These data show that
Ume6p is not only a repressing factor in mitotic growth, but also promotes the meiotic
process induction. It has also been suggested that repression by Ume6 is relieved by
in vivo interaction of Ume6p and Cdc20p, an activator of anaphase promoting
complex/cyclosome (APC/C) ubiquitin ligase. Ume6p degrades partially after
ubiquitination and Ime1p association is required for complete destruction and entry
into meiosis by induction of EMGs (Mallory et al., 2007). Under mitotic growth
conditions Ume6p is not degraded as Cdc20p is inactive due to its phosphorylation
by PKA. Early meiotic genes are transcribed following histone acetylation by Gcn5p
histone acetyl transferase (Figure 1.3A) (Burgess et al., 1999).
Ume6p interacts with Sin3p and recruits the Rpd3p histone deacetylase to bring
about repression under vegetative growth conditions (Kadosh and Struhl, 1997) by
denying access to SAGA histone acetyl transferase complex (Figure 1.3B). Sin3p is
a co-repressor which is recruited by Ume6p to the promoters of early meiotic genes
and Rpd3p functions as a histone deacetylase (Kadosh and Struhl, 1997).

17
Figure 1.3 Interplay of transcriptional regulators, histone-modifying enzymes and chromatin remodelling complexes in regulation of early meiotic genes. A - Under nitrogen starvation, Ime1p associates with Ume6p and Gcn5p acetylates histone to induce early meiotic genes (EMGs). B - In presence of nitrogen Ume6p negatively regulates transcription of EMGs by recruitment of Sin3p-Rpd3p histone deacetylase (HDAC) which lead to histone deacetylation.
Nitrogen abundance
NH4+
Ume6
Rpd3- Sin3
Hac1i
EMG URS1 NUCLEOSOME
B
Isw2- Itc1
Nitrogen limitation
EMG URS1 DBD
Gcn5
NUCLEOSOME
A
Ime1

18
Rpd3p deacetylates histone tails associated with nucleosomes around the promoter
region by removing acetyl group from N-terminal lysine residues of H2A, H2B, H3
and H4 and leads to repression (Kadosh and Struhl, 1998; Rundlett et al., 1998;
Suka et al., 2001). S. cerevisiae forms Rpd3p large and small complexes known as
Rpd3L and Rpd3S (Carrozza et al., 2005). The large complex Rpd3L typically
contains Rpd3p, Ume1p, Sds3p, Sap30p and Pho23p subunits. Rpd3S complex in
addition to Rpd3p, Ume1p and Sin3p, also contains Eaf3p and Rco1p. Both these
complexes perform different functions. Rpd3L localizes primarily to the promoter
regions and represses transcription. Set2p methyltransferase is recruited by RNA
polymerase II to methylate transcribed regions (Joshi and Struhl, 2005). Eaf3p,
subunit of Rpd3S complex has a chromodomain motif to recognise methyl-lysine
modifications and recruits Rpd3S to the transcribed regions to suppress intragenic
transcription initiation (Carrozza et al., 2005; Keogh et al., 2005). The RPD3-SIN3
histone deacetylase (HDAC) complex is involved in regulation of a wide range of
genes in meiosis, metabolism, osmotic stress, telomere boundary regulation,
anaerobic growth (De Nadal et al., 2004; Ehrentraut et al., 2010; Kadosh and Struhl,
1997; Rundlett et al., 1998; Vidal and Gaber, 1991). Ume6p also recruits Isw2p a
protein of the ATP-dependent chromatin remodelling complex Isw2p-Itc1p which is
required for repression on early meiotic genes during mitotic growth of yeast possibly
by maintaining repressed chromatin loci (Goldmark et al., 2000).
ISW2-ITC1 comprises a heterodimer of the Itc1p and Isw2p proteins and is a
representative member of the ISWI subfamily of the SWI2/SNF2 family of chromatin
remodeling proteins (Fitzgerald et al., 2004; Tsukiyama et al., 1999); both Itc1p and
Isw2p are required for the chromatin remodeling activity of the holocomplex (Gelbart
et al., 2001). In addition, two small histone fold containing proteins, Dpb4p and
Dls1p, are present in at least a fraction of Isw2 complexes purified from yeast
(McConnell et al., 2004). Isw2 has been demonstrated to affect in vivo repression of
transcription of several genes (Fazzio et al., 2001; Goldmark et al., 2000; Kent et al.,
2001; Sherriff et al., 2007) and, together with Ino80, to promote replication fork
progression (Vincent et al., 2008). Isw1p functions with the Chd1p chromatin
remodeler at few other genes (Alén et al., 2002; Xella et al., 2006). It has been
suggested that Isw2 accomplishes these activities by modifying the spacing of
sequential mononucleosomes along short, contiguous stretches of chromatin through

19
nucleosome sliding (Kagalwala et al., 2004; Tsukiyama et al., 1999). Interestingly,
Isw2 complex is able to accomplish this sliding of nucleosomes without disrupting the
integrity of the association of the DNA and the octamer (Fazzio and Tsukiyama,
2003; Kassabov et al., 2002). The Isw2 complex interacts efficiently with both naked
DNA and nucleosomal arrays in an ATP-independent manner and both units are
required for nucleosome stimulated ATPase activity and chromatin remodeling
activity (spacing) (Gelbart et al., 2001). Isw2p-Itc1p spaces nucleosomes every 200
bp and the spacing is the function of its association with linker DNA, which is
mediated by Itc1p. Extensive binding of Itc1p with the linker DNA is also suggested to
prevent the nucleosomes from moving too close to each other and hence the length
of linker DNA interaction maintains the spacing of nucleosomes. Isw2p-mediated
repression by creating nuclease inaccessible chromatin structure that includes TATA
box is likely to target the binding of TATA box binding protein (TBP). Isw2p mediated
chromatin remodeling and Sin3p/Rpd3p histone deacetylase may cooperate to inhibit
TBP binding at some target promoters including HOP1 (Shimizu et al., 2003).
Ume6p is phosphorylated by Rim11p and possibly by Mck1p and interacts with
Ime1p and transforms into an activator to induce meiosis (Bowdish et al., 1995;
Mallory et al., 2007; Rubin-Bejerano et al., 1996; Washburn and Esposito, 2001).
IME2 is activated in a two step process where Sin3p-Rpd3p is inactivated and may
be dissociated from Ume6p and then associated with Ime1p leading to transcriptional
activation of IME2 (Bowdish et al., 1995; Rubin-Bejerano et al., 1996). TATA box of
IME2 gene is occupied in the repressed conditions and induction of meiosis recruits
chromatin structure remodelling complex (RSC) to remodel nucleosomes (Inai et al.,
2007). Then association of SAGA complex containing Gcn5p histone acetyl
transferase to IME2 leads to its transcriptional activation (Burgess et al., 1999). Once
the Ume6p mediated repression is relieved on URS1, early meiotic genes including
IME2 are expressed. Ime2p is a meiosis specific serine/threonine protein kinase and
is functionally related to Cdc28p, the cyclin dependent kinase (Chu et al., 1998).
Ime2p contains a TXY motif in its activation loop that is similar to activation loops of
mitogen-activated protein kinases (MAPKs) (Schindler et al., 2003). IME2
transcription which, begins shortly after induction of meiosis rises around the time of
chromosomal divisions. The biphasic expression and accumulation of IME2 requires
Ime1p in the first phase (Mitchell et al., 1990) and Ndt80p in the second phase (Chu

20
et al., 1998). Ime2p firstly regulates EMGs expression through Ime1p and controls
meiotic S phase by functionally replacing some, but not all Cdc28p mitotic S-phase
promoting roles (Benjamin et al., 2003; Guttmann-Raviv et al., 2001; Honigberg,
2004). During early phase of sporulation, Ime2p also phosphorylates replication
protein A. Ime2p represses the transcription of IME1 eventually in the later stages of
meiosis (Guttmann-Raviv et al., 2002; Shefer-Vaida et al., 1995; Smith and Mitchell,
1989). Ime2p also phosphorylates Ime1p and targets it for degradation (Guttmann-
Raviv et al., 2002). Negative feedback regulation of Ime1p ensures its narrow window
of expression in relation to Ime2p for progression of meiotic program.
Meiotic DNA replication follows the expression of IME1 and IME2 (Honigberg and
Purnapatre, 2003). Ime2p phosphorylates Sic1p, an inhibitor of Clb-Cdc28p kinase
and degrades it to initiate meiotic DNA replication (Dirick et al., 1998; Stuart and
Wittenberg, 1998). Ime2p plays a role in the progression of meiosis by positively
regulating Ndt80p through direct phosphorylation and promotes meiotic division
(Benjamin et al., 2003; Foiani et al., 1996; Sia and Mitchell, 1995; Sopko et al., 2002)
Ime2p is an unstable protein kinase and inactivation of Ime2p is needed for the
formation of normal asci (Sari et al., 2008). This is supported by the evidence that
Ime2p negatively regulates Sum1p, a repressor protein that functions against Ndt80p
(Pak and Segall, 2002). The promoter region of NDT80 contains two URS1 sites
besides two middle sporulation elements (MSEs). NDT80 is positively regulated by
Ime1p and Ime2p. Ndt80p, once activated, induces expression of its own and other
genes involved in middle stages of meiosis through MSEs (Chu et al., 1998). Ime2p
also ceases the EMG expression by negatively regulating Ime1p (Guttmann-Raviv et
al., 2001). In late stages of meiosis, Ime2p has been proposed to regulate Cdh1p, a
targeting subunit of the anaphase-promoting complex/cyclosome and may thus
regulate chromosome segregation by modulating the activity of this ubiquitin ligase
(Bolte et al., 2002). Ime2p is degraded shortly after meiosis II is completed (Benjamin
et al., 2003). Ubiquitin-mediated destruction of Ime2p occurs in a Grr1p-dependent
manner when glucose, which inhibits meiosis, is added to sporulating cells
(Purnapatre et al., 2005). In addition, it has been proposed that glucose can inhibit
the Ime2p activity through the Gpa2p heterotrimeric GTP-binding protein (Donzeau
and Bandlow, 1999). Ime2p is phosphorylated at Thr and Tyr residues in a Cak1p-
dependent fashion (Schindler et al., 2003) and Ime2p autophosphorylates its

21
activation loop (Schindler and Winter, 2006). Later Ime2p is hyperphoshorylated and
accumulated in meiotic M phase and is subsequently degraded. RIM4 is required for
IME1 and IME2 dependent transcriptional activation pathways and acts upstream of
IME2 (Soushko and Mitchell, 2000). RIM4, a gene which encodes a putative RNA
binding protein is required for high level expression of EMGs, meiotic division and
recombination (Deng and Saunders, 2001).

22
1.2.2 Pseudohyphal growth
S. cerevisiae diploid cells can undergo a dimorphic switch under nitrogen limitation in
presence of a fermentable carbon source like glucose. Pseudohyphal growth is
characterized by features like elongated cell shape, unipolar budding, symmetric cell
division, adhesion of cells to each other after the cell division is completed and
invasion of solid growth media (Gimeno et al., 1992; Kron et al., 1994). There is
symmetric cell division in pseudohyphal growth as opposed to asymmetric cell
division in budding (Kron and Gow, 1995). The presence of fusel alcohols, which are
end products of catabolism of less preferred amino acids also induce pseudohyphal
growth (Chen and Fink, 2006; Dickinson, 1996). The ability to form pseudohyphae in
response to nutrient starvation is advantageous to yeast as this facilitates foraging for
scarce nutrients. Also formation of pseudohyphae under stress may allow the cells to
deal with stress by choosing alternative developmental program (Zaragoza and
Gancedo, 2000). The haploids form filamentous growth when carbon source is
limiting and is referred as haploid invasive growth. Haploid cells invade agar medium
and show altered budding pattern, though invasive growth is less vigorous and cells
less elongated than diploid pseudohyphal growth (Gancedo, 2001; Gimeno et al.,
1992; Kron and Gow, 1995).
1.2.2.1 Nutrient sensing and pseudohyphal growth:
Glucose sensing occurs through G-protein coupled receptor Gpr1p, which interacts
with G protein α-subunit Gpa2p and transmits the nutritional signal via PKA and
cAMP synthesis (Kraakman et al., 1999; Xue et al., 1998; Yun et al., 1997; Yun et al.,
1998). This association is necessary for pseudohyphal growth (Lorenz et al., 2000b;
Xue et al., 1998). Nitrogen starvation induces GPR1 transcription but the primary
function of Gpr1p is glucose sensing. Gpr1p binds to glucose with low affinity and
may monitor glucose levels necessary for filamentous growth or may integrate
glucose and nitrogen signals in the pseudohyphal pathway. Rgt2p and Snf3p have
also been proposed to bind to glucose and relay glucose signal. Glycolytic pathway
intermediates are also sensed by the cells (Kruckeberg et al., 1998; Ozcan and
Johnston, 1999; Rolland et al., 2001). Glucose phosphorylating enzymes (Glk1p,
Glk2p and Hxk2p) also respond to the presence of glucose and regulate a large

23
number of genes (Johnston, 1999; Rolland et al., 2001). Pseudohyphal growth can
also be triggered by maltose or maltotriose through a signaling pathway independent
of Gpr1p (Van de Velde and Thevelein, 2008).
Pseudohyphal differentiation mainly responds to nitrogen starvation and poor
nitrogen sources like proline (Gimeno et al., 1992; Lorenz and Heitman, 1998b).
Mep1p, Mep2p and Mep3p are the ammonium transporters that are important to the
regulation of pseudohyphal and invasive growth. Mep2p is important as it senses
nitrogen starvation to signal the formation of pseudohyphal growth through cAMP-
PKA pathway and at least activates transcriptional profile consistent with activation of
MAPK pathway (Lorenz and Heitman, 1998a; Rutherford et al., 2008; Van Nuland et
al., 2006). The amino acid transporter Ssy1p of the SPS nutrient sensing system,
which sense extracellular amino acids has been shown to regulate invasive growth
(Forsberg and Ljungdahl, 2001; Klasson et al., 1999). Gap1p is an amino acid
permease, which is tightly regulated depending on the nitrogen source in the
medium. The presence of preferable nitrogen source or high concentration of amino
acids represses Gap1p (Magasanik and Kaiser, 2002). Gap1p transports all common
amino acids, many D-amino acids and nonmetabolizable amino acid analogs. Upon
nitrogen limitation Gap1p expression is induced by two GATA transcription factors
Gln3p and Gat1p (Stanbrough and Magasanik, 1996; Stanbrough et al., 1995).
Gap1p is also implicated in activation of the PKA pathway on addition of amino acids
to nitrogen starved cells (Donaton et al., 2003). Gpa2p-Gpr1p is involved in nitrogen
sensing as gpa2 and gpr1 strains show pseudohyphal growth defect. These growth
defects can be rescued by introduction of constitutive RAS allele or addition of
external cAMP (Kübler et al., 1997; Lorenz and Heitman, 1997; Lorenz and Heitman,
1998a; Lorenz and Heitman, 1998b; Lorenz et al., 2000b; Tamaki et al., 2000).
Internal amino acid is sensed by general control system for amino acid biosynthesis.
Gcn4p is activated in response to depletion of any amino acid and induces a number
of genes involved in amino acid biosynthesis (Jia et al., 2000; Natarajan et al., 2001).
This intracellular nitrogen sensing mechanism involves association of uncharged
tRNA and Gcn2p kinase leading to its activation. Gcn2p phosphorylates eIF2α in
response to amino acid starvation and other stimuli, reducing global protein synthesis
(Dever, 2002; Hinnebusch, 2005). However, GCN4 mRNA is upregulated by Gcn2p
through upstream open reading frame (Mueller and Hinnebusch, 1986) and Gcn4p

24
upregulates genes for biosynthesis of amino acids. tRNA that decodes for glutamine
codon CUG was shown to regulate pseudohyphal growth in response to amino acid
and nitrogen availability (Beeser and Cooper, 2000; Murray et al., 1998). Glutamine
is the main source of nitrogen in yeast cells for biosynthetic reactions and tRNA
seems the likely mechanism to sense intracellular nitrogen.
1.2.2.2 Pathways regulating pseudohyphal growth There are several pathways that function to induce and regulate pseudohyphal
growth response. The formation of pseudohyphal growth requires coordination of at
least two pathways, a mating and filamentation mitogen activated protein kinase
(MAPK) signalling cascade and cAMP dependent protein kinase A (PKA) pathway
and these pathways may act in parallel and partially overlapping manner.
1.2.2.2.1 The MAP Kinase pathway
The mating and filamentation MAP kinase pathway controls the activity of the
heterodimeric transcription factor complex Ste12p-Tec1p (Gavrias 1996, Rupp 1999),
which activates expression of FLO11 and regulates cell elongation and cell adhesion
[Figure 1.4 and (Chen and Thorner, 2010)]. The transcription factor Tec1p is
required for filamentous growth which is stimulated by mitogen activated protein
kinase (MAPK) cascade and together with Ste12p binds to filamentous and invasion
response elements (FREs) to activate target genes (Madhani et al., 1997). The
mating and filamentation MAPK cascade consists of the MAPK kinase Ste11p, the
MAPK kinase Ste7p, the MAPK Kss1p and the scaffold Ste5p, which is regulated by
Msb2p (Cullen et al., 2004; Madhani and Fink, 1998). Msb2p recruits general
signaling proteins, such as Sho1p and isoprenylated, plasma-membrane-tethered
Cdc42p and its p21-activated kinase, Ste20p, to the filamentation MAPK cascade
(Cullen et al., 2004). Cdc42p interacts with Ste20 to displace the negative regulator
Hsl7p (Fujita et al., 1999; Leberer et al., 1997; Peter et al., 1996). Ste20p also
responds to low nitrogen through Sho1p to activate the MAPK cascade (O'Rourke
and Herskowitz, 1998). Ste20p phosphorylates Ste11p and activates its protein
kinase, which in turn phosphorylates Ste7p (Choi et al., 1994; Wu et al., 1995).
Kss1p, is activated when phosphorylated by Ste7p to induce Tec1p-Ste12p. Kss1p in
its unphosphoryated form is associated with Ste12p and the negative regulators
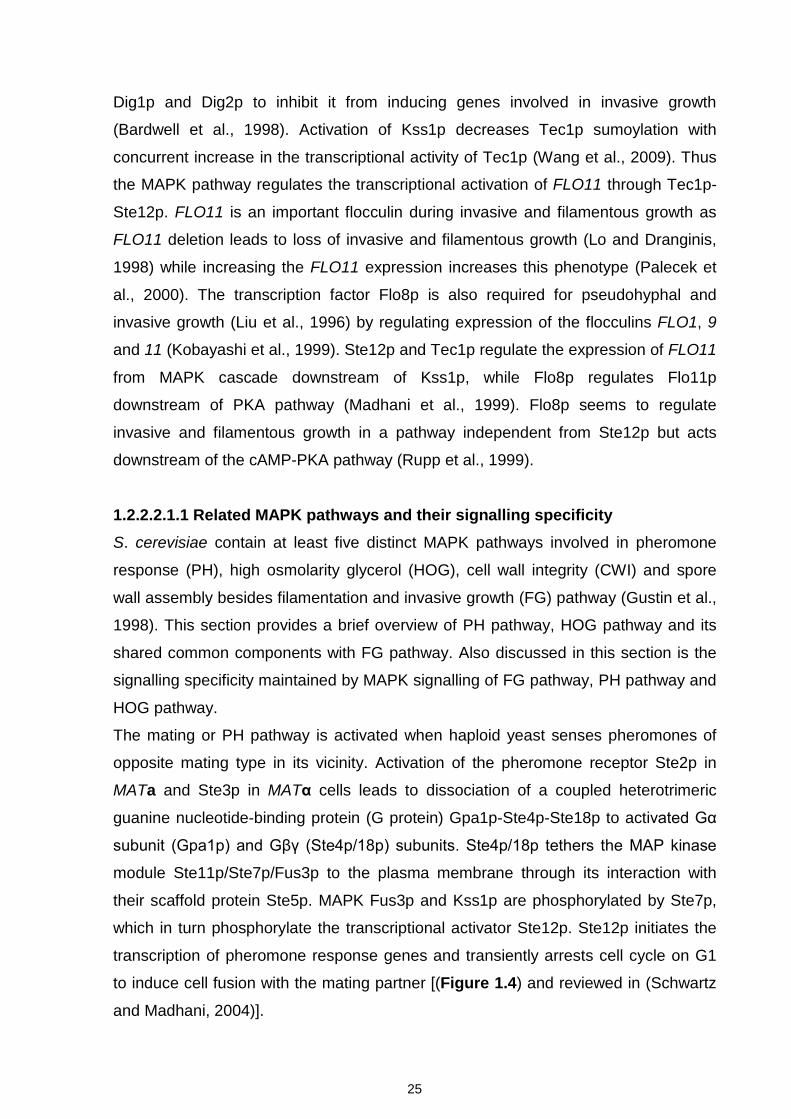
25
Dig1p and Dig2p to inhibit it from inducing genes involved in invasive growth
(Bardwell et al., 1998). Activation of Kss1p decreases Tec1p sumoylation with
concurrent increase in the transcriptional activity of Tec1p (Wang et al., 2009). Thus
the MAPK pathway regulates the transcriptional activation of FLO11 through Tec1p-
Ste12p. FLO11 is an important flocculin during invasive and filamentous growth as
FLO11 deletion leads to loss of invasive and filamentous growth (Lo and Dranginis,
1998) while increasing the FLO11 expression increases this phenotype (Palecek et
al., 2000). The transcription factor Flo8p is also required for pseudohyphal and
invasive growth (Liu et al., 1996) by regulating expression of the flocculins FLO1, 9
and 11 (Kobayashi et al., 1999). Ste12p and Tec1p regulate the expression of FLO11
from MAPK cascade downstream of Kss1p, while Flo8p regulates Flo11p
downstream of PKA pathway (Madhani et al., 1999). Flo8p seems to regulate
invasive and filamentous growth in a pathway independent from Ste12p but acts
downstream of the cAMP-PKA pathway (Rupp et al., 1999).
1.2.2.2.1.1 Related MAPK pathways and their signalling specificity S. cerevisiae contain at least five distinct MAPK pathways involved in pheromone
response (PH), high osmolarity glycerol (HOG), cell wall integrity (CWI) and spore
wall assembly besides filamentation and invasive growth (FG) pathway (Gustin et al.,
1998). This section provides a brief overview of PH pathway, HOG pathway and its
shared common components with FG pathway. Also discussed in this section is the
signalling specificity maintained by MAPK signalling of FG pathway, PH pathway and
HOG pathway.
The mating or PH pathway is activated when haploid yeast senses pheromones of
opposite mating type in its vicinity. Activation of the pheromone receptor Ste2p in
MATa and Ste3p in MATα cells leads to dissociation of a coupled heterotrimeric
guanine nucleotide-binding protein (G protein) Gpa1p-Ste4p-Ste18p to activated Gα
subunit (Gpa1p) and Gβγ (Ste4p/18p) subunits. Ste4p/18p tethers the MAP kinase
module Ste11p/Ste7p/Fus3p to the plasma membrane through its interaction with
their scaffold protein Ste5p. MAPK Fus3p and Kss1p are phosphorylated by Ste7p,
which in turn phosphorylate the transcriptional activator Ste12p. Ste12p initiates the
transcription of pheromone response genes and transiently arrests cell cycle on G1
to induce cell fusion with the mating partner [(Figure 1.4) and reviewed in (Schwartz
and Madhani, 2004)].

26
The HOG MAPK pathway is activated through sensor protein Sho1p and partly
through Sln1p. Under high-salt conditions, interplay between membrane anchor
protein Sho1p and osmosensor membrane proteins Msb2p and Hrk1p tethers the
MAP kinase module Ste11p/Pbs2p/Hog1p to plasma membrane (Figure 1.4) (Maeda
et al., 1995; Tatebayashi et al., 2007; Tatebayashi et al., 2006). Ste11p activates the
Pbs2p MAPKK, which then activates the Hog1p MAPK (Posas and Saito, 1997).
Signalling through Sln1p activates the redundant Ssk2p and Ssk22p MAPKKKs and
ultimately Hog1p but does not involve the common MAPKKK Ste11p. Activated
Hog1p initiates adaptive responses to high osmolarity, including temporary arrest of
the cell-cycle progression, readjustment of the transcription and translation patterns,
and glycerol synthesis [(Figure 1.4) and (Bilsland-Marchesan et al., 2000; Escote et
al., 2004; Hohmann, 2002; O'Rourke and Herskowitz, 2004; Teige et al., 2001)].
The common components of all the three pathways are Cdc42p, p21-activated
kinase Ste20p, adaptor protein Ste50p and Ste11p. Cells employ
compartmentalization, use of scaffold proteins in distinct macromolecular complexes
and cross-inhibition to maintain specificity and avoid inappropriate activation of other
pathways.
1.2.2.2.1.1.1 Crosstalk between FG and PH MAPK modules: FG MAPK pathway
activates Ste11p, Ste7p and Kss1p to promote cell adhesion, cell elongation and
reorganisation of cell polarity, through Kss1p mediated activation of Ste12p-Tec1p
(Figure 1.4). Stimulation of the FG pathway through the Msb2p sensor activates
Kss1p and does not activate Fus3p because Fus3p is sequestered by Ste5p binding
and is only activated when recruited to the plasma membrane. Also nutritional
starvation activates Ste11p and Ste7p by a mechanism that does not involve Ste5p
scaffold. Activated Kss1p ensures that Tec1p is not degraded, and that Ste12p-
Tec1p-dependent FG-specific gene expression is induced. Feedback
phosphorylation of Ste7p by Kss1p specifies an invasive growth response through
selective activation of Kss1p and filamentation-specific gene expression. This is
because mating-specific gene expression is suppressed by the feedback
phosphorylation status of Ste7p (Maleri et al., 2004). The kinase cascade of Ste20p,
Ste11p, and Ste7p, and transcriptional activator Ste12p, also function in pheromone

27
pathway. Thus, the pheromone pathway and the FG pathway share a common
MAPKKK (Ste11p) and MAPKK (Ste7p). However, Ste7p activates Fus3p in
response to pheromones and it has been shown that Fus3p inhibits filamentous
growth through degradation of Tec1p, which is a cofactor for Ste12p in the
expression of filamentation genes. Fus3p phosphorylates threonine 273 in Tec1p,
which leads to ubiquitination and degradation through an SCF ubiquitin protein ligase
(Bao et al., 2004; Chou et al., 2004). Tec1p is not a substrate for Kss1p, so Tec1p
remains stable during filamentous growth (Chou et al., 2004). The scaffold protein
Ste5p insulates the mating pathway from the filamentation pathway, as shown by
analysis of a point mutation in Ste5p that confers increased activation of Kss1p and
reduced Fus3p-dependent degradation of Tec1p (Schwartz and Madhani, 2006).
Ste7p and Fus3p can bind through docking interaction and do not need tethering by
Ste5p scaffold protein for Fus3p activation. However Ste5p is important as it was
shown that minimal scaffold (ms) region in Ste5p selectively promotes Ste7p to
Fus3p signalling (Good et al., 2009). This is further supported by the data that
constitutively active Ste7p mutant poorly activated Fus3p (Maleri et al., 2004).
Pheromones also activate Kss1p (Figure 1.4), but the activation is gradual and
transient as compared to Fus3p (Hao et al., 2008). However Fus3p and Kss1p can
phosphorylate Dig1p/Dig2p, but Fus3p mediated degradation of Tec1p prevents
formation of Tec1p/Ste12p heterodimer for FG-specific gene expression. Instead
Fus3p phosphorylates Ste12p, which homodimerizes and binds to pheromone
response element (PRE) of pheromone response genes (Olson et al., 2000; Yuan
and Fields, 1991).
1.2.2.2.1.1.2 Crosstalk between FG and HOG MAPK modules: The HOG MAPK
module uses Ste11p, Pbs2p and Hog1p while FG MAPK module uses Ste11p, Ste7p
and Kss1p, the common component being the MAPKKK Ste11p. The HOG and the
FG pathways also share components like Sho1p and Msb2p upstream of Ste11p.
(Cullen et al., 2004; Pitoniak et al., 2009; Tatebayashi et al., 2007). In the HOG
pathway, the Msb2p or Hkr1p and Sho1p recruit the Pbs2p MAPKK to the plasma
membrane (Reiser et al., 2000). Ste50p interacts with Sho1p to bring Ste11p into
close proximity with Pbs2p, thereby activating Pbs2p (Tatebayashi et al., 2006).
Finally, Pbs2p activates the Hog1p MAPK, which is tightly bound to Pbs2p by

28
multiple docking interactions (Murakami et al., 2008). Pbs2p cannot phosphorylate
either Fus3p or Kss1p, because their docking sites are incompatible. In FG pathway
Msb2p and Sho1p activate Kss1p through Ste11p without the need for any known
scaffold protein (Good et al., 2009). Osmostress can activate the Kss1p MAPK very
weakly and transiently (Shock et al., 2009; Wang et al., 2009), while glycosylation
defects that activate Kss1p do not activate Hog1p (Yang et al., 2009). In the absence
of Pbs2p or Hog1p, however, osmostress robustly activates Kss1p, and induces FG-
like polarized cell growth (O'Rourke and Herskowitz, 1998). Conversely, activation of
Hog1p, either by osmostress or by overexpression of Pbs2p, inhibits FG responses
(Pitoniak et al., 2009). Using an ATP analog-sensitive Hog1p mutant, it was directly
shown that the cross-talk barrier requires Hog1p kinase activity (Westfall and
Thorner, 2006). But it is yet unclear how Hog1p prevents the cross talk between
these pathways. In the absence of Ste7p or Kss1p/Fus3p, glycosylation defects
activate Hog1p, indicating that the FG pathway also cross-inhibit the HOG pathway
(Yang et al., 2009). Thus, a reciprocal inhibitory loop exists between the HOG and
FG MAPK modules that allow stable activation of only one or the other pathway
under various stress conditions. In wild-type cells both Ste7p and Kss1p are
phosphorylated in response to osmostress, but signalling specificity is maintained
and FG pathway genes are not transcribed under these conditions (Davenport et al.,
1999; O'Rourke and Herskowitz, 2004; Westfall and Thorner, 2006). This signalling
specificity may be achieved through HOG signalling by preventing DNA binding of
Tec1p and thereby interrupting FG pathway signalling (Shock et al., 2009). Another
group reported that specificity may be maintained in response to osmostress when
Hog1p phosphorylates Ste50p and that this phosphorylation of Ste50p limits the
duration of Kss1p activation to prevent FG pathway activation (Hao et al., 2008).
Kss1p inhibits activation of Hog1p MAPK indirectly through the Ptp2 protein
phosphatase (Saito and Tatebayashi, 2004). The mechanistic detail of cross-
pathway inhibition between the HOG and the FG pathways is still unclear. It will be
important to obtain a more detailed understanding of how the HOG and the FG
pathways are activated, respectively, by osmostress and nutritional conditions.
1.2.2.2.1.1.3 Crosstalk between PH and HOG modules: Both modules are
activated by the membrane-bound Ste20p kinase that phosphorylates and activates
Ste11p. The pheromone signalling activates Fus3p through Ste7p which is

29
dependent on Ste5p scaffold protein. Ste7p cannot activate Hog1p, as the docking
sites in Ste7p have no affinity to Hog1p (Remenyi et al., 2005). HOG pathway
activates Hog1p with Sho1p, Pbs2p and Ste5p co-scaffolds. When Ste7p was
covalently attached to Ste11p, only pheromone pathway was activated while fusion
of Pbs2p to Ste11p only activated HOG pathway (Harris et al., 2001). This indicated
that robust protein-protein complexes can specify which MAPK pathway is activated.
Activation of the HOG pathway triggers the activity of phosphatases, which then
feedback to inhibit other MAPK pathways; for example, by dephosphorylating Fus3p
and Kss1p (Davenport et al., 1999; Hall et al., 1996). Such phosphatase activity has,
however, not been demonstrated in wild-type cells. Fus3p activates Fus1p, which
binds and inhibits Sho1p arm of HOG pathway (Nelson et al., 2004). Hog1p also
negatively regulates Fus3p possibly by activating Msg5p phosphatase (Hall et al.,
1996). Thus, these two MAPK modules are securely insulated from each other by
specific scaffolds, docking interactions, cross-pathway inhibition and possibly by
phosphatases.
1.2.2.2.2 The PKA pathway is activated by the D-glucose sensor G-protein coupled
receptor Gpr1p (Lorenz et al., 2000b; Tamaki et al., 2000) and the high affinity
ammonium permease Mep2p [ Figure 1.4 (Boeckstaens et al., 2007; Lorenz and
Heitman, 1998b; Rutherford et al., 2008)]. Protein kinase A (PKA) is activated by
heteromeric G-protein α subunit Gpa2p activated adenylate cyclase (Kübler et al.,
1997; Lorenz and Heitman, 1997). Ras2p, a GTP binding protein plays an important
role in pseudohyphal growth as expression of constitutively active RASVal19
decreased GTPase activity and induced pseudohyphal growth in diploid yeast
(Gimeno et al., 1992). The ras2/ras2 diploid was still able to induce pseudohyphal
growth with round cells in response to nitrogen starvation (Kübler et al., 1997; Mösch
et al., 1999). A downstream target of Ras2p is adenylate cyclase Cyr1p (Thevelein,
1991; Thevelein, 1992). PKA, which is activated consists of three catalytic subunits in
S. cerevisiae, Tpk1p, Tpk2p and Tpk3. Tpk2p directly interacts with Sfl1p and
inhibits, the transcriptional repressor of FLO11 (Robertson and Fink, 1998). Tpk2p
phosphorylates Flo8p to stimulate its binding to the FLO11 promoter and activation of
FLO11 (Pan and Heitman, 1999; Pan and Heitman, 2002). TPK1 and TPK3 deletion
leads to enhanced pseudohyphal growth (Pan and Heitman, 1999; Robertson and
Fink, 1998), suggesting that TPK1 and TPK3 are inhibitors of pseudohyphal growth,

30
but the substrates of TPK1 and TPK3 are yet unidentified. Bcy1p forms a negative
regulatory subunit of PKA, which dissociates on cAMP stimulation. Mutations in
BCY1, that forms a complex with Tpk1-3p, activate PKA and enhance filamentous
growth at both low and high nitrogen concentrations (Pan and Heitman, 1999). Flo8p
and Sfl1p act antagonistically to regulate the expression of FLO11 in response to
cAMP stimulus to induce pseudohyphal growth depending on nutritional signals
(Lorenz et al., 2000b; Rupp et al., 1999). The importance of cAMP-PKA pathway in
pseudohyphal growth comes from the observation, that external stimulus of cAMP
induces pseudohyphal growth while overexpression of phosphodiesterase Pde2p
blocks pseudohyphal growth (Ward et al., 1995).

Ste5
0 Hsl7
Ste12
Ste5
St
e50
Ste
18 γ
Figure 1.4 MAPK and PKA signalling cascade in pseudohyphal growth. This model provides an interpretation of MAPK and PKA pathways involved in pseudohyphal growth (FG) based on the existing data. Both the pathways control expression of FLO11 and large collection of other genes required for pseudohyphal growth. MAPK modules of PH pathway, HOG pathway and FG pathway are also shown. Though these MAPK share common components, they maintain signalling specificity (see text for details). Dotted lines indicate that the relationship is unclear.
Pseudohyphal growth
FG-MAPK pathway
Ras2
Nitrogen starvation and Carbon source signal
Dig2 Dig1
Ste20
Ste7
Msb2 Sho1
P Kss1
ATP cAMP Bcy1
PKA pathway
Sfl1 Flo8
Cyr1
Tpk2
Gpr1 Mep2
Gpa2
31
Ste2/ Ste3
Pheromone pathway
Gpa1 α
Ste5
0
Ste11
Ste7
Fus3
Ste5
St
e4 β
P
P
Tec1 P
Ste11
a/α
Mating
Ste11
Pbs2
Hog1
Cdc42 Ste20
P
P
Pheromones (PH) Osmotic stress (HOG)
HOG pathway
Msb2 Sho1
Pheromone response genes
Kss1 P
Ste12 P
Osmoresponsive genes
Osmoregulation
Hkr1
PRE FLO11
Glycerol synthesis
P Kss1 P
MAPKKK
MAPKK
MAPK
Tec1 Ste12 FRE
P
FLO11
MAPKKKK
Msg5
Hot1
Cdc42 Ste20
Ptp2
Cdc42 Ste20
PKA

32
1.2.2.2.3 Other pathways involved in filamentous differentiation (rpll) Stress-induced signaling also plays an important role in induction of pseudohyphal
growth. In addition to nitrogen and carbon starvation, oxygen limitation may also
affect dimorphic switching in both haploids and diploids (Wright et al., 1993). Hap2-3-
4-5p complex responds to hypoxic conditions and regulates oxygen regulated genes.
FLO11 (also known as MUC1) expression has been shown to increase under hypoxic
conditions (ter Linde et al., 1999), suggesting that pseudohyphal growth may be
induced in absence of oxygen. Nutrient responsive TOR signalling has also been
shown to promote pseudohyphal growth. Sublethal concentration of rapamycin
inhibits pseudohyphal growth in response to nitrogen limitation (Cutler et al., 2001).
Mitochondrial retrograde (RTG) signalling pathway is also required for pseudohyphal
growth through MAPK pathway as deletion of RTG signalling cascade components
showed defect in MAPK activation (Chavel et al., 2010).
Environmental stress like heat stress also induces pseudohyphal growth (Zitomer
and Lowry, 1992). Osmotic stress transduced via the Sho1p receptor may also
enhance pseudohyphal growth (O'Rourke and Herskowitz, 1998). Additionally,
various alcohols also induce pseudohyphal differentiation, like ethanol enhances
pseudohyphal growth in diploid strains and other fusel alcohols including 1- butanol,
isoamyl alcohol and n-amyl alcohol stimulate filamentous growth in haploids growing
in glucose containing liquid medium (Lorenz et al., 2000a). The metabolic
intermediate responsible for generating a filamentous growth signal or the induction
of filamentous growth may suggest that the alcohols serve as signals to switch to
alternate developmental pathway. Skn7p, a transcription factor that mediates
oxidative stress responses downstream of PKA, is required for filament formation in
response to nitrogen starvation (Lorenz et al., 2000b). In addition, the stress-
responsive transcriptional repressor Xbp1p represses CLB2 expression to induce cell
elongation and filament formation in response to nitrogen starvation (Miled et al.,
2001). Ras2p activity also decreases the activity of the stress responsive
transcription factors Msn2p and Msn4p. This suppressed stress response has been
suggested to be responsible for inducing invasive growth (Stanhill et al., 1999).
Mutations in BIR1, a gene homologous to inhibitor of apoptosis (IAP) proteins in
vertebrates, also enhance pseudohyphal growth but block sporulation during carbon
source deprivation (Uren et al., 1999). Not surprisingly, genes linking nutrient

33
regulation to cell growth and division also affect pseudohyphal growth. The
abundance and activity of the G1 cyclin Cln3p has multiple connections to cell-size
control and nutrient sensing during vegetative growth as Cln3p accumulates when
cells have sufficient nutrients to continue growth. Deletion of CLN3 confers enhanced
pseudohyphal growth (Loeb et al., 1999), suggesting that Cln3p abundance may
carry part of the nitrogen starvation signal. Overexpression of WHI2, a gene required
for cell cycle arrest upon carbon source depletion, stimulates filamentous growth
(Radcliffe et al., 1997). However, WHI2 is not required for pseudohyphal growth and
is partially blocked by mutations in the STE MAPK pathway. Deletion of the Whi3p
RNA-binding protein abrogates pseudohyphal growth, leading to small round cells on
nitrogen starvation media (Mösch and Fink, 1997). Mutations in mannose utilization
and protein glycosylation pathways activate MAPK signalling pathways used in
invasive and filamentous growth.
The unfolded protein response pathway transcription factor Hac1ip plays an
interesting role in pseudohyphal differentiation. Ire1p is activated in response to build
up of unfolded proteins in the ER by dissociation of Ire1p from Kar2/BiP and
oligomerization of lumenal domains of Ire1p (Bertolotti et al., 2000; Korennykh et al.,
2009; Shamu and Walter, 1996). This is followed by trans autophosphorylation
activating the endoribonuclease activity of Ire1p (Bertolotti et al., 2000), which splices
constitutively expressed Hac1 mRNA. Ire1p cleaves HAC1 mRNA 5’ and 3’ exon-
intron junctions in an unconventional non spliceosome fashion (Sidrauski and Walter,
1997). The 252 nucleotide intron with splice sites is shown in Figure 1.5 A. The
exons are ligated by tRNA ligase, Rlg1p thus producing spliced HAC1i mRNA
(Sidrauski et al., 1996). Induced HAC1i mRNA is translated into Hac1ip, which is
translocated to the nucleus and induces expression of many chaperone genes,
components of ERAD and phospholipid biosynthesis genes (Schröder and Kaufman,
2005). High nitrogen concentrations stimulated HAC1 mRNA splicing, which ceased
during nitrogen starvation (Figure 1.5 B). Therefore, nitrogen starvation may at least
partially stimulate filamentous growth by slowing protein translation rates, inactivating
the unfolded protein response, and inhibiting HAC1 splicing (Schröder et al., 2000).
Other yeast developmental responses, such as entering the sporulation pathway,
also respond to environmental stresses. In general, sporulation occurs under conditi-

C
G
U
A
U
C
G
C
A
G C
U
C
G
G
C
A
U
A
A
C
U
G
U
G
C
C
G A
C
A
G
U
G
A
C
5’ 3’
252 nt
probe
1
1 2
1 2 5’ 3’
Time (min)
HAC1
pC4/2
A
B
1
Figure 1.5 HAC1 mRNA splicing in S. cerevisiae. A. Secondary structure of HAC1 mRNA 3’ UTR. Arrows indicate cleavage site. B. HAC1 mRNA splicing products as detected by Northern analysis with a probe binding to the 5’ region. WT strain grown to mid-log phase on acetate (lane 1) after nitrogen starvation (lane 2), and 15 and 60 min after addition of ammonium sulphate to cells starved for nitrogen for 15 min (lane 3,4) (Schroeder et al 2000).
34

35
-ons of nitrogen and carbon starvation while pseudohyphal differentiation is induced
in nitrogen-poor but carbon rich environments. This switch may be mediated by
Gpa2, which, when overexpressed, reduces sporulation but enhances filamentous
growth (Donzeau and Bandlow, 1999; Lorenz and Heitman, 1997). Gpa2p appears to
direct cells toward pseudohyphal growth rather than sporulation by directly interacting
with the Ime2p kinase (Donzeau and Bandlow, 1999). In turn, overexpression of
Ime2p inhibits pseudohyphal growth but enhances sporulation in the presence of
glucose and nitrogen while RIM1, 8, 9 and 13 mutations reduce IME2 activity and
switch cells from meiotic division to filamentous growth (Su and Mitchell, 1993a; Su
and Mitchell, 1993b).
1.2.2.2.4 Other proteins involved in regulation of pseudohyphal growth There are a number of other genes involved in the regulation of pseudohyphal growth
whose precise role is not very clear. PHD1 gene is induced in low nitrogen conditions
(Erdman et al., 1998) and when overexpressed in nutrient rich condition induces
vigorous pseudohyphal growth (Gimeno and Fink, 1994). PHD1 transcription is
induced by mating pheromones and nitrogen starvation and deletion of PHD1 with
deletion of STE12 completely suppresses pseudohyphal growth (Gimeno and Fink,
1994; Lo et al., 1997). Sok2p is also involved in negatively regulating pseudohyphal
growth as sok2/sok2 diploids show increased pseudohyphae. Sok2p seems to act
downstream of PKA subunits (Ward et al., 1995) but also in a separate, PKA
independent pathway (Pan and Heitman, 2000). The forkhead transcription factor
Fkh1p and Fkh2p also regulate pseudohyphal growth and invasive growth as
deletion of both transcription factors induces filamentous growth (Hollenhorst et al.,
2000). Fkh1p and Fkh2p regulate transcription of CLB2 and other genes involved in
mitosis, showing the link between cell cycle and pseudohyphal growth (Zhu et al.,
2000). Interestingly, overexpression of the Yak1 kinase, an antagonist of the cAMP-
PKA pathway, enhances pseudohyphal growth in response to nitrogen starvation
(Zhang et al., 2001). In the absence of glucose, Yak1 localizes to the nucleus where
it phosphorylates Pop2, a transcriptional regulator of glucose-repressed genes
(Moriya et al., 2001). Thus Yak1 may be a key link between glucose sensing and
invasive or filamentous growth. The RNA polymerase II complex also regulates
invasive and filamentous growth, perhaps by altering expression of effectors and

36
repressors of these processes. Overexpression of the RNA polymerase subunit
RPB7 causes cell elongation and filament formation (Khazak et al., 1995). Also,
mutations in other components of the RNA polymerase II complex (Ssn3p, Ssn8p,
Srb8p, Cse2p and Med1p) constitutively activate invasive growth in haploids
(Palecek et al., 2000).

37
1.3 The N-end Rule: Protein destabilisation using the N-end rule Proteins function as important structural and functional entities in the cell to regulate
a vast number of pathways. Proteins are in a dynamic state in the cell being
continuously synthesized and degraded. Proteins are degraded to modulate levels of
certain regulatory proteins or to get rid of damaged proteins. These proteins are
conjugated to ubiquitin by the function of three enzymes: E1 ubiquitin activating
enzymes, E2 ubiquitin conjugation enzymes and E3 ubiquitin ligases. The
ubiquitinated protein is then degraded by the 26S proteosome. Methionine is by
default the first amino acid incorporated during translation and this can be replaced
with other destabilising amino acid residues to derive proteins of different half-life.
Thus the N-terminal amino acid residue can determine the stability of the protein and
this pathway is called N-end rule (Varshavsky, 1997). The N-end rule has been found
in organisms ranging from E. coli, S. cerevisiae, A. thaliana to mammalian cells
(Tasaki and Kwon, 2007). Artificially engineered chimeric ubiquitin-β-galactosidase
protein encoded by Ub-lacZ is an artificial N-end rule substrate. β-Galactosidase
encoded by lacZ is routinely used to monitor transcriptional activity in S. cerevisiae
and has a half-life of >30 h (Bachmair and Varshavsky, 1989). The chimera of
ubiquitin and β-galactosidase encodes a protein in yeast in which the nascent protein
is deubiquitinated exposing the N-terminus (Bachmair et al., 1986). The ubiquitin
moiety is cleaved by ubiquitin-specific proteases (Ubp) like UBP1/2/3 and YUH1
found in yeast (Bachmair et al., 1986; Baker et al., 1992; Tobias et al., 1991; Tobias
and Varshavsky, 1991). The metabolic instability of engineered N-end rule substrates
is due to the degradation signals called degrons, which is recognised by N-recognins.
In eukaryotes, the N-degron consists of three determinants: a destabilizing N-terminal
amino acid of the protein substrate, the internal lysine residue which forms the
anchor for ubiquitin chain and the conformationally flexible region in the vicinity of the
other determinants required for ubiquitylation and/or degradation (Hu et al., 2006).
The N-end rule follows a hierarchic structure where asparagine (Asn) and glutamine
(Gln) are tertiary destabilizing residues. They function by enzymatic deamidation to
form secondary destabilizing residues aspartate (Asp) and glutamate (Glu) (Baker
and Varshavsky, 1995; Kwon et al., 2000). These secondary destabilising residues
are then conjugated to arginine (Arg) by ATE1 encoded arginyl-tRNA protein
transferase to derive the protein substrate with Arg for degradation. Phenylalanine, leucine, tryptophan, tyrosine, isoleucine, lysine and histidine besides arginine form

38
other primary destabilizing residues (Balzi et al., 1990; Davydov and Varshavsky,
2000; Hu et al., 2005; Kwon et al., 2002; Kwon et al., 1999; Lee et al., 2005b). N-
recognins are a class of E3 ubiquitin ligases that tag the N-end rule substrates with
ubiquitin via covalent bonding (Hu et al., 2006) and allow degradation by 26S
proteosome. In yeast UBR1 encodes the sole E3 ubiquitin ligase responsible for
ubiquitylation of proteins with destabilising N-terminal residues (Alén et al., 2002; Xie
and Varshavsky, 1999). The 225 kDa N-recognin Ubr1p consists of at least two
binding sites identifying N-terminal residues. Type 1 residues are basic amino acid
residues like Arg, Lys and His and type 2 residues are bulky hydrophobic residues
like Phe, Leu, Trp, Tyr and Ile (Varshavsky, 1997). Therefore replacing default N-
terminal amino acid residue, methionine with destabilising residues can change half-
life of the protein. (Table 1.1) shows half-life of β-galactosidase destabilised with the
amino acid residues as indicated.
The N-end rule functions naturally in a number of pathways which include the
regulation of import of short peptides through ubiquitination and degradation of
CUP9, a transcriptional repressor of PTR2 peptide transporter (Alén et al., 2002),
regulation of signal transduction and cell differentiation in response to mating
pheromones through degradation of GPA1 (Madura and Varshavsky, 1994), the
fidelity of the chromosome segregation by degradation of the SCC1 cohesin subunit
(Alén et al., 2002; Rao et al., 2001; Turner et al., 2000), regulation of apoptosis by
degradation of caspase cleaved inhibitor DIAP1 of apoptosis (Ditzel et al., 2003;
Varshavsky, 2003), the regulation of meiosis (Kwon et al., 2003), leaf senescence
and seed germination in plants (Yoshida et al., 2002), control of shoot and leaf
development (Graciet et al., 2009) and neurogenesis and cardiovascular
development in mammals (An et al., 2006; Johnson et al., 1990; Kwon et al., 2002;
Lee et al., 2005b). In order to monitor transcriptional activity mediated through URS1,
the URS1-CYC1-Ub-lacZ reporters were constructed in the current study exploiting
N-end rule pathway.

39
Table 1.1 Destabilisation of β-galactosidase proteins by N-end rule in S. cerevisiae.
X amino acid residue Half-life of X- β-gal
Arg ~2 min
Lys, Phe, Leu, Trp, Asp, Asn and His
~3 min
Tyr and Gln ~10 min
Ile and Glu ~30 min
Pro* >5h
Met, Cys, Ala, Ser, Gly, Val and Thr
>30h
Table 1.1 Varying half lives of X-β-gal proteins exposing different amino acids at the
N-terminal end in S. cerevisiae measured at 30oC. Reproduced from (Bachmair and
Varshavsky, 1989; Balzi et al., 1990; Gonda et al., 1989). *Ub-Pro-β-gal is
deubiquitinated 20 times slower than the other Ub-X-β-gal proteins and is a long lived
protein in yeast.

40
1.4 Unfolded protein response pathway and its role in nutrient sensing and developmental programs
The unfolded protein response (UPR) pathway is induced in response to accumulation
of unfolded proteins in the endoplasmic reticulum (ER). The cells respond to this ER
stress through a signal transduction pathway that transduces the signal of unfolded or
misfolded proteins from the ER lumen to the nucleus (Schröder and Kaufman, 2005).
ER expansion and upregulation of chaperone gene expression are the main events
occurring in this pathway, which leads to decrease in load of unfolded proteins in ER
(Figure 1.6). The following sections discuss UPR pathway in yeast and mammals and
its role in nutrient sensing and developmental programs.
1.4.1 UPR pathway in yeast:
In budding yeast S. cerevisiae, Ire1p (Inositol requiring) in unstressed conditions is
bound to BiP/GRP78/KAR2 chaperones in a monomeric form (Bertolotti et al., 2000;
Harding et al., 2000; Urano et al., 2000a; Urano et al., 2000b). On an increase of
unfolded proteins in the ER, BiP/GRP78/KAR2 bind the unfolded polypeptides,
rendering Ire1p relatively free. Ire1p now oligomerizes and undergoes
autophosphorylation through its serine threonine kinase domain, activating its RNAse
domain. Ire1p was shown to be forming a higher order oligomer to actuate response to
counter the buildup of unfolded proteins in the ER (Korennykh et al., 2009). Activated
Ire1p splices at the 5’ and 3’ exon-intron junctions of HAC1 messenger RNA (Figure 1.5 A). The exons are ligated by transfer RNA ligase (Rlg1p) (Sidrauski et al., 1996).
HAC1 mRNA encodes Hac1ip, basic leucine zipper transcription factor (bZIP) (Cox and
Walter, 1996; Kawahara et al., 1997; Sidrauski et al., 1996). Thus Hac1ip (”i” for
induced) then activates genes by binding to the consensus sequence Unfolded Protein
Response Element (UPRE; CAGCGTG) present in the promoters of responsive genes
like chaperone genes and activate their transcription (Mori et al., 1996; Mori et al.,
1998; Mori et al., 1992). The expressed chaperones would necessarily help to deal
with ER unfolded protein stress. Unspliced HAC1u mRNA is poorly translated and is
unable to activate transcription as efficiently as Hac1ip synthesized from spliced HAC1i
mRNA (Chapman and Walter, 1997; Cox et al., 1997; Welihinda et al., 2000). The
transcriptional activation through UPRE is dependent on a functional SAGA histone

41
acetyltransferase (Welihinda et al., 1997) and Hac1ip in vitro interacts with Gcn5p the
catalytic subunit of SAGA (Welihinda et al., 2000).
1.4.2 Mammalian UPR pathway:
In higher eukaryotes, there are two orthologs of yeast Ire1p, IRE1-α and IRE1-β.
Activated Ire1p splices XBP1 mRNA encoding the bZIP transcription factor X-box
binding protein (Xbp-1) in metazoans which activates UPR-target genes (Yoshida et
al., 2001). Unspliced XBP1-mRNA (XBP1u) encodes a short lived protein responsible
for repression of these UPR target genes (Yoshida et al., 2006). The splicing of XBP1
mRNA by Ire1p excises an intron resulting in a frameshift in the XBP1 transcript
(XBP1s) resulting into Xbp1s similar to Hac1ip in yeast (Figure 1.6). IRE1 is also
involved in activation of cell death pathways in response to prolonged ER stress by its
interaction with tumor necrosis associated factor (TRAF2) to modulate the activity of c-
JUN N-terminal kinase (JNK) pathway via the apoptosis signaling-regulated kinase 1
(ASK-1), which controls apoptosis through caspase-12 activation (Hetz et al., 2006;
Nishitoh et al., 2002; Urano et al., 2000b; Yoneda et al., 2001). The non-specific Ire1p
RNAse activity has also been suggested to reduce global reduction of protein into ER
by degradation of mRNA localized to ER membrane (Hollien et al., 2009). The Ire1p
mediated mRNA splicing of HAC1/XBP1 is conserved from yeast to mammals while
higher eukaryotes have evolved additional sensors of ER stress in protein kinase
activity of PKR-like endoplasmic reticulum kinase/pancreatic eIF2α-kinase (PERK) and
activating transcription factor 6 (ATF6) (Figure 1.6). The UPR regulates translation
through attenuation of general transcription by increasing the protein kinase activity of
PERK, which in turn phosphorylates the eIF2α translation initiation factor inhibiting
general translation (Harding et al., 1999). Under conditions of ER stress, BiP
dissociates from lumenal domain of PERK triggering oligodimerization,
autophosphorylation and leading to activation of its cytosolic kinase domain (Bertolotti
et al., 2000; Harding et al., 2000; Liu et al., 2003; Ma et al., 2002; Ron and Walter,
2007; Urano et al., 2000a; Urano et al., 2000b). PERK phosphorylation of eIF2α not
only decreases the protein folding load of ER, but also activates NFкB signaling and
potentially promoting cell survival and an inflammatory response (Deng et al., 2004;
Jiang et al., 2003). eIF2α phosphorylation selectively increases translation of activating

42
transcriptions factor 4 (ATF 4) mRNA through upstream open reading frames (uORFs)
present in the ATF4 transcript (Lu et al., 2004; Vattem and Wek, 2004). ATF4 localizes
to the nucleus and activates transcription of genes encoding amino acid transporters,
redox enzymes that promote protein folding in the ER lumen and a proapoptotic
transcription factor called CCAAT enhancer- binding homologous protein (CHOP)
(Jiang et al., 2004; Schröder and Kaufman, 2005). ATF4 also increases transcription of
XBP1 mRNA and augments the UPR response (Yoshida et al., 2000).
Dephosphoryaltion of eIF2α by the association of protein phosphatase I (PPI) to
constitutively expressed repressor of eIF2α phosphorylation (CReP) and stress
inducible ATF4 target, growth arrest and DNA damage inducible gene 34 (GADD34)
relieves PERK dependent translation attenuation (Brush et al., 2003; Ma and
Hendershot, 2003). The third sensor of ER stress, activating transcription factor (ATF6)
is also regulated by its interaction with BiP and release of BiP allows ATF6 packaging
into COPII vesicles to be translocated to Golgi under ER stress (Chen et al., 2002). In
Golgi, ATF6 is sequentially cleaved by site-1-protease (S1P) and site-2-protease (S2P)
to release a 50 kDa cytosolic domain (Haze et al., 1999). This portion of ATF6 may
then heterodimerize with XBP1 and localize to the nucleus to activate genes encoding
ER chaperones (Yoshida et al., 2000). The ER associated protein degradation (ERAD)
pathway is also activated to degrade unfolded/misfolded proteins (Casagrande et al.,
2000; Friedlander et al., 2000; Travers et al., 2000). Thus, upregulation of chaperones
synergizes with translational control and protein degradation machinery in protecting
cells against unfolded and misfolded proteins.

Golgi
uORF
ATF4
Yeast IRE1 Metazoan IRE1α/IRE1β PERK ATF6αβ
IRE1
ATP
IRE1
ADP ADP ADP IRE1
P ADP ADP ADP IR
E1
IRE1
P ADP
TRAF Rlg1 ligase
HAC1/XBP1 Unspliced
HAC1/XBP1 Spliced
Hac1ip Hac1up
Degradation
UPRE
Cytoplasm
ER lumen
Nucleus
mRNA degradation
PER
K
40s 60s PE
RK
PE
RK
ATP
γ α β
γ α β
P eIF2α eIF2α
+GADD34/PPI +CReP/PPI
eIF2B
IκB
Translational attenuation
ATF
6
CR
EB-H
CR
EB-H
ATF
6
ATF6
Xbp1s
ATF6
ER chaperones ERAD Lipid synthesis Adipogenesis ERO1
Apoptosis Insulin resistance
Inflammation Cell survival
CHOP Amino acid transporters Bone Development Cytoplasmic redox XBP1 GADD34 ERO1
XBP1 ER quality control Lipid synthesis
Acute phase response Iron metabolism
ATF4
40s 60s
NFκB
ATF6
S1P/S2P
S1P/S2P
JNK
ASK-1
Hac1ip
P P P P
P P
P P P
BiP
BiP
BiP BiP
BiP BiP
43

Figure 1.6 Unfolded protein response pathway in yeast and mammalian cells. Three sensors of unfolded protein in ER, IRE1, PERK and ATF6 initiate signalling cascade that restores ER homeostasis and if needed be undergoes apoptosis. UPR also regulates metabolic pathways, cell differentiation and inflammation and cell survival. UPR in yeast is triggered in presence of unfolded proteins by activation of Ire1p, whose ribonuclease activity splices HAC1 mRNA to synthesize Hac1ip. The newly synthesized Hac1ip induces transcription of genes containing UPRE (chaperones and foldases), components of ER-associated degradation (ERAD) pathway and proteins involved in phospholipid biosynthesis for ER expansion. XBP1 mRNA is spliced by mammalian homologues of yeast IRE1, IRE1-α and IRE1-β. This splicing causes frameshift in XBP1 transcript, which is translated into Xbp1 activating UPR target genes like yeast. When ER stress is prolonged, IRE1 activates cell death pathways in association with tumor necrosis associated factor 2 (TRAF2) to modulate the activity of the c-Jun N-terminal kinase (JNK) pathway via the apoptosis signaling-regulating kinase (ASK1), which controls apoptosis. In higher eukaryotes PERK and ATF6 form additional branch of UPR. Under ER stress, PERK is dissociated from BiP, triggering PERK dimerization, autophosphorylation and activation of cytosolic kinase domain. Activated PERK phosphorylates translation initiation factor eIF2α, which attenuates global protein translation reducing protein load of ER. ATF4, however is exempted from this embargo due to selective transcription through conserved upstream ORFs (uORFs) in ATF4 mRNA. The ATF4 localizes to the nucleus and upregulates genes encoding amino acid transporters, promote protein folding proteins (e.g., ERO1), and a proapoptotic transcription factor called the CCAAT enhancer-binding homologous protein (CHOP), transcription of XBP1 mRNA. High eIF2α phosphorylation activates NF-кB signalling, which promotes cell survival and inflammatory response. Activating transcription factor 6 (ATF6) is also regulated by interaction with BiP in the ER lumen. ATF6 dissociates from BiP, permitting ATF6 to pack into COPII vesicles for trafficking to the Golgi. ATF6 is sequentially cleaved by the site-1-protease (S1P) and site-2-protease (S2P) in Golgi, with release of the 50 kDa cytosolic domain of ATF6. This portion of ATF6 may then heterodimerize with XBP1 before trafficking to the nucleus to activate genes encoding ER chaperones. ATF6 shares homology with two tissue-specific proteins: CREB-H in hepatocytes and OASIS in astrocytes (not shown), which activate the stress-dependent transcription of genes with promoters containing inflammatory response elements and cAMP-responsive elements, respectively. Thus the UPR integrates all three pathways to restore ER homeostasis.
44

45
1.4.3 Role of UPR in nutrient sensing and differentiation of yeast
The UPR pathway when induced regulates the transcription of 381 open reading
frames in yeast. Roughly 50% of ORFs were known to function in the secretory
pathway, but still ~100 ORFs were known to be regulated by UPR but had other known
functions unrelated to secretory pathway, indicating that they may be related to other
cellular processes (Travers et al., 2000). One function of UPR is control of
differentiation responses like meiosis and pseudohyphal growth in S. cerevisiae. Yeast
responds characteristically to its nutrient niche and the differentiation responses are
controlled by a combination of cell type and environmental cues. Under nitrogen
starvation conditions diploid yeast undergoes pseudohyphal growth in presence of a
fermentable carbon source (Gimeno et al., 1992), while sporulation occurs in the
presence of a non-fermentable carbon source (Kupiec et al., 1997). UPR pathway
senses the nitrogen availability and regulates the differentiation of yeast. The splicing
of HAC1 mRNA is seen in nitrogen-rich conditions, but the splicing is inhibited under
nitrogen starvation (Figure 1.5 B). In nitrogen-rich conditions the UPR pathway
represses both the pseudohyphal growth and meiosis (Schröder et al., 2000).
Overexpression of Hac1ip decreased activation of early meiotic genes (EMGs) under
nitrogen starvation, while deletion of HAC1 increased mRNA levels of EMGs under
nitrogen-rich conditions, but Ime1p levels were not affected. The negative regulation
of EMGs’ transcription through Hac1ip requires Ume6p. Ume6p recruits the ISW2
chromatin remodeling complex (Goldmark et al., 2000) and the Rpd3-Sin3 HDAC
(Schröder et al., 2004) to Upstream Repressing Sequence 1 (URS1). URS1 can be
found in promoters of meiosis-specific genes like SPO13, HOP11 and IME2 and non-
meiotic genes like CAR1 (Gailus-Durner et al., 1996). Overexpression of Hac1ip also
repressed pseudohyphal growth and deletion of HAC1 or IRE1 derepressed
pseudohyphal growth. UPR inducing drugs like tunicamycin and 2-deoxyglucose
repressed pseudohyphal growth in wild-type but not in ire1Δ and hac1Δ (Schröder et
al., 2000). These data show that Hac1ip is synthesized in response to nitrogen-rich
environment and negatively regulates nitrogen starvation responses. Schroder et al,
2000 suggested a model of UPR-signaling pathway sensing the nutritional state of the
cell and regulating the nitrogen starvation induced differentiation responses (Figure 1.7). The splicing of HAC1 mRNA in response to extracellular nitrogen may be due to
increased protein synthesis leading to high levels of newly synthesized unfolded

46
polypeptides in nitrogen-rich conditions compared to nitrogen-starved conditions and
this activates the UPR by splicing of HAC1 mRNA. On the contrary, nitrogen starved
conditions have lower rates of protein synthesis decreasing the ER load, leading to
Ire1p inactivation and shutting off the Hac1ip synthesis. Thus UPR plays a role in
nutrient sensing and controlling differentiation events in yeast.
1.4.4 Basal UPR pathway in yeast:
Healthy cells under nutrient rich conditions also experience basal UPR activity in
presence of unfolded proteins in ER. Synthetic lethalities in yeast between UPR and
ERAD (Travers et al., 2000) or chaperone machinery (Tyson and Stirling, 2000), and
increase in UPR signaling have been reported with defective ERAD in yeast (Cox and
Walter, 1996) and mammalian cells (Hori et al., 2004; Lee et al., 2003). HAC1 mRNA
splicing varies dynamically in response to nitrogen availability and presence of different
carbon sources. HAC1 mRNA splicing is induced under nitrogen-rich conditions, while
spliced HAC1 ceases as nitrogen becomes limiting. The level of HAC1 mRNA splicing
is induced tenfold in non-fermentable carbon source compared to fermentable carbon
sources. These data indicate that the UPR senses the changes to its nutritional
environment and controls nutritional and differentiation programs, besides the basal
UPR that serves to aid protein folding in healthy cells (Schröder et al., 2000). The
repression of metabolic genes ACS1 encoding acetyl coenzyme A synthethase, CAR1
encoding arginase, and INO1 in Ume6p and RPD3-SIN3 HDAC-dependent manner
further highlights the role of UPR in healthy cells to its metabolic regulation (Schröder
et al., 2004).
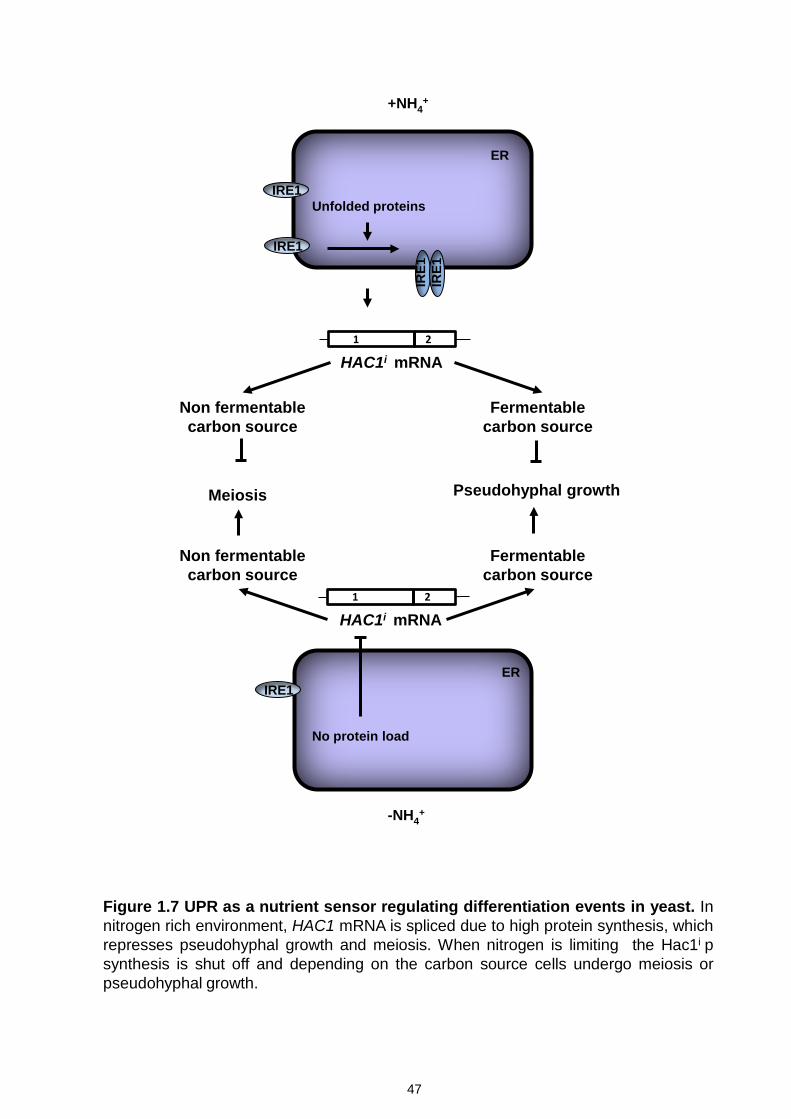
ER
Pseudohyphal growth
+NH4+
ER
Meiosis
Figure 1.7 UPR as a nutrient sensor regulating differentiation events in yeast. In nitrogen rich environment, HAC1 mRNA is spliced due to high protein synthesis, which represses pseudohyphal growth and meiosis. When nitrogen is limiting the Hac1i p synthesis is shut off and depending on the carbon source cells undergo meiosis or pseudohyphal growth.
1 2
HAC1i mRNA
IRE1
IRE1
IRE1
IR
E1
IRE1
Non fermentable carbon source
Fermentable carbon source
-NH4+
Unfolded proteins
Non fermentable carbon source
Fermentable carbon source
No protein load
1 2
HAC1i mRNA
47

48
1.4.5 Role of UPR in nutrient sensing and differentiation in higher eukaryotes:
In higher eukaryotes changes in glucose levels are responded by UPR. Decreased
glucose levels induce the ER chaperone machinery indicating that UPR responds to
nutritional state of the cell. Here this section provides an overview of UPR and its role
in nutrient sensing and differentiation.
1.4.5.1 Glucose regulated events in pancreatic β-cells and plasma B-cells:
Hypoglcemia induced ER stress and UPR in liver cells and abrogation of PERK
pathway in mice leads to hypoglycemia due to reduced levels of glycogen and
phosphoenol pyruvate carboxykinase, a rate limiting step in gluconeogenesis
(Gonzales et al., 2008; Scheuner et al., 2001). Decreased glucose levels induce eIF2α
phosphorylation by PERK and limit translation to decrease proinsulin production in β-
cells (Scheuner et al., 2001). A nearly fivefold increase in total protein synthesis, ~50%
of which is proinsulin production, challenges the folding capacity of ER in glucose
stimulated β-cells. UPR responds by adjusting organelle mass and induces
chaperones and foldases to maintain favorable environment for proper folding of
proinsulin in cases of hyperglycemia, insulin resistance or high fat diet (Scheuner and
Kaufman, 2008). As glucose levels rise, the ADP/ATP ratio increases, inactivating
PERK signaling and inducing proinsulin production (Scheuner et al., 2001). The role of
protein phosphatase 1 (PP1) has been proposed, where in the presence of glucose,
eIF2α is dephosphorylated to allow proinsulin production (Vander Mierde et al., 2007).
eIF2α phosphorylation is also required for maintenance and function of differentiated β-
cells (Back et al., 2009). In this way glucose sensing by β-cells to control proinsulin
production may have evolved ER signaling to support this specialized cell type.
Decreased or increased glucose levels trigger ER stress in isolated pancreatic islets
and insulinoma cells (Elouil et al., 2007; Greenman et al., 2007). High glucose and
high fatty acid supply induce ER stress in β-cells and play a part in development of
type 2 diabetes. Sustained ER stress reduces insulin expression and increases
apoptosis (Kaneto et al., 2006; Laybutt et al., 2007). It has been proposed that ER
stress suppresses insulin biosynthesis at the transcriptional level by JNK activation
(Kaneto et al., 2006). UPR related events are seen in β-cells of type 2 diabetes and
CHOP mediated apoptosis is a fundamental contributing factor to β-cell failure in the

49
disease (Laybutt et al., 2007; Scheuner and Kaufman, 2008). Further β-cell dysfunction
has also been related to ER stress in animal models with defective disulphide bridge
formation in proinsulin (Herbach et al., 2007). The mice with impaired disulfide bond
formation in proinsulin induce diabetes, while similar mutation in human insulin gene
induces permanent neonatal diabetes (Huang et al., 2007; Stoy et al., 2007). So the
involvement of glucose in controlling proinsulin translation by UPR is also evident in
pancreatic β-cells.
Differentiation of B-cells: The role of UPR in differentiation in mammalian system is
reported in the terminal differentiation of B-cells to antibody secreting plasma cells.
UPR is activated on antigenic stimulation of B lymphocytes to terminally differentiate
into plasma cells producing high rate of antibodies to deal with antigen. IRE1 mediated
XBP1 splicing is required to drive the differentiation and activation of UPR is needed to
expand the ER and meet the demand of high secretory activity of B-cells (Calfon et al.,
2002; Iwakoshi et al., 2003; Lee et al., 2005a; Reimold et al., 2001; Zhang et al.,
2005). This is consistent with the requirement for XBP1 in pancreatic acinar cell
development (Lee et al., 2005a). A key role of Xbp1 is in ER expansion through
induction of phospholipid biosynthesis and membrane proliferation for plasma cell
differentiation (Shaffer et al., 2004; Sriburi et al., 2004). Terminal differentiation of B-
cells requires repression of c-myc transcription (Lin et al., 2000) through recruitment of
mammalian Rpd3p orthologs to the c-myc promoter by Blimp-1 (Yu et al., 2000). These
data together with the observation that the UPR controls HDACs in yeast suggests that
UPR signaling is not only important to drive but also important to maintain
differentiation in mammals.
1.4.5.2 UPR and Insulin signaling:
Under nutrient excess, insulin levels rise and activate downstream signaling pathways.
Insulin stimulates glucose uptake, nutrient storage and protein synthesis after binding
to the insulin receptor (IR) to promote differentiation and growth (Draznin, 2006; Nandi
et al., 2004; Saltiel and Kahn, 2001; Saltiel and Pessin, 2002; Shulman, 1999;
Taniguchi et al., 2006). Binding of insulin to the IR induces a conformational change in
the IR and activates tyrosine autophosphorylation of the IR, IR substrate (IRS) 1, 2, 3,
and 4, and of several SRC homology 2 (SH-2) domain containing (SHC) proteins.

50
Tyrosine-phosphorylated IRS and SHC proteins are anchoring points for proteins
containing SH-2 domains, including recruitment of both SH-2 domains in the regulatory
subunits of phosphatidylinositol (PI) 3-kinase (PI3K). p85 is the regulatory subunit of
PI3K and this interaction relieves the basal repression of catalytic subunit of PI3K
(p110). Activated PI3K catalyzes the formation of PI-3,4-bisphosphate and PI-3,4,5-
trisphosphate and recruitment of phosphoinositide-dependent kinases (PDK) 1 and 2
and several protein kinase B (PKB/AKT) isoforms to the plasma membrane. PDKs
when co-localized at the plasma membrane phosphorylate and activate PKB1, -2, and
-3. Activated PKB controls many cellular events, including glucose transport, protein
and glycogen synthesis, cell proliferation and survival by phosphorylation of numerous
substrates. The importance of PI3K in mediating the metabolic actions of insulin is
supported by studies where genetic or pharmacological inhibition of PI3K completely
abolishes insulin stimulation of glucose transport, lipogenesis and glycogen synthesis
(Cheatham et al., 1994; Sharma et al., 1998). More evidence comes from the fact that
alterations in insulin stimulation of PI3K activity have been observed in mouse models
of obesity, as well as in humans with type 2 diabetes (Bandyopadhyay et al., 2005;
Cusi et al., 2000; Heydrick et al., 1995).
Recent results show that p85α and p85β, the regulatory subunits of PI3K interact with
XBP1 and increase its nuclear translocation in response to insulin, thereby activating
UPR (Park et al., 2010; Winnay et al., 2010). The results also show that p85α
deficient cultured cells or hepatocytes result in reduced nuclear accumulation of
XBP1 after ER stress and considerably attenuate UPR by reduction in IRE1α and
ATF6 pathway activation and a concomitant reduction in the expression of UPR
targets at the mRNA and protein levels. However translocation of XBP1 to nucleus
can resolve ER stress with limited activation of PERK arm of UPR. But obese mice
with refeeding and metabolic overload led to severe PERK phosphorylation. So the
intact response of p85 to insulin receptor signaling is necessary for activation of UPR
to deal with metabolic overload. This is especially important because when insulin
levels rise in response to excess of nutrient availability the activation of insulin
receptor signaling increases protein synthesis, nutrient storage and promotes
differentiation and growth (Nandi et al., 2004; Saltiel and Pessin, 2002; Taniguchi et
al., 2006). This metabolic overloading causes ER stress and activation of the PERK
arm of UPR downregulates the protein load by reducing global translation (Harding

51
et al., 2000; Harding et al., 1999) and increased IRE1 kinase activity blocks insulin
receptor signaling. So a model was proposed where decrease in p85α leads to a
reduced nuclear translocation of XBP-1 and therefore reduce cellular response to ER
stress and a decrease in ATF6α pathway activation. Conversely, active insulin
receptor signaling increased the efficiency of XBP-1s by promoting its association
with p85, leading to faster and higher upregulation of the chaperones, without chronic
activation of UPR (Park et al., 2010; Winnay et al., 2010). This highlights the critical
role of PI3K regulatory subunits in modulating the UPR.
Mice with genetic or diet-induced obesity show a considerable elevation in ER stress,
with elevated phosphorylation of PERK and IRE1α and enhanced splicing of XBP-1
(Özcan et al., 2004). Conversely, the increase in insulin sensitivity associated with
weight loss is associated with a substantial reduction in markers of UPR activation
(Gregor et al., 2009). Enhancement of protein folding led to improvements in obesity-
associated insulin resistance and glucose metabolism (Ozawa et al., 2005; Özcan et
al., 2006). So UPR may decrease insulin sensitivity in obese state through IRE1α-
dependent activation of c-Jun N-terminal kinase (JNK), which leads to
phosphorylation of insulin receptor substrate-1 (IRS-1) on inhibitory serine residues
(Audhya et al., 2004; Herschkovitz et al., 2007; Tanti et al., 2004). When subjected
to a high-fat diet, XBP-1–heterozygous mice gain more weight and become more
insulin resistant than control mice (Özcan et al., 2004). These mice also show an
increase in ER stress in adipose tissue, with enhanced PERK and IRE1α
phosphorylation and activation of JNK. Likewise, XBP-1-deficient fibroblasts show
enhanced PERK phosphorylation, hyperactivation of JNK and increased serine
phosphorylation of IRS-1 (Özcan et al., 2004). The ER stress response has been
strongly implicated in the pathophysiology of diabetes, affecting both insulin
sensitivity in liver and fat, and the survival of pancreatic β-cells (Calfon et al., 2002;
Eizirik et al., 2008; Fonseca et al., 2007; Nakatani et al., 2005). Adipose tissues from
obese, insulin-resistant mice and humans show a persistent low level of inflammation
in addition to activation of ER stress pathways, including induction of the UPR.
Therefore inflammation is a common feature of obesity and type 2 diabetes
(Hotamisligil, 2006; Özcan et al., 2004; Shoelson et al., 2006; Wellen and
Hotamisligil, 2005). In obese mice, there is a ~50% reduction in p85α expression in

52
liver (Kerouz et al., 1997). In response to excess nutrients IRE1-XBP1-p85α pathway
manage ER homeostasis and modulate insulin sensitivity but failure of this pathway
in obesity leads to activation of UPR promoting proinflammatory and proapoptotic
state (Park et al., 2010; Winnay et al., 2010). This link between the regulatory subunit
of PI3K regulated by insulin and the cellular response to ER stress establishes a role
of UPR in nutrient sensing mechanism in higher eukaryotes and its regulation of
cellular processes. The crosstalk between the PI3K system and the UPR might have
evolved to ensure the utilization of nutrients at the highest level of their availability in
cell types requiring increased protein load without needing to activate other arms of
UPR that would otherwise block protein synthesis.

53
1.5 Aims and Objectives
Aims:
A) Study of regulation of EMGs under nutrient-rich conditions
• To investigate whether Hac1ip mediates repression on EMGs through URS1 in a
nitrogen-rich environment
• To study the role of histone and chromatin modifying complexes in regulation of
URS1-controlled genes under nutrient rich conditions
S. cerevisiae responds to their nutritional environment and decide their cell fate. The
yeast responds to nitrogen starvation by differentiating to form a spore or
pseudohyphal growth depending on the type of carbon source. Nitrogen-rich conditions
repress these differentiation events. The unfolded protein response pathway is known
to contribute to control of these nitrogen starvation responses. Under nitrogen-rich
conditions Hac1ip is synthesized but when extracellular levels of nitrogen drop, Hac1ip
synthesis ceases. Pseudohyphal growth is repressed by activation of UPR or by
overexpression of Hac1ip. The hac1Δ/hac1Δ strains show derepression of
pseudohyphal growth. Negative regulation of early meiotic genes is shown by
increased levels of mRNA levels in the absence of Hac1ip and repression in the
presence of Hac1ip under nitrogen starved conditions. Therefore, Hac1ip inhibits
meiosis under nitrogen starved conditions. Hac1ip-mediated negative regulation also
requires the function of RPD3-SIN3 HDAC under these conditions, while the ISW2-
ITC1 chromatin remodelling complex was dispensable for this repression. However,
the URS1-mediated repression in the presence of extracellular nitrogen has not been
demonstrated. Therefore, demonstration of Hac1ip-mediated negative regulation of
early meiotic genes through URS1 under nitrogen-rich conditions would further
strengthen the case for involvement of the UPR sensing nitrogen. This will provide
direct evidence of control of differentiation responses by UPR. UAS-less URS1-CYC1-
lacZ reporters have been used to demonstrate negative regulation by Hac1ip at URS1
under nitrogen-starved conditions. But under nitrogen-rich conditions, β-galactosidase
expression from these reporters is barely detectable. Therefore, these reporters did not
yield conclusive data and could not be used here. Therefore, to test whether Hac1ip

54
negatively regulates the transcription of early meiotic genes through URS1 under
nitrogen-rich conditions, I constructed URS1-CYC1-Ub-X-lacZ reporters. Destabilised
β-galactosidase expressed from these reporters would have robust mitotic expression
and different half lives as a result of the N-end rule. URS1-CYC1-Ub-X-lacZ reporters
have been tested in different deletion strains of genetic elements to validate these
reporters. Further, functional URS1-CYC1-Ub-X-lacZ reporters could be used in
genetic screens. Hac1ip upregulates ER chaperone expression through UPRE
elements by histone acetylation of promoters by the SAGA histone acetyltransferase
(Welihinda et al., 1997; Welihinda et al., 2000). Hac1ip also negatively represses
EMGs via URS1 and requires the function of the RPD3-SIN3 HDAC. The URS1-CYC1-
Ub-X-lacZ reporters will be handy in studying the structural features of Hac1ip which is
involved in transcriptional activation and repression. These functional reporters can be
used to investigate transcription factors, histone deacetylases and chromatin
remodelling factors involved in the regulation of EMGs through URS1 under nitrogen-
rich conditions.
B) Role of non-fermentable carbon sources in pseudohyphal growth
• To investigate the effects and role of non-fermentable carbon sources on
pseudohyphal growth
Nitrogen starvation in the presence of a fermentable carbon source initiates
pseudohyphal growth differentiation in S. cerevisiae. The UPR pathway also repressed
pseudohyphal growth under nitrogen-rich conditions as ire1Δ/ire1Δ and hac1Δ/hac1Δ
diploids also showed increased pseudohyphal growth and expression of Hac1ip
repressed pseudohyphal growth. Thus cells compromised in UPR pathway under
sporulation inducing conditions (limiting nitrogen and acetate), responded
inappropriately by switching to pseudohyphal growth. Splicing of HAC1 mRNA was
higher in the presence of acetate as compared to other carbon sources (Schröder et
al., 2000). These observations suggest that at least when UPR is defective, cells
exhibit pseudohyphal growth on a non-fermentable carbon source. Therefore, it would
be interesting to test whether a/α diploid cells also induce pseudohyphal growth on
non-fermentable carbon source. If this is the case, genetic elements involved in this

55
phenomenon can be investigated. Thus this study will provide us an insight into effect
of non-fermentable carbon sources on pseudohyphal growth.

Chapter 2
Materials and Methods

56
2.1 Chemicals, media, reagents and commercial kits
Table 2.1 List of Chemicals
Sr. No Chemical Company , Catalogue No.
1. Acetic acid
Fisher Scientific, # A/0360/PBH
2. Agar
Fisher Scientific, # 9002-18-0
3. Agarose molecular grade
Bioline, # BIO-41025
4. Albumin
Sigma-Aldrich, # A2153-50G
5. Ammonium persulphate
Fisher Scientific, # BP179-25
6. Calcium chloride
Sigma-Aldrich, # C1016-100G
7. Clelands reagent
Calbiochem, # 233155
8. Dimethyl sulfoxide
Sigma-Aldrich, # D5879
9. Disodium hydrogen orthophosphate dodecahydrate
Fisher Scientific, # 10039-32-4
10. Disodium hydrogen phosphate
Sigma-Aldrich, # S3264-250G
11. Ethanol
Fisher Scientific , # E/0500/17
12. Ethylenediaminetetraacetic acid (EDTA)
Fisher Scientific, # BPE119-500
13. Ficoll 400
Fluka, # 46327
14. D-Glucose
Fisher Scientific, # 50-99-7
15. Glycerol
Fisher Scientific, # 56-81-5
16. Hydrochloric acid
Fisher Scientific , # H/1100/PB17
17. Iso-amyl alcohol
BDH, # 272124U

57
18. Isopropyl β-D-thio-galactopyranoside (dioxane free)
Melford, # MB 1008
19. Lithium Acetate
Fisher Scientific , # L/2050/50
20. Magnesium chloride
BDH, # 2909647
21. Magnesium sulphate
Fisher Scientific, # M/1050/53
22. 2-Nitrophenyl-β-D-galactopyranoside
BDH, # 400312X
23. Phenol:CHCl3:isoamylalcohol (25:24:1;v/v/v)
Fisher Scientific, # BPE1752P-400
24. Polyethylene glycol 4000
Sigma-Aldrich, # P 3640
25. Potassium acetate
Fisher Scientific, # P3760153
26. Poatassium chloride
Fisher Scientific, # P/4240/53
27. Potassium dihydrogen phosphate
Fisher Scientific, # 7778-77-0
28. Potassium phthalate monobasic
Sigma-Aldrich, # P6758 -500 G
29. Protease inhibitor cocktail
• Complete • Mini
Roche Applied Science, # 11836153001 # 11836153001
30. Sheared salmon sperm DNA (8.31 mg/ml or 6.89 mg/ml)
Sigma, # D-1626
31. Sodium chloride
Fisher Scientific, # 7647-14-5
32. Sodium dodecyl sulfate
Promega, # H5114

58
33. Sodium hyroxide
Anal-R Normapur, # 28244.262
34. Tris (hydroxymethyl) methylamine
Fisher Scientific, # T/3710/60
35. Tween 20
Fisher Scientific, # BPE 337-500

59
Table 2.2 Media reagents
Sr. No.
Chemical
Company, Cat. No.
1.
LB broth
Formedium, # LBXO102
2.
LB agar
Formedium, # LBXO202
3.
YNB agar
Formedium, # CCMO210
4.
YNB broth
Formedium, # CCMO110
5.
YNB w/o a.a.
Formedium, # CYNO405
6. YNB w/o a.a. w/o ammonium sulphate Formedium, # CYNO501
7.
Difco YNB w/o a.a.
BD, # 291940
8.
Difco agar noble
BD, # 214220
9.
Bacto-peptone
BD, # 211677
10.
Bacto-yeast extract
BD, # 212750
11.
Agar
Fisher Scientific, # 9002-18-0

60
Table 2.3 List of Reagents/Enzymes/Antibiotics
Sr.No
Enzymes/Antibiotics
Company, Cat. No.
1.
1 U/μl β-galactosidase
Promega, # E2000
2.
5 Weiss U/μl T4 DNA ligase
Fermentas, # EL0011
3.
Pfu DNA polymerase
Fermentas, # EP0501
4.
RNase A, 10-20 mg/ml, DNase-free
Fermentas, # EN0531
5.
1 U/μl Calf intestine alkaline phosphatase
New England BioLabs, # M0290L
6. Glusulase
Perkin Elmer, # NEE154
7.
Turbo NarI
Promega, # R7261
8.
PspOMI
New England BioLabs , # R0653
9.
BamHI
Fermentas, # ER0051
10.
BauI
Fermentas, # ER1841
11.
Eco32I (EcoRV)
Fermentas, # ER0301
12.
EcoRI
Fermentas, # ER0271
13.
Ampicillin 100 µg/ml
Melford, # A0104
14.
Tetracycline 12.5 µg/ml
Fluka Biochemika, # 87130
15.
Hygromycin B
Duchefa Biochemie, # 31282-04-9

61
16.
Tunicamycin(Streptomyces lysosuperficus)
Calbiochem, # 654380
17.
G-418
Melford, # G0175
18.
Kanamycin
Gibco, # 11815-024
Table 2.4 List of Commercial kits
Sr.No
Kit
Company, Cat. No.
1.
Reagent A (Bio-Rad DC Protein Assay)
BioRad, # 500-0113
2.
Reagent B (Bio-Rad DC Protein Assay)
BioRad, # 500-0114
3.
Bovine serum albumin (BSA) standard
Sigma-Aldrich, # A2153-50G
4.
5 x Reporter lysis buffer
Promega, # E3971
5.
Wizard SV Gel and PCR clean up system
Promega, # A9282
6.
Qiagen Miniprep Kit
Sigma-Aldrich, # 27104
7.
GeneEluteTM HP Plasmid Midiprep kit
Sigma-Aldrich, # NA0200
8.
GeneluteTM Gel extraction kit
Sigma-Aldrich, # NA1111
9.
GeneEluteTM HP Plasmid Maxiprep kit
Sigma-Aldrich, # NA0310
10.
Gene RulerTM 1Kb DNA ladder
Fermentas Life Sciences, # SM0311

62
11.
2 mM dNTPs
Fermentas Life Sciences, # R0181
12. QIAprep Spin Miniprep kit Qiagen, # 27104
Table 2.5 List of amino acids and media supplements
Sr.No
Enzyme/Antibiotic
Company, Cat. No.
1.
Adenine sulphate
Fluka, # 01880
2.
Inositol
Formedium, # DOCO200
3.
L-Lysine
Formedium, # DOCO161
4.
L- Methionine
Formedium, # DOCO168
5.
L-Valine
Formedium, # DOCO1197
6.
L-Threonine
Formedium, # DOCO185
7.
Isoleucine
Formedium, # DOCO152
8.
L-Aspartic acid
Formedium, # DOCO121
9.
L-Tyrosine
Formedium, # DOCO192
10.
L-Arginine
Formedium, # DOCO108
11.
L-Glutamic acid
Calbiochem , # 3510
12.
L-Histidine
Formedium, # DOCO148
13.
Uracil
Formedium, # DOCO300

63
14.
L-Phenylalanine
Formedium, # DOCO173
15.
L-Tryptophan
Formedium, # DOCO188
16.
L-Leucine
Formedium, # DOCO157
17.
L-Serine
Formedium, # DOCO181

64
2.2 List of primers and oligonucleotides
Table 2.6. List of primers and oligonucleotides. Oligonucleotides were synthesized by
Eurogentec Ltd. Lyophiized primers were resuspended in sterile water to a final
concentration of 100 µM and stored at -20oC.
Sr.No. Primer Sequence
1.
A1
GCATTAATGAATCGGCCAAC
2. A2 ACTAAATTAATAATGCAGATTTTCGTCAAGACTTTGACCGG
3.
B1
ATAGCAGAATGGGCAGACATTAC
4.
B2
TGACGAAAATCTGCATTATTAATTTAGTGTGTGTATTTGTGTTT
GCG
5. I-β-gal CCGGATCCGTGTATACCACCTCTTAGCCTTAGCACGAGATG
TAAGG
6. Q-β-gal CCGGATCCGTGCTGACCACCTCTTAGCCTTAGCACGAGATGT
AAGG
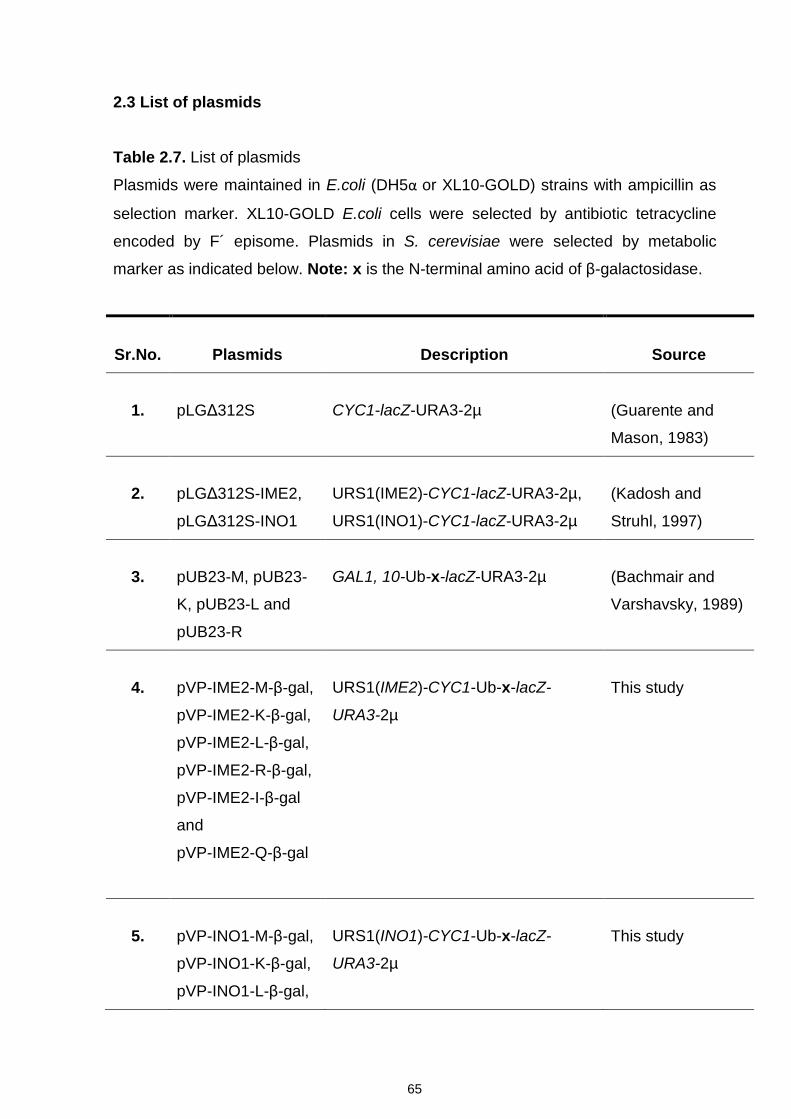
65
2.3 List of plasmids Table 2.7. List of plasmids
Plasmids were maintained in E.coli (DH5α or XL10-GOLD) strains with ampicillin as
selection marker. XL10-GOLD E.coli cells were selected by antibiotic tetracycline
encoded by F´ episome. Plasmids in S. cerevisiae were selected by metabolic
marker as indicated below. Note: x is the N-terminal amino acid of β-galactosidase.
Sr.No.
Plasmids
Description
Source
1.
pLGΔ312S
CYC1-lacZ-URA3-2µ
(Guarente and
Mason, 1983)
2.
pLGΔ312S-IME2,
pLGΔ312S-INO1
URS1(IME2)-CYC1-lacZ-URA3-2µ,
URS1(INO1)-CYC1-lacZ-URA3-2µ
(Kadosh and
Struhl, 1997)
3.
pUB23-M, pUB23-
K, pUB23-L and
pUB23-R
GAL1, 10-Ub-x-lacZ-URA3-2µ
(Bachmair and
Varshavsky, 1989)
4.
pVP-IME2-M-β-gal,
pVP-IME2-K-β-gal,
pVP-IME2-L-β-gal,
pVP-IME2-R-β-gal,
pVP-IME2-I-β-gal
and
pVP-IME2-Q-β-gal
URS1(IME2)-CYC1-Ub-x-lacZ-
URA3-2µ
This study
5.
pVP-INO1-M-β-gal,
pVP-INO1-K-β-gal,
pVP-INO1-L-β-gal,
URS1(INO1)-CYC1-Ub-x-lacZ-
URA3-2µ
This study

66
pVP-INO1-R-β-gal,
pVP-INO1-I-β-gal
and
pVP-INO1-Q-β-gal
6.
pVP-M-β-gal,
pVP-K-β-gal,
pVP-L-β-gal,
pVP-R-β-gal,
pVP-I-β-gal and
pVP-Q-β-gal
CYC1-Ub-x-lacZ-URA3-2µ
This study
7.
pRS314-HAC1i
HA-HAC1i-TRP1-CEN
(Schröder et al.,
2004)
8.
p2UG
GRE3-CYC1-URA3-2µ
(Schena et al.,
1991)
9.
pG-N795
GPD-N795-TRP1-2µ
(Schena et al.,
1991)
10.
p2UG-HA-HAC1i
GRE3-CYC1-HA-HAC1i-URA3-2µ
(Schröder et al.,
2004)

67
2.4 List of strains:
Table 2.8 List of strains
Sr.No. Organism Name Genotype Source
1. S.cerevisiae MSY134-36 SK-1 MATa arg6 rme1Δ5::LEU2
ura3 leu2::hisG trp1::hisG lys2
ho::LYS2
(Schröder et
al., 2004)
2. S.cerevisiae MSY136-40 SK-1 MATα arg6 rme1Δ5::LEU2
ura3 leu2::hisG trp1::hisG lys2
ho::LYS2
(Schröder et
al., 2004)
3. S.cerevisiae MSY 184-55 SK-1 MATa arg6 rme1Δ5::LEU2
ume6-5::LEU2 ura3 leu2 trp1 lys2
ho::LYS2
(Schröder et
al., 2004)
4. S.cerevisiae MSY 289-02 SK-1 MATa arg6 rme1Δ5::LEU2
ura3 leu2::hisG trp1::hisG lys2
ho::LYS2 rpd3Δ::hphMX4
Schröder Lab
Strain
Collection
5. S.cerevisiae MSY 283-06 SK-1 MATa arg6 rme1Δ5::LEU2
ura3 leu2::hisG trp1::hisG lys2
ho::LYS2 isw2 Δ::kanMX2
Schröder Lab
Strain
Collection
6. S.cerevisiae RCY 20-05 SK-1 MATa arg6 rme1Δ5::LEU2
sin3Δ ::LEU2 ura3 leu2::hisG
trp1::hisG lys2 ho::LYS2
Schröder Lab
Strain
Collection
7. S.cerevisiae MSY 301-03 SK-1 MATa arg6 rme1Δ5::LEU2
ura3 leu2::hisG trp1::hisG lys2
Schröder Lab
Strain
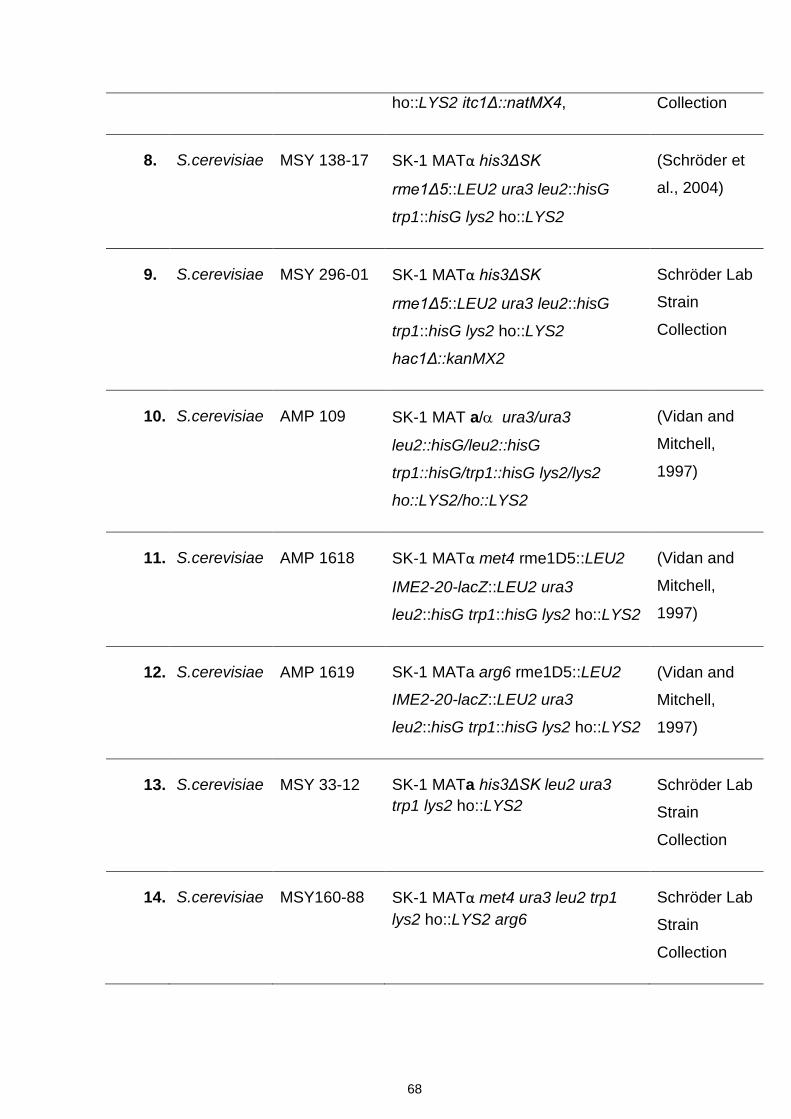
68
ho::LYS2 itc1Δ::natMX4, Collection
8. S.cerevisiae MSY 138-17 SK-1 MATα his3ΔSK
rme1Δ5::LEU2 ura3 leu2::hisG
trp1::hisG lys2 ho::LYS2
(Schröder et
al., 2004)
9. S.cerevisiae MSY 296-01 SK-1 MATα his3ΔSK
rme1Δ5::LEU2 ura3 leu2::hisG
trp1::hisG lys2 ho::LYS2
hac1Δ::kanMX2
Schröder Lab
Strain
Collection
10. S.cerevisiae AMP 109 SK-1 MAT a/α ura3/ura3
leu2::hisG/leu2::hisG
trp1::hisG/trp1::hisG lys2/lys2
ho::LYS2/ho::LYS2
(Vidan and
Mitchell,
1997)
11. S.cerevisiae AMP 1618 SK-1 MATα met4 rme1D5::LEU2
IME2-20-lacZ::LEU2 ura3
leu2::hisG trp1::hisG lys2 ho::LYS2
(Vidan and
Mitchell,
1997)
12. S.cerevisiae AMP 1619 SK-1 MATa arg6 rme1D5::LEU2
IME2-20-lacZ::LEU2 ura3
leu2::hisG trp1::hisG lys2 ho::LYS2
(Vidan and
Mitchell,
1997)
13. S.cerevisiae MSY 33-12 SK-1 MATa his3ΔSK leu2 ura3 trp1 lys2 ho::LYS2
Schröder Lab
Strain
Collection
14. S.cerevisiae MSY160-88 SK-1 MATα met4 ura3 leu2 trp1 lys2 ho::LYS2 arg6
Schröder Lab
Strain
Collection

69
15. S.cerevisiae MSY 33-12 x
MSY 160-88
SK-1 MATa/α ura3/ura3 leu2/leu2 trp1/trp1 lys2/ lys2 ho::LYS2/ho::LYS2
This study
16. S.cerevisiae MSY 673-01 SK-1 MATα his3ΔSK leu2 ura3 trp1 lys2 ho::LYS2 rtg2Δ::kanMX2
This study
17. S.cerevisiae MSY 669-01 SK-1 MATa met4 ura3 leu2 trp1 lys2 ho::LYS2 rtg2Δ::kanMX2
This study
18. S.cerevisiae MSY 673-01 x
MSY 669-01
SK-1 MATa/α ura3/ura3 leu2/leu2 trp1/trp1 lys2/ lys2 ho::LYS2/ho::LYS2 rtg2Δ::kanMX2/ rtg2Δ::kanMX2
This study
19. S.cerevisiae MSY 676-01 SK-1 MATα his3ΔSK leu2 ura3 trp1 lys2 ho::LYS2 rtg3Δ::kanMX2
This study
20. S.cerevisiae MSY 678-02 SK-1 MATa met4 ura3 leu2 trp1 lys2 ho::LYS2 rtg3Δ::kanMX2
This study
21. S.cerevisiae MSY 676-01 x
MSY 678-02
SK-1 MATa/α leu2/ leu2 ura3/ ura3 trp1/ trp1 lys2/ lys2 ho::LYS2/ ho::LYS2 rtg3Δ::kanMX2/ rtg3Δ::kanMX2
This study
22. S.cerevisiae MSY 38-03 SK-1 MATa arg6 his3ΔSK leu2 ura3 trp1 lys2 ho::LYS2
Schröder Lab
Strain
Collection
23. S.cerevisiae MSY 160-88 SK-1 MATα arg6 met4 ura3 leu2 trp1 lys2 ho::LYS2
Schröder Lab
Strain
Collection
24. S.cerevisiae MSY 38-03 x SK-1 MATa/α arg6/arg6 ura3/ ura3 leu2/ leu2 trp1/ trp1 lys2/ lys2
This study

70
MSY 160-88 ho::LYS2/ ho::LYS2
25. S.cerevisiae MSY 659-01 SK-1 MATα arg6 his3ΔSK leu2 ura3 trp1 lys2 ho::LYS2rtg1Δ::kanMX2
This study
26. S.cerevisiae MSY 656-01 SK-1 MATa arg6 met4 ura3 leu2 trp1 lys2 ho::LYS2 rtg1Δ::kanMX2
This study
27. S.cerevisiae MSY 659-01 x
MSY 656-01
SK-1 MATa/α arg6/ arg6 ura3/ ura3 leu2/ leu2 trp1/ trp1 lys2/ lys2 ho::LYS2/ ho::LYS2 rtg1Δ::kanMX2/ rtg1Δ::kanMX2
This study
28. E.coli DH5α F- φ80lacZ∆M15 ∆(lacZYA-
argF)U169 recA1 endA1 hsdR17(rk-,
mk+) phoA supE44 thi-1 gyrA96
relA1 λ-
Schröder Lab
Strain
Collection
29. E.coli XL10-Gold Tetr Δ(mcrA)183 Δ(mcrCB-
hsdSMR-mrr)173 endA1 supE44
thi-1 recA1 gyrA96 relA1 lac Hte [F’
proAB lacIqZ ΔM15 Tn10 (Tetr)
Amy Camr]
Stratagene
30. E.coli SCS110 rpsL (Strr) thr leu endA thi-1 lacY
galK galT ara tonA tsx dam dcm
supE44 ∆(lac-proAB) [F´ traD36
proAB lacIqZ∆M15]
Schröder Lab
Strain
Collection

71
2.5 Stock solution
Note: Solutions were preferably made in high-purity H2O (conductivity = 18 µ-1m-1)
and autoclaved. If this was not possible, solutions were are prepared in autoclaved
high-purity H2O and then filter sterilized by filtration over a 0.22 µm filter.
Table 2.9 Stock solutions
Sr. No.
Solution Quantity Composition Recipe
1. 10 g/l bromophenol blue
10 ml 10g/l bromophenol
blue
Dissolved 100 mg bromophenol
in ~9 ml H2O. Added H2O to 10
ml.
2.
2 x assay buffer
400 ml
200 mM NaxH3-xP04
(pH 7.3)
2 mM MgCl2
100 mM α-
mercaptoethanol
1.33 mg/ml 2-
nitrophenyl-β-D-
galactopyranoside
177 ml 0.4 M Na2HPO4
23 ml 0.4 M NaH2PO4
0.8 ml 1 M MgCl2
2.8 ml β-mercaptoethanol
532 mg 2-nitrophenyl-β-D-
galactopyranoside. Added H2O to
400 ml and mixed. Stored in 50
ml aliquots at -20°C.
3.
Na2CO3, 1 M
500 ml
1 M Na2CO3
Dissolved 53.0 g Na2CO3 in ~400
ml H2O. Added H2O to 500 ml
4.
Tris·HCl (pH 6.8), 1 M
1 l
Tris·HCl (pH 6.8), 1
M
Dissolved 121.14 g Tris in ~800
ml H2O. Adjusted pH to 6.8 with
conc. HCl (~42 ml). Added H2O to
1 l. Autoclaved
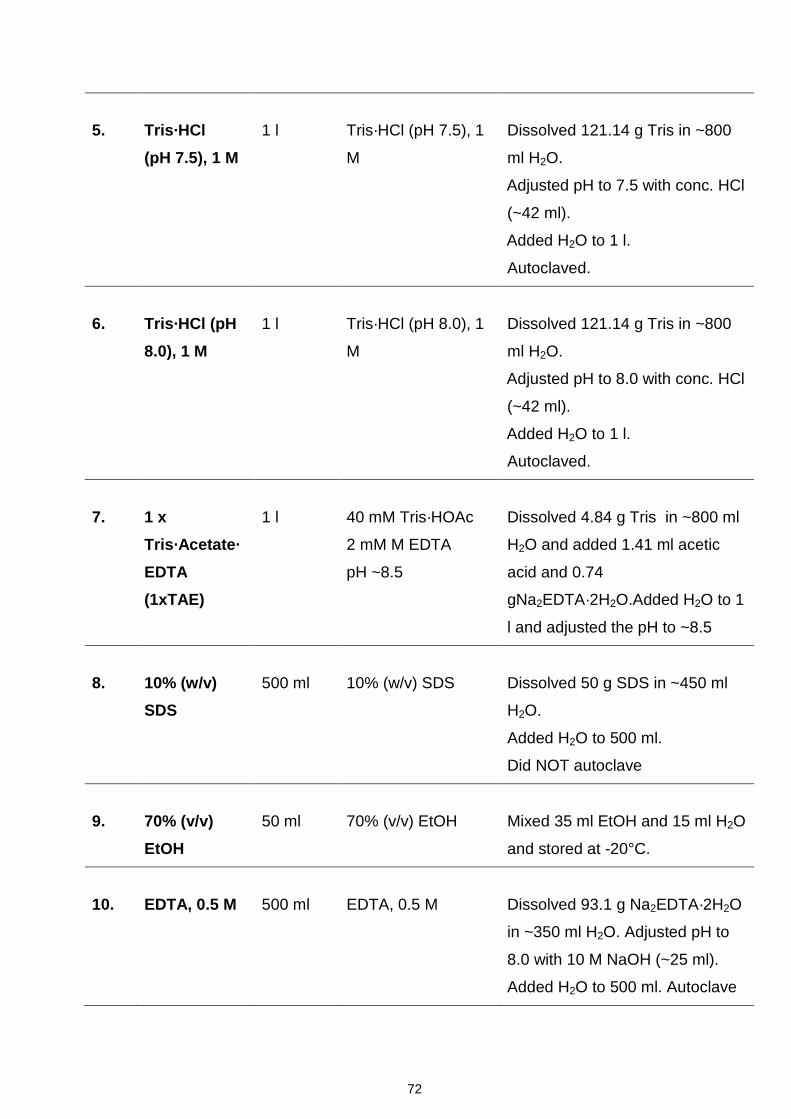
72
5.
Tris·HCl (pH 7.5), 1 M
1 l
Tris·HCl (pH 7.5), 1
M
Dissolved 121.14 g Tris in ~800
ml H2O.
Adjusted pH to 7.5 with conc. HCl
(~42 ml).
Added H2O to 1 l.
Autoclaved.
6.
Tris·HCl (pH 8.0), 1 M
1 l
Tris·HCl (pH 8.0), 1
M
Dissolved 121.14 g Tris in ~800
ml H2O.
Adjusted pH to 8.0 with conc. HCl
(~42 ml).
Added H2O to 1 l.
Autoclaved.
7.
1 x Tris·Acetate· EDTA (1xTAE)
1 l
40 mM Tris·HOAc
2 mM M EDTA
pH ~8.5
Dissolved 4.84 g Tris in ~800 ml
H2O and added 1.41 ml acetic
acid and 0.74
gNa2EDTA·2H2O.Added H2O to 1
l and adjusted the pH to ~8.5
8.
10% (w/v) SDS
500 ml
10% (w/v) SDS
Dissolved 50 g SDS in ~450 ml
H2O.
Added H2O to 500 ml.
Did NOT autoclave
9.
70% (v/v) EtOH
50 ml
70% (v/v) EtOH
Mixed 35 ml EtOH and 15 ml H2O
and stored at -20°C.
10.
EDTA, 0.5 M
500 ml
EDTA, 0.5 M
Dissolved 93.1 g Na2EDTA·2H2O
in ~350 ml H2O. Adjusted pH to
8.0 with 10 M NaOH (~25 ml).
Added H2O to 500 ml. Autoclave

73
11.
1 M LiOAc
250 ml
1 M LiOAc
25.50 g LiOAc·2H2O
Dissolved in ~200 ml H2O.
Added H2O to 250 ml.
Filter sterilized,
12.
5 M KOAc, pH 4.8
500 ml
5 M KOAc, pH 4.8
147.5 ml HOAc, add H2O to ~450
ml, adjusted pH to 4.8 w/ KOH
pellets while cooling in an
ice/H2O bath. Added H2O to 500
ml and autoclaved.
13.
10 x TE (pH 8.0)
4 l
100 mM Tris·HCl
(pH 8.0)
10 mM EDTA
400 ml 1 M Tris·HCl (pH 8.0)
80 ml 0.5 M EDTA
Added H2O to 4 l. Autoclaved
14.
MgCl2, 1 M
100 ml
Dissolved 20.33 g MgCl2·6 H2O in
~80 ml H2O. Added H2O to 100
ml. Autoclaved.
15.
5 M KOAc, pH 4.8
500 ml
5 M KOAc, pH 4.8
147.5 ml HOAc, added H2O to
~450 ml, adjusted pH to 4.8 w/
KOH pellets while cooling in an
ice/H2O bath. Added H2O to 500
ml and autoclaved.
16.
NaOH, 10 M
500 ml
10M NaOH
Dissolved 200 g NaOH in ~350
ml H2O.Solution gets very hot!
Stored in a polyethylene bottle

74
17.
10 x SDS-PAGE buffer
1 l
1.92 M glycine
0.248 M Tris
10 g/l SDS
144.13 g glycine
30.03 g Tris
10.00 g SDS
Add H2O to ~ 900 ml, stir until
completely dissolved, then add
H2O to 1 l.
18.
6 x SDS-PAGE sample buffer
10 ml
350 mM Tris·HCl,
pH 6.8
30% (v/v) glycerol
10% (w/v) SDS
0.5 g/l bromophenol
blue
2% (v/v) β-
mercaptoethanol
3.50 ml 1 M Tris·HCl
3.78 g glycerol
1.00 g SDS
500 μl 10 g/l bromophenol blue
200 μl β-mercaptoethanol
Add H2O to ~ 9 ml, dissolve over-
night if necessary. Add H2O to 10
ml.
19.
30% (v/v) glycerol
500 ml
30% (v/v) glycerol
189 g glycerol. Added H2O to
~400 ml, mixed well by stirring.
Added H2O to 500 ml and
autoclaved.
20.
50 mg/ml ampicillin
10 ml
50g/ml ampicillin
Dissolved 500 mg ampicillin in 10
ml sterile H2O.Filter sterilized.
Mixed and aliquoted in smaller
volumes.
21.
12.5 mg/ml Tetracycline
10 ml
12.5 mg/ml
Tetracycline
Dissolved 125 mg tetracycline in
sterile 10 ml of 70% ethanol.
Mixed and aliquoted in smaller
volumes.

75
2.6 Yeast and bacteriological media
Table 2.10 Liquid media for Escherichia coli
Medium Composition Quantity
Recipe
LB broth, Lennox
10 g/l tryptone
5 g/l yeast extract
5 g/l NaCl
1 l 20 g LB broth, Lennox
formulation
Added H2O to ~900 ml, stirred
until all solid haddissolved,
added H2O to 1 l, dispensed into
bottles and autoclaved.
1 x TSS 10 g/l tryptone
50 g/l yeast extract
5 g/l NaCl
100 g/l polyethylene glycol
3350
5% (v/v) DMSO
50 mM MgCl2
1 l Added 10 g tryptone, 50 g yeast
extract, 5 g Nacl, 100g
polyethylene glycol 3350, 50 ml
DMSO, 50 ml of 1M MgCl2 to
900 ml H2O. Adjusted the pH to
6.5 with HCl. Filter sterilized and
stored protected from light at
4°C

76
Table 2.11 Solidified media for Escherichia coli
Medium Composition Quantity
Recipe
LB agar, Lennox
10 g/l tryptone
5 g/l yeast extract
5 g/l NaCl
15 g/l agar
1 l 35 g LB agar, Lennox
formulation
Added 1 l H2O, mixed until
suspension is homogenous, and
autoclaved. Poured the plates.
Stored at 4°C after plates
solidified.
LB agar, Lennox + 100 µg/ml ampicillin
10 g/l tryptone
5 g/l yeast extract
5 g/l NaCl
15 g/l agar
100 µg/ml ampicillin
1 l 35 g LB agar, Lennox
formulation
Added 1 l H2O, stir until mixture
was homogenous and autocla-
ved. Allowed to cool down to
~55°C, added 2 ml 50 mg/ml
ampicillin, mixed, and poured
plates. Stored at 4°C for ≤ 2
weeks after plates had solidified.
LB agar, Lennox + 100 µg/ml ampicillin + 12.5 µg/ml tetracycline
10 g/l tryptone
5 g/l yeast extract
5 g/l NaCl
15 g/l agar
100 µg/ml ampicillin
12.5 µg/ml tetracycline
1 l 35 g LB agar, Lennox
formulation.
Added 1 l H2O, stirred until
mixture was homogenous and
autoclaved. Allowed to cool
down to ~55°C, added 2 ml 50
mg/ml ampicillin, 12.5 µl of 12.5
mg/ml tetracycline, mixed, and
poured plates. Stored at 4°C for

77
≤ 2 weeks after plates had
solidified.
LB agar, Lennox + 100 µM IPTG + 20 µg/ml X-Gal
10 g/l tryptone
5 g/l yeast extract
5 g/l NaCl
15 g/l agar
100 µM IPTG
1 l 35 g LB agar, Lennox
formulation
Added 1 l H2O, stir until mixture
was homogenous and autocla-
ved. Allowed to cool down to
~55°C, added 0.5 ml 40 mg/ml
X-gal, 1 ml 100 mM IPTG,
mixed, and poured plates.
Stored at 4°C in the dark after
plates had solidified.

78
Table 2.12 Liquid media for Saccharomyces cerevisiae
Medium Composition Quantity
Recipe
C-SPO medium
2% (w/v) KOAc
30 mg/l L-Tyr
20 mg/l adenine sulfate
20 mg/l uracil
20 mg/l L-His·HCl
20 mg/l L-Arg·HCl
20 mg/l L-Met
40 mg/l L-Trp
30 mg/l L-Lys·HCl
100 mg/l L-Leu3
50 mg/l L-Phe
5 mg/l myo-inositol
210 mg/l L-Thr
600
ml
12 g KOAc
18 mg L-Tyr
10 ml 1.2 g/l adenine sulfate
5 ml 2.4 g/l uracil
5 ml 2.4 g/l L-His·HCl1,2
5 ml 2.4 g/l L-Arg·HCl
5 ml 2.4 g/l L-Met
10 ml 2.4 g/l L-Trp1,2
5 ml 3.6 g/l L-Lys·HCl
10 ml 3.6 g/l L-Leu
10 ml 3.0 g/l L-Phe
500 μl 10 g/l myo-inositol
Added H2O to 580 ml, stirred
until all solid dissolved,
dispensed into bottles and auto-
claved. After the medium cooled
down to ~55°C added:
5.25 ml 24 g/l L-Thr2
All stock solutions were sterilized by autoclaving unless otherwise
indicated (note 2).
1) Stored stock solution at 4°C. Filter sterilized.
2) 100 mg/l L-Leu is specially for SK-1 strains. The usual concentration
is 30 mg/l L-Leu.
3) C-SPO dropout medium was made excluding the concerned amino
acid stocks.

79
PSP2 medium
0.67% (w/v) yeast nitrogen
base w/o amino acids
0.10% (w/v) bacto-yeast
extract
1% (w/v) KOAc
30 mg/l L-Tyr
50 mM K-phthalate (pH 5.0)
20 mg/l uracil
20 mg/l L-Arg·HCl
20 mg/l L-His·HCl
20 mg/l L-Met
20 mg/l L-Trp
30 mg/l L-Ile
30 mg/l L-Lys·HCl
150 mgl/ L-Val
375 mg/l L-Ser
20 mg/l adenine sulfate
50 mg/l L-Phe
100 mg/l L-Glu
100 mg/l L-Leu3
100 mg/l L-Asp
200 mg/l L-Thr
600
ml
4 g yeast nitrogen base w/o
amino acids
0.6 g bacto-yeast extract
6 g KOAc
18 mg L-Tyr Dissolve d 6.13 g K-phthalate in
~400 ml H2O, adjusted pH to 5.0
with KOH pellets
5 ml 2.4 g/l uracil
5 ml 2.4 g/l L-Arg·HCl
5 ml 2.4 g/l L-His·HCl1,2
5 ml 2.4 g/l L-Met
5 ml 2.4 g/l L-Trp1,2
5 ml 3.6 g/l L-Ile
5 ml 3.6 g/l L-Lys·HCl
5 ml 18 g/l L-Val
5 ml 45 g/l L-Ser
10 ml 1.2 g/l adenine sulfate
10 ml 3.0 g/l L-Phe
10 ml 6.0 g/l L-Glu
16.7 ml 3.6 g/l L-Leu
Added H2O to 580 ml, stirred
until all solid had dissolved,
dispensed into bottles and auto-
claved. After the medium did
cool down to ~55°C added:
15 ml 4.0 g/l L-Asp2
5 ml 24 g/l L-Thr2

80
SD medium
0.67% (w/v) yeast nitrogen
base w/o amino acids
2% (w/v) D-glucose
30 mg/l L-Tyr
20 mg/l uracil
20 mg/l L-Arg·HCl
20 mg/l L-His·HCl
20 mg/l L-Met
20 mg/l L-Trp
30 mg/l L-Ile
30 mg/l L-Lys·HCl
150 mg/l L-Val
375 mg/l L-Ser
20 mg/l adenine sulfate
50 mg/l L-Phe
100 mg/l L-Glu
100 mg/l L-Leu3
100 mg/l L-Asp
200 mg/l L-Thr
600
ml
4 g yeast nitrogen base w/o
amino acids
12 g D-glucose
18 mg L-Tyr
5 ml 2.4 g/l uracil
5 ml 2.4 g/l L-Arg·HCl
5 ml 2.4 g/l L-His·HCl1,2
5 ml 2.4 g/l L-Met
5 ml 2.4 g/l L-Trp1,2
5 ml 3.6 g/l L-Ile
5 ml 3.6 g/l L-Lys·HCl
5 ml 18 g/l L-Val
5 ml 45 g/l L-Ser
10 ml 1.2 g/l adenine sulfate
10 ml 3.0 g/l L-Phe
10 ml 6.0 g/l L-Glu
16.7 ml 3.6 g/l L-Leu
Added H2O to 580 ml, stirred
until all solid had dissolved,
dispensed into bottles and
autoclaved. After the medium
did cool down to ~55°C added:
15 ml 4.0 g/l L-Asp2
5 ml 24 g/l L-Thr2

81
YPAc broth 1% (w/v) bacto-yeast extract
2% (w/v) bacto-peptone
2% (w/v) KOAc
1. Dissolved 10 g bacto-yeast
extract, 20 g bacto-peptone,
and 20 g KOAc in ~800 ml
H2O.
2. Added H2O to 1 l and mixed.
Dispensed into bottles.
3. Autoclaved.
YPD broth 1% (w/v) bacto-yeast extract
2% (w/v) bacto-peptone
2% (w/v) D-glucose
1 l 1. Dissolved 50 g YPD broth
powder in ~800 ml H2O.
2. Added H2O to 1 l and mix.
3. Dispensed into bottles.
4. Autoclaved.
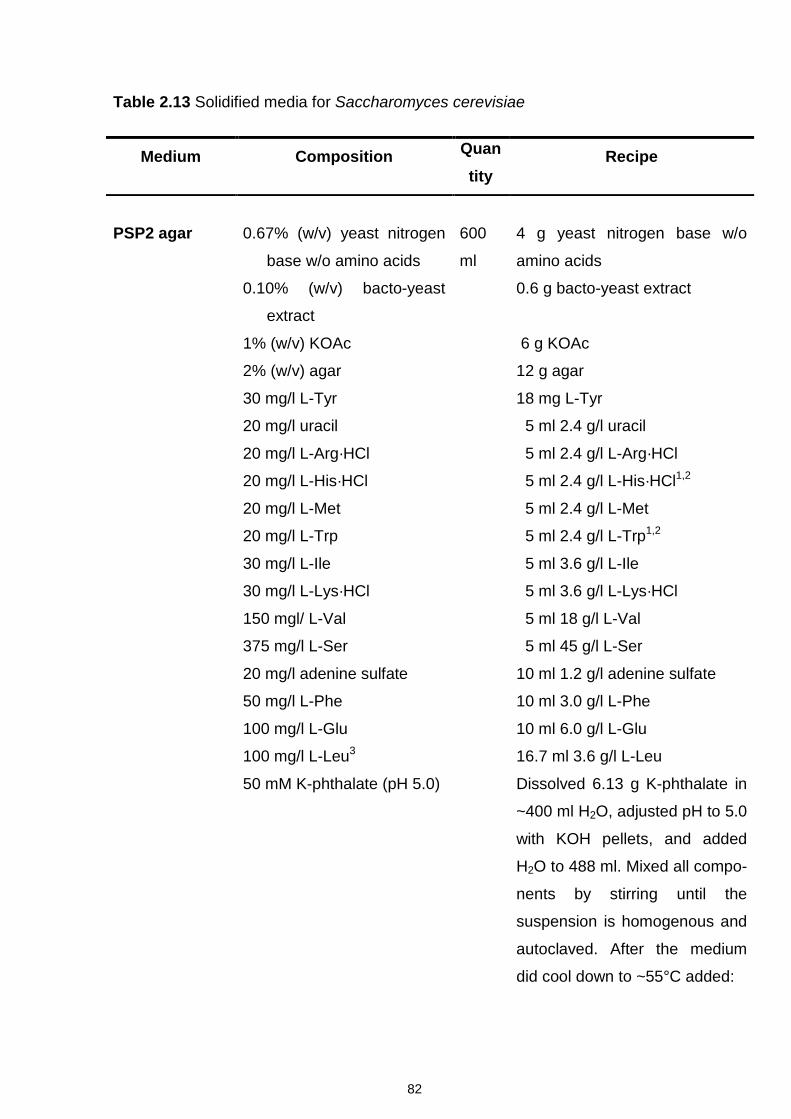
82
Table 2.13 Solidified media for Saccharomyces cerevisiae
Medium Composition Quantity
Recipe
PSP2 agar
0.67% (w/v) yeast nitrogen
base w/o amino acids
0.10% (w/v) bacto-yeast
extract
1% (w/v) KOAc
2% (w/v) agar
30 mg/l L-Tyr
20 mg/l uracil
20 mg/l L-Arg·HCl
20 mg/l L-His·HCl
20 mg/l L-Met
20 mg/l L-Trp
30 mg/l L-Ile
30 mg/l L-Lys·HCl
150 mgl/ L-Val
375 mg/l L-Ser
20 mg/l adenine sulfate
50 mg/l L-Phe
100 mg/l L-Glu
100 mg/l L-Leu3
50 mM K-phthalate (pH 5.0)
600
ml
4 g yeast nitrogen base w/o
amino acids
0.6 g bacto-yeast extract
6 g KOAc
12 g agar
18 mg L-Tyr
5 ml 2.4 g/l uracil
5 ml 2.4 g/l L-Arg·HCl
5 ml 2.4 g/l L-His·HCl1,2
5 ml 2.4 g/l L-Met
5 ml 2.4 g/l L-Trp1,2
5 ml 3.6 g/l L-Ile
5 ml 3.6 g/l L-Lys·HCl
5 ml 18 g/l L-Val
5 ml 45 g/l L-Ser
10 ml 1.2 g/l adenine sulfate
10 ml 3.0 g/l L-Phe
10 ml 6.0 g/l L-Glu
16.7 ml 3.6 g/l L-Leu
Dissolved 6.13 g K-phthalate in
~400 ml H2O, adjusted pH to 5.0
with KOH pellets, and added
H2O to 488 ml. Mixed all compo-
nents by stirring until the
suspension is homogenous and
autoclaved. After the medium
did cool down to ~55°C added:

83
100 mg/l L-Asp
200 mg/l L-Thr
15 ml 4.0 g/l L-Asp2
5 ml 24 g/l L-Thr2
Poured ~25 ml into one 90 mm
petri dish.
SD agar
0.67% (w/v) yeast nitrogen
base w/o amino acids
2% (w/v) D-glucose
2% (w/v) agar
30 mg/l L-Tyr
20 mg/l uracil
20 mg/l L-Arg·HCl
20 mg/l L-His·HCl
20 mg/l L-Met
20 mg/l L-Trp
30 mg/l L-Ile
30 mg/l L-Lys·HCl
150 mgl/ L-Val
375 mg/l L-Ser
20 mg/l adenine sulfate
50 mg/l L-Phe
100 mg/l L-Glu
100 mg/l L-Leu3
100 mg/l L-Asp
200 mg/l L-Thr
600
ml
4 g yeast nitrogen base w/o
amino acids
12 g D-glucose
12 g agar
18 mg L-Tyr
5 ml 2.4 g/l uracil
5 ml 2.4 g/l L-Arg·HCl
5 ml 2.4 g/l L-His·HCl1,2
5 ml 2.4 g/l L-Met
5 ml 2.4 g/l L-Trp1,2
5 ml 3.6 g/l L-Ile
5 ml 3.6 g/l L-Lys·HCl
5 ml 18 g/l L-Val
5 ml 45 g/l L-Ser
10 ml 1.2 g/l adenine sulfate
10 ml 3.0 g/l L-Phe
10 ml 6.0 g/l L-Glu
16.7 ml 3.6 g/l L-Leu
Added 488 ml H2O in a 1 l
Erlenmeyer flask, stirred until
the suspension is homogenous,
and autoclaved. After the
medium did cool down to ~55°C
added:
15 ml 4.0 g/l L-Asp2
5 ml 24 g/l L-Thr2
Poured ~25 ml into one 90 mm

84
petri dish.
SLA agar 0.17% (w/v) yeast nitrogen
base w/o amino acids and
w/o ammonium sulphate
2%(w/v)D-glucose/
Potassium acetate/
L-Lactate/
Pyruvate/Glycerol/Ethanol
2% (w/v) agar
5 mg/l uracil
5 mg/l L-Trp
5 mg/l L-Lys·HCl
5 mg/l L-Leu
50 µM Ammonium Sulfate
600 ml
1.02 g yeast nitrogen base w/o
amino acids w/o and ammonium
sulphate
12 g D-glucose/Potassium
acetate/L-Lactate/
Pyruvate/Glycerol/Ethanol
12 g agar
1.25 ml 2.4 g/l uracil
1.25 ml 2.4 g/l L-Trp
0.83 ml 3.6 g/l L-Lys·HCl
0.83 ml 3.6 g/l L-Leu
0.03 ml of 1 M (NH4)2SO4
Added H2O to make 600 ml in a
1 l Erlenmeyer flask, stirred until
the suspension is homogenous,
and autoclaved. Pour ~25 ml of
media into each petri dish and
allow to set.

85
YPAc agar
1% (w/v) bacto-yeast extract
2% (w/v) bacto-peptone
2% (w/v) KOAc
2% (w/v) agar
1 l 1. Added 1 l H2O to 10 g bacto-
yeast extract, 20 g bacto-
peptone, 20 g KOAc, and 20
g agar in a 2 l Erlenmeyer
flask.
2. Stirred until suspension is
homogenous.
3. Autoclaved.
4. Allowed solution to cool to
~55°C.
5. Poured ~25 ml into one 90
mm Petri dish.
YPD agar
1% (w/v) bacto-yeast extract
2% (w/v) bacto-peptone
2% (w/v) D-glucose
1.5% (w/v) agar
1 l 1. Added 1 l H2O to 65 g YPD
agar powder in a 2 l
Erlenmeyer flask.
2. Stirred until suspension is
homogenous.
3. Autoclaved.
4. Allowed solution to cool to
~55°C.
5. Poured ~25 ml into one 90
mm Petri dish.
YPD + 1 mg/ml hygromycin B agar
1% (w/v) bacto-yeast extract
2% (w/v) bacto-peptone
2% (w/v) D-glucose
1.5% (w/v) agar
600 µg/ml hygromycin B
1 l 1. Added 1 l H2O to 65 g YPD
agar powder in a 2 l
Erlenmeyer flask.
2. Stirred until suspension is
homogenous.
3. Autoclaved.
4. Allowed solution to cool to
~55°C.
5. Added 20 ml 50 mg/ml

86
hygromycin B (filter
sterilized) and mixed.
6. Poured ~25 ml into one 90
mm Petri dish.
YPD + 50 µg/ml X-Gal agar
1% (w/v) bacto-yeast extract
2% (w/v) bacto-peptone
2% (w/v) D-glucose
1.5% (w/v) agar
50 µg/ml X-Gal
0.1 M NaxH3-xPO4 (pH 7.0)
1 l 1. Added 900 ml H2O to 65 g
YPD agar powder in a 2 l
Erlenmeyer flask.
2. Stirred until suspension is
homogenous.
3. Autoclaved.
4. Allowed solution to cool to
~80°C.
5. Added 100 ml 1 M NaxH3-
xPO4 (pH 7.0), 1.25 ml 40
mg/ml X-Gal, and mixed.
6. Poured ~25 ml into one 90
mm Petri dish.

87
2.7 Protocols
2.7.1 Microbiology
2.7.1.1 S. cerevisiae cell culture
Protocol: A pair of forceps was dipped in ethanol and passed briefly through Bunsen
burner. A single isolated S. cerevisiae colony was picked up with tip of the toothpick
using forceps from an appropriate agar plate and was aseptically inoculated to 14ml
sterile tube containing 2-4 ml appropriate medium. The tubes were then incubated in
incubator shaker at 30ºC until saturation (generally 2-3 days). The tubes were
removed from the incubator and vortexed to resuspend cells. 50 μl cell suspension
and 450 μl of medium used to grow the overnight cultures were added to semi-micro
cuvette and mixed. This is 1:10 dilution of original grown culture. Using 500 μl of
medium as blank for spectrophotometer, the absorbance at A600 of 1:10 diluted
culture was determined. A600 readings are linear up to A600 ~0.6. If A600 was more 0.6,
sample was diluted 10-fold or higher. Appropriate medium was added to sterile
Erlenmeyer flasks with at least twice as big size as the intended culture volume
working under aseptic conditions. S. cerevisiae cultures grown in medium
supplemented with acetate as carbon source were grown in Erlenmeyer flasks with
baffles for better aeration and agitation. The amount of inoculum to be added was
calculated as the amount required to yield A600 ~0.01. From 14ml culture tubes with
yeast culture, the calculated culture was added to flasks. The flasks were placed into
a shaker incubator with shaking at 225 – 250 rpm at 30ºC overnight. The growth of
the culture was monitored at regular intervals once visible growth was seen after 12-
24 h by removing 500 μl and pipeting into a disposable semi-micro cuvette and
determining the A600 of the sample. Cultures grown in YPD were monitored at
intervals of 1.5-2 h and PSP2, SD or YPAc grown cultures were monitored every 2-4
h. When the yeast culture achieved A600 between 0.3 – 0.6, this was considered as
exponential growth phase.
Reference: (Treco and Winston, 1997)

88
2.7.1.2 Yeast Culture Sample Collection
Protocol: Yeast culture to be sampled was transferred into an ice-cold 15 or 50 ml
centrifuge tube. Approximately ~20 ml of culture volume was collected for β-
galactosidase reporter assays. The sample volume for yeast strains expressing
URS1-CYC1-Ub-x-lacZ reporters with ‘x’ as Arg or Leu was ~50 ml. The tubes were
centrifuged at 3000 rpm, 4°C for 2 min to sediment the cells. The supernatant was
discarded and the cells were frozen in liquid nitrogen and stored in a -20°C or -80°C
freezer for longer periods.
Reference: (Treco and Winston, 1997)
2.7.1.3 Frozen Yeast Stock Cultures Reagents:
• Freshly grown yeast culture in YPD broth or SD medium. Yeast nitrogen
base without amino acids from Formedium has been specifically used to
make the SD medium for the purposes of making frozen stocks.
Protocol: The cryotubes were labelled with strain name and date using an ethanol
resistant pen or the labelling system. 1 ml 30% (v/v) glycerol was dispensed into
each cryotube. The cells grown were resuspended by briefly vortexing and pipetted 1
ml cell suspension into the appropriate cryotube. The frozen stocks were made in
duplicates for each strain or clone. The cryotubes were closed tightly and mixed by
inverting and placing the tube into an ethanol/dry ice bath or into liquid nitrogen.
Once the culture is frozen, the cryotubes were placed into a cryobox in a -70°C
freezer.
Reference: (Treco and Lundblad, 1993)
2.7.1.4 E. coli cell culture
Protocol: A pair of forceps was dipped in ethanol and passed briefly through Bunsen
burner. A single E. coli colony from an appropriate agar plate was picked up using
forceps and toothpick. Toothpick was aseptically added to 14ml sterile tube
containing 2-3 ml LB medium supplemented with appropriate antibiotics to inoculate

89
the culture. The tubes were then incubated in incubator shaker at 37ºC overnight or
16 h. These cultures were used for plasmid minipreparation or for inoculating larger
volumes of culture for maxipreparation. The overnight grown culture was diluted
1:100 into the new medium (For poorly replicated plasmids inoculum was washed
three times with 1 ml H2O). Appropriate medium was added to sterile Erlenmeyer
flasks under aseptic conditions. The final flasks for growth were at least twice as big
size as the intended culture volume. The flasks were placed into a shaker incubator
with shaking at 225 – 250 rpm at 37ºC overnight. The growth of the culture was
monitored by removing 500 μl every 30 mins (LB broth cultures) and pipeting into a
disposable semi-micro cuvette and determining the A600 of the sample.
Appropriate antibiotics added to LB broth as follows:
Antibiotic Stock solution Working concentration Dilution
ampicillin 100 mg/ml in H2O 100 µg/ml 1:1000
tetracycline 12.5 mg/ml in 12.5 µg/ml 1:1000
Reference: (Elbing and Brent, 2002)
2.7.1.5 Frozen E. coli Stock Cultures
Protocol: A single colony was picked up to inoculate 3 ml LB broth containing
appropriate antibiotics and incubated at the 37ºC temperature overnight with shaking
at 220 rpm until it reaches an A600 nm of ~0.5. The cryotubes were labelled with strain
name and the day’s date using an ethanol resistant pen or using the labelling system.
0.5 ml 30% (v/v) glycerol was dispensed into each cryotube. The cells were
resuspended by briefly vortexing and 1.375 ml of cell suspension was pipetted into
the appropriate cryotube. The frozen stocks were made in duplicate for each strain or
clone. The cryotube was closed tightly, mixed by inverting and placed into an
ehanol/dry ice bath or into liquid nitrogen. Once the culture was frozen the cryotubes
were placed into a cryobox in -70°C freezer.
Reference: (Elbing and Brent, 2002)

90
2.7.2 Yeast genetics
2.7.2.1 Mating of Yeast Strains
Protocol: Two haploid strains of opposite mating type were cross streaked on a YPD
plate. Each parental strain was streaked as controls as shown in Fig 2.1. The plates
were incubated overnight at 30°C. The master plate with controls and mated strains
was replica plated to a selective plate that selects for growth of the diploid strain. The
plate was then incubated at 30°C until patches are grown (2-3 days). Patches for
single colonies were streaked on a selective plate that selects for growth of the
diploid strain and against growth of the two haploid strains. Around 6-8 isolated
colonies were tested for growth on non-fermentable carbon sources by streaking a
small fraction of the colony on YPAc plate. The YPAc plates were incubated for 1 - 3
days at 30°C and scored streaks for growth. The colonies showing strong growth on
the YPAc plate were selected for further processing.
Figure 2.1. Mating of haploid yeast strains by crossing of patches on a YPD
Reference: (Treco and Winston, 1997)
2.7.2.2 Random Spore Isolation
Protocol
Spore dissection: 1 ml YPD broth was inoculated with cells from one isolated colony
of a diploid a/α yeast strain and incubated with shaking (~250 rpm) at 30°C until cells
have grown to saturation (1-2 d). 4 ml YPAc broth was inoculated with 40 μl of the
saturated YPD culture and grown with shaking (~250 rpm) at 30°C until cells had
grown to saturation (~2 d). The cells were collected by centrifugation for 2 min at
3000 rpm and RT and the supernatant was discarded. The pellet was washed by
a
α
a/αa
α
a/α

91
addition of 4 ml H2O and resuspending cells by vortexing, and collect cells by
centrifugation as earlier. These cells were resuspended in 4 ml C-SPO medium by
vortexing and incubated with shaking (~250 rpm) at 30°C for 3 – 5 d to sporulate the
yeast cells. The cells were collected by centrifugation as earlier and resuspended in 1
ml H2O by vortexing, and transferred to a 1.5 ml microcentrifuge tube. The cells were
collected by centrifugation for 10 – 15 s at 12,000 g and supernatant was aspirated.
The pellet were resuspended in 90 μl H2O. 10 μl glusulase was added to this tube
and mixed well and incubate for 30 min at 30°C. The cell wall digestion was
terminated by addition of 1 ml H2O. The tube was centrifuged for 10 – 15 s to collect
cells and supernatant was discarded. Cells were washed once with 1 ml H2O and
resuspended in 0.1 ml H2O by vortexing the cell suspension at maximum speed for 2
min. Cell suspension was completely pipetted out, 1 ml H2O was added, vortexed at
maximum speed for 10 s, and pipetted out the H2O. This step was repeated twice.
0.01% (v/v) NP-40 was added and vortexed at maximum speed for 10 s. Cell
suspension was sonicated in an ice/H2O bath for 10 s at 150 W and incubated for 1
min on ice to dissipate heat. This step was repeated five times. 10 μl cell suspension
was counted in a haemocytometer to ascertain number of cells per ml. Based on the
cell count 10, 100, 1,000, and 10,000 cells were plated onto five agar plates each
(YPD agar plates or selective plates). The plates were incubated at 30°C until
colonies are grown (2-3 d). Only well separated colonies on the plate were processed
further.
Determination of spore genotype
The plates with well separated colonies were replica plated on YPAc agar plate to
screen for growth on non-fermentable carbon sources and on selective plates to
screen for particular genotypes. The plates were then incubated at 30°C until
colonies were grown. If desired, regrow master plate by incubating at 30°C. The
colonies that didn’t grow on acetate were discarded. 3-4 times (in multiples of 48)
more colonies were streaked for single colonies on YPD agar plates than genotypes
that were generated by sporulation of the diploid strain. The plates were then
incubated at 30°C until colonies are grown (~2 days). Individual patches were made
on a YPD agar plate. Parental haploid strains that were used to construct the diploid
strain were patched as controls. The plates were then incubated at 30°C until
patches were grown (~2 days). These patches were replica plated to YPAc agar

92
plates and selective plates to determine genotypes based on growth assays for
metabolic and drug resistance markers. Mating type was tested by colony PCR
analysis. Growth was monitored regularly and growth was recorded.
Reference: (Spencer and Spencer, 1996)
2.7.3 Cell Biology
2.7.3.1 Pseudohyphal growth assays Protocol: Desired freshly grown diploid cells grown on appropriate plates were taken
with a inoculating loop working aseptically. This loop full of yeast cells was streaked
onto synthetic low ammonium (SLA) medium plates to obtain single colonies. SLA
plates contained 2% of indicated carbon source. The streaking was done taking care
not to scratch the agar surface. The plates were then incubated at 30°C and
pseudohyphal growth was observed regularly after ~2d. At least ten colonies were
photographed for each plate with an inverted microscope at magnification of 40-100x.
Reference: (Schröder et al., 2000)
2.7.3.2 Construction of Petit mutants Protocol: 2 ml YPD broth was supplemented with 10 µg/ml of ethidium bromide
working aseptically. A single colony of desired yeast strain to construct petit mutant
was inoculated in the tube from previous step and incubated o/n at 30°C in incubator
shaker. The culture from this tube was streaked to get isolated colonies YPD plates.
YPD plates were incubated 30°C until the colonies form. The YPD plate with isolated
colonies was replica plated on YPAc plate. The colonies unable to grow on YPAc
plate were chosen and streaked for single colonies. These colonies were tested once
again on YPAc plate and used for further experiments.
Reference: (Fox et al., 1991)

93
2.7.3.3 Induction of Expression from Glucocorticoid Response Elements (GRE) in S. cerevisiae
Reagents
• Exponentially growing yeast culture transformed with an empty GRE expression
vector or an GRE expression vector controlling expression of your desired protein
and a vector expressing the rat glucocorticoid receptor
• 100 mM deoxycorticosterone (DOC) in EtOH, filter sterilised, stored at -20°C
Protocol: Exponentially growing untreated culture was taken as 0 h sample working
aseptically close to the flame of a Bunsen burner. Approximately ~10 ml culture was
removed for β-galactosidase assays. The cells were collected by centrifugation at
3000 rpm, 4°C for 2 min and placed tubes on ice. The supernatant was decanted and
the tubes containing pellet was frozen in liquid nitrogen and stored at -20°C or -80°C.
The remaining exponentially growing yeast culture was split into the desired number
of cultures in Erlenmeyer flasks working close to the flame of a Bunsen burner. The
expression was induced by adding 1 – 100 μM DOC depending on the experiment.
The flasks were returned into the shaker and the cultures were incubated at 30°C,
225-250 rpm for 0.25 – 4 h (as desired). Samples were collected as described in
protocol 2.7.1.2.
Reference: (Schena et al., 1991)
2.7.4 Protein Biochemistry
2.7.4.1 Protein Extraction for β-Galactosidase Assays
Reagents:
• 10-20 ml yeast culture samples were washed and stored in 2ml
screw cap tubes. Samples were stored at -20°C.
• 5 x Reporter Lysis Buffer was stored at RT
• Roche Complete Protease Inhibitor (RPI) tablets

94
• 1 x RLB + RPI, ice-cold, made fresh. To make fresh added 4 Vol. H2O to 1 Vol. 5
x RLB, mixed and placed on ice. One Roche Complete Protease Inhibitor tablet
was added to 50 ml of 1 x RLB
• Glass beads, Ø = 0.5 mm
Protocol: The yeast culture samples were thawed at RT and placed on ice. 400 μl
ice-cold 1 x RLB + RPI were added to a 2.0 ml flat bottom microcentrifuge tube
containing the cell pellet and the cells were resuspended by vortexing. To this ~150
mg glass beads were added and the cells and glass beads were vortexed briefly at
maximum speed and placed on ice. The tubes were then placed into the Precellys 24
Instrument and cells homogenized with two 30 second cycles of 6, 500 rpm at 4°C.
Then the glass beads and cell debris were sedimented for 2 min at 12000 g, 4°C and
the supernatant transferred into a labelled fresh tube. The tubes containing the cell
lysates were centrifuged once again for 2 min at 12000g, 4°C. Finally the samples
were stored on ice or in a fridge while performing β-galactosidase assays and protein
assays.
2.7.4.2 β-Galactosidase Assay
Reagents:
• Protein samples
• 5 x Reporter Lysis Buffer, stored at RT
• 1 x RLB + RPI, ice cold. Made fresh by adding 4 Vol. H2O to 1 Vol. 5 x RLB,
mixed and placed on ice. One Roche Complete Protease Inhibitor tablet was
added to 50ml of 1 x RLB.
• Roche Complete Protease Inhibitor (RPI) tablets
• 2 x assay buffer
• 1 U/μl β-galactosidase
• 1 M Na2CO3

95
Protocol:
β-galactosidase standard: 1 μl 1 U/μl β-galactosidase was added to 99 μl ice-cold 1
x RLB+RPI in a tube. The contents of the tube were mixed and tube was stored on
ice. 10 μl of this 1:100 dilution (10 mU/ μl β-galactosidase) was added to 990 μl ice-
cold 1 x RLB in a new tube and mixed. The tube was then placed on ice. The
standards were pipetted into the wells of a 96 well microtiter plate as outlined in the
following table. Each standard concentration was prepared in duplicates. 1 x RLB +
RPI was used to make these dilutions.
β-galactosidase standard [mU/50 μl]
Volume of 0.1 mU/μl β-galactosidase solution
(step 2)
Volume of 1 x RLB
0.0 0 μl 50 μl
1.0 10 μl 40 μl
2.0 20 μl 30 μl
3.0 30 μl 20 μl
4.0 40 μl 10 μl
5.0 50 l 0μl
The protein samples were diluted into the linear range of the β-galactosidase
standard using 1 x RLB + RPI. Dilutions up to 50-fold were directly prepared in the
wells of the microtiter plate, higher dilutions were prepared in 1.5 ml microcentrifuge
tubes and 50 μl of the dilution was added to a well of the microtiter plate.
β-galactosidase activity was determined in all samples at least in duplicate. 50 μl of 2
x assay buffer was added to each well. The plate was covered with parafilm and
incubated at 37°C for 30 min. The reaction was stopped by adding 150 μl 1 M
Na2CO3. Air bubbles were removed before reading the absorbance of the samples at
405 – 420 nm in a microtiter plate reader. A wavelength of 340 nm was used as a
reference wavelength.
Reference: (Miller, 1972; Rosenthal, 1987)

96
2.7.4.3 Protein Assay for β-galactosidase assay
Reagents:
• Protein samples were kept on ice.
• Reagent A (Bio-Rad DC Protein Assay)
• Reagent B (Bio-Rad DC Protein Assay)
• Bovine serum albumin (BSA) standard
Protocol: The protein samples were diluted 1:5 or 1:2 in H2O. 5 µl sample, standard
including the blank, and buffer control were pipetted into a clean, dry microtiter plate.
For all samples, blanks, buffer controls, and standards at least two replicates were
prepared. The buffer control was 1 x RLB + RPI diluted 1:5 or 1:2 in H2O. 25 µl
reagent A and 200 µl reagent B were added into each well using a multichannel
pipette and incubated at RT for 15 min with gentle shaking at 50 rpm on an orbital
shaker and the absorbance was read at 750 nm in a microplate reader.
Reference: (Lowry et al., 1951)
2.7.5 Molecular Biology
2.7.5.1 Polymerase Chain Reaction (PCR) Reagents:
• DNA template: 5ng/μl plasmid DNA
• 10 x Pfu DNA polymerase buffer w/o MgCl2
• 2 mM dNTPs
• 25 mM MgCl2
• Pfu DNA polymerase (2.5 U/µl)
• Primers (100 µM)
Protocol: For a 10 μl analytical (PCR) mix the following:
1.0 μl 10 x Pfu DNA polymerase buffer w/o MgCl2
1.0 μl 2 mM dNTPs

97
x μl 25 mM MgCl2 (0.5 – 6.0 mM)
0.1 μl primer 1
0.1 μl primer 2
0.2 μl Pfu DNA polymerase
1.0 μl Template
6.6 - x μl H2O
10 μl Total
Remarks:For ‘N’ reactions, (N+2)10 μl was prepared, premix, mixed, and suspended
into individual tubes. For preparative PCRs, 1 μl 5 U/μl Pfu DNA polymerase was
used in 100 μl final volume.
Reference: (Kramer and Coen, 2001)
2.7.5.2 DNA agarose gel electrophoresis Reagents:
• DNA molecular weight marker/DNA mass standard
• 10 x DNA sample loading buffer: 20% (w/v) Ficoll 400 0.1 M NA2EDTA, pH 8.0
1% (w/v) SDS 0.25% bromophenol blue 0.25% xylene cyanol
Protocol: An adequate volume of 1 x TAE was prepared to fill the electrophoresis
tank and to prepare the gel. The desired amount of electrophoresis-grade agarose
was added into an Erlenmeyer flask and appropriate volume of 1 x TAE was added
for pouring the gel. The agarose was melted in a microwave oven at the highest
power setting for 1 – 5 min, swirling every ~30 to 60 s to ensure even mixing and to
avoid boiling over of the agarose solution. The agarose solution was then cooled
down to 55°C. Ethidium bromide was added to the concentration of 0.5 µg/ml to
agarose solution and the contents were mixed by swirling. The gel casting platform

98
was sealed either using a tape or placing in the slot in the electrophoresis tank
designed to cast gels. The melted agarose was poured into the casting platform and
the gel comb was inserted making sure that no bubbles are trapped underneath the
combs and all bubbles on the surface of the agarose are removed before the gel
sets. After the gel had solidified the casting platform was removed to open the sealed
ends and the gel comb was removed taking care not to tear the sample wells. The
gel casting platform containing the set gel was placed into the electrophoresis tank. 1
x TAE was added to cover the gel to a depth of about 1 mm (or just until the tops of
the wells are submerged). The DNA samples were prepared in a 1.5 ml
microcentrifuge tube as follows:
x µl DNA sample
(0.9·z – x) µl H2O
(0.1·z) µl 10 x DNA sample loading buffer
z µl total (z ≤ well volume)
Using a pipette the samples were loaded into the wells. An appropriate DNA
molecular weight marker was also included in the gel run. The leads were attached to
the power supply unit and the other end placed on top of the electrophoresis tank so
that the DNA will migrate into the gel toward the anode or positive lead. The voltage
was set to the desired level, typically 1 to 5 V/cm of gel, to begin electrophoresis. The
progress of the separation was monitored by the migration of the dyes in the loading
buffer. The electrophoresis was continued until the dye front reached 70 % of the gel
length or to achieve desired resolution of bands. The power supply was turned off
and visualized the DNA by placing the gel onto a UV light source (λ = 254nm).
Reference: (Voytas, 2000)
2.7.5.3 Restriction Endonuclease Digestion
Protocol: The reaction mixture was prepared as per the table below in a 1.5 ml
microcentrifuge tube:

99
0.9 z – x -y µl H2O
x µl DNA solution,
0.1 z µl 10 x restriction endonuclease buffer
y µl restriction endonuclease in 50% (v/v) glycerol
z µl Total
Remarks:
• For digests with several restriction endonucleases: y = Σyi.
• The maximum for y is 0.1 z (ymax = 0.1 z)
• z is usually defined by the size of the wells of the agarose gel. Otherwise, z =
20 µl or z = 100 µl.
The tubes were mixed well by flipping (not vortexing) and briefly centrifuged in a
microcentrifuge to collect all liquid at the bottom of the tube. The tubes were then
incubated at the desired temperature for the desired time.
Reference: (Bloch and Grossmann, 1995)
2.7.5.4 Dephosphorylation of DNA 5’ termini with calf intestinal alkaline phosphatase (CIAP)
Protocol: The amount of DNA ends [in picomoles] that had to be dephosphorylated
was calculated. Calf intestine alkaline protease (CIAP) was diluted for immediate use
in 1 x CIAP reaction buffer to a final concentration of 0.01 U/μl. Each picomole of
DNA ends will require 0.01 U CIAP.
The reaction mixture was made in a 1.5 ml microcentrifuge tube as follows:
X µl DNA (up to 10 picomoles)
5 µl 10 x CIAP reaction buffer
X µl 0.01 U/μl CIAP
45 – 2 x µl H2O
50 µl Total
The tubes were mixed well by flipping (not vortexing) and briefly centrifuged in a
microcentrifuge to collect all liquid at the bottom of the tube. The tubes were then

100
incubated at 37°C for 30 min and an additional x μl 0.01 U/μl CIAP was added and
incubated further for 30 min at 37°C. 300 μl 10 mM Tris·HCl (pH 7.5), 200 mM NaCl,
1 mM EDTA, 0.5% (w/v) SDS was added to stop the reaction. The preparation was
subjected to phenol: CHCl3 extraction and purified the DNA using a spin column.
Reference: (Tabor, 1987)
2.7.5.5 DNA Ligation with T4 DNA ligase
Protocol:
Ligation of 5’ and 3’ overhanging ends
The ligations were set-up on the basis of guidelines as below: Use 50 ng vector DNA
and an 1:1 – 1:3 molar ratio of vector to insert DNA. The following mix was added
into a 1.5 ml microcentrifuge tube:
X µl vector DNA (50 ng)
Y µl insert DNA (1:1 – 1:3 molar ratio vector:insert)
1 µl 10 x T4 DNA ligase buffer
0.2 µl 5 Weiss-U/μl T4 DNA ligase
8.8 – x - y µl H2O
10 µl Total
The tubes were mixed well by flipping (not vortexing) the tube and briefly centrifuged
in a microcentrifuge to collect all liquid at the bottom of the tube. The tubes were then
incubated at 16°C for ≥ 16 h and stored at 4°C. The ligation mixture was transformed
into E. coli by chemical transformation or after purification by electroporation.
Reference: (Cherepanov and de Vries, 2001; Rossi et al., 1997)
2.7.5.6 Plasmid DNA miniprep from E. Coli
Protocol: 1.5 ml of a saturated overnight E. coli culture was transferred into a 1.5 ml
microcentrifuge tube. The remainder of the culture was stored at 4°C. The cells were
collected by centrifugation for 1 min at 14,000 g, RT and the supernatant aspirated.

101
The tubes were centrifuged again for 1 min at 14,000 g, RT and supernatant was
aspirated. 100 μl 50 mM D-Glc, 25 mM Tris·HCl (pH 8.0), 10 mM EDTA was added
and the cells were resuspended by vortexing or pipetting up and down. The tubes
were incubated for 5 min at RT. Then added 200 μl 0.2 N NaOH, 1% (w/v) SDS and
mixed by inverting tubes 4-6 times and incubated on ice for 5 min. 150 μl ice-cold 5
M KOAc (pH 4.8) was added and mixed by inverting tubes 4 - 6 times and incubated
for 5 min on ice. This was followed by centrifugation for 3 min at 14,000 g, 4°C and
transferred the supernatant into a new microcentrifuge tube. 0.8 ml ethanol were
added and mixed by inverting the tubes 2-3 times. The tubes were then incubated at
RT for 2 min or stored at - 20°C. The tubes were then centrifuged for 1 min at 14,000
g, RT and the supernatant was discarded. 1 ml 70% ethanol, was added to the tubes
and centrifuged for 1 min at 14,000 g, RT. The supernatant was discarded by
aspiration or inverting the tube and centrifuged again briefly to collect the remaining
liquid at the bottom. The residual 70% ethanol was pipetted out and the pellets were
dried in air for 5 min at RT. The pellets were resuspended in 30 μl 1 x TE (pH 8.0),
0.3 mg/ml RNase A and incubated at 4°C until pellets are dissolved (~0.5 - 1 h).
Reference: (Sambrook, 1989)
2.7.5.7 Plasmid Midiprep: GenElute™ High Performance (HP) Plasmid Midiprep Kit (Sigma-Aldrich)
Protocol: The kit was stored at room temperature. Once the RNase A solution was added to
the resuspension solution it was stored at 2 to 8°C. The neutralization solution was
also stored at 2 to 8 °C. The reagents were mixed thoroughly and examined for
precipitation. If any reagent formed a precipitate upon storage, it was warmed at 55-
65°C until the precipitate dissolved and was cooled down to room temperature before
use. The resuspension solution was prepared by adding 750 μl RNase A provided in
the kit and stored at 4°C. Wash solution 2 was diluted with 120 ml of 95-100%
ethanol prior to initial use. A single colony was inoculated in 2 ml LB broth with
appropriate antibiotics and incubated overnight at 37oC to prepare the preculture. 50
ml of LB broth containing appropriate antibiotic was inoculated from the preculture at
a dilution of 1:200 to 1:500 and incubated overnight at 37oC. The cells from 50 ml

102
overnight grown culture were harvested by centrifugation at 5,000 x g for 10 min and
the supernatant was discarded. All steps were carried out at room temperature. The
cells were resuspended in 4 ml of resuspension solution by pipetting up and down, or
vortexing to make sure that the cells are resuspended. The resuspended cells were
lysed by adding 4 ml of the lysis solution and immediately mixing the contents by
gently inverting 6 to 8 times and letting the mixture sit for 3 to 5 min until it became
clear and viscous. The lysis was not prolonged more than 5 min. A filter syringe was
prepared by removing the plunger and placing the barrel in a rack to keep the syringe
barrel upright. The lysed cells were neutralized by adding 4 ml of chilled
neutralization solution and gently inverted 4 to 6 times. A white aggregate (cell
debris, proteins, lipids, SDS, and chromosomal DNA) was formed to which 3 ml of
binding solution was added and inverted 1 to 2 times. The lysate was immediately
poured into the barrel of the filter syringe and sit for 5 min. Meanwhile a binding
column was placed into a collection tube provided and 4 ml of column preparation
solution was added to the column and spun in a swinging bucket rotor at 3,000 x g
for 2 min. The eluate was discarded. The content of the filter syringe barrel was
emptied into the binding column by gently inserting the plunger to expel half of the
cleared lysate into the column. The plunger was pulled back slightly to stop the flow
of the remaining lysate. The column assembly was spun in a swinging bucket rotor at
3,000 x g for 2 min and the eluate discarded. The rest of the cleared lysate was
added to the column and spun at 3,000 x g for 2 min. 4 ml of wash solution 1 was
added to the column and spun in a swinging bucket rotor at 3,000 x g for 2 min. The
eluate was discarded. 4 ml of wash solution 2 was added to the column and spun in
a swinging bucket rotor at 3,000 x g for 5 min. The binding column was transferred to
a new collection tube and 1 ml of elution solution was added to the column and was
kept at RT for 5 min. The column assembly was centrifuged in a swinging bucket
rotor at 3,000 x g for 5 min to recover the plasmid. The plasmid DNA present in the
eluate was concentrated by ethanol precipitation. The plasmid solution was
transferred to tubes that can withstand ≥15,000 x g. 0.1 volume of 3.0 M sodium
acetate, pH 5.2, and 2.5 volume of 95-100 % ethanol was added to the plasmid
solution and mixed well by inversion and incubated at -70oC for ≥ 30min. The tubes
were centrifuged at ≥15,000 x g at 4°C for 30 min and the supernatant was decanted,
being careful not to disturb the pellet. The pellet was rinsed with 1.5 ml of 70%
ethanol and centrifuged as before for 10 min. The supernatant was carefully

103
decanted and the pellet was dried until the residual ethanol evaporated. The DNA
pellet was resuspended in 100 µl of 1 x TE (pH 8.0) and stored in refrigerator.
Reference: (Birnboim and Doly, 1979; Vogelstein and Gillespie, 1979)
2.5.7.8 Promega Wizard® SV Gel and PCR Clean-Up System
Protocol:
For DNA extraction from agarose gels: The membrane wash solution was
prepared by adding the suggested volume of 95% ethanol to the membrane wash
solution prior to beginning the procedure. For DNA extraction from agarose gels the
gel slice containing the DNA was weighted and mixed in the membrane binding
solution at a ratio of 10μl of solution per 10 mg of agarose gel slice. The mixture was
vortexed and incubated at 65°C for 10 min or until the gel slice is completely
dissolved. The tube was vortexed every few min to increase the rate of melting the
agarose gel. The tubes were centrifuged briefly at room temperature to ensure the
contents are at the bottom of the tube.
For cleaning plasmid preparation and PCR amplification products: The plasmid
preparation or amplified PCR product was added to an equal volume of membrane
binding solution
DNA Purification: One SV minicolumn was placed in one collection tube for each
purification reaction. The mixture of membrane binding solution with gel slice/plasmid
solution/PCR product (prepared as described above) was added to the SV
minicolumn assembly and incubated for 2 min at room temperature. The SV
minicolumn assembly was centrifuged at 16,000 × g for 2 min. The SV minicolumn
was removed from the spin column assembly and the liquid was in the collection tube
was discarded. The SV minicolumn was replaced onto the collection tube. The
column was washed by adding 700μl of membrane wash solution, previously diluted
with 95% ethanol, to the SV minicolumn and centrifuging the SV minicolumn
assembly for 1 min at 16,000 × g (14,000rpm). The collection tube was emptied as
before and placed the SV minicolumn back in the collection tube. The wash step was
repeated with 500μl of membrane wash solution and the SV minicolumn assembly
was centrifuged for 5 min at 16,000 × g. The SV minicolumn assembly was removed

104
from the centrifuge, being careful not to wet the bottom of the column with the
flowthrough. The collection tube was emptied and the column assembly was
recentrifuged for 1 min to allow evaporation of any residual ethanol. The SV
minicolumn was carefully transferred to a clean 1.5 ml microcentrifuge tube. 50μl of
nuclease-free water was added directly to the center of the column without touching
the membrane with the pipette tip and incubated at room temperature for 2 min. The
elution volume depended on the downstream application. The tube containing the
column assembly was centrifuged for 1 min at 16,000 × g and the SV minicolumn
was discarded. The microcentrifuge tube containing the eluted DNA was stored at
4°C or -20°C.
2.7.5.9 Phenol/CHCl3 Extraction of DNA Protocol: All steps were performed in a fume hood. 1 Vol. Phenol/CHCl3/isoamylalcohol
(25/24/1 v/v/v), saturated with 1 M Tris·HCl (pH 8.0) was added to the DNA sample.
The mixture was briefly vortexed to homogenize the aqueous and phenolic phases
and then centrifuged at 12,000 g, RT for 1 min to separate both phases. The upper
aqueous phase was transferred into a new 1.5 ml microcentrifuge tube. A white
protein precipitate may form between the two phases, depending on the amount of
protein in the sample. Care was taken as to not transfer any protein precipitate into
the new 1.5 ml microcentrifuge tube. Repeated the above two steps at least once or
until a protein precipitate between the aqueous and phenolic phase was no longer
present. Then pooled both phenolic phases in a 1.5 ml microcentrifuge tube and
extracted the pooled phenolic phase with ¼ Vol. 1 x TE (pH 8.0) as described earlier
and pooled both the aqueous phases. Added 1 Vol. CHCl3/isoamylalcohol (24/1 v/v)
to the pooled aqueous phase and repeat it at least once. Remark: One
CHCl3/isoamylalcohol (24/1 v/v) extraction is not sufficient to remove all traces of
phenol. Four extractions are, but the minimal number of extractions requires to
complete remove the phenol, is somewhere between two and four. Vortexed briefly to
mix the aqueous and organic phase. Centrifuged at 12,000 g, RT for 1 min to
separate both phases. The upper, aqueous phase was transferred into a new 1.5 ml
microcentrifuge tube and processed as desired or stored at 4ºC.
Reference: (Sambrook, 1989)

105
2.7.5.10 Transformation of Yeast with LiOAc/PEG
Protocol: The cells were grown by inoculating 2 ml YPD broth with a single colony
and incubated until saturation (A600 > 3.0) at 30°C. This was the preculture. For each
transformation 5 ml YPD broth was inoculated with an A600nm = 0.01 using the
preculture and incubated at 30°C with shaking at 250 rpm. The absorbance was
measured regularly until A600nm = 0.8-1.2 was reached. The culture was transferred to
a 50 ml tube and the cells were collected by centrifugation for 2 min at 3000 rpm,
4°C. The supernatant was decanted and the cells were placed on ice. While the cells
were centrifuging the sheared salmon sperm DNA was thawed in a 37°C water bath,
then placed on ice. The cell pellet was resuspended in 5-10 ml one-step buffer by
vortexing. The cells were centrifuged for 2 min at 3000 rpm, 4°C, the supernatant
was decanted and placed on ice. The residual liquid was aspirated and 88 μl of one-
step buffer was added to a cell pellet obtained from 5 ml of YPD broth. The cell pellet
was resuspended by vortexing to remove any cell clumps and placed on ice. The
salmon sperm DNA was denatured by boiling (100°C) for 5 min in a heat block and
placing on ice. The transforming DNA was dispensed into 1.5 ml microcentrifuge
tubes and placed on ice. 12 μl 8.31 mg/ml (14.5 μl 6.89 mg/ml) sheared salmon
sperm DNA was also added to each tube containing the transforming DNA using a
large orifice pipette tip. 88 µl cell suspension from earlier step was added to tubes
containing transforming DNA and 100 μgm sheared salmon sperm DNA using large
orifice pipette tips. The tubes were vortexed for 15 s at maximum speed and
incubated the cells in a 42°C water bath for 30 min without mixing. The tubes were
placed on ice. The cells were collected by centrifugation in a microcentrifuge for 10 s
at RT and placed on ice. The supernatant was pipetted out completely and the pellet
was resuspended in 200 µl H2O by pipetting up and down until no cell clumps
remained. The whole content of a tube was plated onto an appropriate plate. The
plates were incubated at 30°C in an incubator until colonies formed (usually 3-14
days). The colonies that appeared on the plate after the incubation period were
streaked for single colonies. These were then tested for their growth on non-
fermentable carbon source by streaking the colonies on PSP2/YPAc plate. The
colonies that were able to grow on non-fermentable carbon source were preserved
as frozen stocks.
106
Transformation controls:
Each time yeast cells are transformed included the following controls:
• Negative control: 100 μl cells were transformed with 5 μl 1 x TE (pH 8.0) to test
for sterility of the reagents and procedure.
• Positive control: One transformation with 100 ng of an autonomously replicating
yeast plasmid was used for positive control to determine the transformation
efficiency (colonies/µg transforming DNA).
Reference: (Chen et al., 1992)
2.7.5.11 Preparation of electrocompetent E. Coli Protocol: 500 ml LB broth was inoculated with 5 ml of a fresh overnight E. coli
culture. The cells were grown at 37ºC with shaking at ~250 rpm until an A600nm of 0.5
was reached. The cells were transferred to an ice-cold 500 ml centrifuge bottle and
chilled on ice for 15 min. The cells were collected by centrifugation at 4000 g, 4ºC for
15 min and the supernatant was decanted. The cells were washed by adding 500 ml
ice-cold water, resuspended by vortexing and centrifuged at 4000 g, 4ºC for 15 min.
The supernatant was decanted and the cells were washed twice as described in the
earlier step. The cells were now resuspended in 8 ml ice-cold 10% (v/v) glycerol and
transferred to a preweighted, ice-cold 40 ml centrifuge tube and centrifuged for 10
min at 4ºC at 3000 g. The supernatant was decanted and the tube was weighed. The
weight of the pellet was calculated and resuspended by vortexing in one cell volume
ice-cold 10% (v/v) glycerol. The cells were aliquoted into 40 µl aliquots into ice-cold
1.5 ml microcentrifuge tubes and frozen in a dry ice/ethanol bath or in liquid nitrogen
and store at -70ºC indefinitely.
Reference: (Seidman et al., 1997a)
2.7.5.12 Electroporation of electrocompetent E. Coli Reagents:
• Electrocompetent E. coli cells
• Control plasmid pUC18 (10 pg/µl)

107
• Plasmid DNA for transformation
• Ligation reactions: Clean-up on a PCR purification column.
• Elute with 20 μl elution buffer. Use 5 μl eluate for electroporation.
• 2 M D-glucose, filter sterilized
• 1 N HCl
• LB plates with appropriate antibiotics (ampicillin 100µgm/ml and
tetracycline 12.5 µgm/ml)
• LB broth
• LB broth + 20 mM D-glucose
Protocol: The pulse controller was set to 200 Ω. For each electroporation 1 ml LB +
20 mM D-Glc was prepared in a 1.5 ml microcentrifuge tube. The electrocompetent
cells were thawed by taking out the tubes from - 80ºC freezer and immediately
placed on ice. The DNA (up to 5 µl) was added to the tube containing
electrocompetent cells and the mix was placed on ice. The cell suspension was then
pipetted into an ice cold electroporation cuvette to the bottom of the cuvette and
gently tapped to remove any foam or air bubbles in the cell suspension. The outside
of the cuvette was wiped dry, and placed into a chilled safety chamber slide. The
cuvette was then pulsed at 25µF, 2.5 kV. The time constant was kept above 5.0 ms.
1 ml LB + 20 mM D-glucose was added immediately to the cuvette using a 1000 µl
pipette and the cells were transferred into a 14 ml culture tube. These tubes were
then incubated in a 37ºC shaker for 1 h with shaking (~220 rpm). The cells were
plated at different aliquots of 5, 10, and 200 µl onto LB-agar plates containing
appropriate antibiotics. The remaining cell suspension was centrifuged for 1 min at
15,000 g at RT to collect cells. The supernatant was aspirated and the cell pellet
resuspended in 100 – 200 µl H2O and plated onto LB-agar plates containing
appropriate antibiotics. The plates were then incubated in a 37ºC incubator for 16 h.
The plates were then observed for appearance of colonies which were then stored in
the refrigerator until the colonies were used as inoculum for plasmid minipreparation.
The following controls were used with each batch of electroporation. Negative
controls were included with 5 µl of 1 x TE (pH 8.0) to determine any possible
contamination. In the positive controls 10 pg of pUC18 plasmid was used to
determine the efficiency of transformation. The ligation mixtures for transformation
were subjected to purification by PCR-clean up column.

108
Reference: (Seidman et al., 1997a)
2.7.5.13 Preparation of chemically competent E. coli cells
Protocol: LB broth 4 ml was inoculated with one colony E. coli cells from a fresh LB
agar plate and grown overnight at 37°C with shaking at 225 rpm. The overnight
culture was diluted 1:100 into LB broth and incubated at 37°C with shaking at 225
rpm. After ~1 h, the absorbance A600 nm of the culture was measured and then
monitored every 15 - 30 min. The culture was transferred to a weighed centrifuge
tube when the 0.3 – 0.4 A600 nm was reached and precooled on ice. The tube was
then centrifuged for 10 min at 1000 g and 4°C to collect the cells and the supernatant
was decanted. The centrifuge tube was weighed and the cell pellet was resuspended
by gently shaking in 1/10 of the original culture volume ice-cold 1 x TSS. The cells
were aliquoted in ice-cold 1.5 ml microcentrifuge tubes as aliquots of 100 – 500 μl
and frozen in liquid nitrogen or a dry ice/ethanol bath. The cells were stored at -70°C
indefinitely.
Reference: (Seidman et al., 1997b)
2.7.5.14 Chemical Transformation of E. Coli
Protocol: The competent cells were thawed by taking them out of the -80ºC freezer
and immediately putting them on ice. Upto 5 µl of DNA solution was added to
microcentrifuge tubes and placed on ice. The thawed competent cells were mixed
carefully by inverting the tube once or twice and 100 µl of competent cells were
added to tubes containing DNA. The tubes were gently flipped to mix the contents
and incubated on ice for 30 min. At the end of the incubation period the tubes were
placed into a 1.5 ml microcentrifuge tube swimmer and placed into a 42ºC waterbath
for exactly 90 sec without moving the tubes. The microcentrifuge tubes with the
swimmer was taken out of the waterbath and placed immediately on ice for 5 min.
900 µl LB broth + 20 mM D-glucose was added to each tube and transferred to 14 ml
culture tubes, and incubated at 37ºC with shaking (~220 rpm) for 1 h. 200 µl cell
suspension was plated onto LB-agar plates containing appropriate antibiotics. The
remaining cell suspension was centrifuged for 1 min at 15,000 g at RT to collect cells

109
and the supernatant was discarded. The cells pelleted were resuspended in 100 –
200 µl H2O and plated onto LB-agar plates containing appropriate antibiotics. The
plates were incubated in a 37ºC incubator for 16 h and colonies counted. The plates
were stored in the refrigerator until the colonies were used as an inoculum for
plasmid minipreparation. The controls were used with each batch of electroporation.
Negative controls were included with 5 µl of 1 x TE (pH 8.0) to determine any
possible contamination. In the positive controls 100 pg of pUC18 plasmid was used
to determine the efficiency of transformation.
Reference: (Seidman et al., 1997b)
2.7.5.15 Gap-repair technique for recombinational cloning in yeast
Reagents
• Vector DNA (~1 ug/transformation)
• Insert DNA (~200 ng/transformation)
• Yeast culture for transformation
• E. coli XL10 GOLD competent cells
• SD medium lacking uracil made with yeast nitrogen base from
Becton Dickinson
• SD agar plates lacking uracil
• QIAprep Spin Miniprep kit
Protocol: A WT S. cerevisiae strain (ura3) was transformed with ~1 μg of vector
DNA and ~200 ng of insert DNA by LiOAc transformation as described in 2.7.5.10.
The cells were plated onto selective SD plate lacking uracil and incubated at 30°C
until the colonies formed. Single colonies were picked up and inoculated in 2-4 ml
synthetic dextrose (SD) medium lacking uracil made with yeast nitrogen base from
Becton Dickinson. The tubes were then incubated in shaker incubator at 30°C for ~2
days or until saturation. The cells were harvested by centrifugation at 5000g, 5 min
and the supernatant discarded. The cells were resuspended in 250 ul Buffer P1
(containing 0.1 mg/ml RNAse A) and transferred to a 2 ml flat bottom tube. Glass
beads (~150 mg) were added to this tube and the cells were lysed using Precellys 24

110
instrument (two 30 second cycles of 6, 500 rpm at 4°C by using cycles for 30 s each).
The tube was centrifuged at 5000 g, 5 min at 4ºC and supernatant was transferred to
a fresh 1.5 ml tube. 250 μl lysis buffer P2 was added to the cell lysate, inverted gently
4-6 times and incubated on ice for 5 min. 350 μl neutralization buffer N3 was added
to the tube and gently inverted 4-6 times to neutralize. The lysate was centrifuged for
10 min at 10,000 g at 4°C. QIAprep spin column was placed in a 2ml collection tube
and cleared lysate form earlier step was applied to it. The whole assembly was
centrifuged for 30-60s 10,000 g at 4°C and follow through was discarded. QIAprep
spin column was washed by adding 0.75 ml of Buffer PE and centrifuging 30-60s
(10,000 g). The follow-through was discarded and QIAprep spin column assembly
was centrifuged again for 1 min to get rid of any residual wash buffer. QIAprep spin
column was transferred to a fresh collection tube and 25 μl of 1XTE was applied to
the center. The column was left to stand for 2 min at RT and then centrifuged for 1
min. The eluate was used to transform E. coli XL10 GOLD cells as described in
2.7.5.14. The plasmids extracted from the clones were subjected to restriction
digestion analysis and fragments of interest were checked by sequencing.
Reference: (Ma et al., 1987)
2.7.5.16 Site directed mutagenesis Reagents:
• QuikChange II XL Site-Directed Mutagenesis kit (Stratagene
200521)
• Plasmid DNA isolated from dam+ strains
• Oligonucleotides: I-β-gal and Q-β-gal (Table 3.1)
Protocol: Two complimentary oligonucleotides I-β-gal and Q-β-gal containing the
silent restriction site BauI flanked by unmodified nucleotide sequence were
synthesized. Oligonucleotides also contained mutation that introduces isoleucine or
glutamine amino acid as the first amino acid of β-galactosidase. Control and sample
reactions were prepared as indicated below:
5 μl of 10× reaction buffer
2 μl (10 ng) of pWhitescript 4.5-kb control plasmid (5ng/μl) or dsDNA template

111
1.25 μl (125 ng) of oligonucleotide primer #1 (100 ng/μl)
1.25 μl (125 ng) of oligonucleotide primer #2 (100 ng/μl)
1 μl of dNTP mix
3 μl of QuikSolution reagent
36.5 μl of double-distilled water (ddH2O) to a final volume of 50 μl
Then 1 μl of PfuUltra HF DNA polymerase (2.5 U/μl) was added to each reaction.
The thermal cycler was used for mutant strand synthesis. A 5 min extension time at
95°C followed by 18 cycles of 95°C for 50 sec, 60°C for 50 sec and 68°C for 1 min/kb
of plasmid length followed by 68°C for 7 min was used. Following temperature
cycling, the reaction tubes were placed on ice for 2 min to cool the reactions to 37°C.
The reaction mixtures were digested with 1ul of DpnI (10 U/μl) for 1 h at 37°C to
remove non mutated parental DNA. 2μl of DpnI digested DNA was transformed in
E.coli as per protocol 2.7.5.14. Mutated plasmids should now have a BauI site
introduced with the oligonucleotides. These plasmids were selected based on
digestion with BauI restriction enzyme and confirmed by sequencing.
Reference: (Cormack, 1997)
2.7.5.17 DNA sequencing
Protocol
Plasmid DNA samples (at least 125 ng per reaction) were provided after checking on
the agarose gel with Restriction digestion analysis. The primers covering overlapping
regions were provided at the concentration of 3.2pmol/μl.DNA sequencing was
carried out by DNA Sequencing Facility at Durham University. The DNA sequencing
was undertaken using an Applied Biosystems 3730 DNA Analyser. The sequence
data that was generated was analyzed using BioEdit software.

112
2.7.5.18 Immunoprecipitation
Reagents:
• Lysis buffer,
ice-cold:
50 mM NaxH3-xPO4 (pH 7.3)
150 mM NaCl
10% (v/v) glycerol
1 mM EDTA
1 mM Na3VO4
10 mM NaF
0.25% (v/v) NP-40
add fresh: 7 mM β-mercaptoethanol
1 μg/ml pepstatin
1 tablet complete mini protease inhibitors/10 ml
• 6 x SDS-PAGE
sample buffer:
350 mM Tris-HCl (pH 6.8)
30% (v/v) glycerol
10% (w/v) SDS
0.2 g/l bromophenol blue
0.6% (v/v) β-mercaptoethanol
• Protein A sepharose, 50% (w/v) slurry in PBS + 0.01% (w/v) NaN3
• Protein G PLUS agarose, 25% (w/v) slurry
Protocol Note: All steps in this protocol are performed on ice or at 4°C, if not indicated
otherwise.
Yeast culture samples were thawed at RT and placed on ice. 5 ml ice-cold H2O was
added to each tube, cells were resuspended and centrifuge for 2 min at 3000 rpm,
4°C to sediment cells. The supernatant was decanted and 1 Vol. ice-cold lysis buffer
was added. The cells were lysed by two passages through a French press and the
solution was transferred into 1.5 ml microcentrifuge tubes and centrifuged at 10,000
g, 4°C for 10 min. Supernatant was transferred into new tubes and protein
concentration was determined using Bio-Rad DC Protein Assay kit. Equal protein
amounts were used in each immunoprecipitation with maximum volume not
exceeding ~ 500 μl. 50 μg protein was saved for a Western blot with anti-PGK as a

113
loading control for the immunoprecipitation. The volume was adjusted to 500 μl with
ice-cold lysis buffer in 1.5 ml screw-cap microcentrifuge tube. 20 μl 25% (w/v) protein
A or G agarose were added using large orifice pipette tips to each
immunoprecipitation and incubated for 1 h with over head rotation at 4°C. The tubes
were centrifuge for 2 min at 12,000 g, 4°C to collect beads and the supernatant was
transferred quantitatively into a new tube. Antibodies and competing peptides were
added to respective tubes and incubated with over head rotation overnight at 4°C. 20
μl 50% (w/v/) protein A or G sepharose slurry was added to each
immunoprecipitation and incubated for another 1 – 2 h at 4°C with overhead rotation.
Immunoprecipitation reactions were transferred into 1.5 ml spin filter microcentrifuge
tubes and centrifuged for 2 min at 12,000 g. The flow through was discarded and
spin filter was placed into a new 1.5 ml centrifuge tube. The sepharose beads were
washed 3 times with 500 μl ice-cold lysis buffer with 0.1% (v/v) NP-40 and once with
500 μl ice-cold lysis buffer without NP-40. Supernatant was separated from beads by
centrifugation for 2 min at 12,000 g, 4°C. Tubes were centrifuged once more for 2
min at 12,000 g and 4°C and placed into a clean 1.5 ml microcentrifuge tube. 15 – 20
μl 6 x SDS-PAGE sample buffer was added and the samples boiled for 3 min in a
heat block. After the samples cooled down, eluate was collected by centrifugation for
2 min at 12,000 g, RT and used for SDS-PAGE gels.
Reference: (Bonifacino et al., 1999)
2.7.5.19 SDS-PAGE gel electrophoresis
Protocol: The electrophoresis unit and criterion 4-15% Tris-HCl gradient precast gels
were assembled according to manufacturer’s instructions and buffer reservoirs filled
with 1 x SDS-PAGE buffer. Samples were prepared by adding appropriate amount of
6x SDS-PAGE sample buffer on ice and centrifuged briefly (~15 s) at 12,000 g and
RT. The samples were then boiled for 5 min at 100ºC and centrifuged again briefly to
collect the whole sample at the bottom of the tube. The wells were washed by
pipeting SDS-PAGE buffer several times using gel loading tips. The samples were
loaded onto gel using gel loading pipette tips. SDS-PAGE electrophoresis unit was
aligned as per the colour coded banana plug and jacks. 200V voltage of was applied
until the bromophenol blue dye front nearly elutes from the gel. The electrophoresis
114
unit was disassembled according to manufacturer’s instructions and was processed
to transfer proteins from gel to a PVDF membrane by immunoblotting.
Reference: (Gallagher, 1999)
2.7.5.20 Electrotransfer and Western Blot
Protocol: The stacking gel was cut off and transferred into 100 ml ice-cold transfer
buffer (10 mM NaHCO3 + 3 mM Na2CO3) and incubated with gentle agitation for 1 h
at 4ºC. Whatman 3MM papers were incubated in ice-cold transfer buffer and PVDF
membrane onto ~ 50 ml methanol. Once the PVDF membrane was completely
wetted, it was transferred to transfer buffer for ~15 min. The gel sandwich was
prepared by placing cassette with the gray side down on a clean surface followed by
one pre-wetted fiber pad. A sheet of Whatman 3MM paper was placed onto the
equilibrated gel to match all edges exactly. Whatman 3MM paper carrying the gel
was placed onto the fiber pad with the gel facing up. Any air bubbles between the
Whatman 3M paper and the gel were removed by rolling a Pasteur pipette gently
over the gel. Pre-wetted PVDF membrane was placed on the gel removing any air
bubbles. The sandwich was completed by placing a sheet of Whatman 3MM paper
onto the PVDF membrane and pre-wetted fiber pad onto the Whatman 3MM paper.
The cassette was firmly closed and locked with the white latch. Magnetic stirrer was
added in the tank. The gray side of each cassette was placed facing the cathode (-
pole). The transfer unit was placed into a large plastic a glass tray placed on a stir
plate in the cold laboratory. The tank was filled completely with ice-cold transfer
buffer. The lid was put on and cables were plugged into the power supply. Transfer
was started by setting the voltage to 30 V with stirring of the transfer buffer for
overnight. Upon completion of the run, membrane was removed by disassembling
the blotting sandwich.
Western Blot: The membranes were transformed into plastic trays containing PBST
(PBS + 0.1% (v/v) tween 20) + 5% (w/v) skim milk powder and incubate 1 h at RT
with shaking (~50-60 rpm). The membranes were transferred into a 50 ml centrifuge
tube containing 50 μl/cm2 PBST + 2.5% (w/v) skim milk powder + primary antibody
(Anti-HA antibody, Roche 12CA5, 100 ng/ml; Anti-PGK, Molecular Probes, 2mg/ml)
removing any air bubbles between the tube walls and the membrane and incubated 1

115
h at RT with rotation. The membranes were then washed four times with PBST by
incubating for 5 min at RT with shaking. The membranes were then incubated with
PBST + 2.5% (w/v) skim milk powder + secondary antibody (anti-mouse IgG-POD-
(Fab’)2;Roche #60530, 1:300 dilution) for 1 h at RT with rotation. The membranes
were washed with PBST four times for 5 min each at RT with shaking. The blots were
developed using ECL kit (GE Healthcare).
References: (Gallagher et al., 1997; Towbin et al., 1979)

Chapter 3
Destabilised β-galactosidase reporters:
Construction, validation & transcriptional regulation
of URS1 controlled early meiotic genes

116
3.1 CYC1-lacZ reporters for monitoring transcriptional activity under nutrient-rich conditions
Meiosis is negatively regulated in the presence of glucose and nitrogen sources and
this has been extensively studied. However, the direct regulation of meiosis by
nitrogen abundance is not very well understood. S. cerevisiae diploid cells under
nitrogen starvation and in the presence of non-fermentable carbon sources undergo
meiosis (Herskowitz, 1988; Kupiec et al., 1997). The onset of the meiotic program is
marked by induction of the early meiotic genes. The bZIP transcription factor Hac1ip
is a negative regulator of early meiotic genes under nitrogen replete conditions
(Schröder et al., 2000) through the upstream repression site 1 (URS1,
TCGGCGGCT), present in most of the early meiotic genes. The negative regulation
of early meiotic genes is shown by an increase in the mRNA levels of early meiotic
genes in the absence of Hac1ip and repression in the presence of Hac1ip under
nitrogen starved conditions (Schröder et al., 2004). Further evidence comes from the
use of CYC1-lacZ reporters, which are routinely used for measuring transcriptional
activity. In the CYC1-lacZ reporters, the Escherichia coli lacZ gene is fused to the
CYC1 promoter [Figure 3.1 and (Guarente and Mason, 1983; Kadosh and Struhl,
1997; Wu et al., 2001; Zhang et al., 1998)]. Schröder et al., 2004 used URS1-CYC1-
lacZ reporters, derivatives of CYC1-lacZ reporters (known as pLGΔ312SΔSS in
Figure 3.1B) without any upstream activating sequences of the CYC1 promoter to
study URS1-controlled transcriptional repression by Hac1ip under meiotic growth
conditions. Hac1ip was constitutively expressed in these experiments, which
repressed the activation of β-galactosidase from URS1-CYC1-lacZ reporter.
However, the regulation that underlies nutrient-rich/mitotic growth conditions could
not be shown directly because pLGΔ312SΔSS constructs show barely detectable
levels of β-galactosidase under nutrient rich conditions and are only induced under
meiotic conditions. I wanted to directly demonstrate whether the negative regulation
of Hac1ip on URS1-controlled genes can be recapitulated in nutrient rich conditions.
In order to test this we wanted to employ a system that firstly elevates expression of
a reporter gene mediated through URS1 and secondly it is easily detected in large
number of samples. Early meiotic genes are repressed in nutrient rich conditions and
so their mRNA cannot be detected easily (Kupiec et al., 1997). Moreover early
meiotic gene transcripts are highly unstable when expressed during vegetative

117
growth or sporulation (Surosky and Esposito, 1992). Analysis by reporter system
allows monitoring specific changes at transcriptional level as compared to techniques
like quantitative real time RT-PCR, which also depends on mRNA stability rather than
transcription initiation. Therefore we decided to use heterologous promoter to elevate
expression of a reporter gene that can be used to measure transcriptional activity
with relative ease. β-Galactosidase reporter assays are routinely used for testing
transcriptional activity at a promoter element of interest. Transcriptional activity
regulated by cis acting element can be studied by cloning in a heterologous promoter
upstream of lacZ. The transcriptional regulation can be detected by colorimetric
estimation of β-galactosidase activity without having to detect mRNA transcripts in
multiple samples. The principal advantage of these assays is their high sensitivity,
reliability, convenience, inexpensive and adaptability to large-scale measurements.
β-Galactosidase reporter employs an enzyme assay as compared to non-enzymatic
fluorescence based reporters and therefore allows quantitative study of
transcriptional induction and repression phenomenon. Advances in microplate
technology have allowed both assay miniaturization and the possibility to save time,
reagents and increase dramatically the number of samples analysed. The use of β-
galactosidase reporter enzymes allows a more rapid and equally sensitive method for
detection of transcription than the analysis of specific transgene transcripts within the
cells. Construction of a control reporter where introduction of point mutations in
URS1, can prevent binding of Ume6p is convenient in comparison to manipulation of
URS1 in the endogenous genes. Since β-Galactosidase reporter also can be applied
to a wide variety of other experimental uses, construction of destabilised reporters is
useful as well as a technical advancement in the field. The pLGΔ312SΔSS
constructs without any CYC1 upstream activating sequences have barely detectable
levels of β-galactosidase in nutrient-rich vegetative (mitotic) growth conditions,
precluding the use of pLGΔ312SΔSS based plasmids to investigate whether Hac1ip
represses on URS1 in vegetative growth conditions (Bowdish and Mitchell, 1993;
Kadosh and Struhl, 1997; Schröder et al., 2004). Therefore we needed a reporter
system that was elevated under nutrient rich conditions. Figure 3.1 shows various
derivatives of CYC1-lacZ reporters widely used to study transcriptional activity driving
the expression of β-galactosidase by heterologous promoter elements. pLGΔ312S-
based plasmids, which contains CYC1 upstream activating sequences and show
robust mitotic expression suited the purpose of the study (Figure 3.1A). The CYC1

118
fragment -324 to +141, which includes two UASCYC1 and the TATA region, is fused to
β-galactosidase encoded by the lacZ region (Guarente and Mason, 1983). The
plasmid pLGΔ312S-INO1 contains one URS1 element from INO1 gene and
pLGΔ312S-IME2 contains two URS1 elements from IME2 gene and are located in
the CYC1 promoter immediately upstream of UASCYC1 [Figure 3.1C and (Kadosh and
Struhl, 1997)]. I employed the URS1 containing CYC1-lacZ reporters to test the
transcriptional activity mediated on URS1 elements in vegetative growth conditions.
S. cerevisiae WT strains were transformed with pLGΔ312S, pLGΔ312S-INO1 and
pLGΔ312S-IME2 and their transcriptional activity was monitored in cells grown in
nutrient-rich synthetic acetate medium (PSP2 medium) and harvested at exponential
phase to measure β-galactosidase levels. The steady state levels of URS1-CYC1-
lacZ reporters expressed under the CYC1 promoter containing 0, 1 or 2 URS1 sites
is shown in Figure 3.2. β-Galactosidase is expressed at elevated levels from URS1-
CYC1-lacZ reporter plasmids with or without any URS1 under nutrient-rich
conditions. The mitotic repression is not remarkable with one URS1 site but in
presence of two URS1 sites there is a repressing trend in nutrient rich conditions.
The URS1-CYC1-lacZ reporters show elevated expression in nutrient-rich conditions
without any URS1 sites, making them appropriate to study transcriptional regulation
at URS1 in nutrient abundance as compared to UAS-less CYC1-lacZ reporters.
Under mitotic growth conditions the URS1 site is repressed by an array of proteins
recruited by Ume6p to repress early meiotic genes, but this repression is relieved
under meiotic conditions allowing transcription of early meiotic genes (Kupiec et al.,
1997). pLGΔ312ΔSS-based plasmids used in the study by Schröder, et al., 2004
have shown that constitutively expressing HAC1i under nitrogen starved conditions
represses β-galactosidase levels through URS1 but in the presence of nitrogen no
clear conclusion could be implied due to weak expression of these reporter plasmids.
However, deletion of HAC1 derepresses this regulation in nitrogen-rich conditions.
This may be because HAC1i splicing occurs at basal levels in vegetatively growing
cells and may induce some repression through URS1. In order to demonstrate
negative regulation by Hac1ip through URS1, ectopic Hac1ip expression may be
necessary in nutrient-rich conditions. Therefore, induced expression of HAC1i would
suit the purpose of the experiment to capture the repression mediated by Hac1ip.

Figure 3.1. CYC1-lacZ reporter constructs used to study transcriptional activity. List of CYC1-lacZ constructs containing UASCYC1 and URS1 used in this study and various other studies for measuring transcriptional activity mediated via URS1. URS1-upstream repressing site 1;UAS-upstream activating sequence; X a.a.-N-terminal amino acid of lacI. CYC1’ denotes the one codon fused to lacI. The arrows indicate open reading frames and their direction of transcription. C and D have been referred in the text as URS1-CYC1-lacZ and URS1-CYC1-Ub-X-lacZ reporters respectively.
pLGΔ312S
(Guarente and Mason, 1983; Kadosh and Struhl, 1997)
A
URA3
UASCYC1 TATA
CYC1’ ’lacZ lacI
pLGΔ312SΔSS (Bowdish and Mitchell,1993; Schröder et al., 2004)
URA3 CYC1’
URS1 URS1 B
’lacZ lacI
URA3
URS1 UASCYC1 TATA
CYC1’
pLGΔ312S-IME2
(Kadosh and Struhl, 1997)
C
’lacZ lacI
URA3 CYC1’
pLGΔ312S-INO1
(Kadosh and Struhl, 1997)
’lacZ lacI
pVP-IME2-X- β-gal pVP-INO1-X- β-gal (this study)
URA3
URS1 UASCYC1 TATA
CYC1’ Ub
X a.a.
D
’lacZ lacI
pVP-X- β-gal (this study)
URA3 CYC1’ Ub ’lacZ lacI
119
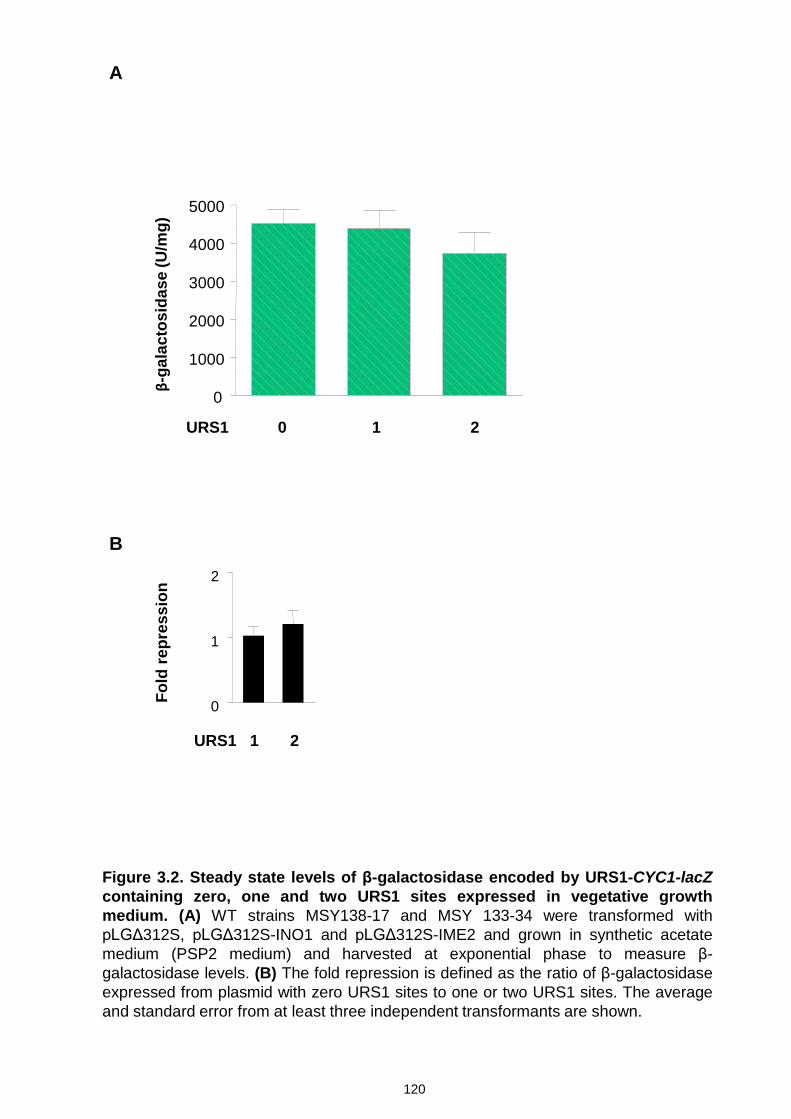
Figure 3.2. Steady state levels of β-galactosidase encoded by URS1-CYC1-lacZ containing zero, one and two URS1 sites expressed in vegetative growth medium. (A) WT strains MSY138-17 and MSY 133-34 were transformed with pLGΔ312S, pLGΔ312S-INO1 and pLGΔ312S-IME2 and grown in synthetic acetate medium (PSP2 medium) and harvested at exponential phase to measure β-galactosidase levels. (B) The fold repression is defined as the ratio of β-galactosidase expressed from plasmid with zero URS1 sites to one or two URS1 sites. The average and standard error from at least three independent transformants are shown.
0
1000
2000
3000
4000
5000
URS1 0 1 2
β-ga
lact
osid
ase
(U/m
g)
A
0
1
2
Fold
repr
essi
on
URS1 1 2
B
120

121
3.2 Demonstration of Hac1ip-mediated negative regulation of EMGs through URS1
The splicing of HAC1 mRNA increases in response to the high nitrogen levels and
lead to synthesis of Hac1ip and activate a basal UPR, while splicing ceases under
nitrogen starvation (Schröder, 2000). When Hac1ip was overexpressed it had little or
no effect on IME1 mRNA levels but repressed IME2 levels including other meiotic
and non-meiotic genes containing URS1 (Schröder et al., 2000; Schröder et al.,
2004). Overexpression of Hac1ip represses through URS1 under nitrogen starvation
conditions and when HAC1 was deleted, expression of genes containing URS1
derepressed modestly (~2 fold). However, we wanted to investigate whether Hac1ip
negatively regulates through URS1 in nutrient rich conditions. The results in figure 3.2 show that URS1-CYC1-lacZ reporters have elevated expression under nitrogen-
rich conditions and repressing trend in the presence of URS1, which allows these
reporters to study regulation under nitrogen-rich conditions. To investigate the Hac1ip
-mediated repression on EMGs via URS1 in nitrogen-rich conditions, I decided to use
URS1-CYC1-lacZ reporters (Figure 3.1A and C).
In nitrogen-rich conditions a basal UPR is active, which splices HAC1 mRNA leading
to some repression (Bicknell et al., 2007; Kuhn et al., 2001; Schröder et al., 2000).
Constitutively expressing spliced form of HAC1i slows the growth of the cells and is
toxic to the cells (Mori et al., 2000). Therefore ectopic expression of HAC1i from an
inducible system addresses the potential problem of repression by Hac1ip
synthesized from basal UPR activation and toxicity to cells. The expression of Hac1ip
was induced from pRS423-GRE3-HA-HAC1i, which contains three glucocorticoid
response elements and expression is induced only in the presence of glucocorticoid
receptor (pG-N795) (Schena et al., 1991) and steroids. Hac1ip is successfully
induced under the control of glucocorticoid response elements in the presence of the
steroid deoxycorticosterone (DOC) and the rat glucocorticoid receptor expressed
constitutively in yeast (Figure 3.3B) and (Schröder et al., 2004). In figure 3.3B, the
Western blot was carried out on supernatant of Sin3p immunoprecipitation samples
and blocking peptide used here competes with Sin3p for binding to anti-Sin3
antibody. Blocking peptide does not affect detection of non-Sin3p bound Hac1ip,
which is overexpressed here and therefore present in molar excess as compared to
Sin3p. The levels of β-galactosidase, when Hac1ip was induced by DOC were mostly
unchanged in the presence of URS1 elements (Figure 3.3A).

122
The levels of β-galactosidase remain unchanged in the strains containing one or two
URS1 sites as compared to no URS1 site in the presence of induced Hac1ip. The
repression of IME2 and INO1 mRNA levels seen in the Northern blot analysis by
overexpression of HAC1i could not be seen with the URS1-CYC1-lacZ reporters
(Schröder, 2004). The expression of Hac1ip which is induced from inducible plasmid
pRS423-GRE3-HA-HAC1i on addition of 50 μM DOC for 1 hour in the presence of
glucocorticoid receptor expressed from pG-N795 was checked by Western blot
(Figure 3.3B) and (Schröder et al., 2004). If the repression on β-galactosidase levels
is caused by Hac1ip synthesized from basal UPR activation, the inducible system
would not allow any further repression by Hac1ip expression. The other possibility is
that the long half-life of the reporter protein β-galactosidase masks any dynamic
changes in transcriptional activity caused by inducible expression of HAC1i. In the
presence of Hac1ip, any transcriptional repression caused by Hac1ip on URS1-
controlled β-galactosidase expression may be masked owing to the longer half-life of
β-galactosidase (>30 h). Thus data from figure 3.2 and figure 3.3 suggests that an
inducible expression of Hac1ip did not repress the β-galactosidase levels possibly
due to already present Hac1ip from basal UPR activation and may be due to residual
activity of β-galactosidase due to its long half-life, which may hinder the testing of
transcriptional regulation under vegetative growth conditions. One problem with β-
galactosidase reporter systems is the relatively long half-life, which prevents
monitoring of dynamic changes during gene regulation. Background expression due
to preexisting reporter molecules present within the cells before the actual
experiment cause a low signal-to-noise ratio. Therefore use of destabilized reporter
system can give a low background as pre-existing β-galactosidase molecules are
rapidly degraded and this can provide a broad dynamic range to the assay.
Therefore, to test the possibility that β-galactosidase half-life and therefore residual
activity hinders monitoring of transcriptional activity I decided to reduce the half-life of
β-galactosidase.

Figure 3.3. Inducible expression of Hac1ip does not repress β-galactosidase driven by URS1 encoded by URS1-CYC1-lacZ reporters. (A) Expression of URS1-CYC1-lacZ in the presence of Hac1ip induced by 50 µM DOC for one h in strains grown in PSP2 medium. The average and standard error from at least three independent transformants are shown. (B) HA tagged Hac1ip is induced by DOC for 1 h in lane 3 and 4 as detected by Western blot. Supernatant of the samples used for immunoprecipitation with anti-Sin3 antibody were used here. The blocking peptide in lane 2 and 4 competes with Sin3p for binding to anti-Sin3 antibody. HA tagged Hac1ip was detected by anti-HA antibody and phosphoglycerate kinase (PGK) was detected as loading control.
0
1000
2000
3000
4000
5000
6000
7000
8000
+ DOC
- DOC
URS1 0 1 2 0 1 2
pRS423 pRS423-GRE3-HA-HAC1i
β-ga
lact
osid
ase
(U/m
g)
123
A
B
anti-HA
anti-PGK
1 2 3 4

124
3.3 Construction of URS1-CYC1-Ub-X-lacZ reporters
The β-galactosidase with higher half-life may mask the transcriptional activity
mediated by URS1. In order to remove the background β-galactosidase rapidly we
decided to decrease the half-life of β-galactosidase so that we can use URS1-CYC1-
lacZ reporters to measure transcriptional repression. The N-terminal amino acid
residue can determine the stability of the protein and this pathway is called the N-end
rule (Varshavsky, 1997). Features that confer metabolic instability to the protein are
called degrons. In eukaryotes, the N-degron consists of three determinants: a
destabilizing N-terminal amino acid of the protein substrate, the internal lysine
residue which forms the anchor for the ubiquitin chain and the conformationally
flexible region in the vicinity of the other determinants required for ubiquitylation
and/or degradation (Hu et al., 2006). The destabilizing residues are recognized by N-
recognins and the N-end rule substrates are tagged with ubiquitin to allow
degradation by the 26S proteosome (Hu et al., 2006). When a chimeric gene
encoding the ubiquitin-β-galactosidase fusion protein is expressed in yeast, ubiquitin
is cleaved off the nascent polypeptide exposing the amino acid residue present at the
ubiquitin-β-galactosidase junction, thereby making it possible to express a β-
galactosidase protein with different amino acid residues on its amino-terminus. These
β-galactosidase proteins can have a varied half-life from less than 3 min to more than
30 hours depending on the β-galactosidase amino acid residue exposed after
cleavage of ubiquitin. Thus, an amino acid residue at the N-terminus of the protein
can decide the stability of the protein (Bachmair et al., 1986; Bachmair and
Varshavsky, 1989). The metabolic instability of engineered N-end rule substrates is
due to degradation signals called degrons, which are recognised by N-recognins (E3
ubiquitin ligases). Decrease in half life of β-galactosidase protein based on N-end
rule relies on post-translational removal of the ubiquitin moiety by proteases
(Bachmair et al., 1986). Since techniques like Northern Blot and highly sensitive
quantitative real time RT-PCR detect all the lacZ mRNA transcripts irrespective of
destabilisation of β-galactosidase protein, use of enzymatic detection of β-
galactosidase as transcriptional output give more dynamicity to the assay.

125
The pUB23 and pLGΔ312S series of plasmids were used to construct URS1-CYC1-
Ub-X-lacZ reporters (Bachmair et al., 1986; Bachmair and Varshavsky, 1989;
Guarente and Mason, 1983). The Ub-X-lacZ reporter plasmids (pUB23) contain the
ubiquitin moiety which is fused to β-galactosidase coding region and the amino acid
after ubiquitin coding region is changed from methionine to a destabilizing residue.
This allows the first amino acid of the β-galactosidase coding region to be changed to
any amino acid substituting methionine. Expression of Ub-β-gal fusion proteins is
driven by the inducible GAL1,10 promoter [(Bachmair and Varshavsky, 1989) and
(Figure 3.4)]. In order to use these reporters to monitor transcriptional activity
through URS1, the GAL1,10 promoter has to be replaced by a constitutive promoter
carrying URS1 elements. The reporter plasmids with URS1 containing promoter
sequences cloned upstream of UASCYC1 were used to replace the GAL1,10 promoter
(Figure 3.1 and Figure 3.4). The sequence encoding ubiquitin moiety with different
amino acid residue was amplified by PCR from pUB23M, pUB23K, pUB23L and
pUB23R plasmids (Bachmair and Varshavsky, 1989) using primers A1 and A2. The
B1 and B2 primers were used to amplify a fragment from pLGΔ312S-IME2 or
pLGΔ312S-INO1 or pLGΔ312S that would amplify a region spanning the URA3
region, URS1 sequence and the lacZ region. The primers A2 and B2 were designed
to have an overhang complementary to each other to get a fusion PCR product as
shown in Figure 3.4. Primers A1 and B1 were designed to amplify fragments that
would contain NarI and PspOMI sites respectively, so that the resulting fusion PCR
product could be digested using these restriction enzymes and cloned into
pLGΔ312S-IME2. As shown in Figure 3.4 this would result in a PCR product having
the sequence URA3-URS1 (2, 1 or 0)-P’CYC1-ubiquitin-X amino acid-lacI-lacZ. The
cloning of the fusion product into pLGΔ312S plasmids using restriction enzyme NarI
and PspOMI only yielded pVP-IME2-M-β-gal and pVP-IME2-L-β-gal. One reason was
that digestion of vector with NarI and PspOMI was inefficient. The other reason could
be inefficient digestion of PCR product. Therefore, the fusion products were first
cloned into pSTBlue-1 blunt vector. Cloning of fusion products released from
pSTBlue-1 vector by digestion with NarI and PspOMI into pLGΔ312S was not
successful either. Therefore I resorted to gap repair method of homologous
recombination in yeast, which does not depend on requirement of sticky ends of DNA
for ligation but only requires homologous sequences in the vector and insert (Ma et
al., 1987). Figure 3.5 shows the strategy used to clone the fusion products by the

126
gap repair method. The fusion product released with EcoRI from pSTBlue-1 Blunt
vector and BamHI-digested pLGΔ312S plasmid fragment have homologous regions
at URA3 and lacI. Co-transformation of these fragments into S. cerevisiae allows
homologous recombination to yield the final plasmid as shown in figure 3.5.
Formation of functional URA3 metabolic marker in the plasmid constructed by
homologous recombination allowed selection in a ura3 strain on uracil dropout plates.
Plasmids were extracted from yeast and transformed into E. coli. The reporters with
isoleucine and glutamine were obtained by site-directed mutagenesis of the
constructed plasmids (Table 3.1). These reporters are now referred to as URS1-
CYC1-Ub-X-lacZ reporters which contain 0, 1 (from INO1) or 2 URS1 (from IME2)
and the N-terminal amino acid of β-galactosidase exposed is denoted by ‘X’, which is
methionine, lysine, leucine, arginine, isoleucine or glutamine. The individual plasmids
as shown in figure 3.1 are designated as pVP-IME2-X- β-gal containing two URS1
sites, pVP-INO1-X- β-gal containing one URS site and pVP-X- β-gal containing no
URS1 site. As a result the destabilized URS1-CYC1-Ub-X-lacZ reporters would
encode β-galactosidase with lower half lives that may be useful to achieve dynamic
and tighter monitoring of the transcriptional regulation by Hac1ip.

pUB23M
NarI
PspOMI
A1 A2
pLGΔ312S
NarI BamHI
SmaI
PspOMI
B1
B2
PCR w/ A1 + A2 PCR w/ B1 + B2
PCYC1 URA3 Ub PCYC1 Ub lacI
PCYC1 Ub lacI
PCYC1 URA3 Ub
A1
B1
PCR w/ A1 + B1
lacI PCYC1 URA3 Ub
PspOMI NarI
PspOMI + NarI
Clone into pLGΔ312S cut w/ PspOMI and NarI OR pSTBlue-1
Figure 3.4. Cloning strategy for URS1-CYC1-Ub-X-lacZ reporter plasmids. The fusion product was amplified using A1 and B1 primers and was cloned into pLGΔ312S or pST-Blue1 vector.
127

Digestion with BamHI
EcoRI
pST-URS1-X-bgal
X a.a.
EcoRI
pLGΔ312S
BamHI
BamHI BamHI
Digestion with EcoRI
pLGΔ312S
PCYC1 Ub lacI URA3
Transformation in yeast
Figure 3.5. Cloning strategy for URS1-CYC1-Ub-X-lacZ reporter plasmids using gap repair in yeast. The fusion product released with EcoRI from pST-Blue1 Blunt vector and the BamHI-digested pLGΔ312S plasmid are transformed into S. cerevisiae to derive constructs by homologous recombination.
Recombination in yeast and plasmid extraction
pVP-URS1-Ub-X- β-gal
X a.a. (X=M,K,L,R,I,Q)
URS1 (0,1 or 2)
128

129
Table 3.1. List of cloning strategies for the construction of destabilized URS1-CYC1-
Ub-X-lacZ reporters.
Sr. No. Plasmid Method
1. pVP-IME2-M-β-gal
&
pVP-IME2-L-β-gal
Fusion PCR and cloning into pLGΔ312S-IME2 at NarI
and PspOMI
2. pVP-IME2-K-β-gal
pVP-IME2-R-β-gal
pVP-INO1-M-β-gal
pVP-INO1-K-β-gal
pVP-INO1-L-β-gal
pVP-INO1-R-β-gal
pVP-M-β-gal
pVP-K-β-gal
pVP-L-β-gal
pVP-R-β-gal
Fusion PCR, cloning into pSTBlue-1 vector, Gap repair
3. pVP-IME2-I-β-gal
pVP-IME2-Q-β-gal
pVP-INO1-I-β-gal
pVP-INO1-Q-β-gal
pVP-I-β-gal
pVP-Q-β-gal
Site-directed mutagenesis of pVP-IME2-R-β-gal using
I-β-gal and Q-β-gal oligonucleotides containing silent
restriction site BauI
Site-directed mutagenesis of pVP-INO1-R-β-gal using
I-β-gal and Q-β-gal oligonucleotides containing silent
restriction site BauI
Site-directed mutagenesis of pVP-M-β-gal using I-β-gal
and Q-β-gal oligonucleotides containing silent
restriction site BauI
The URS1-CYC1-Ub-X-lacZ reporters were digested with EcoRV and BamHI to
confirm the predicted fragments. Restriction digestion analysis (Figure 3.6A-F)
showed expected fragments. The selected clones were checked for the N-terminal
amino acid of β-galactosidase in each construct by sequencing. Figure 3.6G shows
the sequences of the constructed plasmids compared with the original plasmid used

130
for plasmid construction. URS1-CYC1-Ub-X-lacZ reporters show different amino acid
residues at the N-terminus. The silent restriction site BauI introduced in isoleucine
and glutamine plasmid constructs by site directed mutagenesis produced an extra
band and this was checked by restriction enzyme digestion with BauI (Figure 3.6E-F)
and then confirmed by sequencing (Figure 3.6G). The silent restriction site, BauI can
be seen in the sequences of pVP-I-β-gal and pVP-Q-β-gal plasmids.
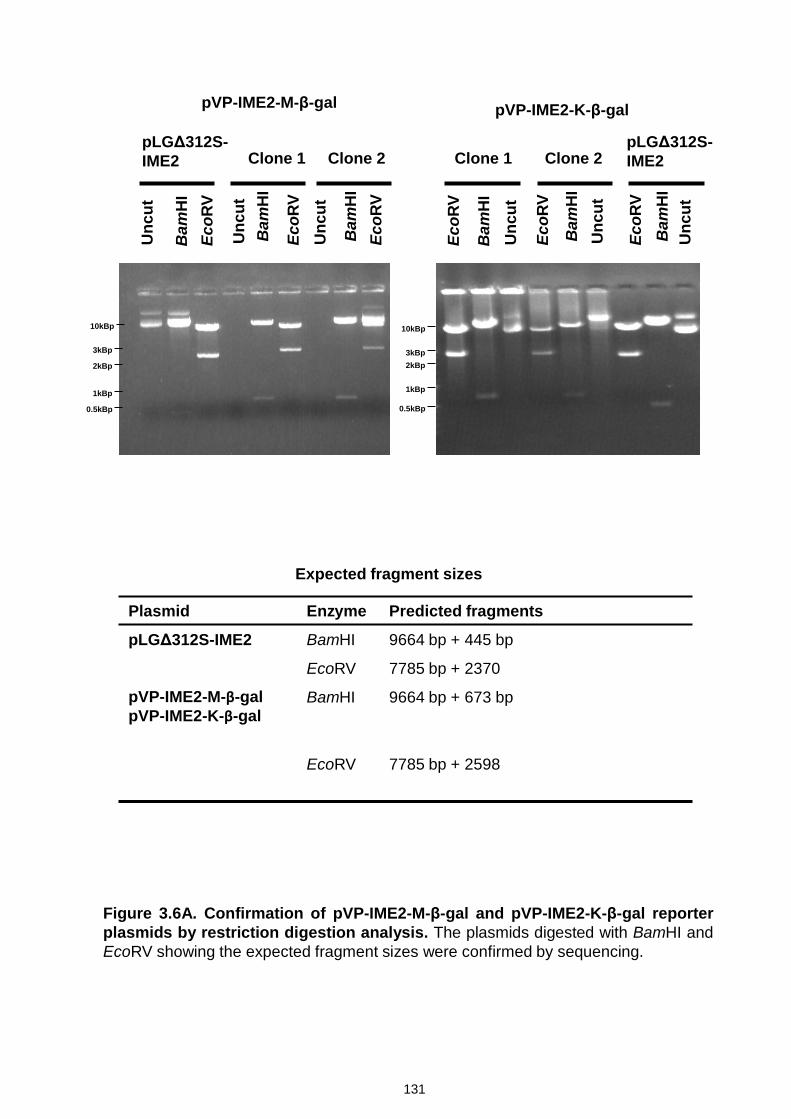
Figure 3.6A. Confirmation of pVP-IME2-M-β-gal and pVP-IME2-K-β-gal reporter plasmids by restriction digestion analysis. The plasmids digested with BamHI and EcoRV showing the expected fragment sizes were confirmed by sequencing.
pVP-IME2-M-β-gal
Plasmid Enzyme Predicted fragments
pLGΔ312S-IME2 BamHI 9664 bp + 445 bp
EcoRV 7785 bp + 2370
pVP-IME2-M-β-gal pVP-IME2-K-β-gal
BamHI 9664 bp + 673 bp
EcoRV
7785 bp + 2598
Expected fragment sizes
Unc
ut
Bam
HI
EcoR
V
Unc
ut
Unc
ut
pLGΔ312S- IME2 Clone 1 Clone 2
EcoR
V
Bam
HI
EcoR
V
Bam
HI
Unc
ut
Bam
HI
EcoR
V
Unc
ut
Unc
ut
pLGΔ312S- IME2 Clone 1 Clone 2
EcoR
V
Bam
HI
EcoR
V
Bam
HI
pVP-IME2-K-β-gal
10kBp
3kBp 2kBp
1kBp
0.5kBp
10kBp
3kBp
2kBp
1kBp
0.5kBp
131
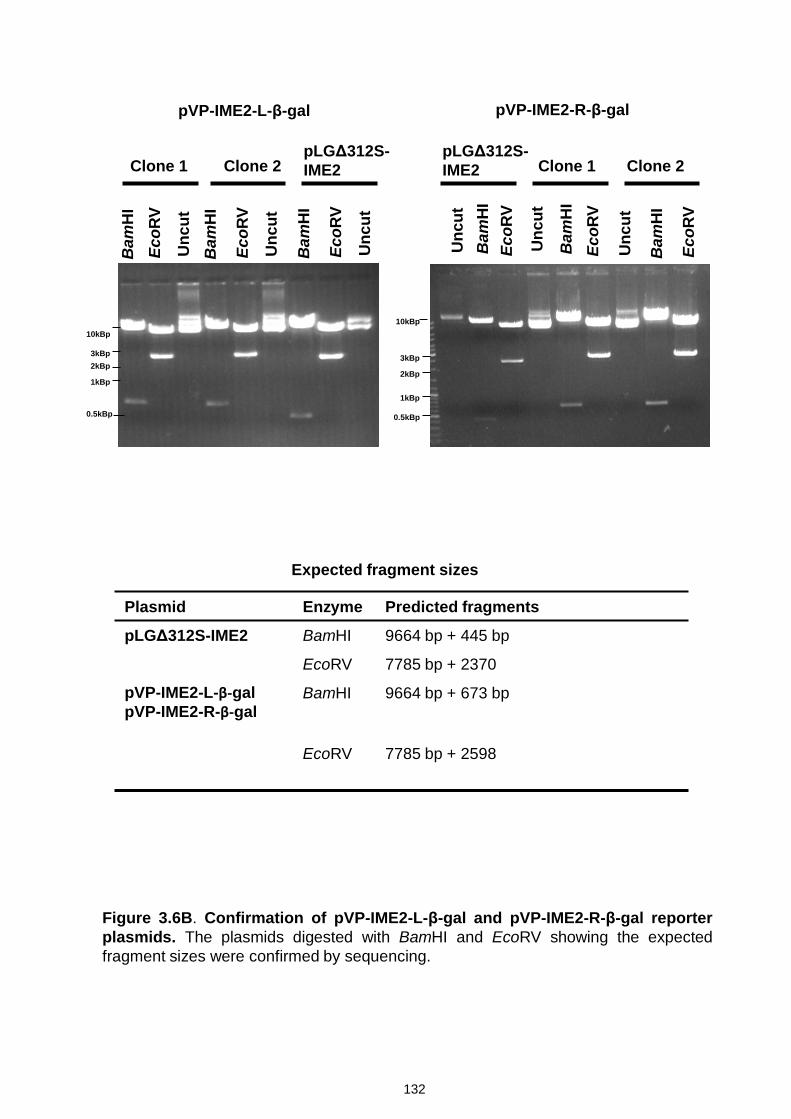
Figure 3.6B. Confirmation of pVP-IME2-L-β-gal and pVP-IME2-R-β-gal reporter plasmids. The plasmids digested with BamHI and EcoRV showing the expected fragment sizes were confirmed by sequencing.
Plasmid Enzyme Predicted fragments
pLGΔ312S-IME2 BamHI 9664 bp + 445 bp
EcoRV 7785 bp + 2370
pVP-IME2-L-β-gal pVP-IME2-R-β-gal
BamHI 9664 bp + 673 bp
EcoRV
7785 bp + 2598
Expected fragment sizes
pVP-IME2-R-β-gal
Unc
ut
Bam
HI
EcoR
V
Unc
ut
Unc
ut
pLGΔ312S- IME2 Clone 1 Clone 2
EcoR
V
Bam
HI
EcoR
V
Bam
HI
10kBp
3kBp
2kBp
1kBp
0.5kBp
132
pVP-IME2-L-β-gal
Unc
ut
pLGΔ312S- IME2 Clone 1 Clone 2
EcoR
V
Bam
HI
Unc
ut
EcoR
V
Bam
HI
Unc
ut
EcoR
V B
amH
I
10kBp
3kBp 2kBp
1kBp
0.5kBp

pVP-INO1-L-β-gal
EcoR
V
Bam
HI
Unc
ut
EcoR
V
Bam
HI
Unc
ut
EcoR
V
Bam
HI
Unc
ut
EcoR
V
Bam
HI
Unc
ut
EcoR
V
Bam
HI
Unc
ut
Clone 1 Clone 2 Clone 1 Clone 2
pVP-INO1-R-β-gal pLGΔ312S -INO1
pVP-INO1-M-β-gal
EcoR
V
Bam
HI
Unc
ut
EcoR
V
Bam
HI
Unc
ut
EcoR
V
Bam
HI
Unc
ut
EcoR
V
Bam
HI
Unc
ut
EcoR
V
Bam
HI
Unc
ut
Clone 1 Clone 2 Clone 1 Clone 2
pVP-INO1-K-β-gal pLGΔ312S -INO1
Figure 3.6C. Confirmation of pVP-INO1-M-β-gal, pVP-INO1-K-β-gal, pVP-INO1-L-β-gal and pVP-INO1-R-β-gal reporter plasmids. The plasmids digested with BamHI and EcoRV showing the expected fragment sizes were confirmed by sequencing.
10kBp
3kBp
2kBp
1kBp
0.5kBp
10kBp
3kBp
2kBp
1kBp
0.5kBp
133
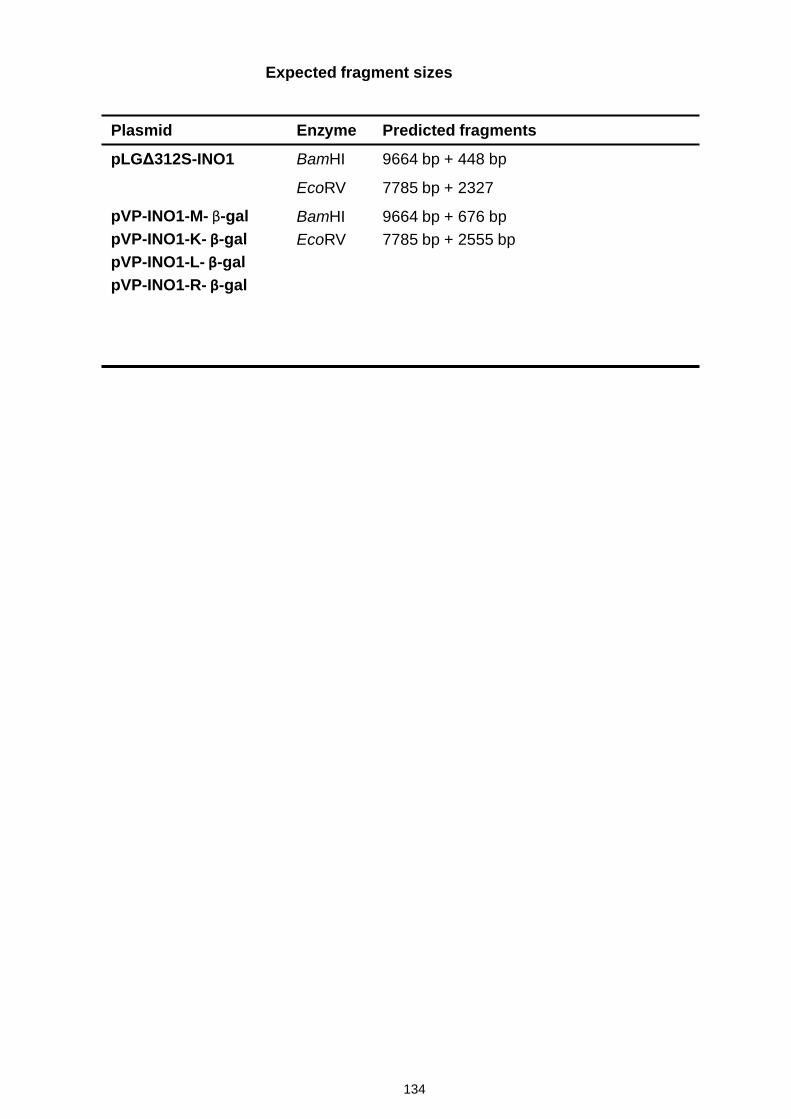
Expected fragment sizes
Plasmid Enzyme Predicted fragments
pLGΔ312S-INO1 BamHI 9664 bp + 448 bp
EcoRV 7785 bp + 2327
pVP-INO1-M- β-gal pVP-INO1-K- β-gal pVP-INO1-L- β-gal pVP-INO1-R- β-gal
BamHI EcoRV
9664 bp + 676 bp 7785 bp + 2555 bp
134

pVP-M-β-gal
EcoR
V
Bam
HI
Unc
ut
EcoR
V
Bam
HI
Unc
ut
EcoR
V
Bam
HI
Unc
ut
EcoR
V
Bam
HI
Unc
ut
EcoR
V
Bam
HI
Unc
ut
Clone 1 Clone 2 Clone 1 Clone 2
pVP-K-β-gal pLGΔ312S
pVP-L-β-gal pVP-R-β-gal pLGΔ312S
pLGΔ312S
Figure 3.6D. Confirmation of pVP-M-β-gal, pVP-K-β-gal, pVP-L-β-gal and pVP-R-β-gal reporter plasmids. The plasmids digested with BamHI and EcoRV showing the expected fragment sizes were confirmed by sequencing.
EcoR
V
Bam
HI
Unc
ut
EcoR
V
Bam
HI
Unc
ut
EcoR
V
Bam
HI
Unc
ut
EcoR
V
Bam
HI
Unc
ut
EcoR
V
Bam
HI
Unc
ut
Clone 1 Clone 2 Clone 1 Clone 2
EcoR
V
Bam
HI
Unc
ut
10kBp
3kBp
2kBp
1kBp
0.5kBp
10kBp
3kBp
2kBp
1kBp
135

Plasmid Enzyme Predicted fragments
pLGΔ312S BamHI 10063 bp
EcoRV 7785 bp + 2278 bp
pVP-M- β-gal pVP-K- β-gal pVP-L- β-gal pVP-R- β-gal
BamHI EcoRV
10291 bp 7785 bp + 2506 bp
Expected fragment sizes
136

pVP-IME2-Q-β-gal
Bau
I
Bam
HI
Unc
ut
Clone 1 Clone 2 Clone 1 Clone 2
pVP-IME2-I-β-gal
pVP-IME2- R-β-gal
Bau
I
Bam
HI
Unc
ut
Bau
I
Bam
HI
Unc
ut
Bau
I
Bam
HI
Unc
ut
Bau
I
Bam
HI
Unc
ut
pVP-INO1-Q-β-gal
Bau
I
Bam
HI
Unc
ut
Clone 1 Clone 2 Clone 1 Clone 2
pVP-INO1-I-β-gal
pVP-INO1- R-β-gal
Bau
I
Bam
HI
Unc
ut
Bau
I
Bam
HI
Unc
ut
Bau
I
Bam
HI
Unc
ut
Bau
I
Bam
HI
Unc
ut
Figure 3.6E. Confirmation of pVP-IME2-Q-β-gal, pVP-IME2-I-β-gal, pVP-INO1-Q-β-gal and pVP-INO1-I-β-gal reporter plasmids. The plasmids digested with BamHI and EcoRV showing the expected fragment sizes were confirmed by sequencing.
10kBp 6kBp
3kBp
1kBp
0.5kBp
10kBp 6kBp
3kBp
1kBp
0.5kBp
137

pVP-Q-β-gal
Bau
I
Bam
HI
Unc
ut
Clone 1 Clone 2 Clone 1 Clone 2
pVP-I-β-gal
pVP-M-β-gal
Bau
I
Bam
HI
Unc
ut
Bau
I
Bam
HI
Unc
ut
Bau
I
Bam
HI
Unc
ut
Bau
I
Bam
HI
Unc
ut
Plasmid Enzyme Predicted fragments
pVP-IME2-R-β-gal
BamHI BauI
9664bp + 673bp 5250bp + 3442bp + 1384bp + 307bp
pVP-IME2-I-β-gal pVP-IME2-Q-β-gal
BamHI BauI
9664bp + 673bp 4092bp + 3442bp + 1384bp + 1158bp + 307bp
pVP-INO1-R-β-gal
BamHI BauI
9664bp + 676bp 5207bp + 3442bp + 1384bp + 307bp
pVP-INO1-I-β-gal pVP-INO1-Q-β-gal
BamHI BauI
9664bp + 676bp 4049bp + 3442bp + 1384bp + 1158bp + 307bp
pVP-M-β-gal
BamHI BauI
10337bp 5158bp + 3442bp + 1384bp + 307bp
pVP-I-β-gal pVP-Q-β-gal
BamHI BauI
9664bp + 673bp 4000bp + 3442bp + 1384bp + 1158bp + 307bp
Expected fragment sizes
Figure 3.6F. Confirmation of pVP-Q-β-gal and pVP-I-β-gal reporter plasmids. The plasmids digested with BamHI and EcoRV showing the expected fragment sizes were confirmed by sequencing.
10kBp 6kBp
3kBp
1kBp
0.5kBp
138

Figure 3.6G. Comparison of lacZ N-terminal amino acid residues of URS1-CYC1-Ub-X-lacZ reporter plasmids. URS1-CYC1-Ub-X-lacZ reporter plasmids were sequenced and confirmed for the N-terminal amino acid by comparing it to the original plasmids; pUB23-M and pLGΔ312S. pVP-I-β-gal and pVP-Q-β-gal plasmid sequences with BauI silent restriction site introduced by site-directed mutagenesis. DNA bases are colour coded and amino acids are black colour.
Ubiquitin - 76 aa β-galactosidase - 1045 aa
C.ACGAG
BauI
139

140
3.4 Validation of URS1-CYC1-Ub-X-lacZ reporters
The newly constructed reporters (now called URS1-CYC1-Ub-X-lacZ reporter)
express chimeric ubiquitin-β-galactosidase protein, which is designed to have a
decreased half-life due to destabilizing amino acid residues at the N-terminal end of
the β-galactosidase. Expression of β-galactosidase from URS1-CYC1-Ub-X-lacZ
reporter is driven by the CYC1 promoter and is expected to be mitotically repressed
through URS1. β-Galactosidase with decreased half-life are expected to increase the
dynamic range of the assay and validate the use of these reporters to monitor the
transcriptional repression via URS1. To test whether the half-lives of destabilized β-
galactosidase has been decreased and validate the mitotic repression in newly
constructed reporter plasmids, we measured the steady state levels of β-
galactosidase in wild type strains. The URS1-CYC1-Ub-X-lacZ reporter plasmids
were transformed into a wild type strain and grown in synthetic acetate (PSP2)
medium, harvested in the exponential growth phase and frozen at -20oC before using
them for the β-galactosidase assays. The decreased steady state levels of the
destabilised β-galactosidase protein due to decreased half lives can be seen in
Figure 3.7. In the strains containing the plasmid with 0 URS1 sites, the β-
galactosidase levels have decreased ~five fold with leucine and arginine and ~15 fold
with glutamine at N-terminal amino acid as compared to the methionine residue at
the N-terminus. The β-galactosidase levels exposing destabilising N-terminal amino
acid residues (Q, L and R) have decreased steady state levels reflecting the lower
half-life as compared to β-galactosidase with methionine at the N-terminal end
(compare zero URS1 sites). The β-galactosidase levels for isoleucine were very low
and so were omitted in the later experiments. On comparing β-galactosidase levels
exposing methionine residues without URS1 sites, there was ~three fold repression
with URS1 (compare zero URS1 to one and two URS1 with methionine residues).
There was ~1.5-2.5 fold repression with leucine and arginine amino acids containing
one and two URS1 as compared to zero URS1 (compare zero to one and two URS1
for leucine and arginine). There was no remarkable increase in repression with an
increase in the number of URS1 elements with methionine, leucine and arginine
residues (compare one and two URS1).
The steady state levels have decreased when chimeric proteins start with
destabilising N-terminal amino acid residues. But surprisingly the presence of

141
ubiquitin moiety in the chimeric β-galactosidase led to repression in levels of β-
galactosidase exposing methionine residues (Figure 3.7) when compared to β-
galactosidase levels in figure 3.2. De-ubiquitination of the nascent ubiquitin-β-
galactosidase chimera was not affected by the type of amino acid at the ubiquitin-β-
galactosidase junction (Bachmair et al., 1986). Same study also showed that the half
life of the ubiquitin-Met-β-galactosidase and control β-galactosidase, which was not
fused to ubiquitin were comparable. This indicates that fusing ubiquitin to β-
galactosidase N-terminal end does not affect half life and therefore steady state
levels. However the variation in degradation of β-galactosidase encoded from slightly
different URS1-CYC1-Ub-lacZ reporters due ubiquitin moiety cannot be excluded
completely. It should be noted that while the repression in ubiquitin-Met-β-
galactosidase was reproducible, the magnitude of this repression was variable. This
is possibly caused due to protease susceptibility of ubiquitin-Met-β-galactosidase.
However, quantitatively more reproducible data was achieved by addition of protease
inhibitors to the extraction buffer. This is evident in the subsequent experiments,
where mitotic repression is reproducible and not over 1.5 fold (Figure 3.8 and 3.9).
The β-galactosidase levels are repressed in the presence of URS1, which
corroborates that the early meiotic gene promoters containing URS1 are maintained
in a repressed state under mitotic growth conditions and validating the assay system.
We selected the destabilised β-galactosidase reporters with leucine and arginine as
the N-terminal amino acid for further experiments as these constructs show lowered
steady state levels and repression in the presence of URS1.
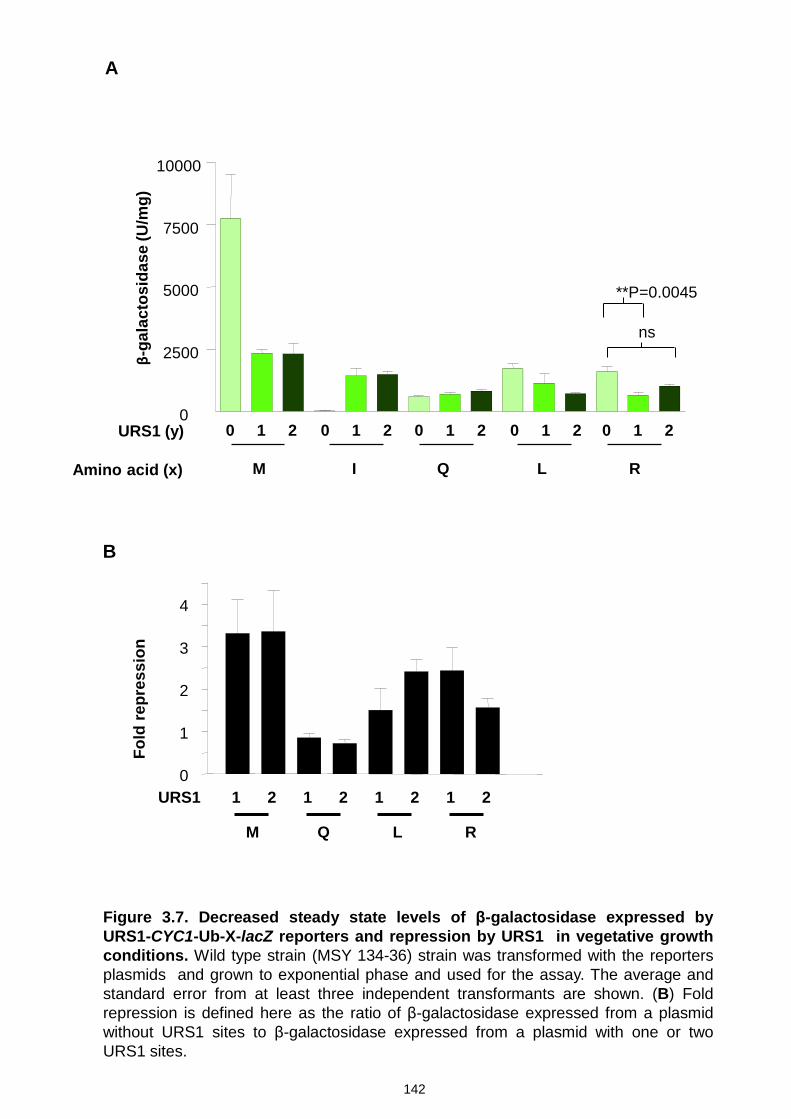
B
0 1 2 M
0 1 2 I
0 1 2 Q
0 1 2 L
0 1 2 R
0
2500
5000
7500
10000
URS1 (y)
Amino acid (x)
β-ga
lact
osid
ase
(U/m
g)
**P=0.0045
ns
A
Fold
repr
essi
on
URS1 1 2 1 2 1 2 1 2
M Q L R
0
1
2
3
4
Figure 3.7. Decreased steady state levels of β-galactosidase expressed by URS1-CYC1-Ub-X-lacZ reporters and repression by URS1 in vegetative growth conditions. Wild type strain (MSY 134-36) strain was transformed with the reporters plasmids and grown to exponential phase and used for the assay. The average and standard error from at least three independent transformants are shown. (B) Fold repression is defined here as the ratio of β-galactosidase expressed from a plasmid without URS1 sites to β-galactosidase expressed from a plasmid with one or two URS1 sites.
142

143
3.5 Discussion
In order to study the transcriptional repression by Hac1ip at URS1, I first looked at the
expression of URS1-CYC1-lacZ reporters in nitrogen-rich conditions. Kadosh and
Struhl, 1997 have demonstrated mitotic repression on URS1 with URS1-CYC1-lacZ
reporters based plasmids. Expression of β-galactosidase from CYC1-lacZ reporters
showed robust expression (figure 3.2) as compared to UAS-less reporters (Schröder
et al., 2004). Since URS1 is a mitotically repressed site, the level of β-galactosidase
containing URS1 under mitotic growth conditions should be lowered. When plasmids
containing two URS1 sites were compared to plasmids containing no URS1 site, the
repression in β-galactosidase levels directed by URS1 was not remarkable, but there
was a repressing trend (Figure 3.2). This indicates that URS1 sites in the CYC1
promoter do not show robust mitotic repression. Induced expression of Hac1ip didn’t
cause any further repression possibly due to long half-life of β-galactosidase (Figure
3.3). Therefore, β-galactosidase was destabilized using N-end rule. As a result,
URS1-CYC1-Ub-X-lacZ reporters were created and steady state levels of β-
galactosidase were decreased due to mitotic repression at URS1 (figure 3.7).

144
3.6 Demonstration of Hac1ip-mediated negative regulation of EMGs through URS1 using URS1-CYC1-Ub-X-lacZ reporters
In order to circumvent the potential problem caused by the long half-life of β-
galactosidase (>30 h) and masking of transcriptional repression mediated by URS1,
we used the destabilised URS1-CYC1-Ub-X-lacZ reporters. The leucine and arginine
amino acid residues at the N-terminal end of the lacZ coding region decreased the
half-life of β-galactosidase to three min and two min, respectively [(Bachmair and
Varshavsky, 1989; Balzi et al., 1990; Gonda et al., 1989) and Figure 3.7]. The levels
of β-galactosidase were also decreased in the presence of URS1 sites depicting the
repression under mitotic growth conditions (Figure 3.7). I employed URS1-CYC1-Ub-
X-lacZ reporters encoding β-galactosidase with decreased half-lives to test whether
Hac1ip represses through URS1 under nitrogen-rich conditions. In order to do this
Hac1ip was constitutively expressed from pRS314-HAC1i driven by its endogenous
promoter (Schröder et al., 2004). I chose plasmid constructs with methionine, leucine
and arginine at the ubiquitin-β-galactosidase junction to drive the expression of β-
galactosidase from URS1 sites. A WT strain was co-transformed with URS1-CYC1-
Ub-X-lacZ reporter (either containing zero or two URS1 sites) and pRS314-HAC1i.
Plasmid pRS314 was transformed as a vector control. The strains carrying the
combinations of the plasmids were grown in vegetative growth medium and
harvested at exponential phase of growth to measure β-galactosidase levels. In the
presence of Hac1ip, the URS1-CYC1-Ub-X-lacZ reporters with methionine and
leucine do not show any repression (Figure 3.8). Mitotic repression in the presence
of URS1 can be still seen (~1.3 fold for the methionine plasmid and ~three fold for the
leucine plasmid). β-Galactosidase levels expressed from arginine constructs donot
show remarkable mitotic repression seen in other constructs but show ~1.7 fold
repression in the presence of Hac1ip. Expression of Hac1ip does not cause any
decrease of β-galcatosidase levels. Therefore Hac1ip-mediated repression cannot be
concluded as expression of Hac1ip does not repress β-galactosidase URS1. β-
Galactosidase levels measured for constructs with arginine at the N-terminus of β-
galactosidase protein were barely detectable when the same number of cells were
used as for other constructs possibly due to decreased half-life of ~two min. This
causes variation in β-galactosidase assay and therefore a difficulty in using arginine
constructs.

145
The negative regulation of Hac1ip on early meiotic genes mediated by URS1 could
not be corroborated when URS1-CYC1-Ub-X-lacZ reporters were expressed in the
presence of Hac1ip expressed from its endogenous promoter in nitrogen-rich
conditions. The constitutive expression of Hac1ip from pRS314-HAC1i has been
shown by Schröder et al, 2004.

Figure 3.8. Expression of URS1-CYC1-Ub-X-lacZ reporters in the presence of Hac1ip. URS1-CYC1-Ub-X-lacZ reporters (X= M, L or R; URS1=0,1 or 2) are expressed in the presence of Hac1ip expressed from pRS314-HAC1i in WT strain (MSY 134-36). The fold repression is the ratio of β-galactosidase levels expressed from a plasmid with zero URS1 to β-galactosidase levels expressed from a plasmid with two URS1 sites. The average and standard error from at least three independent transformants are shown. (B) Fold repression is defined here as the ratio of β-galactosidase levels expressed from a plasmid without URS1 sites to β-galactosidase levels expressed from a plasmid with two URS1 sites.
URS1 0 2 0 2 0 2
Amino acid M L R
Vector
pRS314-HAC1i
0
1000
2000
3000
4000
5000
6000
7000
8000
9000
10000
ns ** P=0.0079
ns
β-ga
lact
osid
ase
(U/m
g)
A
0
1
2
3
4
Fold
repr
essi
on
Hac1ip - + - + - + M L R
B
146

147
3.7 Disruption of Hac1ip-mediated negative regulation in hac1Δ
The destabilisation of β-galactosidase in the URS1-CYC1-Ub-X-lacZ reporters did
not reveal repression mediated by Hac1ip through URS1 (Figure 3.8). This is
surprising because induced expression of Hac1ip repressed transcription of EMGs
and β-galactosidase levels from UAS less CYC1-lacZ reporters under nitrogen
starvation conditions suggested negative regulation of EMGs through URS1
(Schröder et al., 2000; Schröder et al., 2004). An alternative explanation is that
endogenously spliced Hac1ip under vegetative growth may be enough to mediate
repression through URS1 on early meiotic genes. To test whether endogenously
spliced Hac1ip under vegetative growth is sufficient to repress through URS1, I
decided to delete HAC1 and test URS1-CYC1-Ub-X-lacZ reporters in the hac1Δ
strains.
In order to demonstrate the repression caused by Hac1ip synthesized in vegetatively
growing cells, the URS1-CYC1-Ub-X-lacZ reporters were transformed into a HAC1
null mutant (hac1Δ) strain and a WT strain and grown under vegetative growth
conditions (synthetic minimal acetate medium; PSP2). β-Galactosidase levels were
measured from cells harvested at exponential phase (Figure 3.9). The methionine
plasmids show moderate mitotic repression (~1.5 fold) in the WT strain. When HAC1
was deleted, β-galactosidase levels were activated moderately (~0.68 fold) in the
presence of two URS1 sites. The β-galactosidase reporters with leucine as N-
terminal amino acid showed ~two fold repression in the presence of URS1 sites in
the WT strain. But in the absence of Hac1ip (hac1Δ) the leucine constructs showed
~0.17 fold activation in β-galactosidase levels (Figure 3.9B). When the WT strain
was compared to hac1Δ (Figure 3.9C), deletion of HAC1 leads to ~2.5 fold activation
with methionine plasmids and ~13 fold activation of β-galactosidase levels with
leucine plasmids. So the mitotic repression at URS1 is abolished in absence of
Hac1ip.
The repression by Hac1ip via URS1 is relieved when Hac1ip is deleted in HAC1 null
mutant suggesting the disruption of negative regulatory mechanism on URS1. The
activation of β-galactosidase levels under nitrogen-rich conditions in hac1Δ strains
indicates that Hac1ip also regulates URS1-controlled genes in nutrient-rich conditions
to repress meiosis.

Figure 3.9 Repression is relieved in the absence of Hac1ip. Expression of URS1-CYC1-Ub-X-lacZ reporters in a HAC1 null mutant (hac1Δ) and WT strain in minimal synthetic acetate (PSP2) medium. The amino acid residues at the N-terminus of β-galactosidase are methionine (M) and leucine (L). The average and standard error from at least three independent transformants are shown. (B) The fold repression depicts mitotic repression by URS1 sites. Fold repression is the ratio of β-galactosidase levels from a plasmid with zero URS1 sites to β-galactosidase levels from a plasmid with two URS1 sites and fold activation is the ratio of β-galactosidase levels from a plasmid with two URS1 sites to β-galactosidase levels from a plasmid with zero URS1 sites. (C) Activation of β-galactosidase levels is calculated as the ratio of the fold repression of WT to hac1Δ.
URS1 0 2 0 2
Amino acid M L
* P=0.04
β-ga
lact
osid
ase
(U/m
g)
0
1000
2000
3000
4000
5000
6000
7000
hac1∆ (MSY296-01)
WT (MSY138-17)
A
B C
M L
0
4
8
12
16
20
Fold
repr
essi
on
WT hac1Δ WT hac1Δ
M L
0
1
2
3
Fold
act
ivat
ion
WT/hac1Δ
148

149
3.8 Discussion
URS1-CYC1-Ub-X-lacZ reporters encoding β-galactosidase with decreased half lives
were tested in the presence of constitutively expressed Hac1ip. The negative
regulation of Hac1ip on early meiotic genes mediated by URS1 could not be seen in
URS1-CYC1-Ub-X-lacZ reporters (Figure 3.8). The cells in this experiment were
grown in minimal acetate medium (PSP2). PSP2 contains acetate as the sole source
of carbon. The level of HAC1 mRNA splicing is reported to be higher in the presence
of acetate as carbon source (2% acetate in YPAc) as compared to other carbon
sources tested (Schröder et al., 2000). Thus the abundance of Hac1ip under these
conditions (minimal acetate vegetative medium; 1% acetate) may be enough to
achieve constitutive repression on URS1 under mitotic growth conditions, which may
mask the repression that may be otherwise caused solely by Hac1ip expressed from
pRS314-HAC1i. When Hac1ip was deleted, β-galactosidase levels were derepressed
(Figure 3.9C), suggesting negative regulation at URS1. However, an experiment in
which HAC1i is ectopically expressed in hac1Δ strains would substantiate these data.
The URS1-CYC1-Ub-X-lacZ reporters studied here can be used in nutrient-rich
conditions to study transcriptional regulation on URS1-controlled genes in future
work.
Chapter 4
Transcriptional regulation of metabolic genes under nutrient rich condition

150
4.1 Ume6p in regulation of URS1-controlled genes
Using URS1-CYC1-Ub-L-lacZ reporter with leucine residue at the N-terminal end of
β-galactosidase I showed that insertion of the URS1 sites decreases steady state
level of β-galactosidase. However this was not seen convincingly earlier with
methionine plasmids. It is known that the URS1 site is occupied by
Ume6p/Sin3p/Rpd3p repressing the transcription in vegetative growth conditions
(Schröder et al., 2004). The ISW2-ITC1 chromatin remodelling complex is also
recruited by Ume6p under mitotic growth in a parallel pathway to RPD3-SIN3 HDAC
complex (Goldmark et al., 2000). To validate if the repression of URS1-CYC1-Ub-L-
lacZ reporter can be attributed to the known repressing mechanism of URS1 where
recruitment of ISW2-ITC1 and RPD3-SIN3 by Ume6p to URS1 site leads to
repression in vegetatively growing cells, I looked at the URS1-controlled lacZ
expression by expressing URS1-CYC1-Ub-L-lacZ reporters in an ume6Δ strain. The
WT strain showed ~2.5 fold mitotic repression through URS1. However, deletion of
UME6 led to a ~4.5 fold increased levels of β-galactosidase as compared to WT in
the presence or absence of URS1 (Figure 4.1). Thus, ume6Δ leads to elevated
expression of URS1-CYC1-Ub-L-lacZ reporters, which suggests that either Ume6p
negatively regulates components of an activating mechanism/binding of these
components to URS1 or other cis-acting sites in the CYC1 promoter. It is also
possible that deletion of Ume6p causes disruption of Ume6p/Rpd3p/Sin3p repressing
unit which leads to recruitment of histone modifying complexes that activate the
transcription at URS1.

Figure 4.1 Ume6p in the regulation of URS1 controlled genes. URS1-CYC1-Ub-X-lacZ (X= L; leucine) reporters were expressed in ume6Δ strain and WT. The average and standard error from at least three independent transformants are shown. (B) The fold repression depicts mitotic repression by URS1 sites. Fold repression is calculated as the ratio of β-galactosidase levels from a plasmid with zero URS1 sites to β-galactosidase levels from a plasmid with two URS1 sites in the strains indicated. (C) Fold activation is the ratio of β-galactosidase levels from WT to β-galactosidase levels from ume6Δ.
0
1
2
3
4
5
6
Fold
repr
essi
on
WT ume6Δ
URS1 0 2
0
1000
2000
3000
4000
5000
6000
7000
ume6∆ (MSY 184-55)
WT (MSY134-36)
*** P=0.0001
β-ga
lact
osid
ase
(U/m
g)
A
C B
0
1
2
3
4
5
6
Fold
act
ivat
ion
0 2 URS1
151

152
4.2 RPD3-SIN3 histone deacetylase complex in regulation of URS1-controlled genes under nutrient-rich conditions
The transcriptional repression of early meiotic genes involves function of the RPD3-
SIN3 histone deacetylase (HDAC) complex and the ISW2-ITC1 chromatin
remodelling complex. The RPD3-SIN3 HDAC is a large multiprotein complex involved
in regulation of a wide range of genes in meiosis, metabolism, osmotic stress,
telomere boundary regulation and anaerobic growth (De Nadal et al., 2004;
Ehrentraut et al., 2010; Kadosh and Struhl, 1997; Rundlett et al., 1998; Vidal and
Gaber, 1991). Rpd3p functions as histone deacetylase and Sin3p is a co-repressor
which is recruited by Ume6p to the promoters of early meiotic genes (Kadosh and
Struhl, 1997). Schröder et al., 2004 showed that Hac1ip interacts physically with
Rpd3p-Sin3p HDAC to mediate nitrogen-mediated negative regulation of EMG
transcription and that the catalytic activity of Rpd3p is required for this negative
regulation. They also showed that the Ume6p binding site URS1 is the site of Hac1ip-
mediated repression. To test whether the RPD3-SIN3 complex is involved in
regulation of URS1-CYC1-Ub-X-lacZ reporters as reported for URS1-controlled
EMGs under nitrogen-rich conditions, we expressed URS1-CYC1-Ub-X-lacZ
reporters in a strain deleted for RPD3 on minimal synthetic medium (PSP2).
The WT strain shows ~2 fold repression in the presence of URS1 (Figure 4.2). But in
the absence of Rpd3p (rpd3Δ), β-galactosidase levels are not only decreased (~2.5
fold) with URS1 but also when compared to WT (Figure 4.2B). This was surprising
as Kadosh and Struhl, 1997 have shown using URS1-CYC1-lacZ reporters that the
deletion of Rpd3p showed moderate derepression (~four fold). Next I looked at Sin3p
which is a component of Rpd3p-Sin3p HDAC multiprotein complex involved in
transcriptional repression at EMGs. Sin3p, which acts as a co-repressor is recruited
to URS1 by Ume6p. Sin3p then targets Rpd3p HDAC to deacetylate early meiotic
gene promoters and to mediate transcriptional repression. To test whether the known
function of Sin3p is involved in regulation of URS1-CYC1-Ub-X-lacZ reporters, I
expressed URS1-CYC1-Ub-X-lacZ reporters in sin3Δ strains under vegetative growth
conditions. In the presence of Sin3p (WT), the β-galactosidase levels decreased in
the plasmids containing URS1 (~2.5 fold), but when Sin3p was deleted the β-
galactosidase levels elevated not only in the presence of URS1, but also in the
absence of URS1 (Figure 4.3). When the WT strain is compared to sin3Δ strain, β-

153
galactosidase levels elevated to ~three fold (Figure 4.3C). Thus, the mitotic
repression seen in the WT strain (~2.5 fold) is not seen in sin3Δ strain and deletion of
Sin3p elevated β-galactosidase levels in absence or presence of URS1.
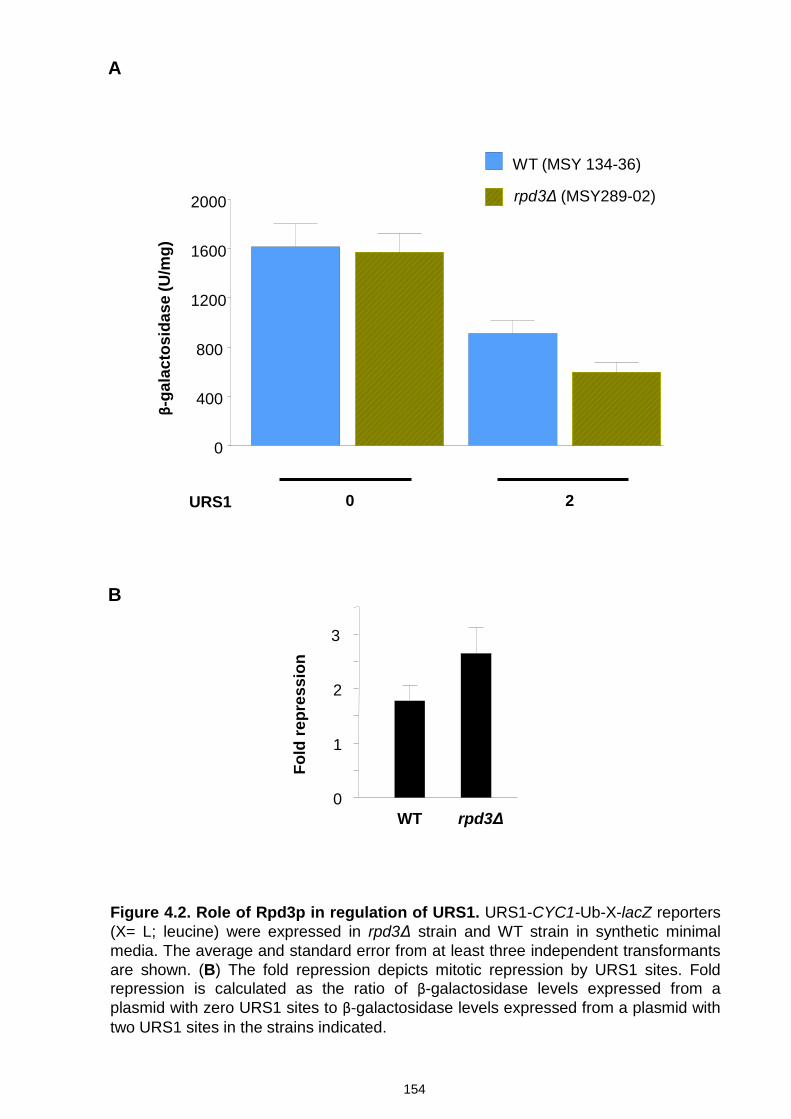
Figure 4.2. Role of Rpd3p in regulation of URS1. URS1-CYC1-Ub-X-lacZ reporters (X= L; leucine) were expressed in rpd3Δ strain and WT strain in synthetic minimal media. The average and standard error from at least three independent transformants are shown. (B) The fold repression depicts mitotic repression by URS1 sites. Fold repression is calculated as the ratio of β-galactosidase levels expressed from a plasmid with zero URS1 sites to β-galactosidase levels expressed from a plasmid with two URS1 sites in the strains indicated.
0
1
2
3
Fold
repr
essi
on
WT rpd3Δ
URS1 0 2
0
400
800
1200
1600
2000
WT (MSY 134-36)
rpd3Δ (MSY289-02)
β-ga
lact
osid
ase
(U/m
g)
A
B
154

Figure 4.3 Role of Sin3p in regulation of URS1-CYC1-Ub-X-lacZ reporters. URS1-CYC1-Ub-X-lacZ reporters (X= L; leucine) were expressed in the absence of Sin3p (sin3Δ) in minimal synthetic medium. (B) The fold repression depicts mitotic repression by URS1. Fold repression is calculated as the ratio of β-galactosidase levels expressed from a plasmid with zero URS1 sites to β-galactosidase levels expressed from a plasmid with two URS1 sites. (C) Activation of β-galactosidase levels is calculated as the ratio of the fold repression of WT to the fold repression of sin3Δ from (B). The β-galactosidase levels shown are an average and standard error from at least three independent transformants.
WT (MSY 134-36)
0
1000
2000
3000 sin3Δ (RCY 20-05)
URS1 0 2
β-ga
lact
osid
ase
(U/m
g)
A
WT sin3Δ
B
WT/sin3Δ
C
0
1
2
3
4
0
1
2
3
Fold
repr
essi
on
Fold
act
ivat
ion
155

156
4.3 Role of ISW2-ITC1 chromatin remodelling complex in regulation of URS1-controlled genes
ISW2 and ITC1, which are components of the Isw2p-Itc1p ATP dependent chromatin
remodelling complex are recruited by UME6 to repress early meiotic genes
(Goldmark et al., 2000) and other non-meiotic genes like INO1 (Sugiyama and
Nikawa, 2001). The Isw2p complex creates a nuclease inaccessible chromatin
structure upstream of the Ume6p binding site in target promoters (Goldmark et al.,
2000). The Itc1p-Isw2p chromatin remodelling complex was not involved in Hac1ip-
mediated repression under nitrogen starvation conditions (Schröder et al., 2004).
However, I wanted to investigate and validate the role of the chromatin remodelling
complex ISW2-ITC1 in repression at URS1 of URS1-CYC1-Ub-X-lacZ reporters
under nutrient-rich conditions. In order to test whether the same mechanism of
repression by ISW2 and ITC1 on URS1-controlled genes in mitotic growth conditions
as reported is also functional on the URS1-CYC1-Ub-X-lacZ reporters we
transformed URS1-CYC1-Ub-X-lacZ reporters into isw2Δ cells. The cells were
harvested at exponential growth phase and after lysis, β-galactosidase assays were
performed. WT strain shows ~2.5 fold repression and isw2Δ strain shows ~1.2 fold
repression in the presence of URS1 (Figure 4.4B). Deletion of Isw2p led to ~fourfold
and ~tenfold elevated expression of β-galactosidase in absence and presence of
URS1 respectively (Figure 4.4A). This suggests that ISW2 may be negatively
affecting transcription of the URS1-CYC1-Ub-X-lacZ reporter at sites other than
URS1. Itc1p is also a component of ISW2-ITC1 complex and so I wanted to test
whether Itc1p was responsible for repression of β-galactosidase levels of URS1-
CYC1-Ub-X-lacZ reporters. Levels of β-galactosidase expressed from URS1-CYC1-
Ub-X-lacZ reporters in itc1Δ strains were measured. WT strain shows ~2.5 fold
mitotic repression, while this repression is lost when ITC1 was deleted (Figure 4.5B).
Deletion of itc1Δ led to ~three fold activation in presence of URS1 but there was no
change in absence of URS1 (Figure 4.5), which indicates that ITC1 is involved in
repression at URS1 in URS1-CYC1-Ub-X-lacZ reporters as has been reported
earlier. The elevated levels of β-galactosidase in the presence or absence of URS1 in
figure 4.4 indicates that this activation may be independent of URS1. When Itc1p is
deleted, β-galactosidase levels are derepressed only in presence of URS1, indicating
that ITC1 is involved in the repression machinery at the URS1 site. Thus deletion of

157
ITC1 shows that repression at URS1 of URS1-CYC1-Ub-X-lacZ reporters is lost, but
when ISW2 is deleted, β-galactosidase levels are elevated even in the absence of
URS1 indicating that ISW2 may be acting independently of ITC1.

Figure 4.4. Role of Isw2p in regulation of URS1 mediated repression. URS1-CYC1-Ub-X-lacZ reporters (X= L;leucine) were expressed in isw2Δ strain and WT strain. (B)The fold repression depicts mitotic repression. Fold repression is calculated as the ratio of β-galactosidase levels expressed from a plasmid with zero URS1 sites to β-galactosidase levels expressed from a plasmid with two URS1 sites. (C) Fold activation is calculated as the ratio of fold repression of WT to fold repression of isw2Δ levels from (B). The β-galactosidase levels are an average and standard error of at least three independent transformants.
0
1
2
3
Fold
repr
essi
on
WT isw2Δ
isw2Δ (MSY 283-06)
URS1 0 2
WT (MSY 134-36)
0
1000
2000
3000
4000
5000
6000
7000
β-ga
lact
osid
ase
(U/m
g)
A
B C
0
1
2
3
Fold
act
ivat
ion
WT/isw2Δ
158

Figure 4.5 Itc1p is involved in regulation of URS1 mediated repression. URS1-CYC1-Ub-X-lacZ (X= L;leucine) reporters were expressed in itc1Δ strain. (B) The fold repression depicts mitotic repression by URS1. Fold repression is calculated as the ratio of β-galactosidase levels expressed from a plasmid with zero URS1 to β-galactosidase levels expressed from a plasmid with two URS1. (C) Fold activation of β-galactosidase levels is calculated as the ratio of the fold repression of WT to the fold repression of itc1Δ from values in (B). The average and standard error from at least three independent transformants are shown.
URS1 0 2
0
1000
2000
WT (MSY134-36)
itc1∆ (MSY301-03)
β-ga
lact
osid
ase
(U/m
g)
A
WT itc1Δ
B C
0
1
2
3
Fold
repr
essi
on
0
1
2
3
4
WT/itc1Δ
Fold
act
ivat
ion
159
160
4.4 Discussion
Deletion of Ume6p leads to activation of β-galactosidase in the absence of URS1
(Figure 4.1) suggesting that Ume6p may be regulating other sites causing activation
of URS1-CYC1-Ub-X-lacZ reporters without URS1. The URS1-CYC1-Ub-X-lacZ
reporters used in this study contains the CYC1 fragment from -324 to +141 that
includes two UASCYC1 sites, the TATA region and URS1 elements cloned
immediately upstream of UASCYC1 [(Guarente and Mason, 1983; Kadosh and Struhl,
1997) and Figure 3.1C]. UASCYC1 from the promoter region of the CYC1 gene
encoding iso-1-cytochrome c is tightly regulated by levels of intracellular heme
(Guarente and Mason, 1983). CYC1 is also induced by oxygen and lactate, and
repressed by glucose (Boss et al., 1980; Guarente and Hoar, 1984; Guarente and
Mason, 1983; Hortner et al., 1982). Induction of oxygen occurs through binding of the
transcription factor Hap1p to UAS1 in the CYC1 promoter (Pfeifer et al., 1987), while
repression in the presence of glucose is mediated by binding of Mig1p and the
CCAAT-binding activator complex subunits Hap2p, Hap3p, Hap4p and Hap5p to
UAS2 in the CYC1 promoter (Olesen et al., 1987; Treitel and Carlson, 1995). It is
likely that regulation of Hap1p or Hap2p-3p-4p-5p complex on UASCYC1 is somehow
negatively regulated by Ume6p, because UME6 is not only a meiosis specific
regulator but also regulates genes involved in arginine catabolism (Strich et al.,
1994), peroxisomal function (FOX3) (Einerhand et al., 1995) and DNA repair genes
(PHR1) (Sweet et al., 1997). Microarray data show that HAP1 gene was derepressed
in ume6Δ (Table 4.1). The HAP4 gene, whose gene expression provides
transcriptional activation domain to the Hap2p-3p-4p-5p complex showed a small
increase in transcription (Williams et al., 2002). So it can be conceived that HAP1
encoding a zinc finger transcription factor, which requires homodimerization for high
affinity DNA-binding to UAS1 may be regulated by UME6. Other regulatory
mechanisms barring the transcriptional level regulation by Ume6p cannot be
excluded for regulation at UASCYC1.
It can be conceived that Ume6p is involved in activation of URS1-CYC1-Ub-X-lacZ
reporters also through UASCYC1 and looking at the genes regulated by Hap1p in
ume6Δ strains may throw more light on understanding of UME6 targets. Also
understanding the UASCYC1 regulatory mechanism promises to be of particular

161
interest as the core CYC1 promoter is used in investigation of transcriptional
activation and repression.
Table 4.1. Microarray data showing expression of HAP genes in UME6 and ume6Δ
strains of SK1 genetic background [data from (Williams et al., 2002)]
Sr. No Gene Normalized intensity
UME6 ume6Δ
1. HAP1 144 237
2. HAP2 87 508
3. HAP3 587 311
4. HAP4 2380 2603
5. HAP5 205 498
6. CYC1 2097 2762
In the absence of Rpd3p (rpd3Δ), there was a decrease in the levels of β-
galactosidase as compared to wild type, but when Sin3p was deleted the repression
on URS1 was derepressed. The behaviour of rpd3Δ cells may be not that surprising
as Kadosh and Struhl, 1997 suggested that sin3Δ strain lost URS1-dependent
transcriptional repression to a larger degree than in rpd3Δ strain. Moreover the effect
of deletion of Rpd3p on repression could be compensated by other related HDAC
(Rundlett et al., 1996) with Sin3p (Figure 4.2). The elevated expression of β-
galactosidase in sin3Δ strains in the absence of URS1 sites indicates that Sin3p
regulates another site in URS1-CYC1-Ub-X-lacZ reporters (Figure 4.3). The data
also suggests that Sin3p may have repressing function as β-galactosidase levels are
elevated in sin3Δ. The contribution of transcriptional repression by Sin3p has been
earlier suggested to be minor (Kadosh and Struhl, 1997), but the data here shows
that the contribution of Sin3p is not minor. Presumably other sites in the CYC1
promoter region of URS1-CYC1-Ub-X-lacZ reporters exist where Sin3p mediates
repression. Mutations in Sin3p or Sin3p binding sites in CYC1 promoter region that
may be responsible for this repression can provide more insight into Sin3p mediated
repression.

162
Deletion of ISW2 results in mitotic transcriptional derepression of many genes
normally induced under meiosis (Goldmark et al., 2000). Deletion of ISW2 here
elevated expression of β-galactosidase from URS1-CYC1-Ub-X-lacZ reporters even
without URS1 (Figure 4.4) suggesting that Isw2p acts on other sites in this reporter.
ISW1, another member of imitation switch (ISWI) class and ISW2 act redundantly
with Chd1p in regulation of CYC1 (Alén et al., 2002). It can be speculated from this
data that ISW2 may be repressing on sites other than URS1, which may be activated
when ISW2 is deleted because Hap1p binding to UAS1 in the CYC1 promoter region
was restored in isw2Δ strains because of loss of nucleosome positioning (Morohashi
et al., 2007). Therefore, deletion of ISW2 may open chromatin structure around the
CYC1 promoter region in URS1-CYC1-Ub-X-lacZ reporters which may lead to
activation of β-galactosidase. Isw2p and Itc1p have been suggested to act in the
same pathway (Gelbart et al., 2001), but when ITC1 was deleted β-galactosidase
were elevated only in the presence of URS1. This suggests negative regulation was
lost at URS1 when ITC1 was deleted. Therefore elevated β-galactosidase levels in
the absence of URS1 in isw2Δ strain, suggests that ISW2 may be acting
independently of ITC1 at sites other than URS1 in URS1-CYC1-Ub-X-lacZ reporters.
The itc1Δ strain shows that the regulation on URS1 is lost (Figure 4.5) and this can
be explained by the fact that a population of Itc1p preferentially interacts with Ume6p
besides its interaction with Ume6p and Isw2p (Goldmark et al., 2000).

Chapter 5
Pseudohyphal growth on non-fermentable carbon
sources

163
5.1 Pseudohyphal growth on non-fermentable carbon sources
The yeast S. cerevisiae show different growth patterns including yeast and
pseudohyphal forms depending on the environmental cues and cell type. Under
nitrogen deplete conditions and in the presence of fermentable carbon sources, S.
cerevisiae differentiate to form pseudohyphae, which is characterized by an
elongated cell shape, unipolar budding, symmetric cell division, adhesion of cells to
each other after cell division is completed and invasion of solid growth media
(Gimeno et al., 1992; Kron et al., 1994). The formation of pseudohyphal growth
requires coordination of at least two signalling pathways, the mating and
filamentation mitogen activated protein kinase (MAPK) signalling cascade and the
cAMP-dependent protein kinase A (PKA) pathway. These pathways may act in a
parallel and partially overlapping manner. The unfolded protein response (UPR)
represses pseudohyphal growth and meiosis under nitrogen-rich conditions.
However, when the UPR pathway is compromised under sporulation-inducing
conditions the cells respond inappropriately by switching to pseudohyphal growth.
ire1Δ/ire1Δ and hac1Δ/hac1Δ diploids also showed increased pseudohyphal growth
and expression of spliced Hac1ip repressed pseudohyphal growth. The splicing of
HAC1 mRNA was higher in the presence of acetate as non-fermentable carbon
source compared to other carbon sources (Schröder et al., 2000), suggesting that
repression of pseudohyphal growth by the UPR is especially an effect of non-
fermentable carbon source. So non-fermentable carbon sources repress
pseudohyphal growth and presence of acetate under pseudohyphal growth
conditions (glucose and nitrogen limiting) may affect the cell’s response. Therefore,
we tested whether a/α diploid cells under pseudohyphal growth-inducing conditions
were affected by the presence of acetate in the SK1 genetic background. The
pseudohyphal growth conditions, in the presence of glucose and nitrogen limiting
conditions (SLAD plates; glucose and 50 μM ammonium sulfate) induced moderate
pseudohyphal growth, characterized by branching chains of cells extruding away
from the centre of the colony (Figure 5.1). Surprisingly, when acetate was included in
the media containing glucose and limiting ammonium sulphate, a/α diploid cells show
enhanced pseudohyphal growth (Figure 5.1). Besides acetate other non-fermentable
carbon sources are also utilised to generate energy through respiration and so we
wanted to check whether other non-fermentable carbon sources also showed a

164
similar effect on pseudohyphal growth. L-lactate, pyruvate, glycerol and ethanol were
added to glucose and tested for pseudohyphal growth. Pseudohyphal growth was
also enhanced in the presence of other non-fermentable carbon sources as well
(Figure 5.1). Enhanced pseudohyphal growth in the presence of acetate and other
non-fermentable carbon sources under pseudohyphal growth inducing conditions
was surprising for two reasons. Firstly, the utilization of non-fermentable carbon
sources is repressed in the presence of glucose (Gancedo, 1998; Schüller, 2003)
and secondly non-fermentable carbon sources have been shown to induce meiosis
and not pseudohyphal growth (Gimeno et al., 1992; Kupiec et al., 1997). These
observations should be noted with the background information that pseudohyphal
growth is widely investigated in Σ1278b strain background (Gimeno et al., 1992),
while SK1, which is an efficiently sporulating strain (Kane and Roth, 1974) is
employed in studying meiosis. In contrast to SK1 strain nonfermentable carbon
sources inhibit pseudohyphal growth in Σ1278b WT strain (Strudwick et al., 2010).
The presence of glucose represses several enzymes of citric acid cycle and
respiratory chain (Schüller, 2003). However, the nitrogen limiting conditions on SLA
plates may derepress genes encoding citric acid cycle enzymes as reported for
rapamycin treated cells grown on glucose (Hardwick et al., 1999). Therefore it is
possible that non-fermentable carbon sources require the metabolic and respiratory
function to induce pseudohyphal growth. To test whether respiratory function is
required for inducing pseudohyphal growth in presence of non-fermentable carbon
sources respiration deficient petite mutants were created. The respiration deficiency
was checked by the inability of petite mutants to grow on plates containing only non-
fermentable carbon source like acetate as seen in figure 5.1A. The petite mutants
were grown on glucose supplemented with various non-fermentable carbon sources.
Pseudohyphal growth was unchanged in respiration-deficient petite mutants
compared to a wild type strain, indicating that respiration is not required for induction
of pseudohyphal growth by non-fermentable sources in the SK1 genetic background
(Figure 5.1). These results also suggest that moderate pseudohyphal growth on
glucose may be caused by fermentation by-products like ethanol, since ethanol also
stimulates pseudohyphal growth [(Figure 5.1) (Lorenz et al., 2000a)]. S. cerevisiae
cells may be detecting its own metabolic by-products to sense the environment and
evoke signalling to decide the cell fate. However, there is evidence that petite

165
mutants in Σ1278b background are unable to undergo filamentous growth and
require mitochondrial function (Kang and Jiang, 2005).

Figure 5.1 Non-fermentable carbon sources induce pseudohyphal growth and respiratory function is not required for induction of pseudohyphal growth. (A) Growth of WT (AMP109) and a petit mutant (ρ0) on acetate as carbon source. (B) AMP109 strain was grown on SLA agar plates containing 50 µM (NH4)2SO4, yeast nitrogen base without amino acids and (NH4)2SO4, different carbon sources as indicated and amino acids to complement amino acid auxotrophy. The colony morphology after 7 d growth is shown.
D-Glucose
Acetate
Nitrogen starvation
L-Lactate
Pyruvate
Glycerol
Ethanol
D-G
luco
se +
ρ0 WT B
YPD YPAc
WT
ρ0
A
166

167
5.2 Role of mitochondrial retrograde signalling pathway in regulation of pseudohyphal growth
The non-fermentable carbon sources therefore induce pseudohyphal growth
independent of their use as respiratory energy source. The SLAD plates used here
lack glutamate and so cells need to synthesize glutamate, which is the main
precursor of other amino acids. Glutamate and its metabolite glutamine are a source
of all nitrogen utilized by yeast in biosynthetic reactions (Magasanik and Kaiser,
2002). Growth under pseudohyphal growth conditions in the presence of non-
fermentable carbon sources and absence of glutamate (Figure 5.1) suggests that
early steps of the TCA cycle must be activated to meet the demand for glutamate.
Mitochondrial retrograde (RTG) signalling is closely associated with the carbon and
nitrogen metabolism in yeast cells and the main function of the RTG signalling
pathway is to maintain glutamate levels in the cell (Magasanik and Kaiser, 2002).
Rapamycin inhibits TOR kinases and induces expression of RTG-dependent target
genes (Komeili et al., 2000), which increases the pool of glutamine and glutamate.
RTG genes induce expression of the first three steps of the TCA cycle, CIT2 (citrate
synthase) involved in the glyoxylate cycle and DLD3 (D-lactate dehydrogenase).
CIT2 is an enzyme in the glyoxylate cycle that enables yeast cells to utilize acetate
and ethanol as sole carbon source. The transcript profiles of genes regulated by the
RTG pathway in SK1 genetic background strain were found upregulated as
compared to Σ1278b strain background (Table 5.1). Σ1278b is normally used to
study pseudohyphal growth and non-fermentable carbon sources inhibit
pseudohyphal growth in this strain background (Gimeno et al., 1992; Strudwick et
al.). To test whether activation of RTG genes in the SK1 background are responsible
for induction of pseudohyphal growth in the presence of glucose and acetate, we
created rtg deletion strains and tested their growth on plates containing low nitrogen,
glucose in the presence or absence of non-fermentable carbon sources.
Pseudohyphal growth was unchanged in rtg2Δ and rtg3Δ strains compared to WT
showing that RTG pathway here is not involved in regulation of pseudohyphal growth
on non-fermentable carbon sources (Figure 5.2). There was no difference in the WT
and the mutants in the presence of glucose. Deletion of RTG genes leads to
glutamate auxotrophy. The rtg1Δ strains I used were also arginine auxotrophs.

168
Therefore, rtg1Δ strains did not grow on SLA plates, which lack glutamate and
arginine and therefore could not be tested here.

Figure 5.2 Role of RTG signalling pathway in induction of pseudohyphal growth on non-fermentable carbon source. Mitochondrial retrograde (RTG) signalling pathway mutants rtg2Δ and rtg3Δ strains were grown on nitrogen limiting conditions as in figure 6.1
169
D-Glucose
D-Glucose +Acetate
Nitrogen starvation
WT rtg2Δ rtg3Δ

170
5.3 Discussion
Non-fermentable carbon sources trigger pseudohyphal growth under nitrogen limiting
conditions supplemented with glucose (Figure 5.1) in the SK1 genetic background.
Stimulation of pseudohyphal growth in respiration deficient cells suggested that
respiration function of the cell is not required for induction of pseudohyphal growth.
These findings have partly been published in Strudwick et al, 2010. The difference in
response to acetate stimuli in SK1 strain compared to Σ1278b strain is attributed
differences in cyclic AMP (cAMP) signalling. Elevated cAMP signalling in Σ1278b
background has been shown to inhibit pseudohyphal growth (Strich et al., 1994;
Strudwick et al., 2010).
Deletion of mitochondrial RTG pathway components did not affect the enhanced
growth stimulated by non-fermentable carbon sources (Figure 5.2). Pseudohyphal
growth was unchanged when acetate was provided in addition to glucose in rtg2Δ
and rtg3Δ indicating that RTG pathway may not be involved in regulation of
pseudohyphal growth in the presence of non-fermentable carbon sources. The
response to carbon source is regulated by a number of pathways but in the presence
of glucose, utilization of alternate carbon sources is inhibited due to glucose
repression. Non-fermentable carbon sources like ethanol and acetate are converted
to acetyl-CoA which is catabolised by TCA cycle in mitochondria or assimilated in
peroxisomes for gluconeogenesis. The RTG deletion strains growing on SLAD plates
in the absence of glutamate indicates that glutamate prototrophy is achieved by
expression of ACO1, CIT1, CIT2, IDH1 and IDH2 of TCA cycle and glyoxylate cycle,
which are induced by RTG genes (Liao and Butow, 1993; Liu and Butow, 1999). The
expression of genes, which encode the first three steps of the TCA cycle from
oxaloacetate to α-ketoglutarate is under the regulation of Hap2-3-4-5p in full
mitochondrial function, but switch their dependence to RTG genes in compromised
mitochondrial function (Liu and Butow, 1999). When the cells respiratory function is
reduced or lost these genes lose control by HAP genes and are under regulation by
RTG genes. Glutamate negatively feeds back by inhibition of RTG signalling
pathway. The dual regulation of early steps of TCA cycle by Hap2-3-4-5p and Rtg1-2-
3p transcription complex allows cells to adapt to carbon source and mitochondrial
state and ensures the availability of glutamate. Growth in glucose and acetate under
nitrogen-limiting conditions despite deletion of RTG genes suggests that the Hap2-3-

171
4-5p complex regulates the expression of genes of first three steps of TCA cycle.
Mitochondrial retrograde signalling pathway has been suggested to be a negative
regulator of pseudohyphal growth in Σ1278b strain background (Jin et al., 2008).
However, rtg2Δ and mitochondrial defect still induce intermediate pseudohyphal
growth suggesting the possibility that other retrograde signalling pathways may be
involved and cannot be excluded here (Epstein et al., 2001; Traven et al., 2001).
Table 5.1. Microarray data showing transcript profile in terms of raw intensity
expressed from Σ1278b and SK1 genetic backgrounds (Strudwick et al., 2010).
Sr. No
Gene
Raw intensity
Σ1278b SK1
1. CIT1 -0.52 12.70
2. CIT2 -0.91
13.20
3. DLD3 -1.54
9.65
4. ACO1 -0.41
12.78
5. IDH1 -0.76
12.10
6. IDH2 -0.97
12.19

Chapter 6
Conclusions and future work

172
6.1 Conclusions and future work:
In yeast S. cerevisiae the differentiation responses depend on the nutritional
environment. Many studies have been carried out studying nitrogen starvation
responses like meiosis and pseudohyphal growth. Nitrogen-rich conditions are known
to repress these differentiation events in S. cerevisiae. In the current study the
negative regulatory mechanism at early meiotic genes by Hac1ip in nitrogen-rich
condition was investigated by using URS1-CYC1-Ub-X-lacZ reporters. Figure 3.9
successfully demonstrates that Hac1ip negatively regulates at URS1 in nitrogen-rich
conditions. The regulation of metabolic genes under nutrient rich conditions by
Hac1ip, an important transcription factor of UPR signifies the importance of how UPR
also functions as nutrient sensing pathway and thereby influencing the differentiation
program. When the nitrogen is limiting, UPR is turned off and Hac1ip synthesis
ceases. This can induce nitrogen starvation responses like pseudohyphal growth or
meiosis based on the carbon source (Figure 1.7). When nitrogen is abundant, HAC1
mRNA splicing is induced dramatically, repressing both the pathways. Therefore the
information of nutritional state of the cell is sensed by UPR, which represses nitrogen
starvation responses, promotes growth and decides the fate of developmental
pathways. Hac1ip is a bZIP transcription factor, which activates transcription of genes
containing UPR element and INO1 gene (Chapman et al., 1998). According to the
genome-wide two-hybrid interaction screen, Hac1ip does not interact with any other
protein (Uetz et al., 2000). Future studies can be carried out to study mechanism of
repression and targets of Hac1ip.
A poorly understood aspect of meiotic gene regulation is how transcriptional
repression is maintained under nutrient rich conditions through URS1. The
interactions between the URS1 regulatory element and its associating factors are
complex. Experiments on individual mutants (ume6Δ, rpd3Δ, sin3Δ, isw2Δ and itc1Δ)
of the mitotic repression machinery at URS1 under nitrogen rich conditions
corroborate their role in regulation of early meiosis. These experiments also suggest
regulation at additional sites in the minimal CYC1 promoter other than URS1 of
URS1-CYC1-Ub-X-lacZ reporters. Understanding regulation at UASCYC1 would be
important in dissecting the transcriptional activity by Ume6p in core CYC1 promoter.
Deletion of Rpd3p of RPD3-SIN3 HDAC complex didn’t considerably affect
transcription at URS1, but deletion of Sin3p did suggesting that either Sin3p has

173
additional repressing functions or there are additional sites regulated by Sin3p
(Figure 4.2 and 4.3). Identifying these additional sites could provide more insight into
regulation at URS1-CYC1-Ub-X-lacZ reporter. This is useful, primarily because
minimal CYC1 promoter is extensively used as heterologous promoter to study
transcriptional regulation and other cell processes. Secondly these reporter systems
have widespread uses in genetic screen and techniques like two-hybrid screen.
URS1-CYC1-Ub-X-lacZ reporters constructed in this study show reduced steady
state levels as compared to the WT β-galactosidase. These reporters are a technical
advancement in the field of reporter system and can be widely used to study
transcription. Rpd3p and Sin3p or Isw2p and Itc1p functions were separable as
suggested by independent repression by Sin3p and Isw2p deletion. This will be
useful to identify and understand the way deletion of proteins with stronger
phenotypes act.
We tested the SK1 genetic background for pseudohyphal growth under nitrogen
starvation conditions known to induce pseudohyphal growth. This induced moderate
pseudohyphal growth due to glycolytic by products such as ethanol. Stimulation by
nonfermentable carbon sources stimulated pseudohyphal growth and this stimulation
didn’t require the nonfermentable carbon source as respiratory energy source
(Figure 5.1B). The results presented in figure 5.2 also show that stimulation of
pseudohyphal growth does not require mitochondrial RTG pathway. This work
highlights the importance of different signaling cascades like MAPK signaling and
cAMP signaling stimulated by different nutrient conditions. Studies on pathways
functioning in pseudohyphal differentiation are important, because pathogenic yeasts
also use these pathways for dimorphic switch to hyphal growth (Borges-Walmsley
and Walmsley, 2000; Lengeler et al., 2000; Roman et al., 2007). The change to
hyphal form is a virulence factor in many human and plant pathogenic yeasts. Insight
into the signal transduction mechanisms that are necessary for the morphological
change will contribute to an understanding of basic biological phenomena and of
pathogenesis. Better understanding of these pathways and its elements can be used
to develop novel drug targets.
A major challenge moving forward will be to better understand how simple
eukaryotes such as yeast are able to precisely discriminate between different nutrient

174
signals and how they are able to generate a diversity of responses given that they
use different but overlapping pathways in different contexts.

References

175
References:
Alén, C., Kent, N.A., Jones, H.S., O'Sullivan, J., Aranda, A. and Proudfoot, N.J. (2002) A role for chromatin remodeling in transcriptional termination by RNA polymerase II. Mol Cell, 10, 1441-1452.
An, J.Y., Seo, J.W., Tasaki, T., Lee, M.J., Varshavsky, A. and Kwon, Y.T. (2006) Impaired neurogenesis and cardiovascular development in mice lacking the E3 ubiquitin ligases UBR1 and UBR2 of the N-end rule pathway. Proc Natl Acad Sci U S A, 103, 6212-6217.
Anderson, S.F., Steber, C.M., Esposito, R.E. and Coleman, J.E. (1995) UME6, a negative regulator of meiosis in Saccharomyces cerevisiae, contains a C-terminal Zn2Cys6 binuclear cluster that binds the URS1 DNA sequence in a zinc-dependent manner. Protein Sci, 4, 1832-1843.
Andreasson, C. and Ljungdahl, P.O. (2002) Receptor-mediated endoproteolytic activation of two transcription factors in yeast. Genes Dev, 16, 3158-3172.
Aronova, S., Wedaman, K., Anderson, S., Yates, J., 3rd and Powers, T. (2007) Probing the membrane environment of the TOR kinases reveals functional interactions between TORC1, actin, and membrane trafficking in Saccharomyces cerevisiae. Mol Biol Cell, 18, 2779-2794.
Ashrafi, K., Lin, S.S., Manchester, J.K. and Gordon, J.I. (2000) Sip2p and its partner snf1p kinase affect aging in S. cerevisiae. Genes Dev, 14, 1872-1885.
Audhya, A., Loewith, R., Parsons, A.B., Gao, L., Tabuchi, M., Zhou, H., Boone, C., Hall, M.N. and Emr, S.D. (2004) Genome-wide lethality screen identifies new PI4,5P2 effectors that regulate the actin cytoskeleton. Embo J, 23, 3747-3757.
Bachmair, A., Finley, D. and Varshavsky, A. (1986) In vivo half-life of a protein is a function of its amino-terminal residue. Science, 234, 179-186.
Bachmair, A. and Varshavsky, A. (1989) The degradation signal in a short-lived protein. Cell, 56, 1019-1032.
Back, S.H., Scheuner, D., Han, J., Song, B., Ribick, M., Wang, J., Gildersleeve, R.D., Pennathur, S. and Kaufman, R.J. (2009) Translation attenuation through eIF2alpha phosphorylation prevents oxidative stress and maintains the differentiated state in beta cells. Cell Metab, 10, 13-26.
Baker, R.T., Tobias, J.W. and Varshavsky, A. (1992) Ubiquitin-specific proteases of Saccharomyces cerevisiae. Cloning of UBP2 and UBP3, and functional analysis of the UBP gene family. J Biol Chem, 267, 23364-23375.
Baker, R.T. and Varshavsky, A. (1995) Yeast N-terminal amidase. A new enzyme and component of the N-end rule pathway. J Biol Chem, 270, 12065-12074.
Balzi, E., Choder, M., Chen, W.N., Varshavsky, A. and Goffeau, A. (1990) Cloning and functional analysis of the arginyl-tRNA-protein transferase gene ATE1 of Saccharomyces cerevisiae. J Biol Chem, 265, 7464-7471.

176
Bandyopadhyay, G.K., Yu, J.G., Ofrecio, J. and Olefsky, J.M. (2005) Increased p85/55/50 expression and decreased phosphotidylinositol 3-kinase activity in insulin-resistant human skeletal muscle. Diabetes, 54, 2351-2359.
Bao, M.Z., Schwartz, M.A., Cantin, G.T., Yates, J.R., 3rd and Madhani, H.D. (2004) Pheromone-dependent destruction of the Tec1 transcription factor is required for MAP kinase signaling specificity in yeast. Cell, 119, 991-1000.
Bardwell, L., Cook, J.G., Voora, D., Baggott, D.M., Martinez, A.R. and Thorner, J. (1998) Repression of yeast Ste12 transcription factor by direct binding of unphosphorylated Kss1 MAPK and its regulation by the Ste7 MEK. Genes Dev, 12, 2887-2898.
Batlle, M., Lu, A., Green, D.A., Xue, Y. and Hirsch, J.P. (2003) Krh1p and Krh2p act downstream of the Gpa2p G(alpha) subunit to negatively regulate haploid invasive growth. J Cell Sci, 116, 701-710.
Beck, T. and Hall, M.N. (1999) The TOR signalling pathway controls nuclear localization of nutrient-regulated transcription factors. Nature, 402, 689-692.
Beeser, A.E. and Cooper, T.G. (2000) The dual-specificity protein phosphatase Yvh1p regulates sporulation, growth, and glycogen accumulation independently of catalytic activity in Saccharomyces cerevisiae via the cyclic AMP-dependent protein kinase cascade. J Bacteriol, 182, 3517-3528.
Benjamin, K.R., Zhang, C., Shokat, K.M. and Herskowitz, I. (2003) Control of landmark events in meiosis by the CDK Cdc28 and the meiosis-specific kinase Ime2. Genes Dev, 17, 1524-1539.
Bertolotti, A., Zhang, Y., Hendershot, L.M., Harding, H.P. and Ron, D. (2000) Dynamic interaction of BiP and ER stress transducers in the unfolded-protein response. Nat Cell Biol, 2, 326-332.
Bianconi, M.L. (2003) Calorimetric determination of thermodynamic parameters of reaction reveals different enthalpic compensations of the yeast hexokinase isozymes. J Biol Chem, 278, 18709-18713.
Bicknell, A.A., Babour, A., Federovitch, C.M. and Niwa, M. (2007) A novel role in cytokinesis reveals a housekeeping function for the unfolded protein response. J Cell Biol, 177, 1017-1027.
Bilsland-Marchesan, E., Arino, J., Saito, H., Sunnerhagen, P. and Posas, F. (2000) Rck2 kinase is a substrate for the osmotic stress-activated mitogen-activated protein kinase Hog1. Mol Cell Biol, 20, 3887-3895.
Birnboim, H.C. and Doly, J. (1979) A rapid alkaline extraction procedure for screening recombinant plasmid DNA. Nucleic Acids Res, 7, 1513-1523.
Bloch, K.D. and Grossmann, B. (1995) Enzymatic manipulation of DNA and RNA. Restriction endonucleases. Digestion of DNA with restriction endonucleases. In Ausubel, F.M., Brent, R., Kingston, R.E., Moore, D.D., Seidman, C.E.,

177
Smith, J.A. and Struhl, K. (eds.), Current Protocols in Molecular Biology. John Wiley & Sons, New York, Vol. 1, pp. 3.1.1-21.
Boeckstaens, M., Andre, B. and Marini, A.M. (2007) The yeast ammonium transport protein Mep2 and its positive regulator, the Npr1 kinase, play an important role in normal and pseudohyphal growth on various nitrogen media through retrieval of excreted ammonium. Mol Microbiol, 64, 534-546.
Bolte, M., Steigemann, P., Braus, G.H. and Irniger, S. (2002) Inhibition of APC-mediated proteolysis by the meiosis-specific protein kinase Ime2. Proc Natl Acad Sci U S A, 99, 4385-4390.
Bonifacino, J.S., Dell'Angelica, E.C. and Springer, T.A. (1999) Analysis of proteins. Immunoprecipitation. In Ausubel, F.M., Brent, R., Kingston, R.E., Moore, D.D., Seidman, C.E., Smith, J.A. and Struhl, K. (eds.), Current Protocols in Molecular Biology. John Wiley & Sons, New York, Vol. 2, pp. 10.16.11-29.
Borges-Walmsley, M.I. and Walmsley, A.R. (2000) cAMP signalling in pathogenic fungi: control of dimorphic switching and pathogenicity. Trends Microbiol, 8, 133-141.
Boss, J.M., Darrow, M.D. and Zitomer, R.S. (1980) Characterization of yeast iso-1-cytochrome c mRNA. J Biol Chem, 255, 8623-8628.
Bowdish, K.S. and Mitchell, A.P. (1993) Bipartite structure of an early meiotic upstream activation sequence from Saccharomyces cerevisiae. Mol Cell Biol, 13, 2172-2181.
Bowdish, K.S., Yuan, H.E. and Mitchell, A.P. (1995) Positive control of yeast meiotic genes by the negative regulator UME6. Mol Cell Biol, 15, 2955-2961.
Broach, J.R. and Deschenes, R.J. (1990) The function of ras genes in Saccharomyces cerevisiae. Adv Cancer Res, 54, 79-139.
Brush, M.H., Weiser, D.C. and Shenolikar, S. (2003) Growth arrest and DNA damage-inducible protein GADD34 targets protein phosphatase 1 alpha to the endoplasmic reticulum and promotes dephosphorylation of the alpha subunit of eukaryotic translation initiation factor 2. Mol Cell Biol, 23, 1292-1303.
Bultynck, G., Heath, V.L., Majeed, A.P., Galan, J.M., Haguenauer-Tsapis, R. and Cyert, M.S. (2006) Slm1 and slm2 are novel substrates of the calcineurin phosphatase required for heat stress-induced endocytosis of the yeast uracil permease. Mol Cell Biol, 26, 4729-4745.
Burgess, S.M., Ajimura, M. and Kleckner, N. (1999) GCN5-dependent histone H3 acetylation and RPD3-dependent histone H4 deacetylation have distinct, opposing effects on IME2 transcription, during meiosis and during vegetative growth, in budding yeast. Proc Natl Acad Sci U S A, 96, 6835-6840.
Butow, R.A. and Avadhani, N.G. (2004) Mitochondrial signaling: the retrograde response. Mol Cell, 14, 1-15.
178
Calfon, M., Zeng, H., Urano, F., Till, J.H., Hubbard, S.R., Harding, H.P., Clark, S.G. and Ron, D. (2002) IRE1 couples endoplasmic reticulum load to secretory capacity by processing the XBP-1 mRNA. Nature, 415, 92-96.
Cardenas, M.E., Cutler, N.S., Lorenz, M.C., Di Como, C.J. and Heitman, J. (1999) The TOR signaling cascade regulates gene expression in response to nutrients. Genes Dev, 13, 3271-3279.
Carrozza, M.J., Florens, L., Swanson, S.K., Shia, W.J., Anderson, S., Yates, J., Washburn, M.P. and Workman, J.L. (2005) Stable incorporation of sequence specific repressors Ash1 and Ume6 into the Rpd3L complex. Biochim Biophys Acta, 1731, 77-87; discussion 75-76.
Casagrande, R., Stern, P., Diehn, M., Shamu, C., Osario, M., Zuniga, M., Brown, P.O. and Ploegh, H. (2000) Degradation of proteins from the ER of S. cerevisiae requires an intact unfolded protein response pathway. Mol Cell, 5, 729-735.
Chapman, R., Sidrauski, C. and Walter, P. (1998) Intracellular signaling from the endoplasmic reticulum to the nucleus. Annu Rev Cell Dev Biol, 14, 459-485.
Chapman, R.E. and Walter, P. (1997) Translational attenuation mediated by an mRNA intron. Curr Biol, 7, 850-859.
Chavel, C.A., Dionne, H.M., Birkaya, B., Joshi, J. and Cullen, P.J. (2010) Multiple signals converge on a differentiation MAPK pathway. PLoS Genet, 6, e1000883.
Cheatham, B., Vlahos, C.J., Cheatham, L., Wang, L., Blenis, J. and Kahn, C.R. (1994) Phosphatidylinositol 3-kinase activation is required for insulin stimulation of pp70 S6 kinase, DNA synthesis, and glucose transporter translocation. Mol Cell Biol, 14, 4902-4911.
Chelstowska, A. and Butow, R.A. (1995) RTG genes in yeast that function in communication between mitochondria and the nucleus are also required for expression of genes encoding peroxisomal proteins. J Biol Chem, 270, 18141-18146.
Chen, D.C., Yang, B.C. and Kuo, T.T. (1992) One-step transformation of yeast in stationary phase. Curr Genet, 21, 83-84.
Chen, E.J. and Kaiser, C.A. (2003) LST8 negatively regulates amino acid biosynthesis as a component of the TOR pathway. J Cell Biol, 161, 333-347.
Chen, H. and Fink, G.R. (2006) Feedback control of morphogenesis in fungi by aromatic alcohols. Genes Dev, 20, 1150-1161.
Chen, R.E. and Thorner, J. (2010) Systematic Epistasis Analysis of the Contributions of PKA- and MAPK-dependent Signaling to Nutrient Limitation-evoked responses in the Yeast Saccharomyces cerevisiae. Genetics.

179
Chen, X., Shen, J. and Prywes, R. (2002) The luminal domain of ATF6 senses endoplasmic reticulum (ER) stress and causes translocation of ATF6 from the ER to the Golgi. J Biol Chem, 277, 13045-13052.
Cherepanov, A.V. and de Vries, S. (2001) Binding of nucleotides by T4 DNA ligase and T4 RNA ligase: optical absorbance and fluorescence studies. Biophys J, 81, 3545-3559.
Cherkasova, V.A. and Hinnebusch, A.G. (2003) Translational control by TOR and TAP42 through dephosphorylation of eIF2alpha kinase GCN2. Genes Dev, 17, 859-872.
Choi, K.Y., Satterberg, B., Lyons, D.M. and Elion, E.A. (1994) Ste5 tethers multiple protein kinases in the MAP kinase cascade required for mating in S. cerevisiae. Cell, 78, 499-512.
Chou, S., Huang, L. and Liu, H. (2004) Fus3-regulated Tec1 degradation through SCFCdc4 determines MAPK signaling specificity during mating in yeast. Cell, 119, 981-990.
Chu, S., DeRisi, J., Eisen, M., Mulholland, J., Botstein, D., Brown, P.O. and Herskowitz, I. (1998) The transcriptional program of sporulation in budding yeast. Science, 282, 699-705.
Clancy, M.J., Shambaugh, M.E., Timpte, C.S. and Bokar, J.A. (2002) Induction of sporulation in Saccharomyces cerevisiae leads to the formation of N6-methyladenosine in mRNA: a potential mechanism for the activity of the IME4 gene. Nucleic Acids Res, 30, 4509-4518.
Clifton, D., Walsh, R.B. and Fraenkel, D.G. (1993) Functional studies of yeast glucokinase. J Bacteriol, 175, 3289-3294.
Coffman, J.A., Rai, R., Cunningham, T., Svetlov, V. and Cooper, T.G. (1996) Gat1p, a GATA family protein whose production is sensitive to nitrogen catabolite repression, participates in transcriptional activation of nitrogen-catabolic genes in Saccharomyces cerevisiae. Mol Cell Biol, 16, 847-858.
Colomina, N., Gari, E., Gallego, C., Herrero, E. and Aldea, M. (1999) G1 cyclins block the Ime1 pathway to make mitosis and meiosis incompatible in budding yeast. Embo J, 18, 320-329.
Cooper, T.G. (2002) Transmitting the signal of excess nitrogen in Saccharomyces cerevisiae from the Tor proteins to the GATA factors: connecting the dots. FEMS Microbiol Rev, 26, 223-238.
Cormack, B. (1997) Mutagenesis of cloned DNA. Directed mutagenesis using the polymerase chain reaction. In Ausubel, F.M., Brent, R., Kingston, R.E., Moore, D.D., Seidman, C.E., Smith, J.A. and Struhl, K. (eds.), Current Protocols in Molecular Biology. John Wiley & Sons, New York, Vol. 1, pp. 8.5.1-10.
180
Covitz, P.A., Herskowitz, I. and Mitchell, A.P. (1991) The yeast RME1 gene encodes a putative zinc finger protein that is directly repressed by a1-alpha 2. Genes Dev, 5, 1982-1989.
Covitz, P.A. and Mitchell, A.P. (1993) Repression by the yeast meiotic inhibitor RME1. Genes Dev, 7, 1598-1608.
Cox, J.S., Chapman, R.E. and Walter, P. (1997) The unfolded protein response coordinates the production of endoplasmic reticulum protein and endoplasmic reticulum membrane. Mol Biol Cell, 8, 1805-1814.
Cox, J.S. and Walter, P. (1996) A novel mechanism for regulating activity of a transcription factor that controls the unfolded protein response. Cell, 87, 391-404.
Crespo, J.L., Powers, T., Fowler, B. and Hall, M.N. (2002) The TOR-controlled transcription activators GLN3, RTG1, and RTG3 are regulated in response to intracellular levels of glutamine. Proc Natl Acad Sci U S A, 99, 6784-6789.
Cullen, P.J., Sabbagh, W., Jr., Graham, E., Irick, M.M., van Olden, E.K., Neal, C., Delrow, J., Bardwell, L. and Sprague, G.F., Jr. . (2004) A signaling mucin at the head of the Cdc42- and MAPK-dependent filamentous growth pathway in yeast. Genes Dev, 18, 1695-1708.
Cusi, K., Maezono, K., Osman, A., Pendergrass, M., Patti, M.E., Pratipanawatr, T., DeFronzo, R.A., Kahn, C.R. and Mandarino, L.J. (2000) Insulin resistance differentially affects the PI 3-kinase- and MAP kinase-mediated signaling in human muscle. J Clin Invest, 105, 311-320.
Cutler, N.S., Pan, X., Heitman, J. and Cardenas, M.E. (2001) The TOR signal transduction cascade controls cellular differentiation in response to nutrients. Mol Biol Cell, 12, 4103-4113.
Daquinag, A., Fadri, M., Jung, S.Y., Qin, J. and Kunz, J. (2007) The yeast PH domain proteins Slm1 and Slm2 are targets of sphingolipid signaling during the response to heat stress. Mol Cell Biol, 27, 633-650.
Davenport, K.D., Williams, K.E., Ullmann, B.D. and Gustin, M.C. (1999) Activation of the Saccharomyces cerevisiae filamentation/invasion pathway by osmotic stress in high-osmolarity glycogen pathway mutants. Genetics, 153, 1091-1103.
Davydov, I.V. and Varshavsky, A. (2000) RGS4 is arginylated and degraded by the N-end rule pathway in vitro. J Biol Chem, 275, 22931-22941.
De Nadal, E., Zapater, M., Alepuz, P.M., Sumoy, L., Mas, G. and Posas, F. (2004) The MAPK Hog1 recruits Rpd3 histone deacetylase to activate osmoresponsive genes. Nature, 427, 370-374.
De Silva-Udawatta, M.N. and Cannon, J.F. (2001) Roles of trehalose phosphate synthase in yeast glycogen metabolism and sporulation. Mol Microbiol, 40, 1345-1356.

181
Deng, C. and Saunders, W.S. (2001) RIM4 encodes a meiotic activator required for early events of meiosis in Saccharomyces cerevisiae. Mol Genet Genomics, 266, 497-504.
Deng, J., Lu, P.D., Zhang, Y., Scheuner, D., Kaufman, R.J., Sonenberg, N., Harding, H.P. and Ron, D. (2004) Translational repression mediates activation of nuclear factor kappa B by phosphorylated translation initiation factor 2. Mol Cell Biol, 24, 10161-10168.
Dever, T.E. (2002) Gene-specific regulation by general translation factors. Cell, 108, 545-556.
Dickinson, J.R. (1996) 'Fusel' alcohols induce hyphal-like extensions and pseudohyphal formation in yeasts. Microbiology, 142 ( Pt 6), 1391-1397.
Dilova, I., Chen, C.Y. and Powers, T. (2002) Mks1 in concert with TOR signaling negatively regulates RTG target gene expression in S. cerevisiae. Curr Biol, 12, 389-395.
Dirick, L., Goetsch, L., Ammerer, G. and Byers, B. (1998) Regulation of meiotic S phase by Ime2 and a Clb5,6-associated kinase in Saccharomyces cerevisiae. Science, 281, 1854-1857.
Ditzel, M., Wilson, R., Tenev, T., Zachariou, A., Paul, A., Deas, E. and Meier, P. (2003) Degradation of DIAP1 by the N-end rule pathway is essential for regulating apoptosis. Nat Cell Biol, 5, 467-473.
Donaton, M.C., Holsbeeks, I., Lagatie, O., Van Zeebroeck, G., Crauwels, M., Winderickx, J. and Thevelein, J.M. (2003) The Gap1 general amino acid permease acts as an amino acid sensor for activation of protein kinase A targets in the yeast Saccharomyces cerevisiae. Mol Microbiol, 50, 911-929.
Donzeau, M. and Bandlow, W. (1999) The yeast trimeric guanine nucleotide-binding protein alpha subunit, Gpa2p, controls the meiosis-specific kinase Ime2p activity in response to nutrients. Mol Cell Biol, 19, 6110-6119.
Draznin, B. (2006) Molecular mechanisms of insulin resistance: serine phosphorylation of insulin receptor substrate-1 and increased expression of p85alpha: the two sides of a coin. Diabetes, 55, 2392-2397.
Duvel, K., Santhanam, A., Garrett, S., Schneper, L. and Broach, J.R. (2003) Multiple roles of Tap42 in mediating rapamycin-induced transcriptional changes in yeast. Mol Cell, 11, 1467-1478.
Ehrentraut, S., Weber, J.M., Dybowski, J.N., Hoffmann, D. and Ehrenhofer-Murray, A.E. (2010) Rpd3-dependent boundary formation at telomeres by removal of Sir2 substrate. Proc Natl Acad Sci U S A, 107, 5522-5527.
Einerhand, A.W., Kos, W., Smart, W.C., Kal, A.J., Tabak, H.F. and Cooper, T.G. (1995) The upstream region of the FOX3 gene encoding peroxisomal 3-oxoacyl-coenzyme A thiolase in Saccharomyces cerevisiae contains ABF1-

182
and replication protein A-binding sites that participate in its regulation by glucose repression. Mol Cell Biol, 15, 3405-3414.
Eizirik, D.L., Cardozo, A.K. and Cnop, M. (2008) The role for endoplasmic reticulum stress in diabetes mellitus. Endocr Rev, 29, 42-61.
Elbing, K. and Brent, R. (2002) Escherichia coli, plasmids, and bacteriophages. Escherichia coli. Growth in liquid media. In Ausubel, F.M., Brent, R., Kingston, R.E., Moore, D.D., Seidman, C.E., Smith, J.A. and Struhl, K. (eds.), Current Protocols in Molecular Biology. John Wiley & Sons, New York, Vol. 1, pp. 1.2.1-2.
Elouil, H., Bensellam, M., Guiot, Y., Vander Mierde, D., Pascal, S.M., Schuit, F.C. and Jonas, J.C. (2007) Acute nutrient regulation of the unfolded protein response and integrated stress response in cultured rat pancreatic islets. Diabetologia, 50, 1442-1452.
Epstein, C.B., Waddle, J.A., Hale, W.t., Dave, V., Thornton, J., Macatee, T.L., Garner, H.R. and Butow, R.A. (2001) Genome-wide responses to mitochondrial dysfunction. Mol Biol Cell, 12, 297-308.
Erdman, S., Lin, L., Malczynski, M. and Snyder, M. (1998) Pheromone-regulated genes required for yeast mating differentiation. J Cell Biol, 140, 461-483.
Escote, X., Zapater, M., Clotet, J. and Posas, F. (2004) Hog1 mediates cell-cycle arrest in G1 phase by the dual targeting of Sic1. Nat Cell Biol, 6, 997-1002.
Esposito, M.S. and Esposito, R.E. (1974) Genes controlling meiosis and spore formation in yeast. Genetics, 78, 215-225.
Fadri, M., Daquinag, A., Wang, S., Xue, T. and Kunz, J. (2005) The pleckstrin homology domain proteins Slm1 and Slm2 are required for actin cytoskeleton organization in yeast and bind phosphatidylinositol-4,5-bisphosphate and TORC2. Mol Biol Cell, 16, 1883-1900.
Fazzio, T.G., Kooperberg, C., Goldmark, J.P., Neal, C., Basom, R., Delrow, J. and Tsukiyama, T. (2001) Widespread collaboration of Isw2 and Sin3-Rpd3 chromatin remodeling complexes in transcriptional repression. Mol Cell Biol, 21, 6450-6460.
Fazzio, T.G. and Tsukiyama, T. (2003) Chromatin remodeling in vivo: evidence for a nucleosome sliding mechanism. Mol Cell, 12, 1333-1340.
Fitzgerald, D.J., DeLuca, C., Berger, I., Gaillard, H., Sigrist, R., Schimmele, K. and Richmond, T.J. (2004) Reaction cycle of the yeast Isw2 chromatin remodeling complex. Embo J, 23, 3836-3843.
Foiani, M., Nadjar-Boger, E., Capone, R., Sagee, S., Hashimshoni, T. and Kassir, Y. (1996) A meiosis-specific protein kinase, Ime2, is required for the correct timing of DNA replication and for spore formation in yeast meiosis. Mol Gen Genet, 253, 278-288.

183
Fonseca, S.G., Lipson, K.L. and Urano, F. (2007) Endoplasmic reticulum stress signaling in pancreatic beta-cells. Antioxid Redox Signal, 9, 2335-2344.
Forsberg, H. and Ljungdahl, P.O. (2001) Sensors of extracellular nutrients in Saccharomyces cerevisiae. Curr Genet, 40, 91-109.
Fox, T.D., Folley, L.S., Mulero, J.J., McMullin, T.W., Thorsness, P.E., Hedin, L.O. and Costanzo, M.C. (1991) Analysis and manipulation of yeast mitochondrial genes. Methods Enzymol, 194, 149-165.
Friedlander, G., Joseph-Strauss, D., Carmi, M., Zenvirth, D., Simchen, G. and Barkai, N. (2006) Modulation of the transcription regulatory program in yeast cells committed to sporulation. Genome Biol, 7, R20.
Friedlander, R., Jarosch, E., Urban, J., Volkwein, C. and Sommer, T. (2000) A regulatory link between ER-associated protein degradation and the unfolded-protein response. Nat Cell Biol, 2, 379-384.
Fujita, A., Tonouchi, A., Hiroko, T., Inose, F., Nagashima, T., Satoh, R. and Tanaka, S. (1999) Hsl7p, a negative regulator of Ste20p protein kinase in the Saccharomyces cerevisiae filamentous growth-signaling pathway. Proc Natl Acad Sci U S A, 96, 8522-8527.
Gailus-Durner, V., Xie, J., Chintamaneni, C. and Vershon, A.K. (1996) Participation of the yeast activator Abf1 in meiosis-specific expression of the HOP1 gene. Mol Cell Biol, 16, 2777-2786.
Gallagher, S.R. (1999) Analysis of proteins. One-dimensional SDS gel electrophoresis of proteins. In Ausubel, F.M., Brent, R., Kingston, R.E., Moore, D.D., Seidman, C.E., Smith, J.A. and Struhl, K. (eds.), Current Protocols in Molecular Biology. John Wiley & Sons, New York, Vol. 2, pp. 10.12A.11-34.
Gallagher, S.R., Winston, S.E., Fuller, S.A. and Hurrell, J.G.R. (1997) Analysis of proteins. Detection of proteins. Immunoblotting and immunodetection. In Ausubel, F.M., Brent, R., Kingston, R.E., Moore, D.D., Seidman, C.E., Smith, J.A. and Struhl, K. (eds.), Current Protocols in Molecular Biology. John Wiley & Sons, New York, Vol. 2, pp. 10.18.11-21.
Gallego, C., Gari, E., Colomina, N., Herrero, E. and Aldea, M. (1997) The Cln3 cyclin is down-regulated by translational repression and degradation during the G1 arrest caused by nitrogen deprivation in budding yeast. Embo J, 16, 7196-7206.
Gancedo, J.M. (1998) Yeast carbon catabolite repression. Microbiol Mol Biol Rev, 62, 334-361.
Gancedo, J.M. (2001) Control of pseudohyphae formation in Saccharomyces cerevisiae. FEMS Microbiol Rev, 25, 107-123.
Garreau, H., Hasan, R.N., Renault, G., Estruch, F., Boy-Marcotte, E. and Jacquet, M. (2000) Hyperphosphorylation of Msn2p and Msn4p in response to heat shock

184
and the diauxic shift is inhibited by cAMP in Saccharomyces cerevisiae. Microbiology, 146 ( Pt 9), 2113-2120.
Gelbart, M.E., Rechsteiner, T., Richmond, T.J. and Tsukiyama, T. (2001) Interactions of Isw2 chromatin remodeling complex with nucleosomal arrays: analyses using recombinant yeast histones and immobilized templates. Mol Cell Biol, 21, 2098-2106.
Gimeno, C.J. and Fink, G.R. (1994) Induction of pseudohyphal growth by overexpression of PHD1, a Saccharomyces cerevisiae gene related to transcriptional regulators of fungal development. Mol Cell Biol, 14, 2100-2112.
Gimeno, C.J., Ljungdahl, P.O., Styles, C.A. and Fink, G.R. (1992) Unipolar cell divisions in the yeast S. cerevisiae lead to filamentous growth: regulation by starvation and RAS. Cell, 68, 1077-1090.
Goldmark, J.P., Fazzio, T.G., Estep, P.W., Church, G.M. and Tsukiyama, T. (2000) The Isw2 chromatin remodeling complex represses early meiotic genes upon recruitment by Ume6p. Cell, 103, 423-433.
Gonda, D.K., Bachmair, A., Wunning, I., Tobias, J.W., Lane, W.S. and Varshavsky, A. (1989) Universality and structure of the N-end rule. J Biol Chem, 264, 16700-16712.
Gonzales, J.C., Gentile, C.L., Pfaffenbach, K.T., Wei, Y., Wang, D. and Pagliassotti, M.J. (2008) Chemical induction of the unfolded protein response in the liver increases glucose production and is activated during insulin-induced hypoglycaemia in rats. Diabetologia, 51, 1920-1929.
Good, M., Tang, G., Singleton, J., Remenyi, A. and Lim, W.A. (2009) The Ste5 scaffold directs mating signaling by catalytically unlocking the Fus3 MAP kinase for activation. Cell, 136, 1085-1097.
Graciet, E., Walter, F., Maoileidigh, D.O., Pollmann, S., Meyerowitz, E.M., Varshavsky, A. and Wellmer, F. (2009) The N-end rule pathway controls multiple functions during Arabidopsis shoot and leaf development. Proc Natl Acad Sci U S A.
Granot, D., Margolskee, J.P. and Simchen, G. (1989) A long region upstream of the IME1 gene regulates meiosis in yeast. Mol Gen Genet, 218, 308-314.
Greenman, I.C., Gomez, E., Moore, C.E. and Herbert, T.P. (2007) Distinct glucose-dependent stress responses revealed by translational profiling in pancreatic beta-cells. J Endocrinol, 192, 179-187.
Gregor, M.F., Yang, L., Fabbrini, E., Mohammed, B.S., Eagon, J.C., Hotamisligil, G.S. and Klein, S. (2009) Endoplasmic reticulum stress is reduced in tissues of obese subjects after weight loss. Diabetes, 58, 693-700.
Guarente, L. and Hoar, E. (1984) Upstream activation sites of the CYC1 gene of Saccharomyces cerevisiae are active when inverted but not when placed downstream of the "TATA box". Proc Natl Acad Sci U S A, 81, 7860-7864.

185
Guarente, L. and Mason, T. (1983) Heme regulates transcription of the CYC1 gene of S. cerevisiae via an upstream activation site. Cell, 32, 1279-1286.
Gustin, M.C., Albertyn, J., Alexander, M. and Davenport, K. (1998) MAP kinase pathways in the yeast Saccharomyces cerevisiae. Microbiol Mol Biol Rev, 62, 1264-1300.
Guttmann-Raviv, N., Boger-Nadjar, E., Edri, I. and Kassir, Y. (2001) Cdc28 and Ime2 possess redundant functions in promoting entry into premeiotic DNA replication in Saccharomyces cerevisiae. Genetics, 159, 1547-1558.
Guttmann-Raviv, N., Martin, S. and Kassir, Y. (2002) Ime2, a meiosis-specific kinase in yeast, is required for destabilization of its transcriptional activator, Ime1. Mol Cell Biol, 22, 2047-2056.
Hall, J.P., Cherkasova, V., Elion, E., Gustin, M.C. and Winter, E. (1996) The osmoregulatory pathway represses mating pathway activity in Saccharomyces cerevisiae: isolation of a FUS3 mutant that is insensitive to the repression mechanism. Mol Cell Biol, 16, 6715-6723.
Hao, N., Nayak, S., Behar, M., Shanks, R.H., Nagiec, M.J., Errede, B., Hasty, J., Elston, T.C. and Dohlman, H.G. (2008) Regulation of cell signaling dynamics by the protein kinase-scaffold Ste5. Mol Cell, 30, 649-656.
Harashima, T., Anderson, S., Yates, J.R., 3rd and Heitman, J. (2006) The kelch proteins Gpb1 and Gpb2 inhibit Ras activity via association with the yeast RasGAP neurofibromin homologs Ira1 and Ira2. Mol Cell, 22, 819-830.
Harding, H.P., Zhang, Y., Bertolotti, A., Zeng, H. and Ron, D. (2000) Perk is essential for translational regulation and cell survival during the unfolded protein response. Mol Cell, 5, 897-904.
Harding, H.P., Zhang, Y. and Ron, D. (1999) Protein translation and folding are coupled by an endoplasmic-reticulum-resident kinase. Nature, 397, 271-274.
Hardwick, J.S., Kuruvilla, F.G., Tong, J.K., Shamji, A.F. and Schreiber, S.L. (1999) Rapamycin-modulated transcription defines the subset of nutrient-sensitive signaling pathways directly controlled by the Tor proteins. Proc Natl Acad Sci U S A, 96, 14866-14870.
Harris, K., Lamson, R.E., Nelson, B., Hughes, T.R., Marton, M.J., Roberts, C.J., Boone, C. and Pryciak, P.M. (2001) Role of scaffolds in MAP kinase pathway specificity revealed by custom design of pathway-dedicated signaling proteins. Curr Biol, 11, 1815-1824.
Haze, K., Yoshida, H., Yanagi, H., Yura, T. and Mori, K. (1999) Mammalian transcription factor ATF6 is synthesized as a transmembrane protein and activated by proteolysis in response to endoplasmic reticulum stress. Mol Biol Cell, 10, 3787-3799.
Herbach, N., Rathkolb, B., Kemter, E., Pichl, L., Klaften, M., de Angelis, M.H., Halban, P.A., Wolf, E., Aigner, B. and Wanke, R. (2007) Dominant-negative

186
effects of a novel mutated Ins2 allele causes early-onset diabetes and severe beta-cell loss in Munich Ins2C95S mutant mice. Diabetes, 56, 1268-1276.
Herman, P.K. and Rine, J. (1997) Yeast spore germination: a requirement for Ras protein activity during re-entry into the cell cycle. Embo J, 16, 6171-6181.
Herschkovitz, A., Liu, Y.F., Ilan, E., Ronen, D., Boura-Halfon, S. and Zick, Y. (2007) Common inhibitory serine sites phosphorylated by IRS-1 kinases, triggered by insulin and inducers of insulin resistance. J Biol Chem, 282, 18018-18027.
Herskowitz, I. (1988) Life cycle of the budding yeast Saccharomyces cerevisiae. Microbiol Rev, 52, 536-553.
Herskowitz, I., Rine, J. and Strathern, J.N. (1992) Mating-type determination and mating-type interconversion in Saccharomyces cerevisiae. In Pringle, J.R., Broach, J.R. and Jones, E.W. (eds.), The Molecular and Cellular Biology of the Yeast Saccharomyces: Gene Expression. Cold Spring Harbor Laboratory Press, Plainview, N.Y., Vol. 2, pp. 583-656.
Hetz, C., Bernasconi, P., Fisher, J., Lee, A.H., Bassik, M.C., Antonsson, B., Brandt, G.S., Iwakoshi, N.N., Schinzel, A., Glimcher, L.H. and Korsmeyer, S.J. (2006) Proapoptotic BAX and BAK modulate the unfolded protein response by a direct interaction with IRE1alpha. Science, 312, 572-576.
Heydrick, S.J., Gautier, N., Olichon-Berthe, C., Van Obberghen, E. and Le Marchand-Brustel, Y. (1995) Early alteration of insulin stimulation of PI 3-kinase in muscle and adipocyte from gold thioglucose obese mice. Am J Physiol, 268, E604-612.
Hinnebusch, A.G. (2005) Translational regulation of GCN4 and the general amino acid control of yeast. Annu Rev Microbiol, 59, 407-450.
Hinnebusch, A.G. and Natarajan, K. (2002) Gcn4p, a master regulator of gene expression, is controlled at multiple levels by diverse signals of starvation and stress. Eukaryot Cell, 1, 22-32.
Hirschberg, J. and Simchen, G. (1977) Commitment to the mitotic cell cycle in yeast in relation to meiosis. Exp Cell Res, 105, 245-252.
Hofman-Bang, J. (1999) Nitrogen catabolite repression in Saccharomyces cerevisiae. Mol Biotechnol, 12, 35-73.
Hohmann, S. (2002) Osmotic stress signaling and osmoadaptation in yeasts. Microbiol Mol Biol Rev, 66, 300-372.
Hollenhorst, P.C., Bose, M.E., Mielke, M.R., Muller, U. and Fox, C.A. (2000) Forkhead genes in transcriptional silencing, cell morphology and the cell cycle. Overlapping and distinct functions for FKH1 and FKH2 in Saccharomyces cerevisiae. Genetics, 154, 1533-1548.

187
Hollien, J., Lin, J.H., Li, H., Stevens, N., Walter, P. and Weissman, J.S. (2009) Regulated Ire1-dependent decay of messenger RNAs in mammalian cells. J Cell Biol, 186, 323-331.
Hong, S.P., Leiper, F.C., Woods, A., Carling, D. and Carlson, M. (2003) Activation of yeast Snf1 and mammalian AMP-activated protein kinase by upstream kinases. Proc Natl Acad Sci U S A, 100, 8839-8843.
Hongay, C.F., Grisafi, P.L., Galitski, T. and Fink, G.R. (2006) Antisense transcription controls cell fate in Saccharomyces cerevisiae. Cell, 127, 735-745.
Honigberg, S.M. (2004) Ime2p and Cdc28p: co-pilots driving meiotic development. J Cell Biochem, 92, 1025-1033.
Honigberg, S.M., Conicella, C. and Espositio, R.E. (1992) Commitment to meiosis in Saccharomyces cerevisiae: involvement of the SPO14 gene. Genetics, 130, 703-716.
Honigberg, S.M. and Esposito, R.E. (1994) Reversal of cell determination in yeast meiosis: postcommitment arrest allows return to mitotic growth. Proc Natl Acad Sci U S A, 91, 6559-6563.
Honigberg, S.M. and Purnapatre, K. (2003) Signal pathway integration in the switch from the mitotic cell cycle to meiosis in yeast. J Cell Sci, 116, 2137-2147.
Hori, O., Ichinoda, F., Yamaguchi, A., Tamatani, T., Taniguchi, M., Koyama, Y., Katayama, T., Tohyama, M., Stern, D.M., Ozawa, K., Kitao, Y. and Ogawa, S. (2004) Role of Herp in the endoplasmic reticulum stress response. Genes Cells, 9, 457-469.
Hortner, H., Ammerer, G., Hartter, E., Hamilton, B., Rytka, J., Bilinski, T. and Ruis, H. (1982) Regulation of synthesis of catalases and iso-1-cytochrome c in Saccharomyces cerevisiae by glucose, oxygen and heme. Eur J Biochem, 128, 179-184.
Hotamisligil, G.S. (2006) Inflammation and metabolic disorders. Nature, 444, 860-867.
Hu, R.G., Brower, C.S., Wang, H., Davydov, I.V., Sheng, J., Zhou, J., Kwon, Y.T. and Varshavsky, A. (2006) Arginyltransferase, its specificity, putative substrates, bidirectional promoter, and splicing-derived isoforms. J Biol Chem, 281, 32559-32573.
Hu, R.G., Sheng, J., Qi, X., Xu, Z., Takahashi, T.T. and Varshavsky, A. (2005) The N-end rule pathway as a nitric oxide sensor controlling the levels of multiple regulators. Nature, 437, 981-986.
Huang, C.J., Lin, C.Y., Haataja, L., Gurlo, T., Butler, A.E., Rizza, R.A. and Butler, P.C. (2007) High expression rates of human islet amyloid polypeptide induce endoplasmic reticulum stress mediated beta-cell apoptosis, a characteristic of humans with type 2 but not type 1 diabetes. Diabetes, 56, 2016-2027.

188
Inai, T., Yukawa, M. and Tsuchiya, E. (2007) Interplay between chromatin and trans-acting factors on the IME2 promoter upon induction of the gene at the onset of meiosis. Mol Cell Biol, 27, 1254-1263.
Iwakoshi, N.N., Lee, A.H., Vallabhajosyula, P., Otipoby, K.L., Rajewsky, K. and Glimcher, L.H. (2003) Plasma cell differentiation and the unfolded protein response intersect at the transcription factor XBP-1. Nat Immunol, 4, 321-329.
Jia, M.H., Larossa, R.A., Lee, J.M., Rafalski, A., Derose, E., Gonye, G. and Xue, Z. (2000) Global expression profiling of yeast treated with an inhibitor of amino acid biosynthesis, sulfometuron methyl. Physiol Genomics, 3, 83-92.
Jiang, H.Y., Wek, S.A., McGrath, B.C., Lu, D., Hai, T., Harding, H.P., Wang, X., Ron, D., Cavener, D.R. and Wek, R.C. (2004) Activating transcription factor 3 is integral to the eukaryotic initiation factor 2 kinase stress response. Mol Cell Biol, 24, 1365-1377.
Jiang, H.Y., Wek, S.A., McGrath, B.C., Scheuner, D., Kaufman, R.J., Cavener, D.R. and Wek, R.C. (2003) Phosphorylation of the alpha subunit of eukaryotic initiation factor 2 is required for activation of NF-kappaB in response to diverse cellular stresses. Mol Cell Biol, 23, 5651-5663.
Jin, R., Dobry, C.J., McCown, P.J. and Kumar, A. (2008) Large-scale analysis of yeast filamentous growth by systematic gene disruption and overexpression. Molecular Biology of the Cell, 19, 284-296.
Johnson, E.S., Gonda, D.K. and Varshavsky, A. (1990) cis-trans recognition and subunit-specific degradation of short-lived proteins. Nature, 346, 287-291.
Johnston, M. (1999) Feasting, fasting and fermenting. Glucose sensing in yeast and other cells. Trends Genet, 15, 29-33.
Jorgensen, P., Rupes, I., Sharom, J.R., Schneper, L., Broach, J.R. and Tyers, M. (2004) A dynamic transcriptional network communicates growth potential to ribosome synthesis and critical cell size. Genes Dev, 18, 2491-2505.
Joshi, A.A. and Struhl, K. (2005) Eaf3 chromodomain interaction with methylated H3-K36 links histone deacetylation to Pol II elongation. Mol Cell, 20, 971-978.
Kadosh, D. and Struhl, K. (1997) Repression by Ume6 involves recruitment of a complex containing Sin3 corepressor and Rpd3 histone deacetylase to target promoters. Cell, 89, 365-371.
Kadosh, D. and Struhl, K. (1998) Targeted recruitment of the Sin3-Rpd3 histone deacetylase complex generates a highly localized domain of repressed chromatin in vivo. Mol Cell Biol, 18, 5121-5127.
Kagalwala, M.N., Glaus, B.J., Dang, W., Zofall, M. and Bartholomew, B. (2004) Topography of the ISW2-nucleosome complex: insights into nucleosome spacing and chromatin remodeling. Embo J, 23, 2092-2104.
189
Kamada, Y., Fujioka, Y., Suzuki, N.N., Inagaki, F., Wullschleger, S., Loewith, R., Hall, M.N. and Ohsumi, Y. (2005) Tor2 directly phosphorylates the AGC kinase Ypk2 to regulate actin polarization. Mol Cell Biol, 25, 7239-7248.
Kane, S.M. and Roth, R. (1974) Carbohydrate metabolism during ascospore development in yeast. J Bacteriol, 118, 8-14.
Kaneto, H., Nakatani, Y., Kawamori, D., Miyatsuka, T., Matsuoka, T.A., Matsuhisa, M. and Yamasaki, Y. (2006) Role of oxidative stress, endoplasmic reticulum stress, and c-Jun N-terminal kinase in pancreatic beta-cell dysfunction and insulin resistance. Int J Biochem Cell Biol, 38, 782-793.
Kang, C.M. and Jiang, Y.W. (2005) Genome-wide survey of non-essential genes required for slowed DNA synthesis-induced filamentous growth in yeast. Yeast, 22, 79-90.
Kassabov, S.R., Henry, N.M., Zofall, M., Tsukiyama, T. and Bartholomew, B. (2002) High-resolution mapping of changes in histone-DNA contacts of nucleosomes remodeled by ISW2. Mol Cell Biol, 22, 7524-7534.
Kassir, Y., Adir, N., Boger-Nadjar, E., Raviv, N.G., Rubin-Bejerano, I., Sagee, S. and Shenhar, G. (2003) Transcriptional regulation of meiosis in budding yeast. Int Rev Cytol, 224, 111-171.
Kassir, Y., Granot, D. and Simchen, G. (1988) IME1, a positive regulator gene of meiosis in S. cerevisiae. Cell, 52, 853-862.
Kawahara, T., Yanagi, H., Yura, T. and Mori, K. (1997) Endoplasmic reticulum stress-induced mRNA splicing permits synthesis of transcription factor Hac1p/Ern4p that activates the unfolded protein response. Mol Biol Cell, 8, 1845-1862.
Kent, N.A., Karabetsou, N., Politis, P.K. and Mellor, J. (2001) In vivo chromatin remodeling by yeast ISWI homologs Isw1p and Isw2p. Genes Dev, 15, 619-626.
Keogh, M.C., Kurdistani, S.K., Morris, S.A., Ahn, S.H., Podolny, V., Collins, S.R., Schuldiner, M., Chin, K., Punna, T., Thompson, N.J., Boone, C., Emili, A., Weissman, J.S., Hughes, T.R., Strahl, B.D., Grunstein, M., Greenblatt, J.F., Buratowski, S. and Krogan, N.J. (2005) Cotranscriptional set2 methylation of histone H3 lysine 36 recruits a repressive Rpd3 complex. Cell, 123, 593-605.
Kerouz, N.J., Horsch, D., Pons, S. and Kahn, C.R. (1997) Differential regulation of insulin receptor substrates-1 and -2 (IRS-1 and IRS-2) and phosphatidylinositol 3-kinase isoforms in liver and muscle of the obese diabetic (ob/ob) mouse. J Clin Invest, 100, 3164-3172.
Khazak, V., Sadhale, P.P., Woychik, N.A., Brent, R. and Golemis, E.A. (1995) Human RNA polymerase II subunit hsRPB7 functions in yeast and influences stress survival and cell morphology. Mol Biol Cell, 6, 759-775.
190
Klasson, H., Fink, G.R. and Ljungdahl, P.O. (1999) Ssy1p and Ptr3p are plasma membrane components of a yeast system that senses extracellular amino acids. Mol Cell Biol, 19, 5405-5416.
Kobayashi, O., Yoshimoto, H. and Sone, H. (1999) Analysis of the genes activated by the FLO8 gene in Saccharomyces cerevisiae. Curr Genet, 36, 256-261.
Komeili, A., Wedaman, K.P., O'Shea, E.K. and Powers, T. (2000) Mechanism of metabolic control. Target of rapamycin signaling links nitrogen quality to the activity of the Rtg1 and Rtg3 transcription factors. J Cell Biol, 151, 863-878.
Korennykh, A.V., Egea, P.F., Korostelev, A.A., Finer-Moore, J., Zhang, C., Shokat, K.M., Stroud, R.M. and Walter, P. (2009) The unfolded protein response signals through high-order assembly of Ire1. Nature, 457, 687-693.
Kraakman, L., Lemaire, K., Ma, P., Teunissen, A.W., Donaton, M.C., Van Dijck, P., Winderickx, J., de Winde, J.H. and Thevelein, J.M. (1999) A Saccharomyces cerevisiae G-protein coupled receptor, Gpr1, is specifically required for glucose activation of the cAMP pathway during the transition to growth on glucose. Mol Microbiol, 32, 1002-1012.
Kramer, M.F. and Coen, D.M. (2001) The Polymerase chain reaction. Enzymatic amplification of DNA by PCR: Standard procedures and optimization. In Ausubel, F.M., Brent, R., Kingston, R.E., Moore, D.D., Seidman, C.E., Smith, J.A. and Struhl, K. (eds.), Current Protocols in Molecular Biology. John Wiley & Sons, New York, Vol. 2, pp. 15.11.11-14.
Kron, S.J. and Gow, N.A. (1995) Budding yeast morphogenesis: signalling, cytoskeleton and cell cycle. Curr Opin Cell Biol, 7, 845-855.
Kron, S.J., Styles, C.A. and Fink, G.R. (1994) Symmetric cell division in pseudohyphae of the yeast Saccharomyces cerevisiae. Mol Biol Cell, 5, 1003-1022.
Kruckeberg, A.L., Walsh, M.C. and Van Dam, K. (1998) How do yeast cells sense glucose? Bioessays, 20, 972-976.
Kübler, E., Mosch, H.U., Rupp, S. and Lisanti, M.P. (1997) Gpa2p, a G-protein alpha-subunit, regulates growth and pseudohyphal development in Saccharomyces cerevisiae via a cAMP-dependent mechanism. J Biol Chem, 272, 20321-20323.
Kuchin, S., Vyas, V.K. and Carlson, M. (2002) Snf1 protein kinase and the repressors Nrg1 and Nrg2 regulate FLO11, haploid invasive growth, and diploid pseudohyphal differentiation. Mol Cell Biol, 22, 3994-4000.
Kuhn, K.M., DeRisi, J.L., Brown, P.O. and Sarnow, P. (2001) Global and specific translational regulation in the genomic response of Saccharomyces cerevisiae to a rapid transfer from a fermentable to a nonfermentable carbon source. Mol Cell Biol, 21, 916-927.

191
Kupiec, M., Byers, B., Esposito, R.E. and Mitchell, A.P. (1997) Meiosis and sporulation in Saccharomyces cerevisiae. In Pringle, J.R., Broach, J.R. and Jones, E.W. (eds.), The Molecular and Cellular Biology of the Yeast Saccharomyces. Cold Spring Harbor Laboratory Press, Plainview, N.Y., Vol. 3, pp. 889-1036.
Kwon, Y.T., Balogh, S.A., Davydov, I.V., Kashina, A.S., Yoon, J.K., Xie, Y., Gaur, A., Hyde, L., Denenberg, V.H. and Varshavsky, A. (2000) Altered activity, social behavior, and spatial memory in mice lacking the NTAN1p amidase and the asparagine branch of the N-end rule pathway. Mol Cell Biol, 20, 4135-4148.
Kwon, Y.T., Kashina, A.S., Davydov, I.V., Hu, R.G., An, J.Y., Seo, J.W., Du, F. and Varshavsky, A. (2002) An essential role of N-terminal arginylation in cardiovascular development. Science, 297, 96-99.
Kwon, Y.T., Kashina, A.S. and Varshavsky, A. (1999) Alternative splicing results in differential expression, activity, and localization of the two forms of arginyl-tRNA-protein transferase, a component of the N-end rule pathway. Mol Cell Biol, 19, 182-193.
Kwon, Y.T., Xia, Z., An, J.Y., Tasaki, T., Davydov, I.V., Seo, J.W., Sheng, J., Xie, Y. and Varshavsky, A. (2003) Female lethality and apoptosis of spermatocytes in mice lacking the UBR2 ubiquitin ligase of the N-end rule pathway. Mol Cell Biol, 23, 8255-8271.
Lamb, T.M., Xu, W., Diamond, A. and Mitchell, A.P. (2001) Alkaline response genes of Saccharomyces cerevisiae and their relationship to the RIM101 pathway. J Biol Chem, 276, 1850-1856.
Laybutt, D.R., Preston, A.M., Akerfeldt, M.C., Kench, J.G., Busch, A.K., Biankin, A.V. and Biden, T.J. (2007) Endoplasmic reticulum stress contributes to beta cell apoptosis in type 2 diabetes. Diabetologia, 50, 752-763.
Leberer, E., Wu, C., Leeuw, T., Fourest-Lieuvin, A., Segall, J.E. and Thomas, D.Y. (1997) Functional characterization of the Cdc42p binding domain of yeast Ste20p protein kinase. Embo J, 16, 83-97.
Lee, A.H., Chu, G.C., Iwakoshi, N.N. and Glimcher, L.H. (2005a) XBP-1 is required for biogenesis of cellular secretory machinery of exocrine glands. Embo J, 24, 4368-4380.
Lee, A.H., Iwakoshi, N.N. and Glimcher, L.H. (2003) XBP-1 regulates a subset of endoplasmic reticulum resident chaperone genes in the unfolded protein response. Mol Cell Biol, 23, 7448-7459.
Lee, M.J., Tasaki, T., Moroi, K., An, J.Y., Kimura, S., Davydov, I.V. and Kwon, Y.T. (2005b) RGS4 and RGS5 are in vivo substrates of the N-end rule pathway. Proc Natl Acad Sci U S A, 102, 15030-15035.
Lee, R.H. and Honigberg, S.M. (1996) Nutritional regulation of late meiotic events in Saccharomyces cerevisiae through a pathway distinct from initiation. Mol Cell Biol, 16, 3222-3232.

192
Lengeler, K.B., Davidson, R.C., D'Souza, C., Harashima, T., Shen, W.C., Wang, P., Pan, X., Waugh, M. and Heitman, J. (2000) Signal transduction cascades regulating fungal development and virulence. Microbiol Mol Biol Rev, 64, 746-785.
Lesage, P., Yang, X. and Carlson, M. (1996) Yeast SNF1 protein kinase interacts with SIP4, a C6 zinc cluster transcriptional activator: a new role for SNF1 in the glucose response. Mol Cell Biol, 16, 1921-1928.
Liao, X. and Butow, R.A. (1993) RTG1 and RTG2: two yeast genes required for a novel path of communication from mitochondria to the nucleus. Cell, 72, 61-71.
Lin, K.I., Lin, Y. and Calame, K. (2000) Repression of c-myc is necessary but not sufficient for terminal differentiation of B lymphocytes in vitro. Mol Cell Biol, 20, 8684-8695.
Liu, C.Y., Xu, Z. and Kaufman, R.J. (2003) Structure and intermolecular interactions of the luminal dimerization domain of human IRE1alpha. J Biol Chem, 278, 17680-17687.
Liu, H., Styles, C.A. and Fink, G.R. (1996) Saccharomyces cerevisiae S288C has a mutation in FLO8, a gene required for filamentous growth. Genetics, 144, 967-978.
Liu, Z. and Butow, R.A. (1999) A transcriptional switch in the expression of yeast tricarboxylic acid cycle genes in response to a reduction or loss of respiratory function. Mol Cell Biol, 19, 6720-6728.
Liu, Z. and Butow, R.A. (2006) Mitochondrial retrograde signaling. Annu Rev Genet, 40, 159-185.
Lo, H.J., Kohler, J.R., DiDomenico, B., Loebenberg, D., Cacciapuoti, A. and Fink, G.R. (1997) Nonfilamentous C. albicans mutants are avirulent. Cell, 90, 939-949.
Lo, W.S. and Dranginis, A.M. (1998) The cell surface flocculin Flo11 is required for pseudohyphae formation and invasion by Saccharomyces cerevisiae. Mol Biol Cell, 9, 161-171.
Lobo, Z. and Maitra, P.K. (1977) Physiological role of glucose-phosphorylating enzymes in Saccharomyces cerevisiae. Arch Biochem Biophys, 182, 639-645.
Loeb, J.D., Kerentseva, T.A., Pan, T., Sepulveda-Becerra, M. and Liu, H. (1999) Saccharomyces cerevisiae G1 cyclins are differentially involved in invasive and pseudohyphal growth independent of the filamentation mitogen-activated protein kinase pathway. Genetics, 153, 1535-1546.
Loewith, R., Jacinto, E., Wullschleger, S., Lorberg, A., Crespo, J.L., Bonenfant, D., Oppliger, W., Jenoe, P. and Hall, M.N. (2002) Two TOR complexes, only one of which is rapamycin sensitive, have distinct roles in cell growth control. Mol Cell, 10, 457-468.

193
Lorenz, M.C., Cutler, N.S. and Heitman, J. (2000a) Characterization of alcohol-induced filamentous growth in Saccharomyces cerevisiae. Mol Biol Cell, 11, 183-199.
Lorenz, M.C. and Heitman, J. (1997) Yeast pseudohyphal growth is regulated by GPA2, a G protein alpha homolog. Embo J, 16, 7008-7018.
Lorenz, M.C. and Heitman, J. (1998a) The MEP2 ammonium permease regulates pseudohyphal differentiation in Saccharomyces cerevisiae. Embo J, 17, 1236-1247.
Lorenz, M.C. and Heitman, J. (1998b) Regulators of pseudohyphal differentiation in Saccharomyces cerevisiae identified through multicopy suppressor analysis in ammonium permease mutant strains. Genetics, 150, 1443-1457.
Lorenz, M.C., Pan, X., Harashima, T., Cardenas, M.E., Xue, Y., Hirsch, J.P. and Heitman, J. (2000b) The G protein-coupled receptor gpr1 is a nutrient sensor that regulates pseudohyphal differentiation in Saccharomyces cerevisiae. Genetics, 154, 609-622.
Lowry, O.H., Rosebrough, N.J., Farr, A.L. and Randall, R.J. (1951) Protein measurement with the Folin phenol reagent. J Biol Chem, 193, 265-275.
Lu, P.D., Harding, H.P. and Ron, D. (2004) Translation reinitiation at alternative open reading frames regulates gene expression in an integrated stress response. J Cell Biol, 167, 27-33.
Ma, H., Kunes, S., Schatz, P.J. and Botstein, D. (1987) Plasmid construction by homologous recombination in yeast. Gene, 58, 201-216.
Ma, K., Vattem, K.M. and Wek, R.C. (2002) Dimerization and release of molecular chaperone inhibition facilitate activation of eukaryotic initiation factor-2 kinase in response to endoplasmic reticulum stress. J Biol Chem, 277, 18728-18735.
Ma, Y. and Hendershot, L.M. (2003) Delineation of a negative feedback regulatory loop that controls protein translation during endoplasmic reticulum stress. J Biol Chem, 278, 34864-34873.
Madhani, H.D. and Fink, G.R. (1998) The riddle of MAP kinase signaling specificity. Trends Genet, 14, 151-155.
Madhani, H.D., Galitski, T., Lander, E.S. and Fink, G.R. (1999) Effectors of a developmental mitogen-activated protein kinase cascade revealed by expression signatures of signaling mutants. Proc Natl Acad Sci U S A, 96, 12530-12535.
Madhani, H.D., Styles, C.A. and Fink, G.R. (1997) MAP kinases with distinct inhibitory functions impart signaling specificity during yeast differentiation. Cell, 91, 673-684.
Madura, K. and Varshavsky, A. (1994) Degradation of G alpha by the N-end rule pathway. Science, 265, 1454-1458.

194
Maeda, T., Takekawa, M. and Saito, H. (1995) Activation of yeast PBS2 MAPKK by MAPKKKs or by binding of an SH3-containing osmosensor. Science, 269, 554-558.
Magasanik, B. and Kaiser, C.A. (2002) Nitrogen regulation in Saccharomyces cerevisiae. Gene, 290, 1-18.
Malathi, K., Xiao, Y. and Mitchell, A.P. (1997) Interaction of yeast repressor-activator protein Ume6p with glycogen synthase kinase 3 homolog Rim11p. Mol Cell Biol, 17, 7230-7236.
Malathi, K., Xiao, Y. and Mitchell, A.P. (1999) Catalytic roles of yeast GSK3beta/shaggy homolog Rim11p in meiotic activation. Genetics, 153, 1145-1152.
Maleri, S., Ge, Q., Hackett, E.A., Wang, Y., Dohlman, H.G. and Errede, B. (2004) Persistent activation by constitutive Ste7 promotes Kss1-mediated invasive growth but fails to support Fus3-dependent mating in yeast. Mol Cell Biol, 24, 9221-9238.
Mallory, M.J., Cooper, K.F. and Strich, R. (2007) Meiosis-specific destruction of the Ume6p repressor by the Cdc20-directed APC/C. Mol Cell, 27, 951-961.
Mandel, S., Robzyk, K. and Kassir, Y. (1994) Ime1 gene encodes a transcription factor which is required to induce meiosis in Saccharomyces cerevisiae. Dev Genet, 15, 139-147.
Marion, R.M., Regev, A., Segal, E., Barash, Y., Koller, D., Friedman, N. and O'Shea, E.K. (2004) Sfp1 is a stress- and nutrient-sensitive regulator of ribosomal protein gene expression. Proc Natl Acad Sci U S A, 101, 14315-14322.
Marston, A.L. and Amon, A. (2004) Meiosis: cell-cycle controls shuffle and deal. Nat Rev Mol Cell Biol, 5, 983-997.
Matsumoto, K., Uno, I. and Ishikawa, T. (1983) Initiation of meiosis in yeast mutants defective in adenylate cyclase and cyclic AMP-dependent protein kinase. Cell, 32, 417-423.
McConnell, A.D., Gelbart, M.E. and Tsukiyama, T. (2004) Histone fold protein Dls1p is required for Isw2-dependent chromatin remodeling in vivo. Mol Cell Biol, 24, 2605-2613.
Miled, C., Mann, C. and Faye, G. (2001) Xbp1-mediated repression of CLB gene expression contributes to the modifications of yeast cell morphology and cell cycle seen during nitrogen-limited growth. Mol Cell Biol, 21, 3714-3724.
Miller, J.H. (1972) Assay of β-galactosidase in Experiments in molecular genetics. Cold Spring Harbor Laboratory Press, [Cold Spring Harbor N.Y.].
Mitchell, A.P., Driscoll, S.E. and Smith, H.E. (1990) Positive control of sporulation-specific genes by the IME1 and IME2 products in Saccharomyces cerevisiae. Mol Cell Biol, 10, 2104-2110.

195
Mori, K., Kawahara, T., Yoshida, H., Yanagi, H. and Yura, T. (1996) Signalling from endoplasmic reticulum to nucleus: transcription factor with a basic-leucine zipper motif is required for the unfolded protein-response pathway. Genes Cells, 1, 803-817.
Mori, K., Ogawa, N., Kawahara, T., Yanagi, H. and Yura, T. (1998) Palindrome with spacer of one nucleotide is characteristic of the cis-acting unfolded protein response element in Saccharomyces cerevisiae. J Biol Chem, 273, 9912-9920.
Mori, K., Ogawa, N., Kawahara, T., Yanagi, H. and Yura, T. (2000) mRNA splicing-mediated C-terminal replacement of transcription factor Hac1p is required for efficient activation of the unfolded protein response. Proc Natl Acad Sci U S A, 97, 4660-4665.
Mori, K., Sant, A., Kohno, K., Normington, K., Gething, M.J. and Sambrook, J.F. (1992) A 22 bp cis-acting element is necessary and sufficient for the induction of the yeast KAR2 (BiP) gene by unfolded proteins. Embo J, 11, 2583-2593.
Moriya, H., Shimizu-Yoshida, Y., Omori, A., Iwashita, S., Katoh, M. and Sakai, A. (2001) Yak1p, a DYRK family kinase, translocates to the nucleus and phosphorylates yeast Pop2p in response to a glucose signal. Genes Dev, 15, 1217-1228.
Morohashi, N., Nakajima, K., Kurihara, D., Mukai, Y., Mitchell, A.P. and Shimizu, M. (2007) A nucleosome positioned by alpha2/Mcm1 prevents Hap1 activator binding in vivo. Biochem Biophys Res Commun, 364, 583-588.
Mösch, H.U. and Fink, G.R. (1997) Dissection of filamentous growth by transposon mutagenesis in Saccharomyces cerevisiae. Genetics, 145, 671-684.
Mösch, H.U., Kubler, E., Krappmann, S., Fink, G.R. and Braus, G.H. (1999) Crosstalk between the Ras2p-controlled mitogen-activated protein kinase and cAMP pathways during invasive growth of Saccharomyces cerevisiae. Mol Biol Cell, 10, 1325-1335.
Mueller, P.P. and Hinnebusch, A.G. (1986) Multiple upstream AUG codons mediate translational control of GCN4. Cell, 45, 201-207.
Mulet, J.M., Martin, D.E., Loewith, R. and Hall, M.N. (2006) Mutual antagonism of target of rapamycin and calcineurin signaling. J Biol Chem, 281, 33000-33007.
Murakami, Y., Tatebayashi, K. and Saito, H. (2008) Two adjacent docking sites in the yeast Hog1 mitogen-activated protein (MAP) kinase differentially interact with the Pbs2 MAP kinase kinase and the Ptp2 protein tyrosine phosphatase. Mol Cell Biol, 28, 2481-2494.
Murray, L.E., Rowley, N., Dawes, I.W., Johnston, G.C. and Singer, R.A. (1998) A yeast glutamine tRNA signals nitrogen status for regulation of dimorphic growth and sporulation. Proc Natl Acad Sci U S A, 95, 8619-8624.

196
Nakatani, Y., Kaneto, H., Kawamori, D., Yoshiuchi, K., Hatazaki, M., Matsuoka, T.A., Ozawa, K., Ogawa, S., Hori, M., Yamasaki, Y. and Matsuhisa, M. (2005) Involvement of endoplasmic reticulum stress in insulin resistance and diabetes. J Biol Chem, 280, 847-851.
Nandi, A., Kitamura, Y., Kahn, C.R. and Accili, D. (2004) Mouse models of insulin resistance. Physiol Rev, 84, 623-647.
Natarajan, K., Meyer, M.R., Jackson, B.M., Slade, D., Roberts, C., Hinnebusch, A.G. and Marton, M.J. (2001) Transcriptional profiling shows that Gcn4p is a master regulator of gene expression during amino acid starvation in yeast. Mol Cell Biol, 21, 4347-4368.
Nath, N., McCartney, R.R. and Schmidt, M.C. (2003) Yeast Pak1 kinase associates with and activates Snf1. Mol Cell Biol, 23, 3909-3917.
Nelson, B., Parsons, A.B., Evangelista, M., Schaefer, K., Kennedy, K., Ritchie, S., Petryshen, T.L. and Boone, C. (2004) Fus1p interacts with components of the Hog1p mitogen-activated protein kinase and Cdc42p morphogenesis signaling pathways to control cell fusion during yeast mating. Genetics, 166, 67-77.
Nishitoh, H., Matsuzawa, A., Tobiume, K., Saegusa, K., Takeda, K., Inoue, K., Hori, S., Kakizuka, A. and Ichijo, H. (2002) ASK1 is essential for endoplasmic reticulum stress-induced neuronal cell death triggered by expanded polyglutamine repeats. Genes Dev, 16, 1345-1355.
O'Rourke, S.M. and Herskowitz, I. (1998) The Hog1 MAPK prevents cross talk between the HOG and pheromone response MAPK pathways in Saccharomyces cerevisiae. Genes Dev, 12, 2874-2886.
O'Rourke, S.M. and Herskowitz, I. (2004) Unique and redundant roles for HOG MAPK pathway components as revealed by whole-genome expression analysis. Mol Biol Cell, 15, 532-542.
Ohkuni, K. and Yamashita, I. (2000) A transcriptional autoregulatory loop for KIN28-CCL1 and SRB10-SRB11, each encoding RNA polymerase II CTD kinase-cyclin pair, stimulates the meiotic development of S. cerevisiae. Yeast, 16, 829-846.
Olesen, J., Hahn, S. and Guarente, L. (1987) Yeast HAP2 and HAP3 activators both bind to the CYC1 upstream activation site, UAS2, in an interdependent manner. Cell, 51, 953-961.
Olson, K.A., Nelson, C., Tai, G., Hung, W., Yong, C., Astell, C. and Sadowski, I. (2000) Two regulators of Ste12p inhibit pheromone-responsive transcription by separate mechanisms. Mol Cell Biol, 20, 4199-4209.
Ozawa, K., Miyazaki, M., Matsuhisa, M., Takano, K., Nakatani, Y., Hatazaki, M., Tamatani, T., Yamagata, K., Miyagawa, J., Kitao, Y., Hori, O., Yamasaki, Y. and Ogawa, S. (2005) The endoplasmic reticulum chaperone improves insulin resistance in type 2 diabetes. Diabetes, 54, 657-663.

197
Özcan, S., Dover, J., Rosenwald, A.G., Wolfl, S. and Johnston, M. (1996) Two glucose transporters in Saccharomyces cerevisiae are glucose sensors that generate a signal for induction of gene expression. Proc Natl Acad Sci U S A, 93, 12428-12432.
Ozcan, S. and Johnston, M. (1999) Function and regulation of yeast hexose transporters. Microbiol Mol Biol Rev, 63, 554-569.
Özcan, U., Cao, Q., Yilmaz, E., Lee, A.H., Iwakoshi, N.N., Ozdelen, E., Tuncman, G., Gorgun, C., Glimcher, L.H. and Hotamisligil, G.S. (2004) Endoplasmic reticulum stress links obesity, insulin action, and type 2 diabetes. Science, 306, 457-461.
Özcan, U., Yilmaz, E., Ozcan, L., Furuhashi, M., Vaillancourt, E., Smith, R.O., Gorgun, C.Z. and Hotamisligil, G.S. (2006) Chemical chaperones reduce ER stress and restore glucose homeostasis in a mouse model of type 2 diabetes. Science, 313, 1137-1140.
Page, S.L. and Hawley, R.S. (2004) The genetics and molecular biology of the synaptonemal complex. Annu Rev Cell Dev Biol, 20, 525-558.
Pak, J. and Segall, J. (2002) Regulation of the premiddle and middle phases of expression of the NDT80 gene during sporulation of Saccharomyces cerevisiae. Mol Cell Biol, 22, 6417-6429.
Palecek, S.P., Parikh, A.S. and Kron, S.J. (2000) Genetic analysis reveals that FLO11 upregulation and cell polarization independently regulate invasive growth in Saccharomyces cerevisiae. Genetics, 156, 1005-1023.
Pan, X. and Heitman, J. (1999) Cyclic AMP-dependent protein kinase regulates pseudohyphal differentiation in Saccharomyces cerevisiae. Mol Cell Biol, 19, 4874-4887.
Pan, X. and Heitman, J. (2000) Sok2 regulates yeast pseudohyphal differentiation via a transcription factor cascade that regulates cell-cell adhesion. Mol Cell Biol, 20, 8364-8372.
Pan, X. and Heitman, J. (2002) Protein kinase A operates a molecular switch that governs yeast pseudohyphal differentiation. Mol Cell Biol, 22, 3981-3993.
Park, S.W., Zhou, Y., Lee, J., Lu, A., Sun, C., Chung, J., Ueki, K. and Ozcan, U. (2010) The regulatory subunits of PI3K, p85alpha and p85beta, interact with XBP-1 and increase its nuclear translocation. Nat Med, 16, 429-437.
Parviz, F. and Heideman, W. (1998) Growth-independent regulation of CLN3 mRNA levels by nutrients in Saccharomyces cerevisiae. J Bacteriol, 180, 225-230.
Peter, M., Neiman, A.M., Park, H.O., van Lohuizen, M. and Herskowitz, I. (1996) Functional analysis of the interaction between the small GTP binding protein Cdc42 and the Ste20 protein kinase in yeast. Embo J, 15, 7046-7059.

198
Pfeifer, K., Arcangioli, B. and Guarente, L. (1987) Yeast HAP1 activator competes with the factor RC2 for binding to the upstream activation site UAS1 of the CYC1 gene. Cell, 49, 9-18.
Pitoniak, A., Birkaya, B., Dionne, H.M., Vadaie, N. and Cullen, P.J. (2009) The signaling mucins Msb2 and Hkr1 differentially regulate the filamentation mitogen-activated protein kinase pathway and contribute to a multimodal response. Mol Biol Cell, 20, 3101-3114.
Posas, F. and Saito, H. (1997) Osmotic activation of the HOG MAPK pathway via Ste11p MAPKKK: scaffold role of Pbs2p MAPKK. Science, 276, 1702-1705.
Primig, M., Williams, R.M., Winzeler, E.A., Tevzadze, G.G., Conway, A.R., Hwang, S.Y., Davis, R.W. and Esposito, R.E. (2000) The core meiotic transcriptome in budding yeasts. Nat Genet, 26, 415-423.
Purnapatre, K., Gray, M., Piccirillo, S. and Honigberg, S.M. (2005) Glucose inhibits meiotic DNA replication through SCFGrr1p-dependent destruction of Ime2p kinase. Mol Cell Biol, 25, 440-450.
Purnapatre, K. and Honigberg, S.M. (2002) Meiotic differentiation during colony maturation in Saccharomyces cerevisiae. Curr Genet, 42, 1-8.
Purnapatre, K., Piccirillo, S., Schneider, B.L. and Honigberg, S.M. (2002) The CLN3/SWI6/CLN2 pathway and SNF1 act sequentially to regulate meiotic initiation in Saccharomyces cerevisiae. Genes Cells, 7, 675-691.
Radcliffe, P.A., Binley, K.M., Trevethick, J., Hall, M. and Sudbery, P.E. (1997) Filamentous growth of the budding yeast Saccharomyces cerevisiae induced by overexpression of the WHi2 gene. Microbiology, 143 ( Pt 6), 1867-1876.
Rahner, A., Scholer, A., Martens, E., Gollwitzer, B. and Schuller, H.J. (1996) Dual influence of the yeast Cat1p (Snf1p) protein kinase on carbon source-dependent transcriptional activation of gluconeogenic genes by the regulatory gene CAT8. Nucleic Acids Res, 24, 2331-2337.
Randez-Gil, F., Bojunga, N., Proft, M. and Entian, K.D. (1997) Glucose derepression of gluconeogenic enzymes in Saccharomyces cerevisiae correlates with phosphorylation of the gene activator Cat8p. Mol Cell Biol, 17, 2502-2510.
Rao, H., Uhlmann, F., Nasmyth, K. and Varshavsky, A. (2001) Degradation of a cohesin subunit by the N-end rule pathway is essential for chromosome stability. Nature, 410, 955-959.
Reimold, A.M., Iwakoshi, N.N., Manis, J., Vallabhajosyula, P., Szomolanyi-Tsuda, E., Gravallese, E.M., Friend, D., Grusby, M.J., Alt, F. and Glimcher, L.H. (2001) Plasma cell differentiation requires the transcription factor XBP-1. Nature, 412, 300-307.
Reinke, A., Anderson, S., McCaffery, J.M., Yates, J., 3rd, Aronova, S., Chu, S., Fairclough, S., Iverson, C., Wedaman, K.P. and Powers, T. (2004) TOR complex 1 includes a novel component, Tco89p (YPL180w), and cooperates

199
with Ssd1p to maintain cellular integrity in Saccharomyces cerevisiae. J Biol Chem, 279, 14752-14762.
Reiser, V., Salah, S.M. and Ammerer, G. (2000) Polarized localization of yeast Pbs2 depends on osmostress, the membrane protein Sho1 and Cdc42. Nat Cell Biol, 2, 620-627.
Remenyi, A., Good, M.C., Bhattacharyya, R.P. and Lim, W.A. (2005) The role of docking interactions in mediating signaling input, output, and discrimination in the yeast MAPK network. Mol Cell, 20, 951-962.
Robertson, L.S. and Fink, G.R. (1998) The three yeast A kinases have specific signaling functions in pseudohyphal growth. Proc Natl Acad Sci U S A, 95, 13783-13787.
Rohde, J.R., Campbell, S., Zurita-Martinez, S.A., Cutler, N.S., Ashe, M. and Cardenas, M.E. (2004) TOR controls transcriptional and translational programs via Sap-Sit4 protein phosphatase signaling effectors. Mol Cell Biol, 24, 8332-8341.
Rolland, F., Winderickx, J. and Thevelein, J.M. (2001) Glucose-sensing mechanisms in eukaryotic cells. Trends Biochem Sci, 26, 310-317.
Rolland, F., Winderickx, J. and Thevelein, J.M. (2002) Glucose-sensing and -signalling mechanisms in yeast. FEMS Yeast Res, 2, 183-201.
Roman, E., Arana, D.M., Nombela, C., Alonso-Monge, R. and Pla, J. (2007) MAP kinase pathways as regulators of fungal virulence. Trends Microbiol, 15, 181-190.
Ron, D. and Walter, P. (2007) Signal integration in the endoplasmic reticulum unfolded protein response. Nat Rev Mol Cell Biol, 8, 519-529.
Roosen, J., Engelen, K., Marchal, K., Mathys, J., Griffioen, G., Cameroni, E., Thevelein, J.M., De Virgilio, C., De Moor, B. and Winderickx, J. (2005) PKA and Sch9 control a molecular switch important for the proper adaptation to nutrient availability. Mol Microbiol, 55, 862-880.
Rose, M., Albig, W. and Entian, K.D. (1991) Glucose repression in Saccharomyces cerevisiae is directly associated with hexose phosphorylation by hexokinases PI and PII. Eur J Biochem, 199, 511-518.
Rosenthal, N. (1987) Identification of regulatory elements of cloned genes with functional assays. Methods Enzymol, 152, 704-720.
Rossi, R., Montecucco, A., Ciarrocchi, G. and Biamonti, G. (1997) Functional characterization of the T4 DNA ligase: a new insight into the mechanism of action. Nucleic Acids Res, 25, 2106-2113.
Rubin-Bejerano, I., Mandel, S., Robzyk, K. and Kassir, Y. (1996) Induction of meiosis in Saccharomyces cerevisiae depends on conversion of the transcriptional

200
represssor Ume6 to a positive regulator by its regulated association with the transcriptional activator Ime1. Mol Cell Biol, 16, 2518-2526.
Rundlett, S.E., Carmen, A.A., Kobayashi, R., Bavykin, S., Turner, B.M. and Grunstein, M. (1996) HDA1 and RPD3 are members of distinct yeast histone deacetylase complexes that regulate silencing and transcription. Proc Natl Acad Sci U S A, 93, 14503-14508.
Rundlett, S.E., Carmen, A.A., Suka, N., Turner, B.M. and Grunstein, M. (1998) Transcriptional repression by UME6 involves deacetylation of lysine 5 of histone H4 by RPD3. Nature, 392, 831-835.
Rupp, S., Summers, E., Lo, H.J., Madhani, H. and Fink, G. (1999) MAP kinase and cAMP filamentation signaling pathways converge on the unusually large promoter of the yeast FLO11 gene. Embo J, 18, 1257-1269.
Rutherford, J.C., Chua, G., Hughes, T., Cardenas, M.E. and Heitman, J. (2008) A Mep2-dependent transcriptional profile links permease function to gene expression during pseudohyphal growth in Saccharomyces cerevisiae. Mol Biol Cell, 19, 3028-3039.
Sagee, S., Sherman, A., Shenhar, G., Robzyk, K., Ben-Doy, N., Simchen, G. and Kassir, Y. (1998) Multiple and distinct activation and repression sequences mediate the regulated transcription of IME1, a transcriptional activator of meiosis-specific genes in Saccharomyces cerevisiae. Mol Cell Biol, 18, 1985-1995.
Saito, H. and Tatebayashi, K. (2004) Regulation of the osmoregulatory HOG MAPK cascade in yeast. J Biochem, 136, 267-272.
Saltiel, A.R. and Kahn, C.R. (2001) Insulin signalling and the regulation of glucose and lipid metabolism. Nature, 414, 799-806.
Saltiel, A.R. and Pessin, J.E. (2002) Insulin signaling pathways in time and space. Trends Cell Biol, 12, 65-71.
Sambrook, J.F.E.F.M.T. (1989) Molecular cloning : a laboratory manual. Cold Spring Harbor Laboratory, Cold Spring Harbor, N.Y.
Sari, F., Heinrich, M., Meyer, W., Braus, G.H. and Irniger, S. (2008) The C-terminal region of the meiosis-specific protein kinase Ime2 mediates protein instability and is required for normal spore formation in budding yeast. J Mol Biol, 378, 31-43.
Schena, M., Picard, D. and Yamamoto, K.R. (1991) Vectors for constitutive and inducible gene expression in yeast. Methods Enzymol, 194, 389-398.
Scherens, B., Feller, A., Vierendeels, F., Messenguy, F. and Dubois, E. (2006) Identification of direct and indirect targets of the Gln3 and Gat1 activators by transcriptional profiling in response to nitrogen availability in the short and long term. FEMS Yeast Res, 6, 777-791.

201
Scheuner, D. and Kaufman, R.J. (2008) The unfolded protein response: a pathway that links insulin demand with beta-cell failure and diabetes. Endocr Rev, 29, 317-333.
Scheuner, D., Song, B., McEwen, E., Liu, C., Laybutt, R., Gillespie, P., Saunders, T., Bonner-Weir, S. and Kaufman, R.J. (2001) Translational control is required for the unfolded protein response and in vivo glucose homeostasis. Mol Cell, 7, 1165-1176.
Schindler, K., Benjamin, K.R., Martin, A., Boglioli, A., Herskowitz, I. and Winter, E. (2003) The Cdk-activating kinase Cak1p promotes meiotic S phase through Ime2p. Mol Cell Biol, 23, 8718-8728.
Schindler, K. and Winter, E. (2006) Phosphorylation of Ime2 regulates meiotic progression in Saccharomyces cerevisiae. J Biol Chem, 281, 18307-18316.
Schröder, M., Chang, J.S. and Kaufman, R.J. (2000) The unfolded protein response represses nitrogen-starvation induced developmental differentiation in yeast. Genes Dev, 14, 2962-2975.
Schröder, M., Clark, R., Liu, C.Y. and Kaufman, R.J. (2004) The unfolded protein response represses differentiation through the RPD3-SIN3 histone deacetylase. Embo J, 23, 2281-2292.
Schröder, M. and Kaufman, R.J. (2005) The mammalian unfolded protein response. Annu Rev Biochem, 74, 739-789.
Schüller, H.J. (2003) Transcriptional control of nonfermentative metabolism in the yeast Saccharomyces cerevisiae. Curr Genet, 43, 139-160.
Schwartz, M.A. and Madhani, H.D. (2004) Principles of MAP kinase signaling specificity in Saccharomyces cerevisiae. Annu Rev Genet, 38, 725-748.
Schwartz, M.A. and Madhani, H.D. (2006) Control of MAPK signaling specificity by a conserved residue in the MEK-binding domain of the yeast scaffold protein Ste5. Curr Genet, 49, 351-363.
Seidman, C.E., Struhl, K., Sheen, J. and Jessen, T. (1997a) Escherichia coli, plasmids, and bacteriophages. Vectors derived from plasmids. Introduction of plasmid DNA into cells. In Ausubel, F.M., Brent, R., Kingston, R.E., Moore, D.D., Seidman, C.E., Smith, J.A. and Struhl, K. (eds.), Current Protocols in Molecular Biology. John Wiley & Sons, New York, Vol. 1, pp. 1.8.4-7.
Seidman, C.E., Struhl, K., Sheen, J. and Jessen, T. (1997b) Escherichia coli, plasmids, and bacteriophages. Vectors derived from plasmids. Introduction of plasmid DNA into cells. In Ausubel, F.M., Brent, R., Kingston, R.E., Moore, D.D., Seidman, C.E., Smith, J.A. and Struhl, K. (eds.), Current Protocols in Molecular Biology. John Wiley & Sons, New York, Vol. 1, pp. 1.8.1-4.
Shaffer, A.L., Shapiro-Shelef, M., Iwakoshi, N.N., Lee, A.H., Qian, S.B., Zhao, H., Yu, X., Yang, L., Tan, B.K., Rosenwald, A., Hurt, E.M., Petroulakis, E., Sonenberg, N., Yewdell, J.W., Calame, K., Glimcher, L.H. and Staudt, L.M. (2004) XBP1,

202
downstream of Blimp-1, expands the secretory apparatus and other organelles, and increases protein synthesis in plasma cell differentiation. Immunity, 21, 81-93.
Shah, J.C. and Clancy, M.J. (1992) IME4, a gene that mediates MAT and nutritional control of meiosis in Saccharomyces cerevisiae. Mol Cell Biol, 12, 1078-1086.
Shamu, C.E. and Walter, P. (1996) Oligomerization and phosphorylation of the Ire1p kinase during intracellular signaling from the endoplasmic reticulum to the nucleus. Embo J, 15, 3028-3039.
Sharma, P.M., Egawa, K., Huang, Y., Martin, J.L., Huvar, I., Boss, G.R. and Olefsky, J.M. (1998) Inhibition of phosphatidylinositol 3-kinase activity by adenovirus-mediated gene transfer and its effect on insulin action. J Biol Chem, 273, 18528-18537.
Shefer-Vaida, M., Sherman, A., Ashkenazi, T., Robzyk, K. and Kassir, Y. (1995) Positive and negative feedback loops affect the transcription of IME1, a positive regulator of meiosis in Saccharomyces cerevisiae. Dev Genet, 16, 219-228.
Shenhar, G. and Kassir, Y. (2001) A positive regulator of mitosis, Sok2, functions as a negative regulator of meiosis in Saccharomyces cerevisiae. Mol Cell Biol, 21, 1603-1612.
Sherman, F. and Roman, H. (1963) Evidence for two types of allelic recombination in yeast. Genetics, 48, 255-261.
Sherriff, J.A., Kent, N.A. and Mellor, J. (2007) The Isw2 chromatin-remodeling ATPase cooperates with the Fkh2 transcription factor to repress transcription of the B-type cyclin gene CLB2. Mol Cell Biol, 27, 2848-2860.
Shimizu, M., Takahashi, K., Lamb, T.M., Shindo, H. and Mitchell, A.P. (2003) Yeast Ume6p repressor permits activator binding but restricts TBP binding at the HOP1 promoter. Nucleic Acids Res, 31, 3033-3037.
Shirra, M.K. and Arndt, K.M. (1999) Evidence for the involvement of the Glc7-Reg1 phosphatase and the Snf1-Snf4 kinase in the regulation of INO1 transcription in Saccharomyces cerevisiae. Genetics, 152, 73-87.
Shock, T.R., Thompson, J., Yates, J.R., 3rd and Madhani, H.D. (2009) Hog1 mitogen-activated protein kinase (MAPK) interrupts signal transduction between the Kss1 MAPK and the Tec1 transcription factor to maintain pathway specificity. Eukaryot Cell, 8, 606-616.
Shoelson, S.E., Lee, J. and Goldfine, A.B. (2006) Inflammation and insulin resistance. J Clin Invest, 116, 1793-1801.
Shulman, G.I. (1999) Cellular mechanisms of insulin resistance in humans. Am J Cardiol, 84, 3J-10J.

203
Sia, R.A. and Mitchell, A.P. (1995) Stimulation of later functions of the yeast meiotic protein kinase Ime2p by the IDS2 gene product. Mol Cell Biol, 15, 5279-5287.
Sidrauski, C., Cox, J.S. and Walter, P. (1996) tRNA ligase is required for regulated mRNA splicing in the unfolded protein response. Cell, 87, 405-413.
Sidrauski, C. and Walter, P. (1997) The transmembrane kinase Ire1p is a site-specific endonuclease that initiates mRNA splicing in the unfolded protein response. Cell, 90, 1031-1039.
Simchen, G., Pinon, R. and Salts, Y. (1972) Sporulation in Saccharomyces cerevisiae: premeiotic DNA synthesis, readiness and commitment. Exp Cell Res, 75, 207-218.
Smith, H.E., Driscoll, S.E., Sia, R.A., Yuan, H.E. and Mitchell, A.P. (1993) Genetic evidence for transcriptional activation by the yeast IME1 gene product. Genetics, 133, 775-784.
Smith, H.E. and Mitchell, A.P. (1989) A transcriptional cascade governs entry into meiosis in Saccharomyces cerevisiae. Mol Cell Biol, 9, 2142-2152.
Sopko, R., Raithatha, S. and Stuart, D. (2002) Phosphorylation and maximal activity of Saccharomyces cerevisiae meiosis-specific transcription factor Ndt80 is dependent on Ime2. Mol Cell Biol, 22, 7024-7040.
Soushko, M. and Mitchell, A.P. (2000) An RNA-binding protein homologue that promotes sporulation-specific gene expression in Saccharomyces cerevisiae. Yeast, 16, 631-639.
Spencer, J.F. and Spencer, D.M. (1996) Meiotic analysis. Methods Mol Biol, 53, 51-58.
Sriburi, R., Jackowski, S., Mori, K. and Brewer, J.W. (2004) XBP1: a link between the unfolded protein response, lipid biosynthesis, and biogenesis of the endoplasmic reticulum. J Cell Biol, 167, 35-41.
Stanbrough, M. and Magasanik, B. (1996) Two transcription factors, Gln3p and Nil1p, use the same GATAAG sites to activate the expression of GAP1 of Saccharomyces cerevisiae. J Bacteriol, 178, 2465-2468.
Stanbrough, M., Rowen, D.W. and Magasanik, B. (1995) Role of the GATA factors Gln3p and Nil1p of Saccharomyces cerevisiae in the expression of nitrogen-regulated genes. Proc Natl Acad Sci U S A, 92, 9450-9454.
Stanhill, A., Schick, N. and Engelberg, D. (1999) The yeast ras/cyclic AMP pathway induces invasive growth by suppressing the cellular stress response. Mol Cell Biol, 19, 7529-7538.
Steber, C.M. and Esposito, R.E. (1995) UME6 is a central component of a developmental regulatory switch controlling meiosis-specific gene expression. Proc Natl Acad Sci U S A, 92, 12490-12494.

204
Stoy, J., Edghill, E.L., Flanagan, S.E., Ye, H., Paz, V.P., Pluzhnikov, A., Below, J.E., Hayes, M.G., Cox, N.J., Lipkind, G.M., Lipton, R.B., Greeley, S.A., Patch, A.M., Ellard, S., Steiner, D.F., Hattersley, A.T., Philipson, L.H. and Bell, G.I. (2007) Insulin gene mutations as a cause of permanent neonatal diabetes. Proc Natl Acad Sci U S A, 104, 15040-15044.
Strich, R., Surosky, R.T., Steber, C., Dubois, E., Messenguy, F. and Esposito, R.E. (1994) UME6 is a key regulator of nitrogen repression and meiotic development. Genes Dev, 8, 796-810.
Strudwick, N., Brown, M., Parmar, V.M. and Schroder, M. (2010) Ime1 and Ime2 are required for pseudohyphal growth of Saccharomyces cerevisiae on nonfermentable carbon sources. Mol Cell Biol, 30, 5514-5530.
Stuart, D. and Wittenberg, C. (1998) CLB5 and CLB6 are required for premeiotic DNA replication and activation of the meiotic S/M checkpoint. Genes Dev, 12, 2698-2710.
Su, S.S. and Mitchell, A.P. (1993a) Identification of functionally related genes that stimulate early meiotic gene expression in yeast. Genetics, 133, 67-77.
Su, S.S. and Mitchell, A.P. (1993b) Molecular characterization of the yeast meiotic regulatory gene RIM1. Nucleic Acids Res, 21, 3789-3797.
Sugiyama, M. and Nikawa, J. (2001) The Saccharomyces cerevisiae Isw2p-Itc1p complex represses INO1 expression and maintains cell morphology. J Bacteriol, 183, 4985-4993.
Suka, N., Suka, Y., Carmen, A.A., Wu, J. and Grunstein, M. (2001) Highly specific antibodies determine histone acetylation site usage in yeast heterochromatin and euchromatin. Mol Cell, 8, 473-479.
Surosky, R.T. and Esposito, R.E. (1992) Early meiotic transcripts are highly unstable in Saccharomyces cerevisiae. Mol Cell Biol, 12, 3948-3958.
Sweet, D.H., Jang, Y.K. and Sancar, G.B. (1997) Role of UME6 in transcriptional regulation of a DNA repair gene in Saccharomyces cerevisiae. Mol Cell Biol, 17, 6223-6235.
Tabor, S. (1987) Enzymatic manipulation of DNA and RNA. Phosphatases and kinases. In Ausubel, F.M., Brent, R., Kingston, R.E., Moore, D.D., Seidman, C.E., Smith, J.A. and Struhl, K. (eds.), Current Protocols in Molecular Biology. John Wiley & Sons, New York, Vol. 1, pp. 3.10.11-15.
Tamaki, H., Miwa, T., Shinozaki, M., Saito, M., Yun, C.W., Yamamoto, K. and Kumagai, H. (2000) GPR1 regulates filamentous growth through FLO11 in yeast Saccharomyces cerevisiae. Biochem Biophys Res Commun, 267, 164-168.
Taniguchi, C.M., Emanuelli, B. and Kahn, C.R. (2006) Critical nodes in signalling pathways: insights into insulin action. Nat Rev Mol Cell Biol, 7, 85-96.

205
Tanti, J.F., Gual, P., Gremeaux, T., Gonzalez, T., Barres, R. and Le Marchand-Brustel, Y. (2004) Alteration in insulin action: role of IRS-1 serine phosphorylation in the retroregulation of insulin signalling. Ann Endocrinol (Paris), 65, 43-48.
Tasaki, T. and Kwon, Y.T. (2007) The mammalian N-end rule pathway: new insights into its components and physiological roles. Trends Biochem Sci, 32, 520-528.
Tatebayashi, K., Tanaka, K., Yang, H.Y., Yamamoto, K., Matsushita, Y., Tomida, T., Imai, M. and Saito, H. (2007) Transmembrane mucins Hkr1 and Msb2 are putative osmosensors in the SHO1 branch of yeast HOG pathway. Embo J, 26, 3521-3533.
Tatebayashi, K., Yamamoto, K., Tanaka, K., Tomida, T., Maruoka, T., Kasukawa, E. and Saito, H. (2006) Adaptor functions of Cdc42, Ste50, and Sho1 in the yeast osmoregulatory HOG MAPK pathway. Embo J, 25, 3033-3044.
Teige, M., Scheikl, E., Reiser, V., Ruis, H. and Ammerer, G. (2001) Rck2, a member of the calmodulin-protein kinase family, links protein synthesis to high osmolarity MAP kinase signaling in budding yeast. Proc Natl Acad Sci U S A, 98, 5625-5630.
ter Linde, J.J., Liang, H., Davis, R.W., Steensma, H.Y., van Dijken, J.P. and Pronk, J.T. (1999) Genome-wide transcriptional analysis of aerobic and anaerobic chemostat cultures of Saccharomyces cerevisiae. J Bacteriol, 181, 7409-7413.
Thevelein, J.M. (1991) Fermentable sugars and intracellular acidification as specific activators of the RAS-adenylate cyclase signalling pathway in yeast: the relationship to nutrient-induced cell cycle control. Mol Microbiol, 5, 1301-1307.
Thevelein, J.M. (1992) The RAS-adenylate cyclase pathway and cell cycle control in Saccharomyces cerevisiae. Antonie Van Leeuwenhoek, 62, 109-130.
Thevelein, J.M., Gelade, R., Holsbeeks, I., Lagatie, O., Popova, Y., Rolland, F., Stolz, F., Van de Velde, S., Van Dijck, P., Vandormael, P., Van Nuland, A., Van Roey, K., Van Zeebroeck, G. and Yan, B. (2005) Nutrient sensing systems for rapid activation of the protein kinase A pathway in yeast. Biochem Soc Trans, 33, 253-256.
Tobias, J.W., Shrader, T.E., Rocap, G. and Varshavsky, A. (1991) The N-end rule in bacteria. Science, 254, 1374-1377.
Tobias, J.W. and Varshavsky, A. (1991) Cloning and functional analysis of the ubiquitin-specific protease gene UBP1 of Saccharomyces cerevisiae. J Biol Chem, 266, 12021-12028.
Towbin, H., Staehelin, T. and Gordon, J. (1979) Electrophoretic transfer of proteins from polyacrylamide gels to nitrocellulose sheets: procedure and some applications. Proc Natl Acad Sci U S A, 76, 4350-4354.

206
Traven, A., Wong, J.M., Xu, D., Sopta, M. and Ingles, C.J. (2001) Interorganellar communication. Altered nuclear gene expression profiles in a yeast mitochondrial dna mutant. J Biol Chem, 276, 4020-4027.
Travers, K.J., Patil, C.K., Wodicka, L., Lockhart, D.J., Weissman, J.S. and Walter, P. (2000) Functional and genomic analyses reveal an essential coordination between the unfolded protein response and ER-associated degradation. Cell, 101, 249-258.
Treco, D.A. and Lundblad, V. (1993) Yeast. Basic techniques of yeast genetics. Preparation and inoclation of frozen stock. In Ausubel, F.M., Brent, R., Kingston, R.E., Moore, D.D., Seidman, C.E., Smith, J.A. and Struhl, K. (eds.), Current Protocols in Molecular Biology. John Wiley & Sons, New York, Vol. 2, p. 13.11.16.
Treco, D.A. and Winston, F. (1997) Yeast. Basic techniques of yeast genetics. Growth and manipulation of yeast. In Ausubel, F.M., Brent, R., Kingston, R.E., Moore, D.D., Seidman, C.E., Smith, J.A. and Struhl, K. (eds.), Current Protocols in Molecular Biology. John Wiley & Sons, New York, Vol. 2, pp. 13.12.11-13.12.12.
Treinin, M. and Simchen, G. (1993) Mitochondrial activity is required for the expression of IME1, a regulator of meiosis in yeast. Curr Genet, 23, 223-227.
Treitel, M.A. and Carlson, M. (1995) Repression by SSN6-TUP1 is directed by MIG1, a repressor/activator protein. Proc Natl Acad Sci U S A, 92, 3132-3136.
Tsukiyama, T., Palmer, J., Landel, C.C., Shiloach, J. and Wu, C. (1999) Characterization of the imitation switch subfamily of ATP-dependent chromatin-remodeling factors in Saccharomyces cerevisiae. Genes Dev, 13, 686-697.
Turner, G.C., Du, F. and Varshavsky, A. (2000) Peptides accelerate their uptake by activating a ubiquitin-dependent proteolytic pathway. Nature, 405, 579-583.
Tyson, J.R. and Stirling, C.J. (2000) LHS1 and SIL1 provide a lumenal function that is essential for protein translocation into the endoplasmic reticulum. Embo J, 19, 6440-6452.
Uetz, P., Giot, L., Cagney, G., Mansfield, T.A., Judson, R.S., Knight, J.R., Lockshon, D., Narayan, V., Srinivasan, M., Pochart, P., Qureshi-Emili, A., Li, Y., Godwin, B., Conover, D., Kalbfleisch, T., Vijayadamodar, G., Yang, M., Johnston, M., Fields, S. and Rothberg, J.M. (2000) A comprehensive analysis of protein-protein interactions in Saccharomyces cerevisiae. Nature, 403, 623-627.
Urano, F., Bertolotti, A. and Ron, D. (2000a) IRE1 and efferent signaling from the endoplasmic reticulum. J Cell Sci, 113, 3697-3702.
Urano, F., Wang, X., Bertolotti, A., Zhang, Y., Chung, P., Harding, H.P. and Ron, D. (2000b) Coupling of stress in the ER to activation of JNK protein kinases by transmembrane protein kinase IRE1. Science, 287, 664-666.

207
Urban, J., Soulard, A., Huber, A., Lippman, S., Mukhopadhyay, D., Deloche, O., Wanke, V., Anrather, D., Ammerer, G., Riezman, H., Broach, J.R., De Virgilio, C., Hall, M.N. and Loewith, R. (2007) Sch9 is a major target of TORC1 in Saccharomyces cerevisiae. Mol Cell, 26, 663-674.
Uren, A.G., Beilharz, T., O'Connell, M.J., Bugg, S.J., van Driel, R., Vaux, D.L. and Lithgow, T. (1999) Role for yeast inhibitor of apoptosis (IAP)-like proteins in cell division. Proc Natl Acad Sci U S A, 96, 10170-10175.
Van de Velde, S. and Thevelein, J.M. (2008) Cyclic AMP-protein kinase A and Snf1 signaling mechanisms underlie the superior potency of sucrose for induction of filamentation in Saccharomyces cerevisiae. Eukaryot Cell, 7, 286-293.
Van Nuland, A., Vandormael, P., Donaton, M., Alenquer, M., Lourenco, A., Quintino, E., Versele, M. and Thevelein, J.M. (2006) Ammonium permease-based sensing mechanism for rapid ammonium activation of the protein kinase A pathway in yeast. Mol Microbiol, 59, 1485-1505.
Vander Mierde, D., Scheuner, D., Quintens, R., Patel, R., Song, B., Tsukamoto, K., Beullens, M., Kaufman, R.J., Bollen, M. and Schuit, F.C. (2007) Glucose activates a protein phosphatase-1-mediated signaling pathway to enhance overall translation in pancreatic beta-cells. Endocrinology, 148, 609-617.
Varshavsky, A. (1997) The N-end rule pathway of protein degradation. Genes Cells, 2, 13-28.
Varshavsky, A. (2003) The N-end rule and regulation of apoptosis. Nat Cell Biol, 5, 373-376.
Vattem, K.M. and Wek, R.C. (2004) Reinitiation involving upstream ORFs regulates ATF4 mRNA translation in mammalian cells. Proc Natl Acad Sci U S A, 101, 11269-11274.
Vidal, M. and Gaber, R.F. (1991) RPD3 encodes a second factor required to achieve maximum positive and negative transcriptional states in Saccharomyces cerevisiae. Mol Cell Biol, 11, 6317-6327.
Vidan, S. and Mitchell, A.P. (1997) Stimulation of yeast meiotic gene expression by the glucose-repressible protein kinase Rim15p. Mol Cell Biol, 17, 2688-2697.
Vincent, J.A., Kwong, T.J. and Tsukiyama, T. (2008) ATP-dependent chromatin remodeling shapes the DNA replication landscape. Nat Struct Mol Biol, 15, 477-484.
Vogelstein, B. and Gillespie, D. (1979) Preparative and analytical purification of DNA from agarose. Proc Natl Acad Sci U S A, 76, 615-619.
Voytas, D. (2000) Prepation and analysis of DNA. Resolution and recovery of large DNA fragments. Agarose gel electrophoresis. In Ausubel, F.M., Brent, R., Kingston, R.E., Moore, D.D., Seidman, C.E., Smith, J.A. and Struhl, K. (eds.), Current Protocols in Molecular Biology. John Wiley & Sons, New York, Vol. 1, pp. 2.5A.1-9.

208
Walsh, R.B., Kawasaki, G. and Fraenkel, D.G. (1983) Cloning of genes that complement yeast hexokinase and glucokinase mutants. J Bacteriol, 154, 1002-1004.
Wang, H. and Jiang, Y. (2003) The Tap42-protein phosphatase type 2A catalytic subunit complex is required for cell cycle-dependent distribution of actin in yeast. Mol Cell Biol, 23, 3116-3125.
Wang, Y., Abu Irqeba, A., Ayalew, M. and Suntay, K. (2009) Sumoylation of transcription factor Tec1 regulates signaling of mitogen-activated protein kinase pathways in yeast. PLoS One, 4, e7456.
Ward, M.P., Gimeno, C.J., Fink, G.R. and Garrett, S. (1995) SOK2 may regulate cyclic AMP-dependent protein kinase-stimulated growth and pseudohyphal development by repressing transcription. Mol Cell Biol, 15, 6854-6863.
Washburn, B.K. and Esposito, R.E. (2001) Identification of the Sin3-binding site in Ume6 defines a two-step process for conversion of Ume6 from a transcriptional repressor to an activator in yeast. Mol Cell Biol, 21, 2057-2069.
Wedaman, K.P., Reinke, A., Anderson, S., Yates, J., 3rd, McCaffery, J.M. and Powers, T. (2003) Tor kinases are in distinct membrane-associated protein complexes in Saccharomyces cerevisiae. Mol Biol Cell, 14, 1204-1220.
Welihinda, A.A., Tirasophon, W., Green, S.R. and Kaufman, R.J. (1997) Gene induction in response to unfolded protein in the endoplasmic reticulum is mediated through Ire1p kinase interaction with a transcriptional coactivator complex containing Ada5p. Proc Natl Acad Sci U S A, 94, 4289-4294.
Welihinda, A.A., Tirasophon, W. and Kaufman, R.J. (2000) The transcriptional co-activator ADA5 is required for HAC1 mRNA processing in vivo. J Biol Chem, 275, 3377-3381.
Wellen, K.E. and Hotamisligil, G.S. (2005) Inflammation, stress, and diabetes. J Clin Invest, 115, 1111-1119.
Westfall, P.J. and Thorner, J. (2006) Analysis of mitogen-activated protein kinase signaling specificity in response to hyperosmotic stress: use of an analog-sensitive HOG1 allele. Eukaryot Cell, 5, 1215-1228.
Williams, R.M., Primig, M., Washburn, B.K., Winzeler, E.A., Bellis, M., Sarrauste de Menthiere, C., Davis, R.W. and Esposito, R.E. (2002) The Ume6 regulon coordinates metabolic and meiotic gene expression in yeast. Proc Natl Acad Sci U S A, 99, 13431-13436.
Winnay, J.N., Boucher, J., Mori, M.A., Ueki, K. and Kahn, C.R. (2010) A regulatory subunit of phosphoinositide 3-kinase increases the nuclear accumulation of X-box-binding protein-1 to modulate the unfolded protein response. Nat Med, 16, 438-445.

209
Wright, R.M., Repine, T. and Repine, J.E. (1993) Reversible pseudohyphal growth in haploid Saccharomyces cerevisiae is an aerobic process. Curr Genet, 23, 388-391.
Wu, C., Whiteway, M., Thomas, D.Y. and Leberer, E. (1995) Molecular characterization of Ste20p, a potential mitogen-activated protein or extracellular signal-regulated kinase kinase (MEK) kinase kinase from Saccharomyces cerevisiae. J Biol Chem, 270, 15984-15992.
Wu, J., Suka, N., Carlson, M. and Grunstein, M. (2001) TUP1 utilizes histone H3/H2B-specific HDA1 deacetylase to repress gene activity in yeast. Mol Cell, 7, 117-126.
Xella, B., Goding, C., Agricola, E., Di Mauro, E. and Caserta, M. (2006) The ISWI and CHD1 chromatin remodelling activities influence ADH2 expression and chromatin organization. Mol Microbiol, 59, 1531-1541.
Xiao, Y. and Mitchell, A.P. (2000) Shared roles of yeast glycogen synthase kinase 3 family members in nitrogen-responsive phosphorylation of meiotic regulator Ume6p. Mol Cell Biol, 20, 5447-5453.
Xie, Y. and Varshavsky, A. (1999) The E2-E3 interaction in the N-end rule pathway: the RING-H2 finger of E3 is required for the synthesis of multiubiquitin chain. Embo J, 18, 6832-6844.
Xue, Y., Batlle, M. and Hirsch, J.P. (1998) GPR1 encodes a putative G protein-coupled receptor that associates with the Gpa2p Galpha subunit and functions in a Ras-independent pathway. Embo J, 17, 1996-2007.
Yang, H.Y., Tatebayashi, K., Yamamoto, K. and Saito, H. (2009) Glycosylation defects activate filamentous growth Kss1 MAPK and inhibit osmoregulatory Hog1 MAPK. Embo J, 28, 1380-1391.
Yoneda, T., Imaizumi, K., Oono, K., Yui, D., Gomi, F., Katayama, T. and Tohyama, M. (2001) Activation of caspase-12, an endoplastic reticulum (ER) resident caspase, through tumor necrosis factor receptor-associated factor 2-dependent mechanism in response to the ER stress. J Biol Chem, 276, 13935-13940.
Yoshida, H., Matsui, T., Yamamoto, A., Okada, T. and Mori, K. (2001) XBP1 mRNA is induced by ATF6 and spliced by IRE1 in response to ER stress to produce a highly active transcription factor. Cell, 107, 881-891.
Yoshida, H., Okada, T., Haze, K., Yanagi, H., Yura, T., Negishi, M. and Mori, K. (2000) ATF6 activated by proteolysis binds in the presence of NF-Y (CBF) directly to the cis-acting element responsible for the mammalian unfolded protein response. Mol Cell Biol, 20, 6755-6767.
Yoshida, H., Oku, M., Suzuki, M. and Mori, K. (2006) pXBP1(U) encoded in XBP1 pre-mRNA negatively regulates unfolded protein response activator pXBP1(S) in mammalian ER stress response. J Cell Biol, 172, 565-575.

210
Yoshida, S., Ito, M., Callis, J., Nishida, I. and Watanabe, A. (2002) A delayed leaf senescence mutant is defective in arginyl-tRNA:protein arginyltransferase, a component of the N-end rule pathway in Arabidopsis. Plant J, 32, 129-137.
Yu, J., Angelin-Duclos, C., Greenwood, J., Liao, J. and Calame, K. (2000) Transcriptional repression by blimp-1 (PRDI-BF1) involves recruitment of histone deacetylase. Mol Cell Biol, 20, 2592-2603.
Yuan, Y.L. and Fields, S. (1991) Properties of the DNA-binding domain of the Saccharomyces cerevisiae STE12 protein. Mol Cell Biol, 11, 5910-5918.
Yun, C.W., Tamaki, H., Nakayama, R., Yamamoto, K. and Kumagai, H. (1997) G-protein coupled receptor from yeast Saccharomyces cerevisiae. Biochem Biophys Res Commun, 240, 287-292.
Yun, C.W., Tamaki, H., Nakayama, R., Yamamoto, K. and Kumagai, H. (1998) Gpr1p, a putative G-protein coupled receptor, regulates glucose-dependent cellular cAMP level in yeast Saccharomyces cerevisiae. Biochem Biophys Res Commun, 252, 29-33.
Zaman, S., Lippman, S.I., Schneper, L., Slonim, N. and Broach, J.R. (2009) Glucose regulates transcription in yeast through a network of signaling pathways. Mol Syst Biol, 5, 245.
Zaragoza, O. and Gancedo, J.M. (2000) Pseudohyphal growth is induced in Saccharomyces cerevisiae by a combination of stress and cAMP signalling. Antonie Van Leeuwenhoek, 78, 187-194.
Zenvirth, D., Loidl, J., Klein, S., Arbel, A., Shemesh, R. and Simchen, G. (1997) Switching yeast from meiosis to mitosis: double-strand break repair, recombination and synaptonemal complex. Genes Cells, 2, 487-498.
Zhang, K., Wong, H.N., Song, B., Miller, C.N., Scheuner, D. and Kaufman, R.J. (2005) The unfolded protein response sensor IRE1α is required at 2 distinct steps in B cell lymphopoiesis. J Clin Invest, 115, 268-281.
Zhang, Y., Sun, Z.W., Iratni, R., Erdjument-Bromage, H., Tempst, P., Hampsey, M. and Reinberg, D. (1998) SAP30, a novel protein conserved between human and yeast, is a component of a histone deacetylase complex. Mol Cell, 1, 1021-1031.
Zhang, Z., Smith, M.M. and Mymryk, J.S. (2001) Interaction of the E1A oncoprotein with Yak1p, a novel regulator of yeast pseudohyphal differentiation, and related mammalian kinases. Mol Biol Cell, 12, 699-710.
Zhu, G., Spellman, P.T., Volpe, T., Brown, P.O., Botstein, D., Davis, T.N. and Futcher, B. (2000) Two yeast forkhead genes regulate the cell cycle and pseudohyphal growth. Nature, 406, 90-94.
Zitomer, R.S. and Lowry, C.V. (1992) Regulation of gene expression by oxygen in Saccharomyces cerevisiae. Microbiol Rev, 56, 1-11.

211
Zurita-Martinez, S.A. and Cardenas, M.E. (2005) Tor and cyclic AMP-protein kinase A: two parallel pathways regulating expression of genes required for cell growth. Eukaryot Cell, 4, 63-71.

APPENDIX I

MOLECULAR AND CELLULAR BIOLOGY, Dec. 2010, p. 5514–5530 Vol. 30, No. 230270-7306/10/$12.00 doi:10.1128/MCB.00390-10Copyright © 2010, American Society for Microbiology. All Rights Reserved.
Ime1 and Ime2 Are Required for Pseudohyphal Growth ofSaccharomyces cerevisiae on Nonfermentable
Carbon Sources
Natalie Strudwick, Max Brown, Vipul M. Parmar, and Martin Schroder*Durham University, School of Biological and Biomedical Sciences, Durham DH1 3LE, United Kingdom
Received 6 April 2010/Returned for modification 24 May 2010/Accepted 16 September 2010
Pseudohyphal growth and meiosis are two differentiation responses to nitrogen starvation of diploid Sac-charomyces cerevisiae. Nitrogen starvation in the presence of fermentable carbon sources is thought to inducepseudohyphal growth, whereas nitrogen and sugar starvation induces meiosis. In contrast to the geneticbackground routinely used to study pseudohyphal growth (1278b), nonfermentable carbon sources stimulatepseudohyphal growth in the efficiently sporulating strain SK1. Pseudohyphal SK1 cells can exit pseudohyphalgrowth to complete meiosis. Two stimulators of meiosis, Ime1 and Ime2, are required for pseudohyphal growthof SK1 cells in the presence of nonfermentable carbon sources. Epistasis analysis suggests that Ime1 and Ime2act in the same order in pseudohyphal growth as in meiosis. The different behaviors of strains SK1 and 1278bare in part attributable to differences in cyclic AMP (cAMP) signaling. In contrast to 1278b cells, hyperac-tivation of cAMP signaling using constitutively active Ras2G19V inhibited pseudohyphal growth in SK1 cells.Our data identify the SK1 genetic background as an alternative genetic background for the study of pseudohy-phal growth and suggest an overlap between signaling pathways controlling pseudohyphal growth and meiosis.Based on these findings, we propose to include exit from pseudohyphal growth and entry into meiosis in thelife cycle of S. cerevisiae.
Diploid cells of the budding yeast Saccharomyces cerevisiaechoose between two developmental responses to nitrogen star-vation, namely, pseudohyphal growth and meiosis (30).Pseudohyphal growth allows sessile S. cerevisiae cells to foragefor nutrients and is a growth form distinct from the vegetative,yeast-like growth form. Pseudohyphal growth is induced bynitrogen starvation in the presence of fermentable carbonsources (30). Pseudohyphal growth is characterized by an elon-gated cell shape, adhesion of cells to each other after celldivision has been completed, a switch from a bipolar to aunipolar budding pattern, and prolongation of the G2 phase ofthe cell cycle to allow daughter cells to grow to the size of theirmothers (45). This increased cell size allows newly bornpseudohyphal daughters to immediately enter the cell cycleand to bud in synchrony with their mothers. Starvation fornitrogen and fermentable carbon sources is a prerequisite forinduction of meiosis. In meiosis (also called sporulation), sin-gle diploid cells form an ascus containing four haploid, stress-and starvation-resistant spores. Meiosis is temporally dividedinto at least early, middle, and late phases of gene expression(16, 74). After premeiotic DNA replication, cells go throughtwo meiotic divisions (meiosis I and II), initiation of prosporewall growth at sites near the spindle pole bodies (SPBs), nu-clear division, and maturation of the spore walls to form ma-ture asci (47).
The protein kinase A (PKA) pathway and the mating andfilamentation mitogen-activated protein kinase (MAPK) path-
way control pseudohyphal growth. Both pathways stimulatepseudohyphal growth by stimulating expression of the cell sur-face flocculin Flo11 (51). The PKA pathway is activated by theglucose sensor Gpr1 (55, 102) and by the high-affinity ammo-nium permease Mep2 (7, 53, 83). Gpa2 activates adenylatecyclase, which in turn activates PKA (46, 54). In S. cerevisiae,three catalytic subunits of PKA, Tpk1, Tpk2, and Tpk3, regu-late pseudohyphal growth. Tpk2 directly interacts with andinhibits the transcriptional repressor of FLO11, Sfl1 (77).Phosphorylation of the transcription factor Flo8 by Tpk2 stim-ulates binding of Flo8 to the FLO11 promoter and activationof FLO11 (71, 72). In contrast to TPK2, deletion of TPK1 orTPK3 enhances pseudohyphal growth (71, 77), suggesting thatTpk1 and Tpk3 are inhibitors of pseudohyphal growth. Sub-strates for Tpk1 or Tpk3 involved in repression of pseudohy-phal growth have not been identified. The mating and filamen-tation MAPK cascade (56), consisting of the MAPK kinasekinase Ste11, the MAPK kinase Ste7, the MAPK Kss1, and thescaffold Ste5, is regulated by the cell surface mucin Msb2 (20).Msb2 recruits general signaling proteins, such as Sho1, theisoprenylated, plasma membrane-tethered protein Cdc42, andits p21-activated kinase, Ste20, to the filamentation MAPKcascade (20). The MAPK pathway controls the activity of theheterodimeric transcription factor Ste12-Tec1 (29, 82), whichactivates expression of FLO11 and regulates cell elongation.
Entry into meiosis is governed by a transcriptional cascadecontrolling expression of early meiotic genes (EMGs) (47).Starvation induces expression of IME1 (85). Ime1 carries atranscriptional activation domain (98), which activates tran-scription of EMGs (99), including IME2, after binding of Ime1to the DNA-binding protein Ume6 (11, 79). A two-hybridinteraction between Ume6 and Ime1 is stimulated by severalprotein kinases, including the glycogen synthase kinase 3 ho-
* Corresponding author. Mailing address: Durham University,School of Biological and Biomedical Sciences, Durham DH1 3LE,United Kingdom. Phone: 44 (0) 191-334-1316. Fax: 44 (0) 191-334-9104. E-mail: [email protected].
Published ahead of print on 27 September 2010.
5514

mologs Rim11, Mck1, and Mrk1 and the protein kinase Rim15(57, 58, 106, 110). Binding of Ime1 to Ume6 induces degrada-tion of Ume6 (59). The protein kinase Ime2 is required for fullexpression of EMGs (99), stimulates its own expressionthrough an upstream activating site (96), and promotes meioticDNA replication by directly phosphorylating Rfa2 (17, 18).Sic1 phosphorylation by Ime2 triggers its proteasomal destruc-tion and entry into meiotic S phase (21, 89). IME2 is alsorequired for expression of middle meiotic genes (4, 64, 69) andfor reestablishment of repression of EMGs in the middle mei-otic phase (47). Nutrient-rich conditions repress transcriptionof IME1. The PKA pathway represses expression of IME1 inthe presence of glucose (60, 62) and inhibits phosphorylationof Ime1 by Rim11 (80). Cells expressing constitutively activeRas2G19V, Gpa2R273A, or Gpa2G132V (22, 105, 111) or deletedfor the regulatory subunit of PKA, BCY1, do not sporulate(12).
Using an efficiently sporulating strain, SK1 (42), we reportthat elements of the early meiotic cascade, such as Ime1, bind-ing of Ime1 to Ume6, and Ime2, are required for pseudohyphalgrowth of SK1 cells. In contrast to the genetic backgroundroutinely used to study pseudohyphal growth, i.e., strain1278b (30), nonfermentable carbon sources stimulatepseudohyphal growth of SK1 cells independent of their utili-zation in respiration. Pseudohyphal SK1 cells can completemeiosis. Differences in cyclic AMP (cAMP) signaling may ex-plain, in part, the different behaviors of these two strains.Whereas constitutively active Ras2G19V stimulates pseudohy-phal growth of 1278b cells, it inhibits pseudohyphal growth ofSK1 cells. Our work establishes the SK1 genetic background asa tool for the study of mechanisms controlling the life choicedecision between pseudohyphal growth and sporulation of di-morphic yeasts and filamentous fungi.
MATERIALS AND METHODS
Plasmid constructions. To obtain plasmid pRS316-T99N-UME6-lexA, the4.4-kbp SpeI/HindIII fragment of pKB193 (11) was cloned into SpeI- andHindIII-digested pRS316 (97). To cure the T99N mutation in UME6, the 263-bpBamHI/NheI fragment of pRS316-T99N-UME6-lexA was replaced with a similarfragment from pCITE-4a()-HA-UME6 (M. Schroder and R. J. Kaufman, un-published data) encoding wild-type (WT) Ume6. pMW2 (108) (CEN URA3RAS2G19V) was used to express constitutively active Ras2. The plasmids used forthis study are listed in Table 1.
Yeast methods. Yeast strains (Table 2) were transformed by the LiOAcmethod (15). IME1 and IME2 were deleted by PCR-based gene deletion (32,107), using the oligodeoxynucleotides listed in Table 3. Mating type was deter-mined by PCR (38). Respiration-deficient 0 cells were generated by treatment
with 20 g/ml ethidium bromide as described previously (24). Growth was mon-itored as described before (91). Pseudohyphal growth was assayed on syntheticlow-ammonium (SLA) medium (91) plates containing a 2% (wt/vol) concentra-tion of the indicated carbon source and, as required, amino acids or uracil tocomplement auxotrophies, at 5 to 10 mg/liter for SK1 cells. Ethanol was used insealed containers containing a 2% (wt/vol) ethanol reservoir. WT and mutantstrains were matched for auxotrophic mutations. In experiments in which mutantstrains carried WT metabolic genes, the corresponding amino acids or uracil wasadded at the same concentration to plates for both the WT and mutant strains.Uracil was provided at 5 mg/liter in SLA plates for 1278b cells (30, 54, 55). Cellswere streaked onto SLA plates to obtain single colonies. Pseudohyphal growthand agar invasion were scored after growth at 30°C for the times indicated in thefigure legends. Pilot experiments revealed no difference in pseudohyphal growthon plates supplemented with 2.5 to 10 mg/liter of the amino acids or uracilrequired to complement auxotrophies. L-Lysine was included in all plates be-cause the ho::LYS2 allele produces a weak Lys phenotype. cAMP (Calbiochem,Merck, Darmstadt, Germany) was used at 5 mM. To document the filamentationphenotype, pictures from at least four representative colonies were taken underbright-field illumination at a magnification of 40 to 100 with an invertedmicroscope (Inverso; Fisher Scientific), an eyepiece camera (Globecam D;Fisher Scientific), and imaging software (Image Driving software; Fisher Scien-tific). Pictures from asci were taken at a magnification of 400. Time-lapse videomicroscopy was performed on the same microscope, using AMCap software.Plates were incubated at room temperature for time-lapse video microscopy.Wet tissues were placed into plates, and plates were sealed with Parafilm tominimize evaporation. Agar invasion was determined after washing away cellsabove the agar by gently scraping plates with a spreader under running distilledwater for 1 min. The remaining cells were photographed at a magnification of40 to 100. Haploid invasive growth was assayed after growth for 3 days at30°C on yeast extract-peptone-dextrose (YPD) plates. Plates were photographedbefore and after washing the cells from the agar surface to document total andinvasive growth, respectively. Activity of the FG(TyA)::lacZ reporter was mea-sured and standardized to total cellular protein activity as described before (66,91). Cell length and width were measured using the straight tool in ImageJ. Budand birth scars were stained as described before (25, 75). Briefly, cells weregrown for 18 h on SLA acetate plates and washed off plates. A total of 1 104
cells were resuspended in 25 l of 1-mg/ml calcofluor white M2R (dissolved inwater) and 50 l of 1-mg/ml fluorescein isothiocyanate-wheat germ agglutinin(FITC-WGA) dissolved in phosphate-buffered saline (PBS; 4.3 mM Na2HPO4,1.47 mM KH2PO4, 2.7 mM KCl, and 137 mM NaCl [pH 7.2]), incubated for 15min at room temperature, and washed three times with PBS. Cells were visual-ized using a Nikon Eclipse TE 300 microscope and a 60 A/1.4 oil objective.Calcofluor white-stained bud scars were observed using a DAPI (4,6-diamidino-2-phenylindole) filter, and FITC-WGA-stained birth and bud scars were ob-served using an FITC filter.
Measurement of sporulation. To determine sporulation, a fresh stationary-phase culture grown in rich medium (YPD; 2% [wt/vol] glucose, 2% [wt/vol]peptone, 1% [wt/vol] yeast extract) was used to inoculate rich acetate medium(YPAc; 2% [wt/vol] KOAc, 1% [wt/vol] yeast extract, 2% [wt/vol] peptone).These cells were grown to mid-log phase in baffled flasks, collected by centrifu-gation at 3,000 g for 2 min, washed once with water, resuspended in completesporulation medium (C-SPO) (106), and grown at 30°C with shaking for therequired amount of time. Cells were visualized under a phase-contrast micro-scope, and the percentage of asci was determined for 3 replicates.
Tetrad dissection. Asci were washed off plates from areas containing smallcolonies consisting predominantly of asci formed by pseudohyphal cells by use ofsterile water collected by centrifugation, and the cell wall was digested withGlusulase for 15 min at 30°C. Spores were dissected using a tetrad dissectionmicroscope (Singer Instruments, Watchet, United Kingdom), placed onto a YPDplate, and allowed to germinate and grow for 2 days at 30°C. Pictures were takenwith a GelDoc 2000 system (Bio-Rad Laboratories, Hemel Hempstead, UnitedKingdom).
Heat shock treatment. Cells were grown to mid-log phase in liquid YPDmedium at 25°C (for glycogen and trehalose determinations) or 30°C (for North-ern analysis) with shaking before being shifted to 37°C (for glycogen and treha-lose determinations) or 39°C (for Northern analysis) for the indicated times.Samples were taken immediately and processed as described below.
Metabolite determinations. Glycogen and trehalose concentrations were de-termined as described by Parrou et al. (73). Briefly, cells were collected bycentrifugation and washed once with ice-cold water, and the pellet was frozenimmediately at 20°C. Cell pellets were resuspended in 250 l 0.25 M Na2CO3
and heated at 95°C for 2 h with occasional mixing. The pH was adjusted to 5.2by addition of 150 l 1 M acetic acid and 600 l 0.2 M sodium acetate buffer, pH
TABLE 1. Plasmids used for this study
Plasmid Features Reference
pCITE-4a()-HA-UME6
UME6-His6 bla Schroder and Kaufman,unpublished data
pHS103 2m URA3 IME1 bla 99pHS105 2m URA3 IME2 bla 99pIL30 FG(TyA)lacZ::URA3 66pKB193 2m URA3 T99N-UME6-
lexA bla11
pMW2 CEN URA3 RAS2G19V bla 108pRS316 CEN6 ARSH4 URA3 bla 97pRS316-UME6-lexA CEN6 ARSH4 URA3
UME6-lexA blaThis study
pRS316-T99N-UME6-lexA
CEN6 ARSH4 URA3T99N-UME6-lexA bla
This study
VOL. 30, 2010 IME1 IS REQUIRED FOR PSEUDOHYPHAL GROWTH 5515

5.2. The suspension was split into two equal parts. The first of these was incu-bated overnight at 57°C with continuous shaking in the presence of 100 g-amyloglucosidase from Aspergillus niger (Sigma, St. Louis, MO), freshly pre-pared as a 10-mg/ml stock dissolved in 0.2 M sodium acetate buffer, pH 5.2. Thesecond half of the suspension was incubated overnight at 37°C with 3 mUtrehalase (0.25 U/ml; Sigma). Liberated glucose was measured using a GOglucose assay kit (Sigma) as directed. To measure the glucose concentration inplates, small sections of the most densely grown areas were cut out with a scalpeland placed into a syringe attached to a 0.22-m filter. Liquid was expelled byapplying pressure to the plunger. The glucose concentration was measured usinga glucose meter (Roche Diagnostics).
cAMP assay. cAMP concentrations were measured essentially as describedbefore (23, 67, 84, 90). In brief, cells grown to mid-log phase on acetate werecollected by centrifugation and washed with ice-cold water. The cell pellet wasresuspended in 6% ice-cold trichloroacetic acid. Acid-washed glass beads (di-ameter 0.4 to 0.6 mm) were added before the suspension was snap-frozen in
liquid nitrogen and thawed on ice. Cells were then lysed using a Precellys 24homogenizer (Bertin Technologies, Montigny-le-Bretonneux, France) at 6,000rpm twice for 30 s each, with a 1-min break between, at 4°C. Following removalof cell debris by centrifugation (2,000 g for 15 min, 4°C), HCl was added to thesupernatant to a final concentration of 10 mM. The sample was extracted fourtimes with diethyl ether and subsequently dried in a speed vacuum. The lyoph-ilized cAMP was resuspended in assay buffer from the cAMP Biotrak enzymeimmunoassay (EIA) system (GE Healthcare, Little Chalfont, United Kingdom),and the cAMP concentration was measured by use of this kit as directed. Sam-ples were standardized against the cell number.
Northern analysis. RNA analysis by Northern blotting was performed asdescribed previously (92). Probes for HSP12, HSP26, HSP82, and FLO11(MUC1) were generated by PCR, using genomic DNA as the template. Theprobes for HOP1, IME1, IME2, INO1, SPO13, and the loading control pC4/2have been described elsewhere (48, 92). All mRNAs were quantitated by phos-phorimaging on a Typhoon 9400 system (GE Healthcare).
TABLE 2. Yeast strains used for this studya
Strain and genetic background Genotype Reference
SK1 genetic backgroundAMP 109 a/ 10AMP 115 a/ ime1-12::TRP1/ime1-12::TRP1 10AMP 1618 IME2-20-lacZ::LEU2 rme15::LEU2 met4 106AMP 1619 a IME2-20-lacZ::LEU2 rme15::LEU2 arg6 91KSY 162 a/ ime2-K97R-myc::TRP1/ime2-K97R-myc::TRP1 trp1FA::hisG/trp1FA::hisG his3-11,15/
his3-11,15 ho::hisG/ho::hisG65
KSY 187 a/ IME2-myc::TRP1/IME2-myc::TRP1 trp1FA::hisG/trp1FA::hisG his3-11,15/his3-11,15ho::hisG/ho::hisG
65
MSY 133-29 a his3SK rme15::LEU2 This studyMSY 133-34 a his3SK rme15::LEU2 This studyMSY 135-12 a met4 rme15::LEU2 This studyMSY 135-43 a met4 rme15::LEU2 This studyMSY 136-40 arg6 rme15::LEU2 92MSY 138-17 his3SK rme15::LEU2 92MSY 184-55 a arg6 rme15::LEU2 ume6-5::LEU2 This studyMSY 185-65 his3SK rme15::LEU2 ume6-5::LEU2 This studyMSY 186-68 arg6 rme15::LEU2 ume6-5::LEU2 92MSY 188-119 a his3SK rme15::LEU2 ume6-5::LEU2 This studyMSY 202-14 arg6 rme15::LEU2 ime2-2::LEU2 This studyMSY 203-22 a met4 rme15::LEU2 ime2-2::LEU2 This studyMSY 203-27 a met4 rme15::LEU2 ime2-2::LEU2 This studyMSY 203-33 a met4 rme15::LEU2 ime2-2::LEU2 This studyMSY 206-36 his3SK rme15::LEU2 ime2-2::LEU2 This studyMSY 552-17 his3SK rme15::LEU2 ime1::hphMX4 This studyMSY 558-38 his3SK rme15::LEU2 This studyS497 a/ his3-11,15/his3-11,15 trp1FA/trp1FA ho::hisG/ho::hisG 88S635 a/ IME2C241-HA6-kanMX/IME2C241-HA6-kanMX his3-11,15/his3-11,15 trp1FA/
trp1FA ho::hisG/ho::hisG88
1278b genetic backgroundMLY 61 a/ a/ ura3-52/ura3-52 54MLY 187 a/ a/ ura3-52/ura3-52 ras2::G418/ras2::G418 55MLY 232 a/ a/ ura3-52/ura3-52 gpr1::G418/gpr1::G418 55MSY 699-01 a/ a/ ura3-52/ura3-52 ime1::kanMX2/ime1::hphMX4 This studyMSY 694-51 a/ a/ ura3-52/ura3-52 ime2::kanMX2/ime2::hphMX4 This study
a All haploid SK1 strains have the additional alleles ura3, leu2::hisG, trp1::hisG, and lys-2 ho::LYS2, and all diploid SK1 strains are homozygous for these alleles, ifnot noted otherwise. The alleles arg6 (68), his3-11,15 (Saccharomyces Genome Database), his3SK (68), ho::hisG (2), ho::LYS2 (2), ime1-12::TRP1 (99), ime2-2::LEU2(64), ime2::kanMX (88), IME2-20-lacZ::LEU2 (106), IME2-myc::TRP1 (4), ime2-K97R-myc::TRP1 (4), IME2C241-HA6-kanMX (88), leu2::hisG (2), lys2 (2), met4 (68),rme15::LEU2 (19), trp1::hisG (2), trp1FA::hisG (37), ume6-5::LEU2 (101), ura3 (2), and ura3-52 (78) have been described before.
TABLE 3. Oligodeoxynucleotides used for this study
Oligonucleotide Sequence
ime1, 5 .........................GCTTTTCTATTCCTCTCCCCACAAACAAAATGCAAGCGGATATGCATGGACAGCTGAAGCTTCGTACGCime1, 3 .........................TGAATGGATATATTTTGAGGGAAGGGGGAAGATTGTAGTACTTTTCGAGAAGGCCACTAGTGGATCTGime2, 5 .........................CGGTTAAGGTGGCTGTCTAGAGAATATAAACCTGTATTTATTTACCAGGCAGGCCACTAGTGGATCTGime2, 3 .........................CTGAGCCGGGTAACCGAACACAAAGATCTCGTTCTACTTTTTTTGACCTCAAGCTTCGTACGCTGCAGG
5516 STRUDWICK ET AL. MOL. CELL. BIOL.

RESULTS
Nonfermentable carbon sources stimulate pseudohyphalgrowth. We previously reported that a/ diploid cells defectivein a nutrient-regulated signaling pathway respond inappropri-ately to a meiotic stimulus by initiating pseudohyphal growth(91). These observations prompted us to investigate whetherdiploid a/ WT cells with the SK1 genetic background inducepseudohyphal growth when exposed to starvation conditionsknown to induce meiosis. To test this hypothesis, we grewdiploid a/ SK1 cells on plates containing nonfermentablecarbon sources and a limiting ammonium sulfate concentration(50 M). In these plate assays, pseudohyphal growth is char-acterized by multiple projections of cells radiating away fromthe colony center (30). Diploid WT SK1 cells formed fewpseudohyphae and were modestly capable of invading the agarwhen grown on glucose (Fig. 1A and B). Nonfermentable car-bon sources, such as acetate, glycerol, pyruvate, and L-lactate,stimulated formation of branched pseudohyphae and agar in-vasion (Fig. 1A and B). Pseudohypha formation and agar in-vasion were also enhanced on plates containing both glucoseand a nonfermentable carbon source (Fig. 1A and B). Thisstimulation could be observed as early as 1 day after inocula-tion of the plates (not shown). Furthermore, 1.6% (wt/vol)glucose remained even in the most densely grown areas ofplates after 10 days of growth, suggesting that nonfermentablecarbon sources stimulate pseudohyphal growth in the presenceof glucose. Based on their appearance, pseudohyphae formedon nonfermentable carbon sources appear to share many mor-phological features with previously described pseudohyphae(30), such as cell adhesion after completion of cytokinesis, agarinvasion, and directional growth (Fig. 1).
Glucose strongly inhibits utilization of alternative carbonsources by inhibiting expression of several enzymes of the citricacid cycle and the respiratory chain (93). However, limitingnitrogen concentrations under pseudohyphal growth condi-tions may derepress these genes. For example, rapamycintreatment, which mimics nitrogen starvation, induces glucose-repressible genes in glucose-grown cultures (35). To establishwhether respiratory metabolism of nonfermentable carbonsources is required for stimulation of pseudohyphal growth bythese carbon sources, we produced respiration-deficient petitecells. We confirmed the loss of respiratory function by theinability of petite cells to grow on plates containing only ace-tate as a carbon source. Acetate and pyruvate stimulatedpseudohyphal growth in petite cells in the presence of glucose(Fig. 1D). In contrast, glycerol, ethanol, and L-lactate did notstimulate pseudohyphal growth of petite cells. These threecarbon sources require NAD-dependent oxidation reactionsin order to be metabolized (93), indicating that less efficientregeneration of NAD from NADH may interfere with stim-ulation of pseudohyphal growth by these carbon sources inpetite cells. Taken together, these data indicate that nonfer-mentable carbon sources stimulate pseudohyphal growth inde-pendent of their use as respiratory energy sources. These re-sults also suggest that the less pronounced pseudohyphalgrowth seen on glucose as a sole carbon source (Fig. 1A) maybe caused by the accumulation of glycolytic waste products,especially ethanol, during fermentative growth. In support of
this hypothesis, we found that ethanol stimulates pseudohyphalgrowth and agar invasion (Fig. 1E) (52).
Microscopic examination of pseudohyphae on plates con-taining only nonfermentable carbon sources at a higher mag-nification revealed that pseudohyphal cells exited pseudohy-phal growth and formed asci (Fig. 1C). Cells both above andbelow the agar surface sporulated as early as 3 days afterinoculation of plates (not shown). All pseudohyphae of allcolonies sporulated. All spores isolated from asci formed bypseudohyphal cells on acetate were viable (Fig. 1F). The mat-ing type locus displayed a 2:2 segregation pattern (Fig. 1G),indicating normal execution of both meiotic divisions. No asciwere observed in the presence of glucose. Asci sometimesdisplayed a linear arrangement of two to four spores, especiallyin cells grown on glycerol (Fig. 1C). All spores from linear asciwere viable and displayed a 2:2 segregation pattern for themating type locus (not shown). Taken together, these datashow that nonfermentable carbon sources stimulate pseudohy-phal growth and that pseudohyphal cells can enter and suc-cessfully complete meiosis.
Ime1 and the protein kinase activity of Ime2 are requiredfor pseudohyphal growth on nonfermentable carbon sources.Sporulation of pseudohyphae precluded investigation of cellu-lar characteristics of pseudohyphal cells, such as cell elonga-tion. Both Ime1 and Ime2 control entry into meiosis. Sporu-lation of ime1/ime1 and ime2/ime2 cells is decreasedseveral hundredfold compared to that of WT strains (43, 99).Functions for IME1 or IME2 outside meiosis have not beenreported. Hence, we characterized pseudohypha formationand agar invasion of ime1/ime1 and ime2/ime2 strains.Surprisingly, pseudohypha formation was nearly completelyabsent in ime1/ime1 cells (Fig. 2A). Deletion of IME1 se-verely decreased the pseudohyphal morphology of nearly allcolonies on a plate, independent of the position of the colonyon the plate (Fig. 2A). However, ime1/ime1 cells were ableto invade the agar (Fig. 2C), showing that filamentation andagar invasion are genetically separable phenotypes. Similarly,filamentation, but not agar invasion, was defective in ime2/ime2 cells grown on glucose, a mixture of glucose and acetate,or acetate, but not glycerol (Fig. 2B and D). Deletion of IME2decreased the pseudohyphal morphology of nearly all colonieson plates containing glucose, glucose plus acetate, or acetate asthe carbon source (data not shown). However, the pseudohy-phal growth defect of ime2/ime2 cells was not as severe asthe pseudohyphal growth defect of ime1/ime1 cells (Fig. 2Aand B). The roles of IME1 and IME2 in pseudohyphal growthwere independent of the ability of yeast to respire (not shown).Overexpression of Ime1 and Ime2 from multicopy (2m) plas-mids enhanced pseudohyphal growth (Fig. 3A) and had noeffect on agar invasion (Fig. 3D). This finding is consistent withdecreased pseudohypha formation of ime1/ime1 and ime2/ime2 strains (Fig. 2). Cells carrying the protein kinase-defec-tive K97R-ime2 allele displayed a defect in pseudohypha for-mation similar to that with the IME2 deletion (Fig. 2E and F),showing that the protein kinase activity of Ime2 is required forpseudohyphal growth and meiosis. Deletion of the C terminusof Ime2 (Ime2C241), which controls the mitotic stability ofIme2 (88), did not affect pseudohyphal growth (not shown).Taken together, these data show that Ime1 and Ime2 are re-quired for pseudohypha formation by SK1 cells.
VOL. 30, 2010 IME1 IS REQUIRED FOR PSEUDOHYPHAL GROWTH 5517

FIG. 1. Nonfermentable carbon sources stimulate pseudohyphal growth in WT a/ diploid SK1 strains (AMP 1618 AMP 1619 transformedwith pRS316). Identical results were obtained with another diploid WT strain (AMP 109) (cf. Fig. 1 and 2). Colony morphology (A), agar invasion(B), and ascus formation (C) are shown after growth for 7 days. (D) Stimulation of pseudohyphal growth in respiration-deficient petite cells. Thecolony morphology after 7 days of growth is shown. (E) Stimulation of pseudohyphal growth by ethanol. (F) Asci formed by pseudohyphal cellscontain four viable spores. Asci formed by a WT strain (AMP109) on SLA medium supplemented with 2% KOAc were dissected with a tetraddissection microscope, and spores were placed onto a YPD plate and allowed to germinate and grow for 2 days. (G) PCR genotyping of the matingtype locus reveals a 2:2 segregation pattern for MATa and MAT.
5518

FIG. 2. Ime1 and the protein kinase activity of Ime2 are required for pseudohyphal growth. The colony morphology of WT (AMP 109) andime1/ime1 (AMP 115) strains (A) and of WT (MSY 135-43 MSY 136-40) and ime2/ime2 (MSY 202-14 MSY 203-27) strains (B) isshown. Bar graphs show percentages of pseudohyphal colonies. For each strain and carbon source, 200 colonies were classified as pseudohyphalor nonpseudohyphal. Error bars represent standard errors. (C and D) Agar invasion by WT (AMP 109) and ime1/ime1 (AMP 115) strains(C) and by WT (MSY 135-12 MSY 138-17) and ime2/ime2 (MSY 203-22 MSY 206-36) strains (D). Filamentation (E) and agar invasion(F) of WT (KSY 187) and K97R-ime2/K97R-ime2 (KSY 162) strains were scored after 7 days of growth.
5519

Ime1 acts through Ime2 to stimulate pseudohyphal growth.In meiosis, Ime1 activates transcription of EMGs, includingIME2. Ime2 stimulates expression of EMGs, including its ownexpression, independent of IME1 (64, 96). Ime2 is also a neg-ative regulator of IME1 expression (81, 95, 96, 99) and Ime1stability (34). To establish whether IME1 and IME2 act in thesame order in pseudohyphal growth and meiosis, we investi-gated whether overexpression of Ime1 or Ime2 from 2mplasmids would rescue the pseudohyphal growth defects ofime1/ime1 and ime2/ime2 strains. Expression of Ime1 inime1/ime1 cells and of Ime2 in ime2/ime2 cells restoredpseudohyphal growth on nonfermentable carbon sources (Fig.3B and C). Expression of Ime2 in ime1/ime1 strains partiallyrestored pseudohypha formation (Fig. 3B), whereas expressionof Ime1 in ime2/ime2 strains had no effect on acetate (Fig.3C), suggesting that activation of IME2 by Ime1 is required forpseudohyphal growth on acetate. The partial restoration ofpseudohyphal growth by overexpression of Ime2 in ime1/ime1 cells is consistent with an Ime2-independent function ofIme1 in pseudohyphal growth. The more severe pseudohyphalgrowth defects of ime1/ime1 cells than those of ime2/ime2 cells (Fig. 2) also suggest an Ime2-independent role forIme1 in pseudohyphal growth. Agar invasion was not alteredby overexpression of Ime1 or Ime2 in the WT, ime1/ime1, orime2/ime2 strain (Fig. 3D and not shown), providing addi-
tional evidence that Ime1 and Ime2 are not involved in regu-lation of agar invasion.
Evidence that binding of Ime1 to Ume6 is involved inpseudohyphal growth on nonfermentable carbon sources.Ime1 activates transcription of EMGs, including IME2,through the DNA-binding protein Ume6 (11, 59, 79). Ume6also recruits two transcriptional repression complexes to EMGpromoters, namely, the ISW2 chromatin remodeling complex(31) and the Rpd3-Sin3 histone deacetylase (HDAC) (41).Deletion of UME6 derepresses EMG transcription, includingthat of IME2, under nutrient-rich conditions (92, 101, 109) butalso abrogates activation of these genes during starvation. AT99N mutation in Ume6 interferes with activation of EMGs byIme1. This mutation decreased the interaction between Ime1and Ume6 35-fold in a two-hybrid assay (110). The T99Nmutation interferes with association of Ime1 with EMG pro-moters (11, 39, 79, 92) and with degradation and removal ofUme6 from EMG promoters by Ime1 (59). These data sug-gested that Ume6 also has a role in pseudohyphal growth.Deletion of UME6 derepressed filamentation (Fig. 4A). Agarinvasion by ume6/ume6 cells was enhanced compared toWT cells (Fig. 4A). This function of Ume6 in agar invasion islikely to be independent of IME1 and IME2, because deletionor overexpression of these two genes had no effect on agarinvasion (Fig. 2 and 3). Expression of WT Ume6 and T99N-
FIG. 3. IME1 acts through IME2 to stimulate pseudohyphal growth. Colony morphology is shown for WT (MSY 135-12 MSY 138-17) (A),ime1/ime1 (AMP 115) (B), and ime2/ime2 (MSY 203-22 MSY 206-36) (C) strains transformed with empty vector (pRS426) or 2mplasmids expressing IME1 (pHS103) or IME2 (pHS105) from their endogenous promoters. Similar results were obtained with an rme1/rme1strain (MSY 135-12 MSY 138-17) and an RME1/RME1 strain (AMP 109). For simplicity, only MSY 135-12 MSY 138-17 is shown in panelA. (D) Agar invasion of the strains in panel A. Filamentation and agar invasion were scored after 7 days of growth.
5520 STRUDWICK ET AL. MOL. CELL. BIOL.

Ume6 complemented the enhanced agar invasion of ume6/ume6 strains (Fig. 4B). T99N-Ume6 inhibited filamentationmore severely than WT Ume6 did (Fig. 4B). This behavior ofthe T99N-Ume6 mutant is consistent with repression of IME2by the two transcriptional repression complexes recruited tothe IME2 promoter by Ume6 and, at the same time, withabrogation of the Ime1-Ume6 interaction by this mutation.These data indicate that the early meiotic cascade consisting ofIme1, recruitment of Ime1 to URS1 by Ume6, and Ime2 isrequired for both pseudohyphal growth and meiosis but not foragar invasion.
Ime1 is required for cell elongation, bud site selection, andbudding of daughter cells before their mother cells. Next, wecharacterized cellular features that distinguish yeast-form andpseudohyphal cells to obtain more detailed insight into theroles of Ime1 and Ime2 in pseudohyphal growth. In contrast toyeast-form cells, pseudohyphal cells invade agar because theyoverexpress Flo11 (51). Compared to yeast-form cells,pseudohyphal cells are elongated, adhere to each other aftercell division has been completed, and switch from a bipolar toa unipolar budding pattern. Yeast-form daughters are bornsmaller than their mothers. Pseudohyphal daughters are bornwith a size comparable to the size of their mothers, allowing
them to bud at the same time as, or even slightly before, theirmothers (45).
Deletion of IME1 or IME2 did not affect agar invasion ofdiploid cells (Fig. 2), indicating that Ime1 and Ime2 act inde-pendent of Flo11. Flo11 is also required for haploid invasivegrowth (33). Deletion of IME1 and IME2 did not decreasehaploid invasive growth (Fig. 5A). Northern blotting confirmedthat FLO11 expression was largely unperturbed in ime1/ime1 cells (Fig. 5B). Consistent with these observations, wefound that deletion of IME1 or IME2 did not significantlydecrease expression of an FG(TyA)::lacZ reporter (not shown)whose activation correlates well with the activity of the fila-mentation MAPK cascade in pseudohyphal cells (66).
Microscopic examination of microcolonies revealed thatime1/ime1 cells were not as elongated as WT cells whengrown on SLA plates with glucose or acetate as the carbonsource (Fig. 5C). Acetate enhanced cell elongation in bothstrains. ime2/ime2 and K97R-ime2/K97R-ime2 cells (Fig. 5Dand data not shown) were also not as elongated as their cor-responding WT cells. The elongation defects of the ime2/ime2 and K97R-ime2/K97R-ime2 strains were less severe thanthe elongation defect of the ime1/ime1 strain. These elon-gation phenotypes are consistent with the less severe
FIG. 4. Recruitment of Ime1 to early meiotic gene promoters, including the IME2 promoter, by Ume6 is required for pseudohyphal growth.(A) Pseudohyphal growth is derepressed in a ume6/ume6 (MSY 184-55 MSY 185-65) strain compared to that in a WT strain (MSY133-34 MSY 136-40). (B) Abrogation of the interaction between Ume6 and Ime1 in cells expressing the T99N-UME6 allele as the sole sourceof Ume6 results in a pseudohyphal growth defect. Filamentation and agar invasion phenotypes of ume6/ume6 (MSY 186-68 MSY 188-119)strains carrying empty vector (pRS316) or plasmids expressing WT Ume6 (pRS316-UME6-lexA) or T99N-Ume6 (pRS316-T99N-UME6-lexA) areshown. Filamentation and agar invasion were scored after 7 days of growth.
VOL. 30, 2010 IME1 IS REQUIRED FOR PSEUDOHYPHAL GROWTH 5521
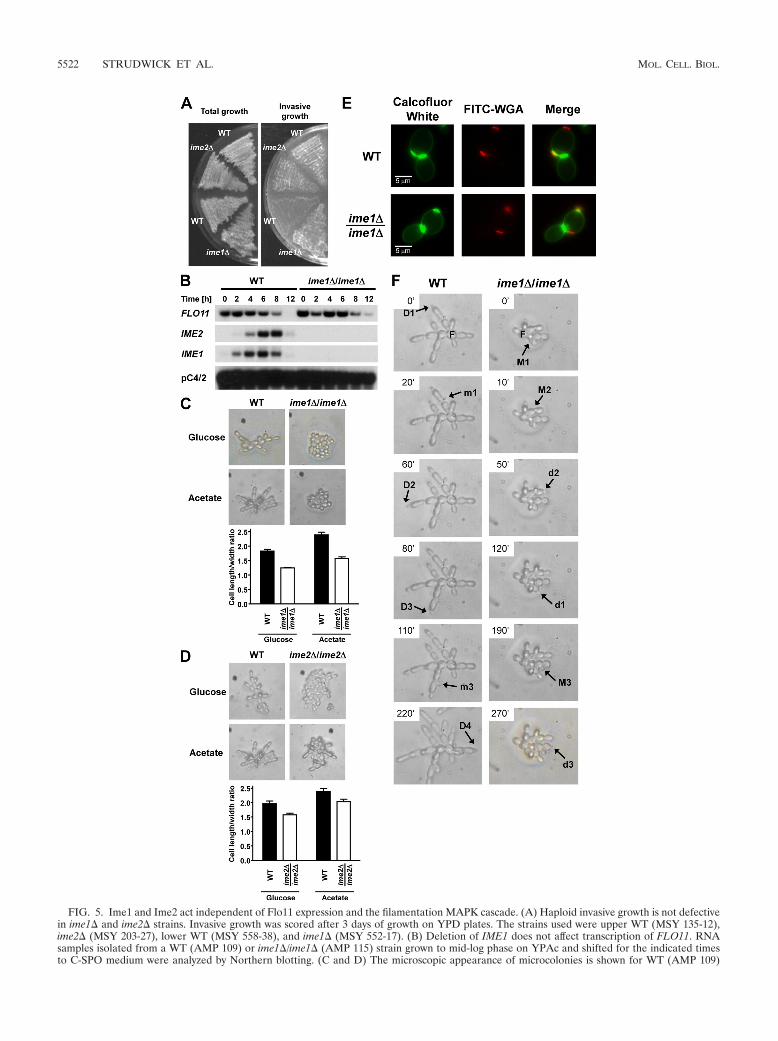
FIG. 5. Ime1 and Ime2 act independent of Flo11 expression and the filamentation MAPK cascade. (A) Haploid invasive growth is not defectivein ime1 and ime2 strains. Invasive growth was scored after 3 days of growth on YPD plates. The strains used were upper WT (MSY 135-12),ime2 (MSY 203-27), lower WT (MSY 558-38), and ime1 (MSY 552-17). (B) Deletion of IME1 does not affect transcription of FLO11. RNAsamples isolated from a WT (AMP 109) or ime1/ime1 (AMP 115) strain grown to mid-log phase on YPAc and shifted for the indicated timesto C-SPO medium were analyzed by Northern blotting. (C and D) The microscopic appearance of microcolonies is shown for WT (AMP 109)
5522 STRUDWICK ET AL. MOL. CELL. BIOL.

pseudohyphal growth phenotype of ime2/ime2 colonies af-ter growth for several days (Fig. 2A) and with the stimulationof pseudohyphal growth by acetate (Fig. 1A). These data showthat IME1 and IME2 are required for elongation of pseudohy-phal cells.
ime1/ime1 and ime2/ime2 microcolonies are moreglobular than microcolonies of WT cells. This suggested thatanother characteristic of pseudohyphal cells that contributes todirectional growth is affected by deletion of IME1 and IME2.To characterize whether the budding patterns of WT andime1/ime1 strains are bi- or unipolar, we stained bud scarswith calcofluor white after growth of both strains for 18 h onSLA acetate plates. For both strains, we observed cells withbud scars at both poles (not shown). Calcofluor white stainingdid not reveal a difference in bud site selection between thetwo strains (not shown). Bipolar budding cells display a strongbias toward the pole opposite their birth site in their first fewdivisions (14). For this reason, it may be difficult to distinguishbetween bi- and unipolar budding patterns by staining withcalcofluor white only. To reveal more subtle differences in budsite selection, we costained cells with FITC-WGA. In additionto bud scars, FITC-WGA also stains birth scars (25). Identifi-cation of the birth scar allowed classification of budding eventsinto events at the poles distal and proximal to the birth scar(Fig. 5E). This classification revealed that WT and ime1/ime1 cells grown for 18 h on SLA acetate plates buddedexclusively at the distal pole in their first division (Table 4).This bias for the distal pole persisted for the first few divisionsin both strains. However, this bias appeared to decrease fasterin the ime1/ime1 strain. The second bud was formed at thebirth pole in 17% of ime1/ime1 cells, whereas only 4.7%of WT cells chose the birth pole for their second bud (P 0.05). This small increase in selection of the proximal pole inthe second cell cycle may suffice to explain the more globulargrowth of ime1/ime1 cells.
Time-lapse video microscopy revealed that pseudohyphalWT daughter cells budded before or around the same time astheir mothers (12 of 14 mother-daughter pairs). Mothers couldbud much later ( 60 min) than their daughters (4 of 12 moth-er-daughter pairs in which the daughter budded first). In con-trast, ime1/ime1 daughter cells budded after their mothers(10 of 10 mother-daughter pairs) (Fig. 5F). This reversal in thebudding order is a second factor that contributes to the glob-ular growth of ime1/ime1 cells.
Comparison of the roles of nonfermentable carbon sourcesin pseudohyphal growth in the SK1 and 1278b genetic back-grounds. Our data show that stimulation of pseudohyphalgrowth by nonfermentable carbon sources in the SK1 geneticbackground requires IME1 and IME2. Next, we wished to
extend these findings to the 1278b genetic background, whichis used more routinely to study pseudohyphal growth (30, 54).In contrast to the case for the SK1 genetic background, non-fermentable carbon sources inhibited pseudohyphal growth indiploid a/ 1278b WT cells (Fig. 6A). Likewise, IME1 andIME2 were not required for pseudohypha formation by diploida/ 1278b WT cells on glucose (Fig. 6B).
Elevated cAMP signaling inhibits pseudohyphal growth onnonfermentable carbon sources. Stimulation of pseudohyphalgrowth in the presence of nonfermentable carbon sources inSK1 cells is different from the behavior of 1278b cells (Fig. 1and 6A). To explore explanations for the different behaviors ofthese two genetic backgrounds, we decided to focus on thePKA pathway. The PKA pathway is a signaling pathway re-sponding to the quality of the carbon source, is activated byglucose (87), and is involved in the regulation of pseudohyphalgrowth (26). The PKA pathway is hyperactive in 1278b cellscompared to another genetic background, SP1 (100). Strainswith high constitutive PKA activity fail to express IME1 (60,62), and PKA signaling inhibits Ime1 (80) and Ime2 (22, 76).These data suggest that elevated cAMP signaling in 1278bcells interferes with activation of Ime1 and Ime2, resulting in apseudohyphal growth defect on nonfermentable carbon
and ime1/ime1 (AMP 115) strains (C) and for WT (MSY 136-40 MSY 135-12) and ime2/ime2 (MSY 202-14 MSY 203-27) strains (D)grown for 12 to 24 h on SLA plates containing glucose or acetate as a carbon source. The P values for all pairwise strain and medium comparisonsare 0.01. (E) Examples of bud site selection in WT (AMP 109) and ime1/ime1 (AMP 115) cells grown on SLA acetate plates at 30°C for 18 h.Bud scars were stained with calcofluor white and are false-colored in green. Bud and birth scars stained with FITC-WGA are false-colored in redto reveal the polarity of the cells. Note that calcofluor white does not stain the birth scar and that FITC-WGA does not stain the chitin ring betweenthe mother and its growing bud. (F) Order of budding of mother and daughter cells in WT (AMP 109) and ime1/ime1 (AMP 115) strains grownon SLA acetate plates. Abbreviations: D, daughter; M, mother. Uppercase letters represent the cell budding first, and lowercase letters representthe cell budding last. The numbers identify mother-daughter pairs. The cells from which the colonies originated are labeled with an “F.” Thesecells are spherical and display a random, nonpolar budding pattern.
TABLE 4. Distribution of bud scars relative to the birth site in WT(AMP 109) and ime1/ime1 (AMP 115) cellsa
No. of bud scars oncells
No. of cellswith onlydistal bud
scars
No. of cellswith 1proximalbud scar
% of cellswith onlydistal bud
scars
% of cellswith 1proximalbud scar
WT cells1 157 0 100 02 61 3 95 4.73 15 12 56 444 5 6 45 555 0 3 0 1006 0 3 0 100
ime1/ime1 cells1 106 0 100 02 53 11 82 173 14 14 50 504 3 10 23 775 1 6 14 866 0 5 0 1007 0 08 0 1 0 100
a Cells were grown for 18 h on SLA acetate plates at 30°C. Cells were thenstained with calcofluor white and FITC-WGA to reveal bud and birth scars, asdescribed in Materials and Methods. Only the difference in selection of thesecond bud site was significantly different (P 0.05, assuming that the numberof bud scars formed at the proximal pole follows a Poisson distribution).
VOL. 30, 2010 IME1 IS REQUIRED FOR PSEUDOHYPHAL GROWTH 5523

sources. To test this hypothesis, we first confirmed that cAMPsignaling is constitutively elevated in 1278b cells compared toSK1 cells. Consistent with elevated cAMP signaling in 1278bcells, we found that growth on nonfermentable carbon sources,sporulation, induction of heat shock genes, and accumulationof storage carbohydrates upon heat shock were decreased in1278b cells (Fig. 7A to D). All of these phenotypes are knownto be inhibited by elevated cAMP signaling (13, 100, 104).Deletion of cAMP signaling components such as GPR1 orRAS2 elevated sporulation and storage carbohydrate accumu-lation in heat-shocked 1278b cells (Fig. 7F, H, and J). Ex-pression of constitutively active Ras2G19V in SK1 cells inhib-ited sporulation and storage carbohydrate accumulationduring heat shock (Fig. 7E, G, and I). These data confirm thatcAMP signaling contributes to the magnitude of these pheno-types in 1278b and SK1 cells. cAMP levels were elevated in1278b cells compared to those in SK1 cells (4.5 0.3 pmol/107 cells versus 3.5 0.2 pmol/107 cells). These data confirmthat cAMP signaling is elevated in 1278b cells compared toSK1 cells. Steady-state IME1 mRNA levels were significantlydecreased in 1278b cells (Fig. 8A), consistent with repressionof IME1 by elevated cAMP signaling in 1278b cells. Additionof cAMP or expression of constitutively active Ras2G19V in-hibited pseudohyphal growth in SK1 cells (Fig. 8B and C).FLO11, whose expression is stimulated by an activated cAMPsignaling pathway in 1278b cells, displayed strongly elevatedmRNA levels in SK1 cells (Fig. 8A and D). Furthermore,acetate induced the expression of FLO11 in SK1 cells (Fig. 8D)but not in 1278b cells (70), which may contribute to increasedpseudohyphal growth and invasiveness of SK1 strains grown on
nonfermentable carbon sources (Fig. 1A and B). Deletion ofRAS2, GPR1, or GPA2 did not allow 1278b cells to formpseudohyphae on nonfermentable carbon sources (not shown),possibly because FLO11 expression requires cAMP signalingin 1278b cells (71, 72, 77). Taken together, these data suggestthat cAMP signaling inhibits pseudohyphal growth on nonfer-mentable carbon sources by inhibiting IME1 and IME2.
DISCUSSION
Our work has shown that nonfermentable carbon sourcesstimulate pseudohyphal growth independent of respiratoryfunction and that pseudohyphal cells formed in the absence ofglucose exit pseudohyphal growth to successfully completemeiosis (Fig. 9). Two regulators of entry into meiosis, IME1and IME2, are required for stimulation of pseudohyphalgrowth by nonfermentable carbon sources. The use of a dif-ferent genetic background, SK1, from that used routinely forinvestigation of pseudohyphal growth, 1278b, was critical formaking these observations. Pseudohyphae formed by SK1 cellson nonfermentable carbon sources share several features withpseudohyphae formed by 1278b cells, for example, cell elon-gation, daughter cells budding before or at the same time astheir mothers, and invasion of the agar. However, pseudohy-phal SK1 cells appear to employ a bipolar budding pattern.Bipolar budding diploid cells display a strong bias toward bud-ding at the pole opposite their birth site in the first few divi-sions (14). This bias (Table 4), together with daughters bud-ding before their mothers (Fig. 5F), may allow SK1 cells toform pseudohyphae. Both of these features are affected bydeletion of IME1. The budding order of daughter and mothercells is reversed in ime1/ime1 cells (Fig. 5F). The bias forbudding distal to the birth site is less pronounced in ime1/ime1 cells, especially for the second budding event (Table 4).These buds and their first daughters are directed toward theorigins of the colonies, thus explaining why ime1/ime1 cellsare defective in pseudohyphal growth.
Role of Ime1 and Ime2 in pseudohyphal growth. Studies onIme1 and Ime2 in meiosis provide clues regarding the extent towhich these two proteins may act through the same or similardownstream targets to stimulate pseudohyphal growth on non-fermentable carbon sources. Ime1 acts through Ume6 to acti-vate EMGs, including IME2 (11, 59, 79, 98). Ume6 serves dual,opposing roles on EMG promoters. Under nutrient-rich con-ditions, it represses EMGs via recruitment of the Rpd3-Sin3HDAC (41) and the ISW2 chromatin remodeling complex(31), whereas in starvation its interaction with Ime1 is requiredfor activation of EMGs, either because Ime1 bound to EMGpromoters via Ume6 provides a transcriptional activation do-main (11, 79, 98) or because the interaction between these twoproteins is required to remove Ume6 from EMGs (59). Toinvestigate whether this transcriptional switch also operates inpseudohyphal growth, we turned to a T99N mutation in Ume6.This mutation decreases the interaction of Ume6 with Ime1 ina two-hybrid assay (35-fold) but does not derepress expres-sion of EMGs prior to induction of meiosis (11), suggestingthat the T99N mutation does not affect interaction of Ume6with the Rpd3-Sin3 HDAC or the ISW2 chromatin remod-eling complex. Cells expressing T99N-Ume6 formed lesspseudohyphal colonies than cells deleted for UME6 (Fig. 4B).
FIG. 6. Characterization of the roles of IME1 and IME2 inpseudohyphal growth in the 1278b background. (A) Inhibition ofpseudohyphal growth by nonfermentable carbon sources in the 1278bgenetic background. The strain used was MLY 61 a/. (B) IME1 (MSY699-01 a/) and IME2 (MSY 694-51 a/) are not required forpseudohyphal growth on glucose in 1278b cells. In both panels, thecolony morphologies after 7 days of growth on the indicated carbonsources are shown.
5524 STRUDWICK ET AL. MOL. CELL. BIOL.

This finding is consistent with the interpretation that derepres-sion of IME2 enhances pseudohyphal growth in ume6/ume6cells. T99N-Ume6 also interfered with pseudohypha formationcompared to WT Ume6 (Fig. 4B), which can be explained bythe inability of Ime1 to activate IME2 in cells expressing T99N-Ume6. This effect of the T99N-Ume6 mutant was more pro-nounced on plates containing both glucose and acetate than onplates containing only glucose (Fig. 4B), which is consistentwith elevated expression of IME1 in cells grown on nonfer-mentable carbon sources (Fig. 8E) and after exponentialgrowth on glucose (44). The pseudohyphal growth defect of theT99N-Ume6-expressing cells was also not as severe as thepseudohyphal growth defect displayed by ime1/ime1 cells,either because of a residual interaction between T99N-Ume6and Ime1 or because of the existence of additional, Ume6-independent Ime1 targets. Epistasis analysis (Fig. 3) supports
the idea that Ime1 acts largely through inducing expression ofIme2 to stimulate pseudohyphal growth. The behavior of theT99N-Ume6 mutant (Fig. 4B) provides further support for thisview. At the same time, the pseudohyphal growth defect ofime1/ime1 cells is more severe than the pseudohyphalgrowth defect of ime2/ime2 cells (Fig. 2 and 5), showing thatIme1 also stimulates pseudohyphal growth independent ofIme2. This situation is similar to regulation of entry into mei-osis by Ime1 and Ime2, where Ime1 also acts through Ime2 andindependent of Ime2 to stimulate entry into meiosis (64). Weconclude that all key elements of the early meiotic cascadefunction in pseudohyphal growth. The transcriptional targetsof Ime1 in pseudohyphal growth remain to be identified, butEMGs and genes carrying the Ume6-binding site URS1 intheir promoters are likely targets.
Several substrates for Ime2 are known, including Sic1 (21,
FIG. 7. cAMP signaling is hyperactive in 1278b cells compared to SK1 cells. (A) Sporulation of a/ diploid SK1 (AMP 109; filled bars) and1278b (MLY 61 a/; open bars) cells. (B) Induction of heat shock genes in WT cells (AMP 109 and MLY 61 a/) shifted from 30°C to 39°C for30 min. (C and D) Accumulation of glycogen (C) and trehalose (D) in WT cells (AMP 109 [filled bars] and MLY 61 a/ [open bars]) shifted from25°C to 37°C for the indicated times. (E) Expression of constitutively active Ras2G19V from plasmid pMW2 in a WT a/ diploid SK1 strain (AMP109) inhibits sporulation. Filled bars, AMP 109 plus pRS316; open bars, AMP 109 plus pMW2. (F) Deletion of GPR1 in a WT a/ diploid 1278bstrain (MLY 61 a/) increases sporulation. Filled bars, WT (MLY 61 a/); open bars, gpr1/gpr1 strain (MLY 232 a/). (G and H) Glycogenaccumulation is shown for cells shifted from 25°C to 37°C for the indicated times. (G) AMP 109 transformed with pRS316 (filled bars) or pMW2expressing Ras2G19V (open bars). (H) MLY 61 a/ (black bars), MLY 232 a/ (gpr1/gpr1; gray bars), and MLY 187 a/ (ras2/ras2; open bars).(I and J) Trehalose accumulation in the cells shown in graphs G and H. For each measurement, the average and standard error for two replicatesare shown.
VOL. 30, 2010 IME1 IS REQUIRED FOR PSEUDOHYPHAL GROWTH 5525

94), Cdh1 (8), the middle meiotic gene-specific transcriptionfactor Ndt80 (4, 69), the repressor of middle meiotic genesSum1 (65), and Rfa2 (17, 18). Stabilization of the G1-S tran-sition-promoting G1 cyclins Cln1 to -3 in grr1/grr1 cells stim-
ulates pseudohyphal growth (6). Consequently, pseudohyphalcells are characterized by a shortened G1 and an extended G2
phase (45). In meiosis, Ime2 substitutes for Cdc28 to triggerentry into meiotic S phase by phosphorylating Sic1 and trig-
FIG. 8. cAMP signaling represses pseudohyphal growth in SK1 cells. (A) Expression of IME1 and FLO11 in WT SK1 (AMP 109) and 1278b(MLY 61 a/) strains grown on rich acetate medium (2% KOAc, 1% yeast extract, 2% peptone) to exponential growth phase. All bands are fromthe same blot. P values were derived from an unpaired, two-tailed t test (n 6). (B and C) Addition of 5 mM cAMP to SLA glucose plates (B) orexpression of constitutively active Ras2G19V from plasmid pMW2 (C) inhibits pseudohyphal growth in SK1 cells (AMP 109). Filamentation andagar invasion were scored after 7 days of growth. Bars, 40 m for glucose and 100 m for the other carbon sources. (D) Acetate induces expressionof FLO11 in a WT SK1 strain (AMP 109). Cells were grown to mid-log phase on YPD or YPAc before isolation of RNA for Northern analysis.The 1278b strain was MLY 61 a/. (E) Comparison of steady-state mRNA levels for IME1, IME2, the EMGs HOP1 and SPO13, and the inositolbiosynthetic gene INO1 in an SK1 strain (AMP 1619) grown to exponential growth phase on glucose (lane 1) or acetate (lane 2) or 4, 8, or 12 hafter being shifted to sporulation medium (C-SPO medium) (see Materials and Methods).
5526 STRUDWICK ET AL. MOL. CELL. BIOL.

gering degradation of Sic1 (21), an inhibitor of Cdc28 and ofthe G1-S transition, suggesting that Ime2 may stimulatepseudohyphal growth by stimulating Sic1 degradation. Never-theless, future studies are required to identify the Ime2 sub-strates in pseudohyphal growth.
Sporulation of pseudohyphal cells. In the absence of glu-cose, pseudohyphae of SK1 cells exit pseudohyphal growth tosuccessfully complete meiosis (Fig. 1). Several models for con-version of pseudohyphal cells into asci are imaginable.Pseudohyphal cells may exit pseudohyphal growth to formnormal yeast- or vegetative-growth-form cells which then enterand execute meiosis. Alternatively, pseudohyphal cells maydirectly exit pseudohyphal growth and enter meiosis. Near-quantitative conversion of filaments into asci within 3 days andthe requirement of IME1 and IME2 for pseudohyphal growthsupport the second model. Independent of the precise mech-anism of switch from pseudohyphal growth to meiosis, thequestion arises of which stimulus triggers entry into meiosis bypseudohyphae. A further decrease in nutrient content of themedium caused by metabolic activity of the growing pseudohy-phae may induce meiosis. Ascus formation by the tip cell ofpseudohyphae (Fig. 1C) provides evidence against such a sim-ple nutrient depletion model. Alternatively, entry into meiosismay be under temporal control. Detailed time-lapse studieswill be necessary to establish whether pseudohyphal cells entermeiosis directly or via prior formation of yeast-form cells. Ascisometimes displayed a linear arrangement of two to fourspores. This ascus morphology has been observed previously inSaccharomyces ludwigii (36) and after sporulation of newlyformed zygotes of S. cerevisiae (103).
Role of cAMP signaling in pseudohyphal growth. Stimula-tion of pseudohyphal growth in the presence of nonferment-able carbon sources in SK1 cells contrasts with the behavior of1278b cells, in which nonfermentable carbon sources inhib-ited pseudohyphal growth (Fig. 6A). cAMP signaling activitywas elevated in 1278b cells compared to SK1 cells (Fig. 7),confirming an earlier report (100). Strains with high constitu-tive PKA activity fail to express IME1 (60, 62). PKA signalinginhibits Ime1 (80) and Ime2 (22, 76). Therefore, 1278b cellsmay fail to form pseudohyphae on nonfermentable carbonsources because the activation of IME1 and IME2 is defective.Both IME1 and IME2 provide virtually essential functions forpseudohyphal growth on several nonfermentable carbonsources (Fig. 2). Attenuation of cAMP signaling by deletion ofRAS2, GPR1, or GPA2 did not rescue pseudohyphal growth of1278b cells on nonfermentable carbon sources (not shown),possibly because FLO11 expression requires an active cAMPsignaling pathway in 1278b cells (71, 72, 77). In SK1 cells,FLO11 expression was induced strongly by acetate (Fig. 8D).In contrast, acetate does not induce FLO11 in 1278b cells(70). This potential uncoupling of FLO11 expression from thePKA pathway in SK1 cells may allow SK1 cells to attenuatePKA signaling on nonfermentable carbon sources (5, 63) inorder to activate IME1 and IME2. Two isoforms of the cata-lytic subunit of PKA, Tpk1 and Tpk3, have negative roles inpseudohyphal growth (71, 77), indicating that Tpk1 or Tpk3may target IME1 or IME2 to inhibit pseudohyphal growth onnonfermentable carbon sources.
Several lines of evidence suggest that Ime1 and Ime2 actindependently of Flo11 in pseudohyphal growth. Haploid in-
FIG. 9. Control of cell differentiation by the early meiotic cascade.(A) Revised life cycle of S. cerevisiae incorporating sporulation ofpseudohyphal cells. Haploid a and cells grow and divide in a nutri-ent-rich environment. Mating type switching allows a cells to switch toan mating type and vice versa. a and cells mate to form an a/diploid cell when exposed to mating pheromones secreted by theiropposite mating types. a/ diploid cells grow and divide in a nutrient-rich environment. Severe starvation triggers sporulation of a/ diploidsand formation of an ascus harboring four haploid spores. Moderatestarvation triggers pseudohyphal growth, which may allow yeasts toforage for nutrients. Severe starvation of pseudohyphae also inducessporulation. After exposure to nutrients and breakdown of the ascuswall, the spores germinate to form haploid a and cells. (B) Modelsummarizing how the early meiotic cascade consisting of Ime1, Ume6,and Ime2 regulates cell differentiation in diploid S. cerevisiae cells.Starvation of a/ diploid cells induces expression of Ime1 and conver-sion of the transcriptional repressor Ume6 to an activator, leading toinduction of early meiotic genes, including IME2. Activation of IME1and IME2 is a general differentiation signal that promotes bothpseudohyphal growth and meiosis. Induction of pseudohyphal growthor meiosis by Ime1 is abolished by a T99N mutation in Ume6. Mod-ulation of the differentiation signal generated by IME1 and IME2 byother, uncharacterized events is expected to govern the choice betweenpseudohyphal growth and meiosis.
VOL. 30, 2010 IME1 IS REQUIRED FOR PSEUDOHYPHAL GROWTH 5527

vasive growth or agar invasion by diploid cells was not de-creased by deletion of IME1 or IME2 (Fig. 5A). Deletion ofIME1 did not significantly affect FLO11 mRNA levels (Fig.5B). ime1/ime1 cells and, to a lesser degree, ime2/ime2cells displayed cell elongation defects (Fig. 5C). Therefore,Ime1 and Ime2 may act independent of and in parallel toFLO11 in pseudohyphal growth.
Implications for other yeast species. Ime2 belongs to a fam-ily of conserved MAPKs found in all eukaryotes (27, 28), in-cluding mammalian MAK, the Schizosaccharomyces pombeproteins Mde3 and Pit1, and the Ustilago maydis protein kinaseCrk1. All family members may function in sexual development.MAK is expressed during spermatogenesis (40, 61), Mde3 andPit1 are important for the timing of the meiotic divisionsand spore morphogenesis (1), Crk1 is required for mating (28),and Ime2 is required for entry into meiotic S phase (21). Ourfinding that Ime2, Ime1, and Ume6 are required for pseudohy-phal growth of S. cerevisiae suggests that Ime2 orthologs func-tion in processes other than meiosis, for example, in hyphaldevelopment and filamentous growth of pathogenic yeasts,such as Ustilago maydis, Magnaporthe grisea, and Candida spe-cies, that undergo dimorphic transitions important for theirvirulence (9, 49, 50, 86). Indeed, Crk1 is required for hyper-polarized growth of U. maydis cells with defects in cAMPsignaling (27) and for infection of maize plants (28), and Ume6is required for hyphal extension in Candida albicans (3). Ourwork provides a motivation to investigate the roles of Ime2orthologs, and possibly orthologs of other meiotic genes, inpseudohyphal and hyphal growth forms and in the virulence ofpathogenic yeast species.
ACKNOWLEDGMENTS
This work was supported by the Biotechnology and Biological Sci-ences Research Council (BB/C513418/1) and the European Commis-sion (MIRG-CT-2005-016411).
We thank Joseph Heitman (Duke University, Durham, NC), AaronMitchell (Columbia University, New York, NY), Julian Rutherford(University of Newcastle upon Tyne, Newcastle upon Tyne, UnitedKingdom), Edward Winter (Thomas Jefferson University, Philadel-phia, PA), and Stefan Irniger (Georg August University, Gottingen,Germany) for providing strains and plasmids. We thank the Newcastle-upon-Tyne yeast group for use of a Singer tetrad dissection micro-scope, Patrick Hussey for use of a Nikon Eclipse TE300 microscope,and David Cox and Andrei Smertenko for help with fluorescencemicroscopy.
REFERENCES
1. Abe, H., and C. Shimoda. 2000. Autoregulated expression of Schizosaccha-romyces pombe meiosis-specific transcription factor Mei4 and a genome-wide search for its target genes. Genetics 154:1497–1508.
2. Alani, E., L. Cao, and N. Kleckner. 1987. A method for gene disruption thatallows repeated use of URA3 selection in the construction of multiplydisrupted yeast strains. Genetics 116:541–545.
3. Banerjee, M., D. S. Thompson, A. Lazzell, P. L. Carlisle, C. Pierce, C.Monteagudo, J. L. Lopez-Ribot, and D. Kadosh. 2008. UME6, a novelfilament-specific regulator of Candida albicans hyphal extension and viru-lence. Mol. Biol. Cell 19:1354–1365.
4. Benjamin, K. R., C. Zhang, K. M. Shokat, and I. Herskowitz. 2003. Controlof landmark events in meiosis by the CDK Cdc28 and the meiosis-specifickinase Ime2. Genes Dev. 17:1524–1539.
5. Beullens, M., K. Mbonyi, L. Geerts, D. Gladines, K. Detremerie, A. W.Jans, and J. M. Thevelein. 1988. Studies on the mechanism of the glucose-induced cAMP signal in glycolysis and glucose repression mutants of theyeast Saccharomyces cerevisiae. Eur. J. Biochem. 172:227–231.
6. Blacketer, M. J., P. Madaule, and A. M. Myers. 1995. Mutational analysisof morphologic differentiation in Saccharomyces cerevisiae. Genetics 140:1259–1275.
7. Boeckstaens, M., B. Andre, and A. M. Marini. 2007. The yeast ammoniumtransport protein Mep2 and its positive regulator, the Npr1 kinase, play animportant role in normal and pseudohyphal growth on various nitrogenmedia through retrieval of excreted ammonium. Mol. Microbiol. 64:534–546.
8. Bolte, M., P. Steigemann, G. H. Braus, and S. Irniger. 2002. Inhibition ofAPC-mediated proteolysis by the meiosis-specific protein kinase Ime2.Proc. Natl. Acad. Sci. U. S. A. 99:4385–4390.
9. Borges-Walmsley, M. I., and A. R. Walmsley. 2000. cAMP signalling inpathogenic fungi: control of dimorphic switching and pathogenicity. TrendsMicrobiol. 8:133–141.
10. Bowdish, K. S., and A. P. Mitchell. 1993. Bipartite structure of an earlymeiotic upstream activation sequence from Saccharomyces cerevisiae. Mol.Cell. Biol. 13:2172–2181.
11. Bowdish, K. S., H. E. Yuan, and A. P. Mitchell. 1995. Positive control ofyeast meiotic genes by the negative regulator UME6. Mol. Cell. Biol.15:2955–2961.
12. Cameron, S., L. Levin, M. Zoller, and M. Wigler. 1988. cAMP-independentcontrol of sporulation, glycogen metabolism, and heat shock resistance in S.cerevisiae. Cell 53:555–566.
13. Cannon, J. F., and K. Tatchell. 1987. Characterization of Saccharomycescerevisiae genes encoding subunits of cyclic AMP-dependent protein kinase.Mol. Cell. Biol. 7:2653–2663.
14. Chant, J., and J. R. Pringle. 1995. Patterns of bud-site selection in the yeastSaccharomyces cerevisiae. J. Cell Biol. 129:751–765.
15. Chen, D.-C., B.-C. Yang, and T.-T. Kuo. 1992. One-step transformation ofyeast in stationary phase. Curr. Genet. 21:83–84.
16. Chu, S., J. DeRisi, M. Eisen, J. Mulholland, D. Botstein, P. O. Brown, andI. Herskowitz. 1998. The transcriptional program of sporulation in buddingyeast. Science 282:699–705.
17. Clifford, D. M., S. M. Marinco, and G. S. Brush. 2004. The meiosis-specificprotein kinase Ime2 directs phosphorylation of replication protein A.J. Biol. Chem. 279:6163–6170.
18. Clifford, D. M., K. E. Stark, K. E. Gardner, S. Hoffmann-Benning, and G. S.Brush. 2005. Mechanistic insight into the Cdc28-related protein kinaseIme2 through analysis of replication protein A phosphorylation. Cell Cycle4:1826–1833.
19. Covitz, P. A., I. Herskowitz, and A. P. Mitchell. 1991. The yeast RME1 geneencodes a putative zinc finger protein that is directly repressed by a1-2.Genes Dev. 5:1982–1989.
20. Cullen, P. J., W. Sabbagh, Jr., E. Graham, M. M. Irick, E. K. van Olden, C.Neal, J. Delrow, L. Bardwell, and G. F. Sprague, Jr. 2004. A signaling mucinat the head of the Cdc42- and MAPK-dependent filamentous growth path-way in yeast. Genes Dev. 18:1695–1708.
21. Dirick, L., L. Goetsch, G. Ammerer, and B. Byers. 1998. Regulation ofmeiotic S phase by Ime2 and a Clb5,6-associated kinase in Saccharomycescerevisiae. Science 281:1854–1857.
22. Donzeau, M., and W. Bandlow. 1999. The yeast trimeric guanine nucleo-tide-binding protein subunit, Gpa2p, controls the meiosis-specific kinaseIme2p activity in response to nutrients. Mol. Cell. Biol. 19:6110–6119.
23. Eraso, P., and J. M. Gancedo. 1984. Catabolite repression in yeasts is notassociated with low levels of cAMP. Eur. J. Biochem. 141:195–198.
24. Fox, T. D., L. S. Folley, J. J. Mulero, T. W. McMullin, P. E. Thorsness, L. O.Hedin, and M. C. Costanzo. 1991. Analysis and manipulation of yeastmitochondrial genes. Methods Enzymol. 194:149–165.
25. Frydlova, I., I. Malcova, P. Vasicova, and J. Hasek. 2009. Deregulation ofDSE1 gene expression results in aberrant budding within the birth scar andcell wall integrity pathway activation in Saccharomyces cerevisiae. Eukaryot.Cell 8:586–594.
26. Gagiano, M., F. F. Bauer, and I. S. Pretorius. 2002. The sensing of nutri-tional status and the relationship to filamentous growth in Saccharomycescerevisiae. FEMS Yeast Res. 2:433–470.
27. Garrido, E., and J. Perez-Martin. 2003. The crk1 gene encodes an Ime2-related protein that is required for morphogenesis in the plant pathogenUstilago maydis. Mol. Microbiol. 47:729–743.
28. Garrido, E., U. Voss, P. Muller, S. Castillo-Lluva, R. Kahmann, and J.Perez-Martín. 2004. The induction of sexual development and virulence inthe smut fungus Ustilago maydis depends on Crk1, a novel MAPK protein.Genes Dev. 18:3117–3130.
29. Gavrias, V., A. Andrianopoulos, C. J. Gimeno, and W. E. Timberlake. 1996.Saccharomyces cerevisiae TEC1 is required for pseudohyphal growth. Mol.Microbiol. 19:1255–1263.
30. Gimeno, C. J., P. O. Ljungdahl, C. A. Styles, and G. R. Fink. 1992. Unipolarcell divisions in the yeast S. cerevisiae lead to filamentous growth: regula-tion by starvation and RAS. Cell 68:1077–1090.
31. Goldmark, J. P., T. G. Fazzio, P. W. Estep, G. M. Church, and T.Tsukiyama. 2000. The Isw2 chromatin remodeling complex represses earlymeiotic genes upon recruitment by Ume6p. Cell 103:423–433.
32. Goldstein, A. L., and J. H. McCusker. 1999. Three new dominant drugresistance cassettes for gene disruption in Saccharomyces cerevisiae. Yeast15:1541–1553.
33. Guo, B., C. A. Styles, Q. Feng, and G. R. Fink. 2000. A Saccharomyces gene
5528 STRUDWICK ET AL. MOL. CELL. BIOL.

family involved in invasive growth, cell-cell adhesion, and mating. Proc.Natl. Acad. Sci. U. S. A. 97:12158–12163.
34. Guttmann-Raviv, N., S. Martin, and Y. Kassir. 2002. Ime2, a meiosis-specific kinase in yeast, is required for destabilization of its transcriptionalactivator, Ime1. Mol. Cell. Biol. 22:2047–2056.
35. Hardwick, J. S., F. G. Kuruvilla, J. K. Tong, A. F. Shamji, and S. L.Schreiber. 1999. Rapamycin-modulated transcription defines the subset ofnutrient-sensitive signaling pathways directly controlled by the Tor pro-teins. Proc. Natl. Acad. Sci. U. S. A. 96:14866–14870.
36. Hawthorne, D. C. 1955. The use of linear asci for chromosome mapping inSaccharomyces. Genetics 40:511–518.
37. Horecka, J., and Y. Jigami. 1999. The trp1-FA designer deletion forPCR-based gene functional analysis in Saccharomyces cerevisiae. Yeast 15:1769–1774.
38. Huxley, C., E. D. Green, and I. Dunham. 1990. Rapid assessment of S.cerevisiae mating type by PCR. Trends Genet. 6:236.
39. Inai, T., M. Yukawa, and E. Tsuchiya. 2007. Interplay between chromatinand trans-acting factors on the IME2 promoter upon induction of the geneat the onset of meiosis. Mol. Cell. Biol. 27:1254–1263.
40. Jinno, A., K. Tanaka, H. Matsushime, T. Haneji, and M. Shibuya. 1993.Testis-specific Mak protein kinase is expressed specifically in the meioticphase in spermatogenesis and is associated with a 210-kilodalton cellularphosphoprotein. Mol. Cell. Biol. 13:4146–4156.
41. Kadosh, D., and K. Struhl. 1997. Repression by Ume6 involves recruitmentof a complex containing Sin3 corepressor and Rpd3 histone deacetylase totarget promoters. Cell 89:365–371.
42. Kane, S. M., and R. Roth. 1974. Carbohydrate metabolism during ascos-pore development in yeast. J. Bacteriol. 118:8–14.
43. Kassir, Y., D. Granot, and G. Simchen. 1988. IME1, a positive regulatorgene of meiosis in S. cerevisiae. Cell 52:853–862.
44. Kawaguchi, H., M. Yoshida, and I. Yamashita. 1992. Nutritional regulationof meiosis-specific gene expression in Saccharomyces cerevisiae. Biosci. Bio-technol. Biochem. 56:289–297.
45. Kron, S. J., C. A. Styles, and G. R. Fink. 1994. Symmetric cell division inpseudohyphae of the yeast Saccharomyces cerevisiae. Mol. Biol. Cell 5:1003–1022.
46. Kubler, E., H. U. Mosch, S. Rupp, and M. P. Lisanti. 1997. Gpa2p, aG-protein -subunit, regulates growth and pseudohyphal development inSaccharomyces cerevisiae via a cAMP-dependent mechanism. J. Biol. Chem.272:20321–20323.
47. Kupiec, M., B. Byers, R. E. Esposito, and A. P. Mitchell. 1997. Meiosis andsporulation in Saccharomyces cerevisiae, p. 889–1036. In J. R. Pringle, J. R.Broach, and E. W. Jones (ed.), The molecular and cellular biology of theyeast Saccharomyces, vol. 3. Cold Spring Harbor Laboratory Press, Plain-view, NY.
48. Law, D. T., and J. Segall. 1988. The SPS100 gene of Saccharomyces cerevi-siae is activated late in the sporulation process and contributes to spore wallmaturation. Mol. Cell. Biol. 8:912–922.
49. Lee, N., C. A. D’Souza, and J. W. Kronstad. 2003. Of smuts, blasts, mildews,and blights: cAMP signaling in phytopathogenic fungi. Annu. Rev. Phyto-pathol. 41:399–427.
50. Lengeler, K. B., R. C. Davidson, C. D’Souza, T. Harashima, W. C. Shen, P.Wang, X. Pan, M. Waugh, and J. Heitman. 2000. Signal transductioncascades regulating fungal development and virulence. Microbiol. Mol.Biol. Rev. 64:746–785.
51. Lo, W. S., and A. M. Dranginis. 1998. The cell surface flocculin Flo11 isrequired for pseudohyphae formation and invasion by Saccharomyces cer-evisiae. Mol. Biol. Cell 9:161–171.
52. Lorenz, M. C., N. S. Cutler, and J. Heitman. 2000. Characterization ofalcohol-induced filamentous growth in Saccharomyces cerevisiae. Mol. Biol.Cell 11:183–199.
53. Lorenz, M. C., and J. Heitman. 1998. The MEP2 ammonium permeaseregulates pseudohyphal differentiation in Saccharomyces cerevisiae. EMBOJ. 17:1236–1247.
54. Lorenz, M. C., and J. Heitman. 1997. Yeast pseudohyphal growth is regu-lated by GPA2, a G protein homolog. EMBO J. 16:7008–7018.
55. Lorenz, M. C., X. Pan, T. Harashima, M. E. Cardenas, Y. Xue, J. P. Hirsch,and J. Heitman. 2000. The G protein-coupled receptor Gpr1 is a nutrientsensor that regulates pseudohyphal differentiation in Saccharomyces cerevi-siae. Genetics 154:609–622.
56. Madhani, H. D., and G. R. Fink. 1998. The riddle of MAP kinase signalingspecificity. Trends Genet. 14:151–155.
57. Malathi, K., Y. Xiao, and A. P. Mitchell. 1999. Catalytic roles of yeastGSK3/shaggy homolog Rim11p in meiotic activation. Genetics 153:1145–1152.
58. Malathi, K., Y. Xiao, and A. P. Mitchell. 1997. Interaction of yeast repres-sor-activator protein Ume6p with glycogen synthase kinase 3 homologRim11p. Mol. Cell. Biol. 17:7230–7236.
59. Mallory, M. J., K. F. Cooper, and R. Strich. 2007. Meiosis-specific destruc-tion of the Ume6p repressor by the Cdc20-directed APC/C. Mol. Cell27:951–961.
60. Matsumoto, K., I. Uno, and T. Ishikawa. 1983. Initiation of meiosis in yeast
mutants defective in adenylate cyclase and cyclic AMP-dependent proteinkinase. Cell 32:417–423.
61. Matsushime, H., A. Jinno, N. Takagi, and M. Shibuya. 1990. A novelmammalian protein kinase gene (mak) is highly expressed in testicular germcells at and after meiosis. Mol. Cell. Biol. 10:2261–2268.
62. Matsuura, A., M. Treinin, H. Mitsuzawa, Y. Kassir, I. Uno, and G. Sim-chen. 1990. The adenylate cyclase/protein kinase cascade regulates entryinto meiosis in Saccharomyces cerevisiae through the gene IME1. EMBO J.9:3225–3232.
63. Mbonyi, K., and J. M. Thevelein. 1988. The high-affinity glucose uptakesystem is not required for induction of the RAS-mediated cAMP signal byglucose in cells of the yeast Saccharomyces cerevisiae. Biochim. Biophys.Acta 971:223–226.
64. Mitchell, A. P., S. E. Driscoll, and H. E. Smith. 1990. Positive control ofsporulation-specific genes by the IME1 and IME2 products in Saccharomy-ces cerevisiae. Mol. Cell. Biol. 10:2104–2110.
65. Moore, M., M. E. Shin, A. Bruning, K. Schindler, A. Vershon, and E.Winter. 2007. Arg-Pro-X-Ser/Thr is a consensus phosphoacceptor sequencefor the meiosis-specific Ime2 protein kinase in Saccharomyces cerevisiae.Biochemistry 46:271–278.
66. Mosch, H.-U., R. L. Roberts, and G. R. Fink. 1996. Ras2 signals via theCdc42/Ste20/mitogen-activated protein kinase module to induce filamen-tous growth in Saccharomyces cerevisiae. Proc. Natl. Acad. Sci. U. S. A.93:5352–5356.
67. Nazar, R. N., H. G. Lawford, and J.-T. Wong. 1970. An improved procedurefor extraction and analysis of cellular nucleotides. Anal. Biochem. 35:305–313.
68. Neigeborn, L., and A. P. Mitchell. 1991. The yeast MCK1 gene encodes aprotein kinase homolog that activates early meiotic gene expression. GenesDev. 5:533–548.
69. Pak, J., and J. Segall. 2002. Regulation of the premiddle and middle phasesof expression of the NDT80 gene during sporulation of Saccharomycescerevisiae. Mol. Cell. Biol. 22:6417–6429.
70. Palecek, S. P., A. S. Parikh, J. H. Huh, and S. J. Kron. 2002. Depression ofSaccharomyces cerevisiae invasive growth on non-glucose carbon sourcesrequires the Snf1 kinase. Mol. Microbiol. 45:453–469.
71. Pan, X., and J. Heitman. 1999. Cyclic AMP-dependent protein kinaseregulates pseudohyphal differentiation in Saccharomyces cerevisiae. Mol.Cell. Biol. 19:4874–4887.
72. Pan, X., and J. Heitman. 2002. Protein kinase A operates a molecularswitch that governs yeast pseudohyphal differentiation. Mol. Cell. Biol.22:3981–3993.
73. Parrou, J. L., M. A. Teste, and J. Francois. 1997. Effects of various types ofstress on the metabolism of reserve carbohydrates in Saccharomyces cerevi-siae: genetic evidence for a stress-induced recycling of glycogen and treha-lose. Microbiology 143:1891–1900.
74. Primig, M., R. M. Williams, E. A. Winzeler, G. G. Tevzadze, A. R. Conway,S. Y. Hwang, R. W. Davis, and R. E. Esposito. 2000. The core meiotictranscriptome in budding yeasts. Nat. Genet. 26:415–423.
75. Pringle, J. R. 1991. Staining of bud scars and other cell wall chitin withcalcofluor. Methods Enzymol. 194:732–735.
76. Purnapatre, K., M. Gray, S. Piccirillo, and S. M. Honigberg. 2005. Glucoseinhibits meiotic DNA replication through SCFGrr1p-dependent destructionof Ime2p kinase. Mol. Cell. Biol. 25:440–450.
77. Robertson, L. S., and G. R. Fink. 1998. The three yeast A kinases havespecific signaling functions in pseudohyphal growth. Proc. Natl. Acad. Sci.U. S. A. 95:13783–13787.
78. Rose, M., and F. Winston. 1984. Identification of a Ty insertion within thecoding sequence of the S. cerevisiae URA3 gene. Mol. Gen. Genet. 193:557–560.
79. Rubin-Bejerano, I., S. Mandel, K. Robzyk, and Y. Kassir. 1996. Inductionof meiosis in Saccharomyces cerevisiae depends on conversion of the tran-scriptional repressor Ume6 to a positive regulator by its regulated associ-ation with the transcriptional activator Ime1. Mol. Cell. Biol. 16:2518–2526.
80. Rubin-Bejerano, I., S. Sagee, O. Friedman, L. Pnueli, and Y. Kassir. 2004.The in vivo activity of Ime1, the key transcriptional activator of meiosis-specific genes in Saccharomyces cerevisiae, is inhibited by the cyclic AMP/protein kinase A signal pathway through the glycogen synthase kinase 3-homolog Rim11. Mol. Cell. Biol. 24:6967–6979.
81. Rubinstein, A., V. Gurevich, Z. Kasulin-Boneh, L. Pnueli, Y. Kassir, andR. Y. Pinter. 2007. Faithful modeling of transient expression and its appli-cation to elucidating negative feedback regulation. Proc. Natl. Acad. Sci.U. S. A. 104:6241–6246.
82. Rupp, S., E. Summers, H. J. Lo, H. Madhani, and G. Fink. 1999. MAPkinase and cAMP filamentation signaling pathways converge on the unusu-ally large promoter of the yeast FLO11 gene. EMBO J. 18:1257–1269.
83. Rutherford, J. C., G. Chua, T. Hughes, M. E. Cardenas, and J. Heitman.2008. An Mep2-dependent transcriptional profile links permease functionto gene expression during pseudohyphal growth in Saccharomyces cerevi-siae. Mol. Biol. Cell 19:3028–3039.
84. Saez, M. J., and R. Lagunas. 1976. Determination of intermediary metab-
VOL. 30, 2010 IME1 IS REQUIRED FOR PSEUDOHYPHAL GROWTH 5529

olites in yeast. Critical examination of the effect of sampling conditions andrecommendations for obtaining true levels. Mol. Cell. Biochem. 13:73–78.
85. Sagee, S., A. Sherman, G. Shenhar, K. Robzyk, N. Ben-Doy, G. Simchen,and Y. Kassir. 1998. Multiple and distinct activation and repression se-quences mediate the regulated transcription of IME1, a transcriptionalactivator of meiosis-specific genes in Saccharomyces cerevisiae. Mol. Cell.Biol. 18:1985–1995.
86. Sanchez-Martínez, C., and J. Perez-Martín. 2001. Dimorphism in fungalpathogens: Candida albicans and Ustilago maydis—similar inputs, differentoutputs. Curr. Opin. Microbiol. 4:214–221.
87. Santangelo, G. M. 2006. Glucose signaling in Saccharomyces cerevisiae.Microbiol. Mol. Biol. Rev. 70:253–282.
88. Sari, F., M. Heinrich, W. Meyer, G. H. Braus, and S. Irniger. 2008. TheC-terminal region of the meiosis-specific protein kinase Ime2 mediatesprotein instability and is required for normal spore formation in buddingyeast. J. Mol. Biol. 378:31–43.
89. Schindler, K., K. R. Benjamin, A. Martin, A. Boglioli, I. Herskowitz, and E.Winter. 2003. The Cdk-activating kinase Cak1p promotes meiotic S phasethrough Ime2p. Mol. Cell. Biol. 23:8718–8728.
90. Schlanderer, G., and H. Dellweg. 1974. Cyclic AMP and catabolite repres-sion in yeasts. In Schizosaccharomyces pombe glucose lowers both intracel-lular adenosine 3:5-monophosphate levels and the activity of catabolite-sensitive enzymes. Eur. J. Biochem. 49:305–316.
91. Schroder, M., J. S. Chang, and R. J. Kaufman. 2000. The unfolded proteinresponse represses nitrogen-starvation induced developmental differentia-tion in yeast. Genes Dev. 14:2962–2975.
92. Schroder, M., R. Clark, C. Y. Liu, and R. J. Kaufman. 2004. The unfoldedprotein response represses differentiation through the RPD3-SIN3 histonedeacetylase. EMBO J. 23:2281–2292.
93. Schuller, H. J. 2003. Transcriptional control of nonfermentative metabo-lism in the yeast Saccharomyces cerevisiae. Curr. Genet. 43:139–160.
94. Sedgwick, C., M. Rawluk, J. Decesare, S. Raithatha, J. Wohlschlegel, P.Semchuk, M. Ellison, J. Yates III, and D. Stuart. 2006. Saccharomycescerevisiae Ime2 phosphorylates Sic1 at multiple PXS/T sites but is insuffi-cient to trigger Sic1 degradation. Biochem. J. 399:151–160.
95. Shefer-Vaida, M., A. Sherman, T. Ashkenazi, K. Robzyk, and Y. Kassir.1995. Positive and negative feedback loops affect the transcription of Ime1,a positive regulator of meiosis in Saccharomyces cerevisiae. Dev. Genet.16:219–228.
96. Sia, R. A. L., and A. P. Mitchell. 1995. Stimulation of later functions of theyeast meiotic protein kinase Ime2p by the IDS2 gene product. Mol. Cell.Biol. 15:5279–5287.
97. Sikorski, R. S., and P. Hieter. 1989. A system of shuttle vectors and yeasthost strains designed for efficient manipulation of DNA in Saccharomycescerevisiae. Genetics 122:19–27.
98. Smith, H. E., S. E. Driscoll, R. A. L. Sia, H. E. Yuan, and A. P. Mitchell.1993. Genetic evidence for transcriptional activation by the yeast IME1gene product. Genetics 133:775–784.
99. Smith, H. E., and A. P. Mitchell. 1989. A transcriptional cascade governsentry into meiosis in Saccharomyces cerevisiae. Mol. Cell. Biol. 9:2142–2152.
100. Stanhill, A., N. Schick, and D. Engelberg. 1999. The yeast ras/cyclic AMPpathway induces invasive growth by suppressing the cellular stress response.Mol. Cell. Biol. 19:7529–7538.
101. Strich, R., R. T. Surosky, C. Steber, E. Dubois, F. Messenguy, and R. E.Esposito. 1994. UME6 is a key regulator of nitrogen repression and meioticdevelopment. Genes Dev. 8:796–810.
102. Tamaki, H., T. Miwa, M. Shinozaki, M. Saito, C. W. Yun, K. Yamamoto,and H. Kumagai. 2000. GPR1 regulates filamentous growth through FLO11in yeast Saccharomyces cerevisiae. Biochem. Biophys. Res. Commun. 267:164–168.
103. Thomas, J. H., and D. Botstein. 1987. Ordered linear tetrads are producedby the sporulation of newly formed zygotes of Saccharomyces cerevisiae.Genetics 115:229–232.
104. Toda, T., S. Cameron, P. Sass, M. Zoller, J. D. Scott, B. McMullen, M.Hurwitz, E. G. Krebs, and M. Wigler. 1987. Cloning and characterization ofBCY1, a locus encoding a regulatory subunit of the cyclic AMP-dependentprotein kinase in Saccharomyces cerevisiae. Mol. Cell. Biol. 7:1371–1377.
105. Toda, T., I. Uno, T. Ishikawa, S. Powers, T. Kataoka, D. Broek, S. Cameron,J. Broach, K. Matsumoto, and M. Wigler. 1985. In yeast, RAS proteins arecontrolling elements of adenylate cyclase. Cell 40:27–36.
106. Vidan, S., and A. P. Mitchell. 1997. Stimulation of yeast meiotic geneexpression by the glucose-repressible protein kinase Rim15p. Mol. Cell.Biol. 17:2688–2697.
107. Wach, A., A. Brachat, R. Pohlmann, and P. Philippsen. 1994. New heter-ologous modules for classical or PCR-based gene disruptions in Saccharo-myces cerevisiae. Yeast 10:1793–1808.
108. Ward, M. P., C. J. Gimeno, G. R. Fink, and S. Garrett. 1995. SOK2 mayregulate cyclic AMP-dependent protein kinase-stimulated growth andpseudohyphal development by repressing transcription. Mol. Cell. Biol.15:6854–6863.
109. Washburn, B. K., and R. E. Esposito. 2001. Identification of the Sin3-binding site in Ume6 defines a two-step process for conversion of Ume6from a transcriptional repressor to an activator in yeast. Mol. Cell. Biol.21:2057–2069.
110. Xiao, Y., and A. P. Mitchell. 2000. Shared roles of yeast glycogen synthasekinase 3 family members in nitrogen-responsive phosphorylation of meioticregulator Ume6p. Mol. Cell. Biol. 20:5447–5453.
111. Xue, Y., M. Batlle, and J. P. Hirsch. 1998. GPR1 encodes a putative Gprotein-coupled receptor that associates with the Gpa2p G subunit andfunctions in a Ras-independent pathway. EMBO J. 17:1996–2007.
5530 STRUDWICK ET AL. MOL. CELL. BIOL.