durability test methods for service life … fp.pdf · durability test methods for service life...
TRANSCRIPT

DURABILITY TEST METHODS FOR SERVICE LIFE DESIGN OF CONCRETE STRUCTURES – EXPOSED TO SEMI ARID INDIAN
ENVIRONMENT
V V Arora & Puneet Kaura National Council for Cement and Building Materials, India
ABSTRACT Corrosion is the root cause of downfall of a RCC structure which could be caused by either internal or external agents. Ingress of Carbon dioxide and correspondingly decrease in the alkalinity of concrete matrix is one of the major factor responsible for reinforced concrete structure deterioration in semi arid environment. Such type of reinforced concrete degradation phenomenon plays an important role in form of a corrosive agent. Presently, Concrete structures located in northern and some parts of central India (mainly the semi arid portion) are deeply affected by the carbonation effect. Even the present Indian standard IS 456 had adopted deemed to satisfy approach for durability design of reinforced concrete structures. Such type of approach does not allow the structural engineer to design reinforced concrete structures against the phenomenon of carbonation which could be deterring issue for infrastructure in forthcoming decades. The resistance to carbonation could be assessed with the help of ISO 1920 Part 12 which is generally an accelerated form of measuring carbonation depth in concrete. However, this test also takes 84 days after 28 days of curing. The present study lays down emphasis on exploring short term durability test methods either like air permeability and electrical resistivity which could be utilized as a substitute against accelerated carbonation test. The study had been conducted on six w/c (0.36, 040, 0.45, 0.50, 0.55, and 0.60) for three different types of cement- two blended (fly ash based and ggbs based) and other non-blended cement. The purpose of study is to provide such accelerated tools which could be used for the assessment of design service life of concrete structures under semi arid Indian environment. Keywords: Carbonation, Air permeability and electrical Resistivity 1.0 Introduction
Carbonation which is a worldwide accepted phenomenon of reinforced concrete degradation somewhere loosen its significance especially in India primarily because of lack of standardization. Presently, IS 456 is the most accepted standard in the field of concrete durability based upon “deemed to satisfy” approach for the durability design of reinforced concrete structures was unable to provide solution to many of the problems associated with the concrete deterioration. On the contrary, problem of concrete structure deterioration majorily because of carbon dioxide ingression in hot and dry environment of India( semi-arid environment) had seen surge not only in structures constructed in 70s -80s but the present infrastructure on the large scale is also affected by the same[1]. Therefore, it becomes a challenging task for Indian researcher to develop such type of carbonation models / carbonation coefficients which not only applicable in Indian environment but there reliability should be substantial. The term concrete carbonation is a complicit physiochemical process which involves dissolution of the calcium bearing phase in the concrete matrix. The process generally involves dissolution of gaseous CO2 in to aqueous phase and thereby reacting with Ca(OH)2 , CSH and yet unhydrated C3S and C2S. The following reactions take place [2, 3, 4, 5].
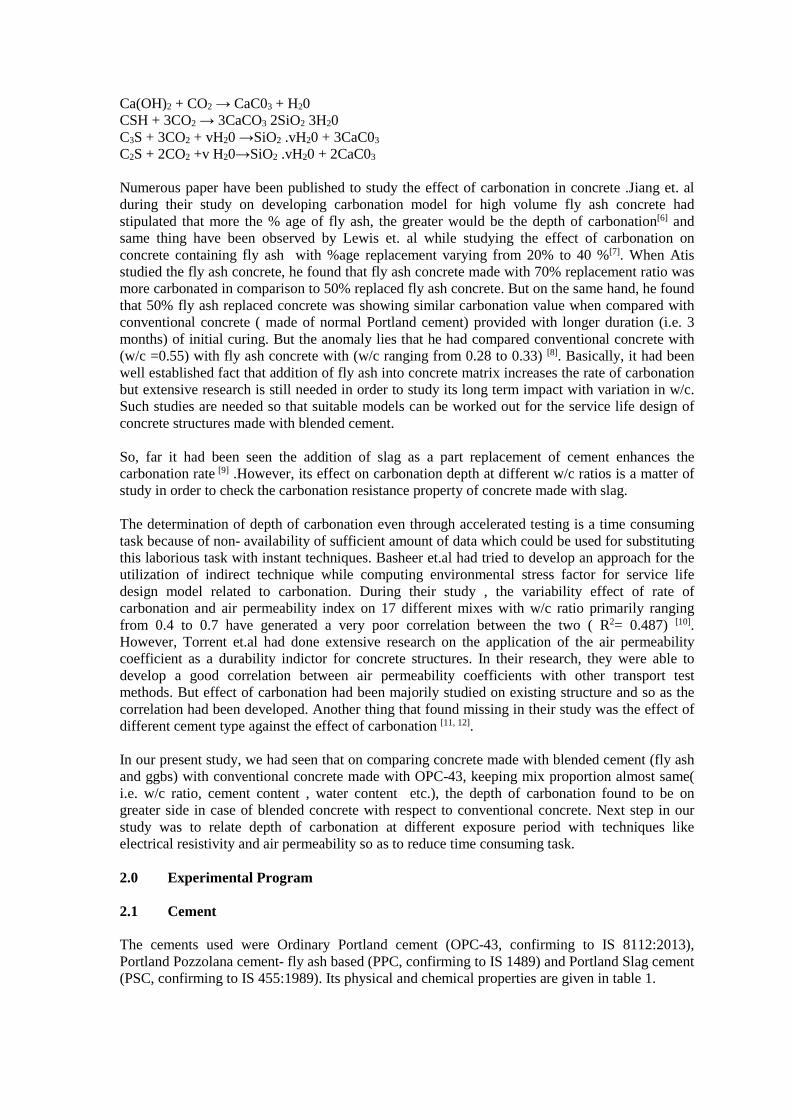
Ca(OH)2 + CO2 → CaC03 + H20 CSH + 3CO2 → 3CaCO3 2SiO2 3H20 C3S + 3CO2 + vH20 →SiO2 .vH20 + 3CaC03 C2S + 2CO2 +v H20→SiO2 .vH20 + 2CaC03 Numerous paper have been published to study the effect of carbonation in concrete .Jiang et. al during their study on developing carbonation model for high volume fly ash concrete had stipulated that more the % age of fly ash, the greater would be the depth of carbonation[6] and same thing have been observed by Lewis et. al while studying the effect of carbonation on concrete containing fly ash with %age replacement varying from 20% to 40 %[7]. When Atis studied the fly ash concrete, he found that fly ash concrete made with 70% replacement ratio was more carbonated in comparison to 50% replaced fly ash concrete. But on the same hand, he found that 50% fly ash replaced concrete was showing similar carbonation value when compared with conventional concrete ( made of normal Portland cement) provided with longer duration (i.e. 3 months) of initial curing. But the anomaly lies that he had compared conventional concrete with (w/c =0.55) with fly ash concrete with (w/c ranging from 0.28 to 0.33) [8]. Basically, it had been well established fact that addition of fly ash into concrete matrix increases the rate of carbonation but extensive research is still needed in order to study its long term impact with variation in w/c. Such studies are needed so that suitable models can be worked out for the service life design of concrete structures made with blended cement. So, far it had been seen the addition of slag as a part replacement of cement enhances the carbonation rate [9] .However, its effect on carbonation depth at different w/c ratios is a matter of study in order to check the carbonation resistance property of concrete made with slag. The determination of depth of carbonation even through accelerated testing is a time consuming task because of non- availability of sufficient amount of data which could be used for substituting this laborious task with instant techniques. Basheer et.al had tried to develop an approach for the utilization of indirect technique while computing environmental stress factor for service life design model related to carbonation. During their study , the variability effect of rate of carbonation and air permeability index on 17 different mixes with w/c ratio primarily ranging from 0.4 to 0.7 have generated a very poor correlation between the two ( R2= 0.487) [10]. However, Torrent et.al had done extensive research on the application of the air permeability coefficient as a durability indictor for concrete structures. In their research, they were able to develop a good correlation between air permeability coefficients with other transport test methods. But effect of carbonation had been majorily studied on existing structure and so as the correlation had been developed. Another thing that found missing in their study was the effect of different cement type against the effect of carbonation [11, 12]. In our present study, we had seen that on comparing concrete made with blended cement (fly ash and ggbs) with conventional concrete made with OPC-43, keeping mix proportion almost same( i.e. w/c ratio, cement content , water content etc.), the depth of carbonation found to be on greater side in case of blended concrete with respect to conventional concrete. Next step in our study was to relate depth of carbonation at different exposure period with techniques like electrical resistivity and air permeability so as to reduce time consuming task. 2.0 Experimental Program 2.1 Cement The cements used were Ordinary Portland cement (OPC-43, confirming to IS 8112:2013), Portland Pozzolana cement- fly ash based (PPC, confirming to IS 1489) and Portland Slag cement (PSC, confirming to IS 455:1989). Its physical and chemical properties are given in table 1.

Table 1: Physical & Chemical Properties of Cement
Sl. No. Properties OPC -43 PPC PSC
(A) Physical Analysis: 1 Blain’s fineness, m2/kg 285 379 346
2 Setting time, minutes Initial Final
240 295
135 205
140 220
3 Compressive strength, N/mm2
3 days 7 days 28 days
34.5 42.5 57.5
30
41.5 55.5
26.5 34.5 49
4 Soundness Autoclave, % Le Chatelier Exp. (mm)
0.07
1
0.07
2
0.05
1 (B) Chemical analysis, % : 1 2 3 4 5 6 7 8 9 10 11 12
Loss of Ignition (LOI) Silica (SiO2) Iron oxide (Fe2O3) Aluminium oxide (Al2O3) Calcium oxide (CaO) Magnesium oxide (MgO) Sulphate (SO3) Alkalies: Na2O K2O Chlorides Ratio of percentage of lime to percentages of silica, alumina and iron oxide, calculated by the formula (CaO - 0.7 SO3) 2.8SiO2+1.2Al2O3+0.65Fe2O3
Ratio of percentage of Alumina to that of Iron oxide Insoluble Residue
5.46 19.94 3.87 4.16 58.56 4.16 2.21
0.43 0.55 0.048
0.9 1.075
2.84
1.85 32.20 3.57 10.84 43.42 4.05 2.21
0.89 0.53 0.001
0.397 3.036
26.64
1.89 27.37 12.01 1.12 47.68 6.60 1.95
0.73 0.47 0.005
0.540 0.093
3.50
2.2 Aggregates The coarse aggregates (20 mm and 10 mm) and the sand (Zone II), confirming to IS 383 had been used in all mix design. Some of the physical properties of aggregates are mentioned in table 2.
Table 2: Physical properties of aggregates Property Sand (Natural) Coarse Aggregate
20 mm 10 mm Specific gravity 2.61 2.83 2.83 Water absorption (%) 0.8 0.40 0.40

2.3 Admixture Super plasticizer normal type confirming to IS 9103 was used in concrete mix design. 2.4 Concrete mix composition The study had been conducted on six water/ cement ratios (0.36, 0.40, 0.45, 0.50, 0.55, and 0.60) with three different type of cement had been used i.e. OPC-43, PPC and PSC, correspondingly resulting into 18 concrete mixes. The concrete mix proportion had been described in table 3 whereas the compressive strength of mixes (in MPa) are mentioned in table 4.
Table 3: Concrete Mix proportion Sr no
w/c ratio
Type of cement
Mix Constituents Air content (%) Cement
(Kg/m3) Sand
(Kg/m3) Coarse
aggregate (Kg/m3)
Water (Kg/m3)
Dose of admixture(%
by Wt of Cement)
1 0.36 OPC-43 444 736 1161 160 0.5 1.2 2 PPC 444 701 1152 160 1 3 3 PSC 444 728 1147 160 1 1.2 4 0.4 OPC-43 400 770 1165 160 0.4 1.5 5 PPC 400 727 1170 160 1 2.9 6 PSC 400 762 1153 160 1 1.1 7 0.45 OPC-43 356 805 1169 160 0.4 2 8 PPC 356 764 1170 160 1 2.1 9 PSC 356 799 1160 160 0.6 1.2 10 0.5 OPC-43 320 837 1167 160 0.35 1.8 11 PPC 320 803 1179 160 1 2 12 PSC 320 831 1158 160 0.6 1.1 13 0.55 OPC-43 300 849 1160 165 0.2 1.7 14 PPC 300 788 1178 165 0.8 2 15 PSC 300 863 1131 165 0.55 1.2 16 0.6 OPC-43 280 863 1155 168 0 2.2 17 PPC 300 801 1130 180 0.4 2 18 PSC 280 877 1127 168 0 1.4
Table 4: Compressive strength (in MPa) at 28days
0.36 0.4 0.45 0.5 0.55 0.6
OPC-43 52.63 45.97 42.33 38.26 33.65 28.06
PPC 59.02 53.65 43.72 37.79 35.16 33.7
PSC 48.64 47.57 34.71 33.48 30.67 28.48
w/c Type of cement

For each concrete mix, a number of concrete beam specimens (100x100x500 mm) and concrete slabs (300x300x100mm) were cast. After 24 hours, the concrete specimens were demoulded and water cured for 28 days. After 28 days of water curing, all the concrete specimens either beams or slabs were shifted to laboratory environment of RH= 65 ± 5 % and temp = 27 ± 2 °C till the age of testing. Concrete beams specimens were employed for carbonation testing whereas concrete slabs were used for determination of electrical resistivity and coefficient of air permeability. 2.5 Accelerated Carbonation Test (ISO 1920 part 12) Carbonation induced corrosion is one of the major issue related to the degradation of the existing infrastructure in semi-arid environment. Therefore, it becomes necessary to measure the carbonation resistance property of concrete [13]. The test is conducted on concrete beam specimen dimension 100x100x500m (No’s=2). After 28 days of water curing, the concrete specimens were shifted to laboratory environment (temperature = 27+ 2oC and Relative humidity = 65+5%) for 62 days. After 62 days of laboratory conditioning, top and bottom longitudinal faces and two end faces of the beam were sealed using paraffin wax and carbonation was allowed on two cast longitudinal faces, in order to prevent multi-directional carbonation. After the sealing, the concrete beam specimens were shifted to the carbonation (4+0.5) %, temperature = 27+ 2oC and relative humidity (65+5%). The carbonation depth was measured by approximately cutting a slice of 50 mm thick from the concrete beam specimen and exposing the cut surface to 1% phenolphthalein solution. The concrete beam specimens were exposed to Carbon dioxide for the following exposure periods: 70 days, 140 days and 210 days. Note: Determination of carbonation depth in case of PSC concrete for different w/c is under progress. 2.6 Electrical Resistivity Electrical resistivity of concrete is a geometry independent property that is used to describe the resistance of concrete against the flow of ions [14]. Four point Wenner probe technique is used to measure the surface resistivity of the concrete slabs (300x300x100mm, Nos =3) at the age of 28 days and 56 days . Principle The outer two electrodes induce the measuring current and the inner electrodes measure the resulting potential drop into the voltage (or vice versa) as shown in Fig 1. The resistance R calculated from the four point measurement could be converted to resistivity ρ using a cell constant based on theoretical considerations by:
ρ= 2*π*a*R Where a is the electrode spacing;

Fig 1:– Sketch of Four –point Wenner method
2.7 Air permeability The torrent permeability tester is an instrument used for determining the air permeability of concrete specimen. Vacuum is created inside the two-chamber vacuum cell which is sealed on the concrete surface by means of a pair of concentric soft rings, creating two separate chambers as shown in Fig 2. At a time between 35 and 60 s valve 2 is closed and the pneumatic system of the inner chamber is isolated from the pump. The air in the pores of the material flows through the cover concrete into the inner chamber, raising its pressure Pi. The rate of pressure rise ∆Pi with time (measurement starts at to =60 s) is directly linked to the coefficient of air permeability of the cover concrete. This test was conducted on the concrete slabs (size = 300x300x100 mm, Nos =3) after 28 days of water curing followed by air curing under laboratory environment for 28 days which includes 3 days pre conditioning in an environmental chamber under a controlled temperature and RH of 50 °C and 80 %, respectively followed by 10 days storage in sealed container at 27 ± 2 ºC. Pre- conditioning of the concrete specimen was required as the air permeability coefficient values were sensitive to moisture conditions. So in order to minimize the effect of moisture, concrete specimens were pre-conditioned. The resultant age at which test was conducted on concrete specimen was 56 days.
Fig 2: Sketch of air-permeability test 3.0 Results and discussions 3.1 Compressive strength and depth of carbonation

Carbonation resistance property of concrete had been studied for exposure periods of 70days, 140 days and 210days and relationship between compressive strength and depth of carbonation is shown in Fig-3, 4, 5.
Fig 3: Compressive strength (28days) vs Carbonation depth (70 days exposure period)
Fig 4: Compressive strength (28days) vs Carbonation depth (140 days exposure period)

Fig 5: Compressive strength (28days) vs Carbonation depth (210 days exposure perio
On perusal of results it was seen that:-
i. The depth of carbonation decreases with increase in compressive strength for all types of concrete.
ii. Concrete made with PPC (flyash blended cement) shows higher depth of carbonation for a given compressive strength in comparison to conventional concrete (made with ordinary Portland cement) for a similar compressive strength value.
iii. The depth of carbonation/rate of carbonation is the function of exposure period. As the exposure period of CO2 increases, on the same path depth of carbonation is also increasing.
iv. From the above graphs it could be seen that the rate of increase of carbonation in PPC concrete was somewhat less in comparison to OPC concrete. However, the depth of carbonation is still higher in PPC concrete.
3.2 w/c and Carbonation depth Effect of water/ cement ratio on carbonation depth for different exposure periods of 70days, 140 days and 201days are shown in Fig -6, 7 and 8
Fig 6: w/c vs Carbonation depth (70 days exposure period)

Fig 7: w/c vs Carbonation depth (140 days exposure period)
Fig 8: w/c vs Carbonation depth (210 days exposure period)
On perusal of results it was seen that:- 1) The depth of carbonation decreases with increase in water /cement ratio for all types of
concrete. 2) Concrete made with PPC (flyash blended cement) shows higher depth of carbonation in
comparison to conventional concrete (made with ordinary Portland cement) and PSC concrete at same water / cement ratios.
3.3 Air permeability and depth of carbonation Air permeability coefficient of concrete generally reflects internal pore structure of a concrete specimen and could be used as a durability indicator [15, 16] Ingress of carbon dioxide into concrete during the accelerated carbonation test and ingress of air into the concrete at the time of determination of air permeability coefficient through torrent air permeability tester both systems involves movement of gas into the concrete matrix. So, it becomes evident to utilize such type of technique for the assessment of concrete resistance property against carbonation.

Fig 6: Air permeability coefficient (56 days) vs Carbonation depth (70 days exposure period)
R2 = 0.9105R2 = 0.9668
0
5
10
15
20
25
30
0.01 0.1 1 10
Air permeability coefficient ( 10-16
m2)
Ca
rbo
na
tio
n d
ep
th (
in m
m)
opc-43
ppc
Fig 7: Air permeability coefficient (56 days) vs Carbonation depth (140 days exposure period)
R2 = 0.9391R
2 = 0.9727
0
5
10
15
20
25
30
0.01 0.1 1 10
Air permeability coefficient ( 10-16
m2)
Ca
rbo
nati
on
de
pth
(in
mm
)
opc-43
ppc
Fig: 8 Air permeability coefficient (56 days) vs Carbonation depth (210 days exposure period)
On perusal of results it was seen that:-

1) Air permeability testing was found to be more apt for conventional concrete made with OPC as wide range of data were made available which could help in specifying range of air permeability coefficient for different carbonation depth requirements for service life of concrete structures.
2) In PPC concrete variation in air permeability coefficient values was less in comparison to OPC concrete.
3) Air permeability coefficient values were significantly affected by the type of cement used in concrete mix. PPC concrete even though having air permeability coefficient value on lower side in comparison to OPC concrete had shown greater depth of carbonation.
3.4 Electrical Resistivity and depth of carbonation Electrical resistivity of concrete serves as a durability indicator for the concrete structures exposed to the coastal environment. This test is mainly associated with the movement of electrical charge into the concrete body and it correlates very well with the chloride diffusion coefficient. However, electrical resistivity of concrete greatly depends upon the pore structure and so as ingress of carbon dioxide. Therefore, a step had been initiated to correlate electrical resistivity and depth of carbonation. In Fig 9, 10, 11, electrical resistivity values determined at the age of 28 days and 56 days which includes 28 days of air curing on same set of concrete specimens which are tested at 28 days is correlated with depth of carbonation obtained for different exposure period.
R2 = 0.9618
R2 = 0.9514
0
2
4
6
8
10
12
14
8 9 10 11 12 13 14
Electrical resistivity (in Kohm-cm)
Ca
rbo
na
tio
n d
ep
th (
in m
m)
opc-43 (28d)
opc-43 (56d)

Fig 9: Electrical Resistivity vs Carbonation depth (70 days exposure period)
R2 = 0.9715
R2 = 0.9703
0
2
4
6
8
10
12
14
16
18
20
8 9 10 11 12 13 14
Electrical resistivity (in Kohm-cm)
Ca
rbo
nati
on
dep
th (
in m
m)
opc-43(28d)
opc-43(56d)
R2 = 0.9104
R2 = 0.9775
0
5
10
15
20
25
30
0 20 40 60 80 100 120
Electrical Resistivity ( in Kohm-cm)
Ca
rbo
na
tio
n d
ep
th (
in m
m)
ppc (28d)
ppc (56d)
Fig 10– Electrical Resistivity) vs Carbonation depth (140 days exposure period)

R2 = 0.8688
R2 = 0.8168
0
5
10
15
20
25
30
8 9 10 11 12 13
Electrical resistivity (in Kohm-cm)
Ca
rbo
na
tio
n d
ep
th (
in m
m)
opc-43(28d)
opc-43 (56d)
R2 = 0.9297
R2 = 0.9967
0
5
10
15
20
25
30
0 20 40 60 80 100 120
Electrical resistivity (in Kohm-cm)
Ca
rbo
na
tio
n d
ep
th (
in m
m)
ppc (28d)
ppc (56d)
Fig 11– Electrical Resistivity vs Carbonation depth (210 days exposure period)
On perusal of results it was seen that:- 1) All the concrete specimens made of PPC shows an increasing trend in term of concrete
resistivity with the passage of time. Micro level changes with in the concrete structure had resulted into a dense geometry in PPC concrete whereas such type of phenomenon was found to be absent in case of conventional concrete made with OPC-43.
2) Pozzolanic reactions are slow in nature. Therefore, it becomes difficult to infer results on the basis of early age resistivity test. A considerable amount of duration is required so as to complete the process of hydration in blended concrete i.e. relationship between electrical resistivity at an age of 56 days is correlating very well with the carbonation depth for different exposure period.
4.0 Conclusion
1) For a given grade of concrete and a given duration of curing, the depth of carbonation not
only increase with the increase in the exposure period to CO2 .it is found to be on higher side with concrete made up of PPC cement irrespective of the exposure period.
2) The rate of increase of carbonation in PPC concrete was somewhat less in comparison to OPC concrete. However, the depth of carbonation is still higher in PPC concrete.
3) There is good correlation between w/c and carbonation depth for a given set of materials. 4) Techniques like air permeability and electrical resistivity have huge potential as a
replacement to accelerated carbonation test method but everything comes with an element of caution such as these are sensitive towards the conditioning requirement.

5) Further research work has to be done to obtain more data in order to further enhance the correlations so developed and to study the effect of different environmental conditions.
References
1. VV Arora and Satish Sharma, Service life design- field studies and laboratory studies, Fourth fib –congress 2014, Mumbai.
2. Thomas P.hill, Fabina Gordon, Nicholos H. Florrin, Paul S. Fennell, Statistical analysis of the carbonation rate of concrete, Cement and concrete Research 72 (2015) 98-107.
3. M.Thiery, G.Villian, P.Dangla and G.Platret, Investigation of the carbonation front shape on cementitious materials: Effects of the chemical kinetics, Cement and Concrete Research 37(2007)1047-1058.
4. Peter A Claisse, Hanaa I Elsayad and Ibrahim G Shaaban., Permeability and Pore volume of carbonated concrete
5. Y.Zhou, B.Gencturk, K .Willam and A.Attar, Carbonation –induced and chloride induced corrosion in Reinforced concrete structures, ASCE September 2014.
6. linhua Jiang ,BAoyu Lin ,Yuebeo Cai , A model for predicting carbonation of high volume fly ash concrete ,Cement and Concrete Research 30(2000)699-702.
7. D.W.S.Ho and R.K Lewis, Carbonation of concrete and its prediction, Cement and Concrete Research 17(1987) 489-504.
8. Cengiz Duran Atis, Accelerated carbonation and testing of concrete made with fly ash, Construction and Building materials 17(2003)147-152.
9. Irene. K, Ryah D and Steven M. Cramer,Effect of Ground Granulated blast furnace slagin Portland Cement concrete(PCC)-Expanded study, Wisconsin Highway Research Program.
10. P.A.M Basheer, D.P Russell and G.I.B Rankin, Design of concrete to resist carbonation, Durability of Building materials and components8 .(1999)423-435.
11. Luis Ebensperger and Roberto Torrent, Concrete air permeability “in situ tests”: status quo,Revista Ingenieria de Constuccion Vol25 December 2010.
12. E. Denariè, F. Jacobs, A. Leeman, T. Teruzzi and R. Torrent, Specification and site control of the permeability of the cover concrete: the Swiss approach.
13. ISO 1920 Part 12, Determination of carbonation resistance of concrete-accelerated carbonation tests.
14. RELIM Recommendation, Test method for on site measurement of resistivity of concrete, Materials and structures Vol 33 December 2000.
15. VV Arora and Puneet Kaura, Durability Testing of blended cement- Relationship between accelerated tests and long term tests” in 2 nd ICDC, New Delhi.
16. Kropp J and Hilsdorf H.K, Performance criteria for Concrete Durability. RELIM Report 12.
17. ISO/FDIS 16204 “Durability — Service life design of concrete structures”.