dundee corporation 2012 first quarter report · processes for the extraction of base metals and...
TRANSCRIPT

DUNDEE CORPORATION
2012 FIRST QUARTER REPORT

DDD UUU NNN DDD EEE EEE CCC OOO RRR PPP OOO RRR AAATTT III OOO NNN
MMM aaa nnn aaa ggg eee mmm eee nnn ttt ’’’ sss DDD iii sss ccc uuu sss sss iii ooo nnn aaa nnn ddd AAA nnn aaa lll yyy sss iii sss Dundee Corporation (the “Corporation” or “Dundee Corporation”) is an independent publicly traded Canadian asset management company. The Corporation is listed on the Toronto Stock Exchange (“TSX”) under the symbol “DC.A”. Asset management activities are focused in the areas of the Corporation’s core competencies and include real estate and infrastructure, energy and resources and, more recently, the agriculture sector. These activities are carried out by the Corporation’s subsidiary, Ned Goodman Investment Counsel Limited (“NGIC”), a registered portfolio manager and exempt market dealer across Canada and an investment fund manager in the province of Ontario, and by Dundee Real Estate Asset Management (“DREAM”), the asset management division of Dundee Realty Corporation (“Dundee Realty”), the Corporation’s real estate operating subsidiary. The asset management activities of NGIC and DREAM are supported by the Corporation’s ownership in Dundee Capital Markets Inc. (“Dundee Capital Markets”), which is also the asset manager of Dundee Corporation’s flow-through limited partnership business carried out through the “CMP”, “CDR” and “Canada Dominion Resources” brands. Dundee Corporation also owns and manages direct investments in these core focus areas, through ownership of both publicly listed and private companies. Real estate operations are carried out through Dundee Realty, an owner, developer and manager of residential, commercial and recreational properties in North America and Europe. Real estate operations are complemented by the Corporation’s 29% interest in Dundee International Real Estate Investment Trust (“Dundee International REIT”), an unincorporated open-ended real estate development trust that invests in commercial property exclusively outside of Canada, as well as a 6% interest in Dundee Real Estate Investment Trust (“Dundee REIT”), a Canadian real estate investment trust. Energy and resource operations include the Corporation’s ownership in Dundee Energy Limited (“Dundee Energy”) (formerly Eurogas Corporation), an oil and natural gas company with a mandate to create long-term value through the development of high impact energy projects. The Corporation also holds several other investments in the resource sector for which it applies the equity method of accounting. Agricultural activities are carried out through a newly formed entity, Dundee Agricultural Corporation (“Dundee Agricultural”). In the fourth quarter of 2011, Dundee Agricultural acquired an 81% interest in Blue Goose Capital Corporation (“Blue Goose”), a privately-owned Canadian company with a leading position in the organic and natural beef production market with operations in both British Columbia and Ontario. This Management’s Discussion and Analysis (“MD&A”) has been prepared with an effective date of May 15, 2012 and provides an update on matters discussed in, and should be read in conjunction with the Corporation’s audited consolidated financial statements as at and for the year ended December 31, 2011 (the “2011 Audited Consolidated Financial Statements”) and the unaudited condensed interim consolidated financial statements as at and for the three months ended March 31, 2012 (the “March 2012 Interim Consolidated Financial Statements”), prepared using International Financial Reporting Standards (“IFRS”). All amounts are in Canadian dollars unless otherwise specified. Tabular dollar amounts, unless otherwise specified, are in thousands of dollars, except for per share amounts.
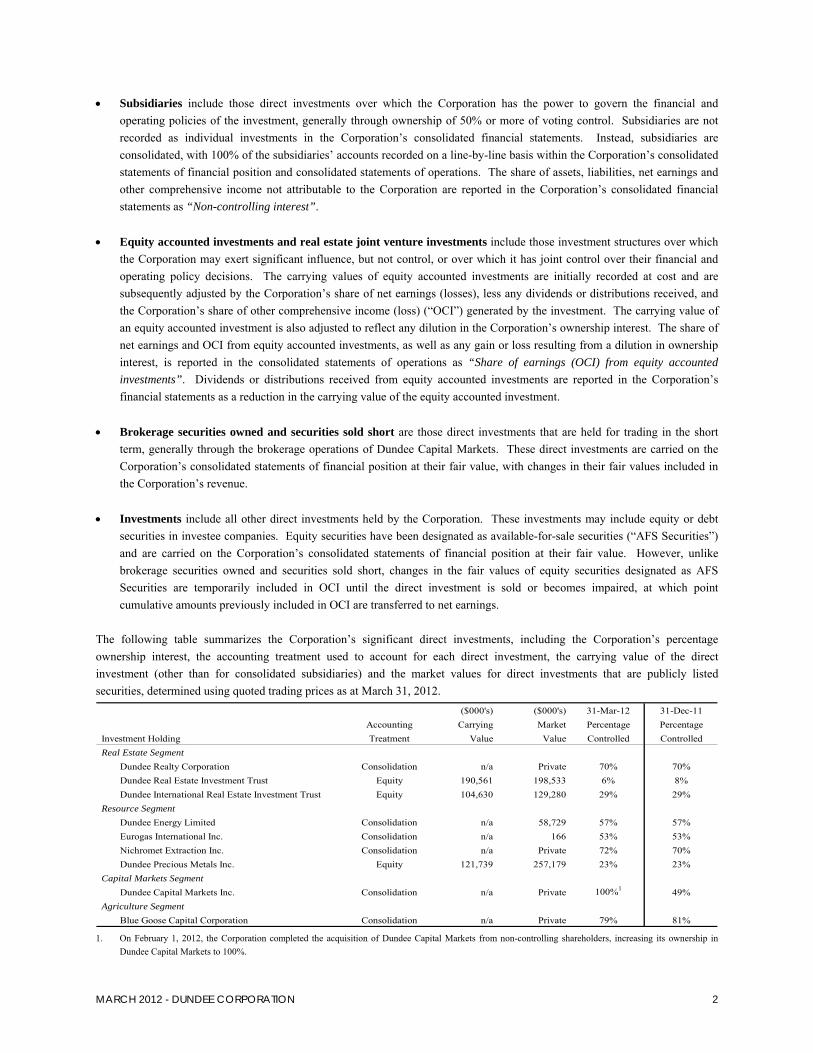
BASIS OF PRESENTATION The ownership structure of the Corporation’s direct investments is significantly diverse. These variations in ownership structure often result in differences in the method of accounting for such investments.
MARCH 2012 - DUNDEE CORPORATION 2
• Subsidiaries include those direct investments over which the Corporation has the power to govern the financial and operating policies of the investment, generally through ownership of 50% or more of voting control. Subsidiaries are not recorded as individual investments in the Corporation’s consolidated financial statements. Instead, subsidiaries are consolidated, with 100% of the subsidiaries’ accounts recorded on a line-by-line basis within the Corporation’s consolidated statements of financial position and consolidated statements of operations. The share of assets, liabilities, net earnings and other comprehensive income not attributable to the Corporation are reported in the Corporation’s consolidated financial statements as “Non-controlling interest”.
• Equity accounted investments and real estate joint venture investments include those investment structures over which
the Corporation may exert significant influence, but not control, or over which it has joint control over their financial and operating policy decisions. The carrying values of equity accounted investments are initially recorded at cost and are subsequently adjusted by the Corporation’s share of net earnings (losses), less any dividends or distributions received, and the Corporation’s share of other comprehensive income (loss) (“OCI”) generated by the investment. The carrying value of an equity accounted investment is also adjusted to reflect any dilution in the Corporation’s ownership interest. The share of net earnings and OCI from equity accounted investments, as well as any gain or loss resulting from a dilution in ownership interest, is reported in the consolidated statements of operations as “Share of earnings (OCI) from equity accounted investments”. Dividends or distributions received from equity accounted investments are reported in the Corporation’s financial statements as a reduction in the carrying value of the equity accounted investment.
• Brokerage securities owned and securities sold short are those direct investments that are held for trading in the short
term, generally through the brokerage operations of Dundee Capital Markets. These direct investments are carried on the Corporation’s consolidated statements of financial position at their fair value, with changes in their fair values included in the Corporation’s revenue.
• Investments include all other direct investments held by the Corporation. These investments may include equity or debt
securities in investee companies. Equity securities have been designated as available-for-sale securities (“AFS Securities”) and are carried on the Corporation’s consolidated statements of financial position at their fair value. However, unlike brokerage securities owned and securities sold short, changes in the fair values of equity securities designated as AFS Securities are temporarily included in OCI until the direct investment is sold or becomes impaired, at which point cumulative amounts previously included in OCI are transferred to net earnings.
The following table summarizes the Corporation’s significant direct investments, including the Corporation’s percentage ownership interest, the accounting treatment used to account for each direct investment, the carrying value of the direct investment (other than for consolidated subsidiaries) and the market values for direct investments that are publicly listed securities, determined using quoted trading prices as at March 31, 2012.
($000's) ($000's) 31-Mar-12 31-Dec-11Accounting Carrying Market Percentage Percentage
Investment Holding Treatment Value Value Controlled ControlledReal Estate Segment
Dundee Realty Corporation Consolidation n/a Private 70% 70%Dundee Real Estate Investment Trust Equity 190,561 198,533 6% 8%Dundee International Real Estate Investment Trust Equity 104,630 129,280 29% 29%
Resource SegmentDundee Energy Limited Consolidation n/a 58,729 57% 57%Eurogas International Inc. Consolidation n/a 166 53% 53%Nichromet Extraction Inc. Consolidation n/a Private 72% 70%Dundee Precious Metals Inc. Equity 121,739 257,179 23% 23%
Capital Markets SegmentDundee Capital Markets Inc. Consolidation n/a Private 100%1 49%
Agriculture SegmentBlue Goose Capital Corporation Consolidation n/a Private 79% 81%
1. On February 1, 2012, the Corporation completed the acquisition of Dundee Capital Markets from non-controlling shareholders, increasing its ownership in Dundee Capital Markets to 100%.
MARCH 2012 - DUNDEE CORPORATION 3
Performance Measures (in alphabetical order) The Corporation believes that important measures of operating performance, including the operating performance of its subsidiaries, include certain performance measures that are not defined under IFRS and as such, may not be comparable to similar performance measures used by other companies. Throughout this MD&A, there will be references to certain performance measures which management believes are relevant in assessing the economics of its business. While these performance measures are not formally recognized by IFRS, the Corporation believes that they are informative and provide further insight as supplementary measures to net earnings and cash flows. • “AUA” or “Assets under Administration” represent the approximate period-end market value of client assets
administered by Dundee Capital Markets’ brokerage subsidiary and in respect of which the subsidiary earns commission revenue and other similar fees from clients. AUA are not included in the Corporation’s consolidated statements of financial position.
• “AUM” or “Assets under Management” represent the period-end market value of client assets managed by the
Corporation’s capital markets and asset management subsidiaries on a discretionary basis and in respect of which these subsidiaries earn management fee revenue and, in certain cases, performance fee revenue. AUM are not included in the Corporation’s consolidated statements of financial position.
• “Barrel of Oil Equivalent” or “boe” is calculated at a barrel of oil conversion ratio of six thousand cubic feet (“Mcf”) of
natural gas to one barrel (“bbl”) of oil (6 Mcf to 1 bbl), based on an energy equivalency conversion method which is primarily applicable at the burner tip and does not always represent a value equivalency at the wellhead.
• “Contribution Margin” or “Margins” is an important measure of earnings in each business segment and generally
represents core revenue less cost of sales, and excludes related general and administrative expenses, depreciation and depletion, interest expense, and income taxes.
• “Field Level Cash Flows” is calculated as revenue from oil and natural gas sales, less royalties and cost of sales. Field
level cash flows contribute to the funding of the Corporation’s working capital, including debt management, as well as to the funding of capital expenditure requirements for these activities.
• “Field Netbacks” refers to field level cash flows expressed on a measurement unit or barrel of oil equivalent basis. • “Per Day Amount” or (“/d”) is used throughout this MD&A to reflect oil and gas production volumes on an average per
day basis. • “Probable Reserves” are those additional reserves that are less certain to be recovered than proved reserves. It is equally
likely that the actual remaining quantities recovered will be greater or less than the sum of the estimated proved plus probable reserves.
• “Proved Reserves” are those reserves that can be estimated with a high degree of certainty to be recoverable. It is likely
that the actual remaining quantities recovered will exceed the estimated proved reserves. • “Reserve Life Index” is determined by dividing proved reserves by expected annual production. For greater certainty, the
reserve life index includes only proved reserves and does not include probable or possible reserves.
MARCH 2012 - DUNDEE CORPORATION 4
OPERATING SEGMENTS
Real Estate The Corporation’s real estate segment includes the operating activities of Dundee Realty, one of Canada’s leading, privately owned real estate companies. The scope of Dundee Realty’s business includes residential land development, housing and condominium development, and residential and commercial property ownership across Canada and in the United States. The Corporation also invests directly in public real-estate based companies, including its 29% interest in Dundee International REIT, its 6% interest in Dundee REIT, and its 22% interest in 360 VOX Corporation. Additional information regarding these direct investments may be accessed at www.dundeeinternational.com, www.dundeereit.com and www.360vox.com, respectively. Resource Operating activities in the resource segment are carried out through Dundee Energy (www.dundee-energy.com), a company involved in oil and gas production in Ontario and the development of a natural gas storage facility in Spain, and through Eurogas International Inc. (“EII”) (www.eurogasinternational.com), a company which carries out oil and gas exploration and evaluation activities in Tunisia. The Corporation also holds a direct investment in Nichromet Extraction Inc. (“Nichromet”), (www.nichromet.com), an exploration and development stage company. Nichromet has developed proprietary metallurgical processes for the extraction of base metals and precious metals, which are in the testing phase. The Corporation’s 23% interest in Dundee Precious Metals Inc. (“Dundee Precious”) (www.dundeeprecious.com), which is accounted for on an equity basis, is also included in the resource segment. Agriculture The agriculture segment consists of the business activities of Dundee Agricultural, a wholly-owned subsidiary of the Corporation. Operating activities in the agriculture segment are carried out by the Corporation’s 79% interest in Blue Goose, a company involved in organic and natural beef production. Blue Goose owns in excess of 10,000 acres of deeded land and approximately 700,000 acres of leased land in British Columbia and Ontario, Canada. Asset Management The asset management segment includes the activities undertaken by NGIC and DREAM. At March 31, 2012, NGIC and DREAM provided sub-advisory and investment services to approximately $9.8 billion of AUM. NGIC also provides investment services in respect of the Corporation’s direct investments, which include both publicly traded and private companies in a variety of industry sectors, as well as liquid securities such as mutual funds. The asset management segment also includes general corporate overhead costs, as well as interest and debt servicing costs, to the extent that such costs have not been specifically allocated to any other operating segment.
Capital Markets Dundee Capital Markets’ core activities consist of investment banking, institutional equity sales and trading and equity research. Dundee Capital Markets has aligned its principal focus into specific sector coverage including resources, real estate and infrastructure, diversified industries and special situations, complementing the core focus areas of the Corporation’s asset management activities. Dundee Capital Markets is also the manager of certain flow-through resource limited partnership investment management products carried out through the “CMP”, “CDR” and “Canada Dominion Resources” brands.

MARCH 2012 - DUNDEE CORPORATION 5
DEVELOPMENTS IN THE FIRST QUARTER OF 2012 • Completed the purchase of non-controlling interest in Dundee Capital Markets, giving the
Corporation 100% ownership interest • Continued expansion into the agriculture sector with a second anchor investment in fisheries • Assets under management and administration increased over 11% to $13.7 billion
Acquisition of Dundee Capital Markets Inc. The Corporation, together with senior management of Dundee Capital Markets concluded that, for a number of reasons, Dundee Capital Markets should not operate as an independent, publicly traded investment dealer. In their respective views, the cyclical nature of the capital markets business and the need for substantial amounts of continuing capital, coupled with the competitive landscape, would invariably cause the common shares of Dundee Capital Markets to underperform in the marketplace. As a result, in December 2011, the Corporation began negotiations with Dundee Capital Markets that would have Dundee Corporation purchase the interest of non-controlling investors in Dundee Capital Markets in order to take the company private. On February 1, 2012, the Corporation successfully completed the acquisition of all outstanding common shares of Dundee Capital Markets that it did not already own for cash of $1.125 per share, by way of a court approved plan of arrangement under the Business Corporations Act (Ontario). Total cash paid for completion of the transaction was $88.0 million. Expansion into the Agriculture Sector Guided by its strategy to seek tangible investment assets that retain their capital value and generate tax-efficient returns, in late 2011 the Corporation created Dundee Agricultural, a wholly-owned subsidiary, to focus on sustainable agricultural investment opportunities across Canada and globally. In December 2011, Dundee Agricultural moved ahead with an anchor investment in the sector by acquiring a majority stake in Blue Goose, the 100% owners of The Blue Goose Cattle Company Ltd. Blue Goose is an unlisted, privately owned Canadian agricultural corporation with exposure to organic and natural beef production and marketing, as well as extensive cattle ranch acreage and farmland ownership. Under its stewardship, it has over 700,000 acres of deeded, leased and licensed grazing land, as well as one of the largest organic cattle herds in North America. In March 2012, the Corporation expanded its portfolio in the agricultural sector through the acquisition of a 14% interest in Agrimarine Holdings Inc. (“Agrimarine”), a Canadian publicly traded company operating in the fisheries sector. Agrimarine has developed a new farm management system, with the intent of providing solutions to the issues facing the fish farming industry. Agrimarine is currently commercializing its proprietary technology for the rearing of finfish, specifically salmon, trout, yellow croaker and potentially other species such as tuna, in order to satisfy the global demand for sustainable seafood production. The company is assessing the economics of its technology in freshwater at its fish rearing facility in China, where successful rearing, harvesting and sales to the market are currently occurring. More recently, Agrimarine deployed a commercial pilot at its Campbell River facility in British Columbia, with the intent of proving the economics and viability of its systems in a marine environment. Growth in AUA and AUM The Corporation continues to grow its asset management base, with AUA and AUM increasing to $13.7 billion at March 31, 2012, an increase of 11% over AUA and AUM of $12.3 billion at December 31, 2011. A significant part of this growth occurred in the real estate segment, including growth of approximately $1.6 billion from new acquisitions.

MARCH 2012 - DUNDEE CORPORATION 6
SELECTED CONSOLIDATED FINANCIAL INFORMATION OF DUNDEE CORPORATION
For the three months ended March 31, 2012 2011Net earnings (loss) before income taxes from: Real estate segment 12,885$ 11,723$ Resource segment 781 7,258 Agriculture segment (716) - Asset management segment 33,735 (1,523) Capital markets segment 3,765 5,253
50,450 22,711 Income taxes (14,911) (5,022) Discontinued operations: Loss, net of taxes - (20,000) Gain on sale of discontinued operations, net of taxes - 870,828 Net earnings for the period 35,539$ 868,517$ Net earnings attributable to:Owners of the parent Continuing operations 32,461$ 14,164$ Discontinued operations - 861,158 Non-controlling interest 3,078 (6,805)
35,539$ 868,517$
CONSOLIDATED RESULTS OF OPERATIONS
Consolidated Net Earnings Net earnings from continuing operations for the three months ended March 31, 2012 attributable to owners of the Corporation were $32.5 million, representing approximately $0.53 per share on a fully diluted basis. This compares to net earnings from continuing operations attributable to owners of the Corporation earned in the first quarter of the prior year of $14.2 million or $0.17 per share on a fully diluted basis. Net earnings in the first quarter of the prior year also included $861.2 million from discontinued operations, including a gain of $870.8 million relating to the Corporation’s divestment of its 48% interest in DundeeWealth Inc. (“DundeeWealth”) which was completed on February 1, 2011 and which is further described in Note 6 to the 2011 Audited Consolidated Financial Statements. A more detailed analysis of net earnings on a segmented basis, and a discussion of the key variables affecting net earnings, is provided under the section entitled “Segmented Results of Operations”. Equity Accounted Investments including Real Estate Joint Venture Investments
For the three months ended March 31, 2012Carrying value of equity accounted investments, beginning of period 477,093$ Transactions during the period
Cash invested in equity accounted investments 16,144 Distributions received, net of reinvestments (5,237) Share of earnings from equity accounted investments 10,630 Share of other comprehensive loss from equity accounted investments (5,260) Disposition (694) Other (129)
Carrying value of equity accounted investments, end of period 492,547$ A detailed discussion of operating results of significant equity accounted investments is presented under “Segmented Results of Operations”.

MARCH 2012 - DUNDEE CORPORATION 7
At March 31, 2012, the carrying value of the Corporation’s portfolio of equity accounted investments was $492.5 million, an increase of $15.4 million over a carrying value of $477.1 million at December 31, 2011. Included in the increase were $16.1 million of new investments, including the Corporation’s $12.9 million participation in a public offering of Dundee REIT units (see “Real Estate Segment – Equity Accounted Investments in the Real Estate Sector”) which was completed during the quarter. In the three months ended March 31, 2012, the Corporation’s share of earnings from these investments was $10.6 million (three months ended March 31, 2011 - $15.3 million) and it recognized its share of other comprehensive losses of $5.3 million (three months ended March 31, 2011 - $4.9 million). The market value of equity accounted investments as at March 31, 2012, was $654.3 million (December 31, 2011 - $617.0 million).
March 31, 2012 December 31, 2011Trade Carrying Fair Carrying FairSymbol Ref Investment Ownership Value Value Ownership Value ValueD.UN Dundee Real Estate Investment Trust 6% 190,561$ 198,533$ 8% 174,577$ 172,519$ DPM Dundee Precious Metals Inc. 23% 121,739 257,179 23% 125,041 250,554 DI.UN 1 Dundee International Real Estate Investment Trust 29% 104,630 129,280 29% 103,983 126,848 RYG Ryan Gold Corp. (formerly Valdez Gold Inc.) 12% 13,780 8,077 12% 13,830 9,191 VOX 360 VOX Corporation 22% 5,671 5,523 23% 6,053 5,283 CRG Corona Gold Corporation 26% 4,789 3,182 26% 5,123 2,834 ODX Odyssey Resources Limited 31% 569 1,705 31% 569 1,819 - 2 Escal UGS S.L. 33% - - 33% - - - 3 Real Estate Joint Venture n/a 50,808 50,808 n/a 47,917 47,917
492,547$ 654,287$ 477,093$ 616,965$ 1. Part of the Corporation’s 29% interest in Dundee International REIT is held through Dundee Realty, the Corporation’s 70% owned subsidiary, giving Dundee
Corporation an effective 27.3% interest in Dundee International REIT. 2. The Corporation’s 33% interest in Escal UGS S.L. (“Escal”) is held through Dundee Energy’s 74% owned subsidiary, Castor UGS Limited Partnership, giving
Dundee Energy an effective 25% interest in Escal. Escal’s market value has been determined based on the Corporation’s carrying value. 3. The market value of real estate joint ventures has been determined based on the Corporation’s carrying value. Other Direct Investments Despite turmoil in Europe over rising sovereign debt levels, Canada’s banks continued to perform well in 2011, with banks posting their third consecutive year of higher earnings after the 2008 global financial crisis. Reflecting these market conditions, the fair value of the Corporation’s portfolio of investments increased by $143.9 million during the first quarter of 2012, including an increase of $93.1 million in the Corporation’s investment in shares of The Bank of Nova Scotia (“Scotiabank”) which it received as partial consideration for its divestment of DundeeWealth. At March 31, 2012, the fair value of the Corporation’s investment portfolio, excluding its investments in equity accounted entities, was $1.6 billion, including $1.1 billion in shares of Scotiabank.
For the three months ended March 31, 2012Fair value of investments, beginning of period 1,484,969$ Transactions during the three months ended March 31, 2012
New investments 42,525 Proceeds from sales of investments (77,159) Changes in fair values of AFS securities 143,850 Other transactions (29)
Fair value of investments, end of period 1,594,156$ Represented by:
Publicly traded securities 1,326,422$ Private investments 157,587 Mutual funds and other short term investments 6,752 Debt securities (at amortized cost) 103,395
1,594,156$ In the current quarter, the Corporation invested a total of $42.5 million in its investment portfolio, with a focus primarily in the resource and agricultural sectors. New investments were funded using proceeds on dispositions of other investments, which totalled $77.2 million in the three months ended March 31, 2012, including the $74.0 million of proceeds from the sale of shares of Scotiabank.

MARCH 2012 - DUNDEE CORPORATION 8
STATEMENTS OF SEGMENTED RESULTS OF OPERATIONS
(in thousands of dollars) 2012Asset Capital
For the three months ended March 31, 2012 Real Estate Resource Agriculture Management Markets Intersegment TOTALREVENUES
Management fees -$ -$ -$ 16,282$ 3,357$ (1,415)$ 18,224$ Financial services - - - 23 32,531 - 32,554 Real estate 57,643 - - - - - 57,643 Oil and gas, net of royalties - 8,074 - - - - 8,074 Agriculture - - 1,201 - - - 1,201 Interest and dividends - 41 - 12,564 1,649 (667) 13,587
57,643 8,115 1,201 28,869 37,537 (2,082) 131,283 COST OF SALES
Variable compensation - - - - (17,849) - (17,849) Real estate expenses (48,968) - - - - 1,020 (47,948) Oil and gas expenses - (3,045) - - - - (3,045) Agriculture expenses - - (1,650) - - - (1,650)
(48,968) (3,045) (1,650) - (17,849) 1,020 (70,492) Depreciation and depletion (600) (3,761) (67) (656) (644) - (5,728) General and administrative (1,870) (3,854) (1,187) (9,876) (15,166) 395 (31,558) Realized gains from investments - - - 21,576 - - 21,576 Share of earnings from equity accounted investments 7,456 3,174 - - - - 10,630 Loss on sale of equity accounted investment (71) - - - - - (71) Fair value changes in investment properties 2,004 - - - - - 2,004 Fair value changes in livestock - - 987 - - - 987 Gain (loss) on derivative financial instruments - 1,260 - (540) - - 720 Interest expense (2,709) (1,085) - (5,509) (81) 667 (8,717) Foreign exchange loss - (23) - (129) (32) - (184) NET EARNINGS (LOSS) BEFORE NON-SEGMENTED ITEMS 12,885 781 (716) 33,735 3,765 - 50,450 Income taxes (14,911) NET EARNINGS (LOSS) FOR THE PERIOD FROM CONTINUING OPERATIONS 12,885 781 (716) 33,735 3,765 - 35,539 DISCONTINUED OPERATIONS -
12,885$ 781$ (716)$ 33,735$ 3,765$ -$ 35,539$ NET EARNINGS (LOSS) ATTRIBUTABLE TO:Owners of the parent 9,078$ 1,360$ (566)$ 33,735$ 3,765$ -$ 32,461$ Non-controlling interest 3,807 (579) (150) - - - 3,078
12,885$ 781$ (716)$ 33,735$ 3,765$ -$ 35,539$
(in thousands of dollars) 2011Asset Capital
For the three months ended March 31, 2011 Real Estate Resource Agriculture Management Markets Intersegment TOTALREVENUES
Management fees -$ -$ -$ 8,124$ 4,696$ (1,368)$ 11,452$ Financial services - - - 1,452 32,117 - 33,569 Real estate 49,113 - - - - - 49,113 Oil and gas, net of royalties - 8,072 - - - - 8,072 Agriculture - - - - - - - Interest and dividends - 68 - 14,926 1,249 (629) 15,614
49,113 8,140 - 24,502 38,062 (1,997) 117,820 COST OF SALES
Variable compensation - - - - (19,158) - (19,158) Real estate expenses (36,563) - - - - 840 (35,723) Oil and gas expenses - (2,898) - - - - (2,898) Agriculture expenses - - - - - - -
(36,563) (2,898) - - (19,158) 840 (57,779) Depreciation and depletion (549) (3,459) - (604) (238) - (4,850) General and administrative (2,096) (3,026) - (23,575) (13,413) 528 (41,582) Realized gains from investments - - - 2,290 - - 2,290 Share of earnings from equity accounted investments 4,167 11,093 - - - - 15,260 Loss on sale of equity accounted investment - - - - - - - Fair value changes in investment properties 442 - - - - - 442 Fair value changes in livestock - - - - - - - Loss on derivative financial instruments - (1,391) - (804) - - (2,195) Interest expense (2,791) (1,091) - (3,216) - 629 (6,469) Foreign exchange loss - (110) - (116) - - (226) NET EARNINGS (LOSS) BEFORE NON-SEGMENTED ITEMS 11,723 7,258 - (1,523) 5,253 - 22,711 Income taxes (5,022) NET EARNINGS (LOSS) FOR THE PERIOD FROM CONTINUING OPERATIONS 11,723 7,258 - (1,523) 5,253 - 17,689 DISCONTINUED OPERATIONS 850,828
11,723$ 7,258$ -$ (1,523)$ 5,253$ -$ 868,517$ NET EARNINGS (LOSS) ATTRIBUTABLE TO:Owners of the parent 8,773$ 8,671$ -$ (1,523)$ 3,265$ -$ 875,322$ Non-controlling interest 2,950 (1,413) - - 1,988 - (6,805)
11,723$ 7,258$ -$ (1,523)$ 5,253$ -$ 868,517$
MARCH 2012 - DUNDEE CORPORATION 9
SEGMENTED RESULTS OF OPERATIONS Three months ended March 31, 2012 compared with the three months ended March 31, 2011
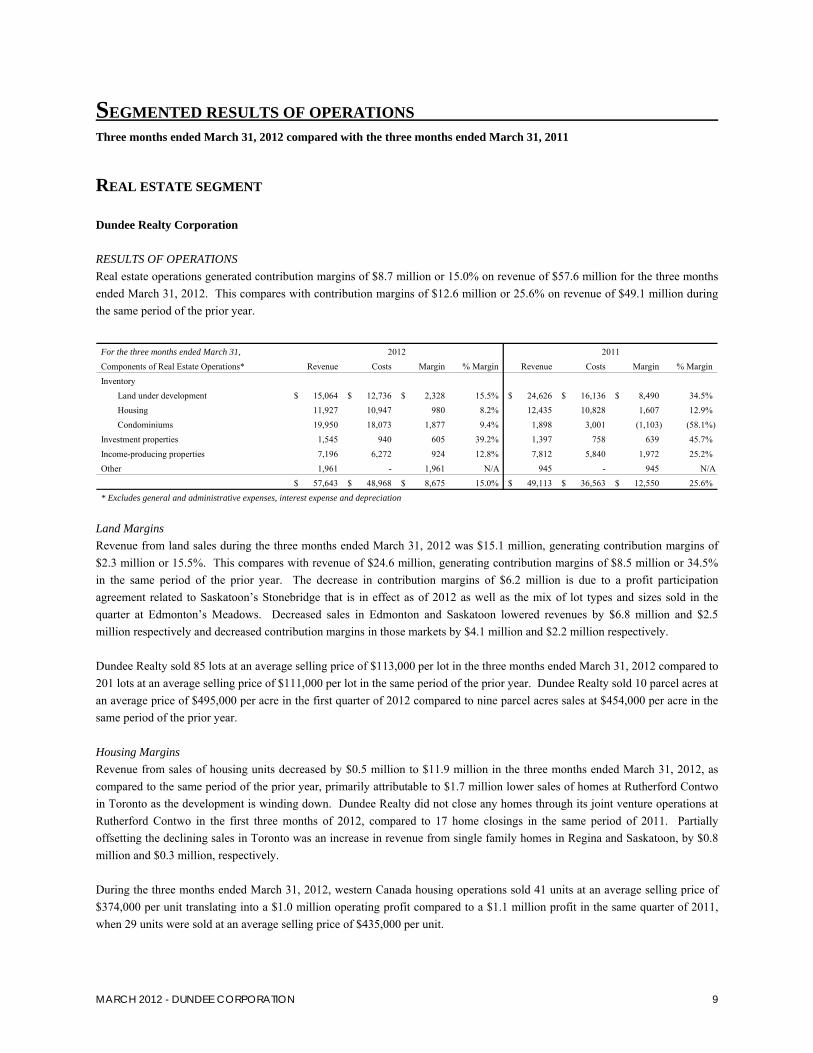
REAL ESTATE SEGMENT Dundee Realty Corporation RESULTS OF OPERATIONS Real estate operations generated contribution margins of $8.7 million or 15.0% on revenue of $57.6 million for the three months ended March 31, 2012. This compares with contribution margins of $12.6 million or 25.6% on revenue of $49.1 million during the same period of the prior year.
For the three months ended March 31, Components of Real Estate Operations* Revenue Costs Margin % Margin Revenue Costs Margin % MarginInventory
Land under development 15,064$ 12,736$ 2,328$ 15.5% 24,626$ 16,136$ 8,490$ 34.5%Housing 11,927 10,947 980 8.2% 12,435 10,828 1,607 12.9%Condominiums 19,950 18,073 1,877 9.4% 1,898 3,001 (1,103) (58.1%)
Investment properties 1,545 940 605 39.2% 1,397 758 639 45.7%Income-producing properties 7,196 6,272 924 12.8% 7,812 5,840 1,972 25.2%Other 1,961 - 1,961 N/A 945 - 945 N/A
57,643$ 48,968$ 8,675$ 15.0% 49,113$ 36,563$ 12,550$ 25.6%* Excludes general and administrative expenses, interest expense and depreciation
2012 2011
Land Margins Revenue from land sales during the three months ended March 31, 2012 was $15.1 million, generating contribution margins of $2.3 million or 15.5%. This compares with revenue of $24.6 million, generating contribution margins of $8.5 million or 34.5% in the same period of the prior year. The decrease in contribution margins of $6.2 million is due to a profit participation agreement related to Saskatoon’s Stonebridge that is in effect as of 2012 as well as the mix of lot types and sizes sold in the quarter at Edmonton’s Meadows. Decreased sales in Edmonton and Saskatoon lowered revenues by $6.8 million and $2.5 million respectively and decreased contribution margins in those markets by $4.1 million and $2.2 million respectively. Dundee Realty sold 85 lots at an average selling price of $113,000 per lot in the three months ended March 31, 2012 compared to 201 lots at an average selling price of $111,000 per lot in the same period of the prior year. Dundee Realty sold 10 parcel acres at an average price of $495,000 per acre in the first quarter of 2012 compared to nine parcel acres sales at $454,000 per acre in the same period of the prior year. Housing Margins Revenue from sales of housing units decreased by $0.5 million to $11.9 million in the three months ended March 31, 2012, as compared to the same period of the prior year, primarily attributable to $1.7 million lower sales of homes at Rutherford Contwo in Toronto as the development is winding down. Dundee Realty did not close any homes through its joint venture operations at Rutherford Contwo in the first three months of 2012, compared to 17 home closings in the same period of 2011. Partially offsetting the declining sales in Toronto was an increase in revenue from single family homes in Regina and Saskatoon, by $0.8 million and $0.3 million, respectively. During the three months ended March 31, 2012, western Canada housing operations sold 41 units at an average selling price of $374,000 per unit translating into a $1.0 million operating profit compared to a $1.1 million profit in the same quarter of 2011, when 29 units were sold at an average selling price of $435,000 per unit.

MA RCH 2012 – DUNDEE CORPORA TION 10
Condominium Margins Revenue from sales of condominium units increased by $18.1 million to $20.0 million in 2012, primarily due to first year sales of 174 condominium units at Corktown Phase Two in the three months ended March 31, 2012, as well as first year sales of all 55 units at 2 Gladstone Ave., both in Toronto. Management is continuing with a program to fund vendor-take-back mortgages that will allow purchasers to obtain the remainder of the financing needed to complete a purchase of a condominium unit at Dundee Realty’s Base Camp project in Colorado. In the three months ended March 31, 2012, Dundee Realty sold one unit and generated revenue of $0.2 million at the Base Camp project. This compares with four sales in the same period of the prior year, generating revenue of $1.2 million. At March 31, 2012, there were 23 additional units available for sale. Margins from Investment Properties Revenue from investment properties increased to $1.5 million in the three months ended March 31, 2012 from $1.4 million in the same period of the prior year. Contribution margins fell to $0.6 million or 39.2% from $0.6 million or 45.7% in the same period of the prior year. During the three months ended March 31, 2012, the fair value of the investment properties increased by $2.0 million, mainly due to increased rental rates and lower capitalization rates since December 2011. Fair values were determined using the discounted cash flow method which discounts the expected future cash flows, generally over a term of 10 years, and uses discount rates and terminal capitalization rates specific to each property, supplemented by third-party appraisals in certain circumstances. Margins from Income-Producing Properties Revenue from income-producing properties decreased to $7.2 million in the three months ended March 31, 2012 from $7.8 million in the same period of the prior year. Contribution margins declined to $0.9 million or 12.8%, a decrease of $1.0 million in contribution margins from the same period of the prior year. The decrease is mainly attributable to record low levels of snow at Arapahoe Basin in Colorado. Dundee Realty’s 17% interest in the King Edward Hotel generated an operating loss in the three months ended March 31, 2012, lower than the marginal contribution margins generated in the same period of the prior year. Revenue decreased to $0.7 million from $0.8 million in the same period of the prior year due to lower hotel suite rental income as a result of condominium construction. CHANGES IN FINANCIAL CONDITION Real Estate Assets
As at March 31, 2012 % Change December 31, 2011Inventory
Land 240,617$ - 240,706$ Housing 33,580 13% 29,692 Condominiums 105,209 1% 104,106 Commercial development 5,721 3% 5,564
385,127 1% 380,068 Investment properties 42,035 5% 39,876 Income-producing properties 23,808 (3%) 24,661
450,970$ 1% 444,605$
MA RCH 2012 – DUNDEE CORPORA TION 11
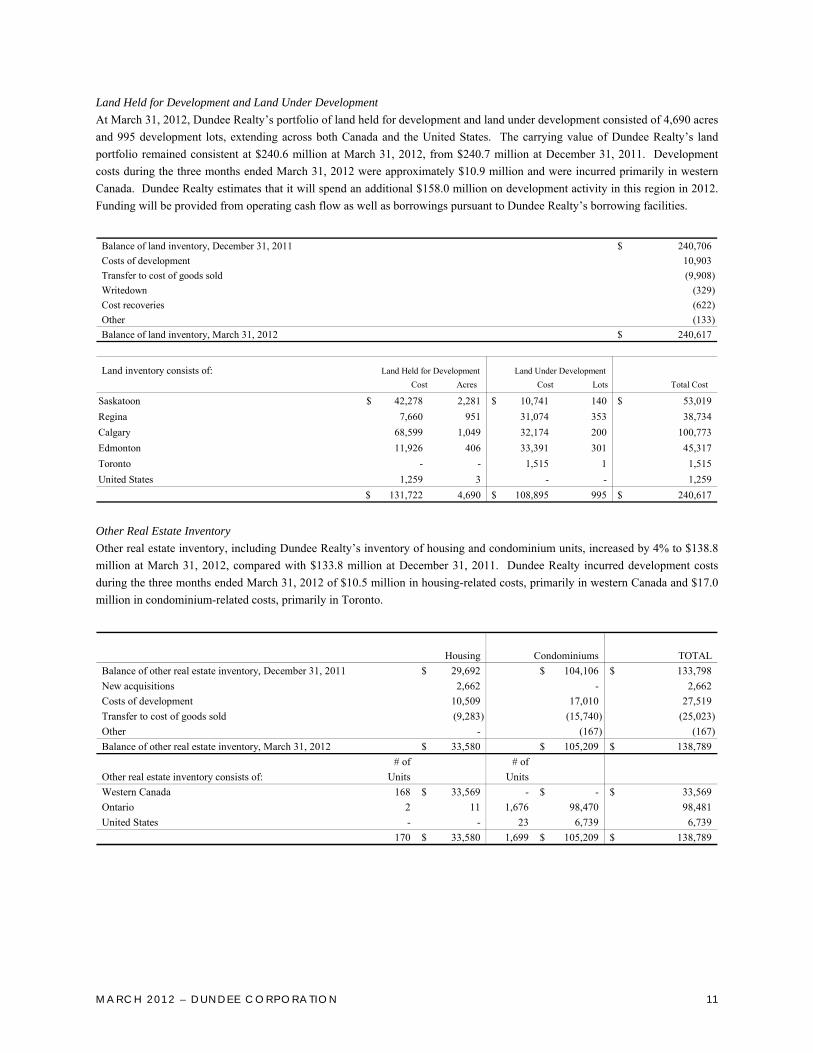
Land Held for Development and Land Under Development At March 31, 2012, Dundee Realty’s portfolio of land held for development and land under development consisted of 4,690 acres and 995 development lots, extending across both Canada and the United States. The carrying value of Dundee Realty’s land portfolio remained consistent at $240.6 million at March 31, 2012, from $240.7 million at December 31, 2011. Development costs during the three months ended March 31, 2012 were approximately $10.9 million and were incurred primarily in western Canada. Dundee Realty estimates that it will spend an additional $158.0 million on development activity in this region in 2012. Funding will be provided from operating cash flow as well as borrowings pursuant to Dundee Realty’s borrowing facilities.
Balance of land inventory, December 31, 2011 240,706$ Costs of development 10,903 Transfer to cost of goods sold (9,908) Writedown (329) Cost recoveries (622) Other (133) Balance of land inventory, March 31, 2012 240,617$
Land inventory consists of:Cost Acres Cost Lots Total Cost
Saskatoon 42,278$ 2,281 10,741$ 140 53,019$ Regina 7,660 951 31,074 353 38,734 Calgary 68,599 1,049 32,174 200 100,773 Edmonton 11,926 406 33,391 301 45,317 Toronto - - 1,515 1 1,515 United States 1,259 3 - - 1,259
131,722$ 4,690 108,895$ 995 240,617$
Land Held for Development Land Under Development
Other Real Estate Inventory Other real estate inventory, including Dundee Realty’s inventory of housing and condominium units, increased by 4% to $138.8 million at March 31, 2012, compared with $133.8 million at December 31, 2011. Dundee Realty incurred development costs during the three months ended March 31, 2012 of $10.5 million in housing-related costs, primarily in western Canada and $17.0 million in condominium-related costs, primarily in Toronto.
Housing Condominiums TOTALBalance of other real estate inventory, December 31, 2011 29,692$ 104,106$ 133,798$ New acquisitions 2,662 - 2,662 Costs of development 10,509 17,010 27,519 Transfer to cost of goods sold (9,283) (15,740) (25,023) Other - (167) (167) Balance of other real estate inventory, March 31, 2012 33,580$ 105,209$ 138,789$
# of # ofOther real estate inventory consists of: Units UnitsWestern Canada 168 33,569$ - -$ 33,569$ Ontario 2 11 1,676 98,470 98,481 United States - - 23 6,739 6,739
170 33,580$ 1,699 105,209$ 138,789$

MA RCH 2012 – DUNDEE CORPORA TION 12
Investment Properties Dundee Realty’s investment properties are located predominantly in downtown Toronto. The carrying value of these assets increased from $39.9 million at December 31, 2011 to $42.0 million at March 31, 2012, including a fair value increase of $2.0 million relating primarily to The Distillery Historic District, reflecting increased leasing activity and a decrease in the overall capitalization rate.
Balance of investment properties, December 31, 2011 39,876$ Initial leasing costs and incentives 157 Fair value changes 2,004 Other (2) Balance of investment properties, March 31, 2012 42,035$
Income-Producing Properties Income-producing properties decreased by 3.5% to $23.8 million at March 31, 2012 compared with $24.7 million at December 31, 2011, mainly due to depreciation.
Balance of income-producing properties, December 31, 2011 24,661$ Net additions 142 Depreciation (604) Other (391) Balance of income-producing properties, March 31, 2012 23,808$
Income-producing properties include:Project Location Carrying valueArapahoe Basin Colorado 11,856$ King Edward Hotel Toronto 6,633 Willows Golf course Saskatoon 2,993 Other 2,326
23,808$ Real Estate Joint Venture Investments
Firelight Infrastructure Fund
Bear Valley Mountain Resort Other
Total real estate joint venture investments
Balance of equity investments, December 31, 2011 21,032$ 5,298$ 21,587$ 47,917$ Equity income for the period 210 15 (156) 69 Net cash investments 2,838 - 114 2,952 Foreign exchange adjustments - (130) - (130) Balance of equity investments March, 31, 2012 24,080$ 5,183$ 21,545$ 50,808$
Included in Dundee Realty’s joint venture investments is its 20% interest in Firelight Infrastructure Fund (“Firelight”). Firelight has committed $200 million to fund renewable energy projects and is currently invested in RMS Energy Dalhousie Mountain LP, which completed its first project in 2010, with the successful conversion of the RMS Dalhousie Mountain wind farm in Pictou County, Nova Scotia. Through Xeneca Limited Partnership (“Xeneca”), Firelight is also indirectly invested in the development of waterpower sites in Ontario. Dundee Realty has a 19% beneficial interest in Xeneca.

MA RCH 2012 – DUNDEE CORPORA TION 13
During the three months ended March 31, 2012, Firelight acquired an additional two rooftop solar projects for $2.3 million bringing its total to eight solar rooftop projects, and a further eight rooftop systems currently under construction as part of a plan to invest $150 million, of which Dundee Realty’s pro rata amount is $30 million, over three years in solar energy projects. The acquired solar projects have entered into power purchase agreements for renewable energy with the Ontario Power Authority to supply energy at a fixed rate of 63.5 to 71.3 cents per KWH for 20 years. Dundee Realty holds a 20% interest in the solar rooftop projects and has invested $4.1 million to March 31, 2012. Also acquired in 2011 were Sandhurst and Rutley, two 10 MW ground mount solar projects located outside of Kingston, Ontario, in which Dundee Realty invested $19.7 million. Firelight also purchased a 50% interest in Erie Ridge, an 8.5 MW solar farm for $4.4 million. Firelight has also entered into a joint venture agreement to acquire a 49% interest in a 31.5 MW wind power project located near Amherst, Nova Scotia, which will begin commercial operations in the second quarter of 2012. Real Estate Debt Real estate debt as at March 31, 2012 was $213.4 million (December 31, 2011 - $210.5 million) including $85.0 million relating to a revolving term credit facility, with the balance divided among mortgages on investment properties, income-producing properties, land servicing loans, vendor-take-back financing of land purchases and housing construction loans. Debt is generally secured by charges on specific properties to which the debt relates. As at March 31, 2012, $43.7 million (December 31, 2011 - $43.9 million) of aggregate debt in the real estate segment was subject to a fixed, weighted average interest rate of 7.54% (December 31, 2011 – 7.46%) and matures between 2012 and 2017. A further $169.7 million (December 31, 2011 - $166.6 million) of real estate debt is subject to a weighted average variable interest rate of 4.01% (December 31, 2011 – 4.12%) and matures between 2012 and 2018. Borrowings under Dundee Realty’s revolving term credit facility are available up to a formula-based maximum not to exceed $190 million, including $40 million relating to a “bulge” commitment established in November 2011. The facility bears interest at prime plus 1.25% or at the corporate bankers’ acceptance rate plus 2.50% as at March 31, 2012. The “bulge” commitment expires on September 15, 2012, while the original balance of $150.0 million expires on November 30, 2013. The facility is secured by a general security agreement and first charges against lots and parcels, as well as certain land held for development in western Canada. At March 31, 2012, Dundee Realty had drawn $158.5 million against its revolving term credit facility, including $73.5 million in the form of letters of credit. Equity Accounted Investments in the Real Estate Sector Share of Equity Earnings
For the three months ended March 31, 2012 2011Dundee Real Estate Investment Trust 5,962$ 3,907$ Dundee International Real Estate Investment Trust 1,979 - 360 VOX Corporation (554) - Real estate joint venture investments (see above) 69 260
7,456$ 4,167$ Dundee REIT Dundee REIT is an unincorporated, real estate investment trust and is a leading provider of high quality, affordable business premises. It is focused on owning, acquiring, leasing and managing mid-sized urban and suburban office and industrial properties in Canada. At March 31, 2012, Dundee REIT’s portfolio consisted of approximately 27.1 million square feet of gross leaseable area across Canada.
MA RCH 2012 – DUNDEE CORPORA TION 14
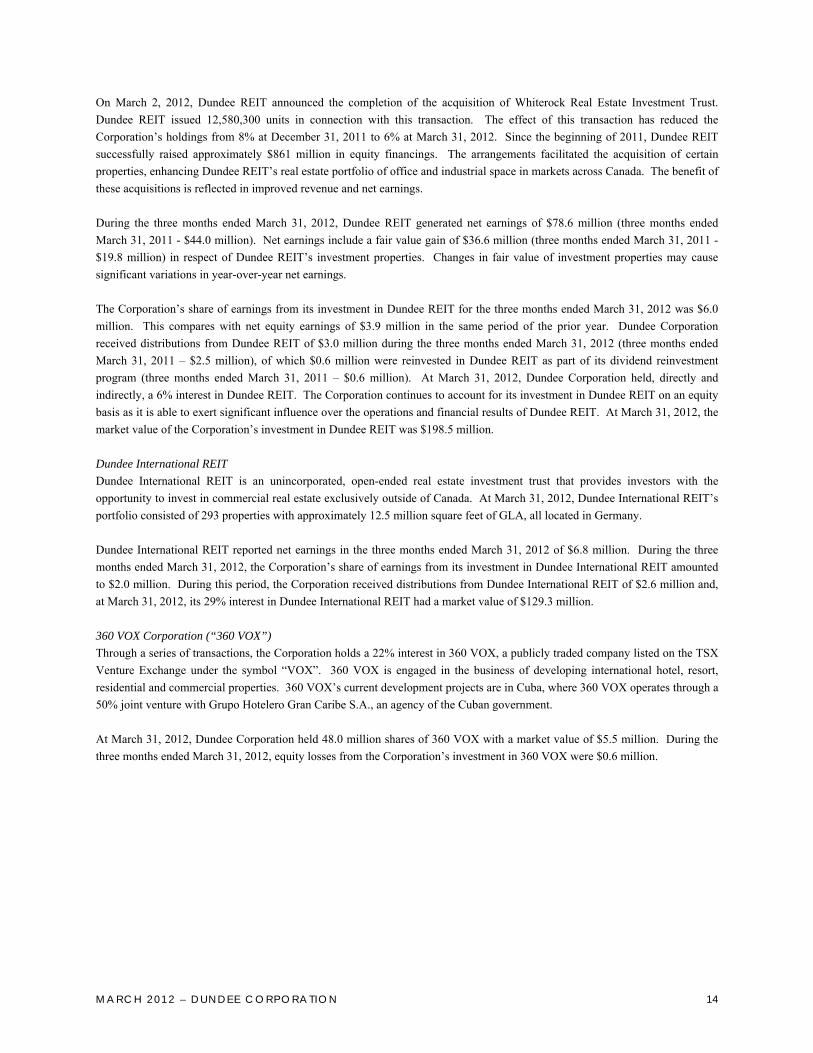
On March 2, 2012, Dundee REIT announced the completion of the acquisition of Whiterock Real Estate Investment Trust. Dundee REIT issued 12,580,300 units in connection with this transaction. The effect of this transaction has reduced the Corporation’s holdings from 8% at December 31, 2011 to 6% at March 31, 2012. Since the beginning of 2011, Dundee REIT successfully raised approximately $861 million in equity financings. The arrangements facilitated the acquisition of certain properties, enhancing Dundee REIT’s real estate portfolio of office and industrial space in markets across Canada. The benefit of these acquisitions is reflected in improved revenue and net earnings. During the three months ended March 31, 2012, Dundee REIT generated net earnings of $78.6 million (three months ended March 31, 2011 - $44.0 million). Net earnings include a fair value gain of $36.6 million (three months ended March 31, 2011 - $19.8 million) in respect of Dundee REIT’s investment properties. Changes in fair value of investment properties may cause significant variations in year-over-year net earnings. The Corporation’s share of earnings from its investment in Dundee REIT for the three months ended March 31, 2012 was $6.0 million. This compares with net equity earnings of $3.9 million in the same period of the prior year. Dundee Corporation received distributions from Dundee REIT of $3.0 million during the three months ended March 31, 2012 (three months ended March 31, 2011 – $2.5 million), of which $0.6 million were reinvested in Dundee REIT as part of its dividend reinvestment program (three months ended March 31, 2011 – $0.6 million). At March 31, 2012, Dundee Corporation held, directly and indirectly, a 6% interest in Dundee REIT. The Corporation continues to account for its investment in Dundee REIT on an equity basis as it is able to exert significant influence over the operations and financial results of Dundee REIT. At March 31, 2012, the market value of the Corporation’s investment in Dundee REIT was $198.5 million. Dundee International REIT Dundee International REIT is an unincorporated, open-ended real estate investment trust that provides investors with the opportunity to invest in commercial real estate exclusively outside of Canada. At March 31, 2012, Dundee International REIT’s portfolio consisted of 293 properties with approximately 12.5 million square feet of GLA, all located in Germany. Dundee International REIT reported net earnings in the three months ended March 31, 2012 of $6.8 million. During the three months ended March 31, 2012, the Corporation’s share of earnings from its investment in Dundee International REIT amounted to $2.0 million. During this period, the Corporation received distributions from Dundee International REIT of $2.6 million and, at March 31, 2012, its 29% interest in Dundee International REIT had a market value of $129.3 million. 360 VOX Corporation (“360 VOX”) Through a series of transactions, the Corporation holds a 22% interest in 360 VOX, a publicly traded company listed on the TSX Venture Exchange under the symbol “VOX”. 360 VOX is engaged in the business of developing international hotel, resort, residential and commercial properties. 360 VOX’s current development projects are in Cuba, where 360 VOX operates through a 50% joint venture with Grupo Hotelero Gran Caribe S.A., an agency of the Cuban government. At March 31, 2012, Dundee Corporation held 48.0 million shares of 360 VOX with a market value of $5.5 million. During the three months ended March 31, 2012, equity losses from the Corporation’s investment in 360 VOX were $0.6 million.

MA RCH 2012 – DUNDEE CORPORA TION 15
RESOURCE SEGMENT During the three months ended March 31, 2012, the resource segment generated net earnings of $0.8 million, compared with net earnings of $7.3 million in the three months ended March 31, 2011. Net earnings in the first three months of the prior year included $8.0 million of equity accounted earnings from the Corporation’s investment in Breakwater, which was subsequently sold in the latter half of 2011.
For the three months ended March 31, 2012 2011Net loss from operations (2,393)$ (3,835)$ Net earnings from equity accounted investments 3,174 11,093 Net earnings from the resource segment 781$ 7,258$
Dundee Energy Limited Through its wholly owned subsidiary, Dundee Energy Limited Partnership (“DELP”), Dundee Energy holds a 95% working interest in 84,000 acres of onshore oil properties and a 65% working interest in 988,000 acres of offshore gas properties located in and around Lake Erie in southern Ontario. In addition to the oil and gas rights associated with these properties, DELP owns six onshore oil facilities, and holds a 65% ownership interest in an offshore fleet of drilling and completion barges and six gas plants and compressor stations that process offshore dry gas at onshore locations. RESULTS OF OPERATIONS Oil and Gas Revenue For the three months ended March 31, 2012 2011
Average Revenue Realized Average Revenue RealizedSales (net) Prices* Sales (net) Prices*
Volume/day ($000's) ($/unit) Volume/day ($000's) ($/unit)Natural gas (Mcf) 10,123 2,442 3.12 10,164 3,656 4.69 Oil and liquids (bbls) 766 5,632 94.61 651 4,416 90.10 Total (boe) 2,450 8,074 42.36 2,345 8,072 45.34 Benchmark PricesDawn Hub (US$/GJ) 2.88 4.61Edmonton Par ($/bbl) 92.94 88.57West Texas Intermediate (WTI) ($/bbl) 103.29 93.15* Before royalty payments During the three months ended March 31, 2012, Dundee Energy realized an average price of $3.12/Mcf on its sales of natural gas before royalty interests, a decrease of over 33% from the average price of $4.69/Mcf realized in the same period of the prior year. In March 2012, natural gas prices in Canada fell below US$2.00/Mcf, as relatively warmer winter weather diminished demand, at the same time as new discoveries and technological changes resulted in a surplus of supply. However, due to the proximity of Dundee Energy’s operations to the Dawn Hub, a leading provider of natural gas supply to the greater Toronto market area, its realized price from sales of natural gas continues to include a positive basis differential from the average industry benchmarks. While international benchmarks such as the West Texas Intermediate (“WTI”) continued to climb in the first quarter of 2012, oil prices fell in western Canada. Given quality differentials, the Edmonton Par Oil Price (“Edmonton Par”) normally trades at a price discount to the WTI oil price. However, the magnitude of the discount was unusually wide in the latter part of the first quarter, increasing to $10.35/bbl compared with $4.58/bbl in the same period of the prior year. With the advent of improved technology, compounded by the growth of oil shale plays, production of oil in western Canada has now exceeded its export pipeline capacity, exerting downward pressure on the Edmonton Par. Changes in the oil and liquids price per bbl realized by Dundee Energy are more closely correlated to the Edmonton Par, reflecting the markets in which it operates. As a result, Dundee Energy realized an average price of $94.61/bbl from its sales of oil and liquids during the first quarter of 2012, a 5% increase over $90.10/bbl realized in the same period of the prior year, but substantially below the WTI benchmark price.
MA RCH 2012 – DUNDEE CORPORA TION 16
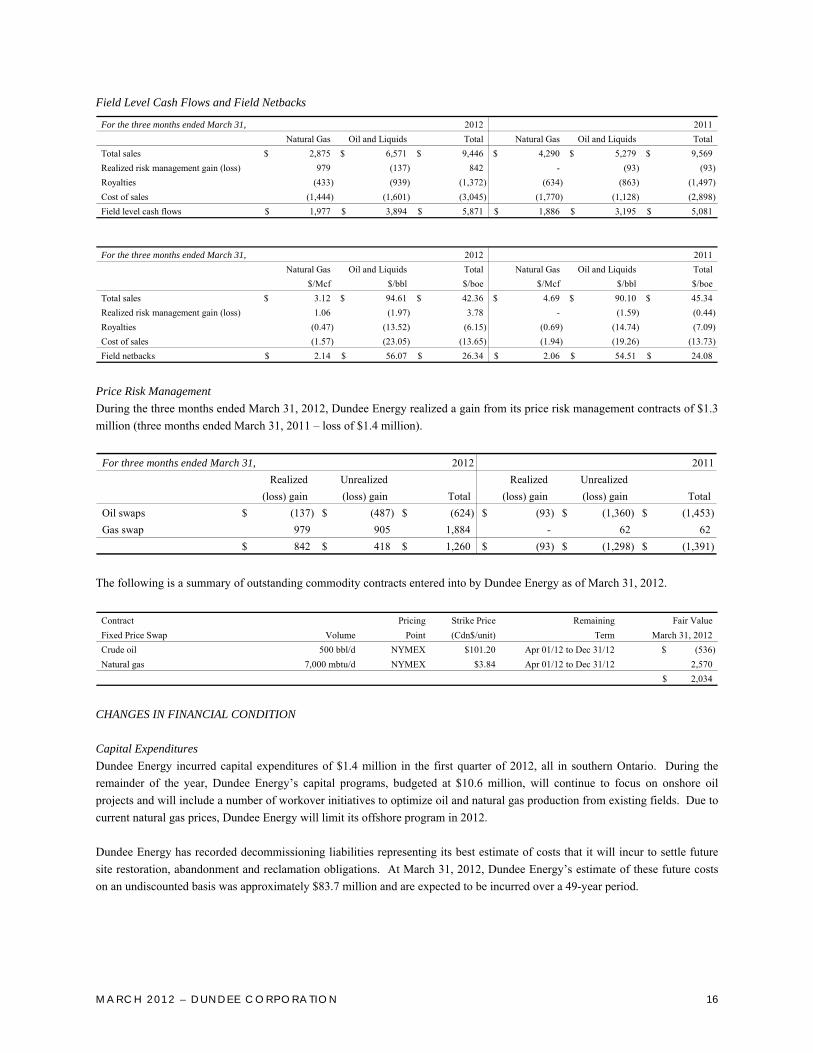
Field Level Cash Flows and Field Netbacks
For the three months ended March 31, 2012 2011Natural Gas Oil and Liquids Total Natural Gas Oil and Liquids Total
Total sales 2,875$ 6,571$ 9,446$ 4,290$ 5,279$ 9,569$ Realized risk management gain (loss) 979 (137) 842 - (93) (93) Royalties (433) (939) (1,372) (634) (863) (1,497) Cost of sales (1,444) (1,601) (3,045) (1,770) (1,128) (2,898) Field level cash flows 1,977$ 3,894$ 5,871$ 1,886$ 3,195$ 5,081$
For the three months ended March 31, 2012 2011Natural Gas Oil and Liquids Total Natural Gas Oil and Liquids Total
$/Mcf $/bbl $/boe $/Mcf $/bbl $/boeTotal sales 3.12$ 94.61$ 42.36$ 4.69$ 90.10$ 45.34$ Realized risk management gain (loss) 1.06 (1.97) 3.78 - (1.59) (0.44) Royalties (0.47) (13.52) (6.15) (0.69) (14.74) (7.09) Cost of sales (1.57) (23.05) (13.65) (1.94) (19.26) (13.73) Field netbacks 2.14$ 56.07$ 26.34$ 2.06$ 54.51$ 24.08$
Price Risk Management During the three months ended March 31, 2012, Dundee Energy realized a gain from its price risk management contracts of $1.3 million (three months ended March 31, 2011 – loss of $1.4 million).
For three months ended March 31, 2012 2011Realized Unrealized Realized Unrealized
(loss) gain (loss) gain Total (loss) gain (loss) gain TotalOil swaps (137)$ (487)$ (624)$ (93)$ (1,360)$ (1,453)$ Gas swap 979 905 1,884 - 62 62
842$ 418$ 1,260$ (93)$ (1,298)$ (1,391)$ The following is a summary of outstanding commodity contracts entered into by Dundee Energy as of March 31, 2012.
Contract Pricing Strike Price Remaining Fair ValueFixed Price Swap Volume Point (Cdn$/unit) Term March 31, 2012Crude oil 500 bbl/d NYMEX $101.20 Apr 01/12 to Dec 31/12 (536)$ Natural gas 7,000 mbtu/d NYMEX $3.84 Apr 01/12 to Dec 31/12 2,570
2,034$ CHANGES IN FINANCIAL CONDITION Capital Expenditures Dundee Energy incurred capital expenditures of $1.4 million in the first quarter of 2012, all in southern Ontario. During the remainder of the year, Dundee Energy’s capital programs, budgeted at $10.6 million, will continue to focus on onshore oil projects and will include a number of workover initiatives to optimize oil and natural gas production from existing fields. Due to current natural gas prices, Dundee Energy will limit its offshore program in 2012. Dundee Energy has recorded decommissioning liabilities representing its best estimate of costs that it will incur to settle future site restoration, abandonment and reclamation obligations. At March 31, 2012, Dundee Energy’s estimate of these future costs on an undiscounted basis was approximately $83.7 million and are expected to be incurred over a 49-year period.

MA RCH 2012 – DUNDEE CORPORA TION 17
Demand Revolving Credit Facilities On June 29, 2010, and concurrent with DELP’s acquisition of the assets in southern Ontario, Dundee Energy arranged for an $80.0 million credit facility for the benefit of DELP. The credit facility is structured as a demand revolving loan, and is subject to a tiered interest rate structure that varies based on the net debt to cash flow ratio generated by DELP. The rate is initially set at prime plus 3% for loans and letters of credit or, for bankers’ acceptances, at the bankers’ acceptance rate plus 4%. At March 31, 2012, an aggregate of $60.1 million had been drawn against the facility and as required by statute, DELP had further issued a letter of credit for $3.3 million in favour of the Ministry of Natural Resources in connection with decommissioning liabilities. Eurogas International Inc. EII is currently conducting exploration and evaluation programs for oil and natural gas offshore Tunisia in the Gulf of Gabes, where it holds a 45% joint venture interest in the 1.0 million acre Sfax permit and the related Ras El Besh development concession. The Corporation’s carrying value of EII’s Tunisian properties at March 31, 2012 was $9.0 million (December 31, 2011 - $8.8 million). Force Majeure As a result of political uncertainty and civil unrest in Tunisia, on January 18, 2011, EII announced that, together with its joint venture partner, Atlas Petroleum Exploration Worldwide Ltd. (“APEX”), it had declared a condition of Force Majeure with respect to its interest in the Sfax permit and the associated Ras El Besh development concession. EII believes that the declaration of Force Majeure allowed EII and APEX to suspend their activities, while the conditions resulting in the Force Majeure continued. On June 19, 2009, the Tunisian government approved an extension on the Sfax permit, extending the original term to December 8, 2011. As a condition of the extension, the joint venture partners committed to drill an exploration well to a required depth during the extension period. On June 23, 2011, the Tunisian government further extended the period of the Sfax permit to December 8, 2012, with no additional commitment. Based on current information, EII estimates that its share of the cost to meet this commitment ranges between US$6 million and US$9 million. In the event that this work commitment is not completed, a compensatory payment of up to US$12 million will be payable by the joint venture partners to the Tunisian regulatory bodies. Equity Accounted Investments in the Resource Sector Share of Equity Earnings
For the three months ended March 31, 2012 2011Dundee Precious Metals Inc. 3,075$ 3,379$ Ryan Gold Corp. (formerly Valdez Gold Inc.) (50) (290) Corona Gold Corporation 149 19 Odyssey Resources Limited - (40) Escal UGS S.L. - 5 Breakwater Resources Ltd. - 8,020
3,174$ 11,093$ Dundee Precious Metals Inc. Dundee Precious is a Canadian based international mining company engaged in the acquisition, exploration, development, mining and processing of precious metals in Bulgaria, Namibia, Armenia and Serbia.
MA RCH 2012 – DUNDEE CORPORA TION 18
For the three months ended March 31, 2012, revenue from sales generated by Dundee Precious was US$100 million, an increase of US$31.6 million over revenue of US$68.4 million generated in the same period of the prior year. The growth was mainly attributable to an increase in deliveries of concentrates and in metal prices. Revenue less cost of sales (“Gross Profit”) from mining operations was US$48.2 million for the three months ended March 31, 2012, compared with US$22.0 million in the same period of the prior year. The increase in Gross Profit is consistent with the growth in net revenue, reflecting increases in the deliveries of concentrates as well as higher gold and silver prices. Dundee Precious reported net earnings attributable to common shareholders of US$8.2 million in the three months ended March 31, 2012, compared with US$14.0 million in the same period of the prior year. The decrease in net earnings was due primarily to unrealized mark-to-market losses related to Dundee Precious’ investment in special warrants of Sabina Gold & Silver Corporation, net losses on metal derivative contracts, lower copper market prices and higher administrative and exploration expenses. Subsequent to March 31, 2012, Dundee Precious announced that following completion of an independent health, safety and environment audit, the Namibian Minister of Environment and Tourism advised Dundee Precious to reduce production at its smelter by approximately half until the projects designed to capture fugitive emissions have been completed. Dundee Precious is currently seeking clarification from the Minister on the levels outlined and developing a plan that will have the least impact on it and the community. Escal UGS S.L. Dundee Energy holds an indirect interest in the Castor underground gas storage project, a Spanish infrastructure project designed to convert the abandoned Amposta oil field, located off the eastern Mediterranean coast of Spain, to a natural gas storage facility (the “Castor Project”). Further details as to the construction of the Castor Project and the associated remuneration system are detailed in Dundee Energy’s management’s discussion and analysis as at and for the three months ended March 31, 2012, which may be accessed at www.sedar.com or at www.dundee-energy.com. Escal has established a hedging strategy to mitigate its exposure to interest rate risk associated with the project financing for the Castor Project. At March 31, 2012, the fair value of Escal’s obligations in respect of these hedging strategies was approximately €59.1 million (December 31, 2011 – €74.8 million). Recording its share of Escal’s obligations in respect of these hedging contracts would draw the Corporation’s investment in Escal to below zero. Accordingly, the Corporation has not recognized its share of $20.4 million of these losses, as it does not have the legal or constructive obligation in respect thereof. From 2010 to March of 2012, Escal issued shares from treasury with a par value of €13,000. In order to maintain its 33% interest, Dundee Energy indirectly subscribed for one third of the newly issued par value shares at an aggregate cost of $6,000 (€4,400). During this time, and in order to meet the equity ratios as required by the project financing, the majority shareholder also contributed a share premium of €38.7 million and issued €52.0 million in subordinated loans. The Corporation has not recognized the benefit of its 33% interest in the share premium and in the subordinated loans as the realization and measurement is subject to a number of risks and uncertainties, including but not limited to, execution risk associated with the construction of the project, the availability and terms of future financing arrangements and the 50-year life span of the project. On March 30, 2012, the Spanish government issued a royal decree, changing the terms of provisional remuneration available prior to final commissioning certification for initiatives similar to the Castor Project. The royal decree also imposed additional commissioning requirements that need to be met prior to acceptance of an underground gas storage project into the Spanish gas system. In addition, on April 27, 2012, a Spanish ministerial order was issued, increasing the term of the remuneration period for invested cost related to underground gas storage from 10 years to 20 years. The fees payable for gas storage investment remain unchanged. This modification may have an effect on Escal’s current project financing arrangements. Dundee Energy is actively working with Escal, and with the majority shareholder of Escal, to obtain further clarification of the potential impact of these changes to the Castor Project.

MA RCH 2012 – DUNDEE CORPORA TION 19
AGRICULTURE SEGMENT As the world grapples with the effects of population growth, climate change, urbanization and deforestation in the upcoming decades, food security will be of paramount concern. The Corporation believes that these conditions will add value to productive farmland assets and sustainable agribusinesses, as they will be a significant part of the long-term solution. In late 2011, the Corporation created Dundee Agricultural in order to pursue these opportunities. Dundee Agricultural’s first acquisition and anchor investment was completed in December 2011, with the purchase of the Corporation’s interest in Blue Goose. To date, the Corporation has invested $25.8 million in this venture, giving it a 79% interest. Blue Goose owns The Blue Goose Cattle Company, which was founded in 1992, and which has been providing high-quality organic and all natural beef products since its inception. The organic and natural food markets, including those for beef, have been expanding at significant growth rates and Blue Goose expects this trend to continue for the foreseeable future as consumers demand healthy, sustainable and traceable premium products. Blue Goose is pursuing an active program to expand its operations of organic cattle farming throughout British Columbia and into Ontario. During the first quarter of 2012, it invested $13.2 million, significantly expanding its land holdings to over 700,000 acres under management.
Net assets acquiredCapital assets . Land and buildings 8,168$ Machinery and equipment 2,604 Livestock Biological assets 23 Inventory 1,889 Intangible assets 519
13,203$ Aggregate consideration transferred:Cash 10,203$ Equity issued to non-controlling interest 3,000
13,203$ Blue Goose plans to continue acquiring farmland property in British Columbia and Ontario in order to implement its vertically integrated business model, which will allow it to control the production, processing and distribution of product. As part of its business plan, Blue Goose has acquired a transportation company and is in the process of constructing an abattoir on one of its owned properties in British Columbia. During the first quarter of 2012, Blue Goose earned revenues of $1.2 million, of which $0.8 million is from the sale of beef, and $0.4 million from trucking sales. In addition, fair value increases in livestock added another $1.0 million to net earnings. The increase in fair value is primarily attributable to increases in cattle prices. Approximately 60% of beef sales are to a single leading retailer of natural and organic foods. Blue Goose intends to continue increasing the “Blue Goose” brand awareness within British Columbia and expand its beef product sales into Ontario and other provinces in Canada. In addition to Canada, Blue Goose is assessing the viability of launching Blue Goose beef into key markets within the United States and abroad. In addition to existing beef operations, Blue Goose is exploring alternative clean protein opportunities, including the aquaculture industry where Blue Goose is considering expanding its business lines to include organic freshwater rainbow trout.
MA RCH 2012 – DUNDEE CORPORA TION 20
ASSET MANAGEMENT SEGMENT Management Fee Revenues
For the three months ended March 31, 2012 2011NGIC Management fees 1,032$ 1,539$ DREAM Management fees 13,292 4,830 Fees on invested capital 1,020 840 International operations 938 915
16,282$ 8,124$ Revenue from asset management activities was $16.3 million in the three months ended March 31, 2012, essentially twice the revenue of $8.1 million earned in the same period of the prior year. The increase corresponds to growth of AUM in DREAM which increased to $8.4 billion at March 31, 2012 compared with $4.6 billion at March 31, 2011. Ned Goodman Investment Counsel Limited NGIC continues to act as sub-advisor to certain DundeeWealth funds under a sub-advisory agreement, which provides NGIC with a share of management and performance fee revenues as they are generated. At March 31, 2012, NGIC provided sub-advisory and investment services to approximately $1.1 billion (three months ended March 31, 2011 - $2.3 billion) of DundeeWealth’s AUM. NGIC also provided sub-advisory services to $0.3 billion (three months ended March 31, 2011 - $0.4 billion) of investment products managed by Dundee Capital Markets. In addition, NGIC provides advisory and investment services to Ravensden Alternative Group Trust (“RAGT”), an investment entity established by NGIC in late 2009. To date, this investment entity has raised $13.9 million, including $9.4 million invested directly by Dundee Corporation. The fair value of the Corporation’s $9.4 million investment in RAGT was $19.6 million at March 31, 2012. Dundee Real Estate Asset Management At March 31, 2012, DREAM managed third-party assets with an estimated value of $8.4 billion (December 31, 2011 - $7.0 billion). DREAM also earns asset management revenue in respect of projects in which Dundee Realty has invested capital, including Dundee Realty’s investments in real estate and infrastructure projects. During the three months ended March 31, 2012, DREAM recognized $1.0 million (three months ended March 31, 2011 - $0.8 million) of asset management revenue in respect of projects in which Dundee Realty has invested capital. The portion of revenue that is earned in respect of Dundee Realty’s invested capital is eliminated in determining the Corporation’s consolidated financial results. Other Asset Management Segment Balances Income from Corporate Investments Dundee Corporation owns several other public and private investments in a variety of industry sectors. The Corporation earns interest and dividend revenue from these investments. During the three months ended March 31, 2012, the Corporation earned interest and dividend revenues of $12.6 million (three months ended March 31, 2011 - $14.9 million), including dividend revenue of $10.6 million (three months ended March 31, 2011 - $12.9 million) from the Corporation’s investment in Scotiabank. The Corporation also realizes a gain or loss on sale when it disposes of an investment. These realized gains or losses are included in the Corporation’s net earnings.

MA RCH 2012 – DUNDEE CORPORA TION 21
Investments in equity securities that are designated either as financial instruments at fair value through profit and loss, or as AFS Securities, are recorded in the Corporation’s consolidated financial statements at fair value. Changes in unrealized fair values of equity securities that are designated as AFS Securities are recorded as a component of OCI, subject to decreases in fair value that are considered other-than-temporary, in which case they are recorded in net earnings. Changes in fair value of other investments that are designated as financial instruments at fair value through profit and loss are recorded directly in earnings, and are included in the Corporation’s statement of operations as “realized gains from investments”. General and Administrative Expenses Generally, head office costs, including costs associated with corporate governance and related public company costs, are accumulated and reported as head office costs and are not allocated to other operating segments. These costs were $9.9 million in the three months ended March 31, 2012 compared with $23.6 million in the same period of the prior year. General and administrative expenses in the first quarter of the prior year included approximately $15.0 million of expenses that were directly related to the gain earned by the Corporation following its divestment of DundeeWealth. Corporate Interest Expense Corporate interest expense was $5.5 million in the three months ended March 31, 2012, a $2.3 million increase over $3.2 million of interest expense incurred in the same period of the prior year, reflecting increases in average borrowings over the respective periods.
CAPITAL MARKETS SEGMENT Dundee Capital Markets Inc. RESULTS OF OPERATIONS North American economic conditions generally improved during the first quarter of 2012. However, investor confidence remains fragile, amidst concern over sovereign debt issues and the downside risk of decreased demand following austerity measures in the European Union and their effect on consumption in emerging economies such as India and China. Capital markets activities in the resource industry, and the mining sector in particular, decreased significantly in the first quarter of 2012 compared with the same period of the prior year. During the first quarter of 2012, revenues in the capital markets segment decreased marginally to $37.5 million, compared with $38.1 million in the same period of the prior year. Higher general and administrative costs further reduced profitability, with pre-tax net earnings attributable to the capital markets segment decreasing to $3.8 million in the three months ended March 31, 2012 compared with $5.3 million earned in the first quarter of the prior year.
For the three months ended March 31, 2012 2011RevenuesManagement fees 3,357$ 4,696$ Financial services
Investment banking 15,818 16,518 Commissions 11,220 12,722 Principal trading 5,288 1,397 Foreign exchange trading 205 1,480
Interest and dividends 1,649 1,249 37,537 38,062
Cost of salesVariable compensation (17,849) (19,158)
Other items in net earnings attributable to the capital markets segmentDepreciation (644) (238) General and administrative (15,166) (13,413) Interest expense (81) - Foreign exchange loss (32) -
Net earnings attributable to the capital markets segment 3,765$ 5,253$
MA RCH 2012 – DUNDEE CORPORA TION 22
Investment banking revenue, including revenues from new issues and advisory services fees, decreased to $15.8 million in the first quarter of 2012 compared with $16.5 million earned in the first quarter of 2011. During the three months ended March 31, 2012, Dundee Capital Markets participated in 56 (three months ended March 31, 2011 – 76) public and private new issue transactions, with the mining and oil and gas sectors representing 43% of new issue activity. Reflecting a decrease in the number of new issue transactions, new issue revenue decreased to $14.9 million in the three months ended March 31, 2012 compared with $16.5 million in the same period of the prior year. During this period, Dundee Capital Markets earned advisory services revenues of $0.9 million. There were no advisory services mandates completed in the first quarter of the prior year. Advisory services mandates are generally long term in nature, and fees are earned only on the successful completion of a contract. Commission revenues were $11.2 million in the three months ended March 31, 2012 compared to $12.7 million earned in the same period of the prior year. Market conditions in the first quarter of 2012 were more challenging than the first quarter of 2011 as evidenced by a general decrease in trading volumes on both the Toronto Stock Exchange and the TSX Venture Exchange. Principal trading activities generated $5.3 million in the three months ended March 31, 2012 compared with $1.4 million in the same period of the prior year, reflecting both mark-to-market gains in respect of broker warrant inventory, as well as increases in Dundee Capital Markets’ portfolio of trading securities. However, revenue from foreign exchange trading in particular decreased to $0.2 million in the three months ended March 31, 2012 compared with $1.5 million earned in the same period of the prior year, reflecting a substantial decrease in activity relating to investment products managed by DundeeWealth prior to the Corporation’s divestment of DundeeWealth in February 2011. Capital markets professionals and financial advisors are compensated on a variable scale, based on revenues generated. Certain capital markets professionals may also be compensated based on the profitability of their respective division. During the first quarter of 2012, variable compensation expense was $17.8 million, compared with variable compensation expense of $19.2 million in the first quarter of the prior year. Management Fee Revenue Management fee revenue earned from tax assisted investment products, closed-end funds, and financial advisor accounts were $3.4 million in the three months ended March 31, 2012. This compares with $4.7 million earned in the same period of the prior year. The decrease is the result of decreased AUM as illustrated in the table below. (in millions of dollars)As at March 31, 2012 2011AUA 3,125$ 3,247$ AUM 1,101 1,424
General and Administrative Expenses General and administrative expenses in the capital markets segment were $15.2 million in the three months ended March 31, 2012, compared with $13.4 million in the same period of the prior year. The increase is due, in part, to the costs of the restructuring process initiated by Dundee Capital Markets following its spin out from DundeeWealth in early 2011, including the separation of back office and operational systems.
MA RCH 2012 – DUNDEE CORPORA TION 23
FINANCIAL CONDITION Call Loan Facilities From time to time, Dundee Capital Markets may utilize call loan arrangements to facilitate the securities settlement process for both client and principal securities transactions, or to fund margin lending. In connection with the establishment of an introducing and carrying broker arrangement with a third-party service provider on January 1, 2012, Dundee Capital Markets arranged for an uncommitted call loan facility for up to $75 million. At March 31, 2012, Dundee Capital Markets had drawn $24.5 million against this facility. Other Balances Relating to Dundee Capital Markets’ Investment Dealer Activities
As at March 31, 2012 2011Client accounts receivable 535,134$ 830,400$ Client deposits and related liabilities (468,535) (825,229) Securities owned 79,973 96,174 Securities sold short (21,702) (16,585)
Client account balances represent funds owing from or belonging to clients, and amounts due to or from brokers and dealers that are pending settlement. While the amounts may vary significantly on a day-to-day basis, they do not necessarily reflect any meaningful change in Dundee Capital Markets’ financial position. Securities owned and securities sold short represent trading positions in the capital markets segment. Trading positions may also vary significantly on a day-to-day basis depending upon trading strategies in response to market conditions and in anticipation of price movements. These variances do not necessarily reflect any meaningful changes to Dundee Capital Markets’ financial position. Trading positions are recorded at their fair value based on quoted prices where available, with changes in market values being included in principal trading revenue.
OTHER CONSOLIDATED BALANCES AND CAPITAL STRUCTURE Income Tax Expense The Corporation’s effective income tax rate was 29.6% for the three months ended March 31, 2012 (three months ended March 31, 2011 – 22.1%). This effective tax rate in the current quarter is higher than the statutory combined federal and provincial tax rate of 26.3% and can be attributed primarily to non tax-deductible items including stock based compensation and preference share dividends classified as interest expense for accounting purposes. The impact of these items on the effective rate is partially offset by certain non-taxable revenues. Net Deferred Income Tax Liabilities The Corporation’s net deferred income tax liabilities at March 31, 2012 were $197.5 million, which represent deferred income tax liabilities of $220.8 million, offset by deferred income tax assets of $23.3 million. This compares to net deferred income tax liabilities of $170.7 million at December 31, 2011. The increase in deferred income tax liabilities during the first three months of 2012 can be attributed primarily to appreciation in the fair market value of the Corporation’s investments. Components of the Corporation’s net deferred income tax liabilities are detailed in Note 29 to the March 2012 Interim Consolidated Financial Statements. The Corporation’s aggregate income tax loss carry forwards at March 31, 2012 were $43.5 million (December 31, 2011 - $69.3 million). The Corporation has recognized a tax benefit of $10.0 million (December 31, 2011 - $17.0 million) in respect of these tax losses in its deferred income tax assets.
MA RCH 2012 – DUNDEE CORPORA TION 24
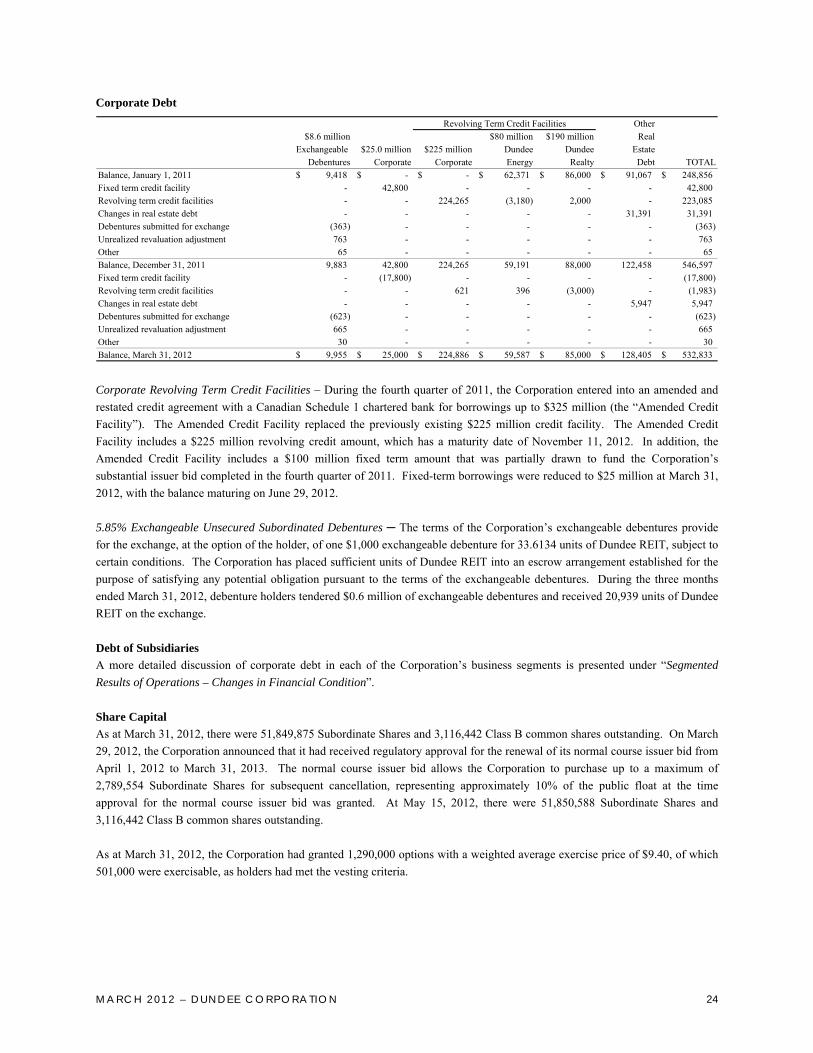
Corporate Debt
Other$8.6 million $80 million $190 million Real
Exchangeable $25.0 million $225 million Dundee Dundee EstateDebentures Corporate Corporate Energy Realty Debt TOTAL
Balance, January 1, 2011 9,418$ -$ -$ 62,371$ 86,000$ 91,067$ 248,856$ Fixed term credit facility - 42,800 - - - - 42,800 Revolving term credit facilities - - 224,265 (3,180) 2,000 - 223,085 Changes in real estate debt - - - - - 31,391 31,391 Debentures submitted for exchange (363) - - - - - (363) Unrealized revaluation adjustment 763 - - - - - 763 Other 65 - - - - - 65 Balance, December 31, 2011 9,883 42,800 224,265 59,191 88,000 122,458 546,597 Fixed term credit facility - (17,800) - - - - (17,800) Revolving term credit facilities - - 621 396 (3,000) - (1,983) Changes in real estate debt - - - - - 5,947 5,947 Debentures submitted for exchange (623) - - - - - (623) Unrealized revaluation adjustment 665 - - - - - 665 Other 30 - - - - - 30 Balance, March 31, 2012 9,955$ 25,000$ 224,886$ 59,587$ 85,000$ 128,405$ 532,833$
Revolving Term Credit Facilities
Corporate Revolving Term Credit Facilities – During the fourth quarter of 2011, the Corporation entered into an amended and restated credit agreement with a Canadian Schedule 1 chartered bank for borrowings up to $325 million (the “Amended Credit Facility”). The Amended Credit Facility replaced the previously existing $225 million credit facility. The Amended Credit Facility includes a $225 million revolving credit amount, which has a maturity date of November 11, 2012. In addition, the Amended Credit Facility includes a $100 million fixed term amount that was partially drawn to fund the Corporation’s substantial issuer bid completed in the fourth quarter of 2011. Fixed-term borrowings were reduced to $25 million at March 31, 2012, with the balance maturing on June 29, 2012. 5.85% Exchangeable Unsecured Subordinated Debentures ─ The terms of the Corporation’s exchangeable debentures provide for the exchange, at the option of the holder, of one $1,000 exchangeable debenture for 33.6134 units of Dundee REIT, subject to certain conditions. The Corporation has placed sufficient units of Dundee REIT into an escrow arrangement established for the purpose of satisfying any potential obligation pursuant to the terms of the exchangeable debentures. During the three months ended March 31, 2012, debenture holders tendered $0.6 million of exchangeable debentures and received 20,939 units of Dundee REIT on the exchange. Debt of Subsidiaries A more detailed discussion of corporate debt in each of the Corporation’s business segments is presented under “Segmented Results of Operations – Changes in Financial Condition”. Share Capital As at March 31, 2012, there were 51,849,875 Subordinate Shares and 3,116,442 Class B common shares outstanding. On March 29, 2012, the Corporation announced that it had received regulatory approval for the renewal of its normal course issuer bid from April 1, 2012 to March 31, 2013. The normal course issuer bid allows the Corporation to purchase up to a maximum of 2,789,554 Subordinate Shares for subsequent cancellation, representing approximately 10% of the public float at the time approval for the normal course issuer bid was granted. At May 15, 2012, there were 51,850,588 Subordinate Shares and 3,116,442 Class B common shares outstanding. As at March 31, 2012, the Corporation had granted 1,290,000 options with a weighted average exercise price of $9.40, of which 501,000 were exercisable, as holders had met the vesting criteria.

MA RCH 2012 – DUNDEE CORPORA TION 25
The Corporation has also issued 6.0 million 5.00% cumulative redeemable first preference shares, series 1 (“Preference Shares, series 1”) and 5.2 million 6.75% cumulative redeemable first preference shares, series 2 (“Preference Shares, series 2”). A full description of the terms of the Preference Shares, series 1 and Preference Shares, series 2 is provided in Note 23 to the 2011 Audited Consolidated Financial Statements.
CONSOLIDATED LIQUIDITY AND CAPITAL RESOURCES As at March 31, 2012, the Corporation had cash of $112.3 million compared with $213.5 million at December 31, 2011. Included in the Corporation’s consolidated cash balance is cash used in the operating business of Dundee Capital Markets. Dundee Capital Markets’ brokerage subsidiaries function in regulated environments and are therefore required to maintain levels of capital in liquid assets in accordance with regulatory requirements. The amount of capital that exists within these regulated entities may dictate the level of business operations, including margin lending, securities trading and corporate finance commitments. Furthermore, the ability to transfer cash resources, which, at March 31, 2012, were $88.9 million, out of these regulated subsidiaries may be limited by their requirement to comply with regulatory capital requirements. As a registered portfolio manager and exempt market dealer across Canada and an investment fund manager in the province of Ontario, NGIC is also required to maintain minimum capital as prescribed by regulation. At March 31, 2012 and 2011, all of the Corporation’s regulated subsidiaries exceeded their minimum regulatory capital requirements. Significant Sources and Uses of Cash During the three months ended March 31, 2012, the Corporation incurred net cash outflows of $101.3 million (three months ended March 31, 2011 – net cash outflows of $24.4 million) from continuing operations. Significant cash flow items are described below: Significant Cash Flows – Operating Activities
For the three months ended March 31, 2012 2011Operating activities:
Adjusted net earnings 22,989$ 2,051$ Changes in balances relating to investment dealer activities (37,162) 39,227 Changes in real estate working capital 16,386 905 Changes in agricultural working capital 948 - Changes in other working capital amounts 8,841 8,531 Changes in income taxes payable (6,483) (11,124)
Cash provided from operating activities 5,519$ 39,590$
• The effect of changes in balances related to investment dealer activities, including client account balances and brokerage securities owned and sold short, will vary significantly on a day-to-day basis. Cash flow balances relating to investment dealer activities also include amounts borrowed or repaid pursuant to call loan facilities. During the three months ended March 31, 2012, these balances resulted in net cash outflow of $37.2 million (three months ended March 31, 2011 – $39.2 million net cash inflow). Changes in cash resulting from these types of transactions may not necessarily reflect any meaningful change in the Corporation’s financial position, or that of its subsidiaries.
• Real estate cash flows are mainly project driven. For the three months ended March 31, 2012, Dundee Realty generated working capital of $16.4 million (three months ended March 31, 2011 – $0.9 million) from operating activities.
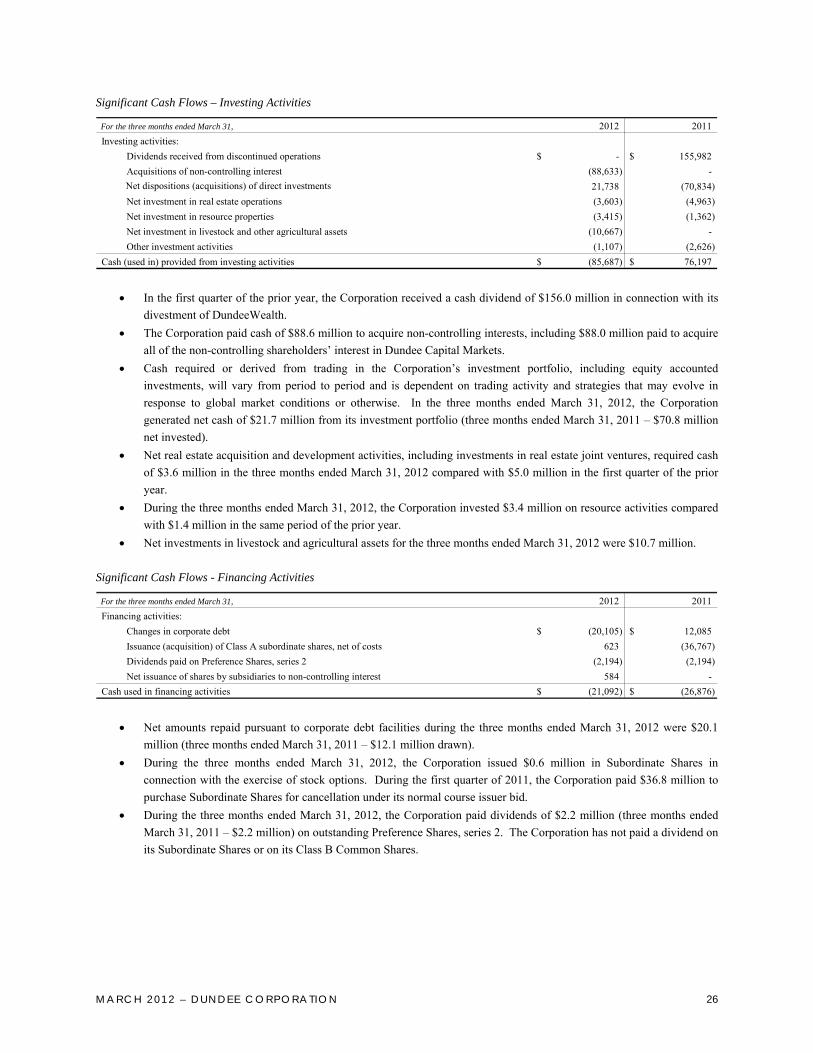
MA RCH 2012 – DUNDEE CORPORA TION 26
Significant Cash Flows – Investing Activities
For the three months ended March 31, 2012 2011Investing activities:
Dividends received from discontinued operations -$ 155,982$ Acquisitions of non-controlling interest (88,633) -
Net dispositions (acquisitions) of direct investments 21,738 (70,834) Net investment in real estate operations (3,603) (4,963) Net investment in resource properties (3,415) (1,362) Net investment in livestock and other agricultural assets (10,667) - Other investment activities (1,107) (2,626)
Cash (used in) provided from investing activities (85,687)$ 76,197$ • In the first quarter of the prior year, the Corporation received a cash dividend of $156.0 million in connection with its
divestment of DundeeWealth. • The Corporation paid cash of $88.6 million to acquire non-controlling interests, including $88.0 million paid to acquire
all of the non-controlling shareholders’ interest in Dundee Capital Markets. • Cash required or derived from trading in the Corporation’s investment portfolio, including equity accounted
investments, will vary from period to period and is dependent on trading activity and strategies that may evolve in response to global market conditions or otherwise. In the three months ended March 31, 2012, the Corporation generated net cash of $21.7 million from its investment portfolio (three months ended March 31, 2011 – $70.8 million net invested).
• Net real estate acquisition and development activities, including investments in real estate joint ventures, required cash of $3.6 million in the three months ended March 31, 2012 compared with $5.0 million in the first quarter of the prior year.
• During the three months ended March 31, 2012, the Corporation invested $3.4 million on resource activities compared with $1.4 million in the same period of the prior year.
• Net investments in livestock and agricultural assets for the three months ended March 31, 2012 were $10.7 million. Significant Cash Flows - Financing Activities
For the three months ended March 31, 2012 2011Financing activities:
Changes in corporate debt (20,105)$ 12,085$ Issuance (acquisition) of Class A subordinate shares, net of costs 623 (36,767) Dividends paid on Preference Shares, series 2 (2,194) (2,194) Net issuance of shares by subsidiaries to non-controlling interest 584 -
Cash used in financing activities (21,092)$ (26,876)$ • Net amounts repaid pursuant to corporate debt facilities during the three months ended March 31, 2012 were $20.1
million (three months ended March 31, 2011 – $12.1 million drawn). • During the three months ended March 31, 2012, the Corporation issued $0.6 million in Subordinate Shares in
connection with the exercise of stock options. During the first quarter of 2011, the Corporation paid $36.8 million to purchase Subordinate Shares for cancellation under its normal course issuer bid.
• During the three months ended March 31, 2012, the Corporation paid dividends of $2.2 million (three months ended March 31, 2011 – $2.2 million) on outstanding Preference Shares, series 2. The Corporation has not paid a dividend on its Subordinate Shares or on its Class B Common Shares.

MA RCH 2012 – DUNDEE CORPORA TION 27
Cash Requirements The Corporation’s capital management and funding objectives include ensuring that the Corporation is compliant with all of its ongoing obligations, including compliance with all applicable debt covenants, and ensuring that the Corporation is able to meet its financial obligations as they become due. In determining its capital allocation, the Corporation considers relevant regulatory capital requirements in order to effectively manage its capital markets business, the use of capital to develop the land and housing business in the real estate segment and resources required for the exploration, evaluation and development activities in the resource segment. The Corporation’s capital management objectives also include ensuring that it has sufficient capital available to benefit from acquisitions and other opportunities, should they arise, and ensuring adequate returns for shareholders. The Corporation regularly assesses the allocation of its capital resources in response to changing economic conditions. On an ongoing basis, the Corporation will require cash to support regulated subsidiaries, to develop real estate assets and resource properties, to meet the obligations under its other contractual commitments, and to finance dividend and interest payments on preference shares and debt obligations. The Corporation may also require cash to finance new business initiatives or to invest in other opportunities, including growth opportunities related to its portfolio of investments. The real estate segment requires working capital to finance development of planned land and housing and condominium projects. The revolving term credit facility of $190 million in the real estate segment provides increased flexibility to operate this business efficiently. As well, Dundee Energy requires working capital to finance planned capital expenditures and development activities. Its demand revolving credit facility of $80.0 million provides Dundee Energy with the necessary cash flow to undertake its planned work programs. On a consolidated basis, the Corporation believes that operating cash flow, combined with available lines of credit and its portfolio of investments, provide sufficient cash resources for the Corporation to conduct its operations for the foreseeable future.
CONSOLIDATED QUARTERLY BUSINESS TRENDS
2012For the three months ended, 31-Mar 31-Dec 30-Sept 30-Jun 31-Mar 31-Dec 30-Sep 30-June
Net earnings for the period Continuing operations 32,461$ 29,675$ 88,636$ 21,006$ 14,164$ 81,159$ 33,551$ 35,468$ Discontinued operations - - - - 861,158 5,664 9,391 11,430
Net earnings attributable to owners of the parent 32,461$ 29,675$ 88,636$ 21,006$ 875,322$ 86,823$ 42,942$ 46,898$
Earnings per share
Basic Continuing operations 0.55$ 0.48$ 1.33$ 0.28$ 0.17$ 1.12$ 0.44$ 0.45$ Discontinued operations - - - - 12.34 0.08 0.13 0.16
0.55$ 0.48$ 1.33$ 0.28$ 12.51$ 1.20$ 0.57$ 0.61$ Diluted Continuing operations 0.53$ 0.47$ 1.29$ 0.27$ 0.17$ 1.09$ 0.44$ 0.44$ Discontinued operations - - - - 12.03 0.07 0.12 0.14
0.53$ 0.47$ 1.29$ 0.27$ 12.20$ 1.16$ 0.56$ 0.58$
2011Prepared in accordance with IFRS
2010
• Net earnings per share in the fourth quarter of 2011 reflect the impact of the Corporation’s substantial issuer bid pursuant to which it acquired 10 million Subordinate Shares of the Corporation for cancellation.
• Net earnings in the third quarter of 2011 include a pre-tax gain of $95.6 million from the divestment of Breakwater. • Net earnings in the first quarter of 2011 include a gain of $870.8 million from the divestment of DundeeWealth. • Performance fee revenue may be earned in each of the Corporation’s capital markets and asset management segments.
Performance fees are contingent on the market values of the underlying portfolio at a point in time, generally at the calendar year end, or upon the conclusion of limited partnership arrangements. As these performance fees are recorded in earnings only when these values have been determined with certainty, these operating segments may experience fluctuations in quarter-over-quarter revenues, with peaks generally in the fourth quarter of each year. Performance fees earned in the fourth quarter of 2011 were $nil (fourth quarter of 2010 - $32.7 million).
MA RCH 2012 – DUNDEE CORPORA TION 28
• Real estate operations are project driven. Real estate revenue and associated real estate operating costs are only included in operations in periods when a development project is completed and sold. Otherwise, these costs are deferred as real estate assets. This may also cause significant fluctuations in net earnings from period to period.
• Investment income includes income earned from dispositions of investment holdings. Investment gains or losses are only recorded when the Corporation disposes of an investment. Therefore, the Corporation may experience significant quarterly fluctuations in these amounts, depending on when it actually effects a disposition.
• The Corporation’s share of earnings from equity accounted investments is included in net earnings for each quarter. Earnings from each equity accounted investment and dilution gains and losses from these investments may fluctuate significantly from period to period and may depend on market forces or other operating conditions that are not necessarily under the Corporation’s direct control.
OFF BALANCE SHEET ARRANGEMENTS, COMMITMENTS AND CONTINGENCIES
Other than as disclosed elsewhere in this MD&A or in Note 33 to the March 2012 Interim Consolidated Financial Statements, there have been no significant changes in the nature of off balance sheet arrangements, commitments and contingencies from those described in Note 35 to the 2011 Audited Consolidated Financial Statements and under “Off Balance Sheet Arrangements” and “Commitments and Contingencies” on pages 41 through 43 in the Corporation’s MD&A as at and for the year ended December 31, 2011.
RELATED PARTY TRANSACTIONS There have been no significant changes in the nature and scope of related party transactions to those described in Note 36 to the 2011 Audited Consolidated Financial Statements and the accompanying MD&A.
CRITICAL ACCOUNTING POLICIES AND ESTIMATES The preparation of the Corporation’s consolidated financial statements in conformity with IFRS requires management to make estimates and assumptions that affect the reported amounts of assets, liabilities, revenues and expenses and the related disclosure of contingent assets and liabilities. Critical accounting estimates represent estimates made by management that are, by their very nature, uncertain. The Corporation evaluates its estimates on an ongoing basis. Such estimates are based on historical experience and on various other assumptions that the Corporation believes are reasonable under the circumstances, and these estimates form the basis for making judgments about the carrying value of assets and liabilities and the reported amount of revenues and expenses that are not readily apparent from other sources. Actual results may differ from these estimates under different assumptions or conditions. There have been no changes in the accounting policies applied in the preparation of the Corporation’s March 2012 Interim Consolidated Financial Statements from those detailed in Note 3 to the Corporation’s 2011 Audited Consolidated Financial Statements. A summary of the more significant judgments and estimates made by management in the preparation of its financial information is provided in Note 4 to the 2011 Audited Consolidated Financial Statements. There have been no significant changes in these judgments and estimates during the three months ended March 31, 2012.
CONTROLS AND PROCEDURES In accordance with the Canadian Securities Administrators’ National Instrument 52-109, the Corporation has filed certificates signed by its Chief Executive Officer and the Chief Financial Officer certifying that, among other things, the design of disclosure controls and procedures and the design of internal control over financial reporting are adequate as at March 31, 2012. Disclosure controls and procedures are designed to ensure that information required to be disclosed by the Corporation in the reports it files or submits under securities legislation is recorded, processed, summarized and reported on a timely basis and that such information is accumulated and reported to management, including the Corporation’s Chief Executive Officer and Chief
MA RCH 2012 – DUNDEE CORPORA TION 29
Financial Officer, as appropriate, to allow required disclosures to be made in a timely fashion. Based on their evaluation, the Chief Executive Officer and Chief Financial Officer concluded that as of March 31, 2012, the Corporation’s disclosure controls and procedures were effective. The Chief Executive Officer and Chief Financial Officer of the Corporation have also evaluated whether there were changes to the Corporation’s internal control over financial reporting during the three months ended March 31, 2012 that have materially affected, or are reasonably likely to materially affect the Corporation’s internal control over financial reporting. There were no changes identified during their evaluation.
MANAGING RISK Except as otherwise disclosed in this MD&A, there have been no significant changes to the nature and scope of the risks faced by the Corporation as described in the Corporation’s 2011 Annual Information Form under “Risk Factors” which is available on SEDAR at www.sedar.com.
FORWARD LOOKING STATEMENTS Dundee Corporation’s public communications may include written or oral forward looking statements. Statements of this type are included in this MD&A, and may be included in other filings with the Canadian regulators, stock exchanges or in other communications. All such statements constitute forward looking information within the meaning of securities law and are made pursuant to the “safe harbour” provisions of applicable securities laws. Forward looking statements may include, but are not limited to, statements about anticipated future events or results including comments with respect to the Corporation’s objectives and priorities for 2012 and beyond, strategies or further actions with respect to the Corporation, its products and services, business operations, financial performance and condition. Forward looking statements are statements that are predictive in nature, depend upon or refer to future events or conditions or include words such as “expects”, “anticipates”, “intends”, “plans”, “believes”, “estimates” or similar expressions concerning matters that are not historical facts. Such statements are based on current expectations of the Corporation’s management and inherently involve numerous risks and uncertainties, known and unknown, including economic factors and those affecting the financial services, real estate and resource industries generally. The forward looking information contained in this MD&A is presented for the purpose of assisting shareholders in understanding business and strategic priorities and objectives as at the periods indicated and may not be appropriate for other purposes. A number of risks, uncertainties and other factors may cause actual results to differ materially from the forward looking statements contained in this MD&A, including, among other factors, those referenced in the section entitled “Risk Factors” in the Corporation’s Annual Information Form, which include, but are not limited to, general economic and market conditions; the Corporation’s ability to execute strategic plans and meet financial obligations; the performance of the Corporation’s principal subsidiaries; the Corporation’s ability to raise additional capital; the Corporation’s ability to create, attract and retain AUM and AUA; risks relating to trading activities and investments; competition faced by the Corporation; regulation of the Corporation’s businesses; successful integration of the Corporation with acquired businesses and the realization of any anticipated synergies; risks associated with the Corporation’s real estate and resource businesses and the Corporation’s investment holdings in general, including risks associated with oil and gas and mining exploration, development and production activities, environmental risks, inflation, changes in interest rates, commodity prices and other financial exposures; the availability and adequacy of insurance coverage for the Corporation and its subsidiaries; maintenance of minimum regulatory capital requirements for certain of the Corporation’s subsidiaries; potential liability of the Corporation and its subsidiaries under securities laws and for violations of investor suitability requirements; and the ability of the Corporation and its subsidiaries to attract and retain key personnel. The preceding list is not exhaustive of all possible risk factors that may influence actual results, and is compiled based upon information available as of May 15, 2012.
MA RCH 2012 – DUNDEE CORPORA TION 30
Forward looking statements contained in this MD&A are based upon assumptions about the future performance of the Canadian, United States, European and other foreign economies, which were material factors considered by management when setting Dundee Corporation’s strategic priorities and objectives. In determining expectations for economic growth in the real estate, resource and capital markets sectors, the Corporation considered historical economic data provided by the Canadian government and its agencies, market and general economic conditions, which factors are unpredictable and may impact the Corporation’s performance. Forward looking statements contained in this MD&A are not guarantees of future performance and, while forward looking statements are based on certain assumptions that the Corporation considers reasonable, actual events and results could differ materially from those expressed or implied by forward looking statements made by the Corporation. Prospective investors are cautioned to consider these and other factors carefully when making decisions with respect to the Corporation and not place undue reliance on forward looking statements. Circumstances affecting the Corporation may change rapidly. Except as may be required by applicable law, the Corporation does not undertake any obligation to update publicly or revise any such forward looking statements, whether as a result of new information, future events or otherwise.
INFORMATION CONCERNING DUNDEE CORPORATION Additional information relating to Dundee Corporation, including a copy of the Corporation’s Annual Information Form, may be found on SEDAR at www.sedar.com and the Corporation’s website at www.dundeecorp.com. Toronto, Ontario May 15, 2012
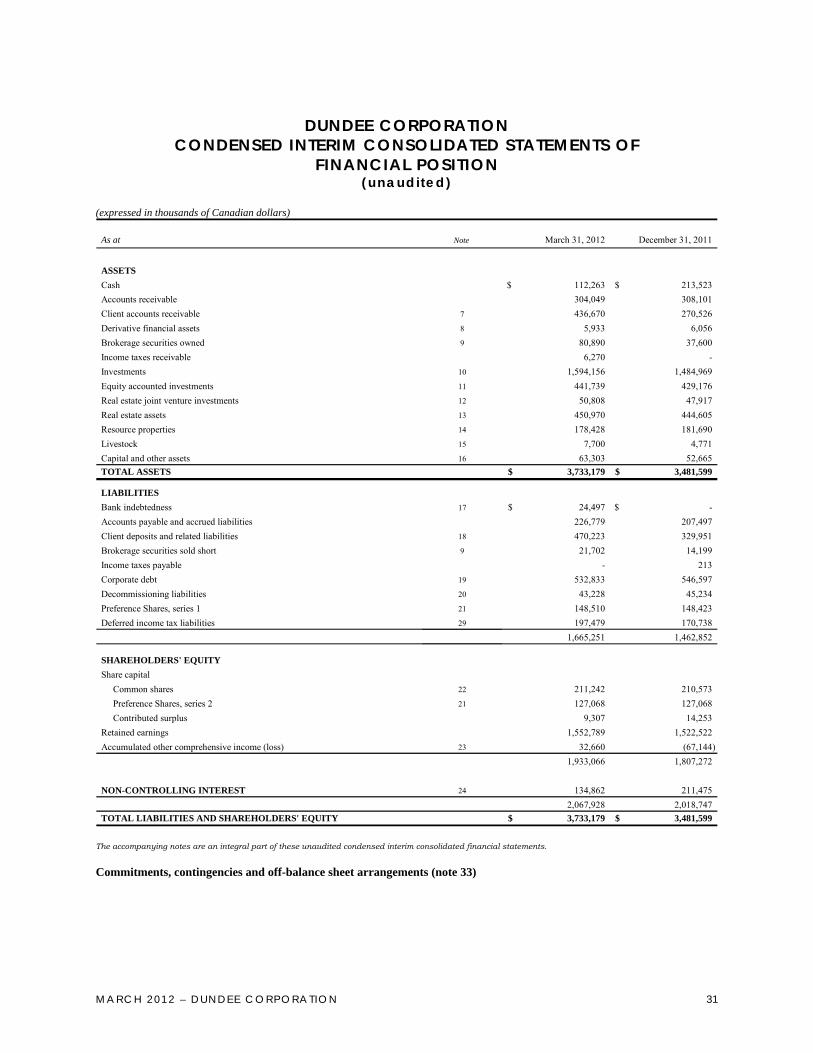
MA RCH 2012 – DUNDEE CORPORA TION 31
DUNDEE CORPORATION
CONDENSED INTERIM CONSOLIDATED STATEMENTS OF FINANCIAL POSITION
(unaudited)
(expressed in thousands of Canadian dollars)
As at Note March 31, 2012 December 31, 2011
ASSETSCash 112,263$ 213,523$ Accounts receivable 304,049 308,101 Client accounts receivable 7 436,670 270,526 Derivative financial assets 8 5,933 6,056 Brokerage securities owned 9 80,890 37,600 Income taxes receivable 6,270 - Investments 10 1,594,156 1,484,969 Equity accounted investments 11 441,739 429,176 Real estate joint venture investments 12 50,808 47,917 Real estate assets 13 450,970 444,605 Resource properties 14 178,428 181,690 Livestock 15 7,700 4,771 Capital and other assets 16 63,303 52,665 TOTAL ASSETS 3,733,179$ 3,481,599$
LIABILITIESBank indebtedness 17 24,497$ -$ Accounts payable and accrued liabilities 226,779 207,497 Client deposits and related liabilities 18 470,223 329,951 Brokerage securities sold short 9 21,702 14,199 Income taxes payable - 213 Corporate debt 19 532,833 546,597 Decommissioning liabilities 20 43,228 45,234 Preference Shares, series 1 21 148,510 148,423 Deferred income tax liabilities 29 197,479 170,738
1,665,251 1,462,852
SHAREHOLDERS' EQUITYShare capital Common shares 22 211,242 210,573 Preference Shares, series 2 21 127,068 127,068 Contributed surplus 9,307 14,253 Retained earnings 1,552,789 1,522,522 Accumulated other comprehensive income (loss) 23 32,660 (67,144)
1,933,066 1,807,272
NON-CONTROLLING INTEREST 24 134,862 211,475 2,067,928 2,018,747
TOTAL LIABILITIES AND SHAREHOLDERS' EQUITY 3,733,179$ 3,481,599$ The accompanying notes are an integral part of these unaudited condensed interim consolidated financial statements.
Commitments, contingencies and off-balance sheet arrangements (note 33)

MA RCH 2012 – DUNDEE CORPORA TION 32
DUNDEE CORPORATION
CONDENSED INTERIM CONSOLIDATED STATEMENTS OF OPERATIONS (unaudited)
(expressed in thousands of Canadian dollars, except per share amounts)
For the three months ended
Note March 31, 2012 March 31, 2011
REVENUES 25 131,283$ 117,820$
OTHER ITEMS IN NET EARNINGSCost of sales 26 (70,492) (57,779) Depreciation and depletion 13,14,16 (5,728) (4,850) General and administrative 28 (31,558) (41,582) Realized gains from investments 10 21,576 2,290 Share of earnings from equity accounted investments 11 10,630 15,260 Loss on sale of equity accounted investment 11 (71) - Fair value changes in investment properties 13 2,004 442 Fair value changes in livestock 15 987 - Gain (loss) on derivative financial instruments 8 720 (2,195) Interest expense 19,20 (8,717) (6,469) Foreign exchange loss (184) (226) NET EARNINGS BEFORE INCOME TAXES 50,450 22,711 Income taxes 29 (14,911) (5,022) NET EARNINGS FROM CONTINUING OPERATIONS 35,539 17,689 DISCONTINUED OPERATIONS 4
Loss, net of taxes - (20,000) Gain on sale of discontinued operations, net of taxes - 870,828
- 850,828 NET EARNINGS FOR THE PERIOD 35,539$ 868,517$
NET EARNINGS ATTRIBUTABLE TO:Owners of the parent 32,461 875,322 Non-controlling interest 3,078 (6,805)
35,539$ 868,517$
NET EARNINGS PER SHARE 30
Basic Continuing operations 0.55$ 0.17$ Discontinued operations - 12.34
0.55$ 12.51$ Diluted Continuing operations 0.53$ 0.17$ Discontinued operations - 12.03
0.53$ 12.20$ The accompanying notes are an integral part of these unaudited condensed interim consolidated financial statements.
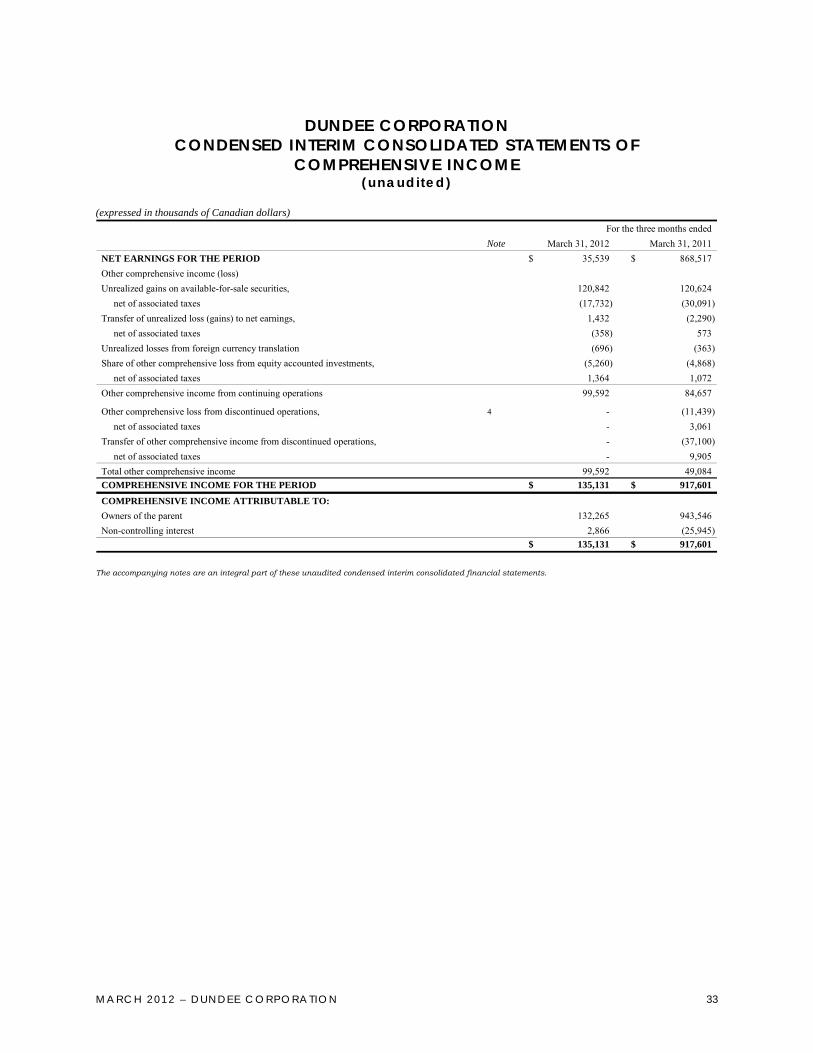
MA RCH 2012 – DUNDEE CORPORA TION 33
DUNDEE CORPORATION
CONDENSED INTERIM CONSOLIDATED STATEMENTS OF COMPREHENSIVE INCOME
(unaudited)
(expressed in thousands of Canadian dollars) For the three months ended
Note March 31, 2012 March 31, 2011NET EARNINGS FOR THE PERIOD 35,539$ 868,517$ Other comprehensive income (loss)Unrealized gains on available-for-sale securities, 120,842 120,624 net of associated taxes (17,732) (30,091) Transfer of unrealized loss (gains) to net earnings, 1,432 (2,290) net of associated taxes (358) 573 Unrealized losses from foreign currency translation (696) (363) Share of other comprehensive loss from equity accounted investments, (5,260) (4,868) net of associated taxes 1,364 1,072 Other comprehensive income from continuing operations 99,592 84,657
Other comprehensive loss from discontinued operations, 4 - (11,439) net of associated taxes - 3,061 Transfer of other comprehensive income from discontinued operations, - (37,100) net of associated taxes - 9,905 Total other comprehensive income 99,592 49,084 COMPREHENSIVE INCOME FOR THE PERIOD 135,131$ 917,601$
COMPREHENSIVE INCOME ATTRIBUTABLE TO:Owners of the parent 132,265 943,546 Non-controlling interest 2,866 (25,945)
135,131$ 917,601$ The accompanying notes are an integral part of these unaudited condensed interim consolidated financial statements.
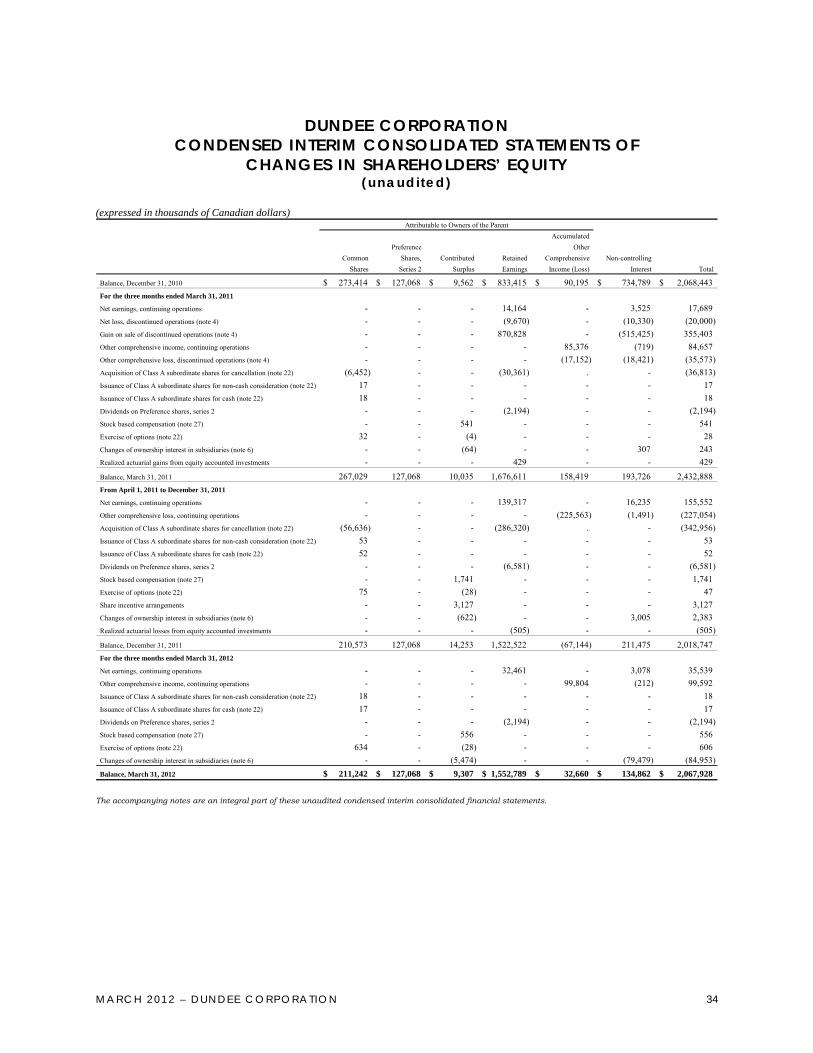
MA RCH 2012 – DUNDEE CORPORA TION 34
DUNDEE CORPORATION
CONDENSED INTERIM CONSOLIDATED STATEMENTS OF CHANGES IN SHAREHOLDERS’ EQUITY
(unaudited)
(expressed in thousands of Canadian dollars)
AccumulatedPreference Other
Common Shares, Contributed Retained Comprehensive Non-controllingShares Series 2 Surplus Earnings Income (Loss) Interest Total
Balance, December 31, 2010 273,414$ 127,068$ 9,562$ 833,415$ 90,195$ 734,789$ 2,068,443$ For the three months ended March 31, 2011
Net earnings, continuing operations - - - 14,164 - 3,525 17,689 Net loss, discontinued operations (note 4) - - - (9,670) - (10,330) (20,000) Gain on sale of discontinued operations (note 4) - - - 870,828 - (515,425) 355,403 Other comprehensive income, continuing operations - - - - 85,376 (719) 84,657 Other comprehensive loss, discontinued operations (note 4) - - - - (17,152) (18,421) (35,573) Acquisition of Class A subordinate shares for cancellation (note 22) (6,452) - - (30,361) . - (36,813) Issuance of Class A subordinate shares for non-cash consideration (note 22) 17 - - - - - 17 Issuance of Class A subordinate shares for cash (note 22) 18 - - - - - 18 Dividends on Preference shares, series 2 - - - (2,194) - - (2,194) Stock based compensation (note 27) - - 541 - - - 541 Exercise of options (note 22) 32 - (4) - - - 28 Changes of ownership interest in subsidiaries (note 6) - - (64) - - 307 243 Realized actuarial gains from equity accounted investments - - - 429 - - 429
Balance, March 31, 2011 267,029 127,068 10,035 1,676,611 158,419 193,726 2,432,888 From April 1, 2011 to December 31, 2011
Net earnings, continuing operations - - - 139,317 - 16,235 155,552 Other comprehensive loss, continuing operations - - - - (225,563) (1,491) (227,054) Acquisition of Class A subordinate shares for cancellation (note 22) (56,636) - - (286,320) . - (342,956) Issuance of Class A subordinate shares for non-cash consideration (note 22) 53 - - - - - 53 Issuance of Class A subordinate shares for cash (note 22) 52 - - - - - 52 Dividends on Preference shares, series 2 - - - (6,581) - - (6,581) Stock based compensation (note 27) - - 1,741 - - - 1,741 Exercise of options (note 22) 75 - (28) - - - 47 Share incentive arrangements - - 3,127 - - - 3,127 Changes of ownership interest in subsidiaries (note 6) - - (622) - - 3,005 2,383 Realized actuarial losses from equity accounted investments - - - (505) - - (505)
Balance, December 31, 2011 210,573 127,068 14,253 1,522,522 (67,144) 211,475 2,018,747 For the three months ended March 31, 2012
Net earnings, continuing operations - - - 32,461 - 3,078 35,539 Other comprehensive income, continuing operations - - - - 99,804 (212) 99,592 Issuance of Class A subordinate shares for non-cash consideration (note 22) 18 - - - - - 18 Issuance of Class A subordinate shares for cash (note 22) 17 - - - - - 17 Dividends on Preference shares, series 2 - - - (2,194) - - (2,194) Stock based compensation (note 27) - - 556 - - - 556 Exercise of options (note 22) 634 - (28) - - - 606 Changes of ownership interest in subsidiaries (note 6) - - (5,474) - - (79,479) (84,953) Balance, March 31, 2012 211,242$ 127,068$ 9,307$ 1,552,789$ 32,660$ 134,862$ 2,067,928$
Attributable to Owners of the Parent
The accompanying notes are an integral part of these unaudited condensed interim consolidated financial statements.

MA RCH 2012 – DUNDEE CORPORA TION 35
DUNDEE CORPORATION CONDENSED INTERIM CONSOLIDATED STATEMENTS OF CASH FLOW
(unaudited) (expressed in thousands of Canadian dollars)
For the three months endedNote March 31, 2012 March 31, 2011
OPERATING ACTIVITIES:Net earnings for the period 35,539$ 868,517$ Adjusted for: net loss from discontinued operations 4 - 20,000 Other items affecting cash flow from operations: Gain on sale of discontinued operations, net of taxes 4 - (870,828) Loss on sale of equity accounted investments 11 71 - Distributions from equity accounted investments 5,237 1,911 Depreciation and depletion 13,14,16 5,728 4,850 Realized gains from investments 10 (21,576) (2,290) Share of earnings from equity accounted investments 11 (10,630) (15,260) Fair value changes in investment properties 13 (2,004) (442) Fair value changes in livestock 15 (987) - Unrealized loss on derivative financial instruments 8 123 2,195 Reclamation expenditures 20 (447) - Deferred income taxes 29 9,943 (6,880) Stock based compensation 27 835 784 Other 1,157 (506)
22,989 2,051 Changes in: Accounts receivable (15,090) 9,997 Accounts payable and accrued liabilities 23,931 (1,466) Bank indebtedness 17 24,497 - Income taxes payable (6,483) (11,124) Brokerage securities owned and sold short, net (35,787) 76,713 Client accounts receivable, net of client deposits and related liabilities (25,872) (37,486) Land, housing and condominium inventory (7,943) (5,742) Other real estate working capital 24,329 6,647 Other agricultural working capital 948 - Cash provided from operating activities - continuing operations 5,519 39,590 Cash provided from operating activities - discontinued operations - 37,617 CASH PROVIDED FROM OPERATING ACTIVITIES 5,519 77,207 INVESTING ACTIVITIES:Net investment in real estate assets and real estate joint ventures (3,603) (4,963) Net investment in resource properties (3,415) (1,362) Net investment in livestock and other agricultural assets (10,667) - Acquisitions from non-controlling interest (88,633) - Acquisition of portfolio investments (55,421) (76,098) Proceeds from dispositions of portfolio investments 77,159 5,264 Dividends received from discontinued operations - 155,982 Net investment in capital and other assets (1,107) (2,626) Cash (used in) provided from investing activities - continuing operations (85,687) 76,197 Cash used in investing activities - discontinued operations - (15,637) CASH (USED IN) PROVIDED FROM INVESTING ACTIVITIES (85,687) 60,560 FINANCING ACTIVITIES:Change in corporate debt (20,105) 12,085 Issuance of Class A subordinate shares, net of issue costs 623 46 Acquisition of Class A subordinate shares, net of costs 22 - (36,813) Net issuance of shares by subsidiaries to non-controlling interest 584 - Dividends paid on Preference shares, series 2 (2,194) (2,194) Cash used in financing activities - continuing operations (21,092) (26,876) Cash used in financing activities - discontinued operations - (135,273) CASH USED IN FINANCING ACTIVITIES (21,092) (162,149) NET DECREASE IN CASH DURING THE PERIOD (101,260) (24,382) Cash, continuing operations, beginning of period 213,523 131,814 Cash, discontinued operations, beginning of period - 373,115
112,263 480,547 Less cash disposed of on sale of discontinued operations - (261,974)
CASH, CONTINUING OPERATIONS, END OF PERIOD 112,263$ 218,573$
Cash flows include the following amounts: Interest paid 9,167$ 6,618$ Taxes paid 11,451$ 23,026$
The accompanying notes are an integral part of these unaudited condensed interim consolidated financial statements.
MARCH 2012 - DUNDEE CORPORATION 36
DUNDEE CORPORATION NOTES TO THE CONDENSED INTERIM CONSOLIDATED
FINANCIAL STATEMENTS (unaudited)
As at and for the three months ended March 31, 2012 Tabular dollar amounts in thousands of Canadian dollars, except per share amounts 1 . N A T U R E O F O P E R A T I O N S
Dundee Corporation (the “Corporation” or “Dundee Corporation”) is an independent publicly traded Canadian asset management company. Dundee Corporation’s asset management activities are focused in the areas of the Corporation’s core competencies and include real estate and infrastructure as well as energy, resources and agriculture. Asset management activities are carried out by Ned Goodman Investment Counsel Limited (“NGIC”), a registered portfolio manager and exempt market dealer across Canada and an investment fund manager in the province of Ontario, and by Dundee Real Estate Asset Management (“DREAM”), the asset management division of Dundee Realty Corporation (“Dundee Realty”). Asset management activities are supported by the Corporation’s ownership in Dundee Capital Markets Inc. (“Dundee Capital Markets”), which is also the asset manager of Dundee Corporation’s flow-through limited partnership business carried out through the “CMP”, “CDR” and “Canada Dominion Resources” brands. Dundee Corporation also owns and manages direct investments in these core focus areas, through ownership of both publicly listed and private companies. Real estate operations are carried out through Dundee Realty, an owner, developer and manager of residential, commercial and recreational properties in North America and in Europe. Real estate operations are complemented by the Corporation’s 29% interest in Dundee International Real Estate Investment Trust (“Dundee International REIT”), an unincorporated open-ended real estate development trust that invests in commercial real estate exclusively outside of Canada, as well as a 6% interest in Dundee Real Estate Investment Trust (“Dundee REIT”), a Canadian real estate investment trust. Energy and resource operations include the Corporation’s ownership in Dundee Energy Limited (formerly Eurogas Corporation) (“Dundee Energy”), an oil and natural gas company with a mandate to create long-term value through the development of high impact energy projects. The Corporation also holds several other investments in the resource sector for which it applies the equity method of accounting. At March 31, 2012, the Corporation’s major subsidiaries included:
As at and for the three months ended As at and for the year ended
March 31, 2012 December 31, 2011
Opening Ending Opening Ending
(in alphabetical order) Ownership Ownership Ownership Ownership
Blue Goose Capital Corporation (note 5) 81% 79% - 81%Dundee Capital Markets Inc. (note 6) 49% 100% 48% 49%Dundee Energy Limited 57% 57% 54% 57%Dundee Realty Corporation 70% 70% 70% 70%DundeeWealth Inc. (note 4) - - 48% -
Ned Goodman Investment Counsel Limited 100% 100% 100% 100% The Corporation is incorporated under the Ontario Business Corporations Act and is domiciled in Canada. The Corporation’s head office is located at Dundee Place, 1 Adelaide Street East, Toronto, Ontario, Canada, M5C 2V9. The Corporation is listed on the Toronto Stock Exchange (“TSX”) under the symbol “DC.A”.
MA RCH 2012 – DUNDEE CORPORA TION 37
2 . B A S I S O F P R E P A R A T I O N
These unaudited condensed interim consolidated financial statements of the Corporation as at and for the three months ended March 31, 2012 (“March 2012 Interim Consolidated Financial Statements”) have been prepared in accordance with International Financial Reporting Standards (“IFRS”) as issued by the International Accounting Standards Board (“IASB”), applicable to the preparation of interim financial statements, including International Accounting Standard 34, “Interim Financial Reporting”. The March 2012 Interim Consolidated Financial Statements were authorized by the Board of Directors on May 15, 2012. The March 2012 Interim Consolidated Financial Statements follow the same accounting principles and methods of application as those disclosed in note 3 to the Corporation’s audited consolidated financial statements as at and for the year ended December 31, 2011 (“2011 Audited Consolidated Financial Statements”). The March 2012 Interim Consolidated Financial Statements do not include all disclosures required by IFRS for annual financial statements and accordingly, should be read in conjunction with the 2011 Audited Consolidated Financial Statements. The preparation of the March 2012 Interim Consolidated Financial Statements requires management to make judgments in applying its accounting policies and estimates and assumptions about the future. These judgments, estimates and assumptions affect the Corporation’s reported amounts of assets, liabilities, revenues and other items in earnings, and the related disclosure of contingent assets and liabilities, if any. The Corporation evaluates its estimates on an ongoing basis. Such estimates are based on historical experience and on various other assumptions that the Corporation believes are reasonable under the circumstances, and these estimates form the basis for making judgments about the carrying value of assets and liabilities and the reported amount of revenues and other items in earnings that are not readily apparent from other sources. Actual results may differ from these estimates under different assumptions or conditions. There have been no significant changes in accounting judgments, estimates and assumptions made by the Corporation in the preparation of the March 2012 Interim Consolidated Financial Statements from those judgments, estimates and assumptions disclosed in note 4 to the 2011 Audited Consolidated Financial Statements.
3 . A C C O U N T I N G S T A N D A R D S , I N T E R P R E T A T I O N S A N D A M E N D M E N T S T O E X I S T I N G S T A N D A R D S N O T Y E T E F F E C T I V E Accounting standards, interpretations and amendments to existing standards that are not yet effective are outlined in note 3 to the 2011 Audited Consolidated Financial Statements. The Corporation has not yet begun the process of assessing the impact that the new and amended standards will have on its consolidated financial statements.
4 . D I S C O N T I N U E D O P E R A T I O N S A N D D I V E S T M E N T O F D U N D E E W E A L T H I N C . On February 1, 2011, the Corporation sold its 48% interest in DundeeWealth Inc. (“DundeeWealth”) to The Bank of Nova Scotia (“Scotiabank”), pursuant to an offer made by Scotiabank on November 22, 2010. In exchange, the Corporation received 18,599,028 common shares of Scotiabank (each a “Scotiabank Common Share”) valued at $1,046,528,000 and 14,897,209 $25 3.70% 5-year rate reset preferred shares of Scotiabank (each a “Scotiabank Preferred Share”) valued at $372,430,000. In addition, the Corporation received a cash dividend of $155,982,000 and a dividend-in-kind of 74,484,956 common shares of Dundee Capital Markets pursuant to distributions made by DundeeWealth immediately prior to completion of the transaction as described above. The Corporation realized a gain of $870,828,000 from the divestment of its investment in DundeeWealth. The operating performance of DundeeWealth prior to completion of the transaction with Scotiabank has been included in the Corporation’s consolidated statements of operations and comprehensive income for the comparative period ended March 31, 2011 as “discontinued operations, net of taxes” and was comprised of the following amounts:
MA RCH 2012 – DUNDEE CORPORA TION 38
For the period fromJanuary 1, 2011 to February 1, 2011
Revenues 83,958$ Other items in net loss (93,971) Net loss before income taxes (10,013) Income taxes (9,987) Net loss for the period (20,000)$
Net loss attributable to:Owners of the parent (9,670)$ Non-controlling interest (10,330)
(20,000)$
Net loss for the period (20,000)$ Other comprehensive loss for the period, net of associated taxes of $3,061 (8,378) Comprehensive loss for the period (28,378)$
Comprehensive loss attributable to:Owners of the parent (13,676)$ Non-controlling interest (14,702)
(28,378)$ In connection with the transaction, each of the Corporation and Ned Goodman, the Corporation’s President and Chief Executive Officer, entered into a non-competition and non-solicitation agreement with Scotiabank which, among other things, restricts each of them for a period of three years ending February 1, 2014, from competing directly or indirectly with the business of DundeeWealth acquired by Scotiabank.
5. B U S I N E S S C O M B I N A T I O N S Acquisition of Blue Goose Capital Corporation On December 9, 2011, the Corporation acquired a 79% interest in Blue Goose Capital Corporation (“Blue Goose”) for cash of $12,000,000. Blue Goose is a privately-owned Canadian company operating in the organic and natural beef production market. Blue Goose has operations in both British Columbia and Ontario. During the three months ended March 31, 2012, Blue Goose generated revenues of $1,201,000 and it incurred a pre-tax comprehensive loss of $716,000. Acquisition of Dundee Securities Europe Ltd. (formerly “Middlemarch Partners Limited”) On November 11, 2011, the Corporation completed the acquisition of Dundee Securities Europe Ltd. (“DSE”) for cash of $2,831,000 (£1,700,000). DSE is a securities firm licensed with the Financial Services Authority in the United Kingdom. During the three months ended March 31, 2012, DSE generated revenues of $931,000 and it incurred a pre-tax comprehensive loss of $122,000. Acquisition of Torque Energy Inc. On August 4, 2011, Dundee Energy completed the acquisition of Torque Energy Inc. (“Torque”), a Canadian-based oil and natural gas company. On December 1, 2011, Dundee Energy converged the assets and operations acquired pursuant to the Torque transaction with its existing business in southern Ontario. A summary of the allocation of the aggregate consideration transferred in the above referenced business combinations, to the various identifiable assets and liabilities acquired is summarized as follows:

MA RCH 2012 – DUNDEE CORPORA TION 39
Blue Goose DSE TorqueNet assets acquired:Cash 2,625$ 2,050$ -$ Accounts receivable - 151 1,171 Resource properties - - 10,076 Livestock 3,339 - - Capital assets 6,916 38 - Other intangible assets 3,703 815 -
16,583 3,054 11,247 Corporate debt - - (1,429) Accounts payable and accrued liabilities (1,619) (140) (519) Income taxes payable - (83) - Decommissioning liability - - (2,169)
14,964$ 2,831$ 7,130$ Aggregate consideration transferred:Cash 12,000$ 2,831$ 6,012$ Equity in Dundee Energy - - 1,118 Attributed to non-controlling interest 2,964 - -
14,964$ 2,831$ 7,130$
6 . A C Q U I S I T I O N S A N D D I L U T I O N S O F I N T E R E S T S I N S U B S I D I A R I E S Transactions Completed During the Three Months Ended March 31, 2012
Effect on Contributed SurplusInterest Increase/ Changes in InterestOwned Decrease Equity of Owned
31-Dec-11 in Ownership Subsidiary 31-Mar -12Blue Goose Capital Corporation 81% 92$ -$ 79%Dundee Capital Markets Inc. 49% (4,977) - 100%Dundee Energy Limited 57% - 58 57%Dundee Realty Corporation 70% - (128) 70%Nichromet Extraction Inc. 70% (519) - 72%
Blue Goose Capital Corporation During the three months ended March 31, 2012, the Corporation acquired 1,221,500 newly issued common shares of Blue Goose for $12,215,000. Concurrent with the Corporation’s investment, Blue Goose issued shares to its non-controlling shareholders for cash and/or in consideration for asset acquisitions. On a net basis, the Corporation’s investment in Blue Goose was diluted from 81% at December 31, 2011 to 79% at March 31, 2012 and, accordingly, the Corporation recorded a dilution gain of $92,000 in contributed surplus. Dundee Capital Markets Inc. On February 1, 2012, the Corporation acquired all of Dundee Capital Markets’ outstanding common shares held by non-controlling shareholders at a price of $1.125 per share by way of a court approved plan of arrangement under the Business Corporations Act (Ontario). The Corporation paid $88,033,000 in respect of the transaction. The difference between the consideration paid and the carrying value of the non-controlling interest of $83,056,000, aggregating $4,977,000, was recorded as a decrease in contributed surplus. Nichromet Extraction Inc. During the three months ended March 31, 2012, the Corporation acquired 2,000,000 common shares of Nichromet Extraction Inc. for $600,000 pursuant to a private transaction. The acquisition increased the Corporation’s ownership to approximately
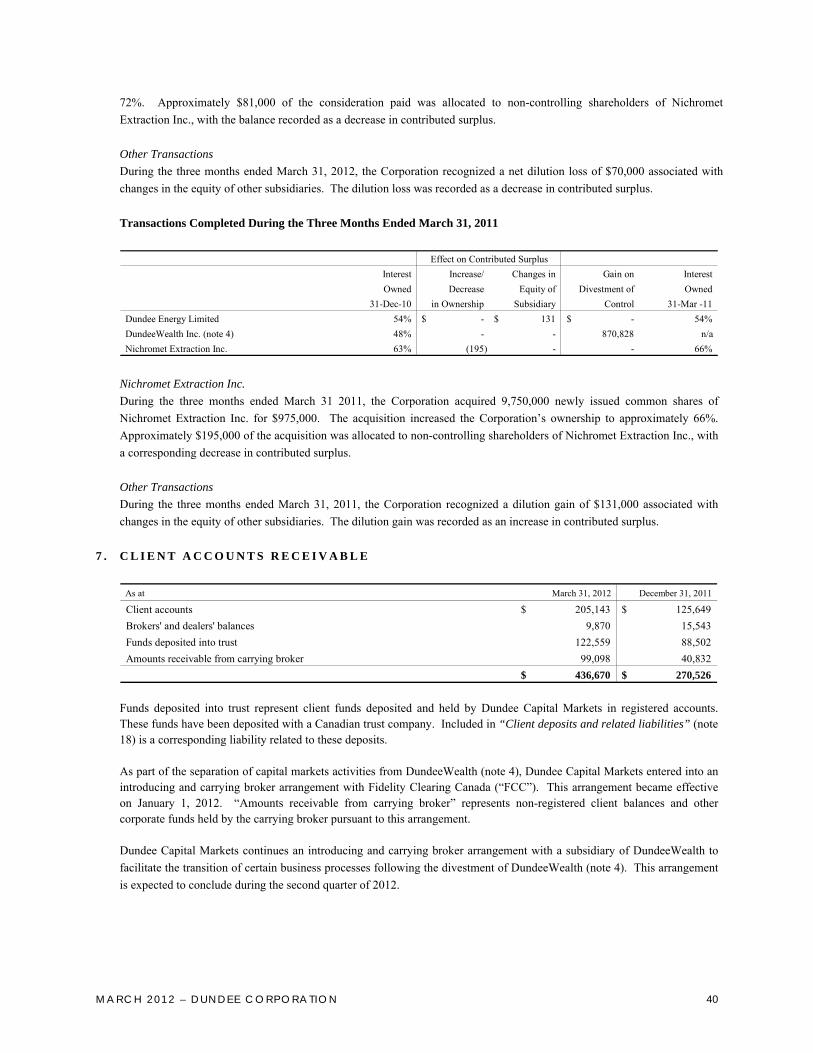
MA RCH 2012 – DUNDEE CORPORA TION 40
72%. Approximately $81,000 of the consideration paid was allocated to non-controlling shareholders of Nichromet Extraction Inc., with the balance recorded as a decrease in contributed surplus. Other Transactions During the three months ended March 31, 2012, the Corporation recognized a net dilution loss of $70,000 associated with changes in the equity of other subsidiaries. The dilution loss was recorded as a decrease in contributed surplus. Transactions Completed During the Three Months Ended March 31, 2011
Effect on Contributed SurplusInterest Increase/ Changes in Gain on InterestOwned Decrease Equity of Divestment of Owned
31-Dec-10 in Ownership Subsidiary Control 31-Mar -11Dundee Energy Limited 54% -$ 131$ -$ 54%DundeeWealth Inc. (note 4) 48% - - 870,828 n/a Nichromet Extraction Inc. 63% (195) - - 66%
Nichromet Extraction Inc. During the three months ended March 31 2011, the Corporation acquired 9,750,000 newly issued common shares of Nichromet Extraction Inc. for $975,000. The acquisition increased the Corporation’s ownership to approximately 66%. Approximately $195,000 of the acquisition was allocated to non-controlling shareholders of Nichromet Extraction Inc., with a corresponding decrease in contributed surplus. Other Transactions During the three months ended March 31, 2011, the Corporation recognized a dilution gain of $131,000 associated with changes in the equity of other subsidiaries. The dilution gain was recorded as an increase in contributed surplus.
7 . C L I E N T A C C O U N T S R E C E I V A B L E
As at March 31, 2012 December 31, 2011
Client accounts 205,143$ 125,649$ Brokers' and dealers' balances 9,870 15,543 Funds deposited into trust 122,559 88,502 Amounts receivable from carrying broker 99,098 40,832
436,670$ 270,526$ Funds deposited into trust represent client funds deposited and held by Dundee Capital Markets in registered accounts. These funds have been deposited with a Canadian trust company. Included in “Client deposits and related liabilities” (note 18) is a corresponding liability related to these deposits. As part of the separation of capital markets activities from DundeeWealth (note 4), Dundee Capital Markets entered into an introducing and carrying broker arrangement with Fidelity Clearing Canada (“FCC”). This arrangement became effective on January 1, 2012. “Amounts receivable from carrying broker” represents non-registered client balances and other corporate funds held by the carrying broker pursuant to this arrangement. Dundee Capital Markets continues an introducing and carrying broker arrangement with a subsidiary of DundeeWealth to facilitate the transition of certain business processes following the divestment of DundeeWealth (note 4). This arrangement is expected to conclude during the second quarter of 2012.
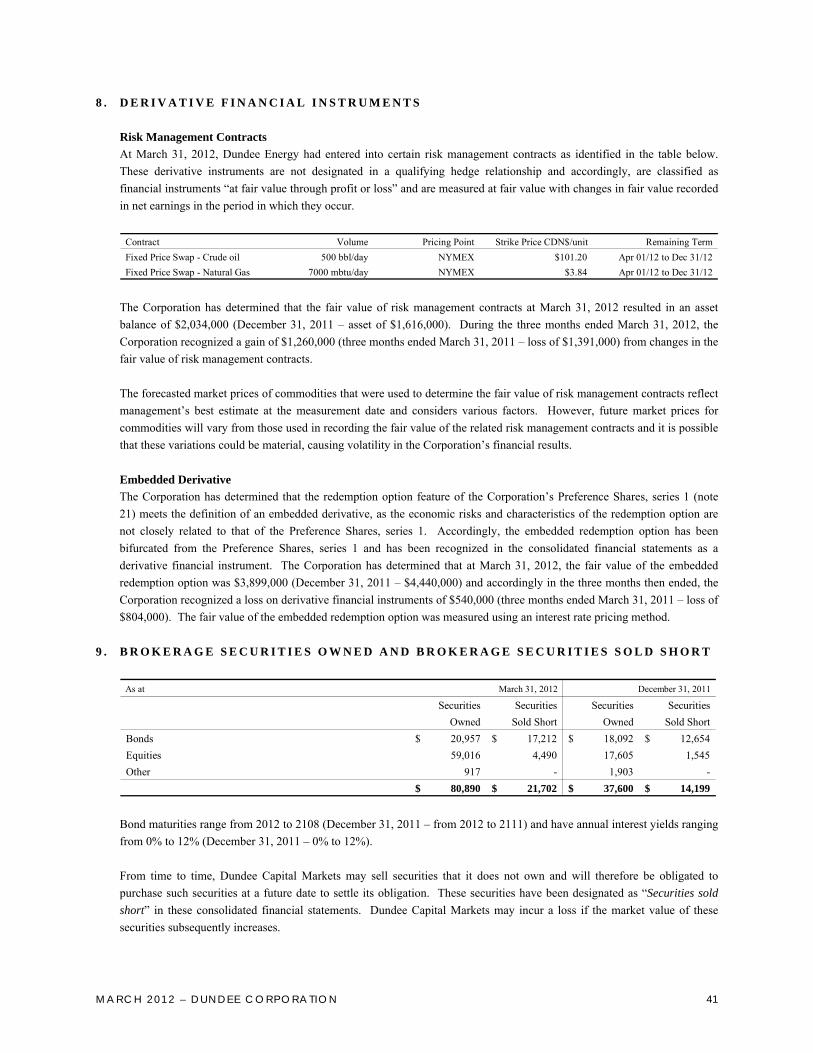
MA RCH 2012 – DUNDEE CORPORA TION 41
8 . D E R I V A T I V E F I N A N C I A L I N S T R U M E N T S Risk Management Contracts At March 31, 2012, Dundee Energy had entered into certain risk management contracts as identified in the table below. These derivative instruments are not designated in a qualifying hedge relationship and accordingly, are classified as financial instruments “at fair value through profit or loss” and are measured at fair value with changes in fair value recorded in net earnings in the period in which they occur.
Contract Volume Pricing Point Strike Price CDN$/unit Remaining TermFixed Price Swap - Crude oil 500 bbl/day NYMEX $101.20 Apr 01/12 to Dec 31/12Fixed Price Swap - Natural Gas 7000 mbtu/day NYMEX $3.84 Apr 01/12 to Dec 31/12
The Corporation has determined that the fair value of risk management contracts at March 31, 2012 resulted in an asset balance of $2,034,000 (December 31, 2011 – asset of $1,616,000). During the three months ended March 31, 2012, the Corporation recognized a gain of $1,260,000 (three months ended March 31, 2011 – loss of $1,391,000) from changes in the fair value of risk management contracts. The forecasted market prices of commodities that were used to determine the fair value of risk management contracts reflect management’s best estimate at the measurement date and considers various factors. However, future market prices for commodities will vary from those used in recording the fair value of the related risk management contracts and it is possible that these variations could be material, causing volatility in the Corporation’s financial results. Embedded Derivative The Corporation has determined that the redemption option feature of the Corporation’s Preference Shares, series 1 (note 21) meets the definition of an embedded derivative, as the economic risks and characteristics of the redemption option are not closely related to that of the Preference Shares, series 1. Accordingly, the embedded redemption option has been bifurcated from the Preference Shares, series 1 and has been recognized in the consolidated financial statements as a derivative financial instrument. The Corporation has determined that at March 31, 2012, the fair value of the embedded redemption option was $3,899,000 (December 31, 2011 – $4,440,000) and accordingly in the three months then ended, the Corporation recognized a loss on derivative financial instruments of $540,000 (three months ended March 31, 2011 – loss of $804,000). The fair value of the embedded redemption option was measured using an interest rate pricing method.
9 . B R O K E R A G E S E C U R I T I E S O W N E D A N D B R O K E R A G E S E C U R I T I E S S O L D S H O R T
As at March 31, 2012 December 31, 2011
Securities Securities Securities SecuritiesOwned Sold Short Owned Sold Short
Bonds 20,957$ 17,212$ 18,092$ 12,654$ Equities 59,016 4,490 17,605 1,545 Other 917 - 1,903 -
80,890$ 21,702$ 37,600$ 14,199$ Bond maturities range from 2012 to 2108 (December 31, 2011 – from 2012 to 2111) and have annual interest yields ranging from 0% to 12% (December 31, 2011 – 0% to 12%). From time to time, Dundee Capital Markets may sell securities that it does not own and will therefore be obligated to purchase such securities at a future date to settle its obligation. These securities have been designated as “Securities sold short” in these consolidated financial statements. Dundee Capital Markets may incur a loss if the market value of these securities subsequently increases.

MA RCH 2012 – DUNDEE CORPORA TION 42
1 0 . I N V E S T M E N T S
As at March 31, 2012 December 31, 2011
Cost Fair Value Cost Fair ValuePublicly traded securities 1,289,695$ 1,326,422$ 1,334,785$ 1,258,259$ Private investments 147,093 157,587 125,168 133,563 Mutual funds and other short term investments 5,782 6,752 5,782 5,785 Debt securities 99,688 103,395 89,612 87,362
1,542,258$ 1,594,156$ 1,555,347$ 1,484,969$ Amounts in “Publicly traded securities” include the Corporation’s interest in the Scotiabank Common Shares and the Scotiabank Preferred Shares, which the Corporation received in settlement of the Corporation’s divestment of its interest in DundeeWealth (note 4). During the three months ended March 31, 2012, the Corporation sold certain Scotiabank Common Shares and Scotiabank Preferred Shares for aggregate proceeds of $74,001,000. At March 31, 2012, the Corporation’s remaining investment in Scotiabank Common Shares and Scotiabank Preferred Shares had a cost of $1,090,737,000 and a fair value of $1,083,998,000. The Corporation recognizes changes in fair values of available-for-sale (“AFS”) securities, other than changes that are determined to be impairments in fair value, in other comprehensive income (“OCI”). During the three months ended March 31, 2012, the Corporation recognized a gain in OCI, net of taxes, of $104,184,000 (three months ended March 31, 2011 – $88,816,000) in respect of its portfolio of AFS securities. Amounts of unrealized gains transferred to net earnings in the three months ended March 31, 2012 are net of recognized impairments in fair value of $8,067,000 (three months ended March 31, 2011 – $nil).
1 1 . E Q U I T Y A C C O U N T E D I N V E S T M E N T S
As at March 31, 2012 December 31, 2011Trade Carrying CarryingSymbol Investment Ownership Value Ownership ValueD.UN Dundee Real Estate Investment Trust 6% 190,561$ 8% 174,577$ DPM Dundee Precious Metals Inc. 23% 121,739 23% 125,041 DI.UN Dundee International Real Estate Investment Trust 29% 104,630 29% 103,983 RYG Ryan Gold Corp. (formerly Valdez Gold Inc.) 12% 13,780 12% 13,830 VOX 360 VOX Corporation 22% 5,671 23% 6,053 CRG Corona Gold Corporation 26% 4,789 26% 5,123 ODX Odyssey Resources Limited 31% 569 31% 569
- Escal UGS S.L. 33% - 33% - 441,739$ 429,176$
The aggregate fair value of the Corporation’s equity accounted investments as at March 31, 2012 was $603,479,000 (December 31, 2011 – $569,048,000). Significant Transactions Affecting the Carrying Value of Equity Accounted Investments Dundee Real Estate Investment Trust During the three months ended March 31, 2012, Dundee REIT issued 12,580,347 units for the acquisition of Whiterock Real Estate Investment Trust, representing aggregate equity consideration of $434,800,000. In addition, Dundee REIT issued a further 6,555,000 units pursuant to a public offering for gross proceeds of $231,719,000. The Corporation purchased 364,800 Dundee REIT units pursuant to the public offering at a cost of $12,896,000. On a combined basis, these transactions diluted the Corporation’s ownership interest in Dundee REIT from 8% at the end of the prior year to 6% at

MA RCH 2012 – DUNDEE CORPORA TION 43
March 31, 2012. The Corporation continues to account for its investment in Dundee REIT on an equity basis as it is able to exert significant influence over the operations and financial results of Dundee REIT through its representation on the board of trustees of Dundee REIT, through services arrangements and through senior management representation. During the first three months of the prior year, Dundee REIT completed a public offering of 4,749,500 units for gross proceeds of $143,910,000. The Corporation did not participate in the offering, resulting in a dilution of the Corporation’s interest. Escal UGS S.L. (“Escal”) During the three months ended March 31, 2012, Escal issued 24 par value shares for €1,000 (year ended December 31, 2011 – 99 par value shares for €5,000). To maintain its proportionate interest in Escal, the Corporation’s subsidiary acquired eight of the newly issued shares (year ended December 31, 2011 – 33) for a nominal amount (year ended December 31, 2011 – $3,000; €2,000). In addition and in order to comply with minimum equity to debt ratio requirements, the majority shareholder in Escal also contributed an issuance premium on the newly issued shares of €3,553,472 (year ended December 31, 2011 – €14,659,000) and it issued €3,200,000 (year ended December 31, 2011 – €43,300,000) in subordinated loans. The Corporation’s subsidiary has not recognized the benefit of its 33% interest in the issuance premium and subordinated loans as the ultimate realization and measurement of the benefit is subject to a significant number of risks and uncertainties, including but not limited to, execution risk associated with the construction of the project, the availability and terms of future financing arrangements and the 50-year life span of the project. Escal has established a hedging strategy to mitigate its exposure to interest rate risk associated with its project financing agreement. At March 31, 2012, the fair value of Escal’s obligations in respect of these hedging strategies was approximately €59,066,000 (year ended December 31, 2011 – €74,790,000). Recognition of these losses draws the Corporation’s carrying value in Escal to zero. At March 31, 2012, the Corporation had not recorded a liability of $20,422,000 (year ended December 31, 2011 – $27,108,000) related to additional losses incurred by Escal, as it does not have the legal or constructive obligation in respect thereof. Share of Earnings from Equity Accounted Investments During the three months ended March 31, 2012, the Corporation’s share of earnings from equity accounted investments, including its share of earnings from real estate joint venture investments (note 12), was $10,630,000 (three months ended March 31, 2011 – $15,260,000).
For the three months ended
March 31, 2012 March 31, 2011
Dundee Real Estate Investment Trust 5,962$ 3,907$ Dundee Precious Metals Inc. 3,075 3,379 Dundee International Real Estate Investment Trust 1,979 - Ryan Gold Corp. (formerly Valdez Gold Inc.) (50) (290) 360 VOX Corporation (554) - Corona Gold Corporation 149 19 Odyssey Resources Limited - (40) Escal UGS S.L. - 5 Breakwater Resources Ltd. - 8,020
10,561 15,000 Real estate joint venture investments 69 260
10,630$ 15,260$
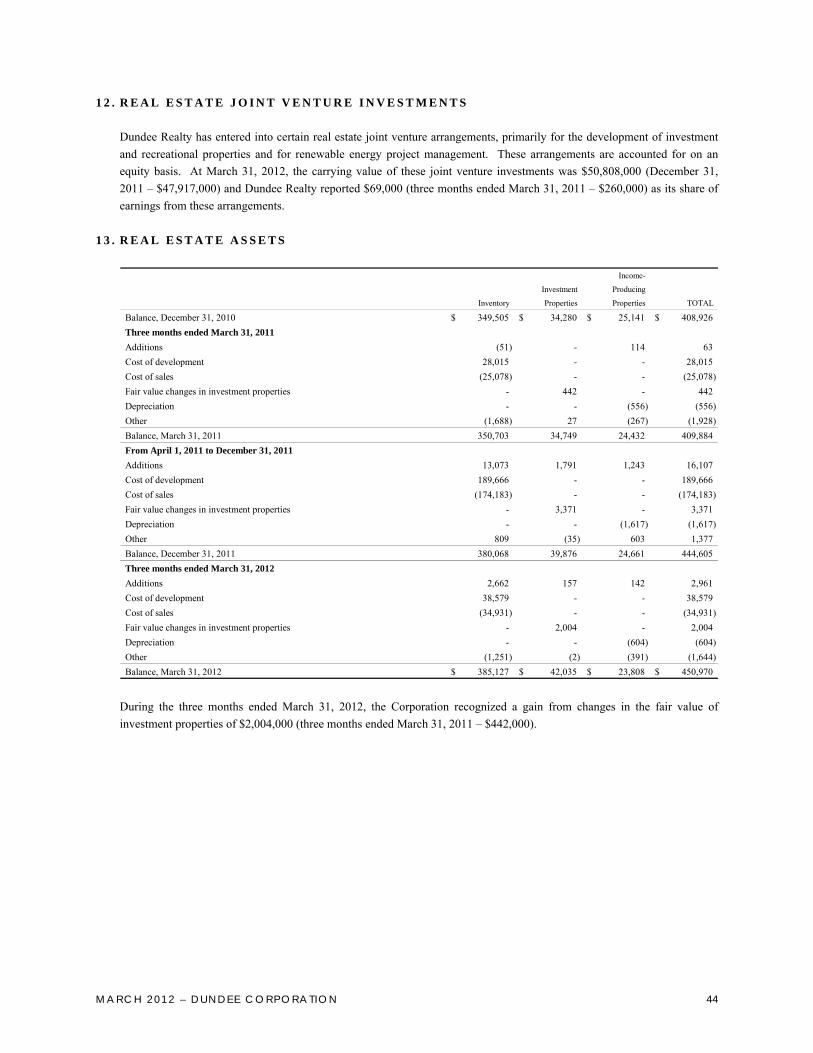
MA RCH 2012 – DUNDEE CORPORA TION 44
1 2 . R E A L E S T A T E J O I N T V E N T U R E I N V E S T M E N T S Dundee Realty has entered into certain real estate joint venture arrangements, primarily for the development of investment and recreational properties and for renewable energy project management. These arrangements are accounted for on an equity basis. At March 31, 2012, the carrying value of these joint venture investments was $50,808,000 (December 31, 2011 – $47,917,000) and Dundee Realty reported $69,000 (three months ended March 31, 2011 – $260,000) as its share of earnings from these arrangements.
1 3 . R E A L E S T A T E A S S E T S
Income-
Investment Producing
Inventory Properties Properties TOTAL
Balance, December 31, 2010 349,505$ 34,280$ 25,141$ 408,926$ Three months ended March 31, 2011Additions (51) - 114 63 Cost of development 28,015 - - 28,015 Cost of sales (25,078) - - (25,078) Fair value changes in investment properties - 442 - 442 Depreciation - - (556) (556) Other (1,688) 27 (267) (1,928) Balance, March 31, 2011 350,703 34,749 24,432 409,884 From April 1, 2011 to December 31, 2011Additions 13,073 1,791 1,243 16,107 Cost of development 189,666 - - 189,666 Cost of sales (174,183) - - (174,183) Fair value changes in investment properties - 3,371 - 3,371 Depreciation - - (1,617) (1,617) Other 809 (35) 603 1,377 Balance, December 31, 2011 380,068 39,876 24,661 444,605 Three months ended March 31, 2012Additions 2,662 157 142 2,961 Cost of development 38,579 - - 38,579 Cost of sales (34,931) - - (34,931) Fair value changes in investment properties - 2,004 - 2,004 Depreciation - - (604) (604) Other (1,251) (2) (391) (1,644) Balance, March 31, 2012 385,127$ 42,035$ 23,808$ 450,970$
During the three months ended March 31, 2012, the Corporation recognized a gain from changes in the fair value of investment properties of $2,004,000 (three months ended March 31, 2011 – $442,000).

MA RCH 2012 – DUNDEE CORPORA TION 45
1 4 . R E S O U R C E P R O P E R T I E S
Explorationand Evaluation
Oil and Gas Machinery LandDevelopment Pipeline and and Undeveloped
Costs Infrastructure Equipment Buildings Other Properties TOTALAt December 31, 2010Cost 107,172$ 23,408$ 21,662$ 4,525$ 6,975$ 6,780$ 170,523$ Accumulated depreciation and depletion (5,194) (926) (554) (12) (673) - (7,360) Net carrying value, December 31, 2010 101,978 22,482 21,108 4,513 6,302 6,780 163,163
Three months ended March 31, 2011Carrying value January 1, 2011 101,978 22,482 21,108 4,513 6,302 6,780 163,163 Net additions 272 1,227 60 - (774) 491 1,276 Remeasure decommissioning liability (note 20) (760) - - - - - (760) Depreciation and depletion (2,664) (485) (275) (6) (29) - (3,459) Net carrying value, March 31, 2011 98,826 23,224 20,893 4,507 5,499 7,271 160,220
At March 31, 2011Cost 106,684 24,635 21,722 4,525 6,201 7,271 171,039 Accumulated depreciation and depletion (7,858) (1,411) (829) (18) (702) - (10,819) Net carrying value, March 31, 2011 98,826 23,224 20,893 4,507 5,499 7,271 160,220
From April 1, 2011 to December 31, 2011Carrying value March 31, 2011 98,826 23,224 20,893 4,507 5,499 7,271 160,220 Acquisitions (note 5) 6,948 - 1,166 55 4 1,903 10,076 Net additions 5,596 682 2,160 - (3,090) 7,080 12,428 Remeasure decommissioning liability (note 20) 10,942 - - - - - 10,942 Depreciation and depletion (9,281) (1,548) (1,013) (19) (115) - (11,976) Net carrying value, December 31, 2011 113,031 22,358 23,206 4,543 2,298 16,254 181,690
At December 31, 2011Cost 130,170 25,317 25,048 4,580 3,115 16,254 204,485 Accumulated depreciation and depletion (17,139) (2,959) (1,842) (37) (817) - (22,795) Net carrying value, December 31, 2011 113,031 22,358 23,206 4,543 2,298 16,254 181,690
Three months ended March 31, 2012Carrying value January 1, 2011 113,031 22,358 23,206 4,543 2,298 16,254 181,690 Net additions 219 135 22 - 46 1,407 1,829 Remeasure decommissioning liability (note 20) (1,335) - - - - - (1,335) Depreciation and depletion (2,949) (437) (334) (6) (30) - (3,756) Net carrying value, March 31, 2012 108,966 22,056 22,894 4,537 2,314 17,661 178,428
At March 31, 2012Cost 129,054 25,452 25,070 4,580 3,161 17,661 204,979 Accumulated depreciation and depletion (20,088) (3,396) (2,176) (43) (847) - (26,551) Net carrying value, March 31, 2012 108,966$ 22,056$ 22,894$ 4,537$ 2,314$ 17,661$ 178,428$
Property, Plant and Equipment
1 5 . L I V E S T O C K During the three months ended March 31, 2012, changes in the Corporation’s livestock, including biological assets and associated inventory, are as follows:
Biological
Inventory Assets TOTAL
From April 1, 2011 to December 31, 2011Acquisitions and additions 610$ 4,161$ 4,771$ Balance, December 31, 2011 610 4,161 4,771 Three months ended March 31, 2012Acquisitions and additions 1,889 598 2,487 Fair value changes - 987 987 Transfer to operating costs (545) - (545) Balance, March 31, 2012 1,954$ 5,746$ 7,700$

MA RCH 2012 – DUNDEE CORPORA TION 46
1 6 . C A P I T A L A N D O T H E R A S S E T S
Computer and OtherFurniture and Network Intangible
Fixtures Equipment Land Other Trademarks Assets TOTALAt December 31, 2010Cost 5,176$ 4,236$ 1,647$ 12,890$ 13,279$ 17,872$ 55,101$ Accumulated depreciation and depletion (4,387) (3,850) - (5,525) (3,585) - (17,348) Net carrying value, December 31, 2010 789 386 1,647 7,365 9,694 17,872 37,753
Three months ended March 31, 2011Carrying value December 31, 2010 789 386 1,647 7,365 9,694 17,872 37,753 Net additions 47 35 - 113 223 2,208 2,626 Depreciation and depletion (137) (77) - (271) (223) (110) (818) Net carrying value, March 31, 2011 699 344 1,647 7,207 9,694 19,970 39,561
At March 31, 2011Cost 5,223 4,271 1,647 13,003 13,502 20,080 57,727 Accumulated depreciation and depletion (4,524) (3,927) - (5,796) (3,808) (110) (18,166) Net carrying value, March 31, 2011 699 344 1,647 7,207 9,694 19,970 39,561
From April 1, 2011 to December 31, 2011Carrying value March 31, 2011 699 344 1,647 7,207 9,694 19,970 39,561 Acquisitions (note 5) 38 - 6,416 500 - 4,518 11,472 Net additions (dispositions) 745 287 (153) 2,347 393 2,484 6,103 Depreciation and depletion (298) (219) - (1,965) (684) (1,305) (4,471) Net carrying value, December 31, 2011 1,184 412 7,910 8,089 9,403 25,667 52,665
At December 31, 2011Cost 6,006 4,558 7,910 15,850 13,895 27,082 75,301 Accumulated depreciation and depletion (4,822) (4,146) - (7,761) (4,492) (1,415) (22,636) Net carrying value, December 31, 2011 1,184 412 7,910 8,089 9,403 25,667 52,665
Three months ended March 31, 2012Carrying value December 31, 2011 1,184 412 7,910 8,089 9,403 25,667 52,665 Net additions (dispositions) (381) 56 9,045 3,155 79 40 11,994 Depreciation and depletion (80) (70) (60) (781) (232) (133) (1,356) Net carrying value, March 31, 2012 723 398 16,895 10,463 9,250 25,574 63,303
At March 31, 2012Cost 5,625 4,614 16,955 19,005 13,974 27,122 87,295 Accumulated depreciation and depletion (4,902) (4,216) (60) (8,542) (4,724) (1,548) (23,992) Net carrying value, March 31, 2012 723$ 398$ 16,895$ 10,463$ 9,250$ 25,574$ 63,303$
Capital Assets Intangible Assets
1 7 . B A N K I N D E B T E D N E S S From time to time, Dundee Capital Markets may utilize call loan arrangements to facilitate the securities settlement process for both client and principal securities transactions, or to fund margin lending. In connection with the establishment of an introducing and carrying broker arrangement with a third-party service provider on January 1, 2012, Dundee Capital Markets arranged for an uncommitted call loan facility for up to $75 million. At December 31, 2011 and March 31, 2011, there were no call loan facilities available to the brokerage subsidiary. At March 31, 2012, Dundee Capital Markets had drawn $24,497,000 pursuant to these arrangements. Interest rates on amounts drawn were 1.50% on Canadian dollar denominated borrowings and ranged from 0.45% to 1.00% on borrowings denominated in U.S. dollars.

MA RCH 2012 – DUNDEE CORPORA TION 47
1 8 . C L I E N T D E P O S I T S A N D R E L A T E D L I A B I L I T I E S
As at March 31, 2012 December 31, 2011
Client accounts 436,116$ 303,817$ Brokers' and dealers' balances 31,321 17,007 International banking client accounts 2,786 9,127
470,223$ 329,951$
1 9 . C O R P O R A T E D E B T At March 31, 2012 and December 31, 2011, the fair value of corporate debt approximated its carrying value.
As at March 31, 2012 December 31, 2011
Corporate$225 million revolving term credit facility due November 11, 2012 224,886$ 224,265$ $25 million fixed term credit facility due June 29, 2012 25,000 42,800 $8.6 million, 5.85% exchangeable unsecured subordinated debentures due June 30, 2015 9,955 9,883 Subsidiaries$80 million demand revolving credit facility, Dundee Energy 59,587 59,191 $190 million revolving term credit facility, Dundee Realty, due November 30, 2013 85,000 88,000 Other real estate debt 128,405 122,458
532,833$ 546,597$ $225,000,000 Revolving Term Credit Facility On October 21, 2011, the Corporation established a $225 million revolving term credit facility with a Canadian Schedule I Chartered Bank which matures on November 11, 2012. Borrowings under the credit facility bear interest at a rate per annum equal to the bank’s prime lending rate for loans plus 0.75% or, at the Corporation’s option, at the prevailing bankers’ acceptance or London Inter-Bank Offer Rate plus 1.75%. Unused amounts available under the facility are subject to an annual standby fee of 0.39375%. Draws against the revolving term credit facility are contingent on, among other things, the pledge of certain of the Corporation’s investments. The facility is subject to certain other covenants, including the maintenance of certain financial ratios and restrictions on the existence of other secured indebtedness, restrictions on the redemption, purchase or repayment of the Corporation’s outstanding exchangeable debentures (see below), and restrictions on the prepayment and payment of interest on these exchangeable debentures. At March 31, 2012, the Corporation had drawn $224,886,000 against this facility. During the three months ended March 31, 2012, interest expense relating to the Corporation’s revolving term credit facility, including standby fees and other similar costs, was $2,063,000 (three months ended March 31, 2011 – $277,000). $25,000,000 Fixed Term Credit Facility In connection with the establishment of the Corporation’s $225 million revolving term credit facility in October 2011, the Corporation also arranged for a $100 million fixed term credit facility as a “bulge” amount to the $225 million revolving term credit facility. The fixed term credit facility was originally established to facilitate the Corporation’s substantial issuer bid completed in October 2011 (note 22). Under the terms of the fixed term credit facility, any prepayments made by the Corporation will reduce borrowing availability by an equal amount. Accordingly, availability under the fixed term credit facility was reduced to $25 million at March 31, 2012, and any amounts outstanding must be fully repaid by June 29, 2012, after which the availability will be extinguished. During the three months ended March 31, 2012, interest expense relating to the fixed term credit facility was $385,000.
MA RCH 2012 – DUNDEE CORPORA TION 48
Subsequent to March 31, 2012, the Corporation made further prepayments of $8,550,000 towards this fixed term facility, reducing amounts available to $16,450,000. $8,559,000, 5.85% Exchangeable Unsecured Subordinated Debentures At March 31, 2012, the Corporation had 8,559 outstanding exchangeable unsecured subordinated debentures with a par value per debenture of $1,000. The exchangeable debentures mature on June 30, 2015 and bear interest at 5.85% per annum, payable semi-annually on June 30 and December 31 of each year. Each exchangeable debenture may be exchanged, at the option of the holder for 33.6134 units of Dundee REIT, representing a conversion price of $29.75 per Dundee REIT unit. During the three months ended March 31, 2012, an aggregate of $623,000 of exchangeable debentures were surrendered for exchange and the Corporation delivered 20,939 units of Dundee REIT in settlement thereof. The carrying value of the exchangeable debentures is adjusted in the Corporation’s consolidated financial statements to reflect the fair value of the embedded exchange feature, provided that such adjustment does not result in a carrying value that is below the principal value of the exchangeable debentures outstanding. The fair value of the exchange feature is determined using a valuation model that recognizes both the debt and exchange feature of the debentures and is based on the premise that each of these components have different default risks. Changes in the fair value of the exchange feature are recorded in net earnings. Based on this valuation model, the Corporation determined that the value of the exchangeable debentures at March 31, 2012 was $10,121,000. $80,000,000 Demand Revolving Credit Facility, Dundee Energy Limited Dundee Energy Limited Partnership (“DELP”), a subsidiary of Dundee Energy, has established an $80 million credit facility with a syndicate comprised of certain Canadian chartered banks. The credit facility provides the subsidiary with a revolving demand loan, subject to a tiered interest rate structure based on its net debt to cash flow ratio, as defined in the credit facility. Based on current ratios, draws on the credit facility bear interest, at the option of the subsidiary, at either the bank’s prime lending rate plus 3.0% for loans or letters of credit, or, for bankers’ acceptances, at the bank’s then prevailing bankers’ acceptance rate plus 4.0%. DELP is also subject to a standby fee of 0.55% on unused amounts under the credit facility. During the three months ended March 31, 2012, interest expense relating to Dundee Energy’s credit facility, including standby fees and other similar costs, was $831,000 (three months ended March 31, 2011 – $825,000). The credit facility is secured against all of the oil and natural gas properties owned by DELP. In addition, Dundee Energy has assigned a limited recourse guarantee of its units in the subsidiary as further security pursuant to the credit facility. The credit facility is subject to certain covenants, including maintenance of minimum levels of working capital. At March 31, 2012, Dundee Energy was in compliance with all such covenants. At March 31, 2012, the subsidiary had drawn $63,370,000 pursuant to the credit facility, including a letter of credit for $3,270,000. $190,000,000 Revolving Term Credit Facility, Dundee Realty Corporation Dundee Realty has established a revolving term credit facility available up to a formula based maximum not to exceed $190 million with a Canadian Schedule I Chartered Bank. The facility bears interest, at Dundee Realty’s option, at a rate per annum equal to either the bank’s prime lending rate plus 1.25% or at the bank’s then prevailing bankers’ acceptance rate plus 2.50%. The facility was renewed on February 1, 2012 and expires on November 30, 2013, except for $40 million which matures and must be repaid on September 15, 2012. The facility is secured by a general security agreement and a first charge against various real estate assets in western Canada. Interest expense relating to this revolving term credit facility during the three months ended March 31, 2012 was $1,130,000 (three months ended March 31, 2011 – $1,136,000). At March 31, 2012, Dundee Realty had drawn $85,000,000 against this facility and it had issued letters of credit of $73,542,000.

MA RCH 2012 – DUNDEE CORPORA TION 49
Other Real Estate Debt Other real estate debt is secured by charges on specific properties to which the debt relates. Mortgages, including land mortgages, are secured by charges on specific properties. Housing advances are secured by charges on specific land under development, housing and condominiums under development, or land held for development. Term debt is secured by charges on specific capital equipment. At March 31, 2012, the weighted average interest rate on fixed rate debt at Dundee Realty, aggregating $43,732,000, was 7.54%. The remaining real estate debt, including in respect of Dundee Realty’s demand revolving term credit facilities, is subject to variable interest rates with a weighted average rate at March 31, 2012 of 4.01%. Fixed rate debt matures between 2012 and 2021. Variable rate debt, including the revolving term credit facility, matures between 2012 and 2018. During the three months ended March 31, 2012, Dundee Realty capitalized interest of $691,000 (three months ended March 31, 2011 – $413,000), including interest incurred on its revolving term credit facility and on other real estate debt, to the carrying value of certain real estate assets.
2 0 . D E C O M M I S S I O N I N G L I A B I L I T I E S The carrying value of the Corporation’s decommissioning liabilities is comprised of the expected future abandonment and site restoration costs associated with resource properties. The Corporation has estimated its abandonment and reclamation costs based on the Corporation’s net ownership in these assets, the estimated cost to abandon and reclaim these properties, including the associated facilities, and the estimated timing of the costs to be incurred in future periods.
Three months ended March 31, 2012 Year ended December 31, 2011
Undiscounted future obligations, beginning of period 84,686$ 81,578$ Acquisition (note 5) - 4,621 Effect of changes in estimates 95 (63) Liabilities settled (reclamation expenditures) (1,007) (1,450) Undiscounted future obligations, end of period 83,774$ 84,686$
Changes in estimates recognized during the three months ended March 31, 2012 reflect the impact of inflation to the timing of abandonment and restoration costs related to certain land and buildings used in production. The following table reconciles the Corporation’s decommissioning liabilities on a discounted basis.
Three months ended March 31, 2012 Year ended December 31, 2011
Discount rates applied to future obligations 1.19% - 2.56% 0.95% - 2.42%Inflation rate 2.00% 2.00%Discounted future obligations, beginning of period 45,234$ 33,391$ Acquisition (note 5) - 2,169 Effect of changes in estimates and remeasurement of discount and foreign exchange rates (1,240) 10,076 Liabilities settled (reclamation expenditures) (1,007) (1,450) Accretion 241 1,048 Discounted future obligations, end of period 43,228$ 45,234$

MA RCH 2012 – DUNDEE CORPORA TION 50
2 1 . P R E F E R E N C E S H A R E S The terms of the Corporation’s preference shares are summarized in note 23 to the Corporation’s 2011 Audited Consolidated Financial Statements. Issued and Outstanding First Preference Shares, Series 1 (“Preference Shares, series 1”)
Number Par Issue Carrying
of Shares Value Costs Premium Value
Balance as at December 31, 2010 6,000,000 150,000$ (2,608)$ 680$ 148,072$ Amortization for the three months ended March 31, 2011 - - 119 (31) 88 Balance as at March 31, 2011 6,000,000 150,000 (2,489) 649 148,160 Amortization for the period from April 1, 2011 to December 31, 2011 - - 355 (92) 263 Balance as at December 31, 2011 6,000,000 150,000 (2,134) 557 148,423 Amortization for the three months ended March 31, 2012 - - 118 (31) 87 Balance as at March 31, 2012 6,000,000 150,000$ (2,016)$ 526$ 148,510$
Issued and Outstanding First Preference Shares, Series 2 (“Preference Shares, series 2”)
Number Par Issue Carrying
of Shares Value Costs Value
Balance as at March 31, 2012 and December 31, 2011 5,200,000 130,000$ (2,932)$ 127,068$
2 2 . S H A R E C A P I T A L The terms of the Corporation’s Class A subordinate voting shares (“Subordinate Shares”) and Class B common shares (“Class B Shares”), and significant transactions in respect thereof during the year ended December 31, 2011, are summarized in note 24 to the Corporation’s 2011 Audited Consolidated Financial Statements.

MA RCH 2012 – DUNDEE CORPORA TION 51
Issued and Outstanding
Number Amount Number Amount Number AmountOutstanding December 31, 2010 67,545,747 265,249$ 3,119,269 8,165$ 70,665,016 273,414$ Transactions during the three months ended March 31, 2011Redeemed pursuant to normal course issuer bid (1,618,797) (6,452) - - (1,618,797) (6,452) Issuance of shares under the share incentive plan 1,541 35 - - 1,541 35 Options exercised 3,000 32 - - 3,000 32 Conversion from Class B Shares to Subordinate Shares 24 - (24) - - - Outstanding March 31, 2011 65,931,515 258,864 3,119,245 8,165 69,050,760 267,029 Transactions during the period from April 1, 2011 to December 31, 2011Redeemed pursuant to substantial issuer bid (10,000,000) (39,866) - - (10,000,000) (39,866) Redeemed pursuant to normal course issuer bid (4,207,351) (16,770) - - (4,207,351) (16,770) Issuance of shares under the share incentive plan 4,452 105 - - 4,452 105 Options exercised 5,000 75 - - 5,000 75 Conversion from Class B Shares to Subordinate Shares 2,408 6 (2,408) (6) - - Outstanding December 31, 2011 51,736,024 202,414 3,116,837 8,159 54,852,861 210,573 Transactions during the three months ended March 31, 2012Issuance of shares under the share incentive plan 1,456 35 - - 1,456 35 Options exercised 112,000 634 - - 112,000 634 Conversion from Class B Shares to Subordinate Shares 395 1 (395) (1) - - Outstanding March 31, 2012 51,849,875 203,084$ 3,116,442 8,158$ 54,966,317 211,242$
SUBORDINATE SHARES CLASS B SHARES TOTAL
Normal Course Issuer Bid On March 29, 2012, the Corporation announced that it had received regulatory approval for the renewal of its normal course issuer bid from April 1, 2012 to March 31, 2013. Subject to certain conditions, the Corporation may purchase up to a maximum of 2,789,554 Subordinate Shares pursuant to these arrangements, representing approximately 10% of its public float at the time approval for the normal course issuer bid was granted. Share Purchase Plan As part of its share incentive arrangements, the Corporation established a share purchase plan pursuant to which eligible participants may contribute up to a specified maximum amount of their basic annual salary towards the purchase of Subordinate Shares of the Corporation, either from treasury or in the open market, at the discretion of the Corporation. Compensation expense associated with the share purchase plan during the three months ended March 31, 2012 was $145,000 (three months ended March 31, 2011 – $130,000). During the three months ended March 31, 2012, the Corporation issued 1,456 Subordinate Shares for $35,000 (three months ended March 31, 2011 – 1,541 Subordinate Shares for $35,000) from treasury pursuant to the share purchase plan, with the balance of the amounts contributed to the share purchase plan being used to purchase shares in the open market.

MA RCH 2012 – DUNDEE CORPORA TION 52
2 3 . A C C U M U L A T E D O T H E R C O M P R E H E N S I V E I N C O M E ( L O S S )
Net unrealized (loss) gains, net of taxesAvailable- Equity Foreign Non-
for-Sale Accounted Currency controlling DiscontinuedSecurities Investments Translation Interest Operations Total
Balance at December 31, 2010 65,466$ 7,454$ (1,310)$ 1,433$ 17,152$ 90,195$
Transactions during the three months ended March 31, 2011Other comprehensive income (loss) 88,816 (3,796) (363) 719 (17,152) 68,224 Balance at March 31, 2011 154,282 3,658 (1,673) 2,152 - 158,419 Transactions during the period from April 1, 2011 to December 31, 2011Other comprehensive (loss) income (220,075) (7,832) 853 1,491 - (225,563) Balance at December 31, 2011 (65,793) (4,174) (820) 3,643 - (67,144)
Transactions during the three months ended March 31, 2012Other comprehensive income (loss) 104,184 (3,896) (696) 212 - 99,804
Balance at March 31, 2012 38,391$ (8,070)$ (1,516)$ 3,855$ -$ 32,660$
2 4 . N O N - C O N T R O L L I N G I N T E R E S T
As at March 31, 2012 December 31, 2011
Non-controlling interest in:Dundee Realty Corporation 92,357$ 88,817$ Dundee Capital Markets Inc. (note 6) - 83,056 Dundee Energy Limited 31,750 31,906 Other 10,755 7,696
134,862$ 211,475$
2 5 . R E V E N U E S
For the three months ended
March 31, 2012 March 31, 2011
Management fees 18,224$ 11,452$ Financial services 32,554 33,569 Real estate 57,643 49,113 Oil and gas, net of royalties 8,074 8,072 Agriculture 1,201 - Interest and dividends 13,587 15,614
131,283$ 117,820$

MA RCH 2012 – DUNDEE CORPORA TION 53
2 6 . C O S T O F S A L E S
For the three months ended
March 31, 2012 March 31, 2011
Variable compensation 17,849$ 19,158$ Real estate expenses 47,948 35,723 Oil and gas expenses 3,045 2,898 Agriculture expenses 1,650 -
70,492$ 57,779$
2 7 . S H A R E I N C E N T I V E P L A N A R R A N G E M E N T S The terms of the Corporation’s share based compensation plans are summarized in note 29 to the Corporation’s 2011 Audited Consolidated Financial Statements. Share Based Compensation During the three months ended March 31, 2012, the Corporation recognized share based compensation expense of $556,000 (three months ended March 31, 2011 – $541,000) related to share incentive arrangements, before similar arrangements of its subsidiaries, as described in the following table.
For the three months ended
March 31, 2012 March 31, 2011
Share option plan 275$ 260$ Deferred share unit plan 281 281
556$ 541$ Share Option Plan There were no share option awards granted in the three months ended March 31, 2012 and the year ended December 31, 2011. A summary of the status of the Corporation’s share option plan as at March 31, 2012 and December 31, 2011, and the changes during the three months and the year then ended, is as follows:
Three months ended March 31, 2012 Year ended December 31, 2011
Weighted Weighted
Number of Average Number of Average
Options Exercise Price Options Exercise Price
Outstanding, beginning of period 1,402,000 $9.09 1,533,000 $8.72Exercised (112,000) $5.41 (131,000) $4.80Outstanding, end of period 1,290,000 $9.40 1,402,000 $9.09Exercisable options 501,000 $9.40 613,000 $8.67
Weighted
Average
Remaining
Options Contractual Options
Exercise Price Outstanding Life (Years) Exercisable
Options issued with an exercise price of $9.40 1,270,000 2.87 496,000 Options issued with an exercise price of $9.67 20,000 2.87 5,000

MA RCH 2012 – DUNDEE CORPORA TION 54
Deferred Share Unit Plan During the three months ended March 31, 2012, the Corporation issued 13,292 (three months ended March 31, 2011 – 11,426) deferred share units (“DSUs”) to certain employees and directors of the Corporation, each DSU entitling the holder thereof to a Subordinate Share on retirement. At March 31, 2012, there were 1,129,641 (December 31, 2011 – 1,116,349) DSUs outstanding. Share Incentive Plan of Dundee Energy Dundee Energy has established a share incentive plan for its directors, officers and employees. As at March 31, 2012, Dundee Energy had 5,665,000 share options outstanding (December 31, 2011 – 5,665,000) at a weighted average exercise price of $0.92 (December 31, 2011 – $0.92), of which 4,593,332 share options were exercisable at March 31, 2012 (December 31, 2011 – 4,593,332). Dundee Energy also has a deferred share unit plan pursuant to which, at March 31, 2012, there were 661,949 (December 31, 2011 – 603,830) deferred share units outstanding. During the three months ended March 31, 2012, compensation expense of $106,000 (three months ended March 31, 2011 – $241,000) was recognized in respect of Dundee Energy’s share option and deferred share unit arrangements. Share Based Compensation of Other Subsidiaries From time to time, other subsidiaries of the Corporation may incur share based compensation expense pursuant to their respective share incentive plan arrangements. During the three months ended March 31, 2012, other subsidiaries recognized share based compensation of $173,000 (three months ended March 31, 2011 – $2,000).
2 8 . G E N E R A L A N D A D M I N I S T R A T I V E E X P E N S E S B Y N A T U R E
For the three months ended
March 31, 2012 March 31, 2011
Salary and salary-related 16,914$ 30,475$ Corporate and professional fees 7,959 6,531 General office 7,863 6,780 Capitalized expenditures (3,224) (2,906) Expense recoveries (445) (483) Other 2,491 1,185
31,558$ 41,582$
2 9 . I N C O M E T A X E S During the three months ended March 31, 2012, the Corporation recognized an income tax expense amount on earnings from continuing operations of $14,911,000 (three months ended March 31, 2011 – $5,022,000), the major components of which include the following items:
For the three months ended
March 31, 2012 March 31, 2011
Current income taxes 4,968$ 11,902$ Deferred income taxes 9,943 (6,880) Total income taxes 14,911$ 5,022$
The income tax expense amount on pre-tax earnings from continuing operations differs from the income tax expense amount that would arise using the combined Canadian federal and provincial statutory tax rate of 26% (March 31, 2011 – 28%), as a result of the following items:
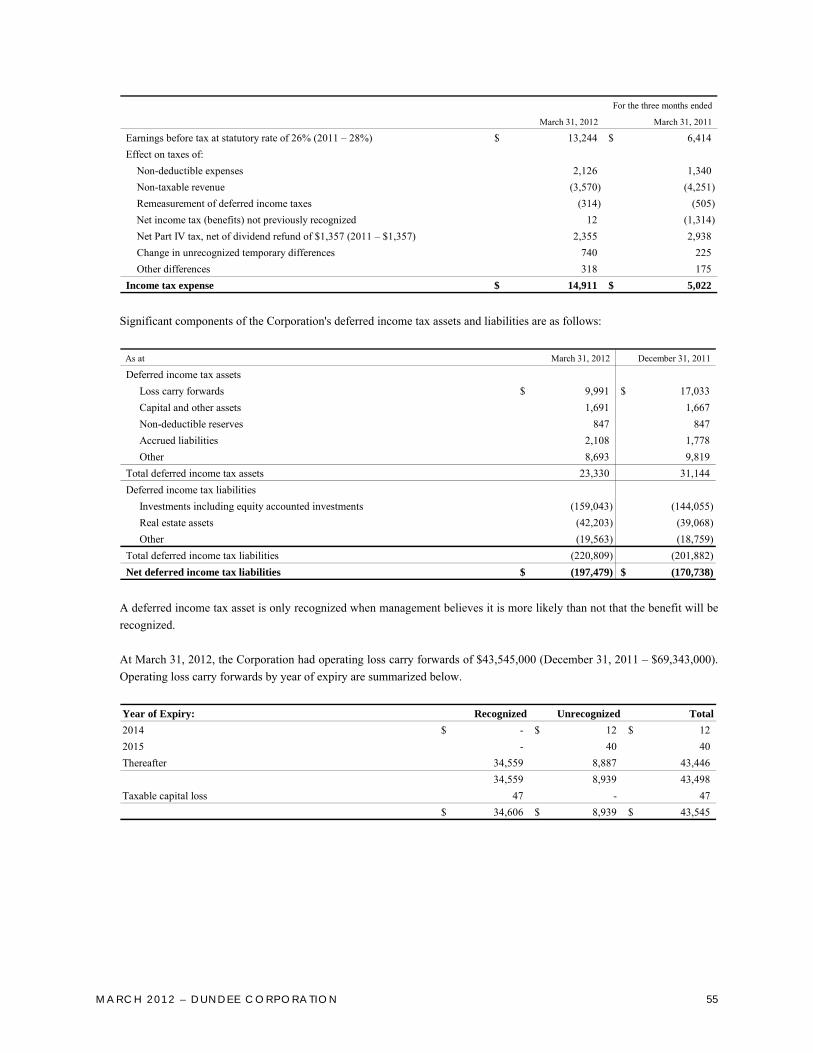
MA RCH 2012 – DUNDEE CORPORA TION 55
For the three months ended
March 31, 2012 March 31, 2011
Earnings before tax at statutory rate of 26% (2011 – 28%) 13,244$ 6,414$ Effect on taxes of:
Non-deductible expenses 2,126 1,340 Non-taxable revenue (3,570) (4,251) Remeasurement of deferred income taxes (314) (505)
Net income tax (benefits) not previously recognized 12 (1,314) Net Part IV tax, net of dividend refund of $1,357 (2011 – $1,357) 2,355 2,938 Change in unrecognized temporary differences 740 225 Other differences 318 175
Income tax expense 14,911$ 5,022$ Significant components of the Corporation's deferred income tax assets and liabilities are as follows:
As at March 31, 2012 December 31, 2011
Deferred income tax assets Loss carry forwards 9,991$ 17,033$ Capital and other assets 1,691 1,667 Non-deductible reserves 847 847 Accrued liabilities 2,108 1,778 Other 8,693 9,819 Total deferred income tax assets 23,330 31,144 Deferred income tax liabilities Investments including equity accounted investments (159,043) (144,055) Real estate assets (42,203) (39,068) Other (19,563) (18,759) Total deferred income tax liabilities (220,809) (201,882) Net deferred income tax liabilities (197,479)$ (170,738)$
A deferred income tax asset is only recognized when management believes it is more likely than not that the benefit will be recognized. At March 31, 2012, the Corporation had operating loss carry forwards of $43,545,000 (December 31, 2011 – $69,343,000). Operating loss carry forwards by year of expiry are summarized below. Year of Expiry: Recognized Unrecognized Total2014 -$ 12$ 12$ 2015 - 40 40 Thereafter 34,559 8,887 43,446
34,559 8,939 43,498 Taxable capital loss 47 - 47
34,606$ 8,939$ 43,545$

MA RCH 2012 – DUNDEE CORPORA TION 56
3 0 . N E T E A R N I N G S P E R S H A R E
For the three months ended
March 31, 2012 March 31, 2011
Net earnings attributable to owners of the parent 32,461$ 875,322$ Less dividends on Preference shares, series 2 (2,194) (2,194)
30,267$ 873,128$ Represented by:
Continuing operations 30,267$ 11,970$ Discontinued operations - 861,158
Weighted average number of shares outstanding during the period 54,929,483 69,767,990
Basic earnings per shareContinuing operations 0.55$ 0.17$ Discontinued operations - 12.34
0.55$ 12.51$ Effect of dilutive securities on weighted average number of shares outstanding during the period 1,950,800 1,812,105
Diluted earnings per shareContinuing operations 0.53$ 0.17$ Discontinued operations - 12.03
0.53$ 12.20$
3 1 . F I N A N C I A L I N S T R U M E N T S A detailed description of the Corporation’s financial assets and financial liabilities and its associated risk management in respect thereof are provided in note 33 to the Corporation’s 2011 Audited Consolidated Financial Statements. There have been no significant changes in the business and economic circumstances and the related financial risks that affect the fair value of the Corporation’s financial assets and financial liabilities since December 31, 2011.
3 2 . C A P I T A L M A N A G E M E N T The Corporation defines the capital that it manages as the aggregate of its shareholders’ equity and interest bearing debt, including outstanding preference shares. The following table summarizes the carrying value of the Corporation’s capital as at March 31, 2012 and December 31, 2011.
As at March 31, 2012 December 31, 2011
Shareholders' equity 1,933,066$ 1,807,272$ Corporate debt 532,833 546,597 Preference shares, series 1 148,510 148,423
2,614,409$ 2,502,292$ The Corporation’s objectives when managing capital include (i) ensuring that the Corporation and all of its regulated entities meet relevant regulatory capital requirements; (ii) ensuring that the Corporation is able to meet its financial obligations as they become due, whilst ensuring compliance with all applicable debt covenants; (iii) ensuring that the Corporation has sufficient capital to manage business activities in each of its operating segments; (iv) ensuring that the Corporation has sufficient capital available to benefit from acquisition opportunities, should they arise; and (v) ensuring adequate returns for shareholders. The Corporation regularly assesses its capital management practices in response to changing economic conditions. Certain of the Corporation’s subsidiaries are subject to regulatory capital requirements. Compliance with these requirements requires that the subsidiaries maintain sufficient cash and other liquid assets on hand to maintain regulatory capital requirements, rather than using these liquid assets in connection with business activities or otherwise. As at March 31, 2012

MA RCH 2012 – DUNDEE CORPORA TION 57
and December 31, 2011, the Corporation and its subsidiaries complied with all regulatory capital requirements and all debt covenants.
3 3 . C O M M I T M E N T S , C O N T I N G E N C I E S A N D O F F - B A L A N C E S H E E T A R R A N G E M E N T S A description of the Corporation’s commitments, contingencies and off-balance sheet arrangements is provided in note 35 to the Corporation’s 2011 Audited Consolidated Financial Statements. The following provides a summary of material changes to these items as at March 31, 2012.
Land Purchase Agreements and Estimated Costs to Complete Dundee Realty had commitments under land purchase agreements totalling $47,484,000 as at March 31, 2012 (December 31, 2011 – $55,358,000) which will become payable in future periods on the satisfaction of certain conditions pursuant to these agreements. Letters of Credit and Surety Bonds Dundee Realty is contingently liable for letters of credit and surety bonds that have been provided to support land and condominium developments in the amount of $52,748,000 at March 31, 2012 (December 31, 2011 – $60,520,000). Dundee Realty is also contingently liable for letters of credit that have been provided to support its equity accounted investments in the amount of $43,511,000 (December 31, 2011 – $42,872,000). Joint Ventures and Co-ownerships Dundee Realty may conduct its real estate activities from time to time through joint ventures with third party partners. The Corporation is contingently liable for the obligations of the other owners of the unincorporated joint ventures in the amount of $47,001,000 as at March 31, 2012 (December 31, 2011 – $41,800,000). The Corporation would have available to it the other venturers’ share of assets to satisfy the obligations that may arise. The Maple Group Dundee Capital Markets has committed to become an equity investor in The Maple Group, an entity that was formed by 13 Canadian financial institutions and pension plans and which has a pending takeover bid for the shares of the TMX Group Inc. (“TMX Group”). If the bid is successful, Dundee Capital Markets’ commitment to acquire shares of The Maple Group will be between $15,000,000 and $19,000,000, representing approximately 0.7% of the aggregate purchase price. The takeover bid was supported by TMX Group on October 30, 2011 and is subject to regulatory approvals. In the event that regulatory approvals are not obtained, The Maple Group has agreed to pay TMX Group a termination fee of $39,000,000. On April 30, 2012, The Maple Group agreed to extend the outside date for completing the offer to July 31, 2012 and, consistent with that, announced an extension of the offer initially to May 31, 2012. Legal Contingencies As part of the business reorganization of the capital markets activities of DundeeWealth (note 4), Dundee Capital Markets agreed to indemnify certain subsidiaries of DundeeWealth with respect to certain claims. In 2011, Sino-Forest Corporation (“Sino-Forest”) was delisted from the TSX, following allegations of securities violations. One of the parties indemnified by Dundee Capital Markets participated in underwriting syndicates in respect of several public equity offerings by Sino-Forest. Dundee Capital Markets understands that the indemnified party is a defendant in at least one lawsuit brought by shareholders of Sino-Forest, alleging securities law and other violations. Sino-Forest received an order for creditor protection in March 2012, which may impact this lawsuit. In April 2012, Sino-Forest and certain of its current and former executives received enforcement notices from the Ontario Securities Commission, indicating that the regulator may commence formal actions against them in the future for securities law violations. It is not known when, or even if such formal action will be commenced, or whether others will be named as respondents. Dundee Capital Markets cannot reliably estimate the timing and quantification of any exposure it may have as a result of the Sino-Forest underwritings, the consequences of which could be material.
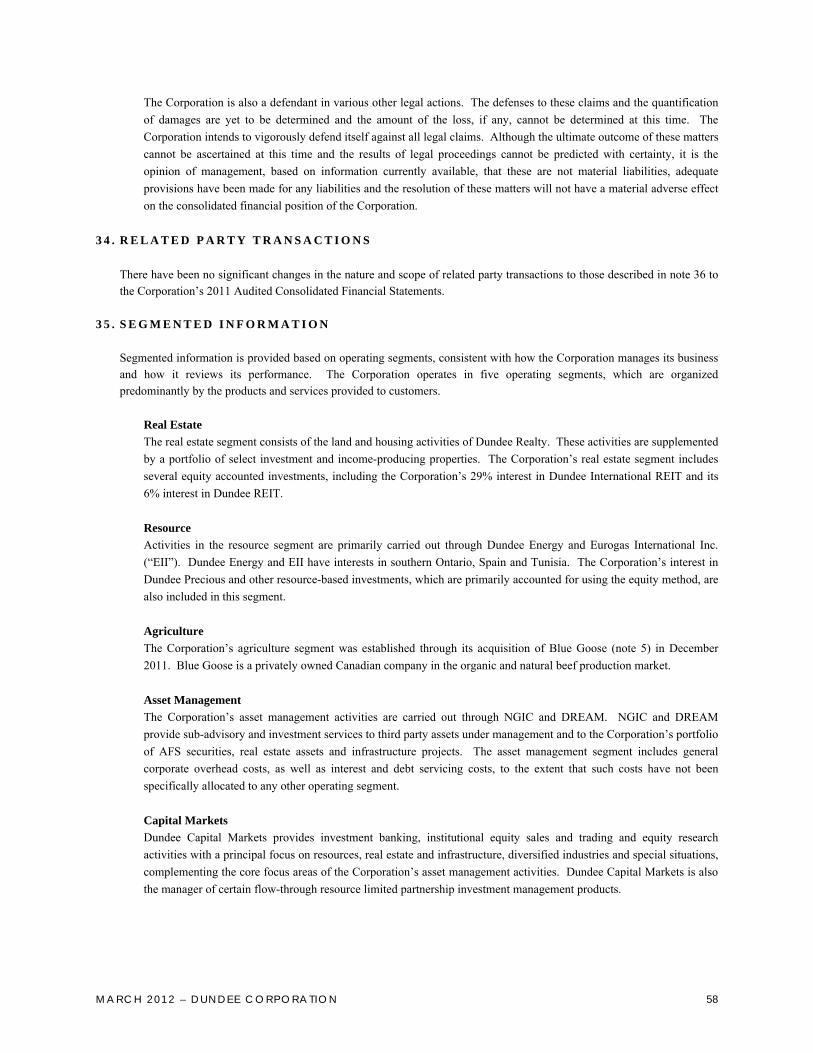
MA RCH 2012 – DUNDEE CORPORA TION 58
The Corporation is also a defendant in various other legal actions. The defenses to these claims and the quantification of damages are yet to be determined and the amount of the loss, if any, cannot be determined at this time. The Corporation intends to vigorously defend itself against all legal claims. Although the ultimate outcome of these matters cannot be ascertained at this time and the results of legal proceedings cannot be predicted with certainty, it is the opinion of management, based on information currently available, that these are not material liabilities, adequate provisions have been made for any liabilities and the resolution of these matters will not have a material adverse effect on the consolidated financial position of the Corporation.
3 4 . R E L A T E D P A R T Y T R A N S A C T I O N S
There have been no significant changes in the nature and scope of related party transactions to those described in note 36 to the Corporation’s 2011 Audited Consolidated Financial Statements.
3 5 . S E G M E N T E D I N F O R M A T I O N Segmented information is provided based on operating segments, consistent with how the Corporation manages its business and how it reviews its performance. The Corporation operates in five operating segments, which are organized predominantly by the products and services provided to customers.
Real Estate The real estate segment consists of the land and housing activities of Dundee Realty. These activities are supplemented by a portfolio of select investment and income-producing properties. The Corporation’s real estate segment includes several equity accounted investments, including the Corporation’s 29% interest in Dundee International REIT and its 6% interest in Dundee REIT. Resource Activities in the resource segment are primarily carried out through Dundee Energy and Eurogas International Inc. (“EII”). Dundee Energy and EII have interests in southern Ontario, Spain and Tunisia. The Corporation’s interest in Dundee Precious and other resource-based investments, which are primarily accounted for using the equity method, are also included in this segment. Agriculture The Corporation’s agriculture segment was established through its acquisition of Blue Goose (note 5) in December 2011. Blue Goose is a privately owned Canadian company in the organic and natural beef production market. Asset Management The Corporation’s asset management activities are carried out through NGIC and DREAM. NGIC and DREAM provide sub-advisory and investment services to third party assets under management and to the Corporation’s portfolio of AFS securities, real estate assets and infrastructure projects. The asset management segment includes general corporate overhead costs, as well as interest and debt servicing costs, to the extent that such costs have not been specifically allocated to any other operating segment. Capital Markets Dundee Capital Markets provides investment banking, institutional equity sales and trading and equity research activities with a principal focus on resources, real estate and infrastructure, diversified industries and special situations, complementing the core focus areas of the Corporation’s asset management activities. Dundee Capital Markets is also the manager of certain flow-through resource limited partnership investment management products.
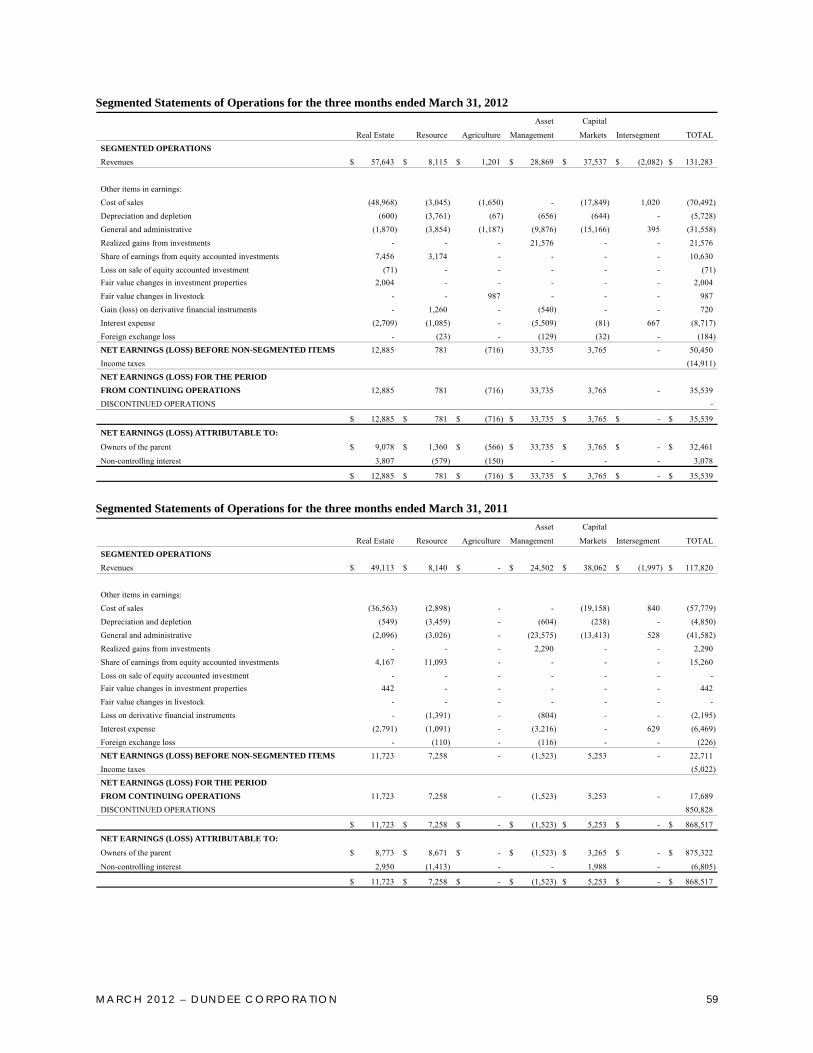
MA RCH 2012 – DUNDEE CORPORA TION 59
Segmented Statements of Operations for the three months ended March 31, 2012 Asset Capital
Real Estate Resource Agriculture Management Markets Intersegment TOTALSEGMENTED OPERATIONSRevenues 57,643$ 8,115$ 1,201$ 28,869$ 37,537$ (2,082)$ 131,283$
Other items in earnings:Cost of sales (48,968) (3,045) (1,650) - (17,849) 1,020 (70,492) Depreciation and depletion (600) (3,761) (67) (656) (644) - (5,728) General and administrative (1,870) (3,854) (1,187) (9,876) (15,166) 395 (31,558) Realized gains from investments - - - 21,576 - - 21,576 Share of earnings from equity accounted investments 7,456 3,174 - - - - 10,630 Loss on sale of equity accounted investment (71) - - - - - (71) Fair value changes in investment properties 2,004 - - - - - 2,004 Fair value changes in livestock - - 987 - - - 987 Gain (loss) on derivative financial instruments - 1,260 - (540) - - 720 Interest expense (2,709) (1,085) - (5,509) (81) 667 (8,717) Foreign exchange loss - (23) - (129) (32) - (184) NET EARNINGS (LOSS) BEFORE NON-SEGMENTED ITEMS 12,885 781 (716) 33,735 3,765 - 50,450 Income taxes (14,911) NET EARNINGS (LOSS) FOR THE PERIODFROM CONTINUING OPERATIONS 12,885 781 (716) 33,735 3,765 - 35,539 DISCONTINUED OPERATIONS -
12,885$ 781$ (716)$ 33,735$ 3,765$ -$ 35,539$
NET EARNINGS (LOSS) ATTRIBUTABLE TO:
Owners of the parent 9,078$ 1,360$ (566)$ 33,735$ 3,765$ -$ 32,461$
Non-controlling interest 3,807 (579) (150) - - - 3,078
12,885$ 781$ (716)$ 33,735$ 3,765$ -$ 35,539$ Segmented Statements of Operations for the three months ended March 31, 2011
Asset Capital
Real Estate Resource Agriculture Management Markets Intersegment TOTALSEGMENTED OPERATIONSRevenues 49,113$ 8,140$ -$ 24,502$ 38,062$ (1,997)$ 117,820$
Other items in earnings:Cost of sales (36,563) (2,898) - - (19,158) 840 (57,779) Depreciation and depletion (549) (3,459) - (604) (238) - (4,850) General and administrative (2,096) (3,026) - (23,575) (13,413) 528 (41,582) Realized gains from investments - - - 2,290 - - 2,290 Share of earnings from equity accounted investments 4,167 11,093 - - - - 15,260 Loss on sale of equity accounted investment - - - - - - - Fair value changes in investment properties 442 - - - - - 442 Fair value changes in livestock - - - - - - - Loss on derivative financial instruments - (1,391) - (804) - - (2,195) Interest expense (2,791) (1,091) - (3,216) - 629 (6,469) Foreign exchange loss - (110) - (116) - - (226) NET EARNINGS (LOSS) BEFORE NON-SEGMENTED ITEMS 11,723 7,258 - (1,523) 5,253 - 22,711 Income taxes (5,022) NET EARNINGS (LOSS) FOR THE PERIODFROM CONTINUING OPERATIONS 11,723 7,258 - (1,523) 5,253 - 17,689 DISCONTINUED OPERATIONS 850,828
11,723$ 7,258$ -$ (1,523)$ 5,253$ -$ 868,517$
NET EARNINGS (LOSS) ATTRIBUTABLE TO:
Owners of the parent 8,773$ 8,671$ -$ (1,523)$ 3,265$ -$ 875,322$
Non-controlling interest 2,950 (1,413) - - 1,988 - (6,805)
11,723$ 7,258$ -$ (1,523)$ 5,253$ -$ 868,517$
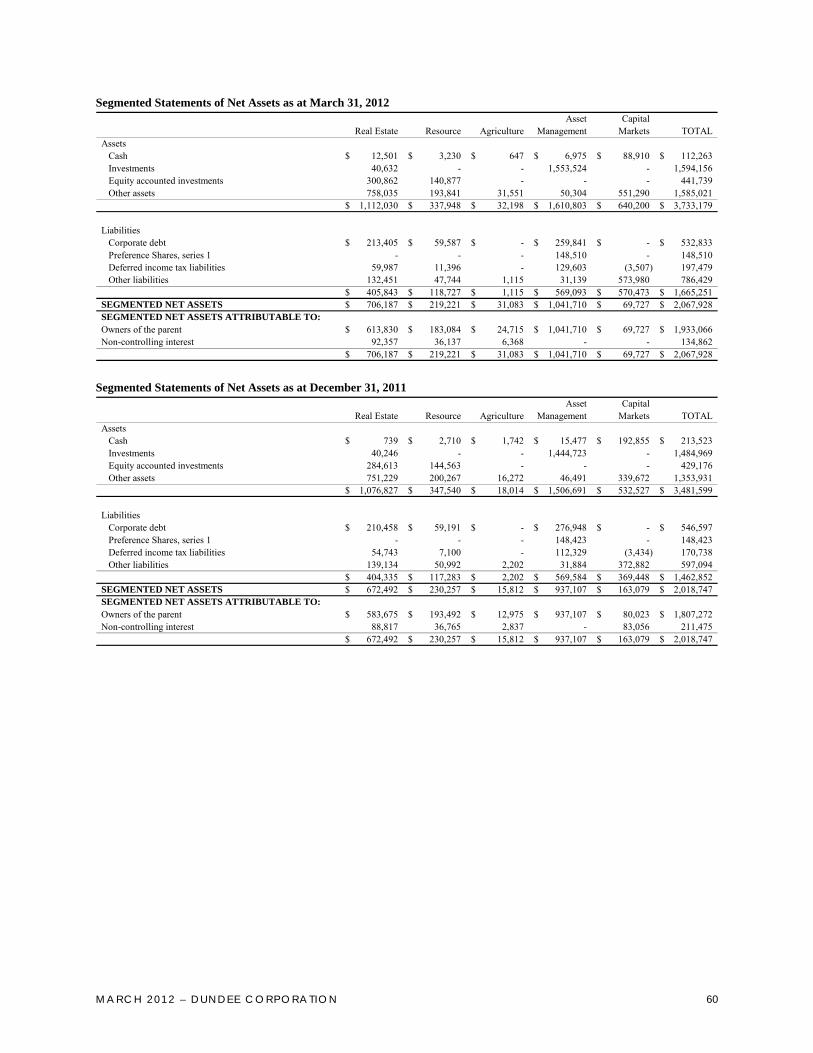
MA RCH 2012 – DUNDEE CORPORA TION 60
Segmented Statements of Net Assets as at March 31, 2012 Asset Capital
Real Estate Resource Agriculture Management Markets TOTALAssets Cash 12,501$ 3,230$ 647$ 6,975$ 88,910$ 112,263$ Investments 40,632 - - 1,553,524 - 1,594,156 Equity accounted investments 300,862 140,877 - - - 441,739 Other assets 758,035 193,841 31,551 50,304 551,290 1,585,021
1,112,030$ 337,948$ 32,198$ 1,610,803$ 640,200$ 3,733,179$
Liabilities Corporate debt 213,405$ 59,587$ -$ 259,841$ -$ 532,833$ Preference Shares, series 1 - - - 148,510 - 148,510 Deferred income tax liabilities 59,987 11,396 - 129,603 (3,507) 197,479 Other liabilities 132,451 47,744 1,115 31,139 573,980 786,429
405,843$ 118,727$ 1,115$ 569,093$ 570,473$ 1,665,251$ SEGMENTED NET ASSETS 706,187$ 219,221$ 31,083$ 1,041,710$ 69,727$ 2,067,928$ SEGMENTED NET ASSETS ATTRIBUTABLE TO:Owners of the parent 613,830$ 183,084$ 24,715$ 1,041,710$ 69,727$ 1,933,066$ Non-controlling interest 92,357 36,137 6,368 - - 134,862
706,187$ 219,221$ 31,083$ 1,041,710$ 69,727$ 2,067,928$ Segmented Statements of Net Assets as at December 31, 2011
Asset CapitalReal Estate Resource Agriculture Management Markets TOTAL
Assets Cash 739$ 2,710$ 1,742$ 15,477$ 192,855$ 213,523$ Investments 40,246 - - 1,444,723 - 1,484,969 Equity accounted investments 284,613 144,563 - - - 429,176 Other assets 751,229 200,267 16,272 46,491 339,672 1,353,931
1,076,827$ 347,540$ 18,014$ 1,506,691$ 532,527$ 3,481,599$
Liabilities Corporate debt 210,458$ 59,191$ -$ 276,948$ -$ 546,597$ Preference Shares, series 1 - - - 148,423 - 148,423 Deferred income tax liabilities 54,743 7,100 - 112,329 (3,434) 170,738 Other liabilities 139,134 50,992 2,202 31,884 372,882 597,094
404,335$ 117,283$ 2,202$ 569,584$ 369,448$ 1,462,852$ SEGMENTED NET ASSETS 672,492$ 230,257$ 15,812$ 937,107$ 163,079$ 2,018,747$ SEGMENTED NET ASSETS ATTRIBUTABLE TO:Owners of the parent 583,675$ 193,492$ 12,975$ 937,107$ 80,023$ 1,807,272$ Non-controlling interest 88,817 36,765 2,837 - 83,056 211,475
672,492$ 230,257$ 15,812$ 937,107$ 163,079$ 2,018,747$


Head Office Registrar and Transfer Agent Stock Exchange Dundee Place Computershare Investor Services Inc. Toronto Stock Exchange 1 Adelaide Street East 100 University Avenue, 9th Floor 21st Floor Toronto, Ontario M5J 2Y1 Toronto, Ontario Toll Free: 1.800.564.6253 Stock Symbol M5C 2V9 E-mail: [email protected] DC.A
www.dundeecorporation.com