due diligence in bangladesh monetary and credit program ...bangladesh monetary and credit program...
TRANSCRIPT

Due Diligence in Bangladesh Monetary and Credit
Program Path Derivation
Imam Abu Sayed, PhD (USA)
CSC, CPH, DFC Canada
Deputy General Manager (Research)
Monetary Policy Department
Bangladesh Bank

Due Diligence in Bangladesh Monetary and Credit
Program Path Derivation
Imam Abu Sayed, PhD1
Abstract
In general it is widely expected that bankers need to maintain plain, fair and true principle in
communicating financial aspects to the stakeholders. Bankers possess specialized knowledge in
formulating banking policies related to economics, finance and accounting. Bankers need to put
the interest of stakeholders ahead of their own. Bankers require to keep continuous learning
efforts regarding the continuously shifting paradigm of economics. Bearing in mind this
development in solicited and unsolicited communication bankers necessitates putting utmost
personal endeavour and keeping themselves logical avoiding fallacy. In central banking bankers
require to follow due diligence particularly in Bangladesh monetary and credit program path
derivation. Due diligence issue relating to Bangladesh monetary and credit program path is
demonstrated in this paper for better communicating to the stakeholders. Consequently, central
banker can serve for the betterment of the stakeholders and country applying fiduciary
responsibility.
Introduction
Among interest rate, exchange rate, asset price and monetary/credit channels, this paper
concentrated on monetary and credit channels impacting inflation and GDP. Bangladesh
monetary and credit program and balance of payment are technical and crucial issue. In order to
address this concern, plain and fair approaches have followed with due diligence. Bangladesh
monetary and credit program requires specialised knowledge related to economics, banking,
finance and accounting. Econometric knowledge is also required to understand the dynamics of
monetary policy. In Bangladesh, monetary and credit programming firstly, I have derived yearly
program path taking into account related macroeconomic developments. Quarterly segregation of
monetary and credit program is impacted by seasonality. In such case monthly seasonal factors
1 Author is a Deputy General Manager (Research) of Monetary Policy Department of Bangladesh Bank. Views
expressed in this paper are his own and do not reflect those of Bangladesh Bank.

are used for smoothing. According to the quantity theory of money, inflation is directly related
with money supply. Real GDP is also vital factor of money supply. This paper, from quantitative
and qualitative point of view, highlighted these factors as a part of plain and fair communication
to the stakeholders. This study unfolds the vital macroeconomics dynamics to commune the
stakeholders. This will contribute to take informed decision by the stakeholders about the
monetary economics interactions.
Organization of the paper
Literature review is presented in section I. Section II deals with research methodology.
Derivation of Bangladesh monetary and credit program applying due diligence is described in
section III. Conclusion is made in section IV.
Section I
Literature review
Sayera and Akhtaruzzaman (2012) pointed out that the objective of their study is to explore the
inflation-economic growth linkage, if any, in Bangladesh. With this view, various tables and
charts, correlation matrices, pair-ranger Causality tests and quadratic regression equation
estimated by OLS based time series annual data covering the sample period from 1976 to 2012
are used. The results of all data including regression analysis convincingly demonstrate that the
relationship between inflation and growth is non-linear with an existence of a threshold level
(relative to the threshold) would be hurtful for growth in terms of potential cost of forgone output
and, at the same time, too high level of inflation would also impede economic growth. Thus,
Government’s inflation target of 7.5 percent set in FY 12/13 budget seems to be reasonable as it
stands within the range threshold levels of inflation found in the study.
Taylor (2009) rule in equation form: In this
equation, is the target short-term nominal interest rate (e.g. the federal funds rate in the USA,
the Bank of England base rate in the UK), is the rate of inflation as measured by the GDP
deflator, is the desired rate of inflation, is the assumed equilibrium real interest rate, is
the logarithm of real GDP, and is the logarithm of potential output, as determined by a linear
trend. In this equation, both and should be positive (as a rough rule of thumb, Taylor's

1993 paper proposed setting ). That is, the rule "recommends" a relatively high
interest rate (a "tight" monetary policy) when inflation is above its target or when output is above
its full-employment level. By specifying , the Taylor rule says that an increase in
inflation by one percentage point should prompt the central bank to raise the nominal interest
rate by more than one percentage point (specifically, by , the sum of the two coefficients
on in the equation above). Since the real interest rate is (approximately) the nominal interest
rate minus inflation, stipulating implies that when inflation rises, the real interest
rate should be increased. Taylor explained the rule in simple terms using three variables:
inflation rate, GDP growth, and the interest rate. If inflation were to rise by 1 percent, the proper
response would be to raise the interest rate by 1.5 percent (Taylor explains that it doesn't always
need to be exactly 1.5 percent, but being larger than 1 percent is essential). If GDP falls by 1
percent relative to its growth path, then the proper response is to cut the interest rate by 0.5
percent. The central bank does not need to take fluctuations in the output gap into account when
setting interest rates (that is, it may optimally set ).
The money supply and MM related issues of developed and developing countries have been
widely worked out. Johannes and Rasche (1979), Bomhoff (1997), Park (1980), Arby (2000),
Ford and Morris (1996), Baghestani and Moot (1997) have pursued studies on money supply and
MM of different countries. They highlighted the degree of controllability over money supply by
the monetary authority, stability and predictability of money supply, determinants of money
supply and policy implications for governing monetary policy. Accordingly, BB’s MM is
disaggregated to understand the impact on inflation and other rates of the economy.
Section II
Research methodology
Technical analysis, quantity theory of money and rational expectation with due diligence is
considered in Bangladesh monetary and credit program path derivation of Bangladesh.
Seasonality, past trends, domestic and global development and unconventional monetary policy
emphasising thrust sector sectors is applied in this paper. The deviation of program and actual
path of Bangladesh monetary and credit program and balance of payments variables are
graphically shown to understand the future outcome.

Section III
Derivation of Bangladesh monetary and credit program applying due diligence
Before moving towards quantity theory of money and judgemental approach, I have tested
fifteen hypotheses related to Bangladesh monetary and credit program.
1. The stability of GDP test result is BLUE following ARMA model. Equation: bd_growth = c +
a bd_growth(-1) +ma(1) + trend +u. To test the GDP stability in Bangladesh we can use this
model. Diagnostic tests on residual. a. Serial Correlation test b. Heteroskedasticity test and c.
Non-normality test. Sayed (2014) deals with ARMA model.
OLS method
o Equation: gdp = α+ βM2 +ε
o Hypothesis testing: βt ≠ 0. Reject the null βt= 0 and accept the alternative hypothesis
that is β is different from zero due to high t-value.
o |tcal|>|ttab|, Z test, F statistic and adjusted R2
o Checking multicollinearity in the data. Testing the variance inflated function
(VIF)=1/(1-r2
23).
o Maximum log likelihood
o Checking structural break in the data and set dummy if necessary.
o Making the regression BLUE. OLS is described by Sayed et al. (2016).
2. The noteworthy hypothesis of Bangladesh monetary and credit programme is to amplify of
share of time deposit (TD) in M2. The share of TD was 75.76% at the end of June 2010, which
accomplished at 76.03% at the end of June 2013. Introduction of plastic card, online and mobile
banking and financial engineering can provide impetus in this regard.
3. Optimization of DMBs excess reserves using OMOs. Sayed (2016) explained excess reserves.
4. Technical exercise implies foreign exchange reserves can be increased of higher level
addressing BOP accounts.
5. Particular and complementary solution determines the government bonds price and coupon
rates. Sayed (2016) elaborated this issue.
6. ARIMA model implies maintaining auto regressive (AR) process the exchange rate can be
forecasted. Setting ARIMA(p,d,q) = ARIMA (1,1,0) [for example]. Determine quarterly
seasonality in Bangladesh’s M2 for instance. ARIMA is described by Sayed (2015).

7. The exercise of ARDL model suggests there is long run relationship between M2 and nominal
GDP. ARDL Bounds Test = + + + +
+
ARDL restricted ECM = + + + +
o Unit Root Test for Stationarity . Combination of I(0) and I(1) is required for ARDL.
o Lag order selection: According to the AIC, among the top 20 model our best model is
ARDL (3,2) for instance.
o Diagnostic checking
Breusch-Godfrey Serial Correlation LM test and unit root of the model residuals
Autoregressive Conditional Heteroskedasticity (ARCH) test
Ramsey RESET (regression specific error test)
Cumulative sum (CUSUM) to test the stability of long run coefficient. ARDL is
presented by Sayed et al. (2016).
8. We failed to reject the null hypothesis as there is no unit root according to the test statistics.
9. Bidirectional causality found in VAR.
10. In VAR model the estimated coefficient of βt ≠ 0 is accepted due to high t-value. Exercised
VAR model in the study is:
+ +
o Orthogonalised residuals regressed each other
o Checking the bidirectional causality between X and Y
o Unit root
o Exoginity test
o Variance decomposition. Shock explains the forecast error variance. For example
checking the exchange rate pass-through on GDP.
o Analysis of IRF (positive and negative shock)
o Forecasting (with the estimated coefficients and checking lower average RAMSE).
VAR model is described in Sayed (2015) paper.
11. According to co integration test, there is long run relationship among the stipulated variables.

12. In VECM there is positive relationship between RM and inflation. Exercised VEC
model +
. VECM is
addressed in Sayed (2013) article.
o Trace and Maximum Eigen Value Test for co-integration
o Test of cointegration rank
o Speed of adjustment
o Test for misspecification
o Test on weak exogenity
o IRF
13. Determination of priors and potential priors using DSGE. Filtering of de-seasonalized
logarithmic data with the Hodrick-Prescott (HP) filter or by de-trending. Comparing priors and
posterios mean for interest rate increase to curb inflation for example. Conditional variance
decomposition of the interested variables. Younus (2017) Working Paper can be consulted
regarding DSGE model.
14. Equilibrium exchange rate can be maintained following REER based exchange rate. REER is
presented in Sayed (2015) paper.
15. Using monetary tools and economic findings the stability of MM need to be maintained in
Bangladesh.
Brief on econometrics exercise related to monetary variables of Bangladesh are highlighted in
Annexure.
Quantity theory of money in short
Following quantity theory of money safe limit of monetary expansion in a year has been derived
in this paper. Money supply more than safe limit is considered as expansionary monetary policy.
Money supply less than safe limit is considered as contractionary monetary policy.
Accommodative monetary policy is the in between of expansionary and contractionary monetary
policy. To achieve the potential level of GDP growth and low and stable inflation BB may
prudently decide what type of monetary policy will be followed. Potential level of GDP growth
is the average of previous few years recent real GDP growth. Average 6 percent-7 percent

inflation rate considering the business cycle is the indicator of optimum inflation level.
Considering Bangladesh GDP growth model (ARMA) and correlation of GDP and inflation
solving quantity theory of money ultimately participatory and judgemental approach are pursued
in quantifying M2, RM and BOP growth numbers. In participatory monetary policy
stakeholders’ opinion are considered. Average of real GDP growth rate and inflation with future
expectation are considered in this paper for formulating monetary expansion for next financial
year. BB considers upcoming year government budget declared GDP and inflation rate rather
average of this two variables in monetary expansion.
Finally, income velocity of money derives dividing nominal GDP by M2, which is declining
trend region in the U shaped curve. Decline in income velocity of money indicates that still there
is room for broad money growth in Bangladesh. Change in income velocity of money for FY
2012-13 is estimated on average at 1.90 percent. Quantity theory of money can be resolved
plugging 5-year average annual GDP growth rate and future expectation (7.0 percent), 5-year
annual inflation rate (6.0 percent) and past 5-year average annual percentage changes in income
velocity of money combining future expectation ( 1.90 percent). Upcoming year GDP growth
and inflation rate is found from the national budget for quantifying of safe limit of monetary
growth in a year. Considering real economic developments these numbers may change.
We know MV=PY
Log function is required to work out the equation.
Thus, we get lnM+lnV= lnP+lnY
Or, (1+M) (1+V) = (1+P) (1+Y)
Or, (1+M) = (1+P) (1+Y)/ (1+V)
Or, M = ((1+P) (1+Y)/ (1+V)) -1
Or, M = ((1+0.060) (1+0.070)/ 1+(-)1.90)-1
Or, M= (1.1342/(1-0.019))-1
Or, (1.1342/0.981)-1
Or, 1.15617-1
Or, 0.15617
Or, 15.6%

Here, M= yearly broad money growth, P= CPI inflation rate, Y= real GDP and V= percentage
change in income velocity of money. Hence, real GDP growth, inflation and percentage change
in income velocity of money provides us safe limit of monetary expansion in a financial year
considering the money demand. M2 plot can be demonstrated summing real GDP growth, CPI
inflation and income velocity of money (Chart 1).
Chart 1
In the quantity theory of money equation if we assume GDP and velocity as constant then the
direct relationship between money (M2) and inflation (P) can be found (Chart 2). In Chart 2
M2 affect inflation with few lags. At the beginning the augment in M2 also contributes to
enhance in CPI inflation. In the plot the relation of money and inflation is clear. Seasonality,
demand pull and cost push factors may create volatility in inflation apart from money supply.

Chart 2
Component wise Bangladesh monetary and credit programme with due diligence
Historical data and current demand observed from the quantity theory of money have been
observed in deriving monetary programming numbers of Bangladesh. Maintenance of optimum
inflation and GDP growth is central aspect of monetary policy. BOP end June 2012 overall
surplus US$ 89.4 crore (Table-5) is added with RM end June 2012 NFA to arrive June 2013
number, which is equivalent to Tk. 76123.70 crore (Table-3). In this conversion exchange rate
used Tk. 80.0 against 1 US$ at the end of June 2013. DMBs asset and liabilities of foreign
exchange holdings is added with the NFA of RM in order to get relevant NFA of M2 (Table-1).
The noteworthy hypothesis of Bangladesh monetary and credit programme is to amplify of share
of time deposit (TD) in M2. The share of TD was 75.76 percent at the end of June 2010, which
accomplished at 76.03 percent at the end of June 2013. Introduction of plastic card, online and
mobile banking and financial engineering can provide impetus in this regard.

Table-1 Monetary and credit programmme (In crore Taka)
Outstanding stock (Actual) Program 2012-13
Particulars June September December March June
2012 2012 2012 2013 2013
1 2 3 4 5 6 7
A. Net Foreign Assets of
banking system 67073.70 70620.00 78860.30 90112.10 81795.20 83697.10 86496.00
(+5.29) (+11.67) (+14.27) (+3.72) (+6.13) (+9.68)
B. Net Domestic Assets
of banking system 295957.50 369899.90 438249.20 445991.00 476207.50 493707.10 516207.10
(+24.98) (+18.48) (+1.77) (+8.66) (+12.65) (+17.79)
a) Domestic credit 340213.70 433525.90 518214.30 529960.70 567201.00 584198.90 616209.30
(+27.43) (+19.53) (+2.27) (+9.45) (+12.73) (+18.91)
Public sector 69453.00 92813.20 110312.70 109923.30 120542.80 123142.30 132654.10
(+33.63) (+18.85) (-0.35) (+9.27) (+11.63) (+20.25)
Govt.(net) 54392.30 73436.10 91906.80 91901.20 103119.10 105919.10 115530.80
(+35.01) (+25.15) (-0.01) (+12.20) (+15.25) (+25.70)
Other Public 15060.70 19377.10 18405.90 18022.10 17423.70 17223.20 17123.30
(+28.66) (-5.01) (-2.09) (-5.34) (-6.43) (-6.97)
Private sector 270760.70 340712.70 407901.60 420037.40 446658.20 461056.60 483555.20
(+25.84) (+19.72) (+2.98) (+9.50) (+13.03) (+18.55)
b) Other items (net) -44256.20 -63626.00 -79965.10 -83969.70 -90993.50 -90491.80 -100002.20
(+43.77) (+25.68) (+5.01) (+13.79) (+13.16) (+25.06)
C. Broad money (A+B) 363031.20 440519.90 517109.50 536103.10 558002.70 577404.20 602703.10
(+21.34) (+17.39) (+3.67) (+7.91) (+11.66) (+16.55)
i) Currency outside banks 46157.10 54795.10 58417.10 61214.50 63072.71 65361.80 67573.50
(+18.71) (+6.61) (+4.79) (+7.97) (+11.89) (+15.67)
ii) Deposits 316874.10 385724.80 458692.40 474888.60 494929.99 512042.40 535129.60
(+21.73) (+18.92) (+3.53) (+7.90) (+11.63) (+16.66)
a) Demand deposits 41831.30 48305.90 51304.30 49794.90 74729.79 72904.50 76892.50
(+15.48) (+6.21) (-2.94) (+45.66) (+42.10) (+49.88)
b) Time deposits 275042.80 337418.90 407388.10 425093.70 420200.20 439137.90 458237.10
(+22.68) (+20.74) (+4.35) (+3.14) (+7.79) (+12.48)
Note:Figures in brackets indicate percentage changes over end June.
June, 2010 June, 2011
Government sector credit expansion from the banking system to implement the ADP is expected
to Tk. 23624.00 crore for FY 2012-13. The borrowing amount declares in the national budget,
which is subject to change according to revised ADP. Subsequently, additional amount can also
be estimated bearing in mind declining trend of non-bank and foreign funds maintaining overall
budget deficit at 5 percent level of GDP. Through treasury bills and bonds government obtain
money from DMBs. This mode of financing will be elaborated later in section V. Other public
sector credit is expected to decline due to privatization process of the state owned enterprises

(SOEs) during that time period. Negative growth rate 6.97 percent is assumed in this sector.
Public sector credit programmed 20.25 percent expansion for FY 2012-13 (Table-1). Private
sector credit component is elaborated in the SBS of BB. This is the thrust sector of the economy.
Private sector credit is ranged from personal loan to manufacturing industry. Housing loan, auto
loan, crop loan, credit card to the common people like developed country encouraging financial
inclusion as well as monetization in Bangladesh. Following related economic standpoint private
sector credit growth is expected to 18.55 percent in FY 2012-13 (Table-1). Private sector growth
is estimated at 9.50 percent and 13.03 percent the end of December, 2012 and March 2013
respectively. The main component of other item (net) is inter-bank asset of unclassified asset
inter-bank liabilities and contingent liability of unclassified liability. Other item (net) can be plus
or minus nature in the balance sheet.

Table-2: Monetary and credit programme (In crore Taka)
Particulars June, 2013 (Programme) June, 2013 (Actual) Difference between
Programme and Actual of June, 2013
1 2 3 4
A. Net Foreign Assets of 86496.00 113384.80 -26888.8 banking system (-31.09)
B. Net Domestic Assets 516207.10 490120.60 26086.50 of banking system (+5.05)
a) Domestic credit 616209.30 571737.10 44472.20 (+7.22)
Public sector 1326541.10 119579.90 1206961.20 (+90.99)
Govt.(net) 115530.80 110124.60 5406.2 (+4.68)
Other Public 17123.30 9455.30 7668.00 (+44.78)
Private sector 483555.20 452157.20 31398.00 (+6.49)
b) Other items (net) -100002.20 -81616.50 -18385.70 (+18.39)
C. Broad money (A+B) 602703.10 603505.40 -802.30 (-0.13)
i) Currency outside banks 67573.50 67552.90 20.60 (+0.03)
ii) Deposits 535129.60 535952.50 -822.90 (-0.15)
a) Demand deposits 76892.50 56050.20 20842.30 (+27.11)
b) Time deposits 458237.10 479902.30 -21665.2 (-4.73)
Note: Figures in brackets indicate percentage changes over end June of previous fiscal.
Outstanding stock

Chart 3
The deviation of actual and forecasted path of NFA, NDA, government and private sector credit
and M2 is very minimum at the end of June 2013 (Chart 3). Deploying judgemental approach
and econometric tools, I have forecasted the related variables of M2. As a result, the exercise of
M2 and RM programme need to be meticulously followed combining four sectors of the
economy.
It may be noted that forecasting of private sector credit and currency using ARIMA procedure
can be attainable as it is stochastic. Using auto regressive process with seasonality, we can
technically predict the private sector credit and currency subject to stability in mm. NFA of M2
and RM, government sector credit, claims on DMBs and time deposits are deterministic. As a
result, prediction of these elements is unyielding using random technique.

Seasonality of M2 in Bangladesh monetary and credit programming (Chart 4)
In the seasonal index, oscillation is found for the month of June and December. For the surge of
M2 during the mentioned period seasonal factor need to understand. Proper seasonal treatment is
required to incorporate to watch in-depth each variable of monetary aggregates for monetary
programming of Bangladesh.
Reserve money programming number in brief
In the NDA of RM (Table-3) claims on DMBs depend on liquidity need maintained through
repo, special repo, LSF, refinancing programme, loan reverse repo. Refinancing is provided to
export and small and medium enterprise (SME) for poverty alleviation generating employment.
The growth programmed in this sector 5.29 percent at the end of June, 2013. The government
sector credit is programmed 6.35 percent growth subject to over draft (current) and overdraft
(blocked) account adjustment and loan requirement of the government for supporting
development works. The RM growth is programmed as 6.26 percent, 10.35 percent and 14.95
percent at the end of December, 2012, March, 2013 and June, 2013. Accordingly, the MM are
calculated as 5.17, 5.14 and 5.36 at the end of December, 2012, March, 2013 and June, 2013.
The government deposits all its cash balances with BB free of interest. BB provides up to Tk.
4000 crore for day to day operation of the government using ways and means account with

reverse repo rate (5.25 percent) as government has taxing capacity. Government can borrow
money through overdraft paying reverse repo rate plus one percent (6.25 percent) with
seigniorage effect and inflation if the borrowing is unplanned. 91-Day government treasury bill
rate is applicable for government blocked account loan taken through over draft from BB.
Claims on other public sector include SOEs elaborated in the SBS. According to exercise
improvement of balance sheet position of SOEs is expected during FY 2011-13.
Table-3 Reserve money programme (In crore Taka)(In crore taka)
Outstanding stock (Actual)
Particulars June September December March June
2012 2012 2012 2013 2013
1 2 3 4 5 6 7
Net Foreign Assets of
Bangladesh Bank 61204.90 61388.70 68971.70 78730.50 71139.20 74060.90 76123.70
(+0.30) (+12.35) (+14.15) (+3.14) (+7.38) (+10.37)
Net Domestic Assets of
Bangladesh Bank 19305.40 28345.70 28831.00 21228.30 32787.20 33865.50 36302.70
(+46.83) (+1.71) (-26.37) (+13.72) (+17.46) (+25.92)
Claims on Govt.(net) 22320.60 32049.70 38044.00 35859.10 37298.00 37800.10 40458.20
(+43.59) (+18.70) (-5.74) (-1.96) (-0.64) (+6.35)
Claims on other public 830.70 736.70 1181.90 1027.30 604.30 600.21 580.03
(-11.32) (+60.43) (-13.08) (-48.87) (-49.22) (-50.92)
Claims on DMBs 6613.90 18608.80 22627.40 15297.60 21824.33 23123.90 23824.21
(+181.36) (+21.60) (-32.39) (-3.55) (+2.19) (+5.29)
Other items (net) -10459.80 -23049.50 -33022.30 -30955.70 -26939.43 -27658.71 -28559.74
(+120.36) (+43.27) (-6.26) (-18.42) (-16.24) (-13.51)
Reserve money 80510.30 89734.40 97802.70 99958.80 103926.40 107926.40 112426.40
(+11.46) (+8.99) (+2.20) (+6.26) (+10.35) (+14.95)
Currency Issued 50465.40 60526.90 64896.50 68244.90 69702.01 72279.60 74582.40
(+19.94) (+7.22) (+5.16) (+7.40) (+11.38) (+14.93)
i) Currency outside banks 46157.10 54795.10 58417.10 61214.50 63072.71 65361.80 67573.50
(+18.71) (+6.61) (+4.79) (+7.97) (+11.89) (+15.67)
ii) Cash in tills 4308.30 5731.80 6479.40 7030.40 6629.30 6917.80 7008.90
(+33.04) (+13.04) (+8.50) (+2.31) (+6.77) (+8.17)
Deposits held with BB 30044.90 29207.50 32906.20 31713.90 34224.39 35646.80 37844.00
(-2.79) (+12.66) (-3.62) (+4.01) (+8.33) (+15.01)
Of which: Excess reserves 12402.90 4082.50 3363.30 490.10 6586.39 3846.80 3444.00
(-67.08) (-17.62) (-85.43) (+95.83) (+14.38) (+2.40)
Reserve money multiplier 4.51 4.91 5.29 5.36 5.37 5.35 5.36
Note:Note:Figures in brackets indicate percentage changes over end June.
Program 2012-13
June, 2010 June, 2011
Reserve Money
Reserve money recorded an increase of Tk.525.50 crore or 0.54 per cent during July-
January, 2011-12 compared to the increase of Tk.3541.90 crore or 4.40 per cent during
July-January, 2010-11. The increase of reserve money growth occured mainly due to
increase in net domestic assets of Bangladesh Bank by Tk. 174.30 crore or 0.48 per cent.
BBs other item (net) comprises among others interest suspense account of unclassified assets
Asian Clearing Union (ACU) and IMF Trust Fund (PRGF) of foreign liabilities. IMF loan
increasing liability contributes in gross foreign exchange reserve building. The foreign exchange
reserves is derived with the help of technical analysis for the first time using recent data and
ultimately matched with the BOP different accounts for maintaining high foreign exchange
reserves, which will contribute for better credit rating of the country.

Gross foreign exchange reserve US$ 10111.0 million for end February 2012 covering different
foreign currency ( USD, pound, euro and other currency totalling US$ 8717.0 million), SDR
holdings (US$727.61 million), Gold (US$654.08 million), reserve position in the IMF (US$0.66
million) and other foreign accounts (US$11.77 million). Exchange rate of end June 2011 is used
in this calculation to comprehend the erosion of foreign exchange over time in the BOP frontier.
Appreciation of Dollar against SDR for instance will generate less amount of Dollar in a contract
with the IMF. The gross foreign exchange reserve using current market rate is US$ 10066.77
million for end February 2012. Stated that NFA of BB is equivalent to gross foreign exchange
reserves deducting liabilities includes for example Asian Clearing Union (ACU) balance, project
FC account and FC clearing account. The divergence between programme and actual RM is
exhibited in Table 4.
Following monetary aggregates RM and M2 liabilities side currency figure is stochastic.
Currency data of different period shows it’s positively related to transaction demand with respect
to GDP and inflation and inversely related to interest rate of banks and national savings
certificates (NSC). Precautionary demand for money represented by broadly demand deposit
(checking account) of real money balance (M1) is positively related to income. Speculative
demand (time deposit) is inversely related to interest rate. It may be pointed out that printing of
notes (Taka) for a year depends on GDP growth, inflation rate and amount of torn notes.
Financial innovations include debit card, credit card and mobile banking reducing the amount of
cash demand. DMBs maintain reserves with BB for daily transaction consequences. DMBs target
is to acquire marginal efficiency in terms of keeping minimum reserves in Taka denomination.
DMBs demand and time deposits 6 percent (CRR) along with foreign currency clearing account
balance is preserved as reserves in the balance sheet of BB. To avoid the liquidity shortfall
arising from cheque clearing DMBs retain Taka with BB more than cash reserve requirement
(CRR). For liquidity management purpose excess reserves is calculated deducting CRR from
local currency balance. Growth in currency reduces the excess reserves of DMBs. Largely
deposit growth depends on financial engineering.
High currency deposit ratio and reserve deposit reserve ratio lower the MM increasing high
powered money (RM). Accordingly OMO, repo, reverse repo and foreign exchange

sale/purchase is deployed allowing for short term liquidity management and keeping the desired
rates. Auction of government treasury bills and bonds is used for debt management tools. These
are the indirect instrument of monetary policy. Apart from those direct instruments CRR, SLR,
bank rate and discount window is used sparsely. RM is mainly deterministic. BB reins M2
through MM. Currency deposit ratio and reserve deposit ratio elements of liability side of M2
and RM determine the magnitude of MM. RM is the operating target of monetary policy. Credit
to government from the DMBs is complementary (necessary) element. On the other hand claim
on government from BB is substitute owing to opportunity cost of funds with seigniorage and
inflation effect. Eventually, the holders of Taka need to bear the cost of government seigniorage
gain. Concentration of asset due to unproductive investment in private and public sector
stimulate the income inequalities in the country impacting the benefit of GDP growth.

Table-4: Reserve money programme (In crore Taka)
Particulars June, 2013 (Programme) June, 2013 (Actual) Difference between
Programme and Actual of June, 2013
1 2 3 4
Net Foreign Assets of 76123.70 103246.00 -27122.30 Bangladesh Bank (-35.63)
Net Domestic Assets of 36302.70 9243.40 27059.30 Bangladesh Bank (+74.54)
Claims on Govt.(net) 40458.20 27069.00 13389.20 (+33.09)
Claims on other public 580.03 1354.50 -774.47 (-133.52)
Claims on DMBs 23824.21 10219.00 13605.21 (+57.11)
Other items (net) -28559.74 -29399.10 839.36 (-2.94)
Reserve money 112426.40 112489.40 -63.00 (-0.06)
Currency Issued 74582.40 75372.30 -789.90 (-1.06)
i) Currency outside banks 67573.50 67552.90 20.60 (+0.03)
ii) Cash in tills 7008.90 7819.40 -810.50 (-11.56)
Deposits held with BB 37844.00 37117.10 726.90 (+1.92)
Of which: Excess reserves 3444.00 3302.00 142.00 (+4.12)
Reserve money multiplier 5.36 5.36 0.00
Note:Figures in brackets indicate percentage changes over end June of previous fiscal.
Outstanding stock

Chart 5
The challenge of BB is to monitor the RM using OMOs tools. We observe (Chart 5) the
programme and actual deviation of NFA, NDA, government sector credit and loans to banks. But
the programme and actual RM are same at the end of June 2013 for effective formulating of RM.
Surge in overall balance of BOP has contributed to increase in NFA resulting decline in NDA.
NFA positively contributed to the economy. Government borrowed less in FY 2013 from the
BB. DMBs amount are also decreased comparing programme due to less demand of money in
this sector. BB has role to operate the OMOs prudently to manage the high powered money
(RM) for maintain stability in MM.
Money multiplier
In monetary and credit programming of Bangladesh RM is used as operating target. M2 is the
intermediate target and inflation and GDP growth is ultimate target. Stability in MM
(1+c/d)/(c/d+r/d) is assumed in monetary programming, which is the research question of this
paper. Stable and upward MM balances the inflation, GDP growth interest and exchange rate,
from macroeconomic point of view. Central bank tools open market operations (OMOs) and
government debt management tools includes banks finance to government are used to create the
orderly situation in money market of Bangladesh. Currency outside banks and reserves are the
two components of RM from liability side. Currency and reserve numbers are arrived from the
Issue Department and Banking Department balance sheet of BB. Increase in currency outside
banks and reserves (DMBs balance with BB) will reduce the MM. Increase in currency outside

banks increase the high powered money with inflationary impact. While increase in DMBs
reserve with BB assuming constant deposit growth will reduce the MM without creating inflation
that much. In such case, considering the economic situation BB can utilize the excess reserves of
RM proving loan at discount rate to the small and medium enterprises (SME). Stable and upward
MM (Table-3) through central bank operations will smooth monetary data generating process
(DGP) with white noise econometric regression inference and less loosing of degrees of freedom.
MM of Bangladesh observes volatility in some extent influencing interest rate, exchange rate and
inflation. Currency deposit ratio (c/d) and reserve deposit ratio (r/d) determines the magnitude of
MM. Deposit growth depends on currency demand and financial engineering. The monetization
rate in Bangladesh is sixty percent of GDP in relation to interest rate sensitivity and its pass-
through in the economy. Currency is a random factor. Excessive government borrowing from BB
enlarge the RM creating volatility in MM. Money multiplier can enter solving (1+c/d)/(c/d+r/d).
Programmed currency and deposit amount for end June 2013 is Tk. 67576.50 crore and
Tk.535129.60 crore. Reserve amount Tk.44852.90 crore contains cash in tills and balances with
BB. To arrive MM 5.36 for end June 2013 the calculated c/d is 0.12628 and r/d is 0.08382. The
long range MM can be found in Chart 6.
Chart 6

Balance of payments accounts programme in short
Export and import growth for FY 2011-13 is programmed 12.59 percent and 13.54 percent
(Table-5) correspondingly keeping the momentum of the economy. Workers remittance is
expected to uphold stable growth at 10.71 percent. As a result, US$ 1251 million will be surplus
in the current account. MLT loans expected to generate US$ 2163 million (Table-5) in the
financial account channelizing pipeline credit. Other long-term loan (net) will reach at US$ 101
million at the end of June 2013. DMBs contribute about US$ 55 million. Altogether the overall
surplus US$ 894 million is intended. Increase of BBs asset position US$ 686 million and
decrease of liabilities number US$ 208 million is calculated in this regard.
According to IMF BOP Manual (BPM-6) Income and Current Transfer head of BPM-5 will be
termed as Primary Income and Secondary Income of Current Account Balance (CAB). There is
also among others difference in sign treatment between BPM-5 and BPM-6 for debit and credit
entry. Export of Trade Balance is compiled using Export Promotion Bureau (EPB) data on value
of goods without shipment cost (f.o.b. price). BB data is used for calculation of Import at f.o.b.
(freight on board) price. Service head Debit mainly includes transportation and travel cost for
instance comprising medical and education cost abroad. FDI, Portfolio Investment, Other long-
term and Short-term interest is included in the Debit account of Primary Income. Grant
component Food aid and Commodity aid is included in the Official Transfers of Secondary
Income of CAB.

Project aid is integrated in the Capital Account. Portfolio Investment relates to investment in the
capital market. FDI is the most precious investment of Financial Account. Financing through
Economic Relations Divisions such as loan from World Bank, ADB or other agencies together
with specific country is counted in the Medium and Long Term Loans head of Financial
Account. Other long-term loans (net) speak about private sector loan. Bangladesh Petroleum
Corporation loan is built-in Other short-term loan account. Difference between EPB and BB
Table-5: Balance of payments Programme (In million USD)
Particulars FY 2011-12 (Actual) FY 2012-13 (Actual) FY2012-13 (programme) Trade balance -7995 -7009 -9304
Exports f.o.b(including EPZ) 1/ 23992 26567 27013 (+4.28) (+10.73) (+12.59)
Imports f.o.b(including EPZ) 31987 33576 36317 (+5.44) (+4.97) (+13.54)
Services -2566 -3162 -2345 Credit 2684 2830 2780 Debit 5250 5992 5125
Primary income -1508 -2369 -1865 Credit 195 120 140 Debit 1703 2489 2005 Of which:Official interest payment 373 476 193
Secondary income 13699 14928 14765 Official transfers 105 97 160 Private transfers 13594 14831 14605 of which : Workers' remittances ( current a/c. portion) 12843 14338 14218
(+10.24) 2388 (+10.71) Current account balance 1630 629 1251 Capital account 469 629 512
Capital transfers 469 0 512 Others 0 2863 0 Financial account -955 1726 -869
i) Foreign direct investment(net) 995 368 1017 ii) Portfolio investment (net) 198 123 28 iii) Other investment(net) -2148 769 -1914
MLT loans 2/ 1460 2085 2163 MLT amortization payments 789 906 889 Other long-term loans (net) -57 -150 101 Other short-term loans (net) 242 -100 -139 Trade credit (net) -1450 -250 -1890 Other assets -1606 0 -1315 DMBs & NBDCs(net) 52 90 55 Assets 443 396 440 Liabilities 495 486 495
Errors and omissions -650 -752 0 Overall balance 494 5128 894 Reserve assets -494 -5128 -894
Bangladesh Bank(net) -494 -5128 -894 Assets 293 5196 686 Liabilities 201 68 208
1/ Excludes local sales reported by EPB. Some adjustments necessiated by BOP considerations have been made. 2/ Excluding supplier's credit, reclassified as trade credit below.

export data is known as Trade Credit (net). Difference mainly relating to export and import of
Export Promotion Zone (EPZ) is captured in Other Assets account. Reporting error and exchange
rate difference is reflected in the Errors and Omissions account of Financial Account. Positive
sign in the Asset side of BB means increases of liability may be from IMF. Negative sign
indicates increase of Liability. Overall Balance of BOP emerges in the table increasing the
liabilities of BB following BPM-6. Overall balance of BOP can be increased considering higher
foreign exchange reserves. Performing technical analysis with the past short term range data of
foreign exchange may increase the NFA of BB. Technical exercise implies foreign exchange
reserves can be increased at higher level addressing BOP accounts. ARIMA exercise can be
deployed in this regard. We know that the NFA of BB is derived from the overall balance of
BOP. If the balance of a particular year (end June) is US$ 100 and the overall balance of BOP is
US$ 10 then the total NFA of BB will be US$110. In technical analysis, the overall balance of
BOP may be generated as US$ 20. Then the total NFA will be US$120. The extra US$ 10 need
to be distributed in the MLT accounts of BB. So, the increased amount in MLT of BOP will
increase the overall balance of BOP. Good governance, confidence of foreign remitter in home
country investment, increase in export and FDI can ensure extra amount of inflow of foreign
funds through MLT and other relevant accounts of BOP and contributes in pilling up substantial
foreign exchange reserves. The foreign exchange reserves is derived with the help of technical
analysis for the first time using recent data and ultimately matched with the BOP different
accounts for maintaining high foreign exchange reserves, which will contribute for better credit
rating of the country. BOP programme and actual position can be found in Table-6. Chart 7 is
signifying the difference of BOP programme and actual numbers.
Monetary, external, fiscal and real sector development and their interaction can be quantified in
tabular form (Table-7). This is how I can establish the sectoral relationship of the economy.

Table-6: Balance of payments programme (In million USD)
Particulars FY2012-13 (programme) FY2012-13 (Actual) Trade balance -9304 -7009
Exports f.o.b(including EPZ) 1/ 27013 26567 (+12.59) (10.73)
Imports f.o.b(including EPZ) 36317 33576 (+13.54) (+4.97)
Services -2345 -3162 Credit 2780 2830 Debit 5125 5992
Primary income -1865 -2369 Credit 140 120 Debit 2005 2489 Of which:Official interest payment 193 476
Secondary income 14765 14928 Official transfers 160 97 Private transfers 14605 14831 of which : Workers' remittances ( current a/c. portion) 14218 14338
Current account balance 1251 2388 Capital account 512 629
Capital transfers 512 629 Others 0 0 Financial account -869 2863
i) Foreign direct investment(net) 1017 1726 ii) Portfolio investment (net) 28 368
123 iii) Other investment(net) -1914 769
MLT loans 2/ 2163 2085 MLT amortization payments 889 906 Other long-term loans (net) 101 -150 Other short-term loans (net) -139 -100 Trade credit (net) -1890 -250 Other assets -1315 0 DMBs & NBDCs(net) 55 90 Assets 440 396 Liabilities 495 486
Errors and omissions 0 -752 Overall balance 894 5128 Reserve assets -894 -5128
Bangladesh Bank(net) -894 -5128 Assets 686 5196 Liabilities 208 68
1/ Excludes local sales reported by EPB. Some adjustments necessiated by BOP considerations have been made. 2/ Excluding supplier's credit, reclassified as trade credit below. P= Provisional. R= Revised

Chart 7
Higher overall balance (Chart 7) of BOP has contributed to increase the foreign exchange
reserves in the country. Consequently, BB needs to apply proper sterilization policy to maintain
the Taka rate against US dollar. NDA is derived from RM minus NFA. As a result, we have
watched the lower growth in NDA (Chart 5) of RM. Other components of BOP follows stable
programmed and actual paths.

Provisional Estimated Projection
2008-09 2009-10 2010-11 2011-12 2012-13
A. Real Sector(%)
National income and prices (percent change)
Nominal GDP growth (% change) 12.6 12.9 13.4 15.9 14.1
Real GDP 5.7 6.1 6.7 7.0 7.2
CPI Inflation (average) 6.7 7.3 8.8 9.5 7.5
Total Domestic Investment as percent of GDP 24.4 24.4 24.7 25.9 26.6
Domestic saving 20.1 20.1 19.6 20.2 19.9
National saving 29.6 30.0 28.4 26.3 26.8
B. Fiscal Sector (%)
Total revenue 10.4 10.9 11.8 12.6 13.4
Tax 8.6 9.0 10.1 10.6 11.2
No-ntax 1.8 1.9 1.7 2.0 2.2
Total expenditure 14.3 14.6 16.2 17.7 18.5
Revenue expenditure 11.2 11.0 12.0 13.2 13.2
Annual Development Program 3.2 3.7 4.2 4.5 5.2
Budget overall balance (Excluding grant) -3.9 -3.7 -4.4 -5.1 -5.0
Financing (net) in percent
Domestic financing 3.1 2.3 3.8 3.8 3.3
Banking source 2.2 -0.3 3.2 3.2 2.4
non-bank 0.9 2.6 0.6 0.6 0.9
Foreign financing 0.8 1.3 0.6 1.3 1.8
C. Monetary Sector
Money and credit (percent change)
Net domestic assets 17.8 18.8 25.0 21.9 15.8
Private sector 15.9 17.6 28.4 19.1 18.0
Broad money (M2) 19.2 22.4 21.4 17.0 16.0
C. External Sector
Balance of payments (percent change)
Exports, f.o.b. 10.1 4.2 41.7 14.5 14.5
Import, c.i.f. 4.2 5.4 41.8 15.0 15.0
Remittances( US$ billion) 9.7 11.0 11.7 12.9 14.5
Current account balance (%of GDP) 2.7 3.7 0.9 0.4 0.2
Gross official reserves (US$ billion) 7.5 10.7 10.9 9.7 10.7
Gross official reserves (months of import) 3.8 5.1 3.6 2.9 2.7
Source: Medium-Term Macroeconomic Outlook : FY11-FY17 Finance Division, Ministry of Financre GOB
Bangladesh Economic Review, 2012
Table- 7 Bangladesh: National Accounts Indicator
Actual

Unconventional monetary policy for ensuring inclusive GDP growth
The other objectives of monetary policy are ensuring inclusive GDP growth following
unconventional monetary policy for reduction of poverty and minimizing the income
inequalities. In this regard credit to small and medium enterprises (SME), progressive tax policy,
green banking, mobile banking, refinancing from BB for supporting agriculture and export are
pursuing for ensuring inclusive growth and robust financial sector.
Section IV
Conclusion
Presenting the crucial and dynamics of monetary policy is the noteworthy outcome of this paper.
Yearly and quarterly Bangladesh monetary and credit program path derivation approach will
help the stakeholders to move the economy in desired direction. Quantity theory of money and
other fundamental technical analysis are lucidly descried in this paper for moving towards higher
growth frontier with optimum inflation. Central bank core function can be consulted by the
stakeholders as the paper concentrated on Bangladesh monetary and credit program path
derivation with due diligence.
Reference
Arby, M.F.(2000). ―Predicting Money Multiplier in Pakistan‖, Pakistan Development Review,
Spring, 39(1), pp.23-35.
Bomhoff, E.J.(1997). ―Predicting the Money Multiplier: A Case Study for the US and the
Netherlands‖, Journal of Monetary Economics, 3 July, pp.325-345.
Baghestani, H. and T. Moot (1997). ―A Cointegration Analysis of the U.S. Money Supply
Process‖, Journal of Macroeconomics, 19(2), April, pp.269-283.
Ford, J.L. and J.L.Morris (1996). ―The Money Multiplier, Simple Sum, Divisia and Innovation-
Divisia, Monetary Aggregates: Cointegration Tests for the United Kingdom‖, Applied
Economics, 28, June, pp. 705-714.
Johannes, J. M M.and R.H.Rasche (1979). ―Predicting the Money Multiplier‖ Journal of
Monetary Economics, 5, pp. 301-325.
Park, Y.C.(1980). ―The ability of the Monetary Authorities to Control the Shock of Money in
LDCs‖ in W.L. Coats, Jr and D.R. Khatkhate (eds.), Money and Monetary Policy in Less
Developed Countries, Pergaman Press Ltd. London.
Sayed, Imam Abu (2013). ―Monetary Causality of Inflation of Bangladesh‖. Journal of the
Institute of Bankers Bangladesh, volume 60 number 2.
Sayed, Imam Abu (2014). ―Major Targets of Monetary Programming in Bangladesh‖. Journal of
the Institute of Bankers Bangladesh (IBB), volume 61, number 2.
Sayed, Imam Abu (2015). ―REER Index Based Exchange Rate and Financial Consequences in
Bangladesh Economy‖. Journal of the Institute of Bankers Bangladesh (IBB), volume 62,
number 1.

Sayed, Imam Abu (2015). ―Forecasting of VAR and ARIMA Based Exchange Rate of
Bangladesh‖. Thoughts on Banking and Finance, Bangladesh Bank Training Academy
(BBTA), volume 4, issue 2.
Sayed, Imam Abu (2016). ―Yield Curve of Bangladesh and Financial Issues for Investment‖.
Thoughts on Banking and Finance, Bangladesh Bank Training Academy (BBTA),
volume 5, issue 1.
Sayed, Imam Abu (2016).―Excess Reserve Management of Bangladesh Bank‖. Journal of
Business and Economics. Daffodil International University, Bangladesh, volume 10,
No. 1.
Sayed, Imam Abu, S. Waheduzzaman, M. Shamim and R. Alok (2016). ―Technical Stock Valuation
of a Company: Bangladesh Perspective‖. Bangladesh Bank Working Paper, WP 1620.
Sayed, Imam Abu, S. Waheduzzaman, F. Omor and M. Shamim (2016). ―The Interrelationship
between Money Supply and Nominal GDP in Bangladesh Bank‖. Working Paper, WP
1622.
Taylor, John B. (2009). ―Getting Off Track: How Government Actions and Interventions
Caused, Prolonged, and Worsened the Financial Crisis‖, Hoover Institution
Press. ISBN 0-8179-4971-2.
Younus,Sayera and Akhtaruzzaman (2012). ―Estimating growth-inflation trade off threshold in
Bangladesh‖. Bangladesh Bank Training Academy Journal, Vol.1.
Younus, Sayera (2017). ―Responses of Inflation and Output to Shocks in Monetary Policy:
A case study with Bangladesh using DSGE model‖. Bangladesh Bank Working Paper
no.1701.

Annexure
Brief on econometrics exercise related to monetary variables of Bangladesh are highlighted next.
1. ARMA model
Bangladesh GDP stability test
The 8th model is an autoregressive moving average process, ARMA(5,5) process with one lag interval,
which can be elaborated as:
bd_growth = a + b bd_growth(-1) + c bd_growth(-3) + d bd_growth(-5) +
ma(1) + ma(3) + ma(5) + u
bd_growth = 0.19 + 0.88 bd_growth(-1) - 0.26 bd_growth(-3) + 0.37 bd_growth(-5) -0.99 ut-1+
0.39 ut-3 -0.36 ut-5
Adjusted R2 =0.62 Schwarz criterion = 2.85
Here coefficients of growth at lag 1, lag 5 and with error term at lag 1 are highly significant; coefficient of
growth at lag 3 and coefficients of error term at lag 5 are statistically significant; and coefficients of
error term at lag 3 is tending toward statistical significance. Goodness of fit is improved significantly.
From the above models, the model 8 is better than all other models from the viewpoint of goodness of fit,
the significance of the coefficients and Schwarz criterion.
However, in determination of appropriate model, it has to satisfy the conditions of no serial correlation,
no heteroskedasticity and non-normality error. The stability of GDP test result is robust following
diagnostic test. The diagnosis of these tests for model is given below:
Serial Correlation test: The correlogram of residuals (Q-stat) at lag 4, 8 and 12 are shown below:
Q-stat at lag 4: 3.57 (0.06), lag 8: 5.21(0.39), lag 12 :7.69 (0.57)
Q-stat at all conventional lags indicates that there is no serial correlation in the residual.
Heteroskedasticity test: The correlogram of squared residuals at lag 4, 5 and 12 are shown below:
lag 4: 3.35 (0.07), lag 5.23 (0.39), lag 12 : 5.59 (0.78)
After taking correlogram of squared residuals, I do not find any evidence of heteroskedasticity at
conventional lags length.
Non-normality test: To test non-normality error, Jargque-Bera test is made and found the following
results
Jarque-Bera : 1.83 (0.40)
The value of Jarque-Bera indicates that there has been non-normality error in the distribution. Basically
the distribution has an excess kurtosis.
OLS model
Drawing OLS regression model stating dependent and independent variables:
Y = β1+ Ui
Y = β1+ β2X1 + β3X2 + β4X3 + β5X4 +β6X5+Ui
Here, dependent variable is ACI stock price denoted by Y and the independent variables are: X1 = DSE
all share price index; X2 = Risk free rate of return; X3 = Consumer Price index (CPI); X4 = Gold Price and
X5 = Petroleum Price.

Correlation coefficient
DSE TBILL CPI Gold Petroleum
DSE 1
TBILL 0.128 1
CPI 0.234 0.148 1
Gold 0.286 0.277 0.348 1
Petroleum 0.149 0.301 0.136 -0.064 1
Source: Authors' Calculation
Empirical Results (ACI and DSE)
Variable Coefficient t-Statistic Probability F-statistic
DSE 1.1377 5.1794 0.0000 26.8259
Source: Authors' Calculation
Empirical Results (ACI and all variables under consideration)
Variable Coefficient t-Statistic Probability
DSE 1.2447 5.5122 0.0000
T-Bill -0.2318 -1.0074 0.3209
CPI -3.3427 -1.7364 0.0915
Gold Price -0.1081 -0.0025 0.9980
Petroleum Price 18.6000 0.6609 0.5131
F-statistic=6.5115
Source: Authors' Calculation
2. ARDL model
The Interrelationship between Money Supply and Nominal GDP in Bangladesh
Granger Causality Test
Hypothesis Probability
GDP does not Ganger cause M2 0.041
M2 does not Ganger cause GDP 0.323
Source: Statistics Department of BB and Bangladesh Bureau of Statistics (BBS).Year:2014
Empirical Results and Analysis
Unit Root Test for Stationarity
The choice of most appropriate unit root test is difficult in practice. Ender (1995) suggested that a
safe choice is to use unit root test—the Augmented Dickey–Fuller (ADF) (1981) test. The Augmented

Dickey-Fuller (ADF) test is widely applied for unit root tests. Therefore, to test stationarity, we conducted
the widely used method of unit root tests—the ADF test—on the variables M2 and nominal GDP for
Bangladesh. The unit root tests were performed at level and at first difference with the trend and intercept
term. The optimum lag was selected by using the Akaike Information Criterion (AIC). A summary of the
ADF unit root test result is presented in Table.
Augmented Dicky Fuller Test of Unit root
Variables Model T-statistic Integration
GDP Trend and intercept -6.005[0.000] I(0)
M2 Trend and intercept -5.499[0.000] I(1)
Source: Statistics Department of BB and Bangladesh Bureau of Statistics (BBS), 2014
Shows that GDP is I(0) and M2 is I(1), which is in a mixed form. None of variable is I(2).This
suggest to perform ARDL Bound test approach (Pesaran, 2001).
Model Selection Criterion
The criterion for variables lag order selection is presented in the following graph. On the basis of
the Akaike Information Criterion (AIC). the optimal lag length has been selected. According to the AIC,
among the top 20 model our best model for this study is ARDL (3,2) model.
7.12
7.16
7.20
7.24
7.28
7.32
AR
DL
(3,
2)
AR
DL
(2,
2)
AR
DL
(3,
0)
AR
DL
(2,
0)
AR
DL
(4,
0)
AR
DL
(4,
2)
AR
DL
(3,
1)
AR
DL
(3,
3)
AR
DL
(2,
1)
AR
DL
(2,
3)
AR
DL
(1,
2)
AR
DL
(4,
1)
AR
DL
(1,
0)
AR
DL
(4,
3)
AR
DL
(1,
1)
AR
DL
(3,
4)
AR
DL
(2,
4)
AR
DL
(1,
3)
AR
DL
(4,
4)
AR
DL
(1,
4)
Akaike Information Criteria
Source: Statistics Department of BB and Bangladesh Bureau of Statistics (BBS), 2014
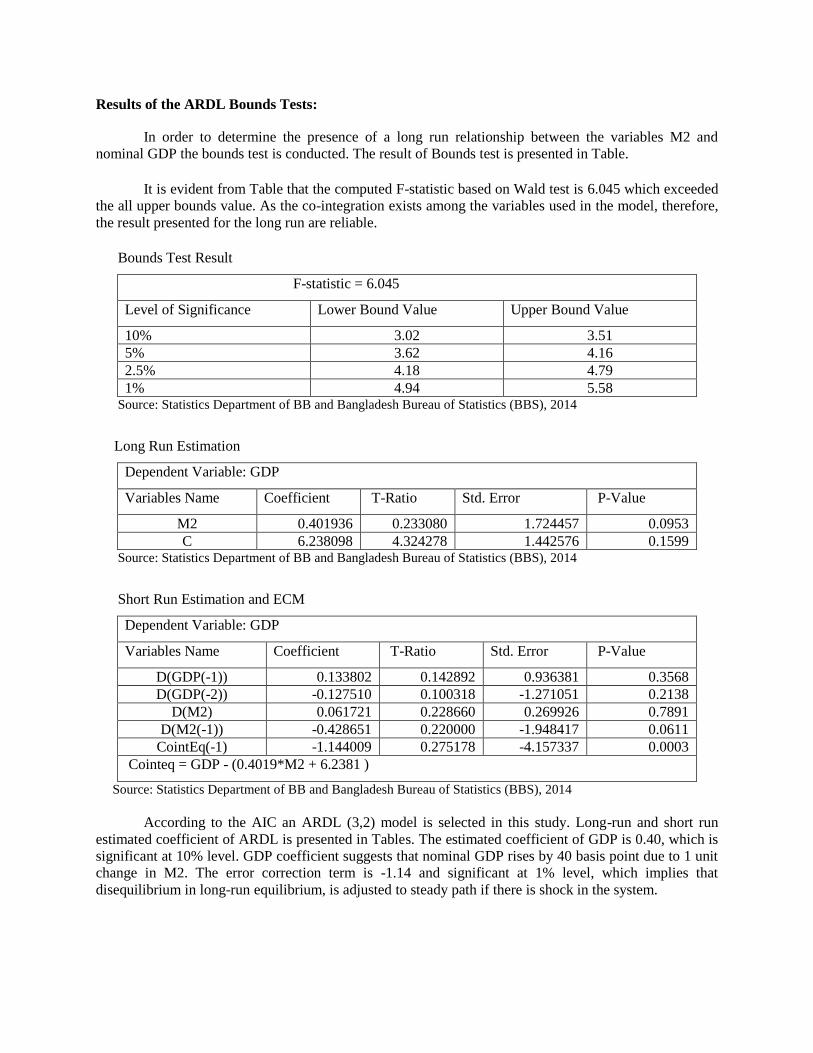
Results of the ARDL Bounds Tests:
In order to determine the presence of a long run relationship between the variables M2 and
nominal GDP the bounds test is conducted. The result of Bounds test is presented in Table.
It is evident from Table that the computed F-statistic based on Wald test is 6.045 which exceeded
the all upper bounds value. As the co-integration exists among the variables used in the model, therefore,
the result presented for the long run are reliable.
Bounds Test Result
F-statistic = 6.045
Level of Significance Lower Bound Value Upper Bound Value
10% 3.02 3.51
5% 3.62 4.16
2.5% 4.18 4.79
1% 4.94 5.58 Source: Statistics Department of BB and Bangladesh Bureau of Statistics (BBS), 2014
Long Run Estimation
Dependent Variable: GDP
Variables Name Coefficient T-Ratio Std. Error P-Value
M2 0.401936 0.233080 1.724457 0.0953
C 6.238098 4.324278 1.442576 0.1599 Source: Statistics Department of BB and Bangladesh Bureau of Statistics (BBS), 2014
Short Run Estimation and ECM
Dependent Variable: GDP
Variables Name Coefficient T-Ratio Std. Error P-Value
D(GDP(-1)) 0.133802 0.142892 0.936381 0.3568
D(GDP(-2)) -0.127510 0.100318 -1.271051 0.2138
D(M2) 0.061721 0.228660 0.269926 0.7891
D(M2(-1)) -0.428651 0.220000 -1.948417 0.0611
CointEq(-1) -1.144009 0.275178 -4.157337 0.0003
Cointeq = GDP - (0.4019*M2 + 6.2381 )
Source: Statistics Department of BB and Bangladesh Bureau of Statistics (BBS), 2014
According to the AIC an ARDL (3,2) model is selected in this study. Long-run and short run
estimated coefficient of ARDL is presented in Tables. The estimated coefficient of GDP is 0.40, which is
significant at 10% level. GDP coefficient suggests that nominal GDP rises by 40 basis point due to 1 unit
change in M2. The error correction term is -1.14 and significant at 1% level, which implies that
disequilibrium in long-run equilibrium, is adjusted to steady path if there is shock in the system.

Autocorrelation Diagnostic checking
Breusch-Godfrey Serial Correlation LM test and unit root of the model residuals are examined to
see if there is any autocorrelation. The LM test is performed at different lags which are given below:
Lag LM F-statistic P-value
1 0.273 0.605
2 0.224 0.801
The F statistic value of LM test up to lag 2 is insignificant at 5% level of significance, suggesting
there is no autocorrelation in the model residuals.
Correlogram Q-staitstics up to 16 lags shows that none of the statistics is significant. This result
also conform to the findings from Breusch-Godfrey Serial Correlation LM test that there is no serial
correlation in the residuals.
Heteroskedasticity Test
It is likely that time series data shows variability over time that is residuals can be
heteroskedastic. So, Autoregressive Conditional Heteroskedasticity (ARCH) test is used to see whether
the conditional variances of errors identical or varying across time. The following table gives the result of
ARCH test for heteroskedasticity.
Lag Chi-Square value p-value
1 0.065 0.799
The above results shows that the probability values of chi-square for selected lag are greater than
5% level of significance, which suggests the null hypothesis that there is no ARCH up to the order
specified by the lag cannot be rejected.
Model Specification Test
The model specified in this study is correctly formed according to Ramsey RESET (Regression
Specific Error Test) test which is a general test to check the correctness of the specification of the model.
The results of Ramsey RESET test is furnished in the following manner:
Omitted variables F statistic p-value
Squares of regressors 0.306 0.585
The p values of F statistic indicates the null hypothesis that the coefficients of omitted variables
(squares of fitted regressors) is zero cannot be rejected at 5% level of significance. It means that the
model without any quadratic terms of specified regressors is a good fit.

Stability Test
Cumulative sum (CUSUM) test has been examined to test the stability of long run coefficient.
The result obtained is given in the following figure
Stability test of coefficient
-16
-12
-8
-4
0
4
8
12
16
86 88 90 92 94 96 98 00 02 04 06 08 10 12
CUSUM 5% Significance Source: Statistics Department and Bangladesh Bureau of Statistics (BBS), 2014
It can be seen from the above Figure that the plot of CUSUM stays within the critical 5% bounds
which confirms the stability of coefficient in the long run.
3. ARIMA model
Forecasted monthly (average) exchange rate plot using ARIMA with seasonal treatment
6054484236302418126
90
80
70
Time
Exra
te
Time Series Plot for Exrate
(with forecasts and their 95% confidence limits)
95 percent confidence level (with seasonality) (Taka/US$ exchange rate)
Month average Forecast Lower Upper Actual
July 12 82.432 81.0529 83.8112
81.7715
August 12 82.5303 80.5743 84.4863
81.5160
September 12 82.7584 80.3559 85.1610
81.7286
October 12 83.8163 81.0340 86.5985
81.3123

November 12 84.5619 81.4422 87.6815
December 12 87.2837 83.8563 90.7111
Source: Authors' Calculation
4. VAR model
Variance Decomposition of LNREMIT:
Period S.E. EXRATE LNEXPORT LNIMPORT LNREMIT 1 0.074232 14.98364 25.11464 2.450293 57.45143
2 0.080250 24.93988 21.71999 2.804236 50.53589 3 0.096091 28.91536 17.08647 3.345848 50.65231 4 0.101997 33.75897 15.16939 4.301009 46.77063
5 0.109251 36.08092 13.55246 4.750810 45.61581 6 0.113257 38.31229 12.63199 5.560966 43.49475 7 0.117049 39.58967 11.95621 6.099145 42.35498
8 0.119648 40.62891 11.48602 6.836234 41.04884 9 0.121898 41.27726 11.15878 7.439006 40.12496 10 0.123650 41.73331 10.91049 8.132011 39.22419
Cholesky Ordering: EXRATE LNEXPORT LNIMPORT LNREMIT Source: Authors' Calculation
Forecasting of Exchange Rate of Bangladesh using VAR model
Form VAR monthly average forecasted exchange rate for July, 2012= -4.137+1.389-0.828+0.692+0.016
= -2.868 percent growth over June, 2012 exchange rate (81.820)=79.474 (under-cast comparing actual
81.772 of July,2012 ). VAR analysis and forecasting imply that economy of Bangladesh observing
interdependence relationship with co-integrating vector.
5. VECM
Estimated coefficient of Reserve Money (RM) and inflation and other variables
Johansen’s Co-integrated Tests
Trace Test
Maximum Eigen Value Test
Null
Hypothesis
Alternative
Hypothesis
Statistics 95%
Critical
Value
Statistics 95% Critical
Value
r=0 r=1 51.70752* 47.85613 25.59641 27.58434
r≤1 r=2 26.11111 29.79707 15.66276 21.13162
r≤2 r=3 10.44835 15.49471 8.740594 14.26460
r≤3 r=4 1.707753 3.841466 1.707753 3.841466
*(**) denotes rejection of the hypothesis at 5%(1%) level
Trace test indicates 1 co-integrating equation; Max-eigenvalue test indicates no co-integration at the 0.05
level
Source: Authors' Calculation

+
DGINFLATION = 12.09 + 0.36 DRM(-1) -1.36INTRATE(-1) -0.33 NEERGR(-1) -0.04ECT(-1)
(3.13) (-0.91) (-1.66) (-2.42)
1 percent change in Reserve Money (RM) increases 0.36 percent of inflation with 3.13
t-statistics.
Impulse Response Function (IRF)
IRF of ginlation to RM band overlap the 0 (mean) line. Where, RM to inflation band did not
converge to 0 line. The IRF implies general inflation has more power to impact high powered
money. If the inflation raises it will create more RM. Higher currency in circulation of RM
contribute more inflation rather higher growth in Deposit Money Banks reserve in RM. Other
variables are showing convergence and divergence with respective time period.
-.8
-.4
.0
.4
.8
1 2 3 4 5 6 7 8 9 10
Response of GINFLATION to RM
-.8
-.4
.0
.4
.8
1 2 3 4 5 6 7 8 9 10
Response of GINFLATION to INTRATE
-.8
-.4
.0
.4
.8
1 2 3 4 5 6 7 8 9 10
Response of GINFLATION to NEERGR
-4
-2
0
2
4
6
1 2 3 4 5 6 7 8 9 10
Response of RM to GINFLATION
-4
-2
0
2
4
6
1 2 3 4 5 6 7 8 9 10
Response of RM to INTRATE
-4
-2
0
2
4
6
1 2 3 4 5 6 7 8 9 10
Response of RM to NEERGR
-.3
-.2
-.1
.0
.1
.2
.3
1 2 3 4 5 6 7 8 9 10
Response of INTRATE to GINFLATION
-.3
-.2
-.1
.0
.1
.2
.3
1 2 3 4 5 6 7 8 9 10
Response of INTRATE to RM
-.3
-.2
-.1
.0
.1
.2
.3
1 2 3 4 5 6 7 8 9 10
Response of INTRATE to NEERGR
-4
-2
0
2
4
1 2 3 4 5 6 7 8 9 10
Response of NEERGR to GINFLATION
-4
-2
0
2
4
1 2 3 4 5 6 7 8 9 10
Response of NEERGR to RM
-4
-2
0
2
4
1 2 3 4 5 6 7 8 9 10
Response of NEERGR to INTRATE
Response to Cholesky One S.D. Innovations ± 2 S.E.

6. DSGE model
o Filtering of de-seasonalized logarithmic data with the Hodrick-Prescott (HP) filter or by de-
trending
o Determination of priors and potential priors
o Comparing priors and posterios mean for interest rate increase to curb inflation for example.
o Conditional variance decomposition of the interested variables.