dubai business survey - اقتصادية دبي...dubai business survey q1 - 2017 dubai’s economy...
TRANSCRIPT

DUBAI
Dubai Economy
Economic Information DivisionEconomic Policies & Studies Sector
BUSINESSSURVEYQ 1 - 2 0 1 7
DUBAIBUSINESSSURVEYQ1 - 2017
INTRODUCTION
The Dubai Economy (DED) was established in March 1992, with the objective to organize, regulate and boost trade and industry within the Emirate of Dubai.
In October 2008, HH Sheikh Mohammed bin Rashid Al Maktoum, UAE Prime Minister and Vice-President, and Ruler of Dubai, issued Decree no. 25 giving full responsibility to DED to plan and regulate the overall economic performance of Dubai, supervise its functions and support the economic development to ensure that the objectives of the Dubai Strategic Plan are achieved.
DED is still responsible for its traditional activities of business registration, licensing and commercial protection in Dubai. However with four new agencies offices now under the umbrella of DED, the mandate has been extended to include:
1. Mohammed Bin Rashid Establishment for Small & Medium Enterprises (SME)
2. Dubai Export Development Corporation (EDC)
3. Dubai Investment Development Agency (FDI)
4. Dubai Competitiveness Office (DCO)
In line with DED’s new mandate, the Economic Information Division conducts a quarterly Business Survey, in coordination with DED Agencies (EDC & SME) and in collaboration with Dun & Bradstreet South Asia Middle East Ltd., in order to provide a timely and objective assessment of business expectations and performance. This document summarizes the main findings of the survey for the first quarter of 2017.
AT A GLANCE
• The Composite BCI has declined by 5.3 points on a y-o-y basis, from 116.5 points in Q1, 2016 to 111.2 points in Q1, 2017, weighed down by a weaker forecast for large companies.
• On a quarterly basis, the Composite BCI has dropped by 9.8 points, decreasing from 121.0 points in Q4, 2016 to 111.2 points in Q1, 2017 due to a slower demand and profitability forecast.
• SMEs hold stronger business projections for Q2, 2017 compared to the large companies, with Composite BCIs at 117.1 and 107.2 points, respectively.
• The forecast for Q2, 2017 is weaker than that for Q1, 2017 for the following parameters: sales revenues, volume of sales and net profits.
• The manufacturing sector has registered the firmest forecast for volumes for Q2, 2017, followed by the services sector, while traders continue to be the least optimistic.
• Exporters hold a stronger outlook compared to the overall business community with Composite BCI scores of 119.2 and 111.2 points, respectively. While exporters are more optimistic about revenues, volumes and net profits, domestic-market oriented firms have a stronger forecast for selling prices and hiring.
• Survey respondents expect the business situation in Q2, 2017 to be similar to the environment in Q1, 2017. The proportion of firms that have forecast an improvement for Q2, 2017 stands at 45%, which is at par with the proportion (47%) in the previous quarter. 78% of the respondents have indicated that they do not expect any hurdles to impact their business operations during Q2, 2017.
• Respondents are more bullish about their capacity expansion and technology upgrade plans in Q1, 2017 vis-à-vis Q4, 2016. 65% hope to upgrade technology in Q1, 2017 compared to 61% in Q4, 2016 and 61% intend to expand capacity in Q1, 2017 versus 57% in Q4, 2016.
• 87% of the respondents have not implemented any type of innovation in their businesses in Q1, 2017, similar to the 88% in Q2, 2016.
02
DUBAIBUSINESSSURVEYQ1 - 2017
The Dubai Economy (DED) is a Dubai Government entity that has the mandate to help achieve the key strategic objectives of fostering ‘Sustainable Economic Development’ and strengthening the ‘Competitiveness of Dubai’.
In order to gauge the perceptions of the business community, DED conducts a quarterly business survey, to assess the level of current economic activity and the outlook of businesses for the next quarter.
In addition, the survey elicits feedback from businesses on challenges that may impact growth and development and assesses their investment outlook for the coming twelve months.
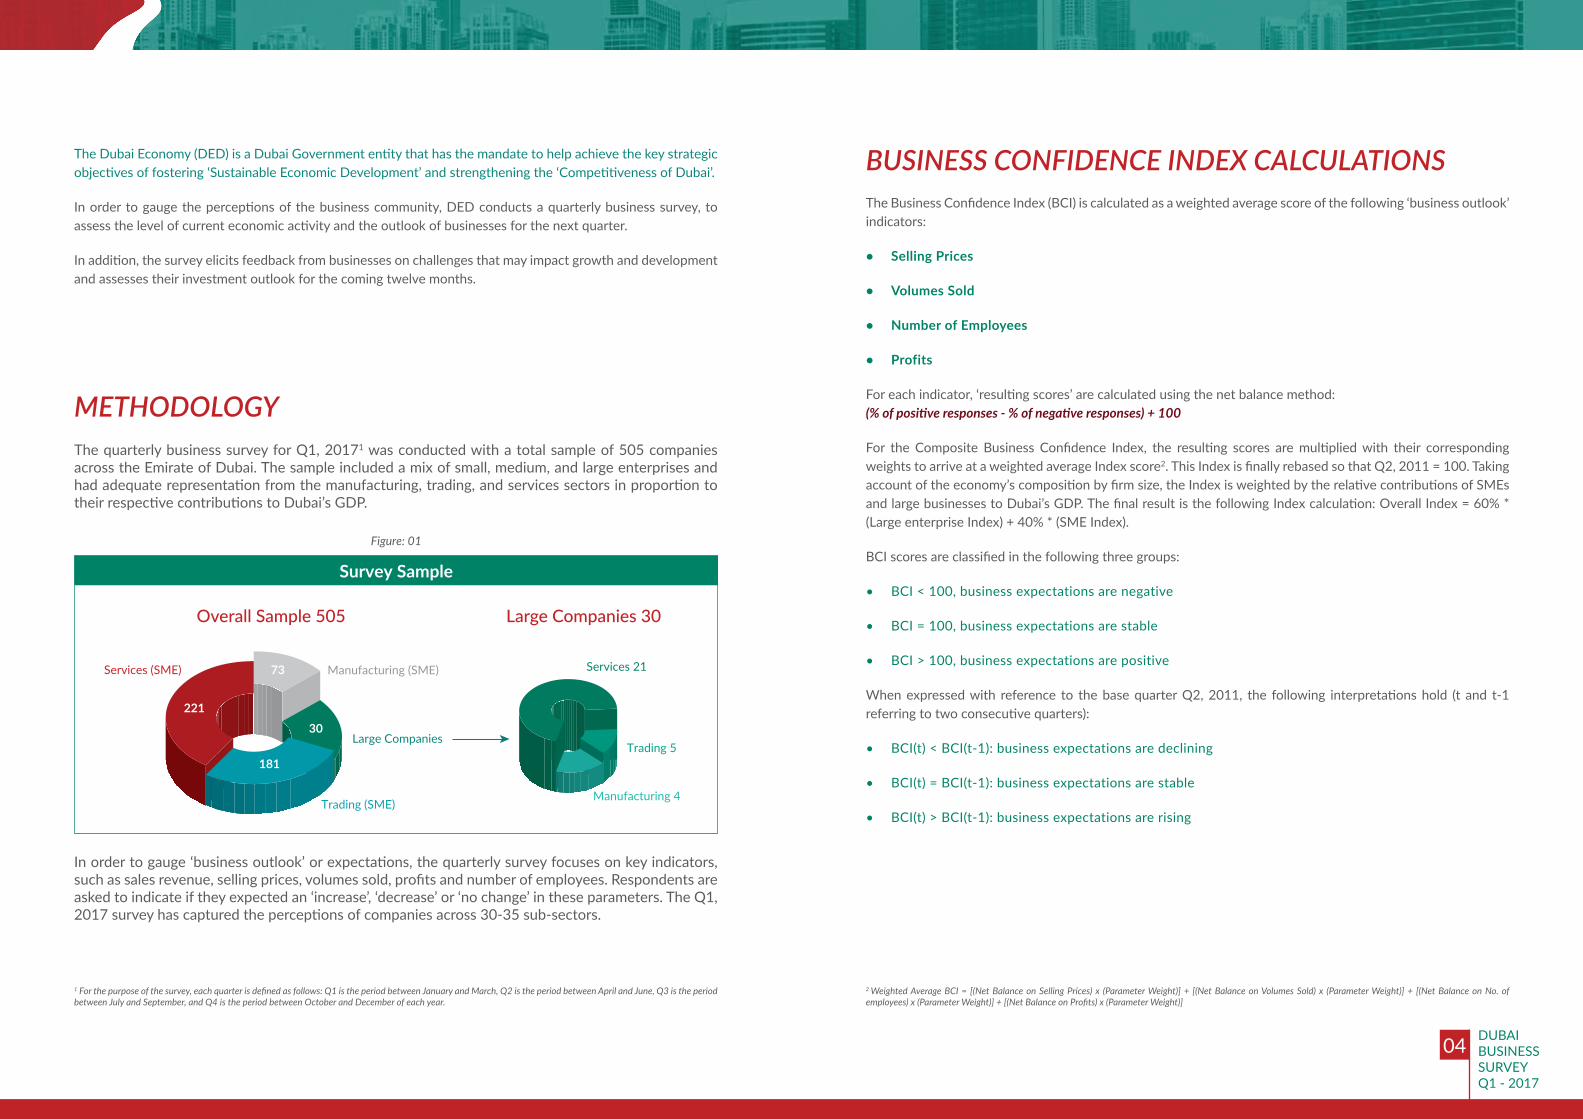
The quarterly business survey for Q1, 20171 was conducted with a total sample of 505 companies across the Emirate of Dubai. The sample included a mix of small, medium, and large enterprises and had adequate representation from the manufacturing, trading, and services sectors in proportion to their respective contributions to Dubai’s GDP.
In order to gauge ‘business outlook’ or expectations, the quarterly survey focuses on key indicators, such as sales revenue, selling prices, volumes sold, profits and number of employees. Respondents are asked to indicate if they expected an ‘increase’, ‘decrease’ or ‘no change’ in these parameters. The Q1, 2017 survey has captured the perceptions of companies across 30-35 sub-sectors.
1 For the purpose of the survey, each quarter is defined as follows: Q1 is the period between January and March, Q2 is the period between April and June, Q3 is the period between July and September, and Q4 is the period between October and December of each year.
METHODOLOGY
The Business Confidence Index (BCI) is calculated as a weighted average score of the following ‘business outlook’ indicators:
• Selling Prices
• Volumes Sold
• Number of Employees
• Profits
For each indicator, ‘resulting scores’ are calculated using the net balance method: (% of positive responses - % of negative responses) + 100
For the Composite Business Confidence Index, the resulting scores are multiplied with their corresponding weights to arrive at a weighted average Index score2. This Index is finally rebased so that Q2, 2011 = 100. Taking account of the economy’s composition by firm size, the Index is weighted by the relative contributions of SMEs and large businesses to Dubai’s GDP. The final result is the following Index calculation: Overall Index = 60% * (Large enterprise Index) + 40% * (SME Index).
BCI scores are classified in the following three groups:
• BCI < 100, business expectations are negative
• BCI = 100, business expectations are stable
• BCI > 100, business expectations are positive
When expressed with reference to the base quarter Q2, 2011, the following interpretations hold (t and t-1 referring to two consecutive quarters):
• BCI(t) < BCI(t-1): business expectations are declining
• BCI(t) = BCI(t-1): business expectations are stable
• BCI(t) > BCI(t-1): business expectations are rising
2 Weighted Average BCI = [(Net Balance on Selling Prices) x (Parameter Weight)] + [(Net Balance on Volumes Sold) x (Parameter Weight)] + [(Net Balance on No. of employees) x (Parameter Weight)] + [(Net Balance on Profits) x (Parameter Weight)]
BUSINESS CONFIDENCE INDEX CALCULATIONS
04

DUBAIBUSINESSSURVEYQ1 - 2017
Dubai’s economy grew 2.7% in real terms in 2016 despite declining oil prices, sluggish global trade and the knock-on effects of a difficult external climate. Dubai’s Economic Development Committee has projected that the Emirate’s economy will grow at 3.1% in 2017, with continued infrastructure spending in the lead-up to Expo 2020 and expansion in non-oil sectors such as retail and tourism. The Emirate’s growth in 2017 will also be supported by its construction sector aided by the pipeline of private and government backed projects. Dubai’s projections for Q2, 2017 are positive with the Composite Business Confidence Index (BCI) at 111.2 points in Q1, 2017 (A score of 100 indicates stable/neutral sentiments).
The Composite BCI has declined by 5.3 points on a y-o-y basis, from 116.5 points in Q1, 2016 to 111.2 points in Q1, 2017, weighed down by a weaker forecast for large companies. On a quarterly basis, the Composite BCI has dropped by 9.8 points, decreasing from 121.0 points in Q4, 2016 to 111.2 points in Q1, 2017 due to a slower demand and profitability forecast.
The survey also shows that SMEs hold stronger business projections for Q2, 2017 compared to the large companies, with Composite BCIs at 117.1 and 107.2 points, respectively. SMEs are more confident than large companies about all the parameters comprising the composite index: selling prices, volumes, net profits and number of employees.
BUSINESS CONFIDENCE INDEX – Q1, 2017According to the latest survey, the forecast for Q2, 2017 is weaker than that for Q1, 2017 for the following parameters: sales revenues, volume of sales and net profits. This is mainly due to the seasonal decline in demand observed during the summer months when the number of tourists visiting the Emirate reduces and there is a drop in customers due to vacations.
• The forecast for volume of sales has weakened q-o-q, with the net balance decreasing by 6 percentage points from 45% for Q1, 2017 to 39% for Q2, 2017. This weakening can be attributed to the seasonal slowdown in demand. However, half (50%) of the respondents anticipate an increase in their volumes during Q2, 2017 based on expectations of new projects and customers, while 11% of the firms have projected a decline.
• The manufacturing sector has registered the firmest forecast for volumes for Q2, 2017, followed by the services sector, while traders continue to be the least optimistic.
• Predictions for selling prices are similar for both quarters: Q1, 2017 and Q2, 2017. A majority (80%) of the respondents anticipate no change in their selling prices, while 11% expect their selling prices to increase.
• The outlook for net profits has moderated q-o-q in line with the weakening sentiments with respect to volumes.
• The forecast for number of employees has firmed up marginally, both on a quarterly and annual basis.
OVERALL BUSINESS OUTLOOK – Q2, 2017
06

DUBAIBUSINESSSURVEYQ1 - 2017
The manufacturing sector’s forecast for volumes for Q2, 2017 has shown a strong improvement compared to the predictions for Q2, 2016, but the outlook has moderated from the previous quarter due to the seasonal decline in demand or the completion of projects. For Q2, 2017, 57% of the manufacturing firms hope to sell higher volumes (versus 65% in the previous quarter) in anticipation of new projects/orders/customers. 33% of the respondents expect stability in their volumes, while the remaining anticipate a decline.
Furniture, metals and glass manufacturers are most optimistic about their volumes during Q2, 2017, while cement manufacturing firms are least confident.
MANUFACTURING SECTOR
SECTOR-WISE OUTLOOK FOR SALES VOLUMES
Among the key sectors, manufacturing companies hold the most bullish forecast for all the parameters in the survey: sales revenues, selling prices, volumes sold, number of employees, net profits and new purchase orders. The trading segment on the other hand holds the weakest outlook for revenues, volumes, hiring and purchase orders. For selling prices, the services sector has registered the least optimistic outlook.
The survey shows an annual improvement in the forecast for volumes, while on a quarterly basis, the forecast has moderated. The q-o-q weakening in volume projections is due to slower demand during the summer months, rising competition and lack of new projects.
• Within the services sector, the hospitality segment (travel & car rental firms) is most optimistic about its volumes during Q2, 2017 with a net balance of 70%. On the other hand, hotels & restaurants are least optimistic with a net balance of negative 36%, mainly due to reduced demand in the summer months.
• Among construction, architecture & real estate firms, 53% of them expect an increase in volumes during Q2, 2017 with expectations of getting new projects/orders, while 5% anticipate a decline, resulting in a net balance of 48%.
• In the transportation segment, 61% of the firms hope to see higher volumes during Q2, 2017, while a modest 5% anticipate a decrease. The remaining predict stability.
SERVICES SECTOR
08
The trading sector’s sentiments with respect to volumes are stable both on a y-o-y and q-o-q basis. 46% of the traders anticipate a rise in volumes during Q2, 2017, the same proportion as in the previous quarter and similar to the 44% for Q2, 2016. Among the three main sectors, trading firms hold the weakest outlook for revenues, volumes, hiring and purchase orders.
TRADING SECTOR

DUBAIBUSINESSSURVEYQ1 - 2017
Key sectors optimistic of higher demand over the next quarter include the following:
• Among electronic traders, 67% have forecast an increase in volumes as they expect the markets to improve and grow. None of the respondents in this segment expect a decline in their volumes.
• 56% of computer traders are confident of higher volumes in Q2, 2017, driven by expectations of getting new orders. The remaining firms do not expect any change in their volumes.
Additionally, 78% of the respondents have indicated that they do not expect any hurdles to impact their business operations during Q2, 2017. Competition and poor market conditions are the two leading concerns for Dubai’s firms.
Dubai’s firms expect the business situation in Q2, 2017 to be similar to the environment in Q1, 2017. The proportion of firms that have forecast an improvement for Q2, 2017 stands at 45%, which is at par with the proportion (47%) in the previous quarter. Similarly, the proportion of firms anticipating deterioration is steady on a q-o-q basis, moving from 7% to 8%, while the number of businesses anticipating stability has tracked sideways from 46% to 47%.
Dubai SME Rating Framework
“Dubai SME Rating Framework” is the first rating system for small and medium sized companies in the region. The system provides a comprehensive review of SMEs’ performance based on financial and non-financial criteria.
The Framework contributes to effectively realizing the UAE’s vision of building a sustainable and diversified economy. The initiative also plays a key role in achieving the goals of Dubai Plan 2021. Dubai Plan 2021 focuses on increasing the contribution of SMEs to the GDP as they are considered an integral pillar of the economy due to their contribution to generating innovative ideas, providing career opportunities, and boosting productivity.
The Framework will facilitate governmental support to rated SMEs through developing a unique strategic partnership between the private and public sector. This collaboration will result in providing SMEs with benefits that will help improve their efficiency with the aim of accelerating their growth and paving the way for them to thrive in a global setting.
Evaluation Framework:
The Dubai SME Rating Framework highlights key areas of strength and improvements in the following areas:
• Business Performance (Operational Analysis, Financial Analysis)
• Innovation
• International Expansion
• Corporate Social Responsibility
• Corporate Governance
Benefits:
The Dubai SME Rating Framework offers each rated company a bundle of services based on its rating:
• Capability Development Programme
• International Expansion Programme
• Financial Support Programme
• Benefits from Government Entities and Programme Partners
For more information please visit www.sme.ae
IN FOCUS
Expected Business Situation:

DUBAIBUSINESSSURVEYQ1 - 2017
Key outlook indicators are summarized below.
• SMEs have improved their outlook for all the parameters when compared on a y-o-y basis. A quarterly comparison shows moderation in the outlook for revenues, volumes and net profits, but a modest firming up in the hiring forecast.
• Predictions for selling prices remain stable with a net balance of 3% for both Q1, 2017 and Q2, 2017. 79% of SMEs project that their selling prices will remain unchanged due to competition, pre-determined contracts or because prices are determined by the market.
• SMEs are more optimistic than large companies regarding all the parameters comprising the composite index: selling prices, volumes, net profits and number of employees.
• Manufacturing SMEs are most bullish for all the parameters in the survey. The trading segment on the other hand holds the weakest outlook for revenues, volumes, hiring, net profits and purchase orders. For selling prices, the services sector has registered the least optimistic outlook.
• 55% of manufacturing SMEs and 48% of services firms forecast an increase in their capacity utilization rates during Q2, 2017.
SMEs account for a dominant share in Dubai’s total business composition (95% of the total number of firms). 475 of the 505 firms that were interviewed as part of the survey were SMEs. These included micro, small, and medium enterprises as per Dubai’s SME definition. SME business projections have strengthened q-o-q, with the Composite BCI increasing from 109.6 points in Q1, 2016 to 117.1 points in Q1, 2017, but the forecast is marginally weaker than in the previous quarter (composite BCI of 119.0 points in Q4, 2016).
DUBAI SME OUTLOOK – Q2, 2017
Key outlook indicators for the next quarter are summarized below.
• While exporters are more optimistic than domestic-market oriented firms about their revenues, volumes and net profits, the latter holds a stronger forecast for selling prices and hiring.
• The outlook for export sales has firmed up on a quarterly basis, but is comparable to the level observed a year ago.
• 41% of the exporters have indicated plans to export to new markets during Q2, 2017 versus a corresponding 22% in the last quarter. The leading new markets for export diversification are GCC, Asia –Pacific and Africa.
• The key challenges faced by Dubai’s exporters related to exporting their goods and services outside the UAE are lack of market knowledge (15%), competition (10%) and availability/cost of finance (6%).
The survey included 96 export-oriented manufacturing, trading, and services firms in Dubai. For the purpose of this report, an exporter is defined as an entity with exports accounting for 20% or more of its consolidated sales. Dubai’s exporters have raised their business forecast for Q2, 2017 in comparison to the previous quarter’s outlook as well as the projections for Q2, 2016. The composite BCI for exporters has increased from 111.8 points in Q1, 2016 and 112.4 points in Q4, 2016 to 119.2 points in Q1, 2017.
DUBAI EXPORTERS’ OUTLOOK – Q2, 2017
12

DUBAIBUSINESSSURVEYQ1 - 2017
Although the main purpose of the survey is to gauge business expectations for future activity, it also captures the actual changes in business performance from one quarter to another, as elicited from the feedback given by responding firms.
• The net balance for volumes sold in Q1, 2017 was negative 9%, resulting from 21% of respondents registering an increase in their volumes and 30% reporting a decrease. Firms that experienced a decline in their volumes were impacted by several factors including competition, slow market conditions, fewer customers, lack of new projects, rise in overhead expenses and political instability in the region.
• Most firms (70%) reported that their selling prices were unchanged in Q1, 2017, while 20% had to lower their prices mainly due to competition, poor market conditions and fewer customers.
• 76% of the respondents were able to maintain the size of their labor force, while 11% had to increase it to meet business requirements, and 13% had to reduce the number of employees.
• Performance with respect to net profits was in line with the trend with respect to demand and prices.
• Labor costs increased for 35% of the firms due to a hike in wages & salaries and rise in the cost of living, especially accommodation, but it remained unchanged for 62% of the firms.
• The rising cost of raw materials impacted 18% of the firms, while 49% reported no change in the parameter. Rental costs increased for 35% of the respondents.
• 33% of the firms reported that they availed of bank finance during Q1, 2017. Of these, 29% reported an increase in the cost of finance, while 68% said that such costs remained unchanged.
OVERALL BUSINESS PERFORMANCE – Q1, 2017
Net Balance = % of respondents citing an increase - % of respondents citing a decrease
• All sectors reported weak economic performances during Q1, 2017, with the services sector performing marginally better than the manufacturing and trading sectors. Within the services sector, the tourism and hospitality segment registered positive economic performance due to an increase in customers and new orders.
• While the overall net balance of the manufacturing sector was negative, cement and glass manufacturers recorded a positive economic performance in Q1, 2017. On the other hand, metals, plastics, furniture and food manufacturers achieved negative net balances.
• Within the trading sector, computer traders realized a positive net balance for volumes, while the remaining segments registered negative performances.
14

DUBAIBUSINESSSURVEYQ1 - 2017
• A smaller proportion of SMEs (20%) indicated a rise in their volumes in Q1, 2017 compared to those that reported a decrease (29%), resulting in a net balance of negative 9%.
• Hiring and employment numbers remained unchanged for majority of SMEs.
• Economic performance of SMEs was similar to that of large companies for most parameters. SMEs had a marginally better performance on selling prices, while large companies performed slightly better with respect to profits.
SMEs PERFORMANCE – Q1, 2017
• Exporters reported a better performance than domestic-market oriented firms with respect to revenues, profits and hiring, while the latter performed better in terms of selling prices and new purchase orders.
• Both groups achieved similar outcomes for volumes with the net balance at negative 8% for exporters and negative 9% for domestic-market oriented firms.
• While manufacturing exporters achieved a positive performance for volumes (net balance of 17%), traders and services exporters recorded negative net balances of 15% and 25%, respectively.
EXPORTERS’ PERFORMANCE – Q1, 2017
16

DUBAIBUSINESSSURVEYQ1 - 2017
A summary of the major challenges facing Dubai’s business community are as follows:
1. Competition: This factor is the foremost impediment to business operations in Dubai. Of all the firms that expect to get impacted by competition, 54% of the firms predict that it will intensify.
2. Demand/market conditions: Slow demand and poor market conditions are a hindrance to 5% of the respondents.
3. Increase in expenses: 4% of Dubai’s businesses are concerned about rising expenses.
4. Delay in payments/receivables: 4% of the firms have cited this as one of the leading obstacle to their operations.
The remaining concerns were less important and each impacted 3% or fewer than 3% of the participants.
The key hurdles faced by both SMEs and large companies were competition and demand/market conditions. Exporters were largely impacted by lack of market knowledge and competition.
KEY BUSINESS CHALLENGES IN DUBAIThe survey also addressed key challenges perceived by businesses at the end of Q1, 2017 that may impact near term business growth and development. 78% of the respondents do not expect to face any hurdles in their business operations in Q1, 2017 compared to 71% in the previous quarter.
INVESTMENT OUTLOOKThe survey also gauges the business community’s investment outlook with respect to capacity expansion and technology upgrade plans over a twelve-month horizon.
• Respondents are more bullish about their technology upgrade plans in Q1, 2017 vis-à-vis the previous quarter and sentiments a year ago. 65% of the firms intend to invest in upgrading technology in Q1, 2017 versus 61% in Q4, 2016 and 57% in Q1, 2016. Plans to invest in capacity expansion have firmed up on a q-o-q basis (61% in Q1, 2017 versus 57% in Q4, 2016), but are at par with projections a year ago (61% hoped to invest in expansion in Q1, 2016).
• Key reasons cited by respondents for not considering expanding business capacity include satisfaction amongst applicable respondents related to size and scale of their current operations and/or prioritization towards achieving stability and profitability, over and above market expansion. Additionally, some businesses did not want to expand amid poor market conditions or lack of new projects.
• Companies in the services sector are most optimistic about capacity expansion plans and technology upgrades. 69% of service companies versus 60% of manufacturing firms and 51% of traders have capacity expansion plans. 74% of services companies versus 62% of manufacturing firms and 55% of traders expect to implement technology upgrades.
• Large firms are more hopeful than SMEs about investment in business expansion and technology upgrades.
• Intent to invest in capacity and upgrade technology is similar among exporters and domestic-market oriented firms.
18

DUBAIBUSINESSSURVEYQ1 - 2017
INNOVATION ORIENTATIONSurvey participants were also asked if they were making any innovations in their businesses, the objective for such innovations and also the amount of provisions being made for R&D.
87% of all respondents in the survey indicated that they did not implement any type of innovation in their businesses; the corresponding proportion in Q2, 2016 was 88%. 6% of all respondents applied improvement/innovations in internal processes and 4% introduced products/services that were new to the UAE. These were the two leading categories of innovation in Q2, 2016 as well.
The survey also shows that 84% of the firms in the services sector did not implement any innovation in their businesses compared to 87% in manufacturing and 91% in trading. The manufacturing sector was most innovative in terms of introduction/customization of innovative products/services that are new to the UAE (5% in manufacturing firms versus 4% in trading and 3% in services companies), while service companies were most innovative with respect to improvements/innovations in internal processes (7% in services companies against 5% in trading and 3% in manufacturing).
Innovation implementation was higher among large firms compared to SMEs: 34% of large firms implemented innovation compared to 12% of SMEs. Among large firms 17% each applied innovation processes towards introduction/customization of innovative products/services that are new to the UAE and improvements/innovations in internal processes; for SMEs the corresponding proportions were 3% and 5%, respectively.
The key objectives for implementing innovation were quality improvement (46%), achieving reduction in costs (12%), productivity improvement (12%), achieving competitive advantage (10%) and realizing product/service diversification (10%).
A comparison of the key sectors shows that the key objectives for manufacturers were quality improvement, achieving product/service diversification and productivity improvement; for traders, quality improvement, achieving competitive advantage and realizing reduction in costs and for services firms, quality improvement, reduction in cost and achieving product/services diversification.
For large firms and SMEs, the reasons for innovation are the same as the overall survey.
20

DUBAIBUSINESSSURVEYQ1 - 2017
92% of all respondents indicated that they did not have an ongoing budget/provision for R&D in Q1, 2017 compared to 87% in Q2, 2016. Of the 8% that had an ongoing budget or made provisions for R&D, 24% had budgeted more than 10% of their sales for R&D (this proportion was 29% in Q2, 2016).
9% of manufacturers, 5% of traders and 9% of services companies have an ongoing budget or have made provisions for R&D. Among SMEs, the corresponding proportion was 7%, while it was 10% for large firms.
Economic Information DivisionEconomic Policies & Studies Sector
P.O. Box: 13223, Dubai, United Arab Emirates Tel: +9714 445 5555Dir: +9714 445 5881 | Dir: +9714 445 5884Fax: +9714 445 5830
w w w . d u b a i d e d . g o v . a e