dual-nutrient (total phosphorus and total nitrogen ...title: dual-nutrient (total phosphorus and...
TRANSCRIPT

Dual-Nutrient (Total Phosphorus and Total Nitrogen)
Remediation of Surface Water Quality at Lake Jesup, FL, a
Hypereutrophic Nutrient-Impaired Lake.

iii
Category: Environmental and Chemical Sciences
Title: Dual-Nutrient (Total Phosphorus and Total Nitrogen) Remediation of Surface Water Quality at
Lake Jesup, FL, a Hypereutrophic Nutrient-Impaired Lake.
Authors& Affiliation
William A. Eggers1, Duane E. De Freese1, Kirby Green1, Rebecca Burnett1, William
Fagan1 and Ronald Allen1
(1) AquaFiber Technologies Corporation, 1150 Louisiana Avenue, Winter Park, FL 32789. (407)
671-2782. [email protected]. www.aquafiber.com.
Corresponding Author
William A. Eggers1 [email protected]
Running Head
AquaFiber Technologies Corporation demonstrated a dual-nutrient remediation process for Florida
surface waters at Lake Jesup that targeted high-nutrient legacy loads and turbid tributary sources to
achieve Florida’s Numeric Nutrient Criteria for both total phosphorus and total nitrogen and achieved
high water clarity in post-treatment discharge waters.
Abstract
AquaFiber Technologies Corporation (AquaFiber) conducted a echnology demonstration project at
Lake Jesup, FL from 2009-2014. The project goal was to demonstrate the effectiveness of
AquaFiber’s proprietary, dual-nutrient (TP and TN) removal technology (AquaLutions®™) to help
reduce nutrients in a hypereutrophic lake as an effective and efficient component of a whole-
waterbody restoration strategy. During the 5-year contract period, AquaFiber treated and returned a
mean of 13.8 million liters per day (21,657,880,703 L total) of post-treatment water to Lake Jesup.
These data show the capacity and efficiency of AquaLutions®™ to reduce in-lake legacy loads of TP,
TN and TSS. Total TP removed was 2,879 kg. Total TN removed was 41,023 kg. Total TSS removed
was over 641,795 kg. AquaFiber achieved mean, post-treatment effluent concentrations of 0.033
mg/L TP and 1.64 mg/L TN during the 5-year contract period administered by the St. Johns River
Water Management District (SJRWMD). Mean, post-treatment TSS during that same period was

iv
10.22 mg/L. On average, AquaFiber exceeded Florida Department of Environmental Protection
(FDEP) Numeric Nutrient
Criteria (NNC) for TP in colored lakes (0.050 mg/L) and achieved TN concentrations within the
FDEP range for colored lakes (1.27 mg/L - 2.23 mg/L). The post-treatment water also often met or
exceeded drinking water clarity (9th quarter effluent TSS was 4.54 mg/L). These data also show that
AquaLutions®™ is an important water quality management option that is effective, efficient,
environmentally safe and cost-competitive. The AquaFiber process represents a new tool for surface
water managers and regulated stakeholders interested in Basin Management Action Plan compliance;
Total Maximum Daily Loads (TMDL) and NNC compliance; nutrient legacy load reductions; and
whole-waterbody restoration.
Key Words: AquaFiber, AquaLutions®™, AquaKnight®™, BMAP, dual nutrient, eutrophic, Florida,
hypereutrophic, in-lake, innovative, legacy, load, Numeric Nutrient Criteria, nutrients, restoration,
surface water, TMDL, TN, TP, TSS, technology, water quality, water remediation

v
Table of Contents 1.0 Introduction.................................................................................................................... 1
2.0 Materials and Methods .................................................................................................. 2
2.1 General ................................................................................................................................. 2
2.2 AquaLutions®™ Performance ................................................................................................. 4
2.3 Environmental Safety ........................................................................................................... 5
2.4 Biomass Handling and Disposal ............................................................................................ 5
2.5 Sustainability ........................................................................................................................ 6
3.0 Results ............................................................................................................................ 7
3.1 Scalable Water Treatment .................................................................................................... 7
3.2 Effective and Efficient Nutrient Reductions and Water Clarity Improvements ..................... 7
3.3 Environmental Safety ......................................................................................................... 14
3.4 Sustainability and Waste Biomass Handling ....................................................................... 14
4.0 Discussion .................................................................................................................... 16
4.1 Nutrient Removal Performance .......................................................................................... 16
4.2 Need for Nutrient Legacy Load Reductions ........................................................................ 16
4.3 Scalable ............................................................................................................................... 17
4.4 Sustainable ......................................................................................................................... 18
4.5 Challenges Ahead ............................................................................................................... 20
5.0 Conclusion ................................................................................................................... 26
6.0 Acknowledgements ....................................................................................................... 28
Glossary .................................................................................................................................. 29
References............................................................................................................................... 31
vi
List of Figures Figure 1: Location Map (Map depicting the AquaFiber Lake Jesup facility location in Florida and the
Middle St. Johns River Basin) .............................................................................................................. 3
Figure 2: Daily Average Flow v. Time (Influent and effluent flow measurements collected every six
seconds and averaged daily over the entire 5-year contract period, downtime included. The quartic
trend line (4th-order polynomial) indicates the rate of change when the rate isn’t constant) ................ 7
Figure 3: Weekly Composite Influent TP Concentration v Weekly Composite Effluent TP
Concentration (Influent and effluent flow measurements collected every six seconds and averaged
daily over the entire 5-year contract period, downtime included. The quartic trend line (4th-order
polynomial) indicates the rate of change when the rate isn’t constant.) ................................................ 8
Figure 4: Weekly Composite Influent TN Concentration v. Weekly Composite Effluent TN
Concentration (Influent and effluent TN concentrations collected every hour, composited and tested
weekly over the entire 5-year contract period, downtime excluded. The quartic trend line (4th order
polynomial) indicates the rate of change when the rate isn’t constant.) ................................................ 9
Figure 5: Daily Average Influent TSS Concentration v. Daily Average Effluent TSS Concentration
(Influent and effluent TSS concentrations collected every six seconds and averaged weekly over the
entire 5-year contract period, downtime excluded. The quartic trend line (4th order polynomial)
indicates the rate of change when the rate isn’t constant.) .................................................................. 10
Figure 6: TP Removal Efficiency (TP removal efficiency on a logarithmic scale over the 5-year
contract period for all weekly effluent TP composite sampling results.) ............................................ 11
Figure 7: TN Removal Efficiency (TN removal efficiency on a logarithmic scale over the 5-year
contract period for all weekly effluent TN composite sampling results.) ........................................... 12
Figure 8: TSS Removal Efficiency (TSS removal efficiency on a logarithmic scale over the 5-year
contract period for all average weekly effluent TSS sampling results.) .............................................. 13
Figure 9: AquaFiber's Iterative Process (Diagram showing AquaFiber’s iterative sampling, testing and
deployment process) ........................................................................................................................... 18
Figure 10: 10-Year TP Trend for Lake Jesup (TP concentrations in Lake Jesup over the last ten years
as shown by SJRWMD water quality data on the Seminole County Water Atlas.) ............................ 21
Figure 11: 10-Year TN Trend for Lake Jesup (TN concentrations in Lake Jesup over the last ten years
as shown by SJRWMD water quality data on the Seminole County Water Atlas.) ............................ 22
Figure 12: 10-Year TSI Trend for Lake Jesup (TSI values in Lake Jesup over the last ten years as
shown by SJRWMD water quality data on the Seminole County Water Atlas.)................................. 23

vii
Figure 13: St. Johns River Basin Map (Map depicting the major basin boundaries along the St. Johns
River) ................................................................................................................................................. 24
List of Tables Table 1: Biomass - Physical and Chemical Summary (Physical and chemical summary of all biomass
harvested by AquaLutions®™ and used for mass-balance calculations.) ............................................. 15

1
1.0 Introduction
Surface water quality restoration in nutrient impaired freshwater, estuarine and coastal marine
ecosystems requires total nitrogen (TN) and total phosphorus (TP) concentration reductions in source
inputs and in situ legacy loads (Havens & Frazer, 2012; Hudnell, 2010; Conley, et al., 2009; Paerl,
2009; Camargo & Alonso, 2006; and Boesch, 2002). While some scientists continue to debate the
efficacy of traditional, single-nutrient (TP or TN) reduction versus dual-nutrient (TP and TN)
reduction, growing evidence suggests that dual-nutrient reductions are essential to restore water
column ecological integrity and healthy freshwater-estuarine-ocean ecosystem connections (Lapointe,
Herren, Debortoli, & Vogel, 2015 in press; Havens, 2013; Havens & Frazer, 2012; Paerl, Hall, &
Calandrino, 2011; Hudnell, 2010; Conley, et al., 2009).
To address the growing crisis of nutrient pollution in surface waters, the United States Environmental
Protection Agency (EPA) through the Federal Water Pollution Control Act of 1972 (Clean Water
Act, 33 U.S.C. Ch. 26) recommended development of NNC for both TP and TN as an effective
strategy to address eutrophication and return impaired surface waters to their intended uses. As the
result of a lawsuit filed by the Florida Wildlife Federation and others in 2008, followed by a Consent
Decree in 2009, the State of Florida and the EPA worked to establish NNC for Florida surface waters
(FDEP, 2009). Ensuing Florida legislation and rule-making by the FDEP established NNC for
Florida’s lakes, rivers, streams, springs and more than 6,276 of the state’s estimated 6,904 km of
coastal estuaries. These new statewide NNC rules included biological response criteria. In 2010, the
EPA estimated that the total, annual incremental cost to implement the NNC in Florida could be
between $135.5 M - $206.1 M with only $28.1 M in predicted benefits (US EPA Office of Water,
2010), while a competing study commissioned by the Florida Water Quality Coalition estimated that
the same incremental costs could be between $3.1 B and $8.4 B, and that even using a narrative
approach those costs are still $1.0 B - $3.2 B (CardnoEntrix, 2010). Attainment of both NNC nutrient
concentrations and biological response criteria will challenge civic leaders, water managers and
regulated stakeholders to comply with the new standards, track water quality status and trends, and
implement meaningful surface water restoration.
In addition to regulatory changes, scientists and water managers in Florida now realize that 20 years
of stormwater regulations and projects that focused on nutrient reductions associated with stormwater
source control have not substantially improved water quality conditions (Hudnell, 2010). For Lake
Jesup, simulation models of stormwater loading to the lake demonstrated that even if all available

2
lands were converted to stormwater Best Management Practices (BMPs), the pollution reduction to
Lake Jesup would be insufficient to restore the lake (Brandt-Williams, 2010). Reduction of in situ
nutrient legacy loads is essential to achieve long-term water quality restoration goals for Lake Jesup
and most of Florida’s surface waters with high in-situ nutrient loads and organic muck deposit
accumulation.
In 2007, AquaFiber entered into a contract with the SJRWMD (Contract #SK473AA) to demonstrate
the effectiveness of its proprietary technology/process (AquaLutions®™). The contract’s stated goal,
“…is to clearly demonstrate that nutrient treatment technologies, alone or in combination, can
sustainably, substantially and cost-effectively remove TP from Lake Jesup on a long term basis and
potentially restore lake water quality to state standards.”
The water treatment facility was funded and built by AquaFiber using private funds. AquaFiber
supplied 100% of the facility construction costs and research and development (R&D) costs.
AquaFiber was reimbursed by the SJRWMD per pound of TP removed from the lake once the
harvested biomass and its associated TP were documented quantitatively, verified by SJRWMD, and
transported for proper disposal outside of the Lake Jesup sub-basin (contract specified disposal in a
landfill). AquaFiber’s project goal was to demonstrate and quantify the efficacy of its surface water
treatment technology and obtain independent public-sector verification of process performance from
relevant state agencies (i.e., SJRWMD, FDEP).
2.0 Materials and Methods
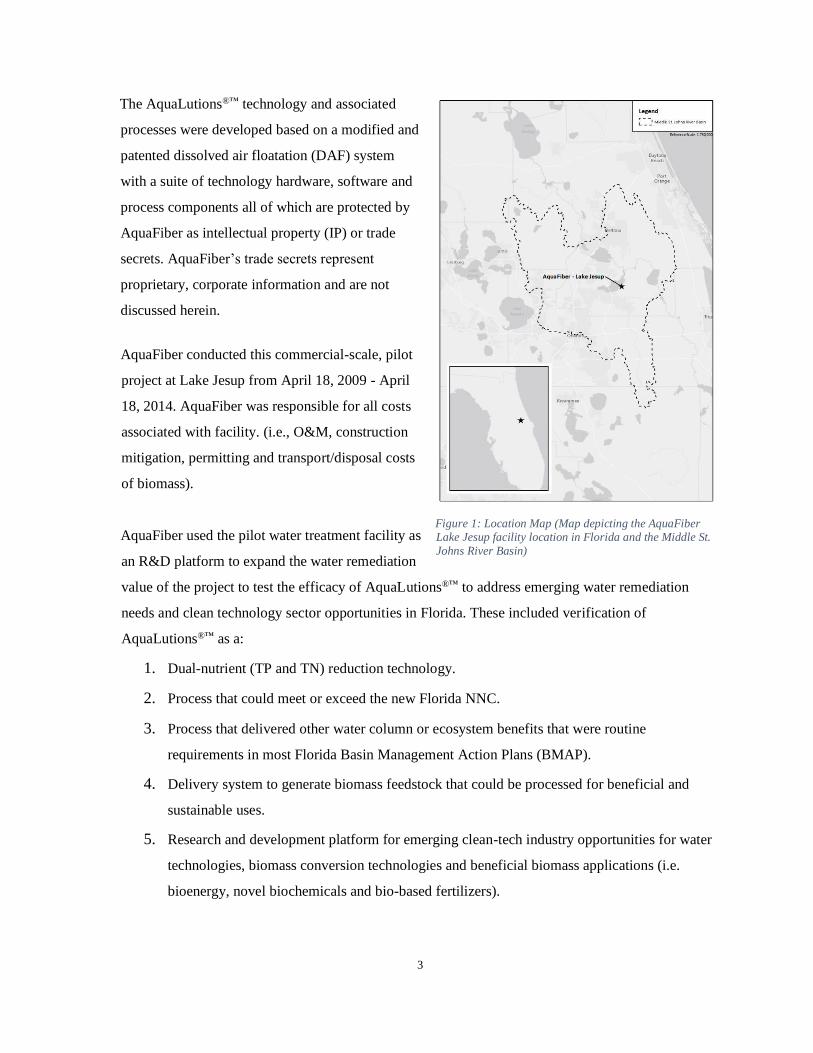
2.1 General: The AquaFiber facility is located on the southern shores of Lake Jesup, FL in
Sections 25 and 26, Township 20 South, and Range 31 East, Seminole County (Figure 1). The
property is ten (10) acres in size. It is owned by the SJRWMD and leased by AquaFiber. In order to
demonstrate the technology’s compact design, less than one (1) acre or 7% of the site is employed for
the AquaLutions®™ treatment process. The remainder of the land is used for: water pre- and post-
treatment (10%); biomass dewatering and storage (16%); stormwater ponds (22%); and gravel roads,
support infrastructure (e.g., admin trailers) and open space (45%).
3
The AquaLutions®™ technology and associated
processes were developed based on a modified and
patented dissolved air floatation (DAF) system
with a suite of technology hardware, software and
process components all of which are protected by
AquaFiber as intellectual property (IP) or trade
secrets. AquaFiber’s trade secrets represent
proprietary, corporate information and are not
discussed herein.
AquaFiber conducted this commercial-scale, pilot
project at Lake Jesup from April 18, 2009 - April
18, 2014. AquaFiber was responsible for all costs
associated with facility. (i.e., O&M, construction
mitigation, permitting and transport/disposal costs
of biomass).
AquaFiber used the pilot water treatment facility as
an R&D platform to expand the water remediation
value of the project to test the efficacy of AquaLutions®™ to address emerging water remediation
needs and clean technology sector opportunities in Florida. These included verification of
AquaLutions®™ as a:
1. Dual-nutrient (TP and TN) reduction technology.
2. Process that could meet or exceed the new Florida NNC.
3. Process that delivered other water column or ecosystem benefits that were routine
requirements in most Florida Basin Management Action Plans (BMAP).
4. Delivery system to generate biomass feedstock that could be processed for beneficial and
sustainable uses.
5. Research and development platform for emerging clean-tech industry opportunities for water
technologies, biomass conversion technologies and beneficial biomass applications (i.e.
bioenergy, novel biochemicals and bio-based fertilizers).
Figure 1: Location Map (Map depicting the AquaFiber Lake Jesup facility location in Florida and the Middle St.
Johns River Basin)

4
Water was pumped from Lake Jesup through high-density polyethylene (HDPE) intake pipes that
extended approximately 671 m into Lake Jesup. A specially designed intake “header” was used to
lower intake velocity and minimize organism entrapment. The intake was positioned in the mid-water
column. The intake pipe was anchored to the lake bottom and adjusted vertically in response to
changing lake water levels.
2.2 AquaLutions®™ Performance: Influent water flow was measured continuously using
Seametrics EX101 Magnetic Insertion Meters. Both intake pipes had a separate meter inserted and
both meters were connected to a FT420W Flow Computer and DL 76 Data Logger. Post-treatment
effluent water flow was measured continuously at a weir using a HACH SC200 Ultrasonic Flow
Sensor connected to an SC200 Controller. TSS was measured every six (6) seconds for both influent
and post-treatment effluent streams beginning in the 8th operational quarter using HACH SOLITAX
TSS probes. Flow and TSS data were collected, organized and archived daily by Microsoft SQL in
relational databases.
Composite water samples were collected by AquaFiber from influent (lake) and effluent (post
treatment) water streams using HACH Sigma SD 900 refrigerated composite water samplers. Lake
influent samples were collected from a side stream sample line connected to the influent pipes. Post-
treatment effluent samples were collected from a vault located at the end of the treatment train, just
before the water was returned to the lake. Post-treatment water traveled from the post-treatment
effluent water sampling site through a final receiving pond and discharge weir structure that
dispersed effluent water as a shallow, overland sheet flow through Lake Jesup’s lacustrine fringe
wetlands.
During treatment operations, 200 ml aliquots of influent lake water and effluent post-treatment water
were collected by each sampler every hour and composited in refrigerated, 5 L vessels. AquaFiber
collected weekly samples from each 5 L vessel manually at 0900 on Wednesday using 50 ml bottles
with an H2SO4 fixative. Influent and post-treatment effluent water samples were transported to an
independent, NELAC/NELAP-accredited laboratory for analysis (Flowers Chemical Laboratories,
Inc., Altamonte Springs, FL and TestAmerica Laboratories, Inc., Orlando, FL). Back-up samples
were also collected from each 5 L vessel using the same methodology and archived in refrigeration.

5
The laboratory examined both influent and effluent water samples for TP concentration as required
by the SJRWMD contract. However, AquaFiber recognized from the beginning that regulation of TN
was likely at both federal and state levels in the near future. In response to this emerging regulatory
interest in dual-nutrient remediation, AquaFiber instructed the laboratory to analyze each water
sample for TN (TKN and NO2/NO3).
Because this was a technology demonstration project, the SJRWMD and the FDEP exerted a high
level of oversight on system performance. SJRWMD conducted independent regular water quality
testing and verification as well as mass-balance nutrient estimates from the harvested biomass.
AquaFiber presented Quarterly performance reports to the SJRWMD staff for technical review and
comments. FDEP evaluated results of routine whole effluent toxicity (WET) tests. FDEP also
conducted an independent, random WET test in September and October of 2011.
2.3 Environmental Safety: Whole Effluent Toxicity (WET) testing is an important component of
the EPA’s integrated approach for detecting and addressing toxicity in surface waters. Once the
facility initiated pumping water (April 18, 2009) and achieved stable water flow and treatment
(October, 2009), AquaFiber conducted regular WET tests on both lake influent and post-treatment
effluent water. Initial testing was scheduled monthly for the first 4 months and quarterly thereafter. A
total of 16 routine WET tests were completed over the project duration. All analyses were performed
by Marinco Bioassay Laboratory Inc., Sarasota, Florida. Marinco Bioassay Laboratory is NELAP
accredited (#E84191) by the Florida Department of Health and its aquaculture facility is certified by
the Florida Department of Agriculture & Consumer Services, Aquaculture Certificate #AQ0668007.
Marinco conducted both acute and chronic WET tests on AquaFiber water samples using the fathead
minnow (Pimephales promelas) and the daphnid (Ceriodaphnia dubia). Cyanotoxin testing and algal
speciation was conducted by GreenWater Laboratories in Palatka, FL.
2.4 Biomass Handling and Disposal: Nutrient-laden biomass was collected as a byproduct from
the AquaLutions®™ process. As a requirement of the SJRWMD contract, this biomass was required to
be transported out of the Lake Jesup sub-basin, in a verifiable way. Freshly collected biomass was
sampled monthly during the first year of operations for tissue composition analysis. The first stage of
biomass dewatering was conducted on the Lake Jesup facility site in 30.5 m geotextile tubes. When it
had dewatered sufficiently, the biomass was transported to the second-stage drying site outside of the

6
Lake Jesup sub-basin where it was stored in a lined pond and allowed to dry further and await an end
user.
As part of the verification process and in conjunction with support from SJRWMD technical staff, the
total amount of TP contained in it was estimated using mass balance calculations. Biomass mass-
balance calculations were used as a quality control comparison to wet chemistry nutrient reduction
measurements. Each load of biomass removed from a geotube and transported offsite by truck was
weighed. Composite, 500 ml biomass samples were collected from each geotube at three locations.
Samples were sent to ABC Research Labs in Gainesville, FL to be analyzed for moisture content and
TP concentration. Composite 50 ml samples of the entrained or leachate water were sent to Flowers
Chemical Laboratories, Inc. in Altamonte Springs to be analyzed for TP concentration. Together,
these data allowed the water volume to be separated from the dry biomass and each assigned a TP
load for that geotube. An evaporation factor of 3.3% and 5% was applied pursuant to SJRWMD staff
directives to estimate nutrients remaining from any evaporated water.
2.5 Sustainability: One of the project performance criteria considered by the SJRWMD contract
was sustainability. Although the contract called for disposal of biomass in a landfill, AquaFiber
pursued numerous avenues to identify sustainable and beneficial uses of the biomass waste stream.
AquaFiber sought strategic partners within the biomass sector proactively. The company fulfilled
many requests for biomass samples from academic institutions, research labs and clean-tech industry
representatives. AquaFiber also conducted Resource Conservation and Recovery Act (RCRA-8
metals) and tissue analysis tests on the biomass to insure it did not contain large concentrations of
metals or other harmful components. These tests were small in number and conducted for regulatory
purposes. Due to the small number of samples, the results of those tests are not discussed in detail.
Biomass handling methodologies were varied based on end-user needs and are not detailed in this
paper. General comments about sustainable biomass applications are included in the discussion.

7
3.0 Results
The Lake Jesup facility was fully operational for a majority of the 5-year contract period. Sufficient
influent water was available during the entire contract period, but operational downtime was required
for routine maintenance and unscheduled events (e.g., power outages, equipment failures, weather
events, etc.). The results include all data collected from the operational period.
3.1 Scalable Water Treatment: AquaFiber treated and returned a mean of 13.8 million liters per
day of Lake Jesup surface water. The total amount of water flowed was 21,657,880,703 L. AquaFiber
adjusted the facility average daily water flow rate from a high of 28,890,249 L/day to a low of 32,706
L/day to test capacity (system scalability) and efficacy characteristics of the AquaLutions®™ process
(Figure 2). These water treatment data demonstrated that the process was scalable and effective
treating a wide range of water volumes and influent nutrient concentrations and TSS loads.
Figure 2: Daily Average Flow v. Time (Influent and effluent flow measurements collected every six seconds and averaged daily over the entire 5-year contract period, downtime included. The quartic trend line (4th-order polynomial) indicates the
rate of change when the rate isn’t constant)
3.2 Effective and Efficient Nutrient Reductions and Water Clarity Improvements: These data
show the efficiency of the AquaLutions®™ technology to remove large quantities of TP and TN, and
improve water clarity through TSS removal. Total TP removed was 2,879 kg (based on 228
quantified composite weekly samples). Total TN removed was 41,023 kg (based on 224 quantified

8
composite weekly samples). Total TSS removed was over 641,795 kg or (based on 125 quantified
composite weekly samples for operational quarters Q8-Q20 plus estimated TSS removal for Q1-Q7
based on the Q8-Q20 TSS removal average). Post-treatment water had high clarity (low TSS) after
the biomass/nutrient separation process was complete. These data show AquaLutions®™ ability to
maintain high TP, TN and TSS removal efficiencies over long periods of time and in response to
wide swings in both weather and lake water quality conditions. Lake Jesup TP concentrations ranged
from 0.03 – 0.62 mg/L (Figure 3). The mean weekly TP removal efficiency was 76.87% ± 18.36 SD
(n=228 weekly composite samples) with a demonstrated maximum TP removal capacity during an
operational quarter = 93.7%.
Figure 3: Weekly Composite Influent TP Concentration v Weekly Composite Effluent TP Concentration (Influent and
effluent flow measurements collected every six seconds and averaged daily over the entire 5-year contract period, downtime
included. The quartic trend line (4th-order polynomial) indicates the rate of change when the rate isn’t constant.)

9
Lake Jesup TN concentrations ranged from 1.26 – 9.92 mg/L (Figure 4). The mean weekly TN
removal efficiency was 52.03% ± 17.07 SD (n=224 weekly composite samples) with a demonstrated
maximum TN removal capacity during an operational quarter of 65.4%.
Figure 4: Weekly Composite Influent TN Concentration v. Weekly Composite Effluent TN Concentration (Influent and
effluent TN concentrations collected every hour, composited and tested weekly over the entire 5-year contract period,
downtime excluded. The quartic trend line (4th order polynomial) indicates the rate of change when the rate isn’t constant.)

10
Lake Jesup TSS concentrations ranged from 4.05 – 199.97 mg/L (Figure 5). During high wind
events, lake TSS concentrations exceeded the 200 mg/L limit of the HACH sensors. The mean,
weekly TSS removal efficiency was 72.5% ± 21.4 SD (n=125 weekly composite samples) with a
demonstrated maximum TSS removal capacity during an operational quarter = 90.2%. During the
TSS sampling period from 04/18/2011 through 01/18/2014 (Operational Quarters 8-20), the mean
water column TSS measured from waters collected from Lake Jesup was 46.14 mg/L. The mean post-
treatment discharge water returned to the lake was 9.33 mg/L.
Figure 5: Daily Average Influent TSS Concentration v. Daily Average Effluent TSS Concentration (Influent and effluent TSS
concentrations collected every six seconds and averaged weekly over the entire 5-year contract period, downtime excluded.
The quartic trend line (4th order polynomial) indicates the rate of change when the rate isn’t constant.)

11
Comparisons of composite influent TP, TN and TSS removal efficiencies versus corresponding lake
concentrations showed that TP removal efficiencies were 60 – 90% throughout a range of influent TP
concentrations of 0.05 – 0.6 mg/L TP (Figure 6).
Figure 6: TP Removal Efficiency (TP removal efficiency on a logarithmic scale over the 5-year contract period for all weekly effluent TP composite sampling results.)

12
TN removal efficiencies were generally lower and highly variable with a narrow range of removal
efficiency (45-55%) throughout a TN concentration range of 1.0 – 8.0 mg/L TN (Figure 7).
Figure 7: TN Removal Efficiency (TN removal efficiency on a logarithmic scale over the 5-year contract period for all
weekly effluent TN composite sampling results.)

13
TSS removal efficiencies were 40 – 90% throughout a range of influent TSS concentrations of 20 -
120 mg/L TSS (Figure 8).
Figure 8: TSS Removal Efficiency (TSS removal efficiency on a logarithmic scale over the 5-year contract period for all
average weekly effluent TSS sampling results.)
Pursuant to SJRWMD contract requirements, these data show AquaFiber’s ability to remove > 1
Metric Ton of TP/Year during Year-2 Operations (April 18, 2010 – April 18, 2011) with removal of
1,122.2 kg of TP with a mean water flow and treatment rate of 17.4 million L, and a corresponding
mean TP removal efficiency of 82.5%. In addition, these data show AquaLutions'®™ capacity to
reduce nutrient concentrations of TP and TN to levels that meet or exceed Florida’s NNC. The
system’s best performance period was in the 8 th quarter (January 18, 2011 to April 18, 2011) of
operations (1,447,821,534 L treated) when TP reduction exceeded 93% efficiency and TN reduction
exceeded 65% efficiency. During this period, the average influent TP concentration was 0.248 mg/L
(s.d. 0.0987) and the average effluent TP concentration was 0.0122 mg/L (s.d. 0.0158) for a total
mass removal of 327.00 kg TP. The average influent TN concentration during the 8th quarter was 4.11
mg/L (s.d. 1.558) while the average effluent TN concentration was 1.30 mg/L (s.d. 0.332) with a total
mass removal of 4,014.29 kg TN. AquaFiber achieved mean, post-treatment effluent concentrations
of 0.033 mg/L TP and 1.73 mg/L TN over the 5year operational period of the facility. On average,

14
AquaFiber exceeded the targeted NNC established by FDEP for TP for colored lakes (0.050 mg/L)
and achieved TN concentrations within the FDEP range for colored lakes (1.27 mg/L - 2.23 mg/L).
Although not mandated by the NNC specifically, AquaFiber’s TSS removal capabilities are also
impressive. The Lake Jesup system’s best performing TSS removal period was the 9th quarter (April
18, 2011 to July 18, 2011) when 1,490,056,183 L of water flowed and TSS removal efficiency
exceeded 90%. During this optimal quarter, influent TSS concentrations averaged 48.57 mg/L (s.d.
8.651) while effluent concentrations averaged 4.54 mg/L (s.d. 1.29) for a total mass removal of
324,694.62 kg TSS.
3.3 Environmental Safety: In 11 of 16 WET tests (68.8%), the post-treated water showed a
moderate to high decrease in toxicity compared to influent Lake Jesup water. In 2 of 16 WET tests
(12.5%), there was no toxicity in either the lake influent or post-treatment effluent waters resulting in
no change. In 3 of 16 WET tests (18.7%), there were variable results with IC25 results that Marinco
Lab reports indicate had possible pathogen interference. All Marinco Bioassay Laboratory WET test
results were provided to the FDEP. There were no non-compliance events throughout all 5 years of
operation and WET testing.
Preliminary test results on a Lake Jesup water and post-treatment biomass for cyanobacteria and
cyanotoxin (n=1) confirmed the presence and abundance of cyanobacteria species in Lake Jesup.
Two species dominated the samples (Microcystis spp. and Cylindrospermopsis spp.). Both are known
to be cyanotoxin producers. microcystin and cylindrospermopsin toxins were detected in Lake Jesup
water samples (0.4 µg/L for both toxins). Fresh biomass had microcystin levels of 24.8 µg/L. Aged,
air-dried biomass had microcystin levels that ranged from 0.2-1.3 µg/L. No anatoxin-a or saxitoxins
were detected.
3.4 Sustainability and Waste Biomass Handling: Freshly collected biomass was sampled monthly
for the first year of operations after stable water flow and treatment were achieved. Biomass was also
sampled during each offsite transport event and mass balance calculations were applied to estimate
the TP and TN contained within it (Table 1). Total biomass transported offsite was 6,079,310 kg.
Based on 3.3% and 5.5% rates of evaporation estimates, the total TP contained in this biomass was
between 2,932 kg and 3,683 kg, respectively. Most of the biomass transported offsite was transported
as wet biomass with an average solids content of 8% total mass. This was determined to be a

15
minimum solids content for safe truck transport. For regulatory purposes, a RCRA-8 metals test
(n=1) was conducted on the biomass by Flowers Chemical Laboratories, Inc. to determine whether it
was safe to spread on the ground. The results showed that the biomass did not contain RCRA-8
metals or did not contain them in concentrations that exceeded regulatory thresholds.
Table 1: Biomass - Physical and Chemical Summary (Physical and chemical summary of all biomass harvested by
AquaLutions®™ and used for mass-balance calculations.)
Total
Mass
Avg.
Moisture
Avg.
Biomass
[TP]
TP
Mass
TP Mass in
Entrained
Water (3.3%)
TP Mass in
Entrained
Water (5.0%)
Total TP at
3.3%
Evaporation
Total TP at
5.0%
Evaporation
kg % mg/kg kg kg kg kg kg
6,079,310 92 3,078 1,473 1,459 2,210 2,932 3,683
The majority of the wet biomass produced and transported offsite was converted to bio-based mulch
by Oldcastle Lawn and Garden, Inc., Polk County, FL. A small, but significant volume was used to
test a slow-release, low phosphorus fertilizer pellet process developed by VitAg Corporation, Orange
County, FL (http://www.vitagcorp.com/). During the contract, AquaFiber accommodated numerous
requests for biomass samples for use in a wide range of academic research, industry and government
R&D projects (i.e. hydrogen gas production, waste-to-energy via gasification and anaerobic
digestion, biofuels production, building materials, novel biochemical prospecting, and feedstock for
black soldier fly to protein meal conversion). In 2009-2010, AquaFiber transported approximately
112,279 L of wet biomass for biomass-to-energy research as a subcontractor to Science Applications
International Corporation (SAIC, http://www.saic.com/) who secured contracts from the Defense
Advanced Research Projects Agency (DARPA) to develop affordable alternatives to petroleum-
derived jet fuel (JP-8) from agricultural and aquacultural feedstock materials (DARPA Algal Biofuels
Program BAA08-07). Approximately 8,271 kg were produced by AquaFiber as a dry pulverized
biomass powder for SAIC energy conversion process development. Certified JP-8 jet fuel was
successfully produced from Lake Jesup biomass by SAIC and its partners. These results show that a
beneficial use for the biomass can be found throughout a range of treatment options and scale.

16
4.0 Discussion
4.1 Nutrient Removal Performance: The project results demonstrated that AquaLutions®™ was an
effective, efficient, scalable and environmentally safe TP remediation technology for Florida surface
waters. The project also demonstrated and verified a number of additional water restoration benefits
that were not part of the contract performance criteria. These benefits included: 1) reduction of TN
concentrations to meet Florida NNC; 2) reduction of other pollutant loads sequestered in the biomass
harvest (including RCRA-8 metals); 3) reduction of in-lake water toxicity; and 4) reduction of water
column turbidity. Due to the high flow rate that discharged large volumes of clean, oxygenated water
back to Lake Jesup, the project provided qualitative evidence that dissolved oxygen levels and water
flow in discharge waters were enhanced. In addition, cyanobacteria and potential cyanotoxins were
removed, and wetland habitat and quality improvements were documented. Scientific evidence
suggests that oxygen depletion can promote the release of pollutants from sediments (e.g. methylation
of mercury, manganese, or release of dissolved phosphorus) that can stimulate freshwater harmful
algal/cyanobacterial blooms (FHAB’s) and potential cyanotoxin production (Hudnell, 2010).
Regional-scale facilities that are sited and scaled strategically could be designed to improve oxygen
concentrations in eutrophic and hypereutrophic systems where low oxygen levels often have these
other deleterious effects. Strategic siting of facilities with targeted clean water discharge points could
be used to advance nearshore water quality improvements and enhanced coverage of submerged
aquatic vegetation.
AquaLutions®™ was designed specifically for water bodies with high nutrient loads and high turbidity
due to algal/cyano blooms, and thick legacy sediments caused by muck accumulation. Although not
presented here, AquaFiber demonstrated the effectiveness of the AquaLutions®™ process using its
mobile treatment unit (AquaKnight®™) on other lakes (Lake Apopka, Lake Thonotosassa, Lake
Hancock and Lake Trafford), flowing waters (Caloosahatchee River and St. Lucie River), stormwater
ponds (Isleworth County Club) and coastal estuaries (Indian River Lagoon). AquaLutions®™ does not
represent a “standalone” water restoration solution. Rather, it complements a broad range of source-
control technologies, watershed restoration projects, and legacy-load reduction initiatives that can be
combined to form a strategic whole-waterbody restoration initiative.
4.2 Need for Nutrient Legacy Load Reductions
For the past three decades, Florida water managers and regulators focused on stormwater
management practices and TMDLs to achieve the individual BMAP regulatory targets.

17
Regulated stakeholders were assigned TMDL targets for source control projects, but few BMAPs
recognized the importance of legacy load reductions, nor did they award nutrient removal credits for
legacy load reductions. Reduction of this legacy load is important because phosphorus accumulation
can be remobilized or recycled to act as a continuous source to waterbodies and downstream waters
for years, decades or centuries (Sharpley, et al., 2014). In support of the performance results of this
project, FDEP provided two letters to AquaFiber (dated August 31, 2011 and February 7, 2014
respectively) that recognized project success, confirmed process environmental safety, and authorized
BMAP credits for both phosphorus and nitrogen on a 1:1 basis (“…one pound of BMAP reduction
credit available for each pound of nitrogen or phosphorus removed from the basin”). To our
knowledge, this is the first issuance of both TP and TN credits for lakes in Florida. Florida’s first and
only water quality credit trading program was initiated as a pilot project for the Lower St. Johns
River in 2008 (s. 403.067, F.S. and Ch. 62-306, F.A.C.). A report to the Florida Governor and
Legislature was issued in 2010 with a recommendation that other areas of the state would likely
benefit from trading (FDEP, 2010). In August 2014, FDEP began hosting public workshops to
discuss expanding Water Quality Credit Trading Programs statewide. Prior to the submission of this
paper (2015), nutrient credit trading had not been initiated statewide.
4.3 Scalable: The ability to scale technology to address whole lake restoration goals represents a
significant restoration and process challenge. Based on the data collected and observations made at
the Lake Jesup pilot facility, AquaFiber modeled, conceptualized and confirmed its ability to build
regional-scale facilities on Lake Jesup or other water bodies of the state. The AquaLutions®™
treatment technology is not limited by scale. AquaFiber successfully operated a mobile treatment unit
(AquaKnight®™) at flow rates of 37,854 – 45,425 L (10,000 - 12,000 gpd). AquaKnight®™ was
operated as a multi-purpose laboratory platform that served three purposes: 1) Experimental platform
for new technology testing; 2) Working water treatment laboratory for preliminary nutrient reduction
field trials; and 3) A small volume test platform to generate composite water quality data to evaluate
facility site locations, facility size and cost-estimate modeling for regional-scale water remediation
facilities. The AquaKnight®™ and AquaFiber’s comprehensive and iterative process are shown in
Figure 9.

18
Figure 9: AquaFiber's Iterative Process (Diagram showing AquaFiber’s iterative sampling, testing and deployment
process)
4.4 Sustainable: Four cornerstones of sustainability are essential considerations for regional- and
ecosystem-scale surface water nutrient remediation projects:
1. Nutrient & Pollutant Sequestration: Removal of excess nutrients and other pollutants from the
watershed and nearby surface waters is the only way to address long-term nutrient reduction
goals. Most surface water nutrient removal projects in Florida that couple hybrid wetlands
and chemical treatment with alum consider the biomass a liability and dispose of it as waste.
The biomass from these projects is spread typically on the land at the treatment site or at an
approved disposal site within the same watershed. Natural wetland remediation sequesters
nutrients within the wetland biomass temporarily, but these nutrient sinks can shift to nutrient
sources under a variety of conditions and contribute to the problem rather than remediate it.
In addition, natural wetland uptake of nutrients do not retain high nutrient uptake efficiencies
over diverse spatial or long temporal scales. The preferred method is to find efficient and
effective treatment systems that incorporate beneficial uses to keep the nutrients from being

19
returned to the source water. The AquaFiber process removed all biomass residuals, nutrients
and other pollutants within that biomass permanently from the Lake Jesup watershed sub-
basin and found a beneficial use for it as a renewable energy feedstock or soil amendment
primarily.
2. Reliability and Adaptability: The data show high levels of nutrient reduction efficiency
throughout a broad range of weather, seasonal and lake conditions. Over the 5-year contract
period, the facility operated 24 hours a day and 7 days each week. Facility operations were
terminated from time to time to respond to power outages, equipment maintenance and/or
replacement, safety inspections, routine maintenance, technology improvements, holidays
and contract transitions. Lake Jesup is impacted by high variability in both weather and water
conditions (i.e. lake water levels, nutrient levels, water chemistry, turbidity, salinity impacts
from the St. Johns River, and extreme weather/wind events). The data show the ability of
AquaLutions®™ to perform effectively and efficiently throughout a wide range of working
conditions.
3. Environmental Safety: “Do no harm” is the foundation for sustainable and ethical water
technology applications. Results from 16 routine whole effluent toxicity (WET) tests
conducted over 5 years on a routine basis support the environmental safety of the process.
4. Biomass Handling and Sustainability: The SJRWMD contract called for residual biomass to
be disposed of in a landfill. However, AquaFiber determined that this method was not
economically viable, environmentally friendly, nor sustainable. Therefore, several beneficial
end-use applications were developed that sequestered and removed the nutrients from the
watershed permanently. AquaFiber developed a number of strategic relationships with
companies and scientific research institutions that represent the emerging clean technology
industry cluster for Florida and the United States. Examples included:
a. Certified JP-8 aviation jet fuel as part of a DARPA contract with SAIC
b. A hydrogen-based welding gas in partnership with MagneGas Corporation, Pinellas
County, FL (http://magnegas.com/)
c. Gasification to produce clean electricity with MaxWest Environmental Systems, Inc.,
Seminole County, FL (http://maxwestenergy.com/)
d. Anaerobic digestion to produce clean electricity with Harvest Power, Inc., Orange
County, FL (http://www.harvestpower.com/florida/)
e. Bio-based fertilizer mix Oldcastle Lawn and Garden, Inc., Polk County, FL

20
f. Low phosphorus slow release bio-fertilizer pellets through a process developed by
VitAg Corporation, Orange County, FL
In addition, considerable national attention is focused on biomass research for novel industry
applications. AquaFiber delivered biomass to a wide range of interested scientific research groups
looking at a multitude of applications from renewable energy to novel biochemicals and
pharmaceuticals. This level of interest in cyanobacteria and biomass represent a secondary,
unforeseen benefit of the AquaFiber Lake Jesup facility as an incubator for clean-tech expansion in
Florida.
4.5 Challenges Ahead: Lake Jesup has been described as, “hypereutrophic and nearly devoid of
submerged aquatic vegetation” (SJRWMD, 2002). The lake has been characterized as unhealthy with
excessive phosphorus and nitrogen concentrations, extensive muck deposits, and declining fish
populations. These conditions are typical of many lakes throughout Florida. Lake Jesup was an
appropriate site for water technology testing because it is considered, “…the most polluted lake
directly connected to the St. Johns River” (SJRWMD, 2008). After almost 20 years of stormwater
regulations and remediation projects, the Lake’s ecological condition has not improved dramatically.
Figure 10, Figure 11 and Figure 12 show the SJRWMD’s latest 10-year TP, TN and Trophic State
Index (TSI) water quality data and trends, respectively for Lake Jesup, as published on the Seminole
County Water Atlas (http://www.seminole.wateratlas.usf.edu). All three parameters are well above
the NNC or other indicators of a healthy lacustrine ecosystem, and show little change over time. A
simulation of stormwater loading to Lake Jesup by the SJRWMD demonstrated that even if all
available land in the basin were converted to stormwater Best Management Practices, the pollution
reduction to Lake Jesup would be insufficient to restore the lake (Brandt-Williams, 2010).

21
Figure 10: 10-Year TP Trend for Lake Jesup (TP concentrations in Lake Jesup over the last ten years as shown by
SJRWMD water quality data on the Seminole County Water Atlas.)

22
Figure 11: 10-Year TN Trend for Lake Jesup (TN concentrations in Lake Jesup over the last ten years as shown by
SJRWMD water quality data on the Seminole County Water Atlas.)

23
Figure 12: 10-Year TSI Trend for Lake Jesup (TSI values in Lake Jesup over the last ten years as shown by SJRWMD water
quality data on the Seminole County Water Atlas.)

24
This assessment confirms the need for
advanced water quality treatment approaches
and new technologies to reduce nutrient
source inputs and in-lake legacy loads to
achieve whole waterbody restoration goals.
Past lake management strategies, regulatory
compliance actions and BMAPs have focused
solely on reduction of TP at Lake Jesup (and
most freshwater lakes in Florida). It is our
opinion, that a single nutrient reduction
strategy is no longer scientifically defensible
for Lake Jesup. Lake Jesup is connected to
the Middle St. Johns River Basin (MSJRB)
with upstream connections to Lake Harney
and downstream connections to Lake
Monroe, the Lower St. Johns River Basin
(LSJRB) and ultimately the Atlantic Ocean
(Figure 13).
The MSJRB nutrient reduction targets are 76,341 kg TP/yr and 2,688203 kg TN/yr. The Lake Jesup
BMAP calls for a TP reduction of 8,504 kg only. There is no requirement for TN regulation or
reduction in the Lake Jesup BMAP. In contrast, the Lake Monroe and Lake Harney BMAP’s call for
a total reduction of Lake Jesup nutrient loads into the MSJRB of 5,715 kg of TP and 124,738 kg of
TN. This lack of regulatory consistency and downstream alignment of nutrient reduction goals
suggests that there is a clear need for BMAP re-evaluation, consistency analysis and modification. In
addition, most BMAPs and stakeholder TMDLs rely heavily on presumptive models and static land-
use patterns to estimate nutrient loads. Without quantification and independent verification of
measured nutrient reductions by BMAP projects, it becomes difficult for regulatory agencies to
document actual nutrient removal, evaluate BMAP compliance and initiate enforcement actions as
necessary. The result is that most BMAPs have not documented water quality improvements nor
achieved their intended water body remediation goals.
Figure 13: St. Johns River Basin Map (Map depicting the major basin boundaries along the St. Johns River)

25
In many Florida lakes, a key symptom of hypereutrophic conditions is cyanobacteria dominance and
blooms. This cyanobacteria dominance is a key characteristic of Lake Jesup (Coveney, et al., 2011).
Some cyanobacteria such as Microcystis can survive and even adapt genetically to the shifting, low
N2 or low P conditions of temperate freshwaters with high levels of dissolved organic matter like
Lake Jesup (Harke & Gobler, 2013). Therefore, P-only reduction strategies are likely to fail in lakes
dominated by these hardy, or non-N2 fixing cyanobacteria species (Conley, et al., 2009).
Furthermore, these waterbodies are interconnected and ultimately flow to the ocean. Holistic, dual-
nutrient reduction policies are necessary, so these downstream waters are also protected. Conley,
2009 and his coauthors state:
“It is prudent, and in most cases essential, to implement a dual-nutrient reduction strategy when
developing measures to control eutrophication. A focus on only P or N reduction should not be
considered unless there is clear evidence or strong reasoning that a focus on only one nutrient is
justified in that ecosystem and will not harm downstream ecosystems.”
This emerging focus on dual-nutrient reduction strategies has been supported by a growing number of
peer-reviewed scientific publications (Lewis, Wurtsbaugh, & Paerl, 2011; Moss, Jeppesen,
Sondergaard, Lauridsen, & Liu, 2013; Paerl, 2009; US EPA Office of Water, 2012). In addition, a
recent study on the Indian River Lagoon demonstrated that nutrient limitation may vary on both
spatial and temporal scales within a single waterbody (Lapointe, Herren, Debortoli, & Vogel, 2015 in
press). This provides further support for nutrient remediation strategies that can address dual nutrient
reduction.
The great challenge for Florida water managers will be to integrate and align regulatory mandates
with broader water quality restoration strategies to address both source inputs and legacy loads with a
long-term commitment to identify and track appropriate biological response criteria. This
comprehensive, long-term perspective is essential to evaluate restoration efficacy with full
consideration and understanding of complex spatial and temporal variability with Florida ecosystems.
There is an urgent need for the state to adopt standardized methodologies for economic and project
cost analyses. The complex nature and diversity of restoration approaches presents a continuing
challenge for regulated stakeholders, policy makers and clean-tech industry partners. Over the past 5
years, AquaFiber was confronted with a wide range of opinions and values regarding the cost to

26
remediate phosphorus in Florida surface waters. A review of the published literature and extensive
discussions with local municipalities and the SJRWMD confirmed that there was no standard
methodology to analyze project costs. In addition, these projects only sequestered the nutrients in situ
for re-introduction to the water column at a later date (e.g., marsh flowway, alum treatment) unlike
AquaLutions®™ that permanently removes the nutrients and exports them out of the watershed. To
address this issue, AquaFiber conducted a comprehensive review of existing and proposed cost
estimates of a number of existing and proposed nutrient remediation projects to guide development of
a business model for full commercialization of AquaLutions®™. AquaFiber discovered that:
1. Most project costs did not identify and consider all capital and O&M costs associated with the
project.
2. Most project costs were based on proposed projects and presumptive cost estimates rather
than actual project cost analyses.
3. Most project costs did not consider the additional values and ecosystem benefits provided by
AquaLutions®™ such as TN and TSS reduction, improved water clarity, reduced toxicity and
legacy load reduction.
4. There was no standardized methodology used to amortize the capital cost of construction.
5. There was no standardized methodology used to address site-specific conditions.
6. Water quality variability and post-treatment water quality targets were highly variable and
those performance expectations have a direct influence on project costs.
7. There was no standardized application of permit and performance requirements for projects.
8. There was limited or no scientific documentation of system performance, system monitoring
for environmental safety, waste stream handling, transport and disposal. This variable
application of regulatory oversight, results in regulatory and financial inequities among
projects confounding fair and accurate cost comparisons.
5.0 Conclusion
This project demonstrated that advanced DAF treatment technologies coupled with other water
treatment applications can remove TP, TN, TSS and water pollutants effectively, efficiently and
safely. As the State of Florida begins to address comprehensive water policy during the 2015
Legislative Session, this 5-year nutrient removal demonstration project provided three important
insights into potential roadblocks that must be considered by Florida water managers, policy makers
and citizens if long-term restoration goals are to be realized:

27
1. There is an important role for private-sector investment in surface water quality technology
development and deployment that can help address Florida water quality restoration needs
and drive job creation in the clean-tech industry cluster.
2. To encourage private sector investment and participation in public-private partnerships,
Florida must clarify roles and responsibilities of stakeholders within BMAPs, understand
total nutrient loads (source and legacy) impacting the system, recognize the role of dual-
nutrient reduction, and quantify load reductions with independent verification and
enforcement.
3. The State of Florida must reinforce that water quality protection and restoration is a
legislative mandate and recognize the potential to take a national leadership role in this
market. It must develop and apply models that attribute all excess nutrient loading to a
stakeholder and create fair cost-comparison methods It must also consider water quality
benefits over the lifetime of a project when considering it for funding.

28
6.0 Acknowledgements
The authors would like to thank the following: AquaFiber Technologies Corporation investors for
their substantial financial support of AquaFiber and the Lake Jesup project. AquaFiber Executive
Team - Ronald Edwards and Melanie Reed. AquaFiber Lake Jesup Facility Operations Team -
Clinton Simmons, Jody Cline, Michael Wilson, Nicholas Coggon and Franklin Acosta. Special
thanks to Dr. Sherry Brandt-Williams, Project Manager for the SJRWMD. AquaFiber extends a
broad thank you to all staff from the SJRWMD, FDEP and other Florida state agencies for their input
and support during this project. The project was supported financially by AquaFiber shareholders and
a SJRWMD Contract (# SK473AA). AquaFiber also received partial funding as a sub-contractor to
SAIC for biomass collection, processing and conversion to bio-fuel as part of a DARPA project to
develop affordable alternatives to petroleum-derived jet fuel (JP-8) from agricultural and aquacultural
feedstock materials (DARPA Algal Biofuels Program BAA08-07).

29
Glossary
AquaKnight®™ AquaFiber’s mobile, trailer mounted version of
AquaLutions®™
AquaLutions®™ AquaFiber’s patented, trade-secret process to remediate water
bodies.
Basin Management Action
Plan - BMAP
A regulatory document describing how stakeholders will
implement restoration projects to meet the TMDL.
Biomass The combined organic and inorganic material harvested as
part of the AquaLutions™ process.
Cyanobacteria A phylum of bacteria that use photosynthesis to obtain their
energy. Also known as blue-green algae.
Dissolved air flotation – DAF A water treatment process that dissolves air in the water under
pressure and then releases that pressure in a flotation tank to
create tiny air bubbles that adhere to the suspended matter and
cause it to float.
Dual-nutrient A water remediation term that combines both total
phosphorus and total nitrogen into one.
Eutrophic The ecosystem state that occurs following the addition of
artificial or natural substances, mainly phosphates, through
detergents, fertilizers, or sewage, to an aquatic system. It is
characterized by the "bloom" or great increase of
phytoplankton in a water body as a response to increased
levels of nutrients.
Hypereutrophic The ecosystem state of very nutrient-rich water bodies
characterized by frequent and severe nuisance algal blooms
and low transparency.
Legacy load The sediment underlying a water body that contributes
to internal nutrient cycling. This sediment layer is usually
attributed to loadings from anthropogenic sources prior to present-
day source control.

30
Mass balance An application of conservation of mass to the analysis of
physical systems. The total mass entering and leaving a
system is used to create budget calculations. In water
remediation, it is used to reconcile the mass removed as
shown by water chemistry sampling.
Numeric Nutrient Criteria –
NNC
Water quality standards established in state and federal rules
as the goals for the protection of aquatic
ecosystems, safe recreation and fishing, and provision of
water supplies, or the designated uses of surface waters.
Sustainability The ability to sustain or capacity to endure changes in the
environment, economy and society; often thought of as the
three pillars of sustainability.
Total Maximum Daily Loads
– TMDL
A baseline of current pollutant loadings and reductions
required to allow a water body to meet its NNC and return to
its designated use.
Whole Effluent Toxicity –
WET
Acute and chronic water toxicity test that exposes living
aquatic organisms to samples of product water to determine
survival and fecundity rates.
Whole-waterbody restoration Restoration method that focuses on restoring the ecosystem
functions of a entire lake, not just the water quality.

31
References
Boesch, D. F. (2002, August). Challenges and Opportunities for Science in Reducing Nutrient Over-
enrichment of Coastal Ecosystems. Estuaries, 25(4b), 886-900. doi:10.1007/BF02804914
Brandt-Williams, S. (2010, Summer). Innovative Nutrient Reduction Technology. Florida Lake
Management Society Newsletter, 22(3), pp. 4-5.
Camargo, J. A., & Alonso, A. (2006, August). Ecological and toxicological effects of inorganic
nitrogen pollution in aquatic ecosystems: A global assessment. Environment International,
32(6), 831-849. doi:10.1016/j.envint.2006.05.002.
CardnoEntrix. (2010). Economic Analysis of the Proposed Federal Numeric Nutrient Criteria for
Florida. Florida Water Quality Coalition.
Conley, D. J., Paerl, H. W., Howarth, R. W., Boesch, D. F., Seitzinger, S. P., Havens, K. E., Likens,
G. E. (2009, February 20). Controlling Eutrophication: Nitrogen and Phosphorus. Science,
323(5917), 1014-1015. doi:10.1126/science.1167755
Coveney, M. F., Hendrickson, J. C., Marzolf, E. R., Fulton, R. S., Di, J. J., Neubauer, C. P., Phlips, E.
J. (2011). St. Johns River Water Supply Impact Study - Chapter 8. Plankton. Palatka: St.
Johns River Water Management District.
FDEP. (2009). Florida Numeric Nutrient Criteria History and Status. Retrieved from Florida
Department of Environmental Protection: Development of Numeric Nutrient Criteria for
Florida's Waters: http://www.dep.state.fl.us/water/wqssp/nutrients/docs/fl-nnc-summary-
100109.pdf
FDEP. (2010). The Pilot Water Quality Credit Trading Program for the Lower St. Johns River: A
Report to the Governor and Legislature. Division of Environmental Assessment &
Restoration. Tallahassee, FL: Florida Department of Environmental Protection.
FDEP. (2015, February 5). Email correspondence with Connie L. Becker. TMDL Cost Percentile
Running List 02-2014-dated 2 4 15.xlsx. Tallahassee, FL: Florida Department of
Environmental Protection.
Harke, M. J., & Gobler, C. J. (2013, July 23). Global Transcriptional Responses of the Toxic
Cyanobacterium, Microcystis aeruginosa, to Nitrogen Stress, Phosphorus Stress, and Growth
on Organic Matter. (D. A. Campbell, Ed.) PloS One, 8(7), 1-15.
doi:10.1371/journal.pone.0069834

32
Havens, K. (2013, January). Deep Problems in Shallow Lakes: Why Controlling Phosphorus Inputs
May Not Restore Water Quality. Retrieved July 8, 2014, from University of Florida IFAS
Extension Electronic Data Information Source: http://edis.ifas.ufl.edu/sg128.
Havens, K., & Frazer, T. (2012, June). Rethinking the Role of Nitrogen and Phosphorus in the
Eutrophication of Aquatic Ecosystems. Retrieved July 8, 2014, from University of Florida
IFAS Extension Electronic Data Information Source: http://edis.ifas.ufl.edu/sg118.
Hudnell, H. K. (2010, June 5). Within water-body management: a needed but neglected complement
to watershed management. (S. K. Sikdar, Ed.) Clean Technologies and Environmental
Policy, 12(3), 205-207. doi:10.1007/s10098-010-0304-6.
Lapointe, B. E., Herren, L. W., Debortoli, D. D., & Vogel, M. A. (2015 in press). Evidence of
Sewage-Driven Eutrophication and Harmful Algal Blooms in Florida's Indian River Lagoon.
In Press.
Lewis, W. M., Wurtsbaugh, W. A., & Paerl, H. W. (2011, November 9). Rationale for control of
anthropogenic nitrogen and phosphorus to reduce eutrophication of inland waters.
Environmental Science & Technology, 45(24), 10300-10305. doi:10.1021/es202401p.
Moss, B., Jeppesen, E., Sondergaard, M., Lauridsen, T. L., & Liu, Z. (2013, June). Nitrogen,
macrophytes, shallow lakes and nutrient limitation: resolution of a current controversy? (K.
Martens, Ed.) Hydrobiologia, 710(1), 3-21. doi:10.1007/s10750-012-1033-0.
Paerl, H. W. (2009, July). Controlling eutrophication along the freshwater–marine continuum: dual
nutrient (N and P) reductions are essential. Estuaries and Coasts, 32(4), 593-601.
doi:10.1007/s12237-009-9158-8.
Paerl, H. W., Hall, N. S., & Calandrino, E. S. (2011, April 15). Controlling harmful cyanobacterial
blooms in a world experiencing anthropogenic and climatic-induced change. Science of the
Total Environment, 409(10), 1739-1745. doi:10.1016/j.scitotenv.2011.02.001.
Sano, D., Hodges, A., & Degner, R. (2005, November). Economic Analysis of Water Treatments for
Phosphorus Removal in Florida. Retrieved February 18, 2015, from University of Florida
IFAS Extension Electronic Data Information Source: http://edis.ifas.ufl.edu/fe576.
Sharpley, A., Jarvie, H. P., Buda, A., May, L., Spears, B., & Kleinman, P. (2014, June 20).
Phosphorus Legacy: Overcoming the Effects of Past Management Practices to Mitigate
Future Water Quality Impairments. Journal of Environmental Quality, 42(5), 1308-1326.
doi:10.2134/jeq2013.03.0098.
SJRWMD. (2002). Middle St. Johns River Basin Surface Water Improvement and Management Plan.
Palatka, FL: St. Johns River Water Management District. SJRWMD. (2008). Lake Jesup

33
Conservation Area Land Management Plan. Palatka, FL: St. Johns River Water Management
District.
US EPA Office of Water. (2010). Economic Analysis of Final Water Quality Standards for Nutrients
for Lakes and Flowing Waters in Florida. Office of Science and Technology. Washington,
DC: USEPA.
US EPA Office of Water. (2012, December). Preventing Eutrophication: Scientific Support for Dual
Nutrient Criteria. Retrieved July 8, 2014, from US EPA Nutrient Pollution Policy and Data:
http://water.epa.gov/scitech/swguidance/standards/criteria/nutrients/upload/NandPf
actsheet.pdf.