dual microcapsule system for autonomous self-healing coatings
TRANSCRIPT

University of New Hampshire University of New Hampshire
University of New Hampshire Scholars' Repository University of New Hampshire Scholars' Repository
Master's Theses and Capstones Student Scholarship
Fall 2008
Dual microcapsule system for autonomous self-healing coatings Dual microcapsule system for autonomous self-healing coatings
Jonathan K. Nguyen University of New Hampshire, Durham
Follow this and additional works at: https://scholars.unh.edu/thesis
Recommended Citation Recommended Citation Nguyen, Jonathan K., "Dual microcapsule system for autonomous self-healing coatings" (2008). Master's Theses and Capstones. 393. https://scholars.unh.edu/thesis/393
This Thesis is brought to you for free and open access by the Student Scholarship at University of New Hampshire Scholars' Repository. It has been accepted for inclusion in Master's Theses and Capstones by an authorized administrator of University of New Hampshire Scholars' Repository. For more information, please contact [email protected].
DUAL MICROCAPSULE SYSTEM FOR AUTONOMOUS
SELF-HEALING COATINGS
BY
JONATHAN K. NGUYEN
B.S. Chemical Engineering, University of New Hampshire, 2006
THESIS
Submitted to the University of New Hampshire
in Partial Fulfillment of
the Requirements for the Degree of
Master of Science
in
Materials Science
September, 2008

UMI Number: 1459509
INFORMATION TO USERS
The quality of this reproduction is dependent upon the quality of the copy
submitted. Broken or indistinct print, colored or poor quality illustrations and
photographs, print bleed-through, substandard margins, and improper
alignment can adversely affect reproduction.
In the unlikely event that the author did not send a complete manuscript
and there are missing pages, these will be noted. Also, if unauthorized
copyright material had to be removed, a note will indicate the deletion.
®
UMI UMI Microform 1459509
Copyright 2008 by ProQuest LLC.
All rights reserved. This microform edition is protected against
unauthorized copying under Title 17, United States Code.
ProQuest LLC 789 E. Eisenhower Parkway
PO Box 1346 Ann Arbor, Ml 48106-1346

This thesis has been examined and approved.
Thesis Director, Dr. Donald Sundberg Professor of Materials Science
rvonDurant Research Associate Professor of Materials Science
Dr. Weihua Ming Research Associate Professor of Materials Science
Date
11
TABLE OF CONTENTS
LIST OF TABLES vi
LIST OF FIGURES vii
ABSTRACT xiv
I. INTRODUCTION 1 Background on Self-Healing 2
Thermally Self-healing Materials 3 Autonomous Self-healing 6
Microvascular Networks 6 Hollow Fibers 8 Microcapsules 10
Background on Microencapsulation 13 Encapsulation Techniques 14
Background on Fracture Toughness 17
II.ONE PART AUTONOMOUS SELF HEALING SYSTEM 20 Feasibility of Self Healing System 21 Encapsulation of DCPD 24 Fracture Testing 29
III. A TWO MICROCAPSULE AUTONOMOUS SELF HEALING SYSTEM 35 Feasibility of Self Healing System 37
Capillary Flow 37 Diffusional Mixing 40 Epoxy Curing Kinetics 44
Encapsulation of Resin Capsules 46 Encapsulation of Epoxy Resin Using the Concentrate Route 46 Encapsulation of Epoxy Resin Using Urea Formaldehyde 48
Amine Adduct 50 Desired Properties of the Amine Adduct 50 Amine Adduct Synthesis 51
Addition of Inert Component 53 Addition of a Reactive Component 54
Analysis of Various Adducts 55 Isophorone Diamine Adduct 57
Isophorone Diamine/Epoxyoctane (IDEO) Adduct Synthesis 58 IDEO Adduct Characterization 61
Encapsulation of Amines 70
i i i
Interfacial Polymerization 70 Complex Coacervation 73 In-situ Polymerization 75
Second Cropping 85 Aqueous Radical Scavenger 86
Amine Capsule Properties 88 Microcapsule Payload 88 IDEO Adduct Density 90 Sonication and Homogenization 91 Polymer Shell Properties 92 Amine Capsule Titration 94
Encapsulation Using V-65 Initiator 96 Characterization of JN4-72 Microcapsules 104
Scanning Electron Microscopy (SEM) 105 Fourier Transform Infrared Spectroscopy (FTIR) 106 Encapsulated Adduct Reactivity 107 Microcapsule Payload 109
Reproduction of JN4-72 Microcapsules 112
IV. CONCLUSIONS AND RECOMENDATIONS 114 Conclusions 114 Recommendations 115
LIST OF REFERENCES 118
APPENDICES 121
APPENDIX A 121
Hydrodynamic Flow Calculations for a One Part Autonomous Self Healing System... 121
APPENDIX B 129
Dicyclopentadiene Microcapsule DSC and Payload Data 129
APPENDIX C 133
Hydrodynamic Flow Calculations for a Two Part Autonomous Self Healing System... 133
APPENDIX D 146
Amine Adducts 146
IV

APPENDIX E 149
NMR Data of IDEOAdduct and Starting Components 149
APPENDIX F 164
Calculation of the Extent of Reaction vs. Time from DSC Analysis 164
APPENDIX G 168
Characterization of PMMA/PBMA Copolymer from IDEO Amine Adduct 168
APPENDIX H 171
IDEO Amine Adduct Encapsulation Experiments 171
v

LIST OF TABLES
Table 3-1. Bulk polymerization experiments (JN4-53) 98
Table 3-2. Bulk polymerization experiments (JN4-54) 98
vi

LIST OF FIGURES
Figure 1-1. Diels-Alder reaction to make prepare polymeric material10 3
Figure 1-2. Fracture toughness specimens of 3M4F. Sample (A) is cracked. Sample
(B) is thermally healed11 4
Figure 1-3. Load vs. Displacement curve for virgin and healed samples of 3M4F10.. .4
Figure 1-4. Diagrams of microvascular networks. Human Skin (left), Epoxy coating
(right)12 7
Figure 1-5. Cracked and healed structure with 2.5% catalyst loading 8
Figure 1 -6. Various Systems using hollow fibers1 9
Figure 1-7. Crack propagation in a self healing composite5 10
Figure 1-8. SEM picture of DCPD capsules manufactured using Urea formaldehyde
process8 11
Figure 1 -9. Cross section of a microcapsule 13
Figure 1-10. TCBD geometry. Dimensions in mm5 17
Figure 1-11. Load vs. displacement curve of anin-situ sample5 19
Figure 2-1. Epoxy matrix with DCPD microcapsules and Grubb's catalyst with a
crack filled with healing agent 20
Figure 2-2. Plot of time required to fill various crack lengths and crack radii with a
contact angle of 30° 22
Figure 2-3. Plot of time required to fill a 10/mi crack varying crack radii and contact
angles 23
vn
Figure 2-4. ROMP of DCPD and Grubb's catalyst28 23
Figure 2-5. Predictions for degree of curing at isothermal conditions (30°C) at low,
medium and high catalyst concentrations28 24
Figure 2-6. Polymerization mechanism for urea-formaldehyde resin 25
Figure 2-7. Proposed mechanism for UF shell formation29 26
Figure 2-8. Experimental set up for encapsulation of DCPD 27
Figure 2-9. Light Microscope (left) and SEM (right) Images of DCPD
Microcapsules25 28
Figure 2-10. Molding process used to make epoxy TDCB specimens 30
Figure 2-11 Load vs. displacement data for fracture of a microcapsule filled epoxy
TDCB specimen25 31
Figure 2-12. Close-up image of pre-cracked region in TDCB specimen 12
Figure 2-13. SEM picture of a fracture surfaces from an epoxy matrix filled with DCPD
microcapsules (left) and fracture surface of neat epoxy (right) 33
Figure 2-14. Load vs. Displacement curve of a healed sample 34
Figure 3-1. Epoxy matrix filled with resin and amine capsules, showing a crack filled
with each healing agent 35
Figure 3-2. Fracture of microcapsules within amatrix 37
Figure 3-3. Time required to a fill crack with epoxy resin, varying crack lengths and
crack radii with a contact angle of 48° 38
Figure 3-4 Contact angle of EPON 815C on an epoxy matrix 39
vin

Figure 3-5. Time required to fill a crack with amine hardener, varying crack lengths
and crack radii with a contact angle of 43° 39
Figure 3-6 Contact angle for amine hardener(IDEO adduct) on an epoxy surface.. ..40
Figure 3-6. Diffusion model of resin and hardener between microcapsules. The
colored regions indicate areas that the liquid core materials occupy the
crack plane. The circles are the embedded microcapsules 41
Figure 3-7. Concentration profile of hardener in a 100/rai length 43
Figure 3-8. Degree of mixing in a crack vs. time 43
Figure 3-9. Epoxy reaction sequence35 44
Figure 3-4. Light microscope (left) and SEM (right) photos of Epon® 815C Resin
capsules using UF process (YD3-56) 49
Figure 3-5. One mole DETA plus two moles of 1, 2' Epoxyhexane 52
Figure 3-6. One mole 4, 4 Diaminodicyclohexylmethane plus two moles of 1,2
Epoxyhexane 52
Figure 3-7. One mole DETA plus two moles Benzaldehyde 54
Figure 3-8. One mole Ethylene Diamine plus two moles of Benzaldehyde 54
Figure 3-9. Structure of Isophorone Diamine 57
Figure 3-10. FTIR Spectra of Acetone Mixed with 1,2-Epoxyhexane (left) and
Isophorone Diamine (right)39 58
Figure 3-11. FTIR Spectra of Ethanol Mixed with Isophorone Diamine (left) and 1,2-
Epoxyhexane (right)39 59
Figure 3-12. Diagram of Isophoronediamine and 1,2-epoxyoctane 60
ix
Figure 3-20. Various configurations of the IDEO adduct 63
Figure 3-21. Proton NMR of 1,2-epoxyoctane. Prediction (left),
actual spectra (right) 64
Figure 3-22. Carbon NMR of 1,2-epoxyoctane. Prediction (left),
actual spectra (right) 65
Figure 3-23. Proton NMR of isophorone diamine. Prediction (left),
actual spectra (right) 66
Figure 3-24 Carbon NMR of isophorone diamine. Prediction (left),
actual spectra (right) 67
Figure 3-25 Extent of reaction vs. Time for EPON815C/IDEO
adduct curing at 25°C 69
Figure 3-26. Drop-wise interfacial polymerization process 71
Figure 3 -27. Experimental set-up of the ultra-turrax homogenizer 72
Figure 3-28. Complex Coacervation of Toluene as a Model System (JN3-59)38 75
Figure 3-29. Initiators used for in-sit polymerization encapsulation process41'42 77
Figure 3-30. First Attempt at Free-Radical Polymerization Based Encapsulation of the
IDEH adduct by a p(MMA-MA) Shell (JN3-80)39 78
Figure 3-31. Clusters of JN3 -82 Amine Adduct Capsules Encapsulated by pMMA/MA
(left), Capsules after Being Crushed and Amine Adduct Liquid Content
Released (right) 79
Figure 3-32. Close-up optical microscope image of broken JN3-82 capsule releasing
IDEH amine adduct liquid 80

Figure 3-33. Optical microscopy of JN3-84 capsules from free-radical polymerization
based encapsulation of the IDEH adduct by a p(MMA-MA) shell with
AIBN initiator 81
Figure 3-34. Clusters of JN3-84 IDEH amine adduct capsules encapsulated by
p(MMA-MA) (left), capsules after being crushed and amine adduct liquid
content released (right) 81
Figure 3-35. Adduct of Isophorone Diamine and 1,2 Epoxyhexane (top), Adduct of
Isophorone Diamine and 1,2 Epoxyoctane (bottom) 82
Figure 3-36 Optical microscopy of JN3-85 capsules from free-radical polymerization
based encapsulation of the IDEO Adduct by a p(MMA-MA) shell with
AIBN initiator 83
Figure 3-37. Clusters of JN3-85 amine adduct capsules encapsulated by pMMA/MA
(left), capsules after being crushed and IDEO amine adduct liquid content
released (right) 83
Figure 3-38. Light microscope images of JN4-11 wet (left) and dried (right, polarized
lens) 84
Figure 3-39. Conversion curve of MMA batch polymerization with AIBN. A charge of
radical scavenger was place at t=30 Min 86
Figure 3-40. Conversion curve of Styrene batch polymerization with AIBN. A charge
of radical scavenger was place at t=30 Min 87
Figure 3-41. Graph of theoretical payload and shell thickness of a 100/rni diameter
microcapsule 90
xi

Figure 3-42. Titration curves of adduct, water, and JN4-11 microcapsules with the
specified acid fed at a rate of 5ml per hour 94
Figure 3-43. Light microscope images of JN4-11 in pH 2 after seven days Light
microscope(left), Light microscope with polarized lens (right) 95
Figure 3-44. Chemical structures of V-65(left) and AIBN (right)41'42 96
Figure 3-45 Solution polymerization of MMA/BMA/IDEO adduct. 20ml vial (left)
Broken halves (right) 99
Figure 3-46. Light microscope images of washed and dried JN4-64 microcapsules.
Whole capsules (left) and crushed capsules (right) 100
Figure 3-47. Paper test of dried and washed JN4-64 microcapsules. Whole Capsules
(left) and crushed capsules (right) 100
Figure 3-48. Titration curve of JN4-64 capsules, water, and IDEO adduct in water... 101
Figure 3-49. JN4-72 capsules in dispersion (left) and dried crushed capsules (right). 102
Figure 3-50. Paper test of JN4-72 capsules. Whole capsules (left) and crushed capsules
(right) 103
Figure 3-51. Experimental set-up of encapsulation process used in JN4-72 104
Figure 3-52. Dynamic light scattering data (Microtrac S3500) of JN4-72
dispersion 104
Figure 3-53. SEM Images of JN4-72 capsules. Whole capsules (left). Crushed capsules
(right) 105
Figure 3-54. SEM Images of JN4-72 capsule (left) and a section of its shell (right)...106
xn
Figure 3-55. FTIR Spectra of IDEO Adduct, MMA/BMA copolymer, and JN4-72
microcapsules 107
Figure 3-56. Image of crushed JN2-32 Resin Capsules and JN4-72 IDEO adduct
capsules between two glass slides 108
Figure 3-57. DSC trace of JN4-63 IDEO adduct 109
Figure 3-58. DSC trace of JN4-68 MMA/BMA polymer 110
Figure 3-59. DSC trace of JN4-72 IDEO amine adduct capsules 110
xni

ABSTRACT
DUAL MICROCAPSULE SYSTEM FOR AUTONOMOUS
SELF-HEALING COATINGS
by
Jonathan K. Nguyen
University of New Hampshire, September 2008
Polymer coatings are vulnerable to external and internal damage. Formation of
microcracks can occur because of an impact event or through oscillatory stresses such as
thermal expansion and contraction. Self-healing offers a solution to respond to internal
damage and repair the polymeric structure.
This work utilizes a dual microcapsule system as the autonomous self-healing
mechanism for use in an epoxy coating. The system is comprised of an epoxy resin
microcapsule and an amine adduct capsule embedded in an epoxy matrix. Encapsulation
of the epoxy resin was achieved, however encapsulation of the amine adduct is very
challenging, and was the main focus of this work. The amine adduct has been
successfully encapsulated, resulting in a satisfactory microcapsule payload and size, but
reproducibility has proven to be difficult. Though reproducibility is an issue, the adhesive
properties of amine adduct and epoxy capsules have been successful by adhering two
pieces of epoxy together.

CHAPTER I
INTRODUCTION
Polymers along with other materials are vulnerable to external and internal
damage1"4. Internal growths of microcracks occur within the material because of an
external act such as an impact event1. External force typically damages the material on
the surface and can be seen visually and be repaired accordingly. Internal damage is often
very difficult to detect. Internal damages can be formed through oscillatory stresses such
as vibrations or thermal expansion and contraction within the material. Techniques such
as ultrasonics and radiography are used as non-destructive tests to detect internal damage,
but leave a lot of the damage undetected1. Self-healing offers a solution to internal
damage by autonomously responding and repairing damage within the polymeric
structure1.
Self-healing systems are able to detect the signs of internal failure and react to
repair the material. The term smart (stimuli responsive) material comes from the system's
ability to react on its own without any external input. The use of self-healing systems
may prolong the life of many polymeric structures.
For many self-healing polymers, the mechanism of self-healing is initiated when
damage occurs. Sources of damage can originate from fatigue or impact. Fatigue cracks
form by oscillatory stresses within the material. The event of impact can form cracks
within or on the surface of the material. Crazing leads to microcrack formation, and this
1
in turn grows into a macrocrack. A self-healing system within the material would react to
the damage at the microscale and accordingly results in healing of the crack prior to
macrocrack formation. Ideally, the self-healing mechanism would recover the material's
original mechanical properties (i.e. fracture toughness, modulus, etc.). Current systems
only recover a fraction of their original strength5. The best system to date has shown a
sample with a healing efficiency up to 90% of the original virgin material fracture
strength (6"9).
2

Background on Self-Healing
Thermal self-healing materials and autonomous self-healing materials are
investigated mechanisms for self-healing research. Thermally self-healing polymers
require a source of heat to initiate repair ' " . Autonomous self-healing systems require
no external input to initiate the healing process3. In the following sections, examples of
thermally healing and autonomous self-healing systems will be discussed.
Thermally Self-Healing Materials
Frank Wudl et al. have developed a thermally self-healing material, in which the
material mechanical properties equal properties of other commercial resins . The system
utilizes the thermally reversible Diels-Alder reaction (DA), for crosslinking linear
polymers.
Monomer 1 (multi furan, 4F) Monomer 2 (multi-maleimide, 3M) Polymer 3M4F
^ ^ (<tC / 3
Figure 1-1: Diels-Alder reaction to make prepare polymeric material10.
Two monomers, multifuran (4F) and multi-maleimide (3M) are synthesized to produce
the bulk copolymer (3M4F). The 3M4F polymeric material is tough and solid at room
temperature. At a temperature of around 120°C, 30% of covalent intermolecular linkages
are detached and upon cooling the detached linkages are reconnected11. Reconnecting
broken crosslinks, under thermo cycling allows healing of the material across the fracture
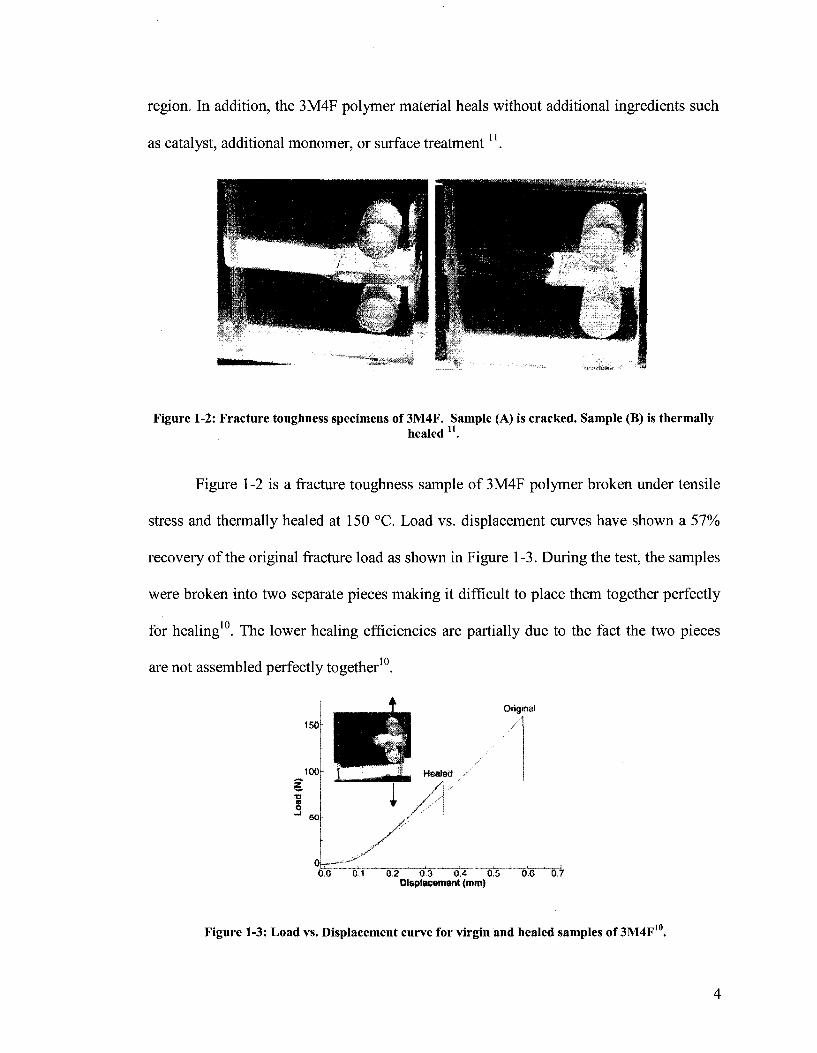
region. In addition, the 3M4F polymer material heals without additional ingredients such
as catalyst, additional monomer, or surface treatment ".
Figure 1-2: Fracture toughness specimens of 3M4F. Sample (A) is cracked. Sample (B) is thermally healed n .
Figure 1-2 is a fracture toughness sample of 3M4F polymer broken under tensile
stress and thermally healed at 150 °C. Load vs. displacement curves have shown a 57%
recovery of the original fracture load as shown in Figure 1-3. During the test, the samples
were broken into two separate pieces making it difficult to place them together perfectly
for healing10. The lower healing efficiencies are partially due to the fact the two pieces
are not assembled perfectly together10.
150
100
z TO
a
3
Healed
Original
0,0 0.1 0.2 0.3 0.4 0.5 0.6 0.7 Displacement (mm)
Figure 1-3: Load vs. Displacement curve for virgin and healed samples of 3M4F
4

The critical fracture load or force in which the sample would break, for a third
consecutive crack has been shown to be 80% of the previous critical fracture load, which
suggests that the polymeric material can be healed multiple times10.
An advantage of auto-mending material is that it does not have any long-term
problems such as a critical shelf life. The healing system uses existing material in the
sample, and can heal multiple times without the use of additional material10'11. A
disadvantage though, is that auto-mending material requires an external source of energy
to promote healing12. The external source of energy essentially makes the thermally self-
healing material not "self healing.
5
Autonomous Self-Healing
Approaches to autonomous self-healing have ranged from the use of
microvascular networks, hollow glass fibers, or incorporating microcapsules to the
material3~9'12"14. Autonomous systems do not require any external input to repair15. Many
approaches to autonomous self-healing use liquid reactants embedded in the material,
eliminating the need of additional material to repair the damage. Autonomous systems
require a means of responding to any mechanical damage and heal the corresponding
region.
Microvascular Networks
Microvascular networks are designed to mimic the architecture of human skin .
The outer epidermal layer is composed of multiple sub layers that work in conjunction to
rebuild the surface of the skin. As can be seen Figure 1 -4, the dermal layer underneath
supplies the nutrients required in repairing the above epidermal layer12. Microvascular
networks have been designed to deliver necessary components to "heal" the area of
damage12'16. This allows the healing fluid to reach all crack sites that occur throughout
the material. A network of channels is fabricated into the material and filled with a
healing agent. After damage occurs the healing agent flows from the microchannels to the
microcrack through capillary action12.
6

Figure 1-4: Diagrams of microvascular networks. Human Skin (left), Epoxy coating (right) ,2.
The microvascular system consists of an epoxy coating that is deposited on a
ductile structure that contains a three-dimensional network12. Networks are made using a
direct-write assembly made from 16-layer structures and microchannels that are inter
connected17. The direct-write assembly would produce a three-dimensional scaffold with
1 7
a fugitive ink, which is solid at room temperature and can liquefy around 60°C . Once
the scaffolding is produced the structure is impregnated with resin and hardened to form a
complete matrix. The matrix is then warmed to liquefy the fugitive ink and is removed
leaving a matrix with an intricate network within . An epoxy coating with Bis-
tricylohexylphosphine benzylidene ruthenium (IV) dichloride, also known as Grubb's
catalyst is deposited on top of the matrix and the microchannels are filled with
dicyclopentadiene (DCPD) monomer as the healing agent12. The reaction mechanism
used to polymerize the DCPD monomer is ring-opening metathesis polymerization
(ROMP)7. 19
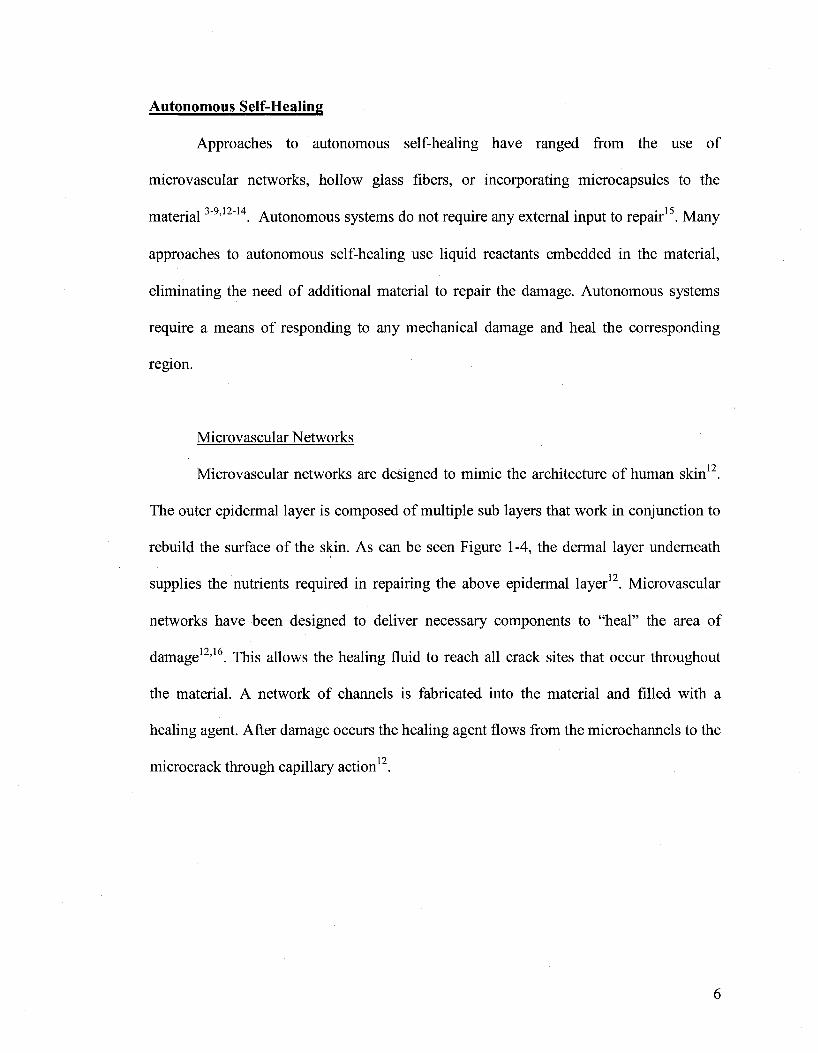
White et al. tested microvasular specimens under a four point bending test. In
Figure 1-5, the excess monomer flowing out of the cracks after a four point bend test is
evident. The sample was cracked and healed numerous times with an average healing
efficiency of 50%. Results of further testing revealed healing halted after a seventh 19
loading test, due to loss of catalyst in the cracked area .
7
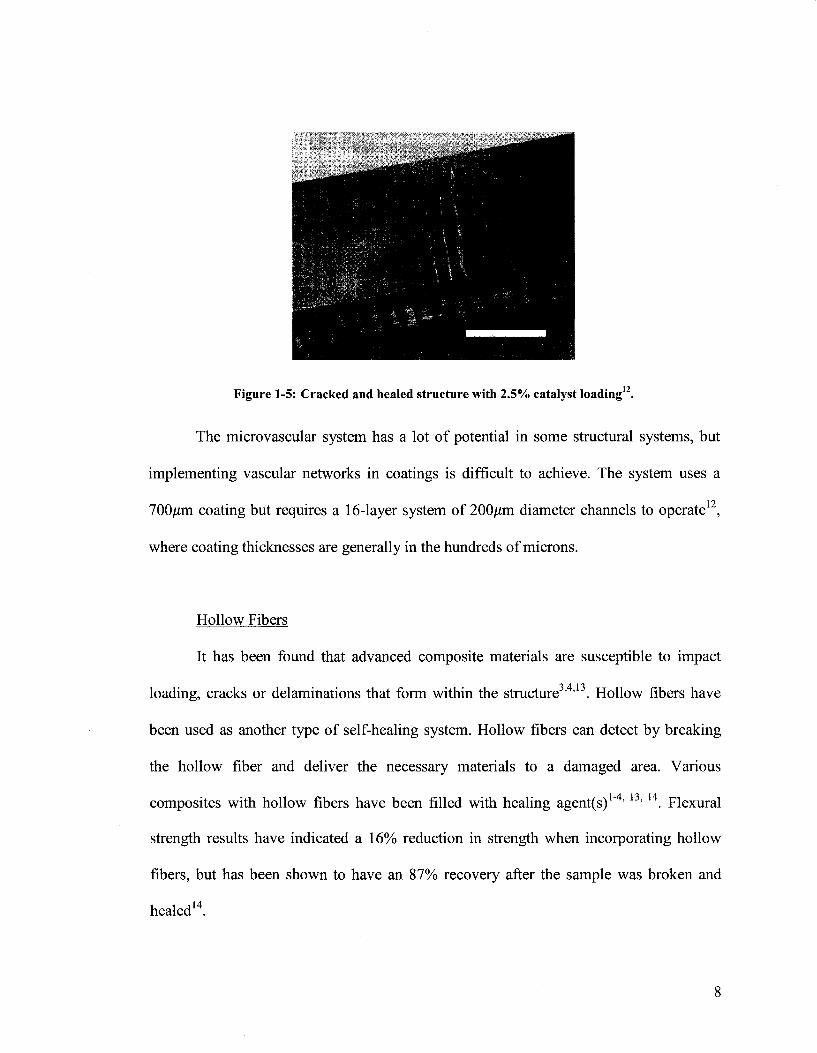
Figure 1-5: Cracked and healed structure with 2.5% catalyst loading12.
The microvascular system has a lot of potential in some structural systems, but
implementing vascular networks in coatings is difficult to achieve. The system uses a
1 9
700/mi coating but requires a 16-layer system of 200jUm diameter channels to operate ,
where coating thicknesses are generally in the hundreds of microns.
Hollow Fibers
It has been found that advanced composite materials are susceptible to impact
loading, cracks or delaminations that form within the structure ' ' . Hollow fibers have
been used as another type of self-healing system. Hollow fibers can detect by breaking
the hollow fiber and deliver the necessary materials to a damaged area. Various
composites with hollow fibers have been filled with healing agent(s)1"4' 13' 14. Flexural
strength results have indicated a 16% reduction in strength when incorporating hollow
fibers, but has been shown to have an 87% recovery after the sample was broken and
healed14.
8
Like any autonomous system, a means of responding to any mechanical damage
is required. In the case of the hollow fibers the cracking of the material will break the
hollow fibers and release the healing agent to the damaged region1.
Upon cracking, the hollow fibers are broken releasing its contents into the crack that has
broken the hollow fibers initially. In Figure 1-6, hollowed fibers can be used in various
configurations. An example system uses two types of hollow fibers utilizing a two part
healing system where one fiber is filled with a reactive resin while the other is filled with
a reactive hardener. When a crack occurs the two reactive materials flow into the crack
plane, diffuse, and react to heal the damaged area.
Figure 1-6: Various Systems using hollow fibers u.
Bond et al.2 have implemented a "bleeding" system where one part would be the
autonomous healing system and the other is to use a fluorescent dye that can reveal areas
that underwent some catastrophic mechanical load and healed overtime . Eighteen piles
of hollow fibers (stacked to a height of 2mm) were manufactured using a hand lay-up
9
process. Four point bending flexural tests of this system have shown a healing efficiency
of 97% using an epoxy matrix embedded with resin and hardener filled hollow fibers2.
The use of hollow fibers has shown excellent healing efficiencies, but requires a
substantial amount of labor to produce the composites . For the use in coatings, hollow
fibers cannot be plausible due to the amount of fibers stacked to a height of
approximately 2mm to achieve a 97% efficiency2. The large thickness, can be
problematic in a coating that is 250-500/xm.
Microcapsules
Another example of an autonomous self-healing material uses microcapsules and
catalyst embedded in an epoxy matrix. The system is an epoxy resin matrix that has
microcapsules of a monomer along with catalyst dispersed within the material5'6'8'9'18. The
system uses encapsulated DCPD and embedded Grubbs catalyst, as the self-healing
materials6.
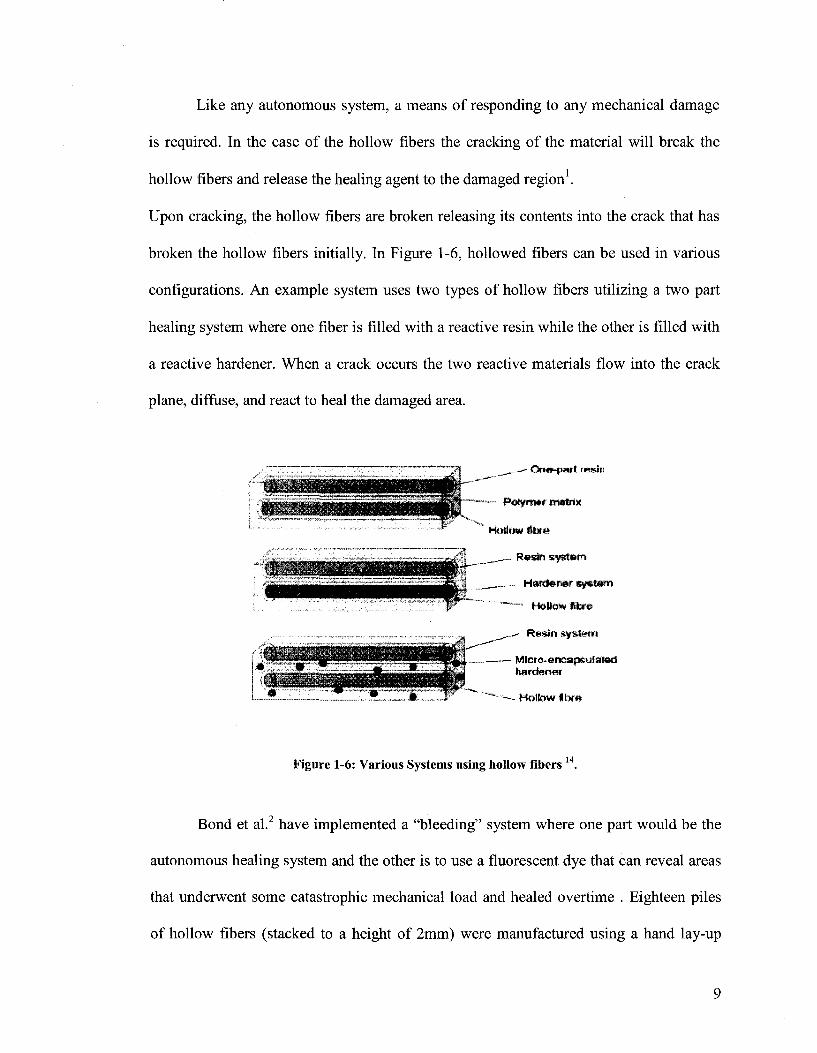
Figure 1-7: Crack propagation in a self healing composite5
10
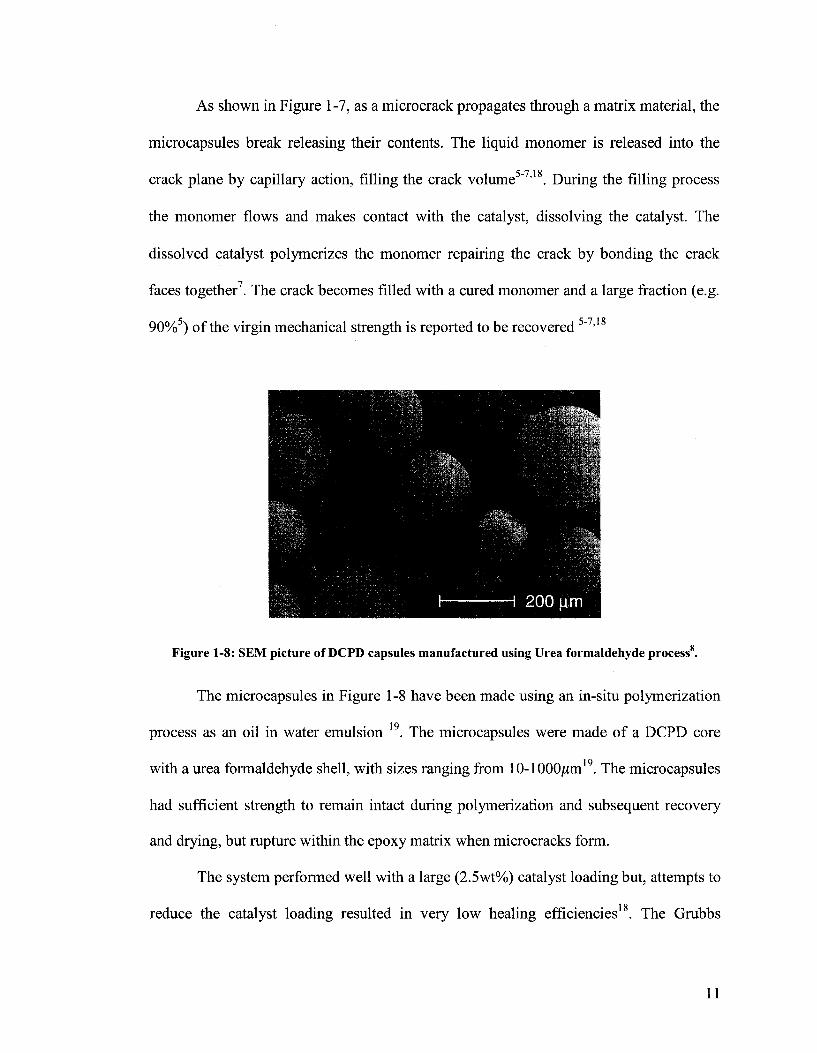
As shown in Figure 1 -7, as a microcrack propagates through a matrix material, the
microcapsules break releasing their contents. The liquid monomer is released into the
crack plane by capillary action, filling the crack volume5"7'18. During the filling process
the monomer flows and makes contact with the catalyst, dissolving the catalyst. The
dissolved catalyst polymerizes the monomer repairing the crack by bonding the crack
faces together7. The crack becomes filled with a cured monomer and a large fraction (e.g.
90%5) of the virgin mechanical strength is reported to be recovered 5"7'18
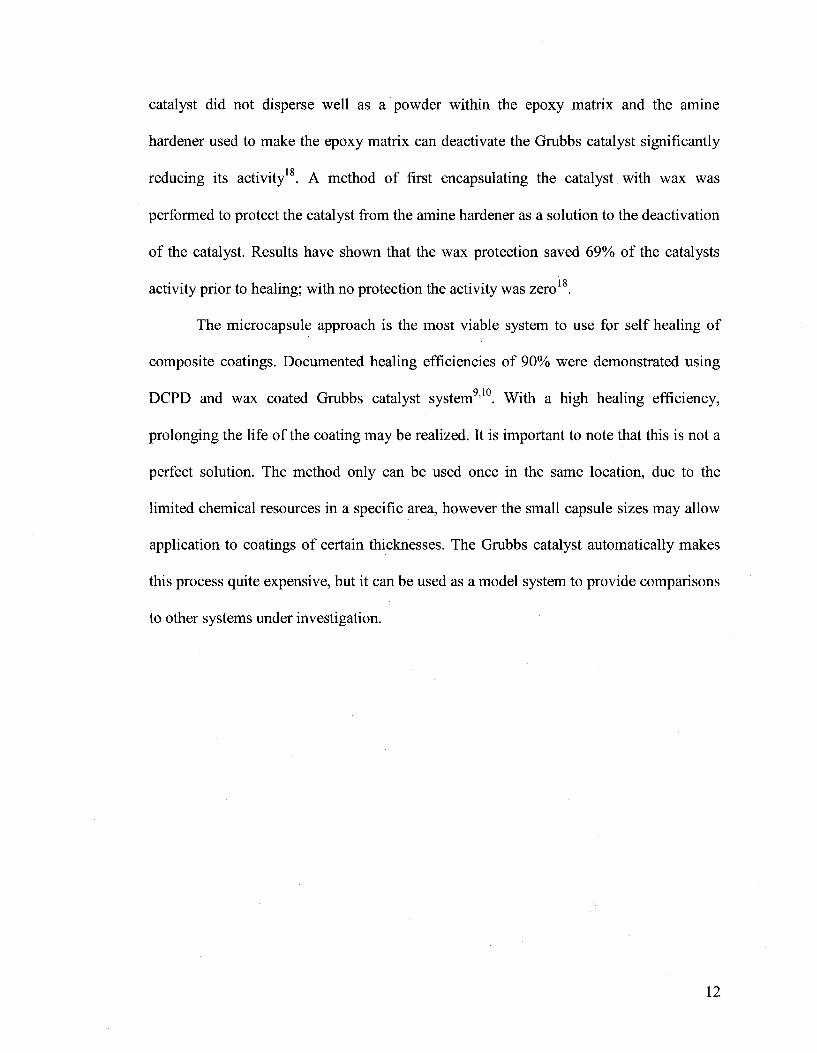
Figure 1-8: SEM picture of DCPD capsules manufactured using Urea formaldehyde process .
The microcapsules in Figure 1-8 have been made using an in-situ polymerization
process as an oil in water emulsion 19. The microcapsules were made of a DCPD core
with a urea formaldehyde shell, with sizes ranging from 10-1000/zm19. The microcapsules
had sufficient strength to remain intact during polymerization and subsequent recovery
and drying, but rupture within the epoxy matrix when microcracks form.
The system performed well with a large (2.5wt%) catalyst loading but, attempts to
i x
reduce the catalyst loading resulted in very low healing efficiencies . The Grubbs
11
catalyst did not disperse well as a powder within the epoxy matrix and the amine
hardener used to make the epoxy matrix can deactivate the Grubbs catalyst significantly
reducing its activity18. A method of first encapsulating the catalyst with wax was
performed to protect the catalyst from the amine hardener as a solution to the deactivation
of the catalyst. Results have shown that the wax protection saved 69% of the catalysts
activity prior to healing; with no protection the activity was zero18.
The microcapsule approach is the most viable system to use for self healing of
composite coatings. Documented healing efficiencies of 90% were demonstrated using
DCPD and wax coated Grubbs catalyst system9'10. With a high healing efficiency,
prolonging the life of the coating may be realized. It is important to note that this is not a
perfect solution. The method only can be used once in the same location, due to the
limited chemical resources in a specific area, however the small capsule sizes may allow
application to coatings of certain thicknesses. The Grubbs catalyst automatically makes
this process quite expensive, but it can be used as a model system to provide comparisons
to other systems under investigation.
12

Background on Microencapsulation
Microencapsulation is a process of enclosing micron sized material, either a solid
or liquid, with an inert shell20. Microencapsulation technology is used for various
purposes, to have controlled release, protection from the environment, or allow for
mixing between incompatible material . The product of a microencapsulation process is
a particle known as the microcapsule. Microcapsules are usually made up of two parts,
the core and the shell as depicted in Figure 1-9.
Figure 1-9: Cross section of a microcapsule
Core material can be encapsulated in the form of a liquid, solid or gas. Efficiency of
microencapsulation depends on the compatibility of the core and shell material. A variety
of materials such as monomers, fragrances, dyes, and catalysts have been encapsulated. A
wide variety (and combinations) of polymers can be used for a shell that can be
engineered to be permeable, semi-permeable, or impermeable20.
Separation of the reactive components via microencapsulation is an important
characteristic for use in a smart self-healing coating. The chemical reaction can then be
initiated by crushing the microcapsules, releasing their contents and exposing each
reactant to each other21. Importantly microcapsules can be obtained as a free flowing
powder and be applied to a coating formulation21.
13
Encapsulation Techniques
There are numerous techniques that can be used to encapsulate core materials.
The techniques can be categorized into two groups, chemical and physical methods.
Chemical processes such as in-situ polymerization, complex coacervation, along with
interfacial polycondensation are commonly used. Examples of physical methods include
spray drying, fluid bed coating and extrusion. The following are examples of common
encapsulation methods used or discussed throughout this thesis ' .
Encapsulation techniques can be performed in an aqueous or organic medium
depending on the polarity of the encapsulate. Complex coacervation is a technique that
utilizes phase separation from an aqueous solution. The technique uses two oppositely
charged colloids that are mixed together and then a phase separation occurs from an
electrostatic interaction. The core material is first dispersed into a cationic polymer
aqueous solution. Then an anionic polymer solution is added. Formation of the shell
results when the two polymers form a complex. The complex can be triggered by adding
salts, changing pH or diluting the whole system. Gelatin and Gum Arabic are common
ingredients used for complex coacervation. They form a complex when a drop in pH is
induced. Gelatin needs to be crosslinked with an aldehyde in order to form a rigid shell
wall20'21.
Interfacial polymerization creates polymer at the interface of a droplet or particle.
Interfacial polymerization allows one to encapsulate hydrophobic or hydrophilic
materials. Encapsulation with this method is obtained using a hydrophobic monomer
within the dispersed phase and a hydrophilic monomer within the continuous phase, or
vice versa. In the microencapsulation process, the dispersed phase and the continuous
14
phase both supply reactive material at the interface to be created. Interfacial
polymerization can encapsulate solid or liquid particles; in the case of liquid particles a
core-shell morphology is dominant. Amines can be encapsulated with nylon or
polyurethane shells using the interfacial polymerization method. Nylon shells can be
made with sebacoyl chloride in an organic solvent and then adding 10% aqueous solution
of an amine into the continuous phase. Urethane shells are like the nylon shell but by
replacing the sebacoyl chloride with a diisocyanate. The issue here is that the capsules
tend to stick together during polymerization and often are made too large to be useful in
coatings21.
In-situ polymerization, unlike interfacial polymerization, has the reactive
ingredients fed from within the dispersed droplet or within the aqueous phase. This
technique utilizes the solubility of monomers and insolubility of their polymers in either
an aqueous or organic medium. During an encapsulation reaction, the monomer(s) used
to encapsulate are polymerized and migrate to the particle interface. At the interface
further polymerization occurs and slowly overwhelms the particle and finally
encapsulates it ' .
As described earlier, urea formaldehyde shells are commonly used as an
encapsulating material for self-healing systems5"9. Urea formaldehyde (UF) shells are
primarily made via in-situ polymerization in an aqueous medium. During aqueous UF
polymerization the precipitates of UF are produced and migrate to the surface and slowly
engulf the whole droplet to make a capsule. A detailed description of the procedure will
be discussed in later sections of this thesis.
15

Mechanically controlled processes are also widely used in industry to produce
microcapsules. Co-extrusion and spray drying are among common procedures used today.
Co-extrusion uses a dual fluid stream in which the liquid core and shell materials are
pumped through concentric tubes. At the end of the extruder a vibrational force is used to
form the droplets. Spray drying is another method and is mainly used for encapsulating
fragrances and oils. The core particles are dispersed in a polymer solution and then
sprayed into a hot chamber. The hot environment will flash off the solvent leaving a solid
shell around the core. Water soluble polymers are typically used as shell material because
of potential hazards solvents can be at high temperatures and concentration21.
16
Background on Fracture Toughness
Throughout this thesis the measure of fracture toughness of a brittle material is
commonly used to describe healing efficiencies of a system. Fracture toughness, Kc (units
of Pa-m1/2), is a property that is material and geometry dependent. Kc is usually
designated as Klc when the sample size is sufficiently large. With a large sample Kic
becomes the lower limit of the fracture toughness. K\c is known as the plain strain
fracture toughness in Mode I fracture22 (see below).
A specimen can be tested under three different fracture modes. Mode I is known
as an opening mode where stresses are applied perpendicular to the crack plane. Mode II
is a forward shear or sliding mode, where the stresses are applied parallel to the crack
plane, in opposite directions. Mode III is a transverse shearing or tearing mode. Mode I
is commonly used for fracture toughness measurements of brittle materials .
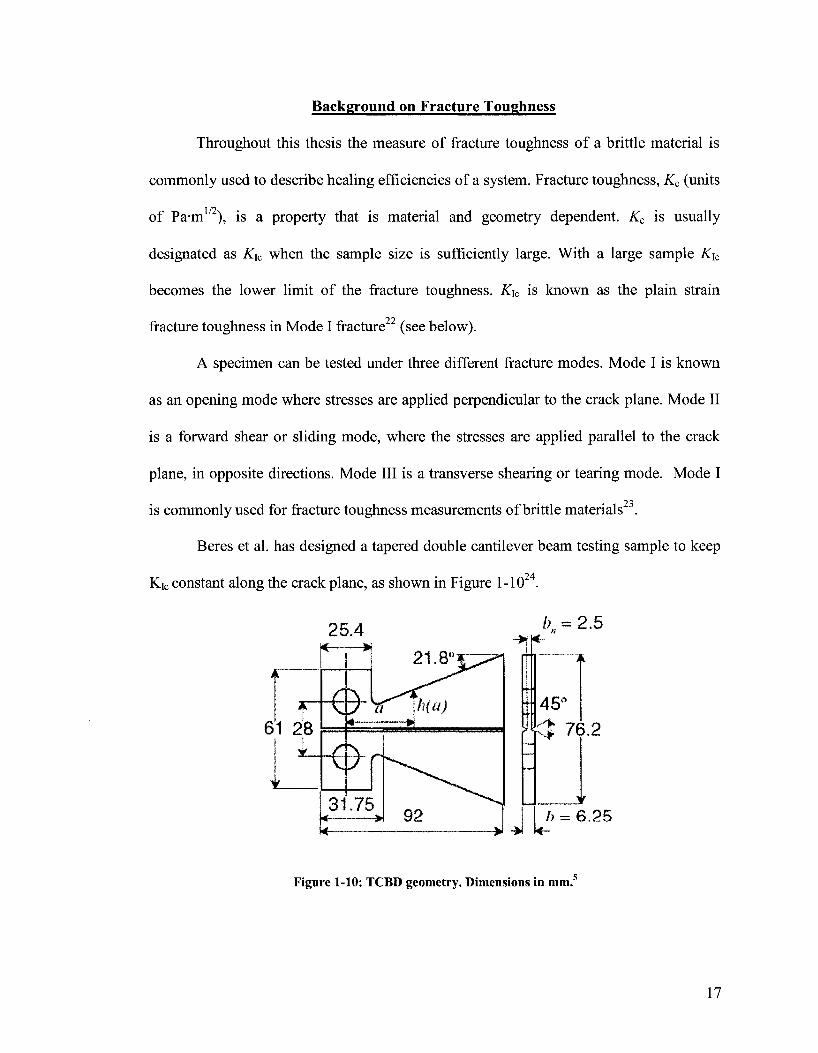
Beres et al. has designed a tapered double cantilever beam testing sample to keep
Kic constant along the crack plane, as shown in Figure 1-1024.
25.4 [J 35 sdL.O
- *K-
f 45° t j 76.2
h = 6.25
Figure 1-10: TCBD geometry. Dimensions in mm.
17
With Kic constant throughout the sample crack plane the fracture toughness is only
dependent on the material.
K*-2P.f (1.1)
The parameter Pc is the critical fracture load which can be measured directly. The
parameters m and /3 are based on geometry of the sample (see Figure 1-10 for a, b, bn, and
h)5.
J3 = b06ibn039 (1.2)
m=Maf + W) ( ' From equation (3), one can see that there is a dependence on crack length, but that has
been designed to be constant throughout the crack plane. One can find K\c by measuring
the critical fracture load of a sample. This tapered double Cantilever beam (TDCB)
geometry has been utilized to calculate healing efficiencies of this DCPD and Grubbs
catalyst system5.
Pc _ healed / j ^ \
Pc . . virgin
Critical fracture loads are measured according to ASTM 638 D for tensile properties of
plastics. ASTM 638 D requires use of a tensile testing machine, such as an Instron to
measure samples under a constant displacement rate while measuring the load on the
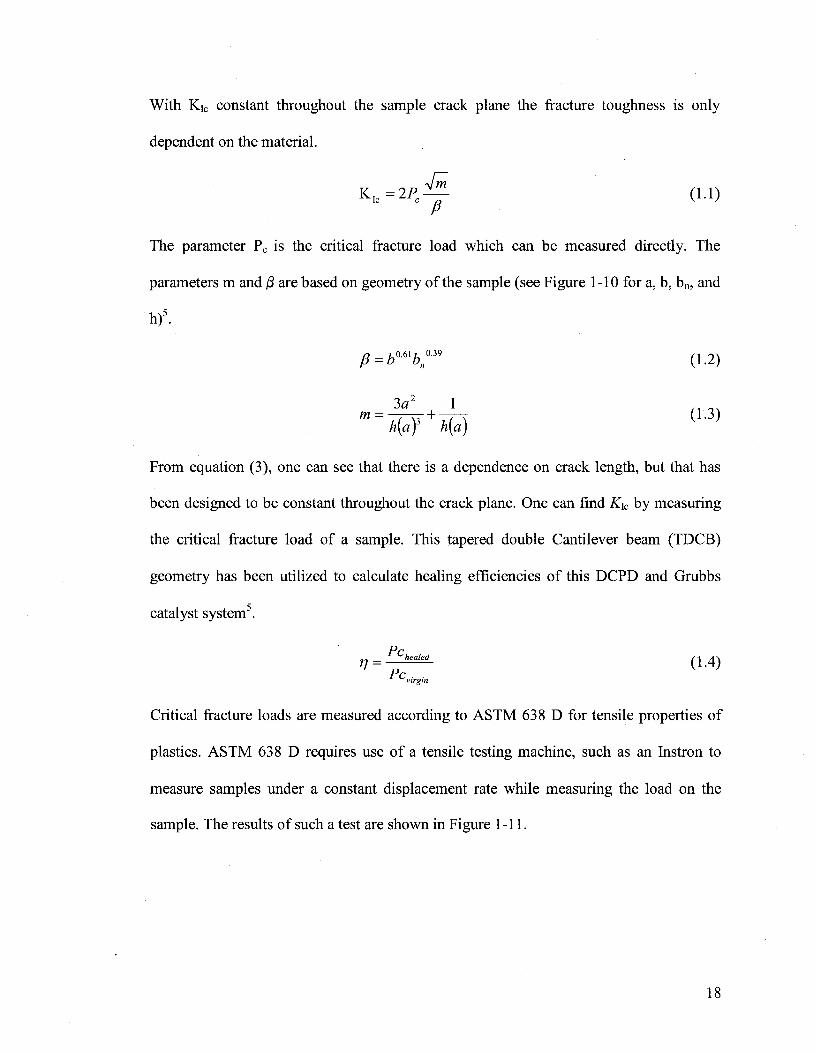
sample. The results of such a test are shown in Figure 1-11.
18
CO Q
60
50
40
30
20
10
0
, , , , , , • 1 • 1 I
• •
Ilk
M J
ft [
- / Virgin j
Healed
n = 90.3% •
-
• • , >
i •
1 i
0 250 500 750 1000 1250 1500 Displacement (|jrn)
Figure 1-11: Load vs. displacement curve of an in-situ sample .
Virgin samples are broken and are realigned and allowed to heal. It is important to note
that the samples often break to failure resulting in two separate pieces. The two pieces are
typically realigned by hand and allowed to heal. When placing such pieces together it is
difficult to join the two crack surfaces perfectly. Ideally one would like to fracture a
specimen a small amount and allow the elastic properties of the sample to realign the
crack faces. The healed sample would then be broken again using the same parameters
used to break the virgin sample. The ratio of the two fracture loads, equation (1.4), will
yield the healing efficiency value n.
19

CHAPTER TWO
ONE PART AUTONOMOUS SELF HEALING SYSTEM
White et al.5 has demonstrated the use of microcapsules and catalyst as an
approach to a self-healing system. The system consists of dicyclopentadiene (DCPD)
microcapsules and Grubb's catalyst embedded in the epoxy matrix. As a crack propagates
through a microcapsule, it releases the DCPD into the crack plane. The DCPD then
contacts the embedded Grubb's catalyst, triggering polymerization of DCPD resulting in
healing the crack shown in Figure 2-1.
Microcapsules Grubbs Catalyst DCPD Core
Figure 2-1: Epoxy matrix with DCPD microcapsules and Grubb's catalyst with a crack filled with healing agent.
This system is sufficient to model other systems but there are many potential problems
with the high cost of the catalyst including the lifetime of the system, and that the
Grubb's catalyst contains a heavy metal that may be harmful to the environment.
However, this system will be used as a model in order to develop an understanding of the
self healing mechanisms and then applied as a system for anti-corrosion.
20
Feasibility of Self-Healing System
In order for the self-healing system to work, analysis of the hydrodynamic flow
properties of the fluid and kinetics of the polymerization need to be assessed. For the
DCPD and Grubb's Catalyst system the DCPD is required to have the ability to fill the
crack completely prior to becoming fully polymerized. Intuitively premature curing can
lead to inadequate healing of the crack, potentially making the matrix susceptible to
further damage.
After microcapsules are broken, the liquid core material fills the crack via
capillary action. The filling of the microcrack is modeled by capillary flow in a horizontal
tube using the equation below25:
r V = - 7 r *
2 'AP^ (2.1)
V / J
where r is the radius of the crack, (j, is the viscosity of the liquid, AP is the pressure drop
within the tube, 1 is the crack length, and v is velocity. Laminar flow is assumed to occur
within the crack, making the pressure drop of the crack, AP, equal to the pressure in the
capillary tube, pc, by :
AP = pc=^*cos8 (2.2)
r
where y is the surface tension of the fluid core material, and 9 is the wetting angle of the
core material on the matrix polymer surface. Combining equations (1) and (2) becomes:
v = _ZL*Z.*cos6> (2.3)
The negative sign (found in equation (2.1)) has been removed because the value of AP is
negative. One can calculate the time required to fill a crack, t, with the following equation:
21

/ (2.4)
Figure 2-2, is a graph of time required to fill a crack with varying crack radii and crack
length, while keeping the contact angle, viscosity and surface tension values constant.
Time to fill crack length varing crack radii with a contact angle of 30°
0.0025
0.002
2 0.0015 <u
JZ 0.001
0.0005
0 50 100 150
Crack length (um)
200 250
Figure 2-2: Plot of time required to fill various crack lengths and crack radii with a contact angle of 30°
The surface tension and viscosity values are taken as 28.8 dynes/cm (Naphtalene, as a
substitute for DCPD as it has a similar structure)26 and 0.01 poise (the viscosity of DCPD
is similar to water),27 respectively. The value of 30° for the contact angle has been
chosen to produce Figure 2-2. The figure above illustrates the filling of the crack by
capillary action occurring in the magnitude of milliseconds. Figure 2-3 (below), shows
the sensitivity of the time required to fill a finite crack length of lOum while varying
contact angles. It is difficult to determine the contact angle of the DCPD due to the fact
that it solidifies in the pipette used to produce the droplet. This indicates that the surface
used to place the DCPD droplet on requires constant temperature control above its
22

melting point. Therefore a variety of contact angles have been used to calculate various
crack fill times. Additional figures regarding crack fill times can be found in Appendix A.
Time Required to fill a 10um Crack vs. Contact Angle Varying Crack Radius
0.000035
0.00003
•8 0.000025
o 4) -£- 0.000015 o E 0.00001 H
0.000005 0 *
-•— Radius=5um
-*— Radius=15um
Radius=25um
Radius=35um
-*— Radius=40um
-•— Radius=50um
50 60 70
Contact Angle (degrees)
Figure 2-3: Plot of time required to fill a lOum crack varying crack radii and contact angles.
Polydicyclopentadiene (PDCPD) is a highly crosslinked polymer that is produced
when DCPD monomer contacts and polmerizes with Grubb's catalyst. The reaction step
involves ring opening metathesis polymerization shown in Figure 2-4.
C\, PCy3
vPh
cr^ :RU:
pcy3
DCPD Monomer
Crosslinked Polymer Network Grubbs' Catalyst
Figure 2-4: ROMP of DCPD and Grubb's catalyst28.
28 White et al. have examined and modeled the kinetics of D C P D with various
concentrations of Grubb's catalyst. Results have shown that the rate of curing is
dependent on the catalyst concentration, as expected, and as shown in Figure 2-5.
23
10 20 30 40
Time (min)
50 60
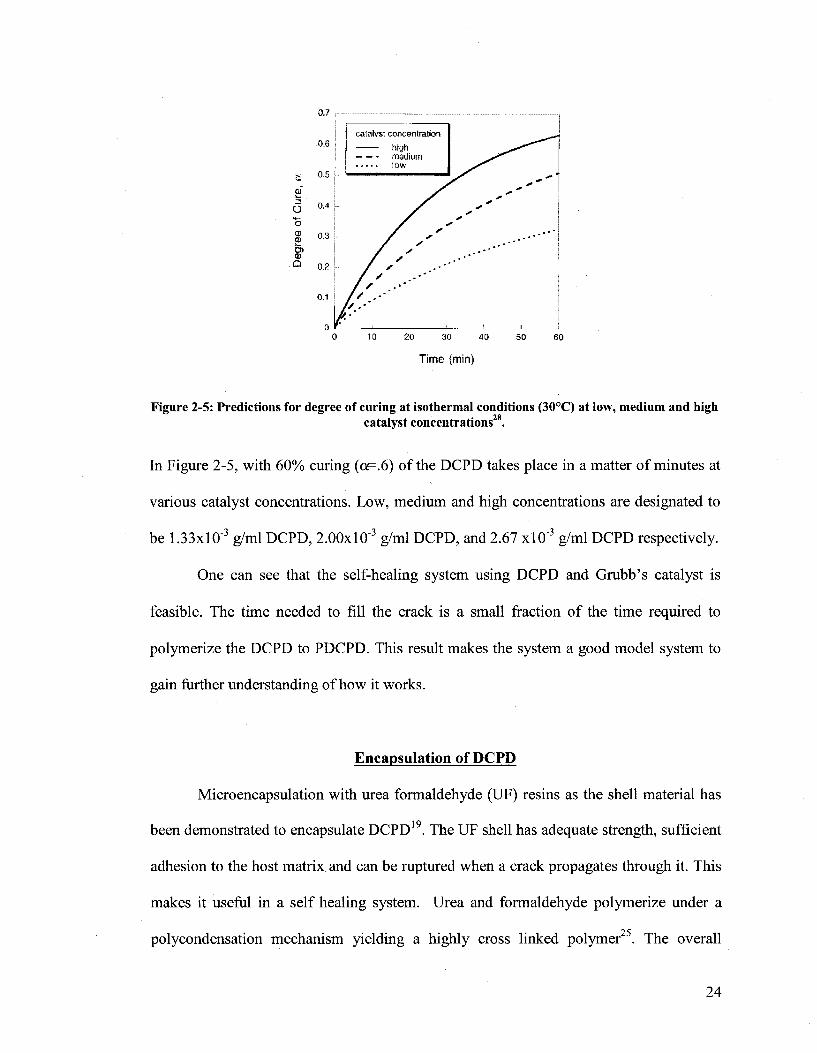
Figure 2-5: Predictions for degree of curing at isothermal conditions (30°C) at low, medium and high catalyst concentrations28.
In Figure 2-5, with 60% curing (o<=.6) of the DCPD takes place in a matter of minutes at
various catalyst concentrations. Low, medium and high concentrations are designated to
be 1.33xl0"3 g/ml DCPD, 2.00xl0"3 g/ml DCPD, and 2.67 xlO"3 g/ml DCPD respectively.
One can see that the self-healing system using DCPD and Grubb's catalyst is
feasible. The time needed to fill the crack is a small fraction of the time required to
polymerize the DCPD to PDCPD. This result makes the system a good model system to
gain further understanding of how it works.
Encapsulation of DCPD
Microencapsulation with urea formaldehyde (UF) resins as the shell material has
been demonstrated to encapsulate DCPD19. The UF shell has adequate strength, sufficient
adhesion to the host matrix and can be ruptured when a crack propagates through it. This
makes it useful in a self healing system. Urea and formaldehyde polymerize under a
polycondensation mechanism yielding a highly cross linked polymer25. The overall
24
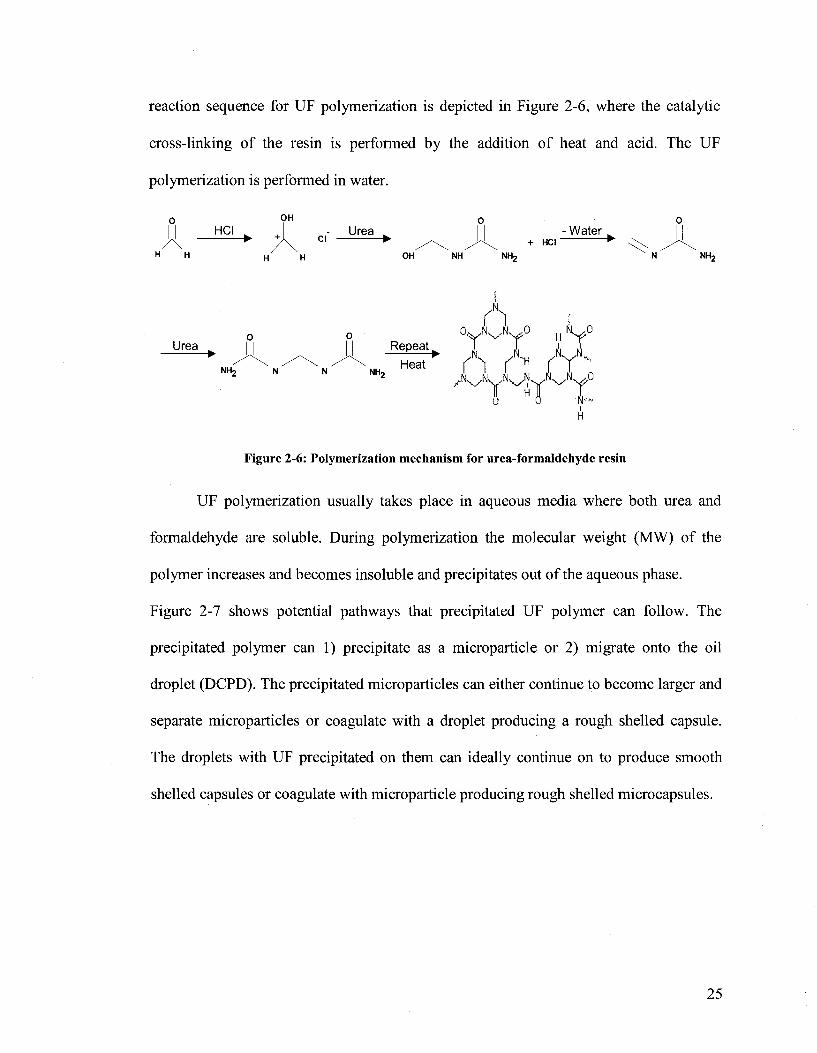
reaction sequence for UF polymerization is depicted in Figure 2-6, where the catalytic
cross-linking of the resin is performed by the addition of heat and acid. The UF
polymerization is performed in water.
o 0 H o o II HCI I - Urea ^ II - Water ^ | |
• A Cl • / \ > l + HCI • H H H H OH NH NH2 N NH;
-y25-«- A ^ A -5sfiSSl* X X A X - r " " "> Hea' X X C ? X V 0 0 N-
Figure 2-6: Polymerization mechanism for urea-formaldehyde resin
UF polymerization usually takes place in aqueous media where both urea and
formaldehyde are soluble. During polymerization the molecular weight (MW) of the
polymer increases and becomes insoluble and precipitates out of the aqueous phase.
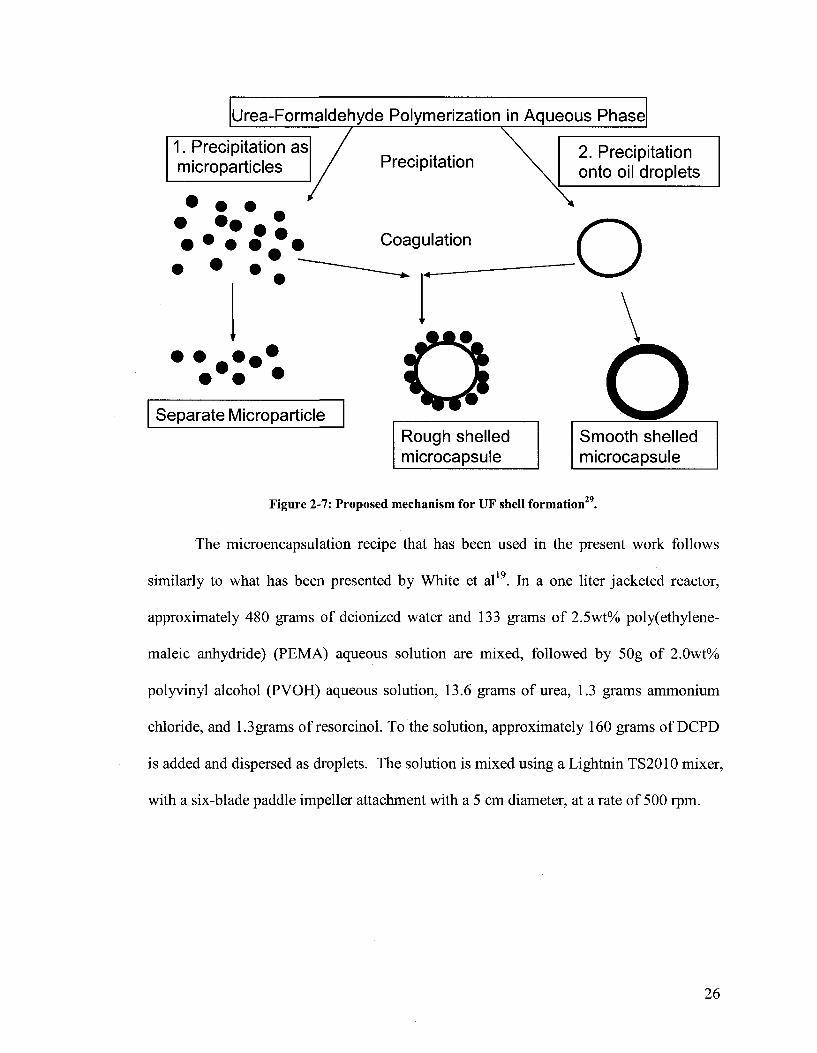
Figure 2-7 shows potential pathways that precipitated UF polymer can follow. The
precipitated polymer can 1) precipitate as a microparticle or 2) migrate onto the oil
droplet (DCPD). The precipitated microparticles can either continue to become larger and
separate microparticles or coagulate with a droplet producing a rough shelled capsule.
The droplets with UF precipitated on them can ideally continue on to produce smooth
shelled capsules or coagulate with microparticle producing rough shelled microcapsules.
25
Urea-Formaldehyde Polymerization in Aqueous Phase
1. Precipitation as microparticles Precipitation
Coagulation
2. Precipitation onto oil droplets
Separate Microparticle
O
Rough shelled microcapsule
o Smooth shelled microcapsule
29 Figure 2-7: Proposed mechanism for UF shell formation
The microencapsulation recipe that has been used in the present work follows
similarly to what has been presented by White et al . In a one liter jacketed reactor,
approximately 480 grams of deionized water and 133 grams of 2.5wt% poly(ethylene-
maleic anhydride) (PEMA) aqueous solution are mixed, followed by 50g of 2.0wt%
polyvinyl alcohol (PVOH) aqueous solution, 13.6 grams of urea, 1.3 grams ammonium
chloride, and 1.3grams of resorcinol. To the solution, approximately 160 grams of DCPD
is added and dispersed as droplets. The solution is mixed using a Lightnin TS2010 mixer,
with a six-blade paddle impeller attachment with a 5 cm diameter, at a rate of 500 rpm.
26
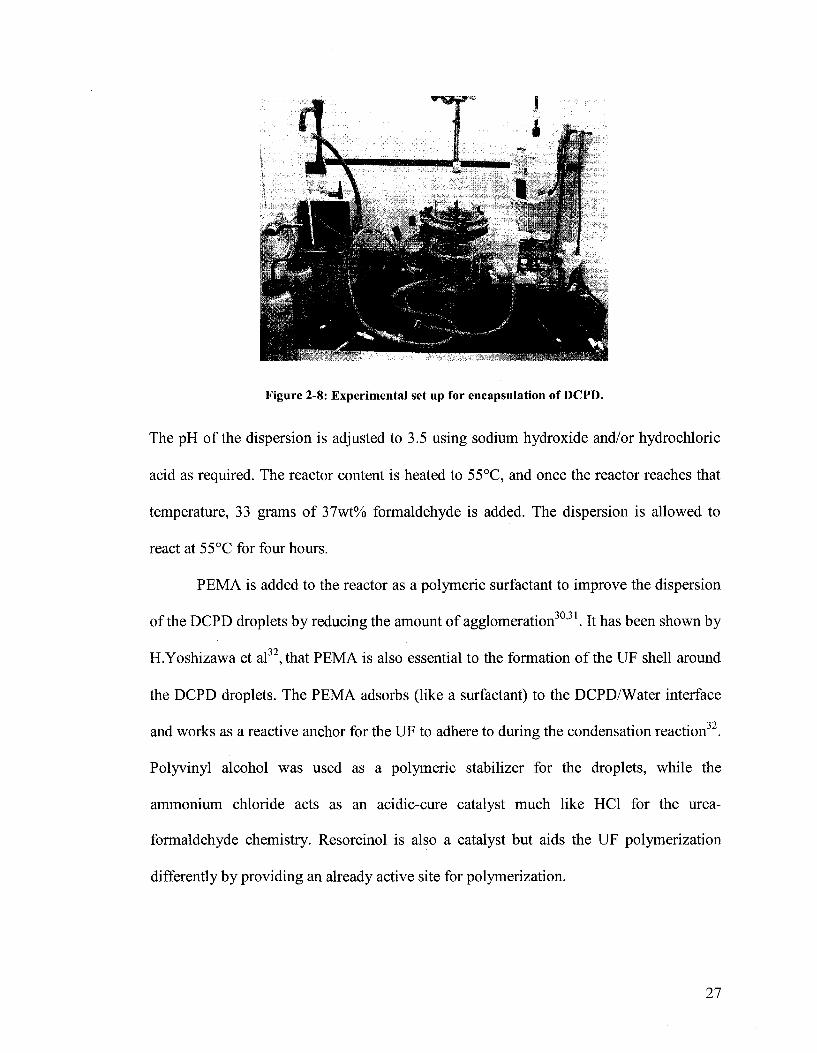
Figure 2-8: Experimental set up for encapsulation of DCPD.
The pH of the dispersion is adjusted to 3.5 using sodium hydroxide and/or hydrochloric
acid as required. The reactor content is heated to 55°C, and once the reactor reaches that
temperature, 33 grams of 37wt% formaldehyde is added. The dispersion is allowed to
react at 55°C for four hours.
PEMA is added to the reactor as a polymeric surfactant to improve the dispersion
of the DCPD droplets by reducing the amount of agglomeration ' . It has been shown by
H.Yoshizawa et al32,that PEMA is also essential to the formation of the UF shell around
the DCPD droplets. The PEMA adsorbs (like a surfactant) to the DCPD/Water interface
and works as a reactive anchor for the UF to adhere to during the condensation reaction .
Polyvinyl alcohol was used as a polymeric stabilizer for the droplets, while the
ammonium chloride acts as an acidic-cure catalyst much like HC1 for the urea-
formaldehyde chemistry. Resorcinol is also a catalyst but aids the UF polymerization
differently by providing an already active site for polymerization.
27

The dispersion is allowed to cool and is placed under vacuum filtration to separate
the capsules from the aqueous solution. During the vacuum filtration process the separate
microparticles will fall through the filter paper along with the aqueous solution. The
capsules are then washed with acetone during filtration process to remove excess
surfactant and unencapsulated material. The washed capsules are dried overnight at room
temperature, resulting in a free flowing powder. In Figure 2-9, one can see that the
particles are approximately 80-120/mi which is confirmed with the use of light scattering
measurements (Microtrac S3000 dry mode).
». *W*-! ' • - • " ' ; % • " •
I' «5*> f *£.
Figure 2-9: Light Microscope (left) and SEM (right) images of DCPD microcapsules
Differential Scanning Calorimeter (DSC) analysis has determined that there is an
80% payload of DCPD in the microcapsules. DSC data and analysis can be found in
Appendix B. Microcapsule payload is defined as the weight ratio of core material to the
overall capsule weight. It is important to note that the dried capsules have thin, hard, and
brittle shells that can withstand breaking during handling of the material but rupture when
needed. Another important characteristic is that the shells have a rough surface which
increases the surface area of the capsule, and can lead to better adhesion to the epoxy
matrix.
28
Fracture Testing
In the present work, fracture testing is used to assess self healing of the DCPD
and Grubb's catalyst system. The degree of healing can be evaluated by measuring the
fracture load of both a virgin and a healed sample. The ratio of those two loads will yield
the healing efficiency. Fracture testing similarly follows ASTM 638D which is tensile
testing of brittle material. An Instron machine is used to analyze and apply force on the
testing specimen at a constant displacement rate and to measure the load over time.
The fracture specimen has a unique design which allows for constant fracture
toughness (see chapter one) along the crack plane of the sample (see Figure 1-10).
Measuring the crack length of samples optically is a difficult task; therefore the design of
the fracture specimen is important. The tapered double cantilever beam (TDCB)
specimen allows accurate measurement of fracture toughness without the worry of where
the crack ended.
In order to mold samples for testing, a master TDCB template was fabricated out
of aluminum. This piece was used to make molds out of silicon rubber. The mold consists
of two separated pieces, which are clamped together by two steel plates and four c-
clamps. The epoxy mixture was then injected into the mold with a syringe as seen in
Figure 2-10. The epoxy mixture was made out of West System Brand Epoxy®, more
specifically the West System 105 resin and 206 slow hardener, with various weight
percentages (up to 20wt%) of DCPD microcapsules. The molds were then overfilled into
two reservoirs that occupy the holes used for injection, to avoid shrinkage during the
curing process.
29

Figure 2-10: Molding process used to make epoxy TDCB specimens.
After twenty-four hours at room temperature, the samples were demolded and
allowed to sit at room temperature for additional curing time; approximately six to seven
more days. The long cure time allows for complete curing and eliminates any
discrepancies in fracture toughness measurements.
The fracture specimens were loaded into an Instron machine and a load applied
perpendicular to the crack plane. The displacement was set at a constant rate of crack
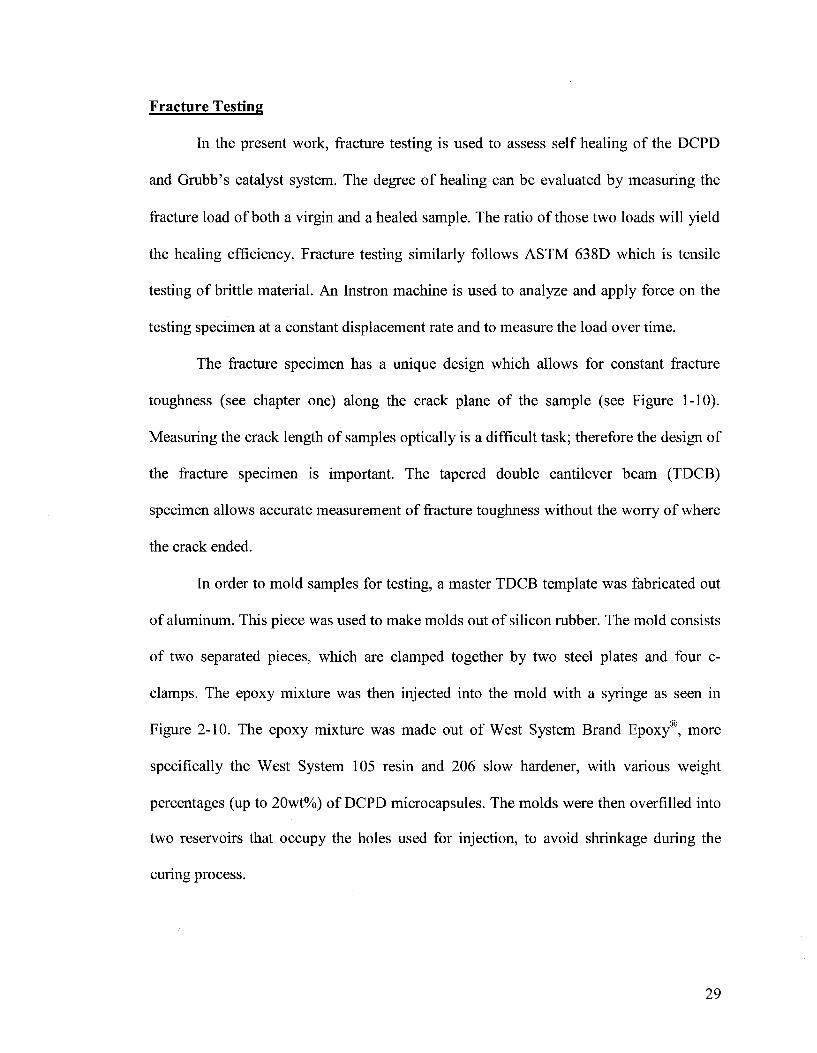
mouth opening displacement until fracture occurred (e.g. 5.0 um/sec). Figure 2-11 shows
a typical load vs. displacement data for the TDCB epoxy specimen where in this case, the
sample exhibited two crack propagations. The crack propagation steps are observed as
sudden drops in load. The second drop in load resulted in failure of the specimen (broken
into two separate pieces). Typical observed fracture toughness values (K) range from 0.5
to 0.9 MPa m1/2, where handbook values are about 0.6 MPa m1/2 22.
30
0.2 0.3 0.4 0.5
Displacement (mm)
25 Figure 2-11: Load vs. displacement data for fracture of a microcapsule filled epoxy TDCB specimen
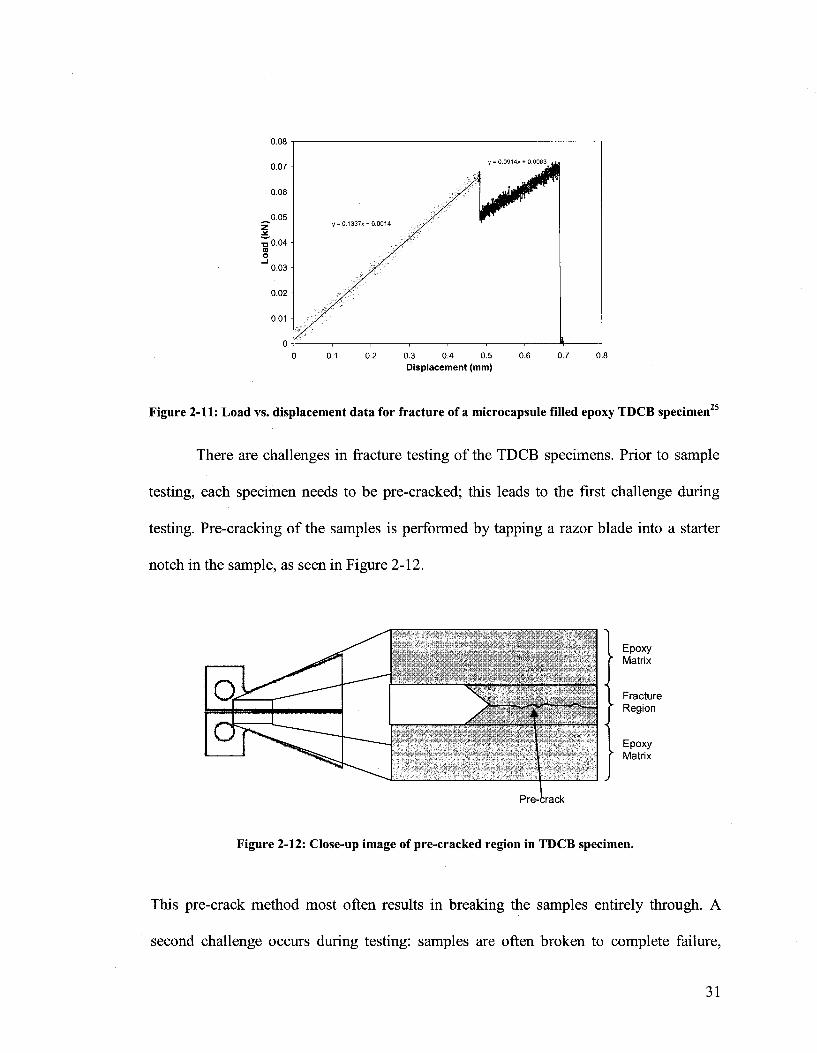
There are challenges in fracture testing of the TDCB specimens. Prior to sample
testing, each specimen needs to be pre-cracked; this leads to the first challenge during
testing. Pre-cracking of the samples is performed by tapping a razor blade into a starter
notch in the sample, as seen in Figure 2-12.
Epoxy Matrix
Fracture f" Region
Epoxy Matrix
Pre-crack
Figure 2-12: Close-up image of pre-cracked region in TDCB specimen.
This pre-crack method most often results in breaking the samples entirely through. A
second challenge occurs during testing: samples are often broken to complete failure,
31
resulting in two halves. In order to evaluate self healing the two halves need to be
brought back together and allowed to heal. The physical act of putting them back together
by hand does not allow for the crack faces to align perfectly, resulting in inadequate
healing. Ideally the sample will only partially crack before the load is released. This
allows the sample to naturally come back into perfect contact after removing the load
from the sample.
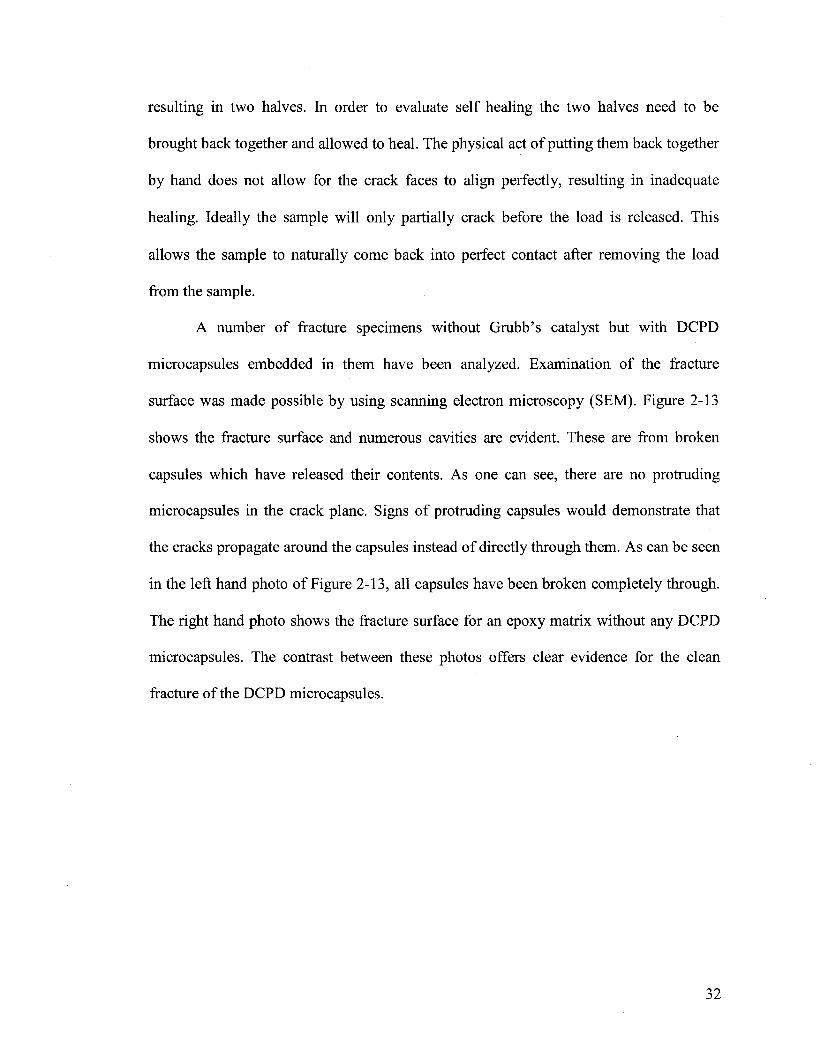
A number of fracture specimens without Grubb's catalyst but with DCPD
microcapsules embedded in them have been analyzed. Examination of the fracture
surface was made possible by using scanning electron microscopy (SEM). Figure 2-13
shows the fracture surface and numerous cavities are evident. These are from broken
capsules which have released their contents. As one can see, there are no protruding
microcapsules in the crack plane. Signs of protruding capsules would demonstrate that
the cracks propagate around the capsules instead of directly through them. As can be seen
in the left hand photo of Figure 2-13, all capsules have been broken completely through.
The right hand photo shows the fracture surface for an epoxy matrix without any DCPD
microcapsules. The contrast between these photos offers clear evidence for the clean
fracture of the DCPD microcapsules.
32

Figure 2-13: SEM picture of a fracture surfaces from an epoxy matrix filled with DCPD microcapsules25 (left) and fracture surface of neat epoxy (right)
Evaluation of self healing was performed with DCPD capsules embedded in
epoxy without any Grubb's catalyst. The Grubb's catalyst was omitted from being
embedded in the sample due possible deactivation by the amine component. After
fracture of an encapsulated DCPD/Epoxy matrix TCBD specimen, a drop of 2wt%
solution of Grubbs catalyst in toluene was dispersed along the crack plane and the two
specimen halves were put back together and held with c-clamps for a period of 24 hours.
Since the specimens typically break into two separate pieces, joining the two crack faces
together isn't perfect. In these tests the no additional DCPD was added to the crack plane;
the only DCPD present came from broken microcapsules.
As shown in Figure 2-14, the fracture behavior is different from the virgin
fracture sample shown in Figure 2-11. The healed sample shows signs of yielding prior to
failure. The yielding occurred approximately at a third of the fracture load where the
virgin samples break. Using equation (1.4) the healing efficiency, n, is found to be 34.1%
for the specific test shown in Figure 2-14.
33

20% MCs healed with Grubbs/toluene
0.025
0 0.2 0.4 0.6 0.8 1 1.2
displacement (mm)
Figure 2-14: Load vs. Displacement curve of a healed sample.
There might be some speculation that the toluene for the Grubb's toluene solution
can heal the sample by solvating the epoxy matrix chains, allowing them to inter-diffuse.
Various neat epoxy samples have been tested without any DCPD microcapsules
embedded within them. A drop of toluene was introduced to the fracture surfaces and the
pieces placed together similarly to the DCPD/Grubb's healed samples. Out of ten
samples tested, one was able to hold together after removing the clamps. This single
sample was unable to hold its own weight and resulted in a break. These results show that
the toluene did not heal or contribute to the healing process. Further investigation of this
system was halted after reproducing the DCPD/Grubb's catalyst work of Scott White.
The understanding of microencapsulation, fracture testing and self-healing was achieved.
The optimization of the DCPD/Grubbs process did not become a main focus of the
present work because we were much more interested in a two part self healing system
that did not contain a catalyst.
34
CHAPTER III
A TWO MICROCAPSULE AUTONOMOUS SELF-HEALING SYSTEM
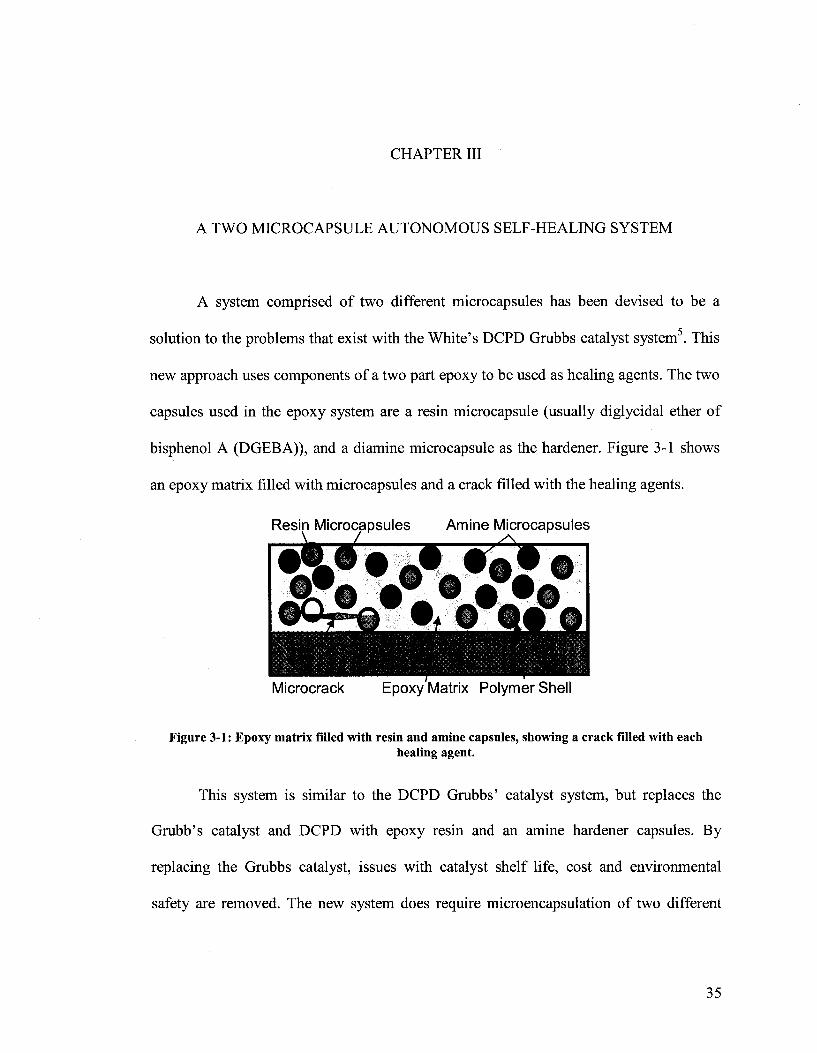
A system comprised of two different microcapsules has been devised to be a
solution to the problems that exist with the White's DCPD Grubbs catalyst system5. This
new approach uses components of a two part epoxy to be used as healing agents. The two
capsules used in the epoxy system are a resin microcapsule (usually diglycidal ether of
bisphenol A (DGEBA)), and a diamine microcapsule as the hardener. Figure 3-1 shows
an epoxy matrix filled with microcapsules and a crack filled with the healing agents.
Figure 3-1: Epoxy matrix filled with resin and amine capsules, showing a crack filled with each healing agent.
This system is similar to the DCPD Grubbs' catalyst system, but replaces the
Grubb's catalyst and DCPD with epoxy resin and an amine hardener capsules. By
replacing the Grubbs catalyst, issues with catalyst shelf life, cost and environmental
safety are removed. The new system does require microencapsulation of two different
35

components in order to preserve them from the outside matrix. The components are
ingredients similar to the ones used to make the matrix. Having the healing agents to be
the same as the matrix allows for proper adhesion to walls of the crack and similar
mechanical strength of the newly formed polymer
Self-healing occurs via a microcrack formed within the matrix that breaks
microcapsules as it propagates through the matrix. The crack will break each of the
different capsules releasing their contents into the crack plane and filling it by capillary
action. This system requires adequate mixing within the crack before it cures. The
additional mixing step is performed via molecular diffusion. The filling and mixing steps
must be faster than the curing step in order to make a feasible self-healing system.
36

Feasibility of Self Healing System
For the two capsule epoxy system to become feasible the liquid core materials
need to flow into the crack, mix with one another via diffusion and then react and cure
after adequate mixing . Analysis of the hydrodynamic flow properties, diffusion rates
and kinetics of the system can determine if the two capsule system is feasible.
Capillary Flow
Within an epoxy matrix the capsules are assumed to be evenly distributed, with
equal distances between capsules (shown in Figure 3-2). A calculated distance between
microcapsules, h, is approximately lOOum (based upon a capsules size of 100/mi and a
capsule loading of 5 wt% in the epoxy matrix).
Distance between microcapsules
Crack Diameter
Figure 3-2: Fracture of microcapsules within a matrix.
As a crack propagates through a matrix, capsules within the matrix are ruptured and the
contents are released into the crack. Filling of the crack begins when the encapsulated
material flows outwards from each capsule occupying all the vacancies within the crack.
The filling of the crack can be observed by focusing on a pair of microcapsules and the
37

distance between them, h. Since the filling process is simultaneously occurring between
each pair of capsules one can calculate the time to fill the crack using a distance of h.
The filling of the microcrack can be modeled by capillary flow in a horizontal
tube using equation (2.3). The following figures show the time required to fill a crack
with resin (Figure 3-3) and amine hardener (Figure 3-5).
Time to fill crack length varing crack radii with a contact angle of 48°
0 50 100 150 200 250
Crack length (^m)
Figure 3-3: Time required to a fill crack with epoxy resin, varying crack lengths and crack radii with a contact angle of 48°
The surface tension and viscosity values in Figure 3-3 are taken as 47 dynes/cm and 6.4
poise, respectively (EPON®815C, found experimentally using a cone and plate rheometer
(model AR 2000) at 25°C). The contact angle for EPON 815C has been found to be
approximately 48° on an epoxy surface made from West System Epoxy at room
temperature (25°C), shown in Figure 3-4.
38
Figure 3-4: Contact angle of EPON 815C on an epoxy surface.
Time to fill crack length varing crack radii with a contact angle of 43°
40 35 -i 30
2 25 "| 20 i= 15
10 5 0
-radius=5um
-radius=15um
radius=25um
radius=35um
-radius=40um
-radius=50um
50 100 150
Crack length (^m)
200 250
Figure 3-5: Time required to fill a crack with amine hardener, varying crack lengths and crack radii with a contact angle of 43°
In Figure 3-5, the surface tension value for the amine hardener is taken as 44 dynes/cm25
and the viscosity is observed to be approximately 220.4 poise (IDEO adduct found
experimentally using a cone and plate rheometer (model advanced Rheometer AR2000)
at 25°C). The contact angle for the amine hardener has been found to be approximately
43° on an epoxy surface made form West System Epoxy at room temperature (25°C),
shown in Figure 3-6.
39
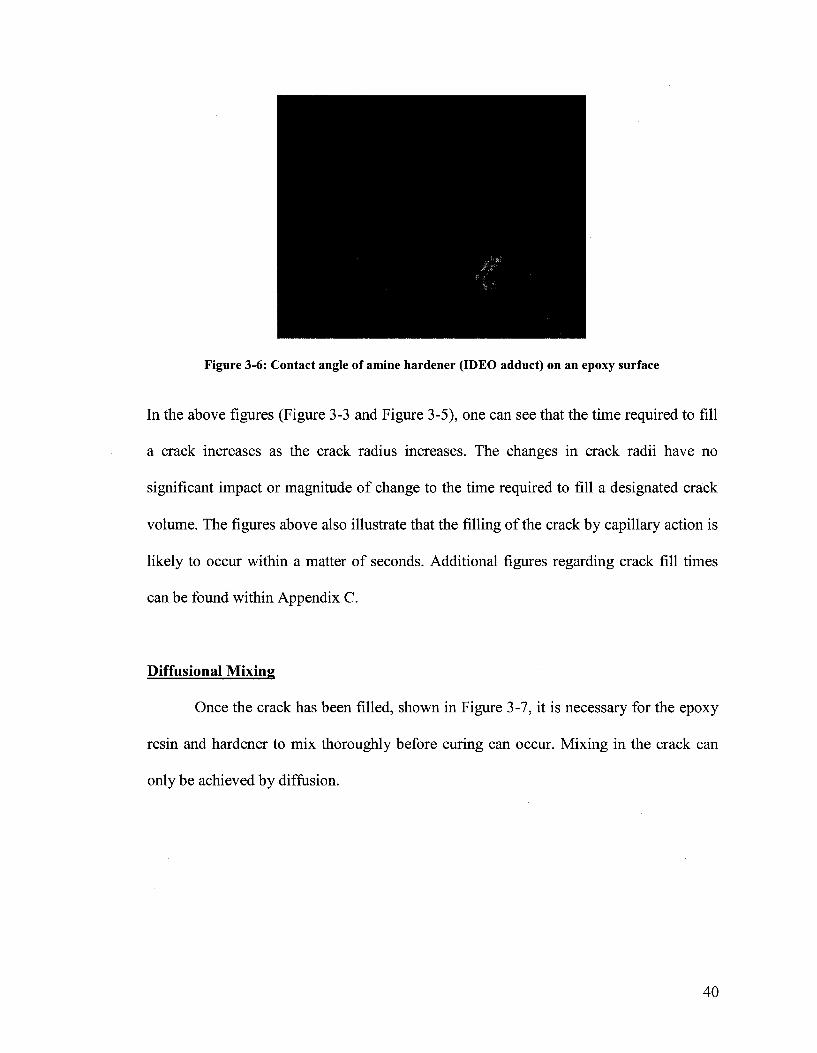
Figure 3-6: Contact angle of amine hardener (IDEO adduct) on an epoxy surface
In the above figures (Figure 3-3 and Figure 3-5), one can see that the time required to fill
a crack increases as the crack radius increases. The changes in crack radii have no
significant impact or magnitude of change to the time required to fill a designated crack
volume. The figures above also illustrate that the filling of the crack by capillary action is
likely to occur within a matter of seconds. Additional figures regarding crack fill times
can be found within Appendix C.
Diffusional Mixing
Once the crack has been filled, shown in Figure 3-7, it is necessary for the epoxy
resin and hardener to mix thoroughly before curing can occur. Mixing in the crack can
only be achieved by diffusion.
40

Length of Crack Plane
Figure 3-7: Diffusion model of resin and hardener between microcapsules. The colored regions indicate areas that the liquid core materials occupy the crack plane. The circles are the embedded
microcapsules.
Diffusion occurs in two directions and this is known as counter-diffusion. This event is
occurring throughout the crack plane simultaneously. The diffusion rate can be
calculated by observing a set of capsules also shown in Figure 3-7. Although counter
diffusion occurs, one can determine the counter-diffusion rate by using the component
having the limiting diffusion coefficient.
Diffusional mixing times are approximated using Fick's law of diffusionz
8C
,25 ,33.
dt = D
Kdx2 j (3.1)
where t is time, x is distance, C is the concentration and D is the diffusion coefficient. By
simply using the inverse relationship between viscosity and diffusion coefficient from the
Stokes-Einstein relation, one can estimate the diffusion coefficients for the amine
hardener and epoxy resin.
K-T D =
6n -T] -r (3.2)
41

Assuming that the constants other than diffusion (d) and the viscosity (n) are constant,
than one can estimate the diffusion coefficients with the following equation:
D ^ ^ - (3.3)
One can use a simple fluid like water (viscosity of 0.0089 poise and diffusion coefficient
of 10"4 (simple liquid)) along with the viscosities of the epoxy and amine components to
estimate the diffusion coefficients. The viscosities for each of the components, discussed
earlier in the chapter are 220.4 poise for the amine hardener (IDEO adduct) and 6.4 poise
for the resin. Based on the calculations the diffusion coefficients are likely to be between
10"7andl0"9 cm /sec for the resin and hardener respectively. By applying the following
boundary conditions to equation (3.1) calculations of mixing times can be achieved.
t = 0 0 < x < h C = 0 (3.4)
t >0 x = 0,x = h C = Coo (3.5)
The solution to equation (3.1) for finding concentration in a distance between
microcapsules h, at time t, and distance x, is calculated below25'33:
C 4 — = 1 exp
( D.ni \ r„.~\
h 2 •t • s i n 71 -X
\ n j (3.6)
The distance between microcapsules, h, is taken to be 100 urn. Figure 3-7 shows the
concentration profile of a lOOum length (distance between capsules) using 10" cm /sec
for the diffusion coefficient and 0.95 g/cm3 (DETA) for the concentration of the
hardener25.
42

Concentration Profile of Hardener in a 100um Crack
20 30
Crack length (um)
* - t=900 seconds
•—1= 1800 seconds
A—t=2700 seconds
t=4500 seconds
t=6300 seconds
t=7200 seconds
_^t=9000 seconds
* 4=9900 seconds
« t= 18000 seconds
Figure 3-7: Concentration profile of hardener in a lOOum length.
This model is only used to achieve an order of magnitude of time needed to fully
mix the self-healing components. The following figure shows the percentage of mixing in
the crack defined by comparing the concentration at distance h, to the initial
concentration at h=0. Assuming equal volume ratios, Figure 3-8 is produced below,
Degree of Mixing vs. Time
2000 4000 6000 8000 10000 12000 14000 16000 18000
Time (seconds)
Figure 3-8: Degree of mixing in a crack vs. time.
43

According to Figure 3-8, the diffusional mixing requires a time of about thirty 5 hours to
reach 80% mixing. Now in order to determine if the system is feasible one must estimate
the kinetics of the epoxy curing reaction.
Epoxy Curing Kinetics
The epoxy cure reaction typically involves an epoxy resin and a diamine. Both
primary and secondary amines can be used where the primary amines are more reactive
than the secondary amine. A single nitrogen-hydrogen bond is required to open the
epoxide ring and polymerize, thus making primary amine difunctional and secondary
amines monofunctional34. The curing reaction leads to a crosslinked three-dimensional
network that is shown in Figure 3-9.
OH I
OH CH2-CH-CH->./v i I
ps ^ C H 2 - C H - C H 2 - N ( 'HiCH-OV" 1 + H2N-R-NH-, *- R OH
I I N-CH2-CH-CH2^v-
•~-CH2-CH-CH,
OH
Figure 3-9: Epoxy reaction sequence34.
Epoxy curing times, at room temperature (25°C), are usually of the magnitude of days to
fully cure, but the reacting mixture becomes solid within hours. Typical commercial
amine based epoxy gel times are within 40-50 minutes (at 25°C)25. Gel times are
windows of time required for the reacting material to become a solid or semisolid .
Before the gel time, the viscosity of the epoxy mixture increases indicating that the
diffusion rates will decrease as time passes. It is important to mix the components
thoroughly before the gel time is reached in order to have a feasible self healing system.
44

The time needed to fill the crack is of the order of seconds and the time for
adequate mixing and in the order of hours. The gel time is in the order of minutes.
Though the gel time and diffusion times are far from one another, there is concern that
the diffusion of material within the crack will not reach 80% mixing within 40-50
minutes of the curing time of typical epoxies. However, the amine reaction time for the
amine adduct, used in this work with EPON 815C has proven to be significantly slower,
this will be discussed later in the thesis with a 70% extent of reaction after 12 hours.
Therefore this result makes the system a feasible alternative to White's DCPD5 and
Grubb's catalyst system.
45
Encapsulation of Resin Capsules
Encapsulation of epoxy resin has been demonstrated using two different routes.
The first approach models a 3M patent for a water-based mechanical fastener35, where the
encapsulate, EPON® 815C (from Miller-Stephenson) resin is mixed with an aqueous
solution of amine hardener. The encapsulation process involves making a pre-polymer
known as a urea-formaldehyde-melamine concentrate to make the polymer shell. The
second approach uses the same urea-formaldehyde encapsulation process demonstrated in
previous work in the encapsulation of DCPD (from Alfa Aesar), which was described in
chapter two of this thesis30.
Encapsulation of Epoxy Resin Using the Concentrate Route
The concentrate route reported in the June 30th 2005 ONR Annual Report30
provides the procedure and recipe used to encapsulate the epoxy resin. The shell material
that results from using the concentrate route consists of urea, formaldehyde (both from
Alfa Aesar), and melamine (UFM) (obtained from Alfa Aesar). The melamine
supposedly helps with branching of the polymer therefore increasing crosslinking density
within the polymer shell, resulting in a hard and brittle shell material. Prior to
encapsulation a pre-polymer concentrate needs to be made.
The concentrate is made as follows: In a 250ml reactor, add 90g of formaldehyde
(37% aqueous solution), followed by 23.6g urea, 10.37g melamine and 0.8g
triethanolamine (obtained from Alfa Aesar). Triethanolamine is added because it acts as a
buffer or control the pH of the solution used to form the UF shell. The solution is heated
to 70°C for two hours and than allowed to cool to room temperature and then is diluted
46

by adding 200ml of de-ionized water. It is important to note that this procedure can be
easily scaled up to produce the desired amount of concentrate for encapsulation.
For the encapsulation process, the set up starts with the same apparatus as with
the DCPD encapsulation shown in Figure 2-8. Addition of 615g of pre-polymer
concentrate into a one liter jacketed reactor is followed by 6.15 grams of sodium sulfate
(used as a catalyst for the formation of the UF polymer), and 141.3 g of a 2.5wt%
poly(ethylene-maleic-anhydride) (PEMA)(from Polysciences Inc.) solution. The pH of
the system is adjusted to 7 with use of hydrochloric acid and/or sodium hydroxide. 200g
of EPON® 815C is added to the reactor and is emulsified for 30 minutes at 500rpm using
a Lightnin TS2010 mixer with a six-blade (5 cm diameter) paddle impeller attachment.
The pH is then adjusted again to 2.5 by slowly adding hydrochloric acid to the reactor.
Emulsify the contents for an additional hour and then begin heating the reactor contents
to 60°C. After 30 minutes, adjust the pH to 1.9 and continue heating for an additional 3.5
hours.
The dispersion is allowed to cool to room temperature and is placed under
vacuum filtration to separate the capsules from the aqueous solution. During the vacuum
filtration process the encapsulated material is separated from the microparticles (shown in
Figure 2.7). The microparticles pass through the filter paper with the aqueous solution
while the larger microcapsules remain on the filter paper. The capsules are then washed
with acetone during the filtration process to remove excess surfactant and unencapsulated
material. The washed capsules are air dried overnight (ca. 16 hours) in a fume hood at
room temperature.
47
A number of experiments have been performed using the concentrate route but
sizes measured by light microscopy and light scattering yield capsules as large as 300/mi.
Various efforts in changing the surfactant and/or agitation did not yield any decrease in
capsule size. The microcapsules have a tendency to agglomerate and adhere to the reactor
wall, reducing the overall yield. Another route that can be used is the recipe and
procedure used for encapsulating DCPD. This procedure has proven to be very successful,
and will be used as another means to encapsulate the EPON® 815C.
Encapsulation of Epoxy Resin Using the Urea Formaldehyde
Encapsulation of the epoxy resin without the use of the concentrate has been
performed in parallel with the UFM concentrate route. The procedure and recipe that has
been used in the present work follows that of the DCPD encapsulation process. In a one
liter jacketed reactor, approximately 384 grams of deionized water and 133 grams of
2.5wt% poly(ethylene-maleic anhydride) (EMA) aqueous solution are mixed, followed
by 149g of 2.0wt% polyvinyl alcohol (PVOH)(from Sigma-Aldrich) aqueous solution,
13.6 grams of urea, 1.3 grams ammonium chloride, and 1.3grams of resorcinol. To the
solution, approximately 160 grams of EPON® 815C resin is added and dispersed as
droplets. The solution is emulsified using a Lightnin TS2010 mixer, with a 5cm diameter,
six-blade paddle impeller attachment at a rate of 500 rpm for one hour. The pH of the
dispersion is adjusted to 3.5 using sodium hydroxide and/or hydrochloric acid as required.
The reactor contents are heated to 55°C; once the reactor reaches temperature, 33 grams
of 37wt% solution formaldehyde is added. The dispersion is allowed to react at 55°C for
four hours.
48

The dispersion is allowed to cool to room temperature before it is placed under
vacuum filtration to separate the capsules from the aqueous solution. The capsules are
washed and dried in the same fashion as the microcapsules produced by the concentrate
route. The dried capsules can be seen in Figure 3-10.
Figure 3-10: Light microscope (left) and SEM (right) photos of Epon® 815C Resin capsules using UF process (YD3-56).
The capsules in Figure 3-10 have very thin shell walls that are hard enough to
withstand forces required to mix the capsules into epoxy but are brittle enough to rupture
by a propagating microcrack. Sizes for the micrcapsules are within the 100-150 um range.
The resin capsules have a high payload up to 83% determined by extraction of the core
material. The process starts by weighing the capsule, extracting the core material with a
solvent and allowing the shell material to dry. By comparing the starting and end material,
one can determine the payload. The microcapsules are recovered to a free-flowing
powder that can be easily dispersed into an epoxy coating.
49

Amine Adduct
Diamines such as diethylenetriamine (DETA), are commonly used as hardening
agents for epoxy systems. Other compounds can be used to cure epoxy resins such as
polythiols and phenolic prepolymers, but are not as efficient, requiring accelerants to in
order to cure34. Other compounds such as anhydrides can be used to cure epoxies with
low epoxide group concentrations34. Due to the great reactivity and crosslinking, amines
are generally used as the curing agent for self-healing.
Encapsulation of amines is a much more difficult task than encapsulating the
epoxy resin. Unlike the epoxy resins, amines tend to be soluble in water, but they are also
soluble in organic solvents. The amine being soluble in both aqueous and organic phases
limits the number of possible processes that can be used to encapsulate it. A majority of
encapsulation processes require the core material to be either completely hydrophobic or
completely hydrophilic, in order to make droplets in aqueous or organic media
respectively. In the current work, modifications of simple amines to amine adducts have
been made to produce hydrophobic amines that allow the production of droplets during
aqueous based emulsification.
Desired Properties of the Amine Adduct
There are numerous desired properties for the amine adduct in addition to
hydrophobicity. The viscosities of the resin and amine adduct need to reasonably match
one another in order to allow for the similar hydrodynamic flow and diffusion rates to
allow for adequate mixing within the crack plane. The reactivity of the amine adduct
needs to be slow enough to allow for flow and adequate mixing, otherwise a barrier has
50
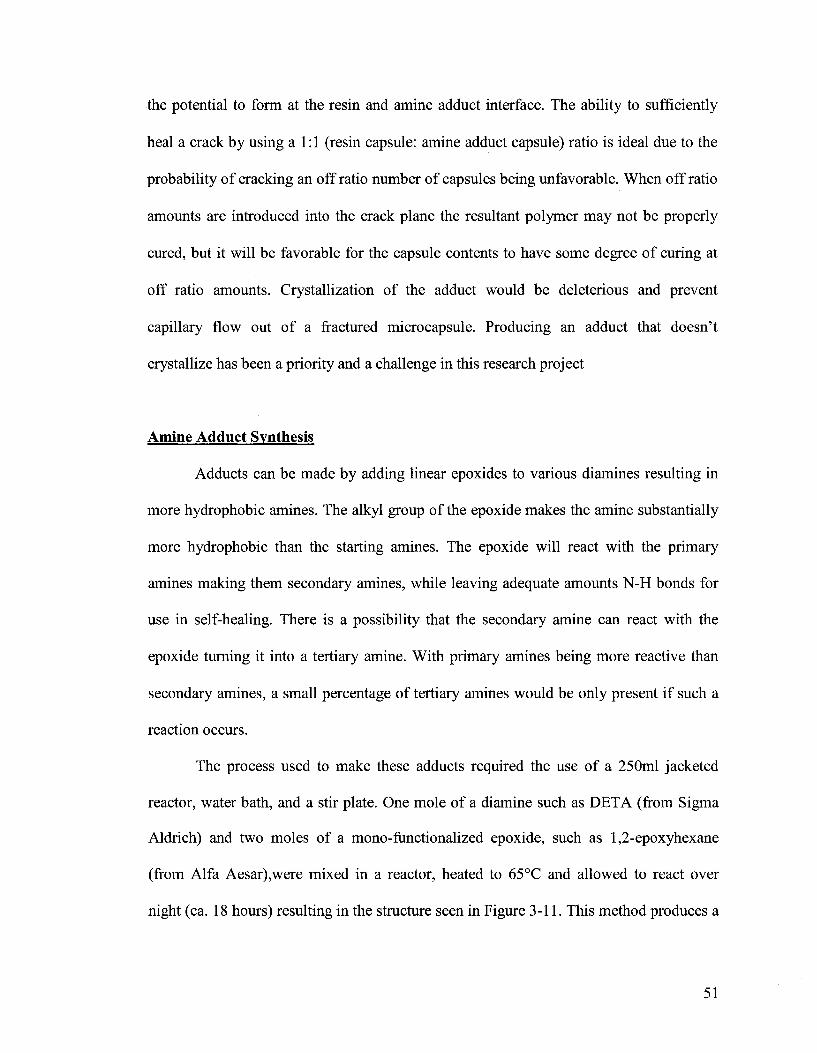
the potential to form at the resin and amine adduct interface. The ability to sufficiently
heal a crack by using a 1:1 (resin capsule: amine adduct capsule) ratio is ideal due to the
probability of cracking an off ratio number of capsules being unfavorable. When off ratio
amounts are introduced into the crack plane the resultant polymer may not be properly
cured, but it will be favorable for the capsule contents to have some degree of curing at
off ratio amounts. Crystallization of the adduct would be deleterious and prevent
capillary flow out of a fractured microcapsule. Producing an adduct that doesn't
crystallize has been a priority and a challenge in this research project
Amine Adduct Synthesis
Adducts can be made by adding linear epoxides to various diamines resulting in
more hydrophobic amines. The alkyl group of the epoxide makes the amine substantially
more hydrophobic than the starting amines. The epoxide will react with the primary
amines making them secondary amines, while leaving adequate amounts N-H bonds for
use in self-healing. There is a possibility that the secondary amine can react with the
epoxide turning it into a tertiary amine. With primary amines being more reactive than
secondary amines, a small percentage of tertiary amines would be only present if such a
reaction occurs.
The process used to make these adducts required the use of a 250ml jacketed
reactor, water bath, and a stir plate. One mole of a diamine such as DETA (from Sigma
Aldrich) and two moles of a mono-functionalized epoxide, such as 1,2-epoxyhexane
(from Alfa Aesar),were mixed in a reactor, heated to 65°C and allowed to react over
night (ca. 18 hours) resulting in the structure seen in Figure 3-11. This method produces a
51
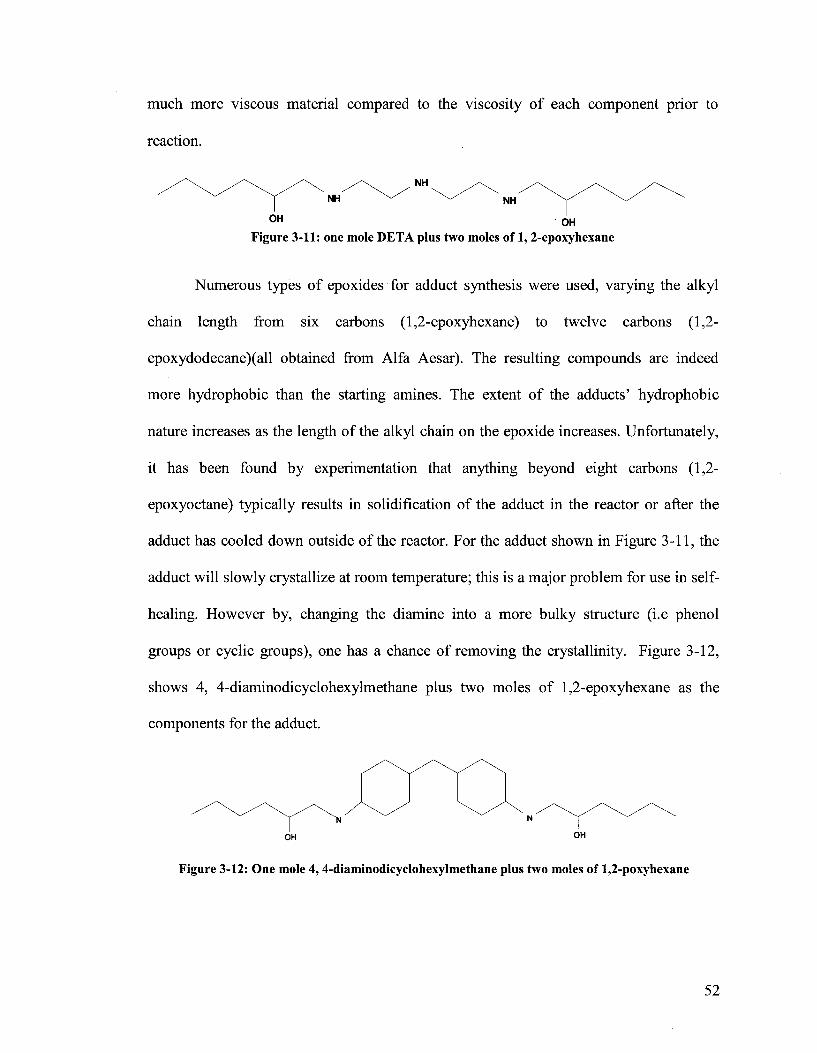
much more viscous material compared to the viscosity of each component prior to
reaction.
Figure 3-11: one mole DETA plus two moles of 1, 2-epoxyhexane
Numerous types of epoxides for adduct synthesis were used, varying the alkyl
chain length from six carbons (1,2-epoxyhexane) to twelve carbons (1,2-
epoxydodecane)(all obtained from Alfa Aesar). The resulting compounds are indeed
more hydrophobic than the starting amines. The extent of the adducts' hydrophobic
nature increases as the length of the alkyl chain on the epoxide increases. Unfortunately,
it has been found by experimentation that anything beyond eight carbons (1,2-
epoxyoctane) typically results in solidification of the adduct in the reactor or after the
adduct has cooled down outside of the reactor. For the adduct shown in Figure 3-11, the
adduct will slowly crystallize at room temperature; this is a major problem for use in self-
healing. However by, changing the diamine into a more bulky structure (i.e phenol
groups or cyclic groups), one has a chance of removing the crystallinity. Figure 3-12,
shows 4, 4-diaminodicyclohexylmethane plus two moles of 1,2-epoxyhexane as the
components for the adduct.
Figure 3-12: One mole 4,4-diaminodicyclohexylmethane plus two moles of 1,2-poxyhexane
52

Unfortunately this adduct also crystallized at room temperature. A series of other adducts
have been produced and are described in Appendix D.
Addition of Inert Component
With various adducts found in Appendix D having issues with crystallinity, one
must find a means to avoid this phenomena. One way to remove the crystallinity might be
to introduce an inert or essentially un-reactive component into the system. The inert
component concept theoretically shows a lot of potential for solving the problems of
crystallization. The inert component can act as a plasticizer and reduce the melting point
suitable for application. Mineral Oil (obtained from Brooks Pharmacy) was used initially
due to its solubility in the components, its insolubility in water, and it is easy to obtain.
Various compositions of mineral oil and amine adduct have been made to observe its
effects on crystallization. Unfortunately it was found that the mineral oil only hinders the
crystallization for a couple of days. When resin, adduct, and mineral oil are mixed
together and allowed to cure, results show that the mineral oil phase separated from the
epoxy matrix.
The idea of using dibutylphthalate (from Alfa Aesar), a common industrial
plasticizer, was considered as another option. Crystallization tests were performed with
various compositions of DETA/l,2-Epoxyoctane adduct and dibutylphthalate and were
observed over time. The crystallization was retarded up to six days before significant
signs of crystallization occurred. Dibutylpthalate and the amine adduct undergo phase
separation upon reaction, and did not completely stop crystallization. Though
unsuccessful in removing the crystallinity there are some characteristics that inert
component can improve. An advantage was to use the dibutylphthalate or mineral oil to
53
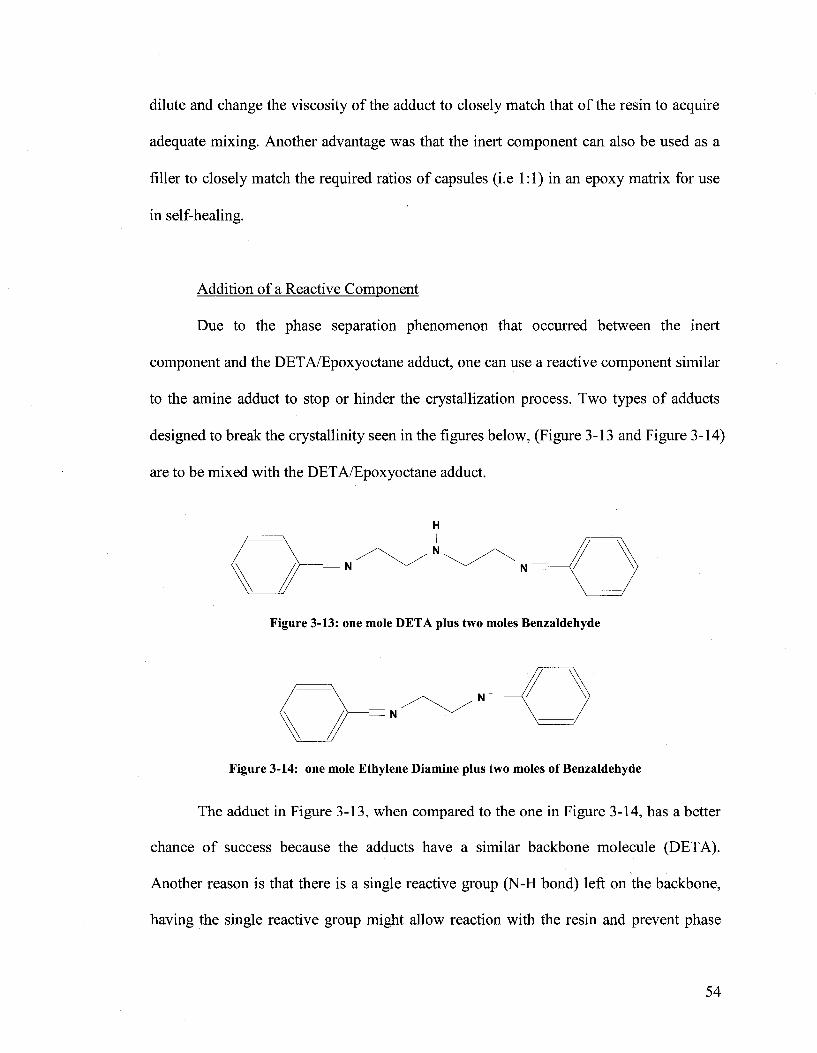
dilute and change the viscosity of the adduct to closely match that of the resin to acquire
adequate mixing. Another advantage was that the inert component can also be used as a
filler to closely match the required ratios of capsules (i.e 1:1) in an epoxy matrix for use
in self-healing.
Addition of a Reactive Component
Due to the phase separation phenomenon that occurred between the inert
component and the DETA/Epoxyoctane adduct, one can use a reactive component similar
to the amine adduct to stop or hinder the crystallization process. Two types of adducts
designed to break the crystallinity seen in the figures below, (Figure 3-13 and Figure 3-14)
are to be mixed with the DETA/Epoxyoctane adduct.
Figure 3-13: one mole DETA plus two moles Benzaldehyde
Figure 3-14: one mole Ethylene Diamine plus two moles of Benzaldehyde
The adduct in Figure 3-13, when compared to the one in Figure 3-14, has a better
chance of success because the adducts have a similar backbone molecule (DETA).
Another reason is that there is a single reactive group (N-H bond) left on the backbone,
having the single reactive group might allow reaction with the resin and prevent phase
54

separation from the epoxy matrix during curing. An adduct blend of DETA/Epoxyoctane
(Figure 3-11) adduct and DETA/Benzaldehyde (Figure 3-13) adduct did not crystallize
for weeks on its own but addition of a crystalline seed allowed it to crystallize. These
findings did not yield great results, but the finding of a new amine, Isophorone diamine
has the potential to stop crystallinity. Isophorone diamine and its adduct has become a
large focus in the research project.
Analysis of Various Adducts
A characteristic that has been heavily viewed is the octanol-water partition
coefficient. The partition coefficient (P) is a measure of the differential solubility of a
particular compound in two immiscible solvents, such as octanol and water. This can be
defined by the following equation:
\c] l 10c tan ol p /"j i \
\c\ \y Water
where [C], is the concentration of the soluble material in octanol or in water. The
partition coefficient is typically expressed in log form (i.e. log P). Partition coefficients
were used to determine how water soluble or oil soluble a specific material (i.e amine
adduct) is compared to other materials. In order to obtain partition coefficient, values
were either found in the Polymer Handbook36 or using prediction software37. Various
adducts have been characterized by their respective log P's to determine which adduct is
best to use for microencapsulating. Appendix D has all the adducts listed with their
respective log P values. Useful values of log P are 2.0 or higher.
As noted above, crystallization has been a major issue when producing various
amine adducts. Many solidify or crystallize during synthesis while others crystallize
55

slowly at room temperature. Crystallization begins by having various nucleation sites of
small crystalline domains, formed thermodynamically or kinetically. Nuclei become sites
for crystal growth leading to a fully crystalline material. The adducts that crystallize do
so because of the linear molecular structure. The degree of crystallization is dependent on
how favorable packing is for a particular structure. Linear molecules are best at
crystallization due to having no restrictions to where each segment of a molecule needs to
line up to have close packing. When adding long alkyl chains to a diamine, it often tends
to allow for the non-crystalline diamine to form a crystalline adduct over time. Addition
of large rigid constituents such as phenyl groups and cyclic groups make it difficult to
crystallize. One can stop crystallinity by having a mixture of different isomers of the
adduct, interrupting the packing of the molecules in an orderly fashion. The
crystallization times do vary and are often long, therefore a small sample of already
crystalline adduct can be added to the non-crystalline sample to act as a seed to accelerate
the crystallization process. The seed is an already thermodynamically stable nucleus to
which crystal growth can occur34.
Reactivity of the adducts also measured to see if on and off ratio mixtures allow
for adequate curing to be used in self-healing. Various molar ratios of the adduct have
been mixed with DGEBA and allowed to cure in an oven at 60°C. The cured samples
were observed to see if they were highly crosslinked (hard/glassy), crosslinked
(soft/elastic) or non-crosslinked(soft/flowing) material.
Reaction kinetics of the amine adduct and resin are observed to determine if the
curing rate can interfere with the time required to diffuse and mix properly. The time
required for adequate mixing in the crack plane for self-healing is on the order of minutes
56

(ca. ten minutes), therefore the gel time between the amine adduct and resin must be
much longer then the diffusion time. During observations of the curing of these adducts it
was noted that the actual gel times of the adducts were longer than that of the starting
amine with the same resin.
Isophorone Diamine Adduct
The isophorone diamine (from Sigma Aldrich) was found to have potential for
producing a hydrophobic adduct. Isophorone diamine, as shown below Figure 3-15 has a
bulkier structure when compared to DETA and thus was hypothesized to have less
tendency to crystallize when formed into an adduct. The amine itself has a log P value of
no
0.96 and one less amine functional group, when compared to DETA .
Figure 3-15: Structure of Isophorone Diamine
With further investigation, the isophorone diamine was able to crosslink well with
epoxy resin (DGEBA) at closer weight ratios. Weight ratios of 2:1 through 6:1 were
found to produce a glassy and hard mixture upon curing. Sufficient curing can take place
over a wide range of ratios and can potentially satisfy the objective of employing equal
T O
number of epoxy capsules as hardener capsules in the epoxy matrix . This makes
isophorone diamine a good candidate to produce an adduct from.
57

Isophorone Diamine/ Epoxyoctane (IDEO) Adduct Synthesis
As with most adducts, synthesis is performed simply as a batch reaction with the
amine and epoxides. Particularly interesting in this study were, 1,2-epoxyhexane or 1,2-
epoxyoctane. When mixing the Isophorone diamine and 1,2-epoxyhexane together, it was
discovered that they were not miscible. Therefore a common solvent was used to
synthesize the adduct. Initially acetone was used, but attempts to remove the acetone via
rotary evaporator have proved unsuccessful. Performing a simple mass balance shows a
large amount of acetone was still present in the mixture. FTIR has also shown in Figure
3-16 that the acetone has reacted with the components making a different substance we
have hoped to have.
Acetone
gaoM&jsane
/Acetone (T=0H)
ERQMiejSSije., /Acetone (T=72H)
jj Acetone
I Qiarote
PMfe/Acetonf t ' (T=QH)
QlamlnVAceton*, (T=72H)*« ••
Figure 3-16: FTIR Spectra of Acetone Mixed with 1,2-Epoxyhexane (left) and Isophorone Diamine (right)38.
In Figure 3-16, the spectra on the left do not show any interaction of the acetone
with 1,2-Epoxyhexane, however the spectra on the right clearly shows interaction
between the acetone and Isophorone diamine thus explaining the difficulty of removing
the acetone by rotary evaporation. A suggestion by naval research personnel Dr. Arthur
Webb, stated that acetone and isophorone diamine can produce a ketamine. Primary
58
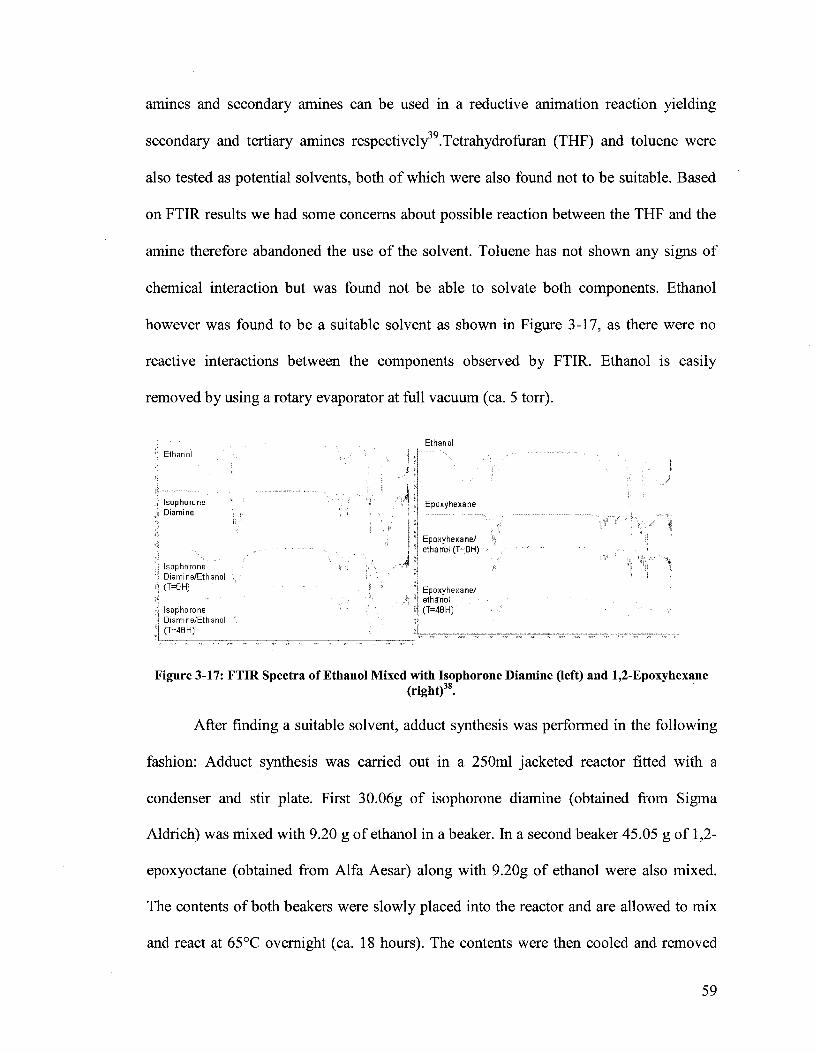
amines and secondary amines can be used in a reductive animation reaction yielding
secondary and tertiary amines respectively39.Tetrahydrofuran (THF) and toluene were
also tested as potential solvents, both of which were also found not to be suitable. Based
on FTIR results we had some concerns about possible reaction between the THF and the
amine therefore abandoned the use of the solvent. Toluene has not shown any signs of
chemical interaction but was found not be able to solvate both components. Ethanol
however was found to be a suitable solvent as shown in Figure 3-17, as there were no
reactive interactions between the components observed by FTIR. Ethanol is easily
removed by using a rotary evaporator at full vacuum (ca. 5 torr).
Ethanol Ethanol
Isophorone Diamine
isophorone Diamine/Ethanol (T=0H)
Epoxyhexane
Epoxyhexane/ etna not (T=0H)
Epoxyhexane/ ethanol
Isophorone ' • * . If (T=48H) Diamine/Ethanol ' t\ (T=48H) i i j
Figure 3-17: FTIR Spectra of Ethanol Mixed with Isophorone Diamine (left) and 1,2-Epoxyhexane
(right)38.
After finding a suitable solvent, adduct synthesis was performed in the following
fashion: Adduct synthesis was carried out in a 250ml jacketed reactor fitted with a
condenser and stir plate. First 30.06g of isophorone diamine (obtained from Sigma
Aldrich) was mixed with 9.20 g of ethanol in a beaker. In a second beaker 45.05 g of 1,2-
epoxyoctane (obtained from Alfa Aesar) along with 9.20g of ethanol were also mixed.
The contents of both beakers were slowly placed into the reactor and are allowed to mix
and react at 65°C overnight (ca. 18 hours). The contents were then cooled and removed
59

from the reactor. The chemical steps to produce the amine adduct can be seen in Figure
3-18 below.
NH,
*o in ethanol+
I Heat Overnight at 65° C I
in ethanol
in ethanol
Figure 3-18: Diagram of Isophoronediamine and 1,2-epoxyoctane.
Approximately half of the reactor contents (ca.46.7g) were added to a 250ml round
bottom flask and placed into a rotary evaporator (Model Yamato RE 400, and Yamato
BM200 Water bath) under full vacuum (ca. 5 torr) at 70°C to remove the ethanol present
and unreacted epoxides. The solvent evaporation process leaves a transparent viscous
liquid which can be used for encapsulation.
60
IDEO Adduct Characterization
A series of different characterizations for the IDEO adduct was performed in
order to understand the properties and formulate encapsulation experiments accordingly.
The resulting adduct had an increased viscosity relative to isophorone diamine and 1, 2-
epoxyoctane alone. The viscosity of the adduct surpasses that of common epoxy resins.
The experimental viscosity, measured using cone and plate rheometer at 25°C (model
Advanced Rheometer AR2000), of the adduct was 220.4 poise compared to that of
DGEBA (DER332) at 42.7 poise and EPON® 815C at 6.4 poise. The viscosity
differences between the IDEO adduct and the EPON® 815C resin is very significant.
The solubility of IDEO adduct in water was low enough to allow droplet
formation in aqueous media. Using prediction software37, the log P of a di-substituted
IDEO adduct is 3.11 which predicted that the amine adduct is approximately 1,200 times
more likely to be in an organic solvent than a water phase. The log P of a mono-
substituted IDEO adducts ranges from 2.4-2.62, depending on which primary amine the
epoxide reacted to. The software also predicted the amine adduct water solubility to be
approximately 0.6 grams per liter and the pKa values to be around 8.72 and 10.75.
When various ratios of adduct and DGEBA were mixed and allowed to cure at
60°C for 24 hours, a 1:1 mole ratio (resin: adduct) was found to produce a highly
crosslinked sample that fractured upon cooling. The 2:1 ratio produced a pliable but
crosslinked sample. The 3:1 ratio material become viscous, but was not crosslinked.
There is some concern that these samples were cured at elevated temperatures (60°C), the
self healing system will most likely only be in room temperature conditions, therefore
determining the appropriate kinetic rates and actual hardness of the material at room
61
temperature (25°C) is important. A series of room temperature studies were performed
using 3:1, 2:1, 1:1, 1:2, 1:3 molar ratios of DGEBA resin and amine adduct. The samples
were made and then left over the weekend to cure (ca. 65 hours). The results showed that
the optimum reactivity is achieved at 1:1 ratio, while still able to react at slightly off ratio
as far as 2:1 and 1:2 molar ratios. By observation, all of them reacted, but only a few (2:1,
1:1, and 1:2 ratio) have seemed to have crosslinked due to their tough and glassy
properties. The amine adduct/DGEBA curing reaction is much slower than that of
commercial resins with gel times in the matter of hours. With the slower gel times, the
time required to fill and diffuse the two self-healing components is very fast by
comparison.
Crystallinity of the adduct was a major concern considering the tendency of the
prior prepared adducts described earlier in the thesis. In order to probe this new adduct
for its propensity to crystallize, several tests were performed. A small sample was stored
at room temperature (25°C), a sample was placed into a freezer (0°F), a third was mixed
with a seed crystal from a different crystallization prone adduct and left at room
temperature (25°C), and a similar sample with a crystal seed was put in the freezer (0°F).
From the first preparation of this adduct to the ones presently made, none of the samples
showed any signs of crystallization. With the success of producing an adduct that met the
desired adduct properties described earlier, and that is not prone to crystallization, the
project moved again toward testing encapsulation of the new adduct.
Proton and carbon NMR analyses was chosen to determine the chemical structure
of the adduct after synthesis. The starting material used to produce the adduct is a mixture
of two moles of the epoxyoctane to one mole of isophorone diamine, therefore one would
62
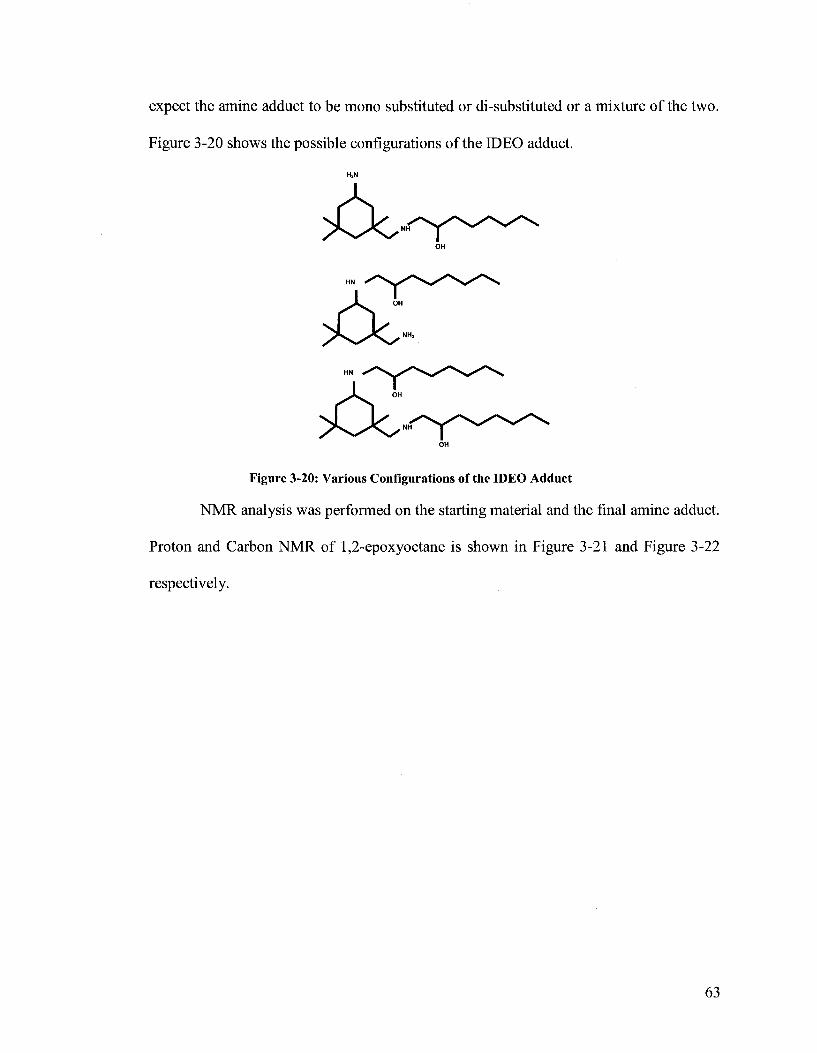
expect the amine adduct to be mono substituted or di-substituted or a mixture of the two.
Figure 3-20 shows the possible configurations of the IDEO adduct.
Figure 3-20: Various Configurations of the IDEO Adduct
NMR analysis was performed on the starting material and the final amine adduct.
Proton and Carbon NMR of 1,2-epoxyoctane is shown in Figure 3-21 and Figure 3-22
respectively.
63

Figure 3-21: Proton NMR of 1,2-epoxyoctane. Prediction (Top), actual spectra (Bottom)
64
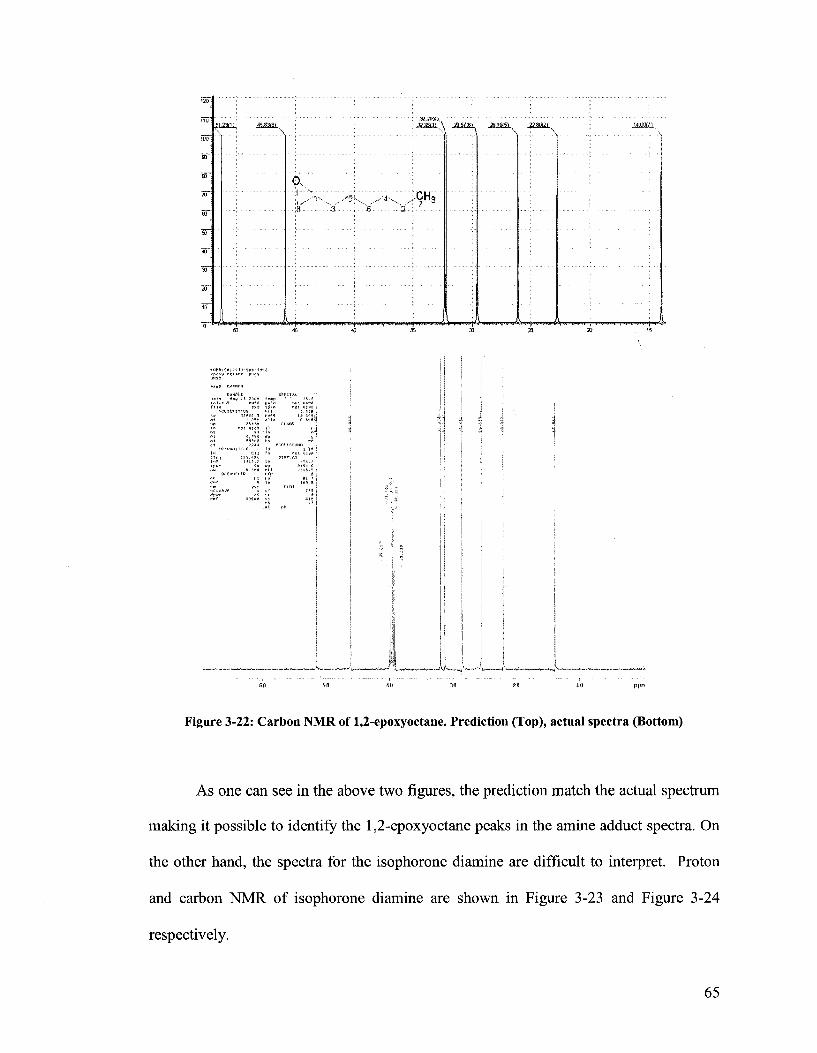
JusaxA Asaa, Jtisa. j w a ,
0H«
JLiL nnmu^V.ii(.njinv'.iii|i A ' 'i),.iunm~fr-n _^UL
• 1 3
Figure 3-22: Carbon NMR of 1,2-epoxyoctane. Prediction (Top), actual spectra (Bottom)
As one can see in the above two figures, the prediction match the actual spectrum
making it possible to identify the 1,2-epoxyoctane peaks in the amine adduct spectra. On
the other hand, the spectra for the isophorone diamine are difficult to interpret. Proton
and carbon NMR of isophorone diamine are shown in Figure 3-23 and Figure 3-24
respectively.
65

NH,
YWMH.
0.71 |4J_
LttSSUlXN
200 280 270 2.60 2.50 240 230 2.20 210 2.00 190 1.90 170 1.60 160 1.40 1.30 120 110 1.00 030 080 0.70
'I ••}£ A '
* j " i ' i
a.s i,o 2 . 0 1 . 0 - 5 ™&.B pp«
Figure 3-23: Proton NMR of Isophorone Diamine. Prediction (Top), actual spectra (Bottom)
66
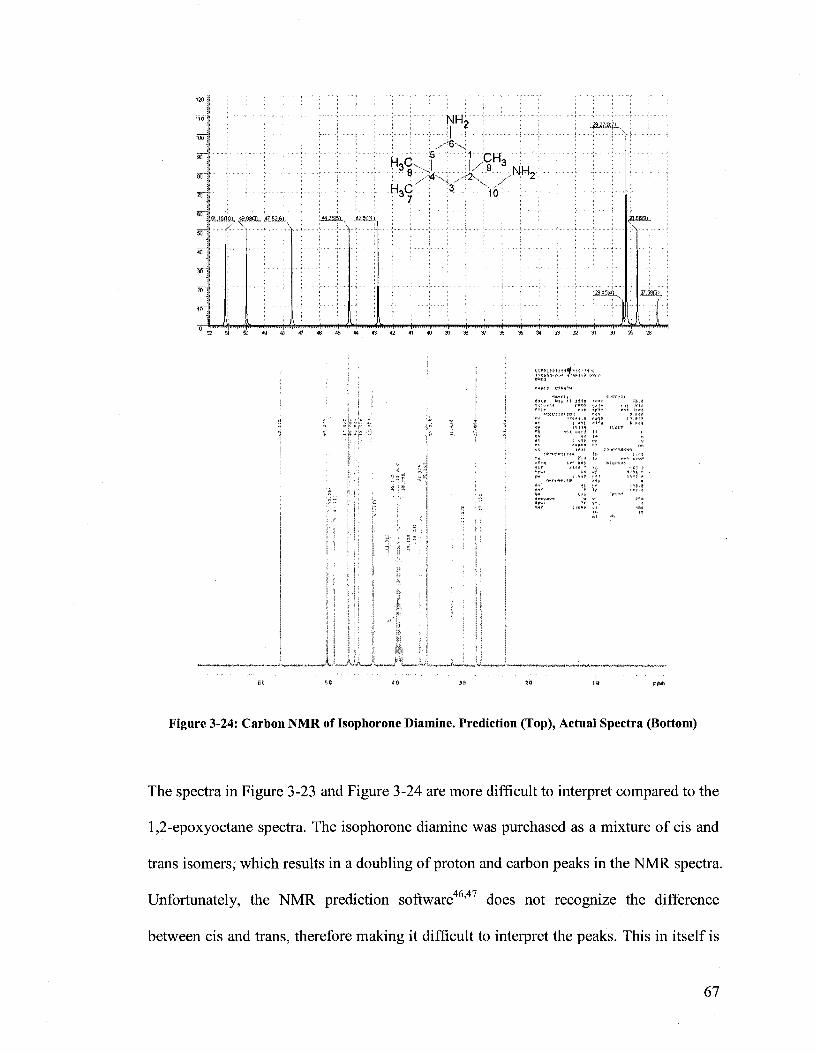
{SUHlffl, «aSSL SU2SL
L
TSIH;
M3CJ-
: 37 :3. '
/ :9 >w2 16'!
JL S 0 4 9 4 3 47 4 6 4 5 4 4 4 3 42 4 1 < J 0 3 9 3 e 3 7 3 3 3 5 3 « 3 3 : a 3 1 3 0 2 9
JLHH1,
;r. 3 j
Figure 3-24: Carbon NMR of Isophorone Diamine. Prediction (Top), Actual Spectra (Bottom)
The spectra in Figure 3-23 and Figure 3-24 are more difficult to interpret compared to the
1,2-epoxyoctane spectra. The isophorone diamine was purchased as a mixture of cis and
trans isomers, which results in a doubling of proton and carbon peaks in the NMR spectra.
Unfortunately, the NMR prediction software46'47 does not recognize the difference
between cis and trans, therefore making it difficult to interpret the peaks. This in itself is
67
a major problem in using this technique. Thus the amine adduct is likely produced in
various configurations which would make the interpretation for the amine adduct much
more difficult to do. NMR results have been inconclusive in determining the mole
fraction of 1,2-epoxyoctane that have attached to the isophorone diamine. NMR spectra
for the each component and IDEO amine adduct can be found in Appendix E.
The reaction kinetics between the IDEO adduct EPON 815C have been observed
through DSC analysis. Equal weight ratios of the resin and adduct have been mixed
together and placed into the DSC. The structure(s) of the amine adduct are still
inconclusive but molecular weight was estimated to be 382g/mole based on an average of
1.5 moles of 1,2-epoxyoctane reacting with isophorone diamine. EPON 815C is a
mixture of various resins and solvent(s) whose molecular weight is stated to be less than
or equal to 700g/mole. Diglycidyl Ether of Bisphenol A (DGEB A) is a main component
of the EPON which has a molecular weight of 340g/mole. Therefore it is safe to assume
that a one to one weight ratio is sufficient.
DSC analysis was performed isothermally monitoring heat flow over time.
Experiments monitoring kinetics were performed at 25°C (Figure 3-25) to obtain a
conversion vs. time plot for this experiment. See Appendix F for the calculation and
production of the conversion vs. time plot in Figure 3-25.
68

0.8 -,
0.7
c 0,6-o B 0.5-(0 0)
E 0 . 4 -o g 0.3 -"S m0.2-
0.1 -
0 -
EPON 815C and IDEO adduct at 25C
\--mmimml^^f^^ t
0 100 200 300 400 500 600
Time (mln)
1
700 1
800
Figure 3-25: Extent of reaction vs. Time for EPON 815C/IDEO adduct curing at 25°C
It is evident from the two figures above that the EPON 815C/IDEO adduct epoxy curing
time is substantially longer than the time required to for adequate diffusional mixing to
occur (80% mixing after 5 hours as shown in Figure 3-8). At 5 hours the curing of the
EPON 815C/IDEO adduct is approximately 15% (at 25°C) This slow curing time would
allow sufficient time for the IDEO adduct and EPON resin to fill a microcrack crack and
fully mix.
69
Encapsulation of Amines
After overcoming the challenge of being able to disperse the amine adduct in
aqueous media, there has been a concern about the encapsulation process. Amines
typically have pKa's between 8 and 10. Many aqueous encapsulation routes require
lowering the pH such as for the urea-formaldehyde (UF) process used for DCPD and
epoxy resin. With the pKa being so high there is a concern about water solubility when
the pH of the system is brought below the pKa's. When the pH drops below the pKa the
amine becomes ionized and more hydrophilic. Various encapsulation attempts have been
performed using various techniques that do not require a drop in pH.
Interfacial Polymerization
Prior to the discovery of the isophorone diamine/epoxyoctane (IDEO) adduct,
interfacial polymerization was a route used to produce amine capsules. Interfacial
91
polymerization is known to work and it allows the use of pure amines (i.e. DETA). This
technique requires a substance in the dispersion to partially react with the core material at
the interface to form the polymer shell. The shell thickness is determined by the diffusive
properties of the reactive components through the forming polymer shell, providing a
constant shell thickness regardless of droplet size. Kondo's book shows that an aqueous
solution of an amine can be encapsulated by introducing an amine (drop-wise) into a
sebacoyl chloride (from Sigma Aldrich) and xylene solution. The reaction between
sebacoyl chloride and a diamine amine makes a nylon shell. This particular method
requires a small percentage of water to be mixed with the amine in order to make
spherical capsules. The same idea can be applied to the use of amines and toluene
70
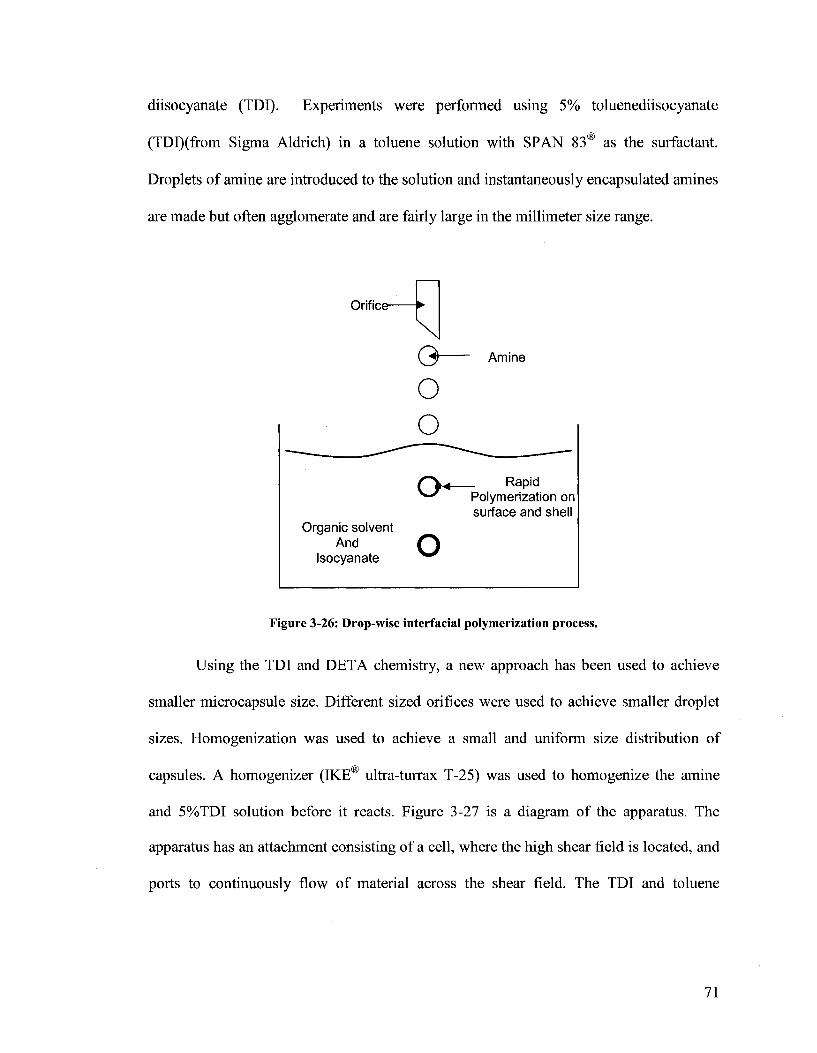
diisocyanate (TDI). Experiments were performed using 5% toluenediisocyanate
(TDI)(from Sigma Aldrich) in a toluene solution with SPAN 83® as the surfactant.
Droplets of amine are introduced to the solution and instantaneously encapsulated amines
are made but often agglomerate and are fairly large in the millimeter size range.
Orifice-
Organic solvent And
Isocyanate
O O
o o
— Amine
Rapid Polymerization on surface and shell
Figure 3-26: Drop-wise interfacial polymerization process.
Using the TDI and DETA chemistry, a new approach has been used to achieve
smaller microcapsule size. Different sized orifices were used to achieve smaller droplet
sizes. Homogenization was used to achieve a small and uniform size distribution of
capsules. A homogenizer (IKE® ultra-turrax T-25) was used to homogenize the amine
and 5%TDI solution before it reacts. Figure 3-27 is a diagram of the apparatus. The
apparatus has an attachment consisting of a cell, where the high shear field is located, and
ports to continuously flow of material across the shear field. The TDI and toluene
71
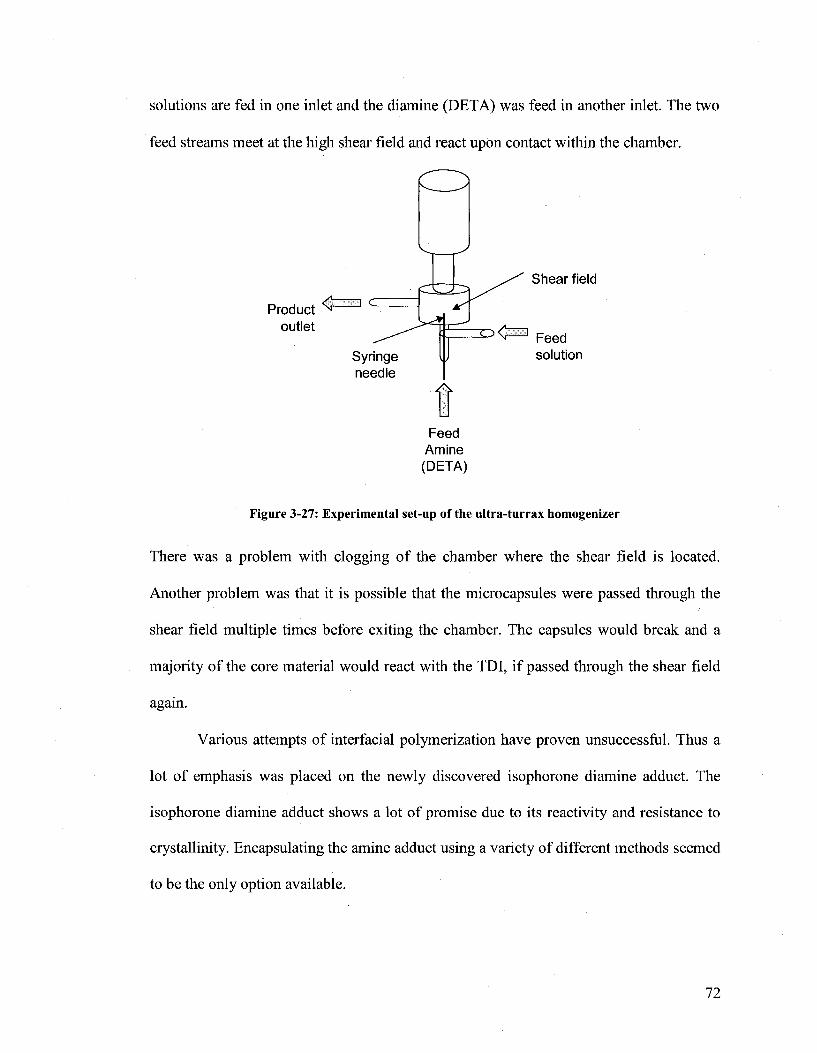
solutions are fed in one inlet and the diamine (DETA) was feed in another inlet. The two
feed streams meet at the high shear field and react upon contact within the chamber.
Product outlet
Syringe needle
Shear field
D < = 1 Feed solution
Feed Amine (DETA)
Figure 3-27: Experimental set-up of the ultra-turrax homogenizer
There was a problem with clogging of the chamber where the shear field is located.
Another problem was that it is possible that the microcapsules were passed through the
shear field multiple times before exiting the chamber. The capsules would break and a
majority of the core material would react with the TDI, if passed through the shear field
again.
Various attempts of interfacial polymerization have proven unsuccessful. Thus a
lot of emphasis was placed on the newly discovered isophorone diamine adduct. The
isophorone diamine adduct shows a lot of promise due to its reactivity and resistance to
crystallinity. Encapsulating the amine adduct using a variety of different methods seemed
to be the only option available.
72

Complex Coacervation
A proposed approach was to produce a polymer layer around the amine,
regardless of its mechanical properties, in order to protect it from ionizing in the acidic
environment of the UF process. A UF shell could then be applied as a second step atop
the protective layer. Many different types of encapsulation processes have been explored
in order to achieve this task.
Complex coacervation uses an aqueous solution of a positively charged colloid
and negatively charged colloid. When these two are mixed, a phase separation results due
to electrostatic interactions. Typically gelatin is used along with gum arabic or a
polyphosphate as the components for coacervation. This process has been successfully
performed by a previous student, Charles Beck. The recipe was based on his work40 using
a type A gelatin (obtained from Sigma Aldrich) and a CALGON® (polyphosphate)
solution. The polyphosphate has a net negative charge while the gelatin has a net positive
charge at low pH and negative charge at high pH. Type A gelatin is widely used for
complex coacervation due to its isoelectric point which ranges from 7-9 depending on its
preparation. Complex coacervation does require lowering th pH below the pKa's of the
amine adduct, however it has been considered that the formation of the initial shell could
form before a significant amount of the amine becomes ionized.
Complex Coacervation process is performed as followed. In a 250ml jacketed
reactor, 5 grams of gelatin (type A) is mixed with 60ml of deionized water. The
dispersion of gelatin is held at 50°C, which is above the gel point of gelatin. 20ml of the
core material to be encapsulated is introduced to the dispersion. Soon thereafter 10ml of a
polyphosphate solution, (made from mixing 5 g of CALGON® Conditioner (a
73
polyphosphate) in 100ml of water) is added to the system. An additional 60ml of water is
charged to the system after the polyphosphate solution is allowed to mix. While
maintaining the temperature at 50°C the pH is dropped slowly to a pH of 5 by drop-wise
addition of acetic acid. Once at a pH of 5, the pH is reduced at a slower rate until the
gelatin phase separates onto the droplets of the core material. Encapsulation occurs
around a pH range of 4.2-4.6. The temperature is then dropped to 10°C to harden the
gelatin and allow the capsules to either settle or float. Removal of the remaining
continuous phase is required and is then replaced with chilled deionized water. 40ml of
37wt% formaldehyde is added soon after to crosslink the capsule walls. Crosslinking is
needed due to the fact that the encapsulation process is completely reversible if the pH is
ever brought back up, the gelatin will go right back into the continuous phase making it
unstable without crosslinking. Crosslinking with formaldehyde takes 12 hours.
To prove capability with the process, a control experiment was performed by
encapsulating toluene. The encapsulation of toluene was successful and found to be
easy to reproduce. The resultant capsules were quite large, as seen in the figure
below, but this was inconsequential as the adduct encapsulation would certainly have a
different droplet size.
74

. i
• X
16 u»
> i ^ ^ # " ~
' \
1
Figure 3-28: Complex Coacervation of Toluene as a Model System (JN3-59)38
Once substituting the toluene core material in the process to the amine adduct,
the encapsulation experiments encountered difficulties. When attempting to lower the pH
to 4.2, a considerable amount of acid was required. This quickly suggests there is
competition between titration of the amine and the precipitation of the gelatinous shell.
For this reason, complex coacervation was abandoned and a different method of
encapsulating the amine was sought.
In-situ Polymerization
The focus towards encapsulating the isophorone diamine adduct has changed
from using complex coacervation to using an in-situ polymerization process. Previous
encapsulation techniques clearly indicated that the amine adduct is sensitive to aqueous
based encapsulations that involve the reduction of pH. The main focus is protection of the
adduct droplet from the acidic environments by placing a polymer shell around the
droplet.
An in-situ polymerization process used to protect the amine droplets can be
described as a free radical solution like polymerization, where droplets are dispersed in
75

aqueous media containing the amine adduct (IDEH or IDEO), monomer(s), initiator and
co-stabilizer. Due to the hydrophobicity of the amine adduct, a co-monomer mixture of
methyl methacrylate (MMA) and methyl acrylate (MA) was proposed, where the
resulting polymer is more hydrophilic than the adduct and has a tendency to phase
separate during formation and move towards the outer surface of the water/droplet
interface. PMMA has a high glass transition temperature (119°C) and PMA has a low
glass transition temperature (9°C), the co-monomer mixture was used to produce a
copolymer of a Tg relative to the reaction temperature. Since the reaction temperature was
chosen to be 70°C, the ratio of MMA to MA was chosen to be 70:30 (by weight) such
that the copolymer Tg would also be close to 70°C (P(MMA-MA) shell with a dry Tg of
78°C and a wet Tg of 65°C). With the reaction temperature lying between the wet and dry
Tg, the polymer formed would phase separate to the outer surface of the adduct droplet
and should have enough mobility at the reaction temperature to coalesce with
neighboring polymer domains and form a continuous shell. Numerous experiments have
been performed using a variety of initiators (shown in Figure 3-29) to determine which
one best encapsulates the amine adduct.
76
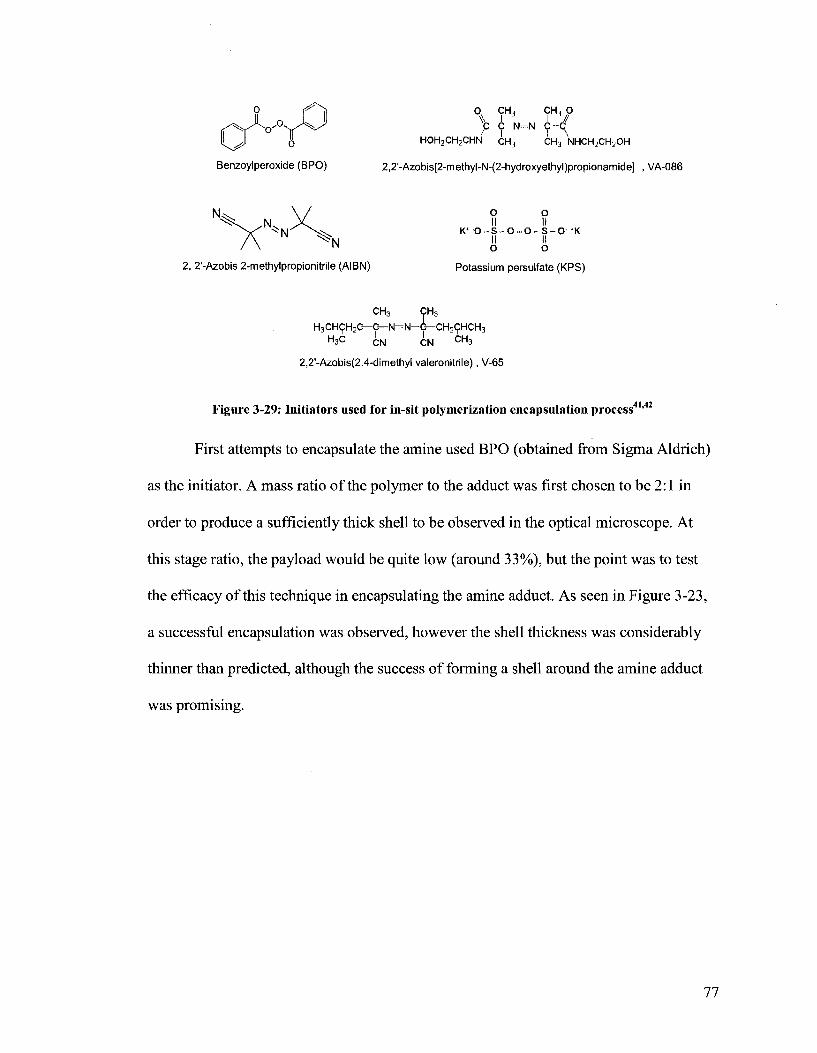
o '
0 r < ^ ^ 0 CH3 CH3 0 ° ~ Y ^ y p—C— N=N~C— C
§ HOH2CH2CHN CH3 CH3 NHCH2CH2OH
Benzoylperoxide (BPO) 2,2'-Azobis[2-methyl-N-(2-hydroxyethyl)propionamide] , VA-086
N ^ \ / o o ^N \ ^ K* O-S-O-O-S-O »K
IN o o 2, 2'-Azobis 2-methylpropionitrile (AIBN) Potassium persulfate (KPS)
I I H3CHCH2C—C—N=N-C—CH29HCH3
H3C C N C N CH3
2,2'-Azobis(2.4-dimethyl valeronitrile), V-65
Figure 3-29: Initiators used for in-sit polymerization encapsulation process41'42
First attempts to encapsulate the amine used BPO (obtained from Sigma Aldrich)
as the initiator. A mass ratio of the polymer to the adduct was first chosen to be 2:1 in
order to produce a sufficiently thick shell to be observed in the optical microscope. At
this stage ratio, the payload would be quite low (around 33%), but the point was to test
the efficacy of this technique in encapsulating the amine adduct. As seen in Figure 3-23,
a successful encapsulation was observed, however the shell thickness was considerably
thinner than predicted, although the success of forming a shell around the amine adduct
was promising.
77

Figure 3-30 First Attempt at Free-Radical Polymerization Based Encapsulation of the IDEH adduct by a p(MMA-MA) Shell (JN3-80)38.
Although the shell was thinner than expected, the photos at the right side of Figure 3-30
clearly shows a broken capsule retaining its shape under the microscope. The capsule was
broken by placing a glass cover slip over the material. Clearly a droplet would not retain
its shape, so this was a simple proof that a shell has formed. However, the monomer
conversion of this polymerization was found to be low, which helps to explain the thinner
polymer shell. A second attempt (JN3-81) of encapsulation at a higher stage ratio (5:1)
also showed a significantly thinner than expected shell and a noticeably low monomer
conversion.
In the portion of the procedure where the droplet size is established, the amine
adduct (mixed with the monomers and the benzoyl peroxide initiator, BPO) is agitated in
the reactor at room temperature for over one hour. It turned out that the benzoyl peroxide
initiator actually forms a redox couple with the amine adduct43 and was decomposing
during this pre-mixing period at room temperature. The high radical decomposition rate
78

of the redox system may produce a high radical flux initially and polymerization quickly
consumed the initiator, resulting in forming only a thin shell. This explains why later, as
the reactor was brought to temperature no further polymerization occurred.
To salvage the low conversion of a particular run (JN3-82), azobizbutyronitrile
(AIBN), (obtained from Alfa Aesar) was fed to the reactor in an aqueous solution with a
small fraction of acetone to aid its solubility and dispersibilty. AIBN was chosen as a
potentially more appropriate initiator. The monomer conversion was found to easily
increase and form a much more pronounced shell on the capsules. Although the resulting
capsules were much too large (1-2 millimeters), Figure 3-31 and Figure 3-32 shows the
promise and success of this system.
Figure 3-31: Clusters of JN3-82 Amine Adduct Capsules Encapsulated by P(MMA/MA) (left), Capsules after Being Crushed and Amine Adduct Liquid Content Released (right)
79

Figure 3-32: Close-up optical microscope image of broken JN3-82 capsule releasing IDEH amine adduct liquid
Figure 3-31 uses a paper wetting test to determine the amount of encapsulated material
present after being crushed between a folded paper towels. One can see that there is some
indication of liquid core material inside the capsules, though the capsules were large and
agglomerated. Figure 3-30 shows a single microcapsule releasing a large amount of
IDEH liquid, indicating that encapsulation was successful.
In order not to consume any of the amine adduct which was observed with the
BPO and amine redox coupling, the same recipe was reattempted (JN3- 84) utilizing only
the AIBN initiator feed. The experiment consisted of a stage ratio of 2 using a 70:30
MMA:MA monomer composition. 2 wt% of AIBN (compared to monomer) was mixed
with a 50:50 water and acetone solution (20ml) and for two hours. Optical microscopy
images of those capsules are shown in Figure 3-33.
80

Figure 3-33 Optical microscopy of JN3-84 capsules from free-radical polymerization based encapsulation of the IDEH adduct by a P(MMA-MA) shell with AIBN initiator
However, when those capsules were subjected to the isolation and crushing test to prove
release of the amine adduct hardener, only a small payload of amine was released as
shown in Figure 3-34 below.
Figure 3-34: Clusters of JN3-84 IDEH amine adduct capsules encapsulated by P(MMA-MA) (left), capsules after being crushed and amine adduct liquid content released (right)
The low yield in the release of these capsules could potentially be due to a variety of
issues. It was suspected that there was a poor degree of phase separation between the
adduct core and the polymer resulting in a highly occluded morphology which might be
81

more difficult to crash. When compared to previous runs (JN4-80, JN4-81), the
difference is found to be the very fast polymerization of an initial shell when the
BPO/amine redox was occurring. To test this concept, a different amine adduct was made
which would be slightly more hydrophobic than the IDEH adduct, the only difference
being the addition of four more carbon units via two epoxyoctane units versus
epoxyhexane units , as shown in Figure 3-35.
Figure 3-35: Adduct of Isophorone Diamine and 1,2 Epoxyhexane (top), Adduct of Isophorone Diamine and 1,2 Epoxyoctane (bottom)
Now with a more hydrophobic core (IDEO adduct) the phase separation of the
p(MMA/MA) polymer to the outer surface of the droplets should occur more easily. The
resulting optical microscopy images and crush test of those capsules are shown in Figure
3-36 and Figure 3-37 respectively.
82

Figure 3-36: Optical microscopy of JN3-85 capsules from free-radical polymerization based encapsulation of the IDEO Adduct by a p(MMA-MA) shell with AIBN initiator
Figure 3-37: Clusters of JN3-85 amine adduct capsules encapsulated by pMMA/MA (left), capsules after being crushed and IDEO amine adduct liquid content released (right)
Clearly from the two figures above, this encapsulation technique shows significant
promise as spherical capsules were obtained which on crushing released a considerable
amount of amine hardener liquid. This result was a significant achievement for this
project. The capsules were far from optimized for application with the resin capsules, but
the amine component has some promise for encapsulation.
83

Many attempts to lower the stage ratio of the encapsulation process below 1.5
have been unsuccessful and focus changed towards water-soluble initiators. Such
initiators experimented with were potassium persulfate (KPS) (obtained from Alfa Aesar)
and VA-086 (obtained From WAKO Chemicals) an azo-initiator. The water soluble
initiators were fed into a reactor containing dispersed monomer and adduct droplets. KPS
was used to test if feeding water-soluble initiators could improve the capsule properties.
The results of the KPS run were not successful due to a large amount of unencapsulated
adduct floating on top.
VA-086 is a water soluble azo-initiator which produces carbon centered radicals
compared to KPS that produces oxygen centered radicals. Feeding of VA-086 compared
to feeding AIBN resulted in smaller sized capsules and produced a larger yield of
microcapsules compared to BPO. The stability was much better than any other
encapsulation attempted on the IDEO adduct so far. The capsules can be seen in the light
microscope shown in Figure 3-38.
Figure 3-38: Light microscope images of JN4-11 wet (left) and dried (right, polarized lens)
As one can see from Figure 3-38, the polymer shell seems thinner than calculated; but
there are signs that a definite shell is formed around the droplets. Attempts to lower the
stage ratio below 1.5 have been unsuccessful due to large amounts of unencapsulated
adduct that floats.
84
It is important to note that there is formation of a second crop of polymer
particulates in the aqueous dispersion. It was suspected that the second crop is made up of
smaller sized polymer particles (nanoparticles) due to the dispersion having limited
stability. It was also noted that the second crop would affect the actual stage ratio of the
encapsulation due to the loss of polymer from adduct droplets to the dispersion. This
might explain why the shells were significantly thin in the majority of experiments and
why one cannot further decrease the effective stage ratio. Before moving on, a step
towards determining the effects of a second crop to the encapsulation process was
assessed.
Second cropping
With many encapsulation attempts so far, a second crop of polymer has formed in
the aqueous phase. This is possibly due to nucleation of polymer particles in the aqueous
phase. Nucleation of polymer particles can be caused by the partial solubility of the
monomers in water and the partial or complete solubility of the initiators. MMA
monomer has a 1.5% solubility (25°C)36 in water and MA has a 5% solubility (25°C)37 in
water which is very high compared to many vinyl monomers. With much of the monomer
residing in the aqueous phase, one would believe the effective amount of monomer used
for encapsulation is less than what was put in the reactor initially. As an example, a stage
ratio of 1.5 used in most experiments could actually be a stage ratio lower than 1.5 due to
loss of polymer used to form the shell material, therefore reducing the stage ratio that was
put in the reactor at the start of polymerization. Therefore the amine adduct and monomer
droplets experience a different stage ratio or "effective" stage ratio. One must either
85

determine what the new "effective" stage ratio is to compare to theoretical values or
introduce the use of an aqueous free radical scavenger such as Fremy's salt (potassium
nitrosodisulfonate) or sodium nitrite44, to reduce or eliminate the second cropping of
polymer formation in the aqueous phase.
Aqueous Radical Scavenger
Aqueous radical scavengers such as Fremy's salt and Sodium Nitrite (NaNCh) are
used to deactivate free radicals in the aqueous phase and therefore potentially stop a
second crop of polymer from forming. The aqueous radical scavenger primarily attacks
carbon based radicals found in the aqueous phase44. Before attempting the addition of the
radical scavengers, a few experiments were performed in order to obtain a better
understanding of how the polymerization behaves with radical scavengers present.
Separate batch emulsion polymerizations of MMA(JN4-26) (Figure 3-39) and
Styrene(JN4-27) (Figure 3-40) have shown decrease in conversion after charging an
equal molar amount (compared to the KPS initiator used) of the radical scavenger,
Sodium Nitrite (from Sigma Aldrich), after 30 minutes of reacting.
Conversion vs. Time
1
0.8
C
o g 0.6 0)
> 8 0.4
0 2
0
0 20 40 60 80 100 120 140
time (min)
Figure 3-39: Conversion curve of MMA batch emulsion polymerization with AIBN. A charge of radical scavenger was place at t=30Min
-fraction monomer fed
- fractional conversion
86

Conversion vs. Time
6 0.6
> O 0.4
0.2
0 0 20 40 60 80 100 120 140
time (min)
Figure 3-40: Conversion curve of Styrene batch polymerization with AIBN. A charge of radical scavenger was place at t=30Min
As one can see in the above figures the decrease in polymerization rate is more obvious
in the styrene batch reaction rather than the methyl methacrylate batch reaction. The
reason that the scavenger did not perform will with the MMA batch reaction is that the
polymerization was effectively complete before the addition of the radical scavenger. For
the styrene reaction (Figure 3-40) the addition of the radical scavenger caused the
monomers polymerize slowly as the scavenger becomes consumed.
When using the radical scavenger, one can no longer use water soluble initiators
or feed initiators into the system. Feeding of the initiator across the aqueous phase will
cause deactivation of free radicals with sodium nitrite present. Experiments involving
radical scavengers have been performed as batch reactions using azo-initiators. Azo-
initiators such as AIBN have been performed with the radical scavenger but have resulted
in producing a second crop. A new type of azo-initiator, 2,2'-Azobis(2.4-dimethyl
valeronitrile) known as V-65 from Wako Chemicals, is similar to AIBN but is
predominantly oil soluble. The transition to V-65 was justified by reducing the amount of
-fraction monomer fed
- fractional corrversion
- • * •_
87

second cropping from forming. The combination of the radical scavenger and V-65 has
shown significant reduction or elimination of second cropping.
Amine Capsule Properties
With the numerous experiments performed thus far, various characterizations of
the encapsulated amines were performed to determine properties and information which
can be used in preparation for the next experiment to further optimize the encapsulation
process. Properties such as amine capsule payload, capsule size, stability, and the ability
to protect itself from ionization, have been used as guides on how to carry on a new set of
experiments.
Microcapsule Payload
The microcapsule payload is important data to determine how well the
encapsulation process was performed. Many encapsulation attempts have shown various
shell thickness and payloads by observation. To differentiate which of the attempts are
better, one must be able to analyze microcapsule payloads in a quantitative manner.
Typically, payload data can be achieved by using a Differential Scanning
Calorimeter (DSC), measuring heat flow vs. temperature. A first order transition was
observed and integration of the peak will result the heat required to soften the material in
the units of J/g. The results for pure core material and the microcapsules are compared to
determine the capsule payload by simply dividing the value received for the capsules
divided by the value of the pure core material, (eg. 5.766 J/g for pure DCPD and 4.615
88
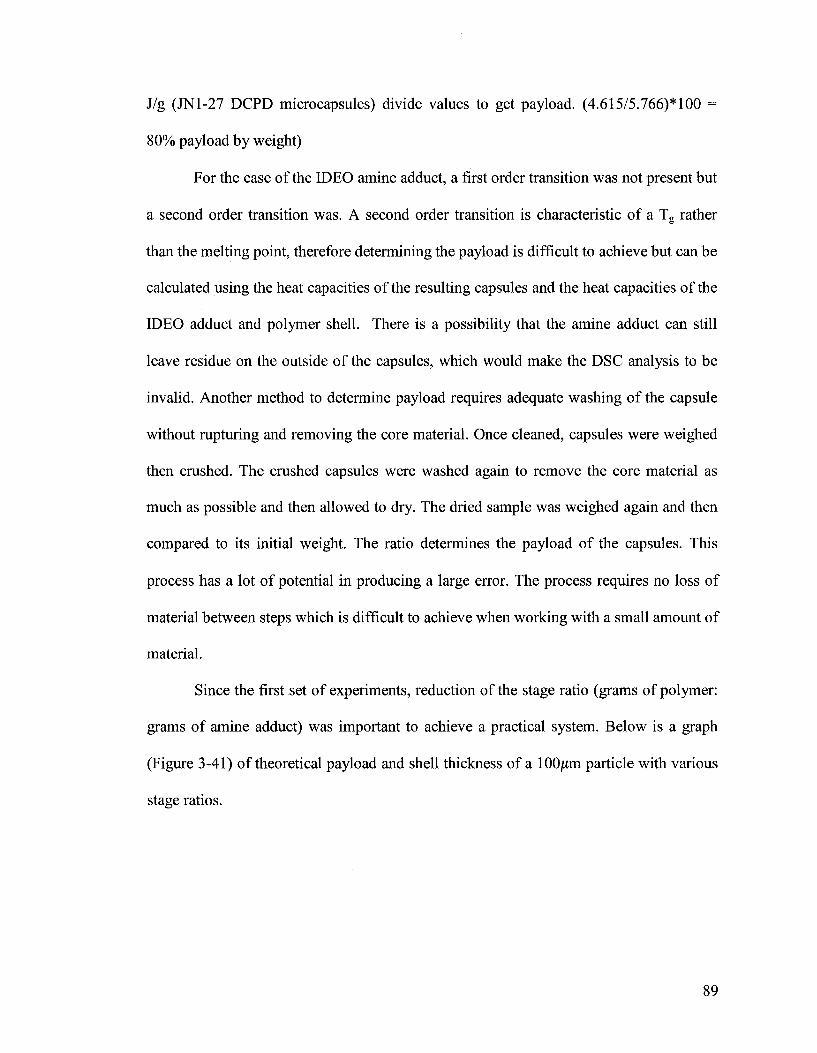
J/g (JN1-27 DCPD microcapsules) divide values to get payload. (4.615/5.766)* 100 =
80% payload by weight)
For the case of the IDEO amine adduct, a first order transition was not present but
a second order transition was. A second order transition is characteristic of a Tg rather
than the melting point, therefore determining the payload is difficult to achieve but can be
calculated using the heat capacities of the resulting capsules and the heat capacities of the
IDEO adduct and polymer shell. There is a possibility that the amine adduct can still
leave residue on the outside of the capsules, which would make the DSC analysis to be
invalid. Another method to determine payload requires adequate washing of the capsule
without rupturing and removing the core material. Once cleaned, capsules were weighed
then crushed. The crushed capsules were washed again to remove the core material as
much as possible and then allowed to dry. The dried sample was weighed again and then
compared to its initial weight. The ratio determines the payload of the capsules. This
process has a lot of potential in producing a large error. The process requires no loss of
material between steps which is difficult to achieve when working with a small amount of
material.
Since the first set of experiments, reduction of the stage ratio (grams of polymer:
grams of amine adduct) was important to achieve a practical system. Below is a graph
(Figure 3-41) of theoretical payload and shell thickness of a 100/an particle with various
stage ratios.
89

100% T T 18.00
0«.; I i i l l I 0.00
0.1 0.2 0.3 0.4 0.5 0.6 0.7 0.8 0.9 I 1.1 1.2 1.3 1.4 1.5 1.6 1.7 1.8 1.9 2
Stage Ratio
Figure 3-41: Graph of theoretical payload and shell thickness of a lOOum diameter microcapsule.
A payload of approximately 80% (by weight) is desired to match that of the resin
microcapsules, which would mean a stage ratio of 0.2 is required. The most successful
encapsulation attempts had a stage ratio of 1.5, which would theoretically give a payload
of 40% and a shell thickness of 13jum. After observing the capsules from the numerous
experiments using light microscopy techniques, we have seen that the capsules actually
have a larger payload than 40% and the actual shell thickness is thinner than the
theoretical 13/mi shell thickness. With this knowledge one can suspect that second
cropping can be the cause of this phenomenon.
IDEO amine adduct density
With many successful encapsulations, the typical result was capsules that tend to
float on top of the liquid dispersion while the second crop polymer particles sank to the
bottom. Since the capsules float, one would suspect that the density of the amine adduct
was less than that of water and polymer. Assuming the density of the P(MMA/MA)
polymer to be 1.147g/ml45 and the density of IDEO adduct is 0.74g/ml (JN4-19, found
90

experimentally at 25°C), it has been calculated that a stage ratio of 2:1 is required to have
the capsules sink in the dispersion. The recipes thus far have only successfully
encapsulated with a stage ratio of 1.5, therefore the microcapsules produced will always
float to the top. With the density being less than that of water, separation of the capsules
from the dispersion becomes an easier process by simply removing the top layer of
capsules and placing them in a container of water and allowing that to separate again. But
the floating of microcapsules proves to be an issue later when adding these capsules to an
epoxy matrix. Upon curing of the epoxy matrix the capsules have a tendency to float and
congregate at the top. This phenomenon can cause problems with preparing samples to
test self-healing and in end-use applications.
Sonication and Homogenization
Initially magnetic stirrers were used to make and maintain droplet sizes in the
reactor, but resulted in large microcapsule sizes in the range of 500um to 1500um. The
use of a magnetic stirrer was not sufficient to make small droplet sizes. Investigations for
obtaining smaller droplet sizes and stable particles have been performed using a
homogenizer and sonicator. The use of the sonicator or homogenizer could produce
smaller droplet sizes in the desired range of 50-80/mi. Producing smaller droplets can
improve the stability of the monomer/adduct droplets from coalescing therefore improve
droplet stability.
Investigation of sonication and homogenization methods have been applied to a
beaker of water, polyvinylpyrrolidone (PVP), hexadecane and mineral oil to observe if
each of the processes can produce droplets that are in the 50-80jttm range. Mineral oil was
91

used as a substitute for the amine adduct since it has a similar viscosity to the amine
adduct/monomer droplets, and to explore how the equipment worked and how to
optimize settings for the appropriate droplet sizes.
Droplet sizes with both the sonicator and homogenizer ranged from 10-80/mi. The
droplets were shown to be stable for at least 90 min after introduced to
sonication/homogenization without the use of a co-stabilizer. The homogenizer was
chosen over the sonicator due to having the ability to produce a narrower size distribution
of mineral oil, in the range of 20-100um with the majority of the droplets being 50um
(JN4-46) determined by light microscopy. Experiments then led to the use of the adduct
instead of mineral oil. Using the same setting on the homogenizer and same reactor set up,
smaller droplet sizes were achieved and the dispersion turned white very quickly. After 5-
10 minutes of homogenization the dispersion was very white in color with sizes around
10-20um. Clearly one obtains much smaller droplet sizes with the use of the adduct than
with mineral oil likely due to the more polar nature of the adduct and the reduction of the
interfacial tension.
Polymer Shell Properties
Microcapsules obtained during and after polymerization often have a tendency to
agglomerate to one another. This phenomenon is also observed after having the capsules
vacuum filtered washed, and dried. The agglomeration can be caused by numerous things
such as a low Tg polymer (polymer drift during polymerization), plasticized shell, or that
the washing method was not adequate therefore there is residue that remains on the
capsule walls. During the polymerization reaction agglomeration between droplets can
92

occur especially in a "sticky" period around 50-70% conversion. In the 50%-70%
conversion range polymer is produced while having the unreacted monomers reside
within the polymer, plasticizing the polymer and make them sticky. The sticky droplets
can collide with one another and end up agglomerated together.
A simple experiment (JN3-87) was performed to determine if the IDEO adduct
could plasticize the p(MMA-MA) copolymer. A solution polymerization containing
MMA, MA, IDEO adduct (1.5 stage ratio), and AIBN was performed. The
polymerization yielded an opaque solid with large occlusions contained inside. The
occlusions were found to be filled with a viscous liquid of IDEO amine adduct. Along
with the opaqueness of composite this proves that the P(MMA/MA)/adduct system
sufficiently phase separates. The polymer chunk is solid and glassy at room temperature
which would indicate that the copolymer is not significantly plasticized by the amine
adduct.
One might think that the agglomeration is a result of adduct being on the outside
of the capsules and making them stick together. Attempts to wash them have been
performed but capsules still have a tendency to stick to one another. It is important to use
a washing solvent that doesn't plasticize or swell the shell material and potentially affect
the core material. Current washing methods use a mixture of 50% methanol in water to
wash the capsules. During the vacuum filtration process, the methanol mixture is poured
over the capsules. This procedure is done two to three times to ensure proper cleaning.
After performing this procedure many capsules still continue to stick to one another. With
this information one must suspect the stability of the droplets during polymerization is
insufficient.
93

Amine Capsule Titration
The reason that the in situ-polymerization process was used was to have a
protective layer that encapsulates the amine, while ignoring other desired properties of
the shell. The reason for the protective layer was to prevent ionization of the amine which
is a concern when using many other types of encapsulation techniques. If the amine
adduct was successfully protected, then one can try to place a urea-formaldehyde shell
around it, to match the mechanical properties of the resin microcapsules. To determine if
protective polymer shells are adequate, titration experiments were performed to
determine how the adduct capsules behave, during the titration of the amine adduct with
acid in the aqueous dispersion. Using a pH probe and pH meter (Venier Lab Pro System),
the pH was monitored and plotted over time. Figure 3-42 (below) contains separate
titration curves for 2wt% JN4-11 capsules (VA-086 capsules) in water, DI Water alone,
and 2wt% IDEO adduct dispersed directly in water.
Titration Curves
—Adduct 4.5M HCI — Microcapsules 1M HCI — Water 1M HCI
4 6 8 Volume of HCI added (ml)
10 12
Figure 3-42: Titration curves of adduct, water, and JN4-11 microcapsules with the specified acid fed at a rate of 5ml per hour
94

One can see in Figure 3-42, that the IDEO adduct (dark blue curve) has two pKa's
approximately around nine and seven (designated by arrow 1 and 2 respectively), while
the pure water and the microcapsule curves have no signs of a pKa. The microcapsule
titration curve (green curve) lies in between the adduct curve and water curve. The fact
that the microcapsule curve lies in between the pure water curve and the adduct in water
curve (red curve), makes one suspect that there is some trace of amine adduct on outside
of the capsule walls or that the adduct could be slowly leaching through the shell wall.
With the JN4-11 capsules (polymerized with VA-086), attempts to optimize the
washing was performed with no further improvement. In addition, the capsules that have
been titrated were saved and were exposed to acidic conditions (pH=2) over a week's
time. Unfortunately, the capsules no longer floated, which would make one believe that
the capsules have ruptured or leached their contents within that period. Figure 3-41 shows
a light microscope image of JN4-11 microcapsules in acidic conditions for one week.
Figure 3-43: Light microscope images of JN4-11 in pH 2 after seven days Light microscope(left), Light microscope with polarized lens (right).
In Figure 3-43, one can clearly see that there are broken capsules present. This
information is very discouraging, but encapsulation of the amine adduct has been
achieved. Our focus thus shifted to produce a thicker shell around the capsules by means
of increasing the stage ratio or eliminating the second crop. The actual payload of the
95

JN4-11 capsules was unknown due the challenges in determining the actual capsule
payload.
Encapsulations Using V-65 Initiator
Although AIBN generated in some successful encapsulations, it unfortunately still
partitions into the water phase. Having the free radicals in the aqueous phase often results
in the formation of a second crop, therefore a new azo-initiator that is predominantly oil
soluble might be suitable. An oil soluble azo-initiator, VA-65 is very similar to AIBN but
is predominantly oil soluble. Below in Figure 3-44, one can see that the initiators have
similar structures with the double bonded nitrogen groups in the center. Dissociation of
the both initiators results in carbon centered radicals that are highly reactive with
monomer.
CH3 CH3 N
H3CHCH2G—C— N=N-C— CH2CHCH3 ^ ^ ' N
w H 3 C CN CN C H3 / \ ^"fsj
2,2'-Azobis(2.4-dimethyl valeronitrile), V-65 Azobisisobutyronitrile
Figure 3-44: Chemical structures of V-65(left) and AIBN (right)40'41
In the figure above, one can see that the V-65 has a longer alkyl chains in the molecule
compared to the structure in AIBN, making V-65 a much more hydrophobic initiator.
VA-65 has a 10 hour half life at 51°C40. Reduction of the polymerization
temperature to 65°C was used to have a reasonable half-life during the polymerization
process (1.53 hours). A series of batch reactions were performed with V-65 and radical
scavenger. Results were much better than any previous encapsulation attempts with the
amine adduct, with higher yield and the amount of polymer formed as a second crop has
96

decreased significantly. The dispersion was opaque rather then milky white. However the
capsules were still large (eg. 300-800um) and most of them still agglomerated to one
another.
The issue of second crop formation seems to have been eliminated with the use of
an aqueous radical scavenger in conjunction with V-65. Unfortunately, experiments
trying to drive the stage ratio lower than 1.0 have been unsuccessful. Stability is still a
key issue with encapsulation.
Agglomeration during polymerization has been a common result when trying to
encapsulate the IDEO adduct using MMA/MA co-polymer. An experiment has been
performed (JN4-50) which has the IDEO adduct omitted from the recipe to see if the
adduct has anything to do with the system being sticky and cause the capsules to
agglomerate. After running an experiment (JN4-51) without the adduct conversions have
been calculated to be approximately 49%. The low conversion of the polymer is a
puzzling result. A possible reason for the low conversion is the radical scavenger present
during polymerization. Even though the scavenger is dominant in the aqueous phase, it
can cause the resulting low conversion. However an experiment (JN4-52) without adduct
and without scavenger still resulted in a low conversion, approximately 45%.
In order to determine what is going on with the low conversion a series of small
scale experiments (20ml vials) have been performed. A series of bulk polymerizations
were performed to answer a few questions about the system that was currently employed.
Investigation of temperature, monomers, and initiator concentrations has been a priority.
The relationship between conversion and temperature has been observed in the following
series of bulk polymerizations found in Table 3-1 below:
97

Table 3-1: Bulk polymerization experiments JN4-53
Vial#
1
2
MMA,g
4.8
4.8
MA,g
3.2
3.2
V-65, g
0.137
0.137
Reaction Temperature, C 65
80
Properties
Polymerized but sticky
Polymerized but sticky
The polymer Tg's should be around 80°C(Dry Tg) and 63°C (Wet Tg); it clearly shows
that the Tg of the experiments in Table 3-1 is below that. Investigation of the
polymerizations of the individual homomonomers has been performed using BPO and V-
65 as initiators to determine if there are any anomalies that occur during polymerization.
Table 3-2: Bulk polymerization experiments JN4-54
Vial#
1
2
3
4
5
6
MMA,g
8
8
4.8
4.8
MA,g
8
8
3.2
3.2
Initiator, g
0.137 V-65
0.137 V-65
0.137 V-65
0.137 V-65
0.137 BPO
0.137 BPO
Reaction Temperature, C 65
80
65
80
65
80
Properties
Polymerized, soft
Polymerized, soft
Polymerized, hard
Polymerized, hard
Polymerized, hard
Polymerized, hard
With the data from Table 3-1 and Table 3-2, one can see that V-65 used to polymerize a
copolymer of MM A an MA was soft and therefore unsuccessful (Table 3-1) but when
using BPO, polymerization is easily achieved resulting in a hard material (Table 3-2).
This result is very puzzling since MMA and MA should be easily copolymerized.
With this puzzling result, a substitution of MA with BMA has been made. The use
of BMA lowers the polarity of the copolymer but still it remains higher than the adduct.
98
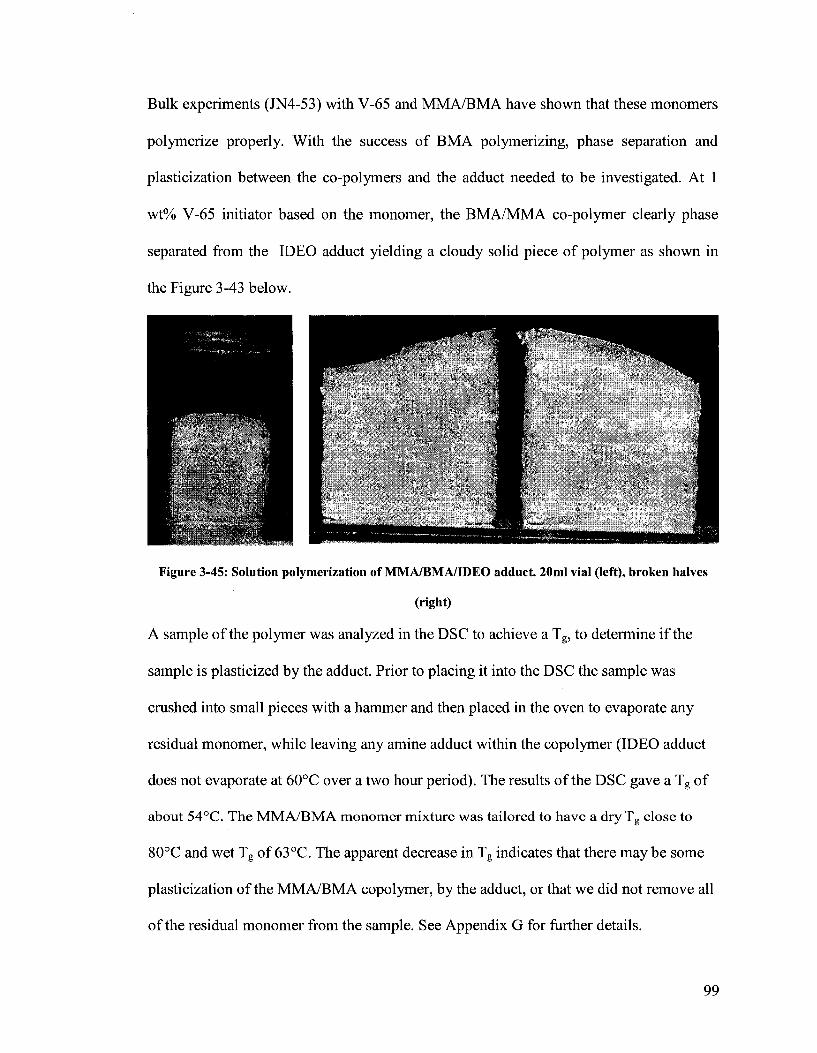
Bulk experiments (JN4-53) with V-65 and MMA/BMA have shown that these monomers
polymerize properly. With the success of BMA polymerizing, phase separation and
plasticization between the co-polymers and the adduct needed to be investigated. At 1
wt% V-65 initiator based on the monomer, the BMA/MMA co-polymer clearly phase
separated from the IDEO adduct yielding a cloudy solid piece of polymer as shown in
the Figure 3-43 below.
Figure 3-45: Solution polymerization of MMA/BMA/IDEO adduct. 20ml vial (left), broken halves
(right)
A sample of the polymer was analyzed in the DSC to achieve a Tg, to determine if the
sample is plasticized by the adduct. Prior to placing it into the DSC the sample was
crushed into small pieces with a hammer and then placed in the oven to evaporate any
residual monomer, while leaving any amine adduct within the copolymer (IDEO adduct
does not evaporate at 60°C over a two hour period). The results of the DSC gave a Tg of
about 54°C. The MMA/BMA monomer mixture was tailored to have a dry Tg close to
80°C and wet Tg of 63°C. The apparent decrease in Tg indicates that there may be some
plasticization of the MMA/BMA copolymer, by the adduct, or that we did not remove all
of the residual monomer from the sample. See Appendix G for further details.
99

An encapsulation attempt was performed using a 1.5 stage ratio with MMA/BMA
as the co-monomers. Reaction was subjected to homogenization during the entire
polymerization process. The experiment yielded 50-150|j,m microcapsules that float to
the top of the dispersion and removed to be dried and washed with a 50% methanol
solution. The resulting dried capsules can be seen in Figure 3-46 and Figure 3-47 below.
Figure 3-46: Light microscope images of washed and dried JN4-64 microcapsules. Whole capsules (left) and crushed capsules (right)
Figure 3-47: Paper test of dried and washed JN4-64 microcapsules. Whole Capsules (left) and crushed capsules (right)
Under the light microscope (Figure 3-46), one can see some liquid on the glass
slide after applying pressure onto the capsules. With the paper test (Figure 3-47), one can
not see the liquid core material. A titration experiment on the capsules has been
performed to see if the shell walls are sufficient in the protection of the core material
from ionization. Figure 3-48 shows the data obtained from the titration experiment JN4-
65.
100
Titration curves
— IDEO Adduct 4.5M HCI —Water 1M HCI
JN4-64 Capsules 1M HCI
2 3 4
Volume of HCI Added (ml)
Figure 3-48: Titration curve of JN4-64 capsules, water, and IDEO adduct in water.
The JN4-64 microcapsule curve lies between the water and adduct titration curves,
similar to the JN4-11 microcapsules made with VA-086. This can indicate that the
washing process was still not sufficient or that the adduct continues to leach out of the
shell wall. Interestingly after a day, the JN4-64 capsules sank in an acidic solution with a
pH of 2. This is also a characteristic of the JN4-11 microcapsules previously mentioned.
Though the protection of the core material from being ionized was not completely
successful, the IDEO adduct was indeed encapsulated.
A series of tests have been performed trying to drive down the stage ratio closer
to 0.2 to achieve an 80% payload. There was success at a stage ratio of 1:1, but lead to
the formation of a "crust" near the homogenizer shaft after an hour of reaction. The
capsules tend to be agglomerated into large (ca. 1mm) particles.
Typically the homogenizer has been run for 3-4 hours, during the whole reaction,
to maintain the same droplet size throughout the free radical polymerization. But in one
specific experiment JN4-72, the homogenizer started to make some odd grinding noises
around the motor. Immediately homogenization was halted in the early part of the
101

reaction. It was approximately 45-50 minutes when homogenization was stopped . The
first 15 minutes was used for dispersing the liquid droplets at room temperature and the
remaining 30-35 minutes was the time for the water bath to be heated from room
temperature to 65°C. With the reactor contents already at temperature, it was best to let
the reaction proceed for the rest of its time, without using the homogenizer. This incident
yielded capsules that floated in the dispersion and were 70-150um in size according to
light microscopy and multi angle light scattering techniques (Microtrac, wet setting). The
microcapsules were much more dispersed and a higher yield of capsules was produced
but did agglomerate slightly after washing and drying. Light microscope images in Figure
3-49, and paper towel test Figure 3-50 show a lot of promise compared to other previous
attempts.
Figure 3-49: JN4-72 capsules in dispersion (left) and dried crushed capsules (right)
As one can see from Figure 3-49, the capsule sizes are smaller than achieved with any
other attempt so far. On the right side of Figure 3-49, there is a significant amount of
liquid core material released form the ruptured capsules
102
Figure 3-50: Paper test of JN4-72 capsules. Whole capsules (left) and crushed capsules (right)
Figure 3-50 shows that there is a significant amount of liquid amine adduct that was
released by wetting the paper towel.
The following is a detailed procedure and recipe used to make the capsules from
JN4-72 with a stage ratio of 1 to 1. In a beaker, 128ml of deionized water, 5.12g
polyvinylpyrrolidone) and 0.0892g sodium nitrite are added and well mixed. In a second
beaker, 6.4g of MMA, 4.26g BMA, 0.106g hexadecane 0.106g V-65 are well mixed.
Once mixed 10.66g of IDEO adduct is added to the monomer mixture until dissolved.
The contents are then placed into a 250 ml jacket reactor at room temperature. Attached
to the reactor are a condenser, homogenizer, and a nitrogen gas feed line. The
homogenizer is not sealed, therefore parafilm® is used to produce a gas tight seal. The
contents are dispersed using the homogenizer (IKE® Ultra-turrax T-25) with a setting of
9500 RPM in conjunction with a magnetic stir plate and oval shaped (30mm in length)
stir bar at a setting of 11 (Barnstead/Thermolyne Cimaric) for 15 minutes. In Figure 3-51,
the experimental set-up is shown below.
103
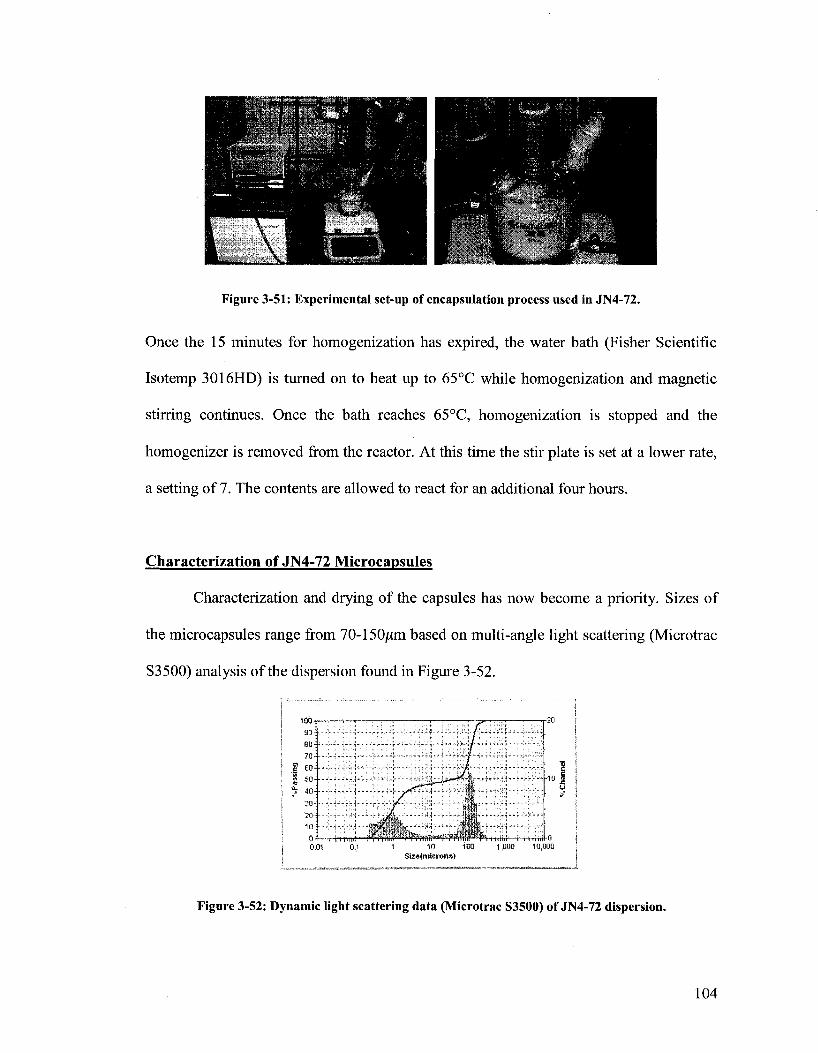
Figure 3-51: Experimental set-up of encapsulation process used in JN4-72.
Once the 15 minutes for homogenization has expired, the water bath (Fisher Scientific
Isotemp 3016HD) is turned on to heat up to 65°C while homogenization and magnetic
stirring continues. Once the bath reaches 65°C, homogenization is stopped and the
homogenizer is removed from the reactor. At this time the stir plate is set at a lower rate,
a setting of 7. The contents are allowed to react for an additional four hours.
Characterization of JN4-72 Microcapsules
Characterization and drying of the capsules has now become a priority. Sizes of
the microcapsules range from 70-150/mi based on multi-angle light scattering (Microtrac
S3500) analysis of the dispersion found in Figure 3-52.
Figure 3-52: Dynamic light scattering data (Microtrac S3500) of JN4-72 dispersion.
104

By observation one can see that there is a second crop in the dispersion shown as
by a bi-modal distribution in sizes. Isolation of the particles is typically done by using
vacuum filtration but the second crop (at about l^trn) would typically clog the filter paper
making it difficult to isolate and dry. To get around this, the capsules were allowed to
float. The microcapsule were then removed from the top and placed into the vacuum
filtration apparatus to be washed with a 50% methanol in water solution two times.
Capsules were then placed in the hood to dry overnight (ca. 16 hours) at room
temperature.
Scanning Electron Microscopy
The microcapsules were analyzed using Scanning Electron Microscopy (SEM)
(AMRAY 3300FE) to determine the characteristics of the shell when intact or crushed.
The images shown in Figure 3-53, show a fairly smooth shell material (compared to
Urea-formaldehyde), and that the capsules did not break when crushed.
Figure 3-53: SEM Images of JJN4-72 capsules. Whole capsules (left). Crushed capsules (right).
The SEM images showed an interesting microcapsule shown on the left of Figure 3-51.
This capsule shows some substance pouring out of the capsule while keeping a majority
105
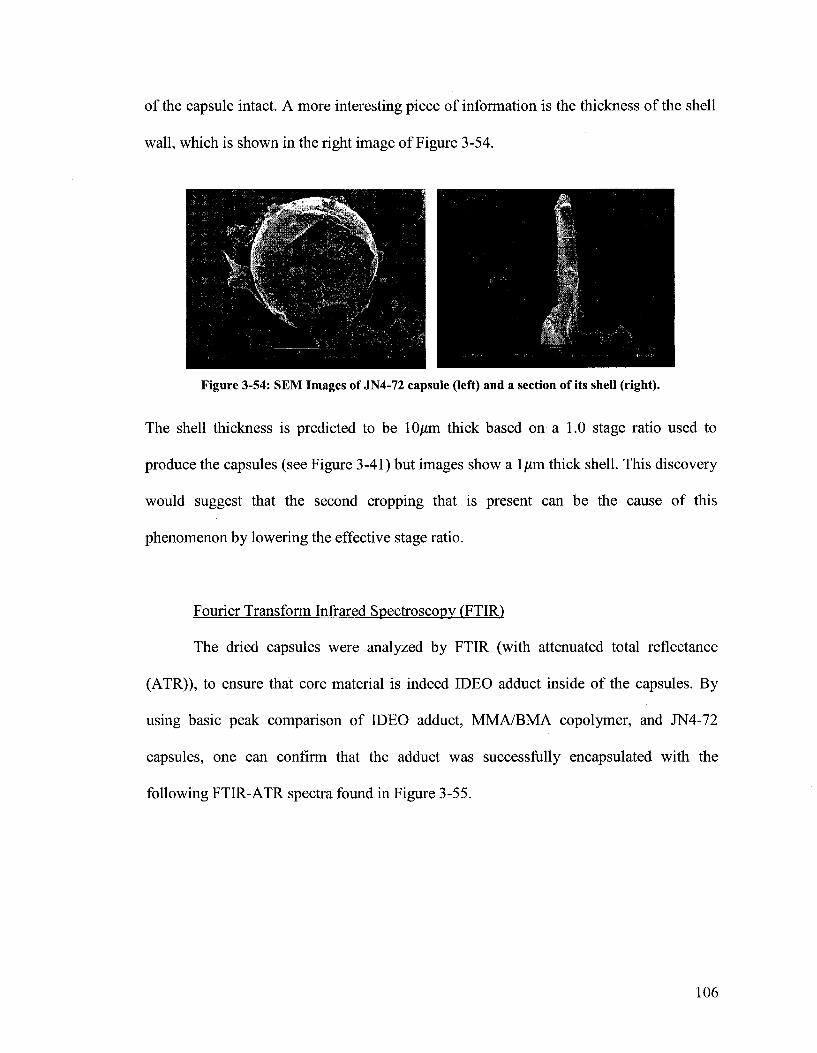
of the capsule intact. A more interesting piece of information is the thickness of the shell
wall, which is shown in the right image of Figure 3-54.
Figure 3-54: SEM Images of JN4-72 capsule (left) and a section of its shell (right).
The shell thickness is predicted to be 10/rni thick based on a 1.0 stage ratio used to
produce the capsules (see Figure 3-41) but images show a l^m thick shell. This discovery
would suggest that the second cropping that is present can be the cause of this
phenomenon by lowering the effective stage ratio.
Fourier Transform Infrared Spectroscopy (FTIR)
The dried capsules were analyzed by FTIR (with attenuated total reflectance
(ATR)), to ensure that core material is indeed IDEO adduct inside of the capsules. By
using basic peak comparison of IDEO adduct, MMA/BMA copolymer, and JN4-72
capsules, one can confirm that the adduct was successfully encapsulated with the
following FTIR-ATR spectra found in Figure 3-55.
106
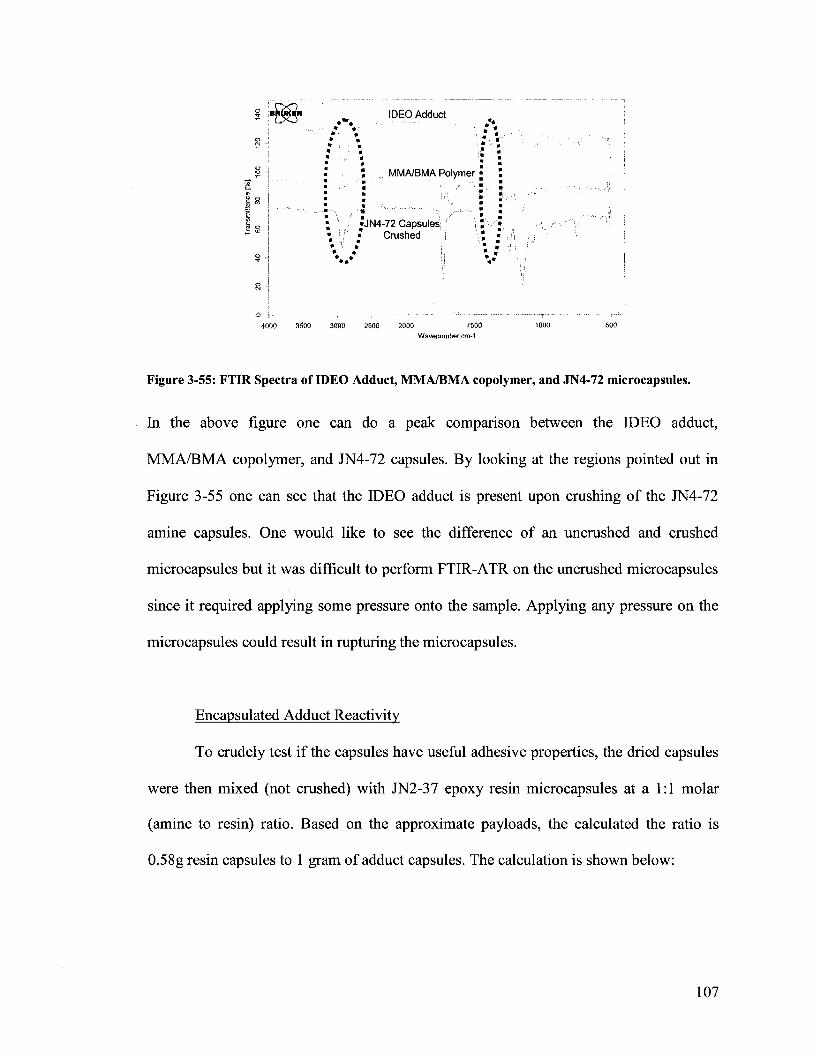
1000 500
Figure 3-55: FTIR Spectra of IDEO Adduct, MMA/BMA copolymer, and JN4-72 microcapsules.
In the above figure one can do a peak comparison between the IDEO adduct,
MMA/BMA copolymer, and JN4-72 capsules. By looking at the regions pointed out in
Figure 3-55 one can see that the IDEO adduct is present upon crushing of the JN4-72
amine capsules. One would like to see the difference of an uncrushed and crushed
microcapsules but it was difficult to perform FTIR-ATR on the uncrushed microcapsules
since it required applying some pressure onto the sample. Applying any pressure on the
microcapsules could result in rupturing the microcapsules.
Encapsulated Adduct Reactivity
To crudely test if the capsules have useful adhesive properties, the dried capsules
were then mixed (not crushed) with JN2-37 epoxy resin microcapsules at a 1:1 molar
(amine to resin) ratio. Based on the approximate payloads, the calculated the ratio is
0.58g resin capsules to 1 gram of adduct capsules. The calculation is shown below:
IDEO Adduct
MMA/BMA Polymer
•JN4-72 Capsules; • Crushed
• . *
4000 3500 3000 2500 2000 1800 Wavenumber cm-1
107
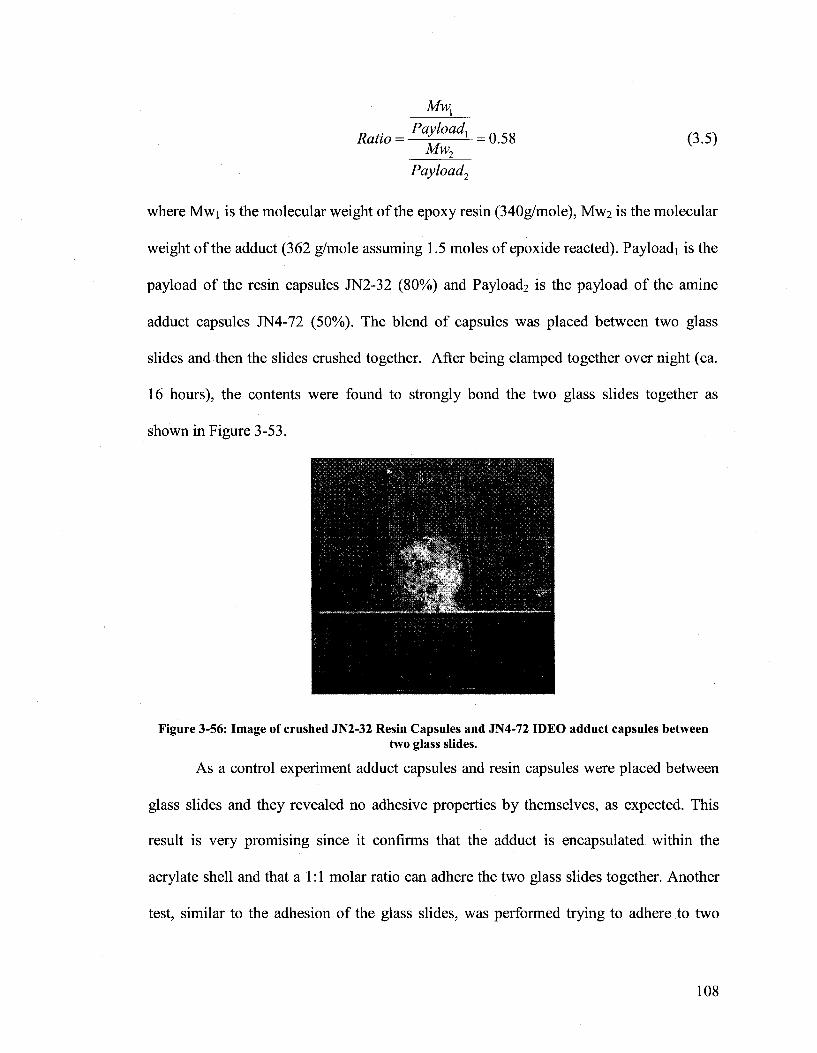
Mwx
Ratio = ^ = 0.58 (3.5)
Payload2
where Mwi is the molecular weight of the epoxy resin (340g/mole), Mw2 is the molecular
weight of the adduct (362 g/mole assuming 1.5 moles of epoxide reacted). Payloadi is the
payload of the resin capsules JN2-32 (80%) and Payload2 is the payload of the amine
adduct capsules JN4-72 (50%). The blend of capsules was placed between two glass
slides and then the slides crushed together. After being clamped together over night (ca.
16 hours), the contents were found to strongly bond the two glass slides together as
shown in Figure 3-53.
Figure 3-56: Image of crushed JN2-32 Resin Capsules and JN4-72 IDEO adduct capsules between two glass slides.
As a control experiment adduct capsules and resin capsules were placed between
glass slides and they revealed no adhesive properties by themselves, as expected. This
result is very promising since it confirms that the adduct is encapsulated within the
acrylate shell and that a 1:1 molar ratio can adhere the two glass slides together. Another
test, similar to the adhesion of the glass slides, was performed trying to adhere to two
108

sheets of epoxy. The sample was allowed to cure for 24 hours and resulted in successful
bonding of the two sheets. It is important to note that the molecular weight of the resin is
approximately 340.41 g/mole and the adduct (assuming 1.5 moles of epoxyoctane groups
react with the amine) is 362.6 g/mol. If an 80% payload (similar to the resin) can be
achieved with the adduct capsules, one can produce a blend that requires 1 resin capsule
to 1 adduct capsule in order to cure properly.
Microcapsule Payload
Obtaining payload data through DSC analysis is difficult, since the adduct does
not have a melting temperature, unlike DCPD. Without a melting point, obtaining the
microcapsule payload of the amine capsules requires data obtained from the DSC in the
form of heat capacities. The heat capacities of the adduct (Figure 3-57), shell material
(Figure 3-58), and the overall microcapsules (Figure 3-59) are found in the figures below.
p.
Temperature f C )
Figure 3-57: DSC trace of JN4-63 IDEO adduct
109

Temperature ("C)
Figure 3-58: DSC trace of JN4-68 MMA/BMA polymer
» 1.5
<r<fc
Temperature (°C)
Figure 3-59: DSC trace of JN4-72 IDEO amine adduct capsules.
From the figures above, the ACp values of the amine adduct and the polymer shell along
with the integrated peak areas of the amine microcapsules were calculated from the DSC
trace observing the reversible heat capacity and derivative of the heat capacity vs.
temperature. With the appropriate data, one can now calculate the payload with the
following equation:
^ - P polymer ^ adduct Payload =
^•^P polymer ^adduct ^P adduct polymer
(3.6)
110

where ACppoiymer is the change in heat capacity for the shell polymer, ACpadduct is the
change in heat capacity for the amine adduct, Abduct is the integrated area of the
derivative reversible heat capacity for the amine adduct, and Apoiymer is the integrated area
of the derivative of reversible heat capacity for the polymer shell. The resulting payload
is:
Payload = 0-3757*0.1055 #lQQ = g 5 ^ %
0.3757 * 0.1055 + .6976 * 0.009279
The resulting payload is approximately 86%, which is significantly higher than the
predicted 60% payload.
However, a payload can also be calculated based on the amount of polymer in the
second crop. With the second crop present, the effective payload is higher (stage ratio is
lower) than what was put in the reactor. By this technique (as determined from the
measurement of the second crop for experiment JN4-72) the maximum payload that these
capsules can achieve is 78%, making the actual payload fall in between the range of 60%-
78% for the 1.0 stage ratio experiment. With the SEM images found in Figure 3-52, one
can also estimate the payload by back calculating from the size of the capsule and the
apparent shell thickness. A shell thickness of 1 /-im (from SEM) and a capsule size of 150
/xm were used to calculate a payload of 95% or a stage ratio equivalent of 0.075. This
result is very surprising, but one can not determine the average payload with this method.
This method only utilizes a few microcapsules and the shell would most likely to rupture
at the weakest point of the polymeric shell, therefore skewing the data. The three methods
used to determine the microcapsule payload resulted in three different answers. It is still
uncertain which of the payload values are correct.
I l l

Reproduction of JN4-72 Microcapsules
With the limited success of encapsulating the IDEO adduct, one can move on and
employ them into an epoxy matrix for self-healing testing. In order to do self-healing
tests, producing a large amount of capsules is needed. Attempts to replicate the
experiment JN4-72 have been very difficult to achieve. Subsequent attempts have
encapsulated the amine adduct but often led to large microcapsules and/or agglomerate
during the encapsulation process. A series of experiments has been performed to try to
produce more IDEO adduct capsules to be used in self-healing testing.
The first set of tests was attempted to replicate the experiment JN4-72. The
recipes to produce the capsules are identical but the magnetic stir rate was adjusted to
obtain a similar vortex in the reactor between runs. Results have shown that the capsules
float and often agglomerate into large particulates in the millimeter size range. A second
crop of polymer particle was present in all of the experiments. A table of experiments for
repeating JN4-72 can be found in Appendix H, Table H-l.
A next set of experiments used mechanical stirring (paddle stirrer attached to a
mixer) instead of magnetic stirring (magnetic stir plate with 30mm oval stir bar).
Magnetic stirring has shown to be unreliable in maintaining the same speed (RPM)
throughout and between experiments. Therefore, mechanical stirring might resolve the
uncertainty in using magnetic stirring. A list of experiments performed are found in Table
F-2 in Appendix F. Numerous variables have been changed, such as surfactant
concentration, solid content, stirring speed, and homogenization speed, but always
resulted in undesirable results. A majority of the experiments often led to capsules that
are very large 300-800um with yields varying from very low to moderate.
112
With numerous attempts to encapsulate the amine adduct only one experiment,
JN4-72, has been successful in producing a high yield of capsules in the correct size
range and payload. Based on the information from the experiments trying to reproduce
JN4-72, it is clear that the conditions for a successful encapsulation are very sensitive to
changes in the reactor conditions and the recipe. To date we have not been able to
reproduce the results of JN4-72.
113

CHAPTER 4
CONCLUSIONS AND RECOMMENDATIONS
Conclusions
The work in this thesis has shown that the concept of self-healing can be achieved.
Work with the dicylopentadiene microcapsule and Grubb's catalyst system has furthered
our understanding on how to test and produce a previously demonstrated self-healing
system. A new system involving a dual microcapsules system became the main focus of
the thesis.
Computational results have suggested that the epoxy resin and amine
microcapsule system is feasible for self-healing. Modeling results have revealed that a set
of microcapsules, once broken, may release their contents, fill a microcrack by capillary
flow, and sufficiently mix by diffusion prior to significant reaction of the healing agents.
Providing that sufficient adhesion between the new polymer and the walls of the crack is
achieved, this appears to lead to successful self-healing.
Encapsulation of the epoxy resin was easily achieved. Encapsulation with urea
formaldehyde resulted with capsules in the 80-120jUm range and has an 80% payload.
The capsules can be dried into a free flowing powder and can be easily dispersed in an
epoxy coating. Adhesion between epoxy resin capsules and the host epoxy matrix was
sufficient to allow a crack to properly cleave the microcapsules.
114

With amines being soluble in aqueous and organic media, traditional
encapsulation methods are difficult to perform. Various amine adducts were produced to
be hydrophobic but often crystallized over time. However, an isophorone diamine and
1,2-epoxyoctane (IDEO) adduct was made and has been shown to have a low water
solubility, achieve good reactivity with the epoxy resin, and does not crystallize. It has
been discovered that the amine adduct does become ionized at lower pH, therefore
making the adduct more water soluble. This result limits the number of possible
encapsulation techniques that can be used to encapsulate the amine adduct, however free
radical in-situ polymerization was successful in encapsulating the amine adduct when
using an acrylic polymer as the shell. The microcapsules range in sizes from 70-150jttm
and have a reasonable payload. The capsules are able to be dried into a free flowing
powder and can be dispersed into an epoxy coating. However, reproducing the
encapsulation process has proven to be very difficult.
Though reproducibility is an issue, the adhesive properties with a mixture of
amine adduct capsules and epoxy resin capsules have proven to be successful by binding
two pieces of epoxy strongly together. This result shows the great potential of the dual
microcapsule self-healing system.
Recommendations
There are still multiple issues that must be addressed with the chemical analysis,
and encapsulation of the amine hardener. The chemical properties of the IDEO adduct,
the reproduction of amine encapsulation, and the self-healing two part microcapsule
115

system requires further investigation. Analysis of the amine adduct via NMR has proven
difficult because the isophorone diamine is obtained as a mixture of cis and trans
configurations. The two configurations make it difficult to identify peaks in carbon and
proton NMR. The time to identify each peak requires extensive knowledge about NMR
analysis of amines. If possible, one can purchase or purify the isophorone diamine to
have one specific configuration and then perform NMR studies. Other techniques such as
Carbon Hydrogen Nitrogen (CHN) analysis, Gel Permeation Chromatography (GPC),
Liquid Chromatography (LC), and Mass Spectrometry (MS) should be performed to
determine the number of epoxide groups that have reacted with the isophorone diamine to
produce the IDEO amine adduct.
Epoxy resin microcapsules were easily produced but, encapsulation of the adduct
has been very difficult. The current investigation has shown that this encapsulation
process is very sensitive to the reaction conditions. Though encapsulation of the amine
adduct is achieved, the microcapsules tend to be very large and agglomerate together.
Further investigation of the free radical in-situ polymerization process is needed. More
specifically, studies on how the second crop is formed and what kind of influences the
second crop has on the production and properties of the IDEO microcapsules are needed.
Other variables such as solid content, surfactant concentration, and mixing should be
thoroughly addressed. Production of large quantities of microcapsules is important to
have ability to perform tests on self-healing. Encapsulation by other means should be
studied in conjunction with in-situ polymerization. Methods such as spray drying and co-
extrusion could be used to encapsulate an amine or the amine adduct.
116
Proving the concept of self-healing with the two-part microcapsules system is
important to this project. After producing a significant amount of amine capsules, fracture
testing with the tapered double cantilever beam specimens should be performed to
compare healing efficiencies with the ones published by Scott White5 and the ones
achieved with DCPD capsules and Grubb's catalyst system mentioned in this thesis. A
second mechanical testing method suggested by Dr. Michal Kaperski to monitor the time
evolution of self-healing process with the Dynamic Mechanical Analyzer (DMA) is
suggested. In the present literature, there is no test proposed or proven to monitor the
dynamics of self-healing, where most methods perform tests before and after healing.
This test has the potential to supply unique data, such as the rate of the self-healing
system and also to determine if self-healing can be achieved with the continuous
variation of stress in the healing sample held in the DMA instrument.
117

LIST OF REFERENCES
1) Dry, C. Composites Structures, 1996, 35, 263-269.
2) Pang, J.W.C.; Bond, J.P. Composites: Part A: Applied Science and Manufacturing, 2005, 36, 183-188.
3) Pang, J.W.C.; Bond, J.P. Composites Science and Technology, 2005, 65, 1791-1799.
4) Bleay, S.M.; Loader, C.B.; Hawyes, V.J.; Humberstone, L.; Curtis, P.T. Composites: Part A, 2001, 32, 767 -1776.
5) E.N. Brown; N.R Sottos; S.R White. Experimental Mechanics, 2002, 42, 372-379.
6) A.S. Jones; J.D. Rule; J.S. Moore; N.R Sottos; S.R White. Journal of the Royal Society Interface, 2007, 4, 13, 395-403.
7) M. R Kessler; S.R White. Composites Part A: Applied Science and Manufacturing, 2001, 32, 5, 683-699.
8) Brown, E.N.; White, S.R.; Sottos, N.R. Journal of Materials Science, 2004, 39, 1703-1710.
9) Brown, E.N.; White, S.R.; Sottos, N.R. Proceedings of the Materials Research Society, Fall 2002.
10) Wudl, F.; Chen, X.; Nutt, S.R; Shen, H. Macromolecules, 2002, 295, 1698-1702.
11) Wudl, F. Thermally re-mendable crosslinkedpolymers, United States Patent Application: 20040014933, January 22, 2004
12) Toohey, Kathleen S.; Nancy R. Sottos; Jennifer A. Lewis; Jeffrey S. Moore; Scott R. White.. Letters to Nature, June 2007.
13) Williams G.J.; Trask R.S.; Bond LP. A Self-Healing Carbon Fibre Reinforced Polymer for Aerospace Applications, 12th European Conference on Composite Materials, Biarritz, France, Aug.29-Sept. 1, 2006.
14) Trask, R.S.; Bond, J.P. Smart Materials Structures, 2006, 15, 704-710.
15) www.merriam-webster.com
16)Bejan, A.; Lorente, S.; Wang, K.-M. Journal of Applied Physics, 2006, 100.
118

17) Therriault D.; Robert F. Shepard; Scott R. White; Jennifer A. Lewis; Advanced Materials, 2005, 17,4.
18) Rule J.D.; E.N. Brown; N.R Sottas; S.R White; J.S. Moore; Advanced Materials, 2005, 17, 2, 205-208.
19) E.N. Brown; M.R Kessler; N.R Sottas; and S.R White; In Situ poly(urea-formaldehyde) microencapsulation ofdicyclopentadiene, Submitted to Journal of Microencapsulation, 2003.
20) Ghosh S.K. Functional Coatings by Polymer Microencapsulation, Wiley-VCH Verlag GmbH & Co., 2006.
21) Kondo A. Microcapsule Processing and Technology, University Microfilms International: Michigan, 1992.
22) Courtney T.H. Mechanical Behavior of Materials second ed., McGraw Hill: Boston, 2000.
23) http://www.matter.org.uk/glossary/index.asp?dbid=l 71
24)Beres, W.; A. K. Koul; R. Thamburaj ; Journal of Testing and Evaluation, JTEVA, 1997, 25, 536-542.
25) Sundberg D.C.; J.P Claverie; Y.G Durant; Innovative Multifunctional Anti-Corrosion Coatings Semi-Annual Report January 15, 2006.
26) Weast R.C. Handbook of Chemistry and Physics 50th Edition, 1969-1970, F-31.
27) Gupta, R.K. Polymer and Composite Rheology Second Edition Revised and Expanded, Marcel Dekker: New York, 2000.
28) Kessler, M.R; White, S.R. Journal of Polymer Science: Part A: Polymer Chemistry, 2002, 40, 2373-2383.
29) Sundberg D.C., J.P Claverie, Y.G Durant. Innovative Multifunctional Anti-Corrosion Coatings Semi-Annual Report December 23, 2004.
30) Sundberg D.C., J.P Claverie, Y.G Durant. Innovative Multifunctional Anti-Corrosion Coatings Semi-Annual Report June 30, 2005.
31) K. Dietrich; H. Hernia; R Nastke; E. Bonatz; W. Tiege; Acta Polymerica, 1989, 40,243-251.
119

32) Yoshizawa, H. E.; Kamio Hirabayashi; J. Jacobson; Y. Kitamura; Journal of Microencapsulation, 2004, 21, 241-249.
33) Vergnaud J.M.; T.M. Aminabhavi; H.T.S. Phayde; J.D. Ortego; Polymer 1996, 37, 1677-1684.
34) Odian G. Principles of Polymerization 4th ed. Wiley Interscience: New York, 2004.
35) Willett P.S.; R.D. Wald; R.S. Frank; R. Carrozzella; Water-based Adhesive Compositions with Polyamine Curative and Binder, United States Patent Application US2004/0258922 Al, Dec. 23, 2004.
36) Howard, P.H,; Meylan, W.M. Handbook of Physical Properties of Organic Chemicals. Lewis Publisher: Boca Raton, 1997.
37) www.Chemsilico.com
38) Sundberg D.C., Y.G Durant. Innovative Multifunctional Anti-Corrosion Coatings Semi-Annual Report June 13, 2007.
39) McMurray, J. Organic Chemistry 6th ed. Thomson:United Stated 2004.
40) Beck, Charles L., Diffusion Controlled Delivery ofAntifouling Agents from marine coatings; Masters of Science Thesis University of New Hampshire 1997, 150-153.
41) http://www.wako-chem.co.jp/specialty/oilazo/V-65.htm
42) www.Wikipedia.com
43) Sarac, A.S. Progress in Polymer Science 1999, 24, 149-1204.
44)Tsavalas J.G.; F.J Schork; Hans de Brouwer; Michael J. Montiero; Macromolecules,, 2001, 34, 3938-3945.
45) Sundberg, D.C., Stubbs J.; Carrier R. Kmorph 3 Software. University of New Hampshire 2005.
46) ACD/HNMR ver. 1.0, ACD/Labstm
47) ACD/CNMR ver. 1.1, ACD/Labstm

APPENDICES
121

APPENDIX A
Hydrodynamic Flow Calculations for the One Part Autonomous Self Healing System
122

The surface tension and viscosity values of Dicyclopentadiene are taken as 28.8 dynes/cm and 0.01 poise respectively.
Time to fill crack length varing crack radii with a contact angle of 30°
0.0025
0.002
2 0.0015
jZ 0.001
0.0005
—•—radius=5um
-m— radius=15um
radius=25um
x radius=35um
x radius=40um
—•—radius=50um
50 100 150
Crack length (um)
200 250
Figure A-l: Plot of time required to fill various crack lengths and crack radii with a contact angle of 3 0°
Time to fill crack length varying crack radii with a contact angle of 45°
0.003
0.0025
£ 0.002
jjj 0.0015
i2 0.001
0.0005
0
•radius=5um
• radius=15um
radius=25um
radius=35um
• radius=40um
-radius=50um
50 100 150
Crack Length (um)
200 250
Figure A-2: Plot of time required to fill various crack lengths and crack radii with a contact angle of 45°
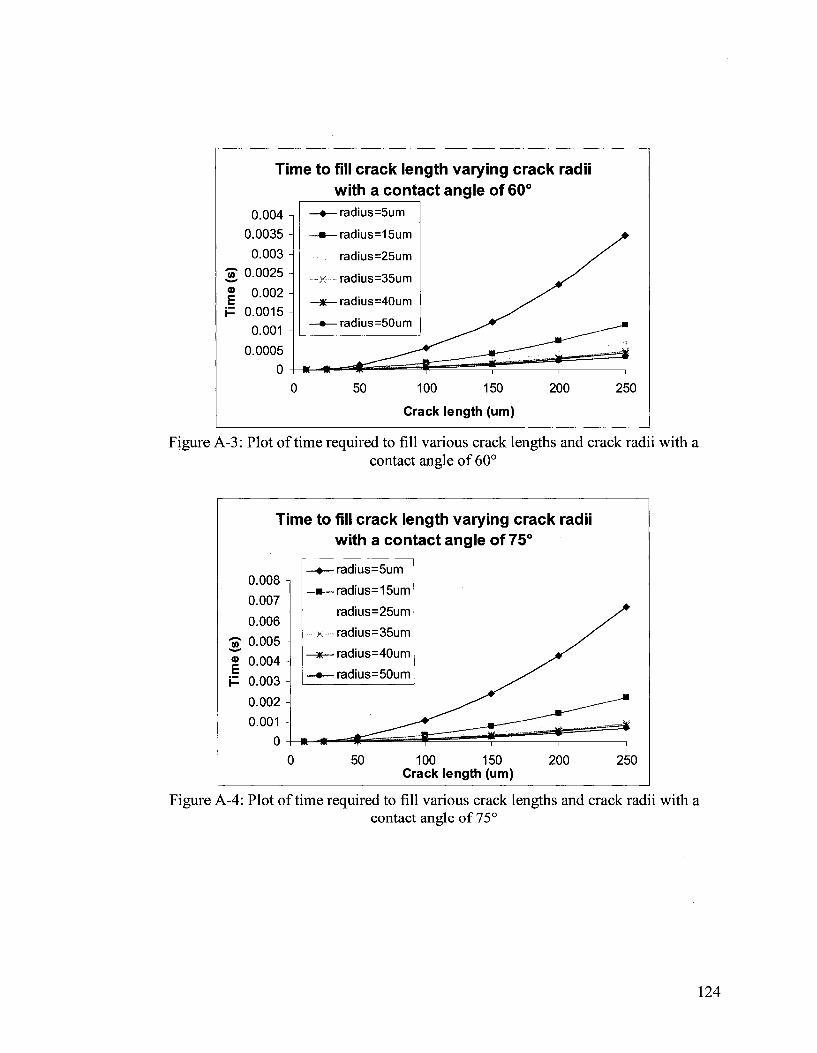
Time to fill crack length varying crack radii with a contact angle of 60°
0.004 -,
0.0035 -
0.003
2 0.0025 -
| 0.002 -
H 0.0015 -
0.001
0.0005
0 -•
0 50 100 150 200 250
Crack length (um)
Figure A-3: Plot of time required to fill various crack lengths and crack radii with a contact angle of 60°
Time to fill crack length varying crack radii with a contact angle of 75°
0.008
0.007
0.006
•£ 0.005
" | 0.004
H 0.003
0.002 -
0.001
0
Figure A-4: Plot of time required to fill various crack lengths and crack radii with a contact angle of 75°
-•— radius=5um
•m— radius=15um
50 100 150 200 250 Crack length (um)
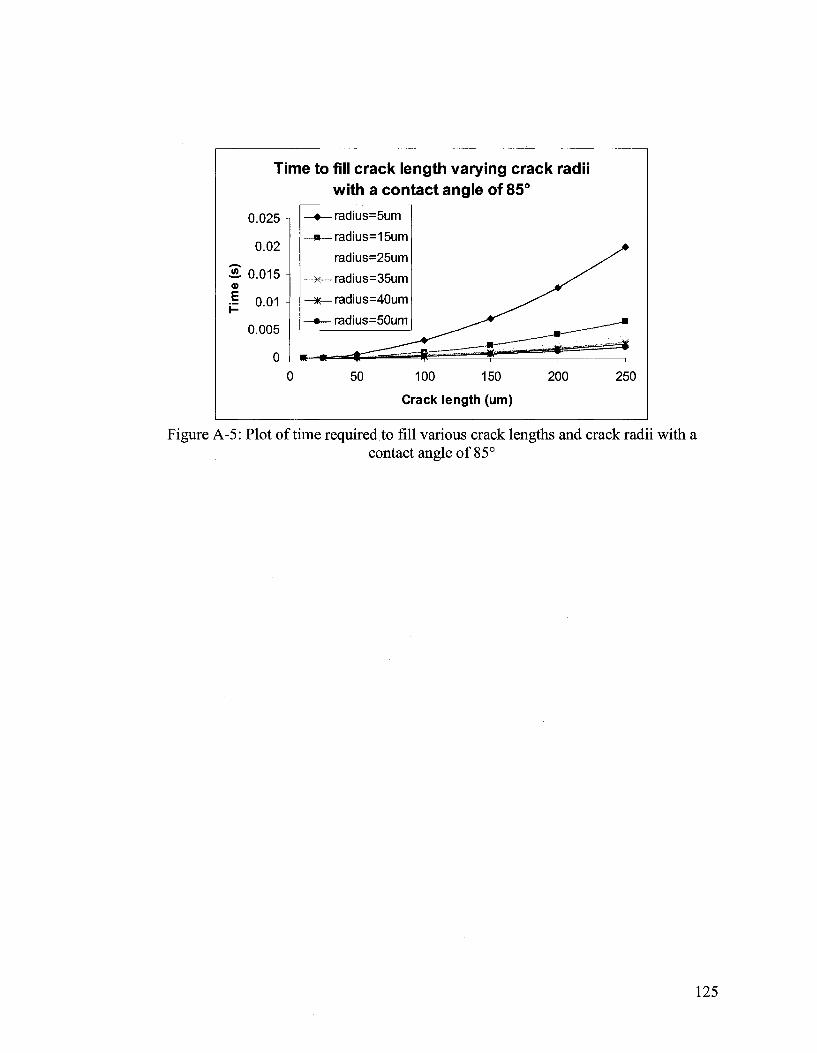
Time to fill crack length varying crack radii with a contact angle of 85°
0.025
0.02
2 0.015 a>
I 0.01
0.005
0
• radius=5um
-radius=15um
radius=25um
radius=35um
• radius=40um
-radius=50um
50 100 150
Crack length (urn)
200 250
Figure A-5: Plot of time required to fill various crack lengths and crack radii with a contact angle of 85°

Time Required to fill a 10um Crack vs. Contact Angle Varying Crack Radius
0.000035
0.00003
§" 0.000025 c 8 0.00002 » «£. 0.000015 <D
.§ 0.00001
0.000005
0 30
-Radius=5um
-Radius=15um
Radius=25um
Radius=35um
- Radius=40um
- Radius=50um
40 50 60 70
Contact Angle (degrees) 80
Figure A-6: Plot of time required to fill a lOum crack varying crack radii and contact angles.
Time Required to fill a 50um Crack vs. Contact Angle Varying Crack Radius
V) •o c o u Q)
0)
E
0.0009
0.0008
0.0007
0.0006
0.0005
0.0004
0.0003
0.0002
0.0001
0 *
30
• Radius=5um
• Radius=15um
Radius=25um
Radius=35um
• Radius=40um
• Radius=50um
40 50 60 70
Contact Angle (degrees)
80
Figure A-7! Plot of time required to fill a 50um crack varying crack radii and contact angles.
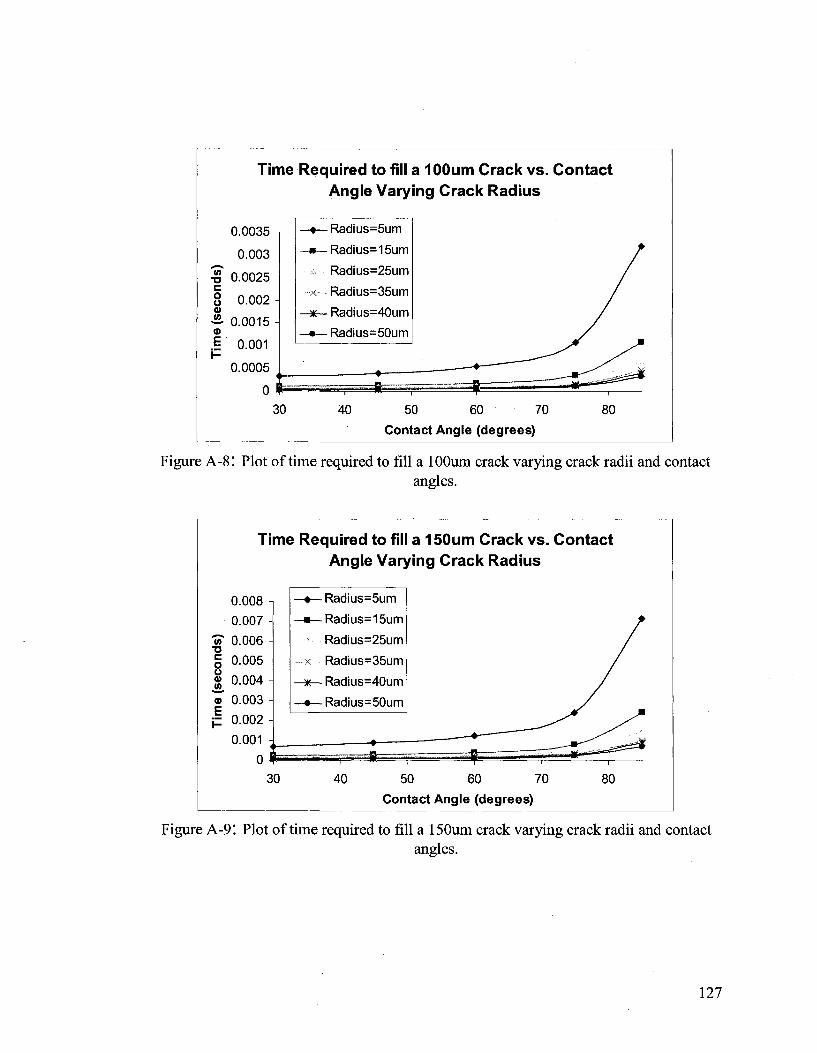
Time Required to fill a 100um Crack vs. Contact Angle Varying Crack Radius
0.0035
0.003
0.002
•S 0.0025 c o u £• 0.0015 a> .§ 0.001 H
0.0005
0 *
-•— Radius=5um
-m— Radius=15um
Radius=25um
~x__ Radius=35um
—3K— Radius=40um
-•— Radius=50um
3fc 30 40 50 60 70
Contact Angle (degrees) 80
Figure A-8! Plot of time required to fill a lOOum crack varying crack radii and contact angles.
Time Required to fill a 150um Crack vs. Contact Angle Varying Crack Radius
0.008
0.007
In 0.006
§ 0.005
® 0.004
"aT 0.003
jZ 0.002
0.001
0
30
-*-
• Radius=5um
• Radius=15um
Radius=25um
Radius=35um
• Radius=40um
• Radius=50um
40 50 60 70
Contact Angle (degrees) 80
Figure A-91 Plot of time required to fill a 150um crack varying crack radii and contact angles.

Time Required to fill a 200um Crack vs. Contact Angle Varying Crack Radius
0.014
0.012
% 0.01 c 8 0.008 <u & 0.006 a> .§ 0.004 i -
0.002 0 $
30
-•— Radius=5um
-•— Radius=15um
Radius=25um
x Radius=35um
-*— Radius=40um
-•— Radius=50um
40 50 60 70
Contact Angle (degrees)
80
Figure A-101 Plot of time required to fill a 200um crack varying crack radii and contact angles.
(A •o c o u
<u E
Time Required to fill a 250um Crack vs. Contact Angle Varying Crack Radius
0.025
0.02
0.015
0.01
0.005
0 30
-•— Radius=5um
-•— Radius=15um
Radius=25um
K— Radius=35um
-*— Radius=40um
-•— Radius=50um
40 50 60 70
Contact Angle (degrees)
80
Figure A-l 1: Plot of time required to fill a 250um crack varying crack radii and contact angles.
APPENDIX B
Dicyclopentadiene Microcapsule DSC and Payload Data
129
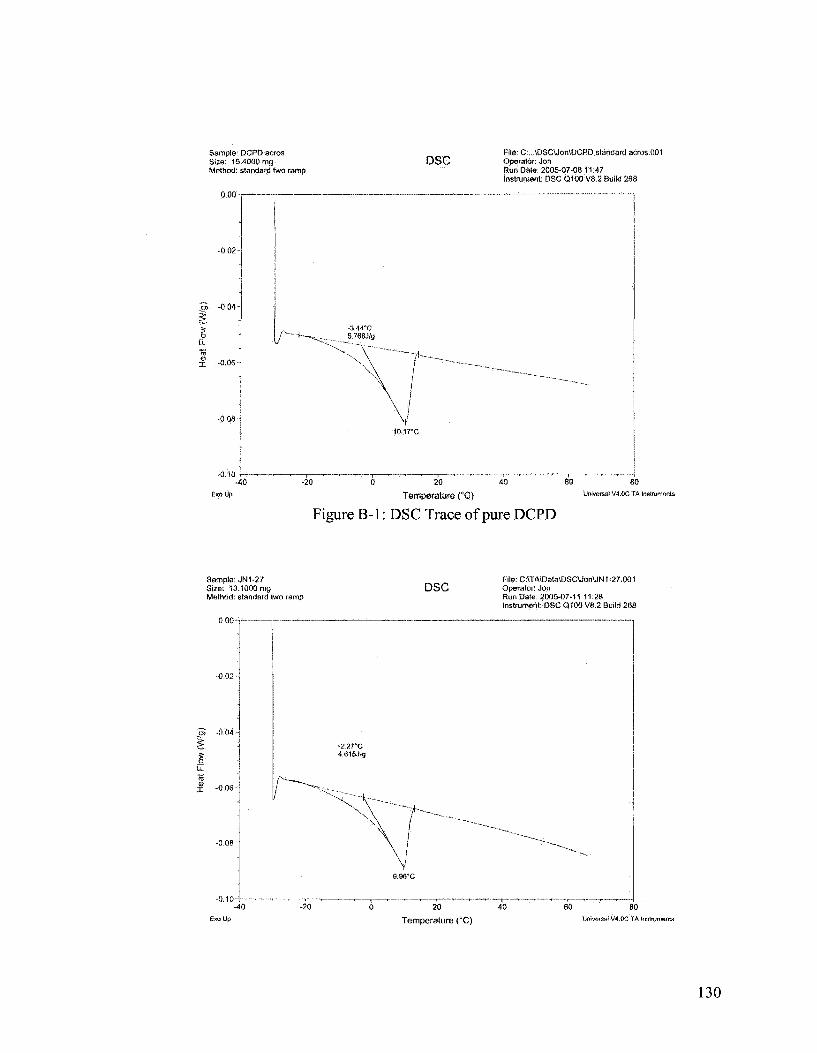
Sample: DCPD acros Size: 15.4000 mg Method: standard two ramp
DSC Pile: C:,.ADSC\Jon\DCPD standard acros.001 Operator: Jon Run Date: 2005-07-08 11:47 Instrument: DSC Q100 V8.2 Build 288
5. i
-0.02-
-0.04-
-0.06-
-0.08 -
-0.10
/ - i - ^ . -3.44*0
___ 5.766J/g
\ / ^ ^
V 10.17*0
~~~
' ( ' •' '
-40 -20
Temperature (°C) Universal V4.0C TA Instalments
Figure B-l: DSC Trace of pure DCPD
Sample: JN1-27 Size: 13.1000 mg Method: standard two ramp
DSC File: C:\TA\Data\DSCUonUN1-27.001 Operator: Jon Run Date: 2005-07-11 11:28 Instrument; DSC Q100 V8.2 Build 268
-0,02 -
Ex*jtjp Temperature (°C)
60 80 Universal V4.0C TA instruments
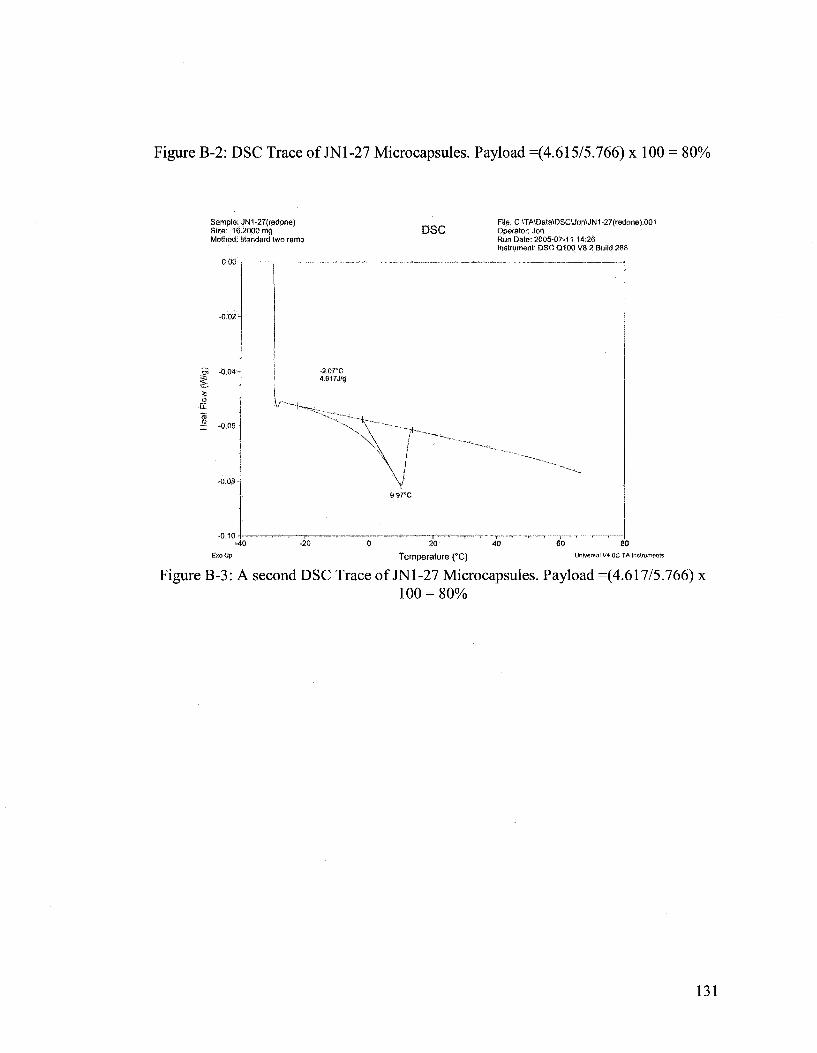
Figure B-2: DSC Trace of JN1-27 Microcapsules. Payload =(4.615/5.766) x 100 = 80%
Sample; JN1-27(redone) Size: 16.2000 mg Method: standard two ramp
DSC
Di -0.04 -
8
X -0 06 -
Fite;C:VrAVData\DSCUortJN1-27(redone).001 Operator: Jon Run Date: 2005-07-11 14:26 Instrument: DSC Q100 V8.2 Build 268
-2,07*C 4.617.1%
• • U ,^
\ \ / "*"* N \ /
\ / 9,»7*C
—*
,~~--~^»..
-20 eo Temperature (*C)
80 Universal V4 0C TA Instruments
Figure B-3: A second DSC Trace of JN1-27 Microcapsules. Payload =(4.617/5.766) x 100 = 80%
131

Sample: JN1-29(2nd) Size: 17.1000 mg Method: standard two ramp
DSC File:MTA\DataVDSCUonUN1-29(2nd).002 Operator: Run Date: 2005-07.18 10:18 Instrument; DSC Q100 V8.2 Build 268
Temperature ( X ) Universal V4.0C TA Instruments
Figure B-4: DSC Trace of JN1-29 Microcapsules. Payload =(4.307/5.766) x 100 = 74.6%
132

Appendix C
Hydrodynamic Flow Calculations for the Two Part Autonomous Self Healing System
133
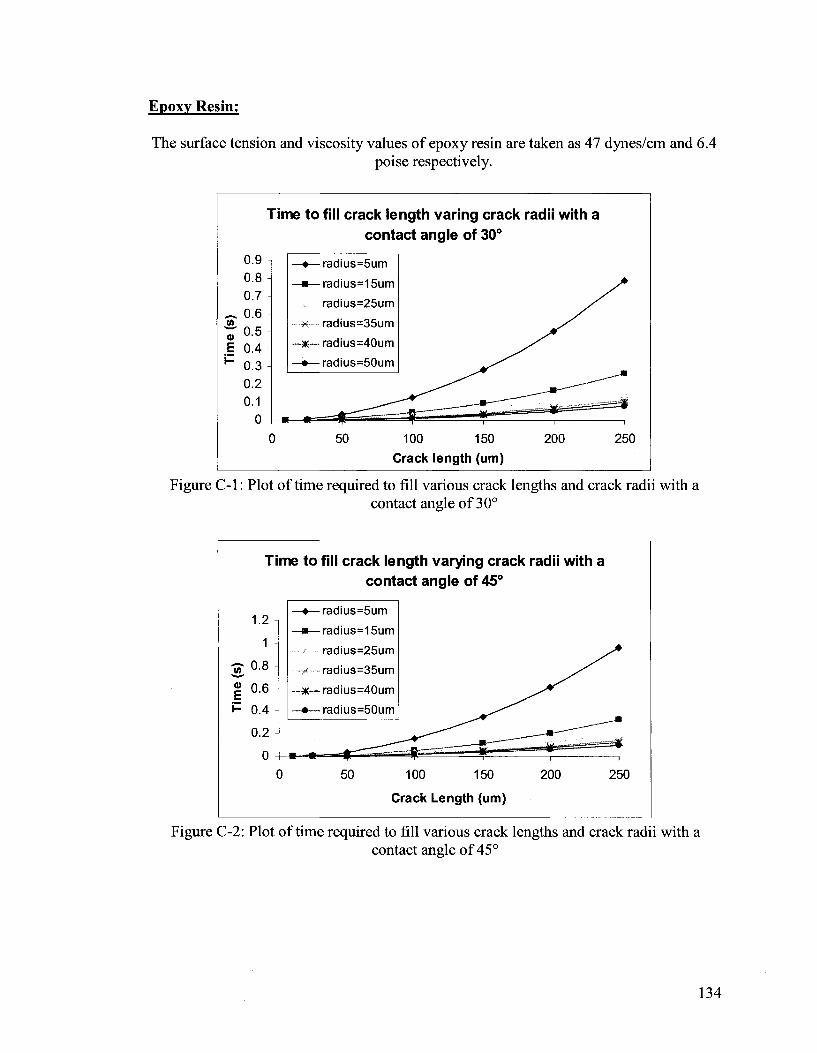
Epoxy Resin:
The surface tension and viscosity values of epoxy resin are taken as 47 dynes/cm and 6.4 poise respectively.
Time to fill crack length varing crack radii with a contact angle of 30°
0.9 0.8 0.7 0.6 0.5 0.4 0.3 0.2 0.1
0
-•—radius=5um
-•—radius=15um
radius=25um
~x— radius=35um
H*—radius=40um
-•—radius=50um
50 100 150
Crack length (urn) 200 250
Figure C-l: Plot of time required to fill various crack lengths and crack radii with a contact angle of 30°
E
Time to fill crack length varying crack radii with a contact angle of 45°
1.2 -,
1 -
^ 0 . 8
0.6
0.4
0.2
0
—•—radius=5um
-Hi—radius=15um
radius=25um
x-radius=35um
- * — radius=40um
-•—radius=50um
50 100 150
Crack Length (urn)
200 250
Figure C-2: Plot of time required to fill various crack lengths and crack radii with a contact angle of 45°
134

Time to fill crack length varying crack radii with a contact angle of 60°
1.6 1.4 1.2
1 0.8 0.6 0.4 0.2
0
-•—radius=5um
-•— radius=15um
radius=25um
-x-radius=35um
-*-—radius=40um
-•—radius=50um
50 100 150
Crack length (um)
200 250
Figure C-3: Plot of time required to fill various crack lengths and crack radii with a contact angle of 60°
Time to fill crack length varying crack radii with a contact angle of 75°
3
2.5
^ 2
•" 1.5
F 1
0.5
0
-radius=5um
-radius=15um
radius=25um
radius=35um
- radius=40um
-radius=50um
50 100 150 Crack length (um)
200 250
Figure C-4: Plot of time required to fill various crack lengths and crack radii with a contact angle of 75°

Time to fill crack length varying crack radii with a contact angle of 85°
10
8
.2. 6 0)
-•— radius=5um
-•— radius=15um
radius=25um
< - radius=35um
-*— radius=40um
-•— radius=50um
50 100 150
Crack length (um)
200 250
Figure C-5: Plot of time required to fill various crack lengths and crack radii with a contact angle of 85°
136

Time Required to fill a 10um Crack vs. Contact Angle Varying Crack Radius
0.014
0.012
M 0.01 c 8 0.008 o> •52- 0.006 a> .1 0.004
-•—Radius=5um
-•— Radius=15um
Radius=25um
K Radius=35um
-*— Radius=40um
-Radius=50um
0.002
0 $ 30 40 50 60 70
Contact Angle (degrees) 80
Figure C-6I Plot of time required to fill a lOum crack varying crack radii and contact angles.
Time Required to fill a 50um Crack vs. Contact Angle Varying Crack Radius
0.35
0.3
0.25
0.2
& 0.15
</) •o c o o 0)
0)
E 0.1
0.05
0 # 30
• Radius=5um
-Radius=15um
Radius=25um
Radius=35um
- Radius=40um
- Radius=50um
40 50 60 70
Contact Angle (degrees) 80
Figure C-7I Plot of time required to fill a 50um crack varying crack radii and contact angles.
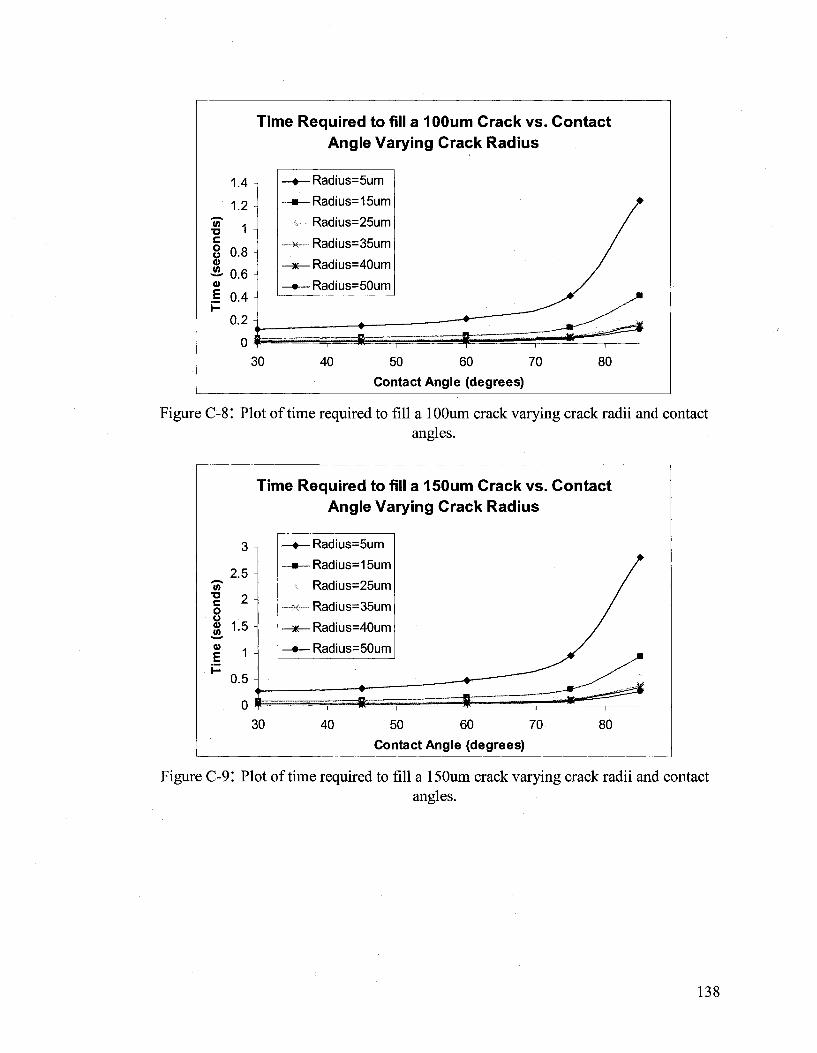
Time Required to fill a 100um Crack vs. Contact Angle Varying Crack Radius
1.4
1.2
•o 1
8 0.8
«& 0.6
0.4
0.2
0 * 30
-Radius=5um
-Radius=15um
Radius=25um
Radius=35um
- Radius=40um
- Radius=50um
40 50 60 70
Contact Angle (degrees)
80
Figure C-8! Plot of time required to fill a lOOum crack varying crack radii and contact angles.
Time Required to fill a 150um Crack vs. Contact Angle Varying Crack Radius
3
^ Z 5 "ST 1 2 o o 81 1-5 I 1 P 0.5
0
-•—Radius=5um
-•— Radius=15um
Radius=25um
x Radius=35um
-3R—Radius=40um
-•—Radius=50um
30 40 50 60 70
Contact Angle (degrees) 80
Figure C-9: Plot of time required to fill a 150um crack varying crack radii and contact angles.

(A
C o u ©
Time Required to fill a 200um Crack vs. Contact Angle Varying Crack Radius
1
0 *• 30
-•—Radius=5um
-•— Radius=15um
Radius=25um
Radius=35um
-*— Radius=40um
-•— Radius=50um
40 50 60 70
Contact Angle (degrees) 80
Figure C-10: Plot of time required to fill a 200um crack varying crack radii and contact angles.
9 n
8 -
1 6-8 5 m, 4 -
E 3 ~ H 2
1 ;
T
i —
me Required to fill a 250um Crack vs. Contact Angle Varying Crack Radius
—•— Radius=5um
—m— Radius=15um
Radius=25um
x Radius=35um
—*— Radius=40um
—•— Radius=50um
. - •
/
—— i<^ or ; — ; — « ^ ¥ , ' ~ — ,
30 40 50 60 70 80
Contact Angle (degrees)
Figure C-l 1! Plot of time required to fill a 250um crack varying crack radii and contact angles.
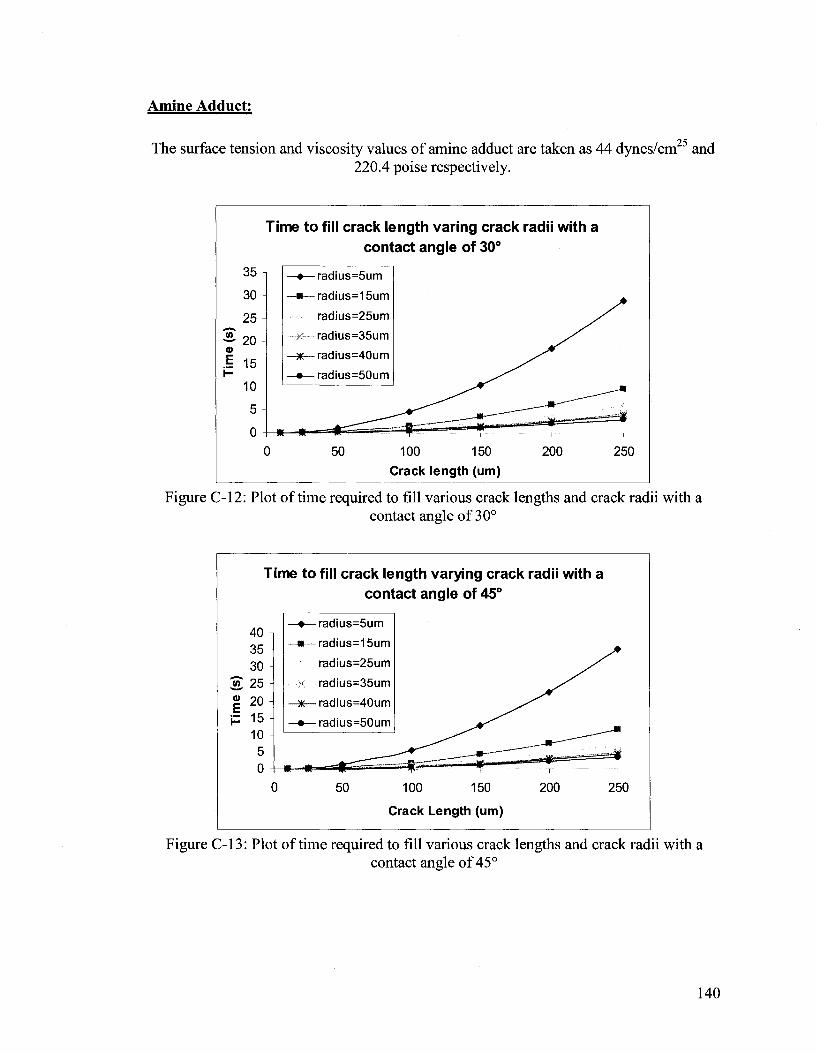
Amine Adduct:
The surface tension and viscosity values of amine adduct are taken as 44 dynes/cm25 and 220.4 poise respectively.
Time to fill crack length varing crack radii with a contact angle of 30°
35
30
25
o .§ 15 h-
10
5
0
-•—radius=5um
-•—radius=15um
radius=25um
x radius=35um
- ts— radius=40um
-•—radius=50um
50 100 150
Crack length (um)
200 250
Figure C-12: Plot of time required to fill various crack lengths and crack radii with a contact angle of 30°
Time to fill crack length varying crack radii with a contact angle of 45°
40 35 30
2 25 <D
E 20 15 10 5 0
-•—radius=5um
-•—radius=15um
radius=25um
x radius=35um
-&— radius=40um
-•—radius=50um
50 100 150
Crack Length (um)
200 250
Figure C-13: Plot of time required to fill various crack lengths and crack radii with a contact angle of 45°
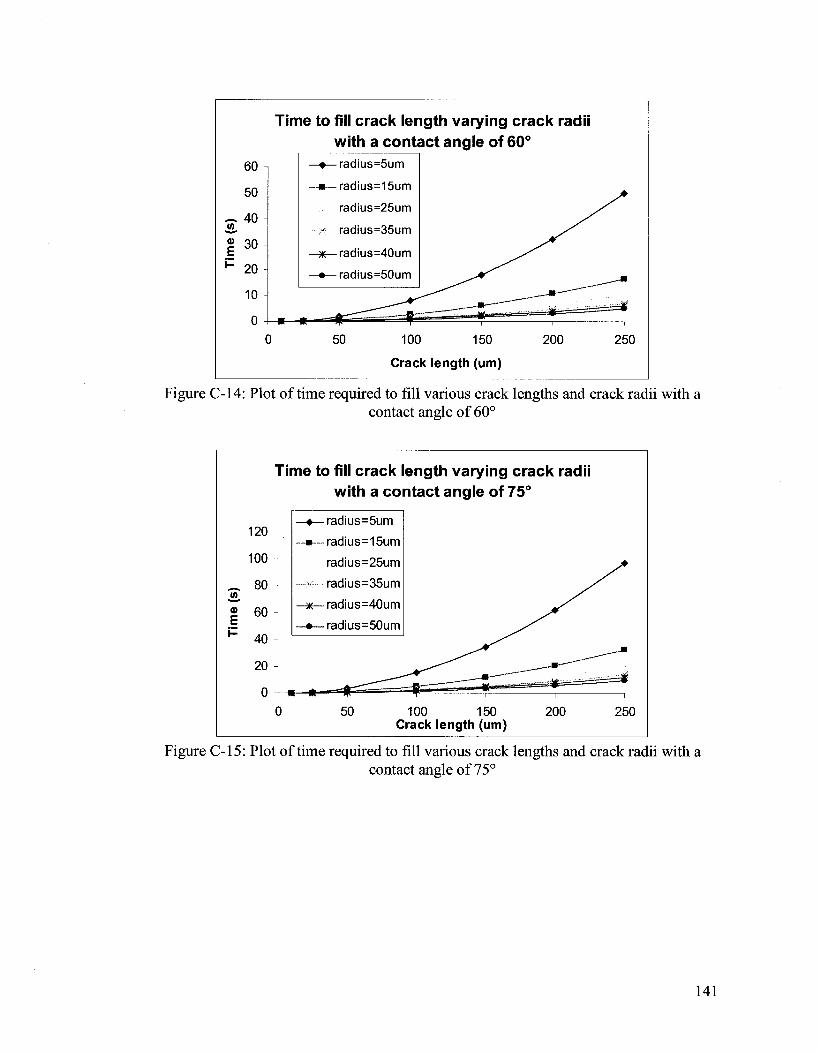
Time to fill crack length varying crack radii with a contact angle of 60°
2 T
ime
60
50
40
30
20
10
0
-•—radius=5um
-•—radius=15um
radius=25um
x radius=35um
-*— radius=40um
-•—radius=50um
50 100 150
Crack length (urn)
200 250
Figure C-14: Plot of time required to fill various crack lengths and crack radii with a contact angle of 60°
Time to fill crack length varying crack radii with a contact angle of 75°
120
100
^ 80
Q)
E 60
40
20
0
-•— radius=5um
-»—radius=15um
radius=25um
-y rad ius=35um
-*— radius=40um
- radius=50um
0 50 100 150 Crack length (um)
200 250
Figure C-15: Plot of time required to fill various crack lengths and crack radii with a contact angle of 75°

Time to fill crack length varying crack radii with a contact angle of 85°
350
300
250
2 200
E 150 H 100
50
0
—«—radius=5um
-*— radius=15um
radius=25um
._*_. radius=35um
—*— radius=40um
—•— radius=50um
50 100 150
Crack length (um)
200 250
Figure C-16: Plot of time required to fill various crack lengths and crack radii with a contact angle of 85°
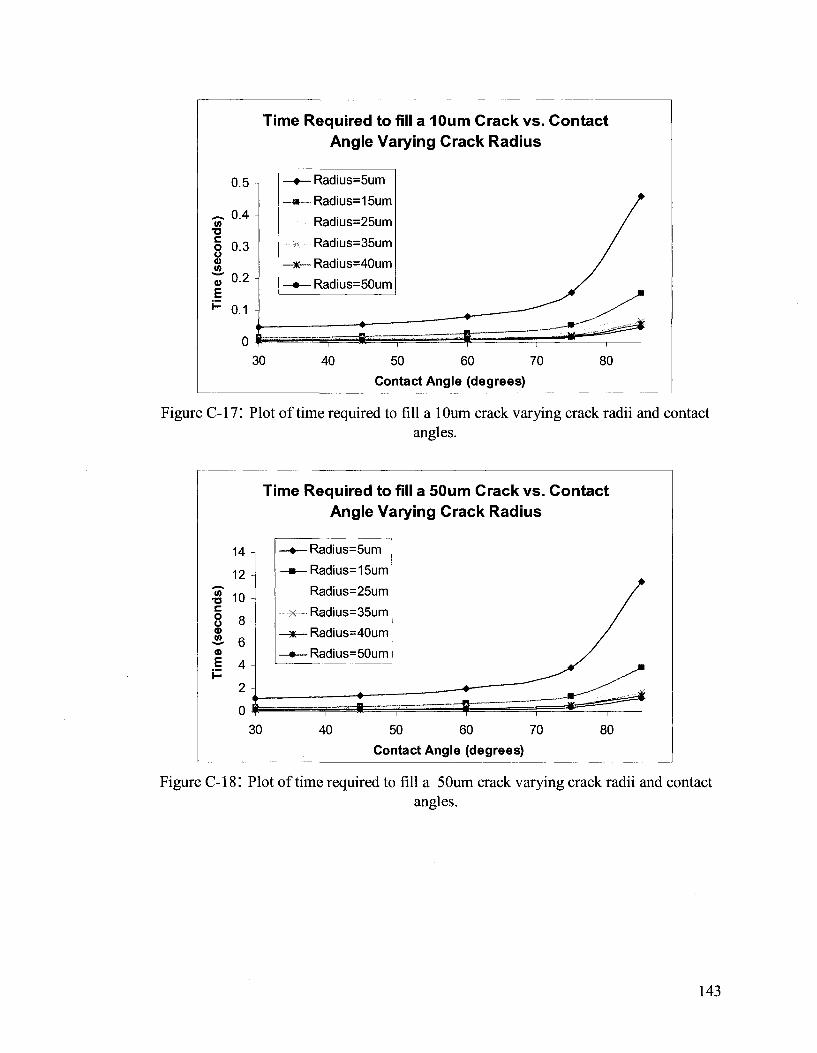
Time Required to fill a 10um Crack vs. Contact Angle Varying Crack Radius
0.5
~ 0.4 w •o
§ 0-3 w
V °-2
E 0.1
-Radius=5um
-Radius=15um
Radius=25um
Radius=35um
- Radius=40um
- Radius=50um
30 40 50 60 70
Contact Angle (degrees) 80
Figure C-IT. Plot of time required to fill a lOum crack varying crack radii and contact angles.
•a c o u o 3. CD
E
14
12
10
8
6
4
2
0
Time Required to fill a 50um Crack vs. Contact Angle Varying Crack Radius
-•— Radius=5um
-•— Radius=15um
Radius=25um
x Radius=35um
-^—Radius=40um
-•—Radius=50um
30 40 50 60 70
Contact Angle (degrees)
80
Figure C-l 8'. Plot of time required to fill a 50um crack varying crack radii and contact angles.
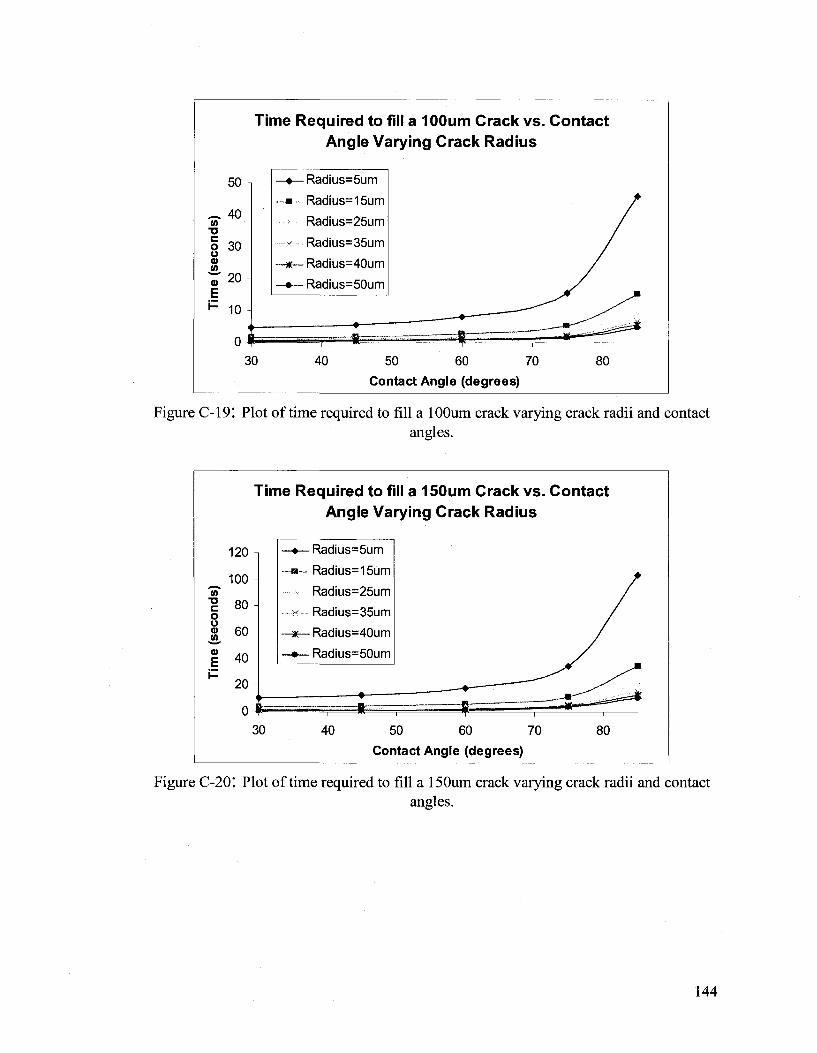
(0 TJ C o o 0)
a> E
Time Required to fill a 100um Crack vs. Contact Angle Varying Crack Radius
50
40
30 •]
20
10
- * -
-Radius=5um
•Radius=15um
Radius=25um
Radius=35um
•Radius=40um
•Radius=50um
30 40 50 60 70
Contact Angle (degrees)
80
Figure C-19I Plot of time required to fill a lOOum crack varying crack radii and contact angles.
w T3 c o o 0)
<o E
Time Required to fill a 150um Crack vs. Contact Angle Varying Crack Radius
120
100
80
60
40
20
- * -
- Radius=5um
-Radius=15um
Radius=25um
Radius=35um
-Radius=40um
-Radius=50um
30 40 50 60 70
Contact Angle (degrees)
80
Figure C-20: Plot of time required to fill a 150um crack varying crack radii and contact angles.
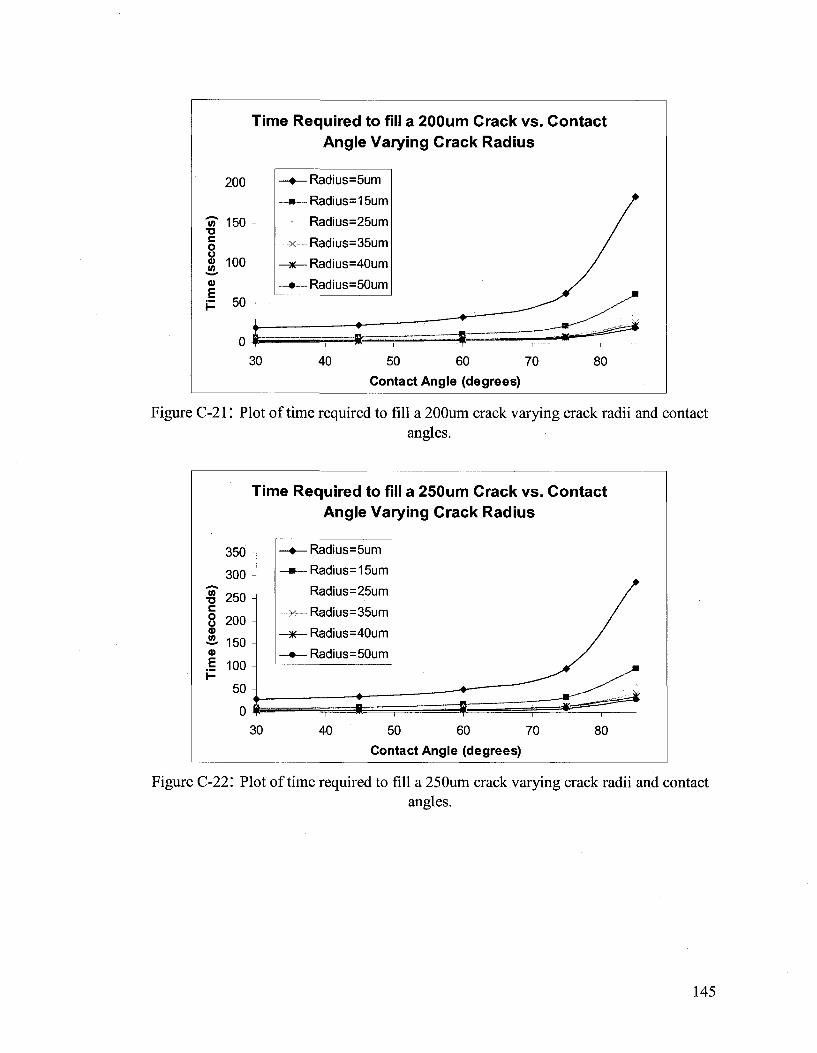
Time Required to fill a 200um Crack vs. Contact Angle Varying Crack Radius
200
w 150 •a c o I 100 a>
I 50
-•— Radius=5um
-•— Radius=15um
Radius=25um
-x— Radius=35um
-*— Radius=40um
-*—Radius=50um
30 40 50 60 70
Contact Angle (degrees) 80
Figure C-21; Plot of time required to fill a 200um crack varying crack radii and contact angles.
Time Required to fill a 250um Crack vs. Contact Angle Varying Crack Radius
350
300
¥ 250 c 8 200 <u
«£• 1 5 0 a>
.§ 100
50
0
-•— Radius=5um
-•— Radius=15um
Radius=25um
x Radius=35um
-*— Radius=40um
-•— Radius=50um
30 40 50 60 70
Contact Angle (degrees) 80
Figure C-22: Plot of time required to fill a 250um crack varying crack radii and contact angles.

Appendix D
Amine Adducts
146

Adduct 1: 1 mol DETA + 2 mol 1,2-Epoxyoctane
*note shown as DETA with epoxyhexane Log P =-1.4 Log P (without OH) = 0.18 Log P (without OH and middle N) = 2.1
Adduct 2: 1 mol 4,4 Diaminodicyclohexylmethane + 2 mol 1,2 Epoxyh
Log P= 1.02
Adduct 3: 1 mol 1, 6 Diaminohexane + 2 mol 1,2 Epoxyhexane
Log P = -0.26 (with OH) Log P = 1.82 (without OH)

Adduct 4: 1 mol TETA + 2mol Benzaldehyde
\ \ /) = N ^ " ^ ^ ^ ^ \ / ^ \ ^ / N — K /
L/ N ^ \=/ Log P = 0.04 Log P (if nitrogen changed to carbon) = 4.56 Log P (if added a methyl group to each benzene ring) =1.68 Log P (if added a ethyl group to each benzene ring) =1.9
Adduct 5: MDI + H20 and alkylation of amines (with methyl/ethyl bromide)
And (mixture)
Log P = unknown
Adduct 6: 1, 6 diaminohexane + benzaldehyde +catalyst
Log P = -0.07 Log P (with nitrogen changed to C) = 5.47 Log P (with nitrogen changed to C-OH) = 3.14
Appendix E
NMR Data of IDEO Adduct and Starting Components
149

1,2-Epoxyoctane:
to
I ,
\ t (N
<o
m
/ '
GO
/
W
%
frag
3
n
S5r
OT
lift riWfWPT'"'1'"'1 '•" M|' '*" 'VWfWI mil I' I'M 111 HI M* »* -m'f f f'w < ipiwpmm y * # ywup^ m w P f W W W f W f f
Figure E-l: Predicted Proton NMR Spectra of 1,2-Epoxyoctane.

f ft
• to
o
13
in
n>
o o w
o
X
PWPRLO»l3058-50S-b<)-H
Epoxyoctane pure (white)
quantitative proton dl=3S seconds
Data Collected on:
lyle5~inovasaa
Archive directory:
/export/horoe/Sundberg/vnsnrsys/data
Sample directory:
File: PROTON
Pulse Sequence: sSpul
4.0
0.73
3,5
3.0
2.5
2.14
339.09
330.9!
337.31
52.11
i
z.o
1.5
1.0
0.5
-0.0
ppm

m
1M
>
\
.«?
/ *p>
/ \
55 L-. t . l ' I ' i ' lVI V|\
8 ja |s |B Is |a 9 p p g |o
Figure E-3: Predicted Carbon NMR Spectra of 1,2-Epoxyoctane.
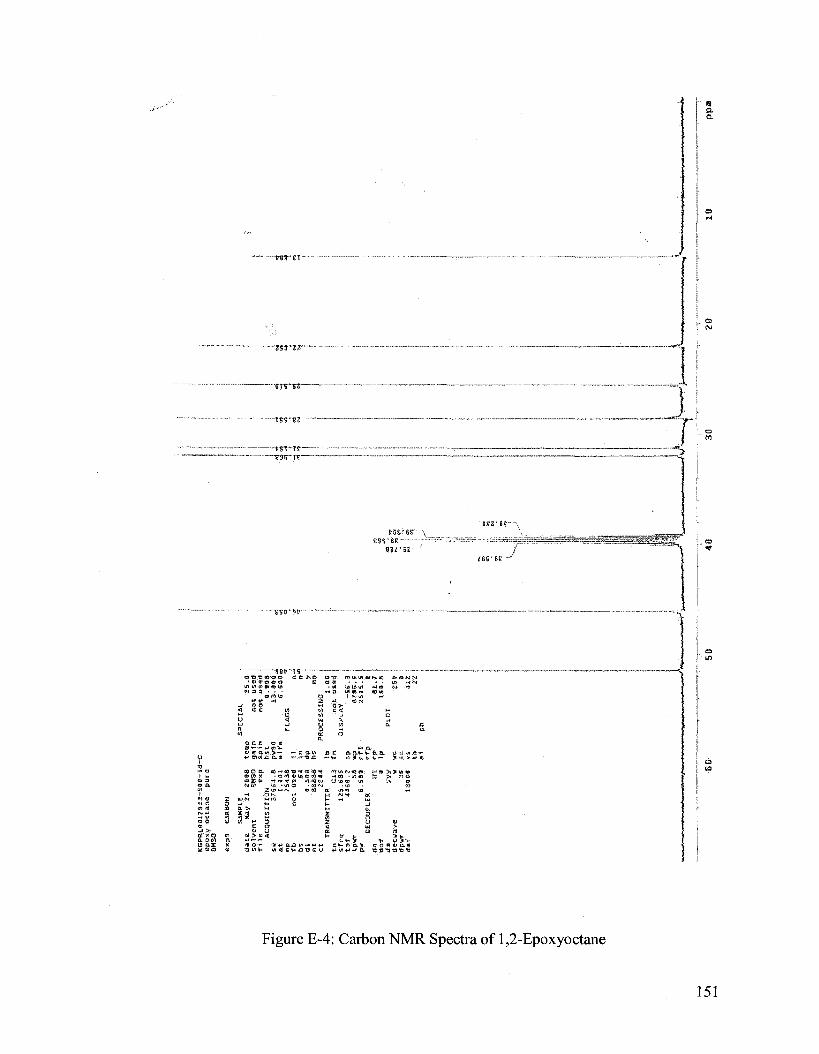
I o
C3
?0
t/3
CD
O
p o W
O
o
KG
PR
i8fU
2$
4 3
-SO
0-i
d-C
e
po
xy
OM
SO
e«
p9
da
te
oc
tan
e p
ure
CA
RS
ON
SA
MP
LE
Ha
y Z
X
Ǥ
a s
olv
en
t S
HS
O
fi
le
e*p
A
CQ
UIS
ITIO
NS
s
w
at
np
fb
bs
dl
nt
ct
37
ss
i.a
I.tt
Ol
7S
43
S
no
t u
se
d 5
4 Q
.5S
3 3
&o
*3*t
5 2
2*<
T
RA
NS
MIT
TE
R
tn
sfr
q to
r tp
wr
pw
DE
d
n d
of
da
C1
3 1
25
.68
S
44
60
.2
58
«.S
»»
CO
UP
LER
H
I * y
yy
de
cw
av
e w
d
pw
r E
tKf
3S
13
00
8
tew
p g
ain
s
pin
h
st
p^3
0 a
lfa
11
in
ap
hs
SP
ICIA
L 2
5.
0 n
ot
us
ed
no
t u
see
* -
«.«
03
13
.t
O^
6 .S
C0
« F
LA
GS
"
n- nu
y n
n P
RO
CE
SS
ING
1
6 fn
«»
*P
rf
i rr
p rs
>
ip
vc
SG
V
S
i.a
u n
ot
us
ed
0I3
PL
AY
-S
S.3
8
73
6.S
2
S1
S.S
a 8
1.7
is
o.a
P
LO
T
25
1 0 l
41
2 :
U\
60
50
40
-I
at
I 1
-J
30
20
10
pp
a
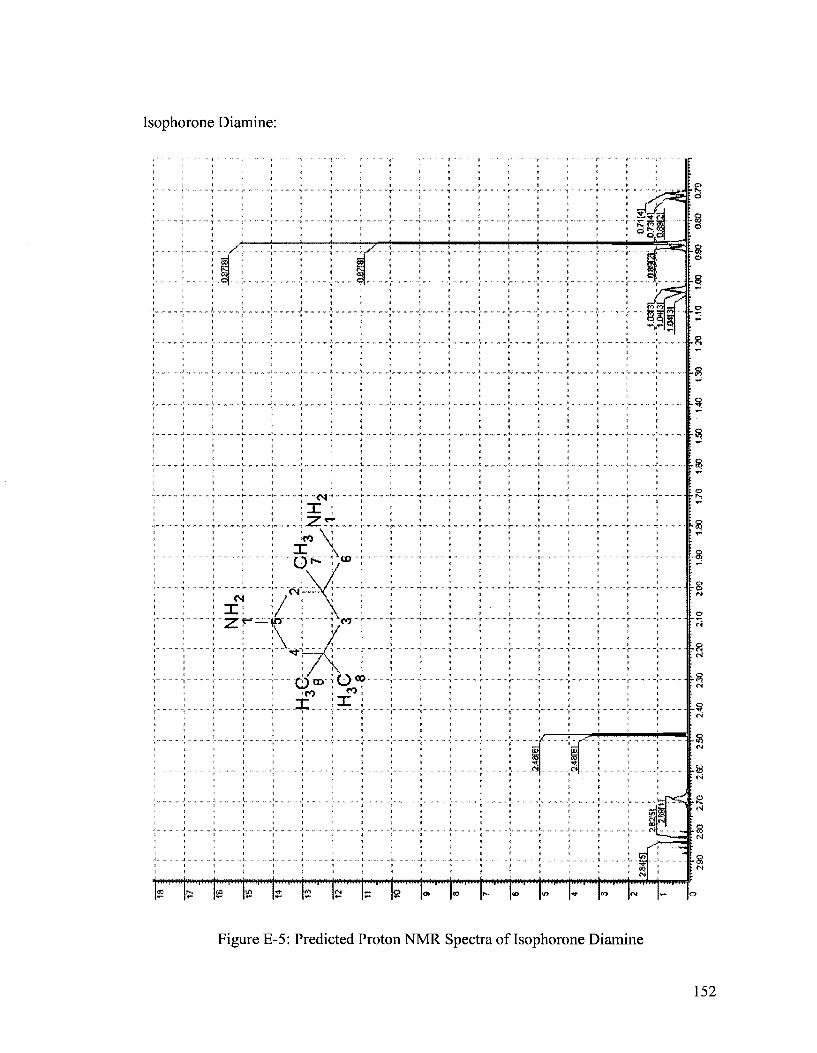
Isophorone Diamine:
' - - - r - -f" P?"
„ „ „ J „ „ „ ^ I , „ ^ ^ » .
I
„ s_ „ „*,
8
8 o
5
53
r8?
ool
JT« CA
->- - J I I PJ
pd
', %n rs uLiwmiwj^ ^i^:ijiiH»'^'m|a''<'Pi|(m|'»wrf>'^
I? F |s \& jS |S2 IS I? 1° \m \m V" I™ I" I* I" P
Figure E-5: Predicted Proton NMR Spectra of Isophorone Diamine
152
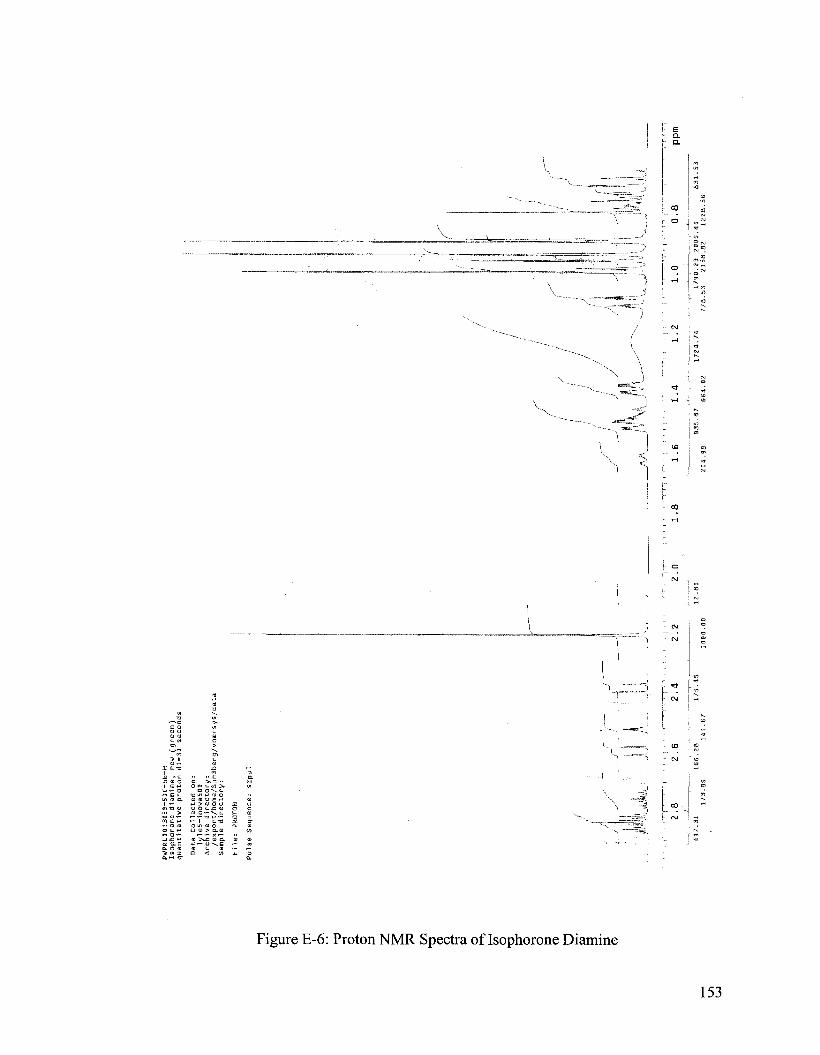
f o m
i "d
>-t o
O
ES
a o
p o
I—I
CO o
o 3 cs
O
3
PWPP.LO013059-50 0-bb-H
Isophorone diamine, new (green)
quantitative proton dl=30 seconds
Data Collected on:
Iyle5-1nova503
Archive directory:
/export/home/Sundberg/vnmrsys/data
Sample directory:
File: PROTON
Pulse Sequence: s2pul
m*.
i
,1 i
'\ !
III
'
I II
i'.il'
l .
2.8
2.6
2.4
2.2
2.0
1.8
1.6
1.4
1.2
1.0
0.8
ppm
497.31
166.28
176.45
12.80
173.39
149.67
1000.00
935.87
1724.74
1790.29 2006.46
831.53
204.98
664.02
778.53
2158.82
1228.56

— .. „ r „ hZ
• s i h--i *N
_ ™
_
_ J
L -
/
IE
f , „ r „ „ „ „
r ™r
.. ._ L
r ' " l " " | " " l
O D
. J „ - .. _ .), .. „ „ _
. . . . ^ . . . . ; . . . .
— i - - - t '- - - -
i ™
.05?;.. /:
r<bJ ! 59
i A
_ J -. _ -.- ... A „ „. „
i - - -J -
s |a |s
D
p ff „ „ - _
e
S CO CD
! ! ! i g > < i i CO
; ; : : fc j£ ~J ™, «. . . ™ J. „ „> J. _ _ : L> - , „ ,
f i i i ^j=j
; ; ; : R
• - -
A -\—'-\—!-—-
„. ! _ 4. 4. | „
-"-
o CO
- S
- i f i CO CO
~&
s
o
Co
s
- -1 7 r r
_ __ \ I I_
/ ; ; ; ;
/ ; ; ; ;
h : : i
I I M | I I I I | I I 1 l | l l l l | l l l l | l l f l | f l l l | l 1 l
|ffl |i? |R |R | I I M
- . v
J
1 — J
~^
1 _ - * — 1
J
o
1
r
L
:
r
|
\
o
Figure E-7: Predicted Carbon NMR Spectra of Isophorone Diamine
154

f o m
00 O
!•
o
S3
rc
o
f?
o
•+>
M (/!
O
13* o
i-i O
CD I 3
0 C
J j<£
- r
J
V^
Wv*
**^ p-
li
;!
w~/
U^
60
50
40
KGPRL0 012 9 4^£SOO-id-C
isophorone diamine pure
DMSO
explO
CARBON
SAMPLE
date
May 21 2 0 08
solvent
BMSO
file
exp
ACQUISITION
sw
37664.8
at
1.001
np
75438
fb
not used
bs
64
dl
0.500
nt
88888
Ct
1841
TRANSMITTER
tn
C13
Sfrq
125.685
tof
4460.2
tpwr
58
pw
6.500
DECOUPLER
dn
HI
dof
0
dm
yyy
decwave
w
dpwr
38
dmf
13000
temp
gain
spin
hst
pw9 0
alfa
11
in
dp
hs
SPECIAL
25.0
not used
not used
0. 008
13.000
6.SO0
FLAGS
n
rt
y
nn
PROCESSING
lb
fn
sp
wp
rfl
rfp
rP
IP
wc
sc
vs
1.00
not used
DISPLAY -6 3.2
8796.6
2532.8 0
139.8
-141.0
PLOT
250 0
380
iW^W-V \'
'W*»
-WIW
UM^/
^r*
**^-
J**i
#&ri
»i*&
wi»
i}i#
*
30
20
10
ppm

IDEO Adduct:
Figure E-9: Predicted Proton NMR Spectra of Di-functionalized Isophorone Diamine Adduct
156

)T
CiS-T
/ O -I
\ o?_l
H
/ I
, \J
Figure E-10: Predicted Proton NMR Spectra of a Mono-functionalized (top) Isophorone Diamine Adduct
157

t S S 2: 2 £! t 2 °> °° K "> k> •* « «
Figure E-l 1: Predicted Proton NMR Spectra of a Mono-functionalized (top) Isophorone Diamine Adduct
158
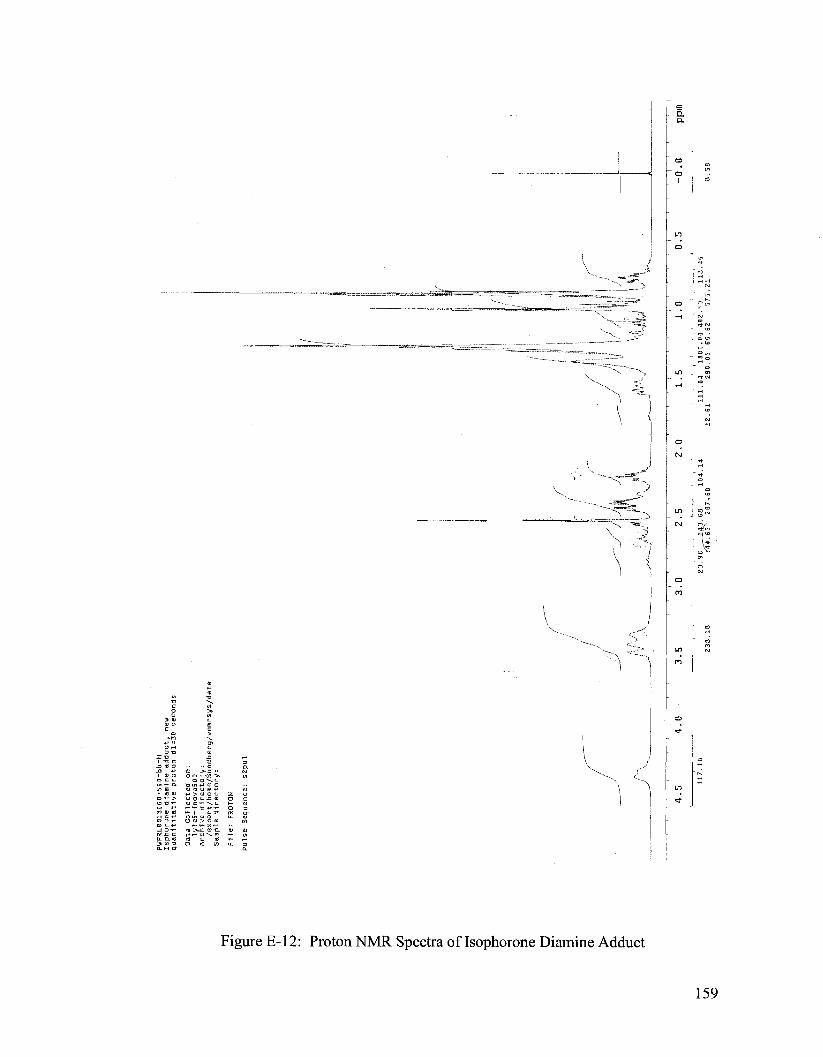
•fl m
K>
TJ
§ T3
O
M cn
O
^3
13*
O o
13 I 3 >
PVPRLG013Q60-50 0-bb-H
Isphorone diamine adduct, new
quantitative proton dl=3Q seconds
Data Collected on:
ly1eS-1nova5 0Q
Archive directory:
/export/home/Sundberg/vnmrsys/data
Sample directory:
File: PROTON
Pulse Sequence: s2pul
4.5
4.0
3.5
3.0
2.5
2.0
1.5
1.0
0.5
-0.0
ppm
23.96^_i43.68
104.14
,'44.65
207.60
111.04
1000.00 402.53
113.46
12.61
290.05 66.62
575.21

X
Figure E-13: Predicted Carbon NMR Spectra of a Di-functionalized Isophorone Diamine Adduct
160

m
.;-N
<*-r
^y
?U>7
S 9 d
. . ? . ^ 0_
E ^ o o S 8 8 S R R
Figure E-14: Predicted Carbon NMR Spectra of a Mono-functionalized (top) Isophorone Diamine Adduct
161
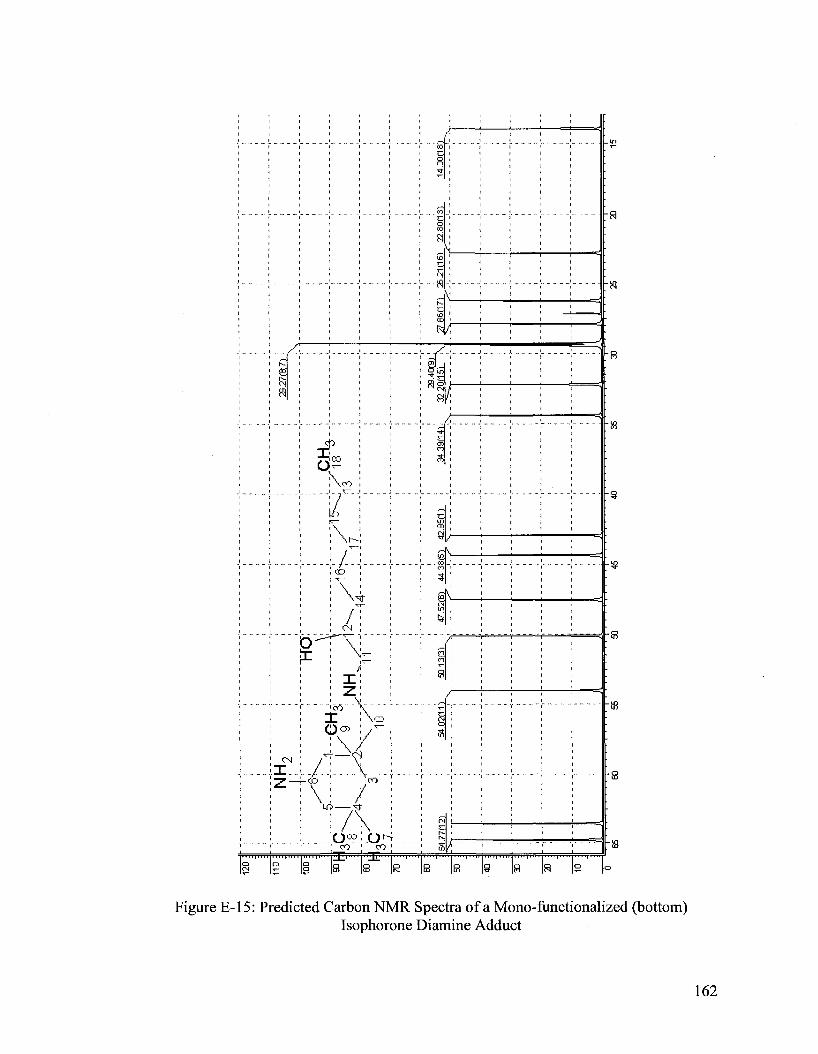
;
.;
23.2
7(8
:7)
'< /
CM
o
0
I o
1
\
w i f \ CM
: x ! Z ' (70
X
V4-N
r-CD
r
\ o
>
CO
/
:o.°?:.o^ i i 0 0 ' C O i T • 1
O LX1 |B
i n : R
86H
71
26.2
1(16
1
22.8
0(13
) 14
.00(
18
s!
\!
w,
% (So
Pi
o5 n
CD
((] CO
IT
I *
s CO
64.7
7(12
1
'<
54.0
2(11
B
«
/,'
N
/;
/
? ; " - - -
Is s
—
, s R
j
^
w
.
-
•
-
-
•
-
. •
o
Figure E-15: Predicted Carbon NMR Spectra of a Mono-functionalized (bottom) Isophorone Diamine Adduct
162

T)
i O I o 13
?0
GO
CD
O er
p o i-b
i—
i cc
O
^
S tr
o i-» o 13
CD s 13
CD
>
KG
PR
LQ
0129
34-5
00-I
d-C
is
op
ho
ron
e d
iam
ine
add
uct
DM
SO
Dat
a C
oll
ec
ted
on
: ly
le5
-in
ov
a5Q
G
Arc
hiv
e d
ire
cto
ry:
/ex
po
rt/h
an
ie/S
un
db
arg
/vn
nrr
sys/
data
S
ampl
e d
ire
cto
ry:
Fil
e:
CA
RB
ON
Pu
lse
Se
qu
en
ce
: s
2p
u1
.UU
l
*HN
T?
jf
tn
fo
nw
fl
nr
am
np
n
'^^W
4^>I
P^##
#^
^4M
^'ii
l^%
fiW
^^«y
^ IW
MI^
W/
J ik
J J A
W^w
w^s
^^^
70
60
50
40
30
20
10
ppm

APPENDIX F
Calculation of the Extent of Reaction vs. Time from DSC Analysis
164
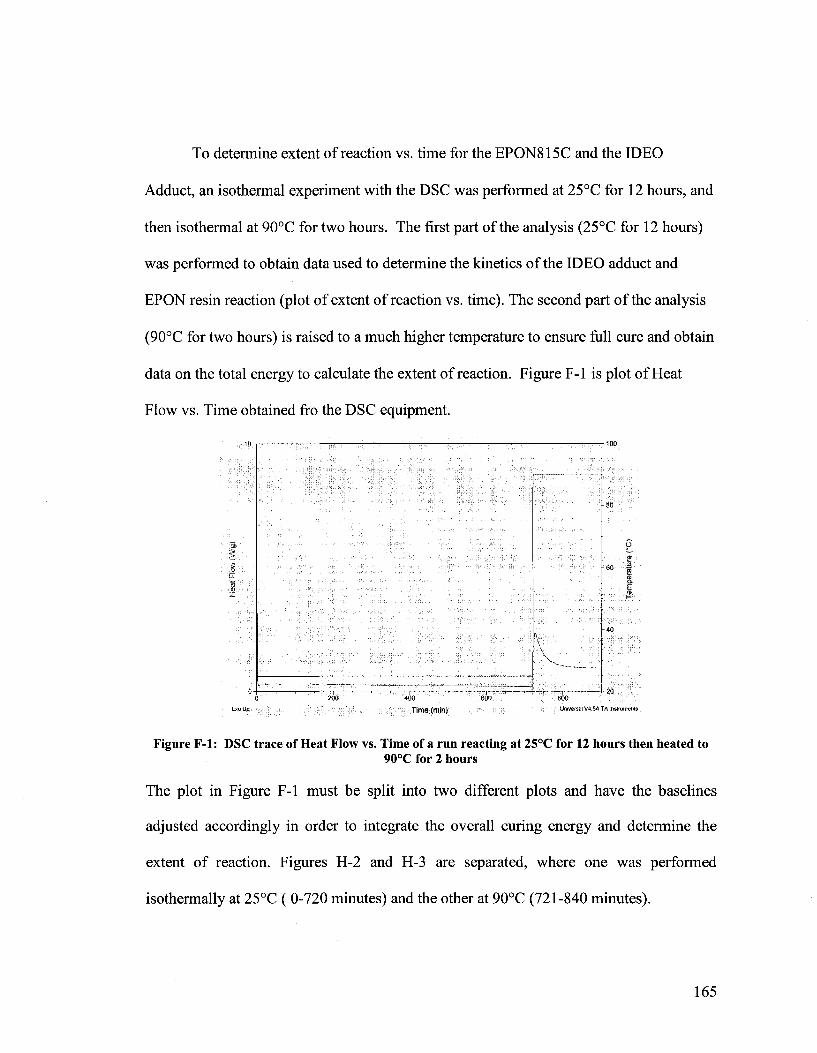
To determine extent of reaction vs. time for the EPON815C and the IDEO
Adduct, an isothermal experiment with the DSC was performed at 25°C for 12 hours, and
then isothermal at 90°C for two hours. The first part of the analysis (25°C for 12 hours)
was performed to obtain data used to determine the kinetics of the IDEO adduct and
EPON resin reaction (plot of extent of reaction vs. time). The second part of the analysis
(90°C for two hours) is raised to a much higher temperature to ensure full cure and obtain
data on the total energy to calculate the extent of reaction. Figure F-l is plot of Heat
Flow vs. Time obtained fro the DSC equipment.
OH c
ExoUp
o p>
60 |
I E
400
Time (min) Umversal V4.5A TA Instiunwtrts
Figure F-l: DSC trace of Heat Flow vs. Time of a run reacting at 25°C for 12 hours then heated to 90°C for 2 hours
The plot in Figure F-l must be split into two different plots and have the baselines
adjusted accordingly in order to integrate the overall curing energy and determine the
extent of reaction. Figures H-2 and H-3 are separated, where one was performed
isothermally at 25°C ( 0-720 minutes) and the other at 90°C (721-840 minutes).
165
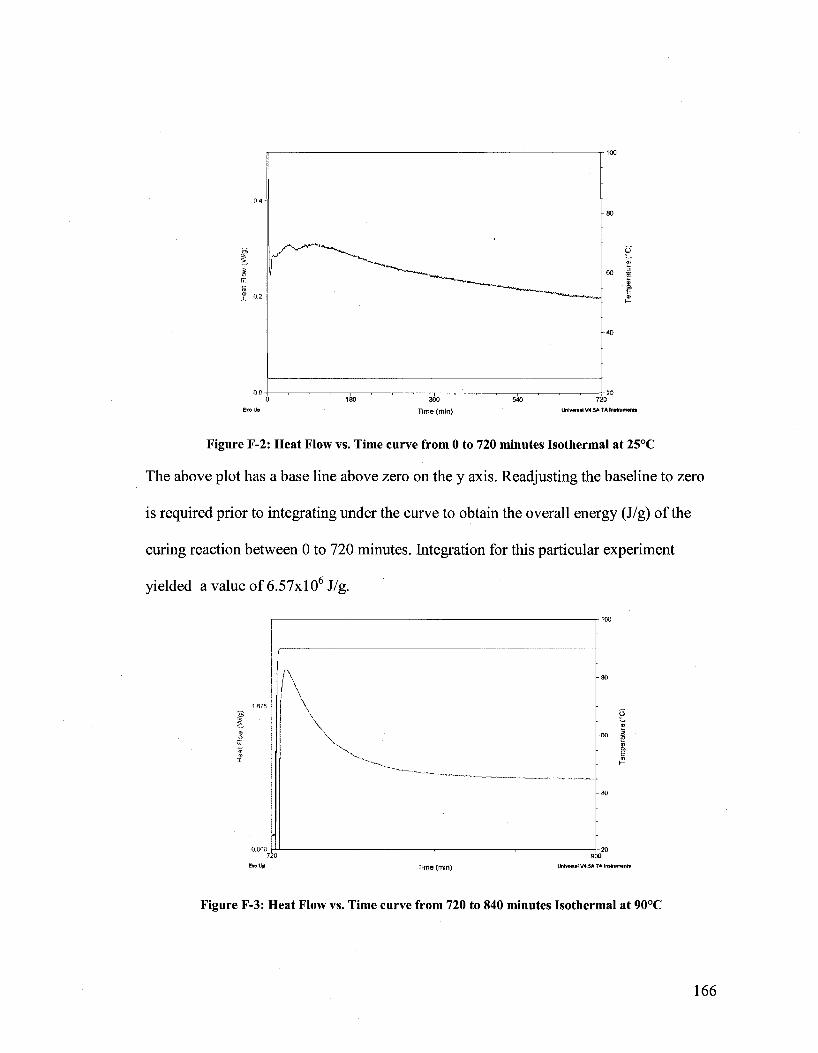
eo |
720
Unlvsrest V4.5A TA Instruments
Figure F-2: Heat Flow vs. Time curve from 0 to 720 minutes Isothermal at 25°C
The above plot has a base line above zero on the y axis. Readjusting the baseline to zero
is required prior to integrating under the curve to obtain the overall energy (J/g) of the
curing reaction between 0 to 720 minutes. Integration for this particular experiment
yielded a value of 6.57x10⁶ J/g.
Time (min)
900
Unlvetsal V4.5A T4 litsirumsnt*
Figure F-3: Heat Flow vs. Time curve from 720 to 840 minutes Isothermal at 90°C

Similar to Figure F-2, the base line must be shifted prior to integration in Figure H-3.
Integration of the curve yielded a value of 2.99x10⁶ J/g. With the two plots individually
integrated the two energy values are summed together to obtain the total energy required
to fully cure the EPON 815C/IDEO adduct epoxy. The total energy of reaction is
9.55xl06J/g.
To obtain the extent of reaction at time t, one must integrate from 0 to t and then
divide that value by the total energy (obtained from fully integrating Figure F-2-and F-3).
With the extent of reaction calculated, one can generate a plot of Extent of reaction vs.
Time shown in Figure F-4 below.
100 MO 300 400 500
Time (min) 600 700 800
Figure F-4: Extent of Reaction vs. Time plot for EPON 815C and IDEO adduct at 25°C
APPENDIX G
Characterization of PMMA/PBMA Copolymer from IDEO Amine Adduct
168

DSC Analysis:
The DSC was perfomred to determine if a PMMA/PBMA copolymer would be
plasticized by the IDEO adduct and if so to what extent. Figure G-l is a plot of reversible
heat capacity vs. temperature and the derivative of reversible heat capacity vs.
temperature.
2.8
2.4
2.2
P 20
4)
16
1.4 H
-40 •20 - I 1 1 - 1 1 1 1 1 1 1 1 I
20 — I — 80
0.025
a. O
o
-i 1—r -0-025 120
Temperature f C)
100
Univoisa! V4.5A TA InsttumoiH*
Figure G-l: DSC Trace of JN5-29 MMA/BMA/IDEO adduct solution polymerization.
Integration of the peak between the temperatures of 40°C and 60°C (typical polymer Tg's
span across 20°) on the derivative of reversible heat capacity curve, resulted in a Tg of
approximately 54°C. This is lower then the calculated Tg by the Fox-Flory equation
shown below for a copolymer composed of 60% MMA and 40% BMA.
169

-L-.5. + J5. (G.1)
where Wi is the weight fraction of homopolymer 1 (0.6 MMA), W2 is the weight fraction
of homopolymer 2 (0.4 BMA). Tgi and Tg2 are the glass transition temperatures for the
corresponding homopolymers (119°C and 35°C, respectively). A sample calculation of
the Tg is written out below.
Tg 393.15^ 308.15/:
Tg = 354.08£ = 80.9°C (G.3)
With the Tg of the PMMA/PBMA/IDEO adduct mixture lower than that of the calculated
Tg, there may be some plasticization of the polymer. Plasticization can either be caused
by the IDEO adduct or from the residual monomer, even though there was an attempt to
remove it.
170

APPENDIX H
IDEO Amine Adduct Encapsulation Experiments
171

Tab
le H
-l:
Exp
erim
ents
rep
licat
ing
JN4
-72
Ex
pe
rim
en
t
JN
4-7
2
JN
4-7
3
JN
4-S
7
JN
4-8
8
JN
4-9
0
JN
5-1
2
JN
5-1
3
JN
5-1
4
JN
5-1
5
JN
5-1
6
Rr
H2
0
(g)
12
8
12
8
12
8
12
8
12
8
19
2
12
8
12
3
12
8
12
8
PV
P
(g)
5.1
2
5.1
2
5.1
2
5.1
2
5.1
2 ,«
5.1
2
5.1
2
5.1
2
5.1
2
Sc
av
en
ge
r
<g)
0.0
89
2
0.0
89
2
0.0
89
2
0.0
89
2
0.0
89
2
0.0
89
2
0.0
89
2
0.0
89
2
0.0
89
2
O.0
S9
2
(MM
A)
(3)
6.4
6.4
6.4
6.4
6.4
8.4
B.4
5.4
6.4
6.4
(BM
A)
(9)
4.2
6
4.2
6
4.2
6
4.2
6
4.2
6
4.2
6
4.2
6
4.2
6
4.2
6
4.2
6
(EG
DM
A)
<g)
0 0 0 0 0 0 0 0 0 0
He
xa
de
ca
ne
(g)
0.1
06
0.1
06
0.1
06
0.1
06
0.1
06
0.1
O6
0.1
OB
0.1
06
0.1
06
0
(v-
65
Xg
)
0.1
08
0.1
06
0.1
06
0.1
06
0.1
06
G.,
0.
0.1
06
0.1
06
0.1
06
0.1
06
IDE
O
ad
du
ct
(g)
10
.66
10
.66
10
.68
10
.66
10
.66
10
.66
,0
.
10
.66
10
.66
10
.66
.C
65
65
65
65
65
65
65
65
65
65
Mix
ing
Sti
rpla
te (
ye
llo
w s
tirp
late
se
ttin
g)
11
du
rin
g h
om
og
en
iza
tio
n th
en
7 a
fte
rwa
rds
11
du
rin
g h
om
og
en
iza
tio
n th
en
7 a
fte
rwa
rds
11
11
11
11
du
rin
g h
om
og
en
iza
tio
n th
en
7 a
fte
rwa
rds
11
du
rin
g h
om
og
en
iza
tio
n th
en
10
aft
erw
ard
s
11
du
rin
g h
om
og
en
iza
tio
n th
en
7 a
fte
rwa
rds
11
11
Ho
mo
ge
niz
ati
on
Se
ttin
g
2 2 2 2 2 2 * 2 2 2
Ti™
15
min
+ t
ime
to h
ea
t w
ate
r b
ath
(C
a.
38
0 m
in)
15
min
+•
tim
e to
he
at
wa
ter
ba
th (
Ca
. 3
80
min
)
15
min
+ t
ime
to h
ea
t w
ate
r b
ath
(C
a.
3A
0 m
in)
15 m
in +
lim
e t
o h
ea
t w
ate
r b
ath
(C
a.
30
0 m
in)
15 m
int
lim
e to
h
ea
t w
ate
r b
ath
(C
a.
38
0 m
in)
15 m
in +
tim
e t
a h
ea
t w
ate
r b
ath
(C
a.
38
0 m
in)
15 m
in +
tim
e t
a h
ea
t wa
ter
ba
th (
Ca
. 3
00
min
)
15
min
+ tim
e to
he
at
wa
ter
ba
th(C
a.
38
0 m
in)
15
min
+ t
ime
to h
ea
t wa
ter
ba
th (
Ca
. 3
80
min
)
15
min
+ tim
e to
he
at w
ate
r b
ath
(Ca
. a
lio
min
)
Re
su
lts
Sec
ond
crop
pre
sent
. Cap
sule
s in
8C
I50u
m ra
nge
Sec
ond
crop
pre
sent
. Lar
ge a
gglo
mer
ates
form
ed
Sec
ond
crop
pre
sent
. Lar
ge a
ggio
mer
ates
form
ed
Sec
ond
crop
pre
sent
. Lar
ge a
gglo
mer
ates
form
ed.
Low
yi
eld
Sec
ond
crop
pre
sent
. Lar
ge a
gglo
mer
ates
form
ed
Sec
ond
crop
pre
sent
. Lar
ge a
gglo
mer
ates
form
ed
Sec
ond
crop
pre
sent
. Lar
ge a
gglo
mer
ates
form
ed
Sec
ond
crop
pre
sent
. Lar
ge a
gglo
mer
ates
form
ed
Sec
ond
crop
pre
sent
. Lar
ge a
gglo
mer
ates
form
ed
Sec
ond
crop
pre
sent
. Lar
ge a
gglo
mer
ates
form
ed

Tab
le H
-2: E
ncap
sula
tion
Atte
mpt
s U
sing
Mec
hani
cal
Stir
ring
Exp
erim
ent
JN
4S
2
JN
4S
3
JN
+9
4
JN4
-95
JN
46
6
JN
4S
7
JN
49
B
JN
+9
9
JN
4-1
00
JN
50
1
JN
50
2
JN
50
3
JN
50
4
JN
50
6
JN
50
S
JN
50
9
JN5
-10
Re
cip
e
H2
0<
g)
12
8
12
8
12
8
12
8
12
8
19
2
19
2
19
2
19
2
19
2
19
2
19
2
19
2
19
2
19
2
19
2
19
2
PV
P(g
)
5.1
2
5.1
2
5.1
2
5.1
2
5.1
2
7.6
8
7.6
8
11
.52
15
.36
15
.36
"
15
.36
15
.36
19
.2
19
.2
19
.2
19.2
19
.2
Sc
av
en
ge
r (g
;
0 0 0 0 0 0 0 0 • "o
0 0 0 0 0 0 0
08
92
08
92
08
92
08
92
04
46
13
38
08
92
08
92
08
92
08
92
08
92
08
92
08
92
08
92
04
46
08
92
08
92
(MM
A){
g)
e a 6 6 3 9 6 6 e 6 e e 6 e 3 6 6
4 4 4 4 2 9 4 4 4 4 4 4 4 * 2 4 4
(BM
A)<
g>
4.2
6
4.2
8
4.2
6
4.2
6
2.1
3
6.4
4.2
6
4.2
6
4.2
6
4.2
6
4.2
6
4.2
6
4.2
6
4.2
6
2.1
3
4.2
6
4.2
6
(EG
DM
A)(
g)
0 0 0 0 0 0 0 0 0 0 0 0 0 0 0 0 0
He
xa
de
ca
ne
(g
0 0 0 0 0 0 0 0 0 0 0 0 0 0 0 0 0
10
6
10
6
10
6
10
6
05
3
15
9
10
6
10
6
10
6
10
6
10
6
10
6
10
6
10
6
05
3
10
6
10
6
<*5
5X
g>
0.1
06
0.1
06
0.1
06
0.1
06
0.0
53
.
0.1
59
0.1
06
0.1
06
0.1
06
0.1
06
0.1
06
0.1
06
0.1
06
0.1
06
0.0
53
0,1
06
0.1
06
IDE
O a
dd
uc
t (g
10
10
10
10
5 15
10
10
10
10
10 10
10
10 10
10
10
66
66
66
66
94
66
66
66
66
66
66
66
66
66
66
36
Te
mp
.C
65
65
65
65
65
65
65
65
65
65
65
65
65
65
65
65
65
Sti
rrin
g
Me
ch
an
ica
l (R
PM
)
20
0
20
0
20
0
15
0
20
0
20
0
27
5
27
5
30
0
27
5
27
5
37
5
25
0
27
5
27
5
30
0
30
0
Ho
mo
ge
niz
ati
on
Se
ttin
g
2 2 2 2 2 2 2 2 2 2 3 3 3 3 3 2 2.5
Tim
e
15
min
+ t
ime
to h
ea
t wa
ter
ba
th (
Ca
-BB
min
)
15 m
in +
Bm
e to
he
at w
ate
r b
ath
(C
a-B
Em
in)
15
min
+ flm
e to
he
at w
ate
r b
ath
(C
a.-
4S
5m
in)
15 m
in +
tim
e to
he
at w
ate
r b
ath
(C
a-B
Em
in)
15 m
m +
tim
e to
he
at
wa
ter
ba
th (
Ca
t-S
Sm
in)
15
min
+ t
ime
to h
ea
t w
ate
r b
ath
(C
a-S
Bm
in)
15
min
+ t
ime
to h
ea
t w
ate
r b
ath
(C
ar4
ffi m
in)
15
min
+ flm
e to
he
at
wa
ter
ba
th (
Ca
^ff
i min
)
15
min
+ t
ime
to h
ea
t w
ate
r b
ath
(C
a-H
E m
in)
15
min
+ t
ime
t o
he
at
wa
ter
ba
th (
Ca
Hfl
Em
ip)
+2
0 m
inu
tes
15
min
+ t
ime
to h
ea
t w
ate
r b
ath
(C
a-H
Bm
in)
15
min
+ t
ime
t o
he
at
wa
ter
ba
th
(Ca
^B
min
)
15
min
+ t
ime
to
he
at
wa
ter
ba
th
(Ca
^B
min
)
15
min
* t
ime
t o
he
at
wa
ter
ba
th (
Ca
r«6
min
) +
20
min
ute
i
15
min
+ t
ime
to h
ea
t w
ate
r b
ath
(C
a^
ffim
in)
15
min
+ t
ime
to
he
at
wa
ter
ba
th (
Ca
-HE
min
}
15
min
+ t
ime
to
he
at
wa
ter
ba
th {
Ca
-HE
min
)
Re
su
lts
Se
con
d cr
ap
pre
sen
t. C
ap
sule
s in
th
e ra
nge
of-S
OQ
um
Se
co
nd
cro
p p
rese
nt.
La
rge
ag
glo
me
rate
s fo
rme
d
Se
co
nd
cro
p p
rese
nt.
Ca
psu
les
in t
he
ran
ge
of-
33
00
um
Se
co
nd
cro
p p
rese
nt.
Ca
psu
les
in t
he
ran
ge
oM
QO
Ou
m
Se
co
nd
cro
p p
rese
nt.
La
rge
ag
glo
me
rate
s fo
rme
d
Se
co
nd
cro
p p
rese
nt.
La
rge
ag
glo
me
rate
s fo
rme
d
Se
co
nd
cro
p p
rese
nt.
Ca
psu
les
in t
he
ran
ge
of-
a0
0u
m
Se
con
d cr
op
pre
sen
t. C
ap
sule
s in
th
e ra
ng
e o
f-8
00
um
Se
con
d cr
op
pre
sen
t. C
ap
sule
s in
th
e ra
ng
e o
f-9
00
um
Se
co
nd
cro
p p
rese
nt.
Ca
psu
les
in t
he
ran
ge
of-
30
0u
m
Se
co
nd
cro
p p
rese
nt.
Ca
psu
les
in t
he
ran
ge
of-S
OO
um
Se
co
nd
cro
p p
rese
nt.
Ca
psu
les
in t
he
ran
ge
of-
ao
Ou
m
Se
co
nd
cro
p p
rese
nt.
Ca
psu
les
in t
he
ran
ge
oGB
Oum
Se
con
d cr
op
pre
sen
t. C
ap
sule
s in
th
e ra
ng
e o
f-2
00
um
Lo
w y
eilc
No
en
cap
sula
tio
n
Se
co
nd
cro
p p
rese
nt.
Ca
psu
les
in t
he
ran
ge
of-
60
0u
m
Se
co
nd
cro
p p
rese
nt.
Ca
psu
les
in t
he
ran
ge
of-
36
0u
m