dual-credit education programs in texas
TRANSCRIPT

M A K I N G RES E ARC H R EL EV A N T
AMERICAN INSTITUTES FOR RESEARCH | AIR.ORG
Dual-Credit Education Programs in Texas: Phase II
JULY 2018
Authors: Trey Miller | Hol ly Kosiewicz | Courtney Tanenbaum | Drew Atchison David Knight | Beth Ratway | Scott Delhommer | Jesse Levin
Contributors: Maryan Carbuccia Abbott | Hana Gebremariam | Kendall Hol ley | Nicholas Kean Rex Long | Salma Mohammed |Todd Nobles | Christine Pham | Joseph Shields

Dual-Credit Education Programs in Texas Phase II
JUNE 2018
Authors :
Trey Mil ler , American Inst itutes for Research
Hol ly Kosiewicz , Texas Higher Educat ion Coordinat ing Board
Courtney Tanenbaum, American Institutes for Research
Drew Atchison, American Inst itutes for Research
David Knight , Univers ity of Texas at El Paso
Beth Ratway, American Inst itutes for Research
Scott Delhommer , Univers ity of Texas a t Aust in
Jesse Levin , American Inst itutes for Research
Contr ibutors :
Maryan Carbuccia Abbott , American Inst itutes for Research
Hana Gebremariam , American Inst itutes for Research
Kendal l Hol ley , American Inst itutes for Research
Nicholas Kean, American Inst i tutes for Research
Rex Long, Gibson Consult ing
Salma Mohammed, American Inst itutes for Research
Todd Nobles, American Inst itutes for Research
Christ ine Pham , Gibson Consult ing
Joseph Shie lds , Gibson Consult ing
This material is based upon work supported by the Texas Higher Education Foundation, the non-profit fundraising arm of the Texas Higher Education Coordinating Board (THECB). Any opinions, findings, and conclusions or recommendations expressed in this material are those of the author(s) and do not necessarily reflect the views of the THECB.
“This material is based upon work supported by the Texas Higher Education Foundation, a nonprofit fundraising arm for the Texas Higher Education Coordinating Board (THECB). Any opinions, findings, and conclusions or recommendations expressed in this material are those of the author(s) and do not necessarily reflect the views of the THECB.”
“This material is based upon work supported by the Texas Higher Education Foundation, a nonprofit fundraising arm for the Texas Higher Education Coordinating Board (THECB). Any opinions, findings, and conclusions or recommendations expressed in this material are those of the author(s) and do not necessarily reflect the views of the THECB.”
1000 Thomas Jefferson Street NW Washington, DC 20007-3835 202.403.5000
www.air.org
Copyright © 2018 American Institutes for Research. All rights reserved. 4947_07/18
Contents Page
Executive Summary ......................................................................................................................... 1
Key Findings ................................................................................................................................ 2
Policy Recommendations............................................................................................................ 6
Introduction .................................................................................................................................... 7
About This Report ....................................................................................................................... 8
Overview of Dual-Credit Education in Texas .............................................................................. 9
Defining Dual-Credit Education in Texas .................................................................................. 10
Debates Around Dual-Credit Education in Texas...................................................................... 10
Summary of Phase I Findings .................................................................................................... 11
Overview of Phase II ................................................................................................................. 12
Chapter 1: Quantitative Findings .................................................................................................. 19
Background and Policy Context ................................................................................................ 19
Organization of Chapter ........................................................................................................... 20
Data ........................................................................................................................................... 20
Approach to Questions 1 and 2 ................................................................................................ 21
Racial Disparities ....................................................................................................................... 22
HB 505 Study ............................................................................................................................. 35
Changes in Dual-Credit Participation Since HB 505 .................................................................. 36
Changes in Dual-Credit Context Since HB 505 .......................................................................... 39
Changes in Academic Preparation of Dual-Credit Participants ................................................ 44
Changes in Dual-Credit Course Performance ........................................................................... 47
Causal Impact Study .................................................................................................................. 49
Limitations ................................................................................................................................ 65
Summary, Limitations, and Conclusions ................................................................................... 67
Additional Analyses ................................................................................................................... 69
Chapter 2. Dual-Credit Advising Practices and Models ................................................................ 71
Background and Policy Context ................................................................................................ 71
Data Collection and Analysis ..................................................................................................... 73
Organization of Chapter ........................................................................................................... 75

Findings ..................................................................................................................................... 76
Students Targeted for Dual-Credit Education .......................................................................... 76
Coordination of Advising Activities ........................................................................................... 86
Course-Taking Considerations .................................................................................................. 88
Advising Challenges .................................................................................................................. 92
Suggestions to Improve Student Advising ................................................................................ 95
Conclusions ............................................................................................................................... 99
Chapter 3. The Academic Rigor of Dual-Credit Courses ............................................................. 101
Organization of This Chapter .................................................................................................. 102
Research Design ...................................................................................................................... 102
Instructional Strategies ........................................................................................................... 109
The Assessment of Student Learning and Performance ........................................................ 111
Assessment of Student Performance ..................................................................................... 113
Data Analysis ........................................................................................................................... 116
Limitations .............................................................................................................................. 117
Findings ................................................................................................................................... 117
Conclusion ............................................................................................................................... 125
Chapter 4: The Costs of Delivering Dual-Credit Education ......................................................... 127
Purpose ................................................................................................................................... 128
Cost Study Methodology ........................................................................................................ 129
Cost of Providing Dual-Credit Courses in Texas ...................................................................... 135
Funding for School Districts and Community Colleges ........................................................... 151
Benefits of Dual-Credit Course Taking .................................................................................... 154
Chapter Conclusion ................................................................................................................. 162
Chapter 5: Conclusion ................................................................................................................. 164
Policy Recommendations........................................................................................................ 172
References .................................................................................................................................. 174
Appendix A. Data and Methods .................................................................................................. 180
Appendix B: Advising Data Collection Instruments .................................................................... 214
Appendix C. Advising Interview Sample ..................................................................................... 222
Appendix D. Advising Interview Codebook ................................................................................. 225

Appendix E: Detailed Cost Descriptions for Traditional Dual-Credit Models by Community College ..................................................................................................................... 230
Costs for Community College A and Its District Partners ....................................................... 230
Costs for Community College B and Its District Partners ....................................................... 235
Costs for Community College C and Its District Partners ....................................................... 242
Costs for Community College D and Its District Partners ....................................................... 247
Costs for Community College E ............................................................................................... 251
Appendix F. English Language Arts Protocol............................................................................... 253
Appendix G. Mathematics Protocol ............................................................................................ 264
Tables Page
Table 1.1. Most Common Dual-Credit Courses for All Students (2012–17) ................................. 39
Table 1.2. Most Common Dual-Credit Courses Before and After HB 505, by Grade (Percent of All DC SCH Represented by Course) ........................................................................... 41
Table 1.3. Mean Student Outcomes by Dual-Credit Participation (2001–16) .............................. 51
Table 3.1. Total Amount of Participants for Each Course Type .................................................. 103
Table 3.2. Instructor Materials Collected for Study .................................................................... 105
Table 3.3. Data Collected From Participants .............................................................................. 105
Table 3.4. Mathematics and English Content Areas ................................................................... 107
Table 3.5. Mathematics and English Content Skills .................................................................... 108
Table 3.6. Novice-to-Expert Continuum (Conley, 2013) ............................................................. 115
Table 3.7. Weighted Average of Instructor Reported Use of Class Time ................................... 122
Table 3.8. Weighted Average of Instructor Reported Use of Assessment Strategies ................ 124
Table 3.9. Counts of Assignments by Grade and Rating on Novice-to-Expert Continuum ........ 125
Table 4.1. Sample of Community Colleges ................................................................................. 136
Table 4.2. Average dual-credit costs per semester credit hour to colleges, school districts, and students pre- and post-tuition across five colleges .............................................. 138
Table 4.3. Average Costs for Different Cost Categories Applied for the Calculation of Statewide Costs ........................................................................................................................... 146
Table 4.4. Statewide Costs per SCH and Total Costs .................................................................. 147
Table 4.5. Average Costs per SCH According to Predominant Instructor Type .......................... 149
Table 4.6 Average Costs per SCH According to Predominant Instructor Type ........................... 151
Table 4.7. Effects of Dual-Credit Course Taking on Credits and Time to Degree ....................... 155

Table 4.8. Benefits Attributed to Dual-Credit Enrollment Resulting From Reduced Time to Degree .................................................................................................................................... 158
Table 4.9. Lifetime Benefits of a Two-Year Credential ............................................................... 160
Table A.1. Key Variables by Student and Course File ................................................................. 183
Table A.2. Definition of Outcomes .............................................................................................. 186
Table A.3. Summary Statistics ..................................................................................................... 188
Table A.4. First Stage for Average Effects ................................................................................... 191
Table A.5. Second Stage for Average Effects .............................................................................. 192
Table A.6. First-Stage for Dosage Effects .................................................................................... 197
Table A.7. Second Stage for Dosage Effects ............................................................................... 198
Table A.8. Heterogeneous Effects of DC for Students Eligible and Ineligible for Free or Reduced-Price Lunch................................................................................................................... 202
Table A.9. Heterogeneous Effects of DC for Students by Eighth-Grade Test Scores ................. 204
Table A.10. Heterogenous Effects of DC for Students by Race .................................................. 206
Table A.11. Heterogeneous Effects of DC for Students by Eligibility for Free/Reduced Price Lunch and Eighth-Grade Reading Test Scores ................................................................... 209
Table A.12. Heterogeneous Effects of DC for Students by Eligibility for Free/Reduced Price Lunch and Eighth-Grade Math Test Scores ........................................................................ 210
Table A.13. Determinants for Racial Disparities of DC Participation by Race ............................ 213
Table C1. IHE and High School Characteristics of the Interview Sample .................................... 222
Table E.1. Costs per semester credit hour for three school districts partnering with Community College A .................................................................................................................. 235
Table E.2. Costs per Semester Credit Hour for Three School Districts Partnering With Community College B .................................................................................................................. 242
Table E.3. Costs per Semester Credit Hour for Two School Districts Partnering With Community College C .................................................................................................................. 247
Table E.4. Costs per Semester Credit Hour for Three School Districts Partnering With Community College D ................................................................................................................. 251
Table E.5. Costs per Semester Credit Hour at the College Level for Community College D ...... 252
Figures Page
Figure 1.1. Dual-Credit Participation Rates by Race/Ethnicity (2001–15) .................................... 22
Figure 1.2. Dual-Credit Participation by Race/Ethnicity (Student Cohorts of Juniors Enrolled in Dual-Credit Education in 11th and / or 12th Grade: 2001–16; n = 3,422,095) .......... 23

Figure 1.3. Dual-Credit Participation by Race/Ethnicity, Adjusting for Differences in Dual-Credit Access (Student Cohorts of Juniors Enrolled in Dual-Credit Education in 11th and / or 12th Grade: 2001–16; n = 3,422,095) ...................................................................................... 25
Figure 1.4. Dual-Credit Participation by Race/Ethnicity, Adjusting for Differences in Eighth-Grade Achievement Test Scores (Student Cohorts of Juniors Enrolled in Dual-Credit Education in 11th and / or 12th Grade: 2001–16; n = 3,422,095) ..................................... 26
Figure 1.5. Dual-Credit Participation by Race/Ethnicity, Adjusting for Differences in Free or Reduced-Price Lunch Eligibility (Student Cohorts of Juniors Enrolled in Dual-Credit Education in 11th and / or 12th Grade: 2001–16; n = 3,422,095)................................................ 28
Figure 1.6. Dual-Credit Participation by Race/Ethnicity, Adjusting for Differences in Access to AP and IB Courses (Student Cohorts of Juniors Enrolled in Dual-Credit Education in 11th and / or 12th Grade: 2001–16; n = 3,422,095)................................................ 29
Figure 1.7. Dual-Credit Participation by Race/Ethnicity, Adjusting for Differences in Where Students Attended High School (Student Cohorts of Juniors Enrolled in Dual-Credit Education in 11th and / or 12th Grade: 2001–16; n = 3,422,095) ..................................... 31
Figure 1.8. Dual-Credit Participation by Race/Ethnicity, Adjusting for Differences in Dual-Credit Tuition and Fee Waivers (Student Cohorts of Juniors Enrolled in Dual-Credit Education in 11th and / or 12th Grade: 2016; n = 311,383) ......................................................... 33
Figure 1.9. Dual-Credit Participation by Race/Ethnicity, Adjusting for Differences in All Factors Considered Previously (Student Cohorts of Juniors Enrolled in Dual-Credit Education in 11th and / or 12th Grade: 2001–16; n = 3,422,095)................................................ 34
Figure 1.10. Dual-Credit Participation Rate Among All Texas Public High School Students (2012–17; n = 8,580,735) .............................................................................................................. 36
Figure 1.11. Dual-Credit Participation Among Texas Public High School Students by Grade (2012–17; n = 8,580,735) ................................................................................................... 37
Figure 1.12. SCH of Dual Credit Taken Among Dual-Credit Participants by Grade (2012–17; n = 673,151) ............................................................................................................................ 38
Figure 1.13. Delivery of Dual-Credit Courses Among Dual-Credit Participants Before and After HB 505 (2012 –17; n = 1,868,920) ....................................................................................... 42
Figure 1.14. Type of Dual-Credit Courses Among Dual-Credit Participants (2012–17; n = 1,868,920) ..................................................................................................................................... 43
Figure 1.15. Faculty Characteristics of Dual-Credit Courses at Two-Year Colleges (2012–17; n = 1,268,365) ......................................................................................................................... 44
Figure 1.16. Average Score on the Eighth-Grade Standardized State Assessment (TAKS and STAAR Examinations) Among Dual-Credit Participants (2012–17; n = 620,716) .................. 45
Figure 1.17. Average Score on the Eighth-Grade Standardized State Assessment (TAKS and STAAR Examinations) Among Dual-Credit Participants by Grade (2012–17; n = 620,716) ........................................................................................................................................ 46
Figure 1.18. Share of Dual-Credit Course Grades That Were As by Grade (2012–17; n = 1,868,920) ..................................................................................................................................... 47

Figure 1.19. Distribution of Dual-Credit Course Grades in College Algebra (Math 1314/1414) (2012–17; n = 87,853) ............................................................................................... 48
Figure 1.20. Distribution of Dual-Credit Course Grades in English Composition I (English 1301) (2012–17; n = 192,174) ....................................................................................................... 49
Figure 1.21. Causal Impact of Dual-Credit Participation on High School Completion (Student Cohorts of Juniors Enrolled in Dual-Credit Education in 11th and / or 12th Grade: 2001–16; n = 3,411,286) ................................................................................................... 53
Figure 1.22. Causal Impact of Dual-Credit Participation on College Enrollment (Student Cohorts of Juniors Enrolled in Dual-Credit Education in 11th and / or 12th Grade: 2001–15; n = 3,223,430) ......................................................................................................................... 54
Figure 1.23. Causal Impact of Dual-Credit Participation on Two- Versus Four-Year College Enrollment (Student Cohorts of Juniors Enrolled in Dual-Credit Education in 11th and / or 12th Grade: 2001–15; n = 3,223,430) ...................................................................................... 55
Figure 1.24. Causal Impact of Dual-Credit Participation on College Completion (Student Cohorts of Juniors Enrolled in Dual-Credit Education in 11th and / or 12th Grade: 2001–08; n = 1,542,629) ......................................................................................................................... 57
Figure 1.25. Causal Impact of Dual-Credit Participation on Two- Versus Four-Year College Completion (Student Cohorts of Juniors Enrolled in Dual-Credit Education in 11th and / or 12th Grade: 2001–13; n = 2,754,765) ...................................................................................... 58
Figure 1.26. Causal Impact of Dual-Credit Participation on SCH-to-Degree (Student Cohorts of Juniors Enrolled in Dual-Credit Education in 11th and / or 12th Grade Who Graduated From a Four-Year College: 2001–08; n = 384,658) ..................................................... 59
Figure 1.27. Causal Impact of Dual-Credit Participation on Time-to-Degree (Student Cohorts of Juniors Enrolled in Dual-Credit Education in 11th and / or 12th Grade Who Graduated From a Four-Year College: 2001–08; n = 375,715) ..................................................... 60
Figure 1.28. Causal Impact of Dual-Credit Participation on Key Outcomes by Race/Ethnicity (Student Cohorts of Juniors Enrolled in Dual-Credit Education in 11th and / or 12th Grade: 2001–08; n = 1,542,068) .................................................................................... 61
Figure 1.29. Causal Impact of Dual-Credit Participation on Key Outcomes by Free or Reduced-Price Lunch Eligibility (Student Cohorts of Juniors Enrolled in Dual-Credit Education in 11th and / or 12th Grade: 2001–08; n = 1,542,068)................................................ 63
Figure 1.30. Causal Impact of Dual-Credit Participation on Key Outcomes by Eighth-Grade Reading TAKS and STAAR Scores (Student Cohorts of Juniors Enrolled in Dual-Credit Education in 11th and / or 12th Grade: 2001–08; n = 1,542,068) ..................................... 64
Figure 1.31. Causal Impact of Dual-Credit Participation on Key Outcomes by Eighth-Grade Mathematics TAKS and STAAR Scores (Student Cohorts of Juniors Enrolled in Dual-Credit Education in 11th and / or 12th Grade: 2001–08; n = 1,542,068) ............................ 65
Figure 4.1. Illustration of Sampling Plan for Cost Analysis ......................................................... 131

Dual-Credit Education Programs in Texas: Phase II
AMERICAN INSTITUTES FOR RESEARCH | AIR.ORG 1
Executive Summary
This report presents findings and offers key takeaways from the second phase of a two-year
study of dual-credit education programs in Texas. Phase II extends and expands research
conducted by the RAND Corporation during Phase I and provides more in-depth analysis of
dual-credit education programs, specifically: (1) the impact of dual-credit education programs
on college access and college completion; (2) patterns in student participation and course
grades in dual-credit education and delivery of dual-credit education programs before and after
2015 legislative efforts to expand access to dual-credit education; (3) factors contributing to
racial disparities in dual-credit participation; (4) dual-credit advising practices; (5) similarities
and differences in the academic rigor of dual-credit and college-credit only courses; and (6) the
costs of delivering dual-credit education.
Analyses conducted for this report focus primarily, though not exclusively, on “traditional” dual
credit education programs delivered by community colleges. By “traditional” dual credit
education programs, we mean academic dual credit courses that are delivered through regular
high schools (i.e. not Early College High Schools (ECHS)) that offer dual credit courses. The
decision to focus on this type of model was based on evidence from Phase I showing that it was
the predominant model to deliver dual credit education across the state. Moreover, a number
of rigorous experimental studies of ECHS that include some Texas ECHS programs demonstrate
the effectiveness of well-implemented ECHS programs for a wide range of students, including
those who are traditionally underrepresented in postsecondary education. A consequence of
this focus is that Phase II lends less insight into the effectiveness and the implementation of
ECHS, career and technical (CTE) dual credit education, and dual credit education delivered by
four-year institutions. We note throughout the report where analyses could not examine less
common dual credit delivery models.
This report is organized as follows:
Chapter 1 examines the impact of dual-credit education programs on student success and
efficient degree completion prior to the passage of House Bill (HB) 505 (2015). It also
examines changes in student participation and course grades and in the delivery of dual-
credit education programs before and after the passage of HB 505. Finally, this chapter
examines the factors that contribute to racial and ethnic gaps in dual-credit education
participation. All analysis draws on administrative records collected by the Texas Higher
Education Coordinating Board (THECB) and the Texas Education Agency (TEA).

Dual-Credit Education Programs in Texas: Phase II
AMERICAN INSTITUTES FOR RESEARCH | AIR.ORG 2
Chapter 2 investigates how high school students are advised relative to dual-credit
education and through dual-credit courses, as well as how dual-credit education partners
work together to provide advising services based on interviews with high school guidance
counselors and college advisors.
Chapter 3 explores whether there are systematic differences in content, instructional
strategies, student assignments, and grading practices between dual-credit and college-
level courses by analyzing syllabi, assignments, graded student work products, and survey
data from high school teachers and college faculty providing instruction in College Algebra
(Math 1314/1414) and English Composition (Engl 1301).
Chapter 4 quantifies the costs of delivering dual-credit education; examines how these
costs are shared among community colleges, school districts, and students and their
families; and considers how the costs of delivering dual-credit education compare to state
funding that school districts and community colleges receive for delivering dual-credit
courses. The study also compares the costs of delivering dual-credit programs against the
benefits that are reaped from them. The analysis employs the Ingredients Approach and
draws on administrative records from THECB and TEA and interview data from secondary
and postsecondary administrators.
Chapter 5 concludes with key findings from Phase II and describes the process that will be
used to inform policy recommendations based on stakeholder feedback on this draft report.
Key Findings
The Impact of Dual-Credit Education Programs on Student Outcomes
On average, participation in traditional dual-credit programs prior to the passage of HB 505
modestly improved a range of student outcomes, including college enrollment and
completion.
– This finding suggests that previous estimates of the impact of dual-credit programs on
student outcomes, including the descriptive findings reported in Phase I, were probably
too high because they were unable to fully account for all systematic differences (such
as academic preparation, motivation, and other factors) in dual-credit participants and
nonparticipants.

Dual-Credit Education Programs in Texas: Phase II
AMERICAN INSTITUTES FOR RESEARCH | AIR.ORG 3
The effect of participating in traditional dual-credit programs prior to HB 505 on student
outcomes was more positive for traditionally advantaged student groups (e.g., White
students); the effect was negative in some cases for less advantaged groups (e.g., low-
income students).
– The negative results for free and reduced price lunch eligible students were likely due to
the fact that free and reduced price lunch eligible students were more likely than
ineligible participants to have lower 8th grade standardized test scores that hindered
their success in dual credit education courses. In particular, we found that the impact of
dual credit education for free and reduced price lunch eligible students with 8th grade
standardized tests scores that were one standard deviation above the mean was
positive for all postsecondary outcomes, while the impact for those with average
standardized test scores was largely negative.
Participation, Outcome, and Delivery Patterns Before and After Passage of HB 505
Overall, the percentage of students participating in dual-credit programs modestly increased
after passage of HB 505.
– Growth in dual-credit participation after HB 505 was higher among ninth and 10th
graders. Starting from a low base, the dual-credit participation rate more than doubled
(from 1.0% to 2.1%) among ninth graders and increased by 60% (from 2.7% to 4.3%)
among 10th graders.
The academic preparation of ninth- and 10th-grade dual-credit participants declined after
the passage of HB 505, while dual-credit pass rates increased for those groups. This
suggests that the academic rigor of dual-credit courses may have declined for ninth and
10th graders since HB 505.
Factors Contributing to Racial and Ethnic Gaps in Dual Credit Education Participation
Differences in observable student factors account for most, but not all, of the difference in
dual-credit participation across race and ethnicity.
– For example, the black dual credit participation rate was 10.6%, while that of white
students was 24.7%. Our analysis indicated that if blacks had the same characteristics as
the average white student, then their participation rate would be 22.7%, which is quite
close to the 24.7% for white students. We found similar patterns for Hispanic students.

Dual-Credit Education Programs in Texas: Phase II
AMERICAN INSTITUTES FOR RESEARCH | AIR.ORG 4
Differences in academic preparation, family income, and the type of high school that a
student attended served as the most significant contributors to disparities in dual-credit
participation by race and ethnicity.
– Differences in access to dual-credit programs, access to Advanced Placement and
International Baccalaureate (AP / IB) coursework, and access to tuition and fee waivers
explained little of the gap in dual-credit participation by race and ethnicity.
Dual Credit Education Advising Practices
The extent to which high school counselors and college advisors actively encouraged
students to participate in dual-credit education varied based on several factors, including
state and district policies and school philosophies about which students could benefit from
and succeed in dual-credit courses.
Most high school guidance counselors played the primary role in advising dual-credit
students, with one quarter sharing this responsibility with college advisors.
– College advisors typically played a secondary role, serving as the key point of contact for
high school counselors and sharing information about dual credit with prospective
students and their families, except in special circumstances.
High school students’ academic and emotional readiness to participate in dual-credit
education, the latitude given to students in dual-credit course selection, and the limited
time advisors had to fulfill their dual-credit advising responsibilities were reported as major
challenges to adequate advising.
To improve dual-credit advising, high school counselors and college advisors most
commonly sought greater clarity on credit-transfer policies, dedicated and well-trained
dual-credit staff, and early advising.
The Academic Rigor of Dual-Credit Education Courses
In the limited sample of College Algebra (Math 1314/1414) and English Composition
(English 1301) courses we examined, we identified more similarities than differences in
dual-credit courses taught by high school teachers (HSDC), dual-credit courses taught by
college faculty (DC), and college-credit only courses taught by college faculty (CC).
– No discernable differences existed in the content covered, the level of cognitive
complexity demanded by student assignments, and the way in which instructors graded
student work across HSDC, DC, and CC courses.

Dual-Credit Education Programs in Texas: Phase II
AMERICAN INSTITUTES FOR RESEARCH | AIR.ORG 5
The skills students were required to master varied slightly by instructor type.
– HSDC, DC, and CC instructors required students to master similar skills in ENGL 1301.
– Math 1314/1414 CC instructors required students to master general mathematics skills
and more so than their HSDC and DC counterparts.
Instructors across HSDC, CC, and DC courses reported using different instructional strategies
to teach students college-level material.
– HSDC and DC instructors were more likely to report using computers as instructional
tools.
– CC instructors were more likely to report requiring students to work more on their own,
summarizing and analyzing information from a variety of sources, and using whole-
group discussion.
The Costs of Delivering Dual-Credit Education
In 2016–17, we estimate that the overall cost of providing dual-credit instruction was $111
per semester credit hour for each participating student, or $121.7 million statewide.
– The incremental revenue generated consisted primarily of funding based upon semester
credit hours (SCHs) and averaged just $38 per SCH.
Tuition and fees arrangements varied widely across the state and had significant effects on
the distribution of costs.
The strongest predictor of overall costs and how costs were distributed across stakeholders
was the type of instructor—HSDC, DC, or CC—teaching the course.
Our estimates suggest that the costs of dual credit delivered through ECHSs was greater
overall but was similar on a per-semester credit hour basis as traditional dual credit
programs.
Overall, our estimates suggest that, on average, the benefits of dual-credit education far
exceeded the costs.
– The short-term benefits (e.g., lower state expenditures for higher education) related to
reduced time to degree were 1.18 times the cost of dual credit. In other words, each
dollar invested in dual credit returned $1.18 from students spending less time in college
and entering the workforce earlier. Long-term monetary benefits (e.g., tax revenues)
associated with a greater number of college graduates were almost five times the
estimated cost of dual credit.

Dual-Credit Education Programs in Texas: Phase II
AMERICAN INSTITUTES FOR RESEARCH | AIR.ORG 6
Policy Recommendations
In this draft report for public comment, we do not make recommendations to develop or
reform current statutes or policies that govern the delivery of dual-credit education. We
recognize that deciding how policy and practice should change based on our research is a
nuanced and complicated process that requires input from stakeholders representing various
perspectives and opinions. Although we have engaged stakeholders in this research on an
informal basis (e.g., meetings with THECB leadership, a webinar for dual-credit administrators
and faculty), we are using a public comment period to more formally gather feedback on this
draft report and the presented findings. The feedback we receive will play a vital role in shaping
how we translate the study’s findings into recommendations to reform policy and practice.
Formal Feedback Process
This draft report was released for public comment at the THECB Board Meeting on July 26,
2018. The research team also will host a webinar for interested stakeholders in early August
and will present detailed findings at the Texas Association of Community Colleges (TACC)
annual conference in Corpus Christi, Texas, on August 2, 2018. The American Institutes for
Research (AIR), which drafted this report, welcomes comments and suggestions to help
contextualize the findings and develop practical policy recommendations grounded in the
research that is presented in this report and elsewhere. The public comment period will be
open through August 27, 2018.
The research team will host a second webinar in late September 2018 to summarize the
comments and suggestions we received through the public comment period. At this time, we
also will share a draft set of policy recommendations that are grounded in the research and
informed by the feedback received through the public comment period. Interested
stakeholders will have the opportunity to submit feedback on the draft recommendations
through October 9, 2018. The research team will then revise its recommendations based on
feedback received and will present a final report at the October 25, 2018, THECB Board
Meeting.

Dual-Credit Education Programs in Texas: Phase II
AMERICAN INSTITUTES FOR RESEARCH | AIR.ORG 7
Introduction
Increasing enrollment and graduation rates in higher education, particularly among historically
underserved students, represents an enduring challenge among educators and policymakers.
Although evidence shows that college has become more accessible to low-income students and
students of color over time, the college enrollment rate for these students has not grown at a
rate comparable to that of traditionally more advantaged students (Perna, 2006). This widening
gap has led to an overwhelming consensus among policymakers, practitioners, and researchers
that not enough improvement has been made relative to college enrollment among
disadvantaged students (Perna, 2006). What is even more troubling is that the overall U.S.
college enrollment rate has recently declined (National Student Clearinghouse Research Center,
2017), and racial and ethnic disparities in college completion are widening (Pfeffer, 2018),
despite efforts to make college more affordable and more responsive to student needs. While
some states, like Texas, have managed to increase college enrollment and completion among
students who are less likely to enroll in college (e.g., low-income students), the continuing
increase in the number of poorer-resourced residents has highlighted a need to develop
specific interventions to help future students pursue and finish higher education.
Identifying and scaling what works to guide more traditionally underrepresented students to
and through college has been problematic for policymakers. One theory of why interventions
have failed to achieve expectations cites a lack of coherence between secondary and
postsecondary education systems (Kirst & Venezia, 2004). Indeed, numerous scholars have
identified the misalignment of academic standards, curricula, assessment, pedagogy, and
expectations between high schools and colleges and universities as putting students at risk of
failing to succeed in college (Carnevale & Desrochers, 2002; Goldrick-Rab, 2010; Harvey &
Houseman, 2004). Low-income students and students of color are disproportionately affected
because they have fewer resources to draw upon to address this disparity (Dounay, 2008).
Dual-credit education is one alternative to business-as-usual practice that has the potential to
integrate secondary and postsecondary sectors, widen college opportunities, and boost college
completion as a result. Dual-credit education programs, which are jointly delivered by high
schools and postsecondary education institutions, concomitantly award high school and college
credit to high school students who enroll in college-level coursework (Bragg & Kim, 2005).
While originally developed to provide academically challenging content to high-achieving
students, dual-credit education programs across the United States now enroll high school
students with varying degrees of academic preparation and exposure to college and with an

Dual-Credit Education Programs in Texas: Phase II
AMERICAN INSTITUTES FOR RESEARCH | AIR.ORG 8
array of postsecondary education goals and expectations. In 2013, the U.S. Department of
Education reported that four of five U.S. high schools offered at least one dual-credit course
(Thomas, Marken, Gray, & Lewis, 2013), illustrating that access to this intervention has become
widespread across U.S. secondary schools. Bailey, Hughes, and Karp (2002) contend that the
strong link between rigorous academic coursework and success in higher education has served
as an impetus for enrolling mid-range and lower achieving students in dual-credit coursework.
About This Report
This report presents findings and offers key takeaways from the second phase of a two year
study on dual-credit education programs in Texas. Phase II extends research conducted by the
RAND Corporation (RAND) in Phase I that, during the 86th Texas Legislature, Regular Session
(2017), provided Texas policymakers and practitioners with an initial appraisal of the
effectiveness and implementation of dual-credit education programs.
Phase II conducts a more in-depth analysis of dual-credit education programs than Phase I,
specifically investigating core issues at the heart of current debates about dual-credit education
in Texas, a state that has rapidly scaled dual-credit education programs. This report builds on
the Phase I study findings to provide Texas decision makers greater insight into questions about
(1) the impact of dual-credit education programs on college access and college completion; (2)
the quality of advising and the rigor of academic content, instructional strategies, and
assessment practices; (3) the costs of delivering dual-credit education; (4) factors that
contribute to racial disparities in dual-credit participation; and (5) changes in patterns of
student participation in dual-credit education, the outcomes of dual-credit students, and the
delivery of dual-credit coursework after the passage of legislative efforts to expand access to
dual-credit education programs. The focus of this study is on “traditional: academic dual credit
education delivered by community colleges. Consequently, results from Phase II lend less
insight into the effectiveness and the implementation of Early College High Schools (ECHS),
career and technical dual credit education, and dual credit education delivered by four-year
universities and colleges. Findings developed during Phases I and II of this study provide Texas
policymakers and stakeholders a more informed understanding of dual-credit education and
will offer an evidence-based roadmap to guide reform intended to improve the effectiveness
and cost-efficiency of dual-credit programs after the public comment period.
In the narrative that follows, we provide a brief overview of the dual-credit education
landscape in Texas and describe Texas’ definition of dual-credit. We also identify the issues at
the core of the current debate surrounding dual-credit education in the state. We then

Dual-Credit Education Programs in Texas: Phase II
AMERICAN INSTITUTES FOR RESEARCH | AIR.ORG 9
summarize findings from Phase I research conducted by Miller and colleagues (2017) and
describe the research conducted for Phase II. Chapters 2 through 4 present the findings from
Phase II, and the report concludes with a synthesis of findings from both phases.
Overview of Dual-Credit Education in Texas
Since 2000, Texas has witnessed an unprecedented increase in the number of high school
students enrolling in dual-credit education programs and in the number of public higher
education institutions (HEIs) delivering dual-credit education in partnership with public high
schools. Between 2000 and 2016, the count of high school students taking at least one dual-
credit course rose from approximately 18,524 to 204,286, an increase of more than 1,100%.
During the same period, the number of HEIs delivering dual-credit education increased from 52
to 108. At present, 79 community colleges (99%), 29 universities (59%), and 1,650 high
schools (93%) provide dual-credit education in Texas.
Two major factors explain why dual-credit education has scaled so quickly in Texas:
• Since 1995, Texas has enacted legislation that has made it easier for students to
participate in dual-credit courses and for HEIs to offer dual-credit education programs.
The architects of these laws not only created explicit funding streams for the delivery of
dual-credit courses but also required high schools to offer students the opportunity to
take at least 12 hours of advanced coursework that may include dual-credit courses. In
2015, the legislature took an additional step to broaden access by passing HB 505, a bill
that prohibits THECB from limiting dual-credit participation exclusively to high school
juniors and seniors and from limiting the number of dual-credit courses a student can
take while enrolled in high school. Nevertheless, HEIs and school districts still can
implement these restrictions if they wish to do so. Based on data from fiscal year 2017,
roughly half (1,545) of institutional partnerships delivered dual-credit education to
ninth- and 10th-grade students.1
• Higher education institutions, particularly community colleges, have taken advantage of
new laws expanding access to college-level coursework. Many institutions promote
dual-credit education as a promising strategy to increase college access and completion
rates. Advocates have drawn on existing research to successfully argue that dual-credit
education addresses many barriers that prevent students from accessing and
1 It is important to note that this statistic does not reveal the amount of dual credit education delivered to ninth- and 10th-grade students. For more information about dual-credit dosage, please refer to Technical Appendix A.

Dual-Credit Education Programs in Texas: Phase II
AMERICAN INSTITUTES FOR RESEARCH | AIR.ORG 10
succeeding in college. They argue that dual-credit education exposes students to the
academic and behavioral demands of college, offers an opportunity to align curricula
and content standards across secondary and postsecondary education by increasing
communication and collaboration between the two sectors, and saves students time
and money relative to degree attainment (Bailey et al., 2002; Edwards & Hughes, 2011;
Hoover & Vargas, 2016).
Defining Dual-Credit Education in Texas
THECB defines dual-credit education as “a process by which a high school student enrolls in a
college course and receives simultaneous academic credit for the course from both the college
and the high school” (Texas Administrative Code [TAC], Title 19, Part I, Chapter 4, Subchapter D,
Rule 4.83). This definition includes the different ways in which dual-credit education is
implemented in practice. For example, we know from the Phase I study that HEIs delivered
dual-credit education programs on high school and college campuses, using high school
teachers and college faculty, and through face-to-face and online instruction, among other
approaches. In Texas, institutions also administer dual-credit education programs in ECHS,
which, according to the TEA, are secondary institutions that offer dual-credit courses that can
lead to either an associate degree or at least 60 semester credit hours toward a baccalaureate
degree for ninth-, 10th-, 11th-, and 12th-grade students at risk of dropping out of high school.
To be considered enrolled in a dual-credit education program, dual-credit partners (i.e., the
high school and the HEI) must confer both high school and college credit for performance in a
dual-credit course. Partnerships that award either high school or college credit (but not both)
for college-level coursework are not defined as dual-credit programs according to Texas law.
Debates Around Dual-Credit Education in Texas
Texas policymakers and practitioners have begun to express reservations about whether dual-
credit education can deliver on its promise to narrow gaps in college enrollment and
completion. Chief among these concerns is the long-held assumption that dual-credit courses
are not as academically rigorous as college-credit only courses. Some dispute the notion that
dual-credit instructors can or will teach courses at a level of rigor equal to that of college-level
courses, given that they face enormous pressure to graduate high school students in order to
meet accountability mandates.
In addition, some concerned stakeholders question whether all high school students are
academically and emotionally prepared to meet the performance criteria of college-level
Dual-Credit Education Programs in Texas: Phase II
AMERICAN INSTITUTES FOR RESEARCH | AIR.ORG 11
courses; and many have questioned how dual-credit partners select students to participate in
dual-credit education programs, how they advise students regarding academic and career and
technical dual-credit courses, and the extent to which high school students benefit
academically from such educational programming. Because Texas does not have a uniform
model to fully fund the implementation of dual-credit education programs, lawmakers also seek
basic knowledge about who bears the costs of delivering dual-credit education and the extent
to which stakeholders are being adequately compensated for their investment.
Summary of Phase I Findings
In July 2017, RAND published findings from Phase I of this study in an interim report on dual-
credit education programs in Texas. For that report, Miller and colleagues (2017) conducted
descriptive quantitative and qualitative analyses examining four focal areas of dual-credit
education of interest to dual-credit stakeholders. Those areas of focus included: (1) academic
achievement and degree attainment of dual-credit students versus nondual-credit students, (2)
participation of different student groups in dual-credit education programs, (3) instructional
and advising practices of community colleges that deliver dual-credit education, and (4) the
number of credits and semesters in which dual-credit students enroll to earn a bachelor’s
degree. Key findings from the study’s Phase I research are summarized below.
High school graduates who participated in dual-credit education programs outperformed
students who did not.
Measures of performance included grades in dual-credit courses and follow-on college-
credit only courses, college remediation, enrollment, persistence, and completion.
Instructional and advising practices used to deliver dual-credit education programs were not
uniform and varied across community colleges.
Resource constraints, geographic proximity to high schools, and institutional latitude over
academic matters contributed to differences in delivery approaches.
Despite notable gains among historically underserved student groups, disparities in dual-credit
education by race/ethnicity, income, gender, and academic background persisted over time.
Traditionally advantaged students (e.g., Whites, gifted, academically talented) stood a much
greater chance of participating in dual-credit education than historically disadvantaged
students (e.g., Black, Hispanic, economically disadvantaged).

Dual-Credit Education Programs in Texas: Phase II
AMERICAN INSTITUTES FOR RESEARCH | AIR.ORG 12
Dual-credit students did not progress more efficiently toward a bachelor’s degree than
nondual-credit students.
High school graduates who participated in dual-credit education took about 142 credits,
including credits earned in dual-credit education programs, to complete a bachelor’s
degree. That average was similar to the number of credits earned by high school graduates
who did not enroll in dual-credit education. Nevertheless, dual-credit students generally
graduated one semester sooner than did their nondual-credit peers.
Overview of Phase II
Objective of Phase II Research
In April 2017, AIR was awarded funding to conduct Phase II of this research. The purpose of
Phase II was to examine areas of dual-credit education that Phase I was unable to explore but
that remained of interest to Texas state and local education decision makers. Unlike the fast
turnaround (approximately six months) and relatively narrow research focus of the study’s first
phase, Phase II was conducted over the course of a year and included six specific study
components: (1) a causal impact study, (2) a racial disparities study, (3) an HB 505 study, (4) an
advising study, (5) an academic rigor study, and (6) a cost study. In its design, Phase II
intentionally provided stakeholders a more in-depth understanding of how well dual-credit
education programs were working, how they were delivered to students in practice, and who
bore the costs of delivering dual-credit education. Decision makers will be able to link the
overall effectiveness and cost of dual-credit education with specific features of how dual-credit
programs are delivered by connecting the results of all six components. This, in turn, will
facilitate the identification of areas in need of support or reform.
Phase II Research Methods
Phase II was a multicomponent study that employed the concurrent mixed-model design
approach. This design allowed the research team to conduct parallel quantitative and
qualitative studies that, together, will help decisionmakers understand the relationships
between several aspects of dual-credit education, such as its effectiveness and the ways it is
delivered to high school students. To answer research questions (RQs) from Phase II, AIR drew
on a range of analytical techniques and data sources. In each of the subsequent chapters of this
report and in the technical appendices, we detail the methods and data used to conduct each
study component.

Dual-Credit Education Programs in Texas: Phase II
AMERICAN INSTITUTES FOR RESEARCH | AIR.ORG 13
How Phase II Research Questions Addressed Current Knowledge Gaps
Phase II was designed to answer six RQs designed to expand knowledge about dual-credit
education in Texas beyond what was investigated in Phase I. Following, we list these RQs in the
order in which they are presented in the report and briefly describe the knowledge gaps that
motivated them, as well as the methods we used to answer them.
RQ 1: To what extent did dual-credit education increase college enrollment, credential
attainment, and efficient degree completion?
Phase I found that, on average, dual-credit students outperformed students who did not
participate in dual-credit education programs on a wide range of achievement measures.
Generally, Texas high school students must meet various eligibility criteria to enroll in dual-credit
education. Thus, students who participate in dual-credit education programs are likely different
from those who do not. For example, Phase I discovered that dual-credit students were more
likely to be identified as gifted, academically talented, and White than were nondual-credit
students. Because Phase I did not account for differences between dual-credit and nondual-credit
students, estimates measuring the effect of dual-credit education on student success captured
not only the effect of dual-credit education but also the effect of individual characteristics that
affect how well a student performs in school. Consequently, these measures do not describe the
true impact of dual-credit education on college access and college completion.
To assess the extent to which dual-credit education—independent of other factors—affected
the chances of a given student achieving academic milestones and reaching them more
efficiently, AIR employed a more rigorous research method; specifically, the instrumental
variable approach embedded with a difference-in-different framework. Drawing on THECB and
TEA administrative data across 16 student cohorts, AIR examined the extent to which
improvements in high school and college degree attainment, college enrollment, and efficient
degree completion over time occurred in precise relation to when a high school began offering
dual-credit courses. AIR started with the cohort of students who were in their junior year of
high school in 2000. As part of the analysis, AIR also examined the extent to which participation
in dual-credit education had differential impacts on student outcomes for students with varied
demographic and academic backgrounds (e.g., race/ethnicity, free or reduced-price lunch
status, gifted and academically talented).
Because insufficient time has passed to measure the effectiveness of dual-credit programs since
the enactment of HB 505, results from this analysis apply specifically to dual-credit education

Dual-Credit Education Programs in Texas: Phase II
AMERICAN INSTITUTES FOR RESEARCH | AIR.ORG 14
programs implemented before 2015. Moreover, our econometric approach required us to
exclude dual credit delivered through ECHSs from this component of the study. We do not view
this as a major limitation, since a number of rigorous studies that have included ECHS programs
in Texas have documented the benefits of ECHS for a wide range of students, including those
who are traditionally underrepresented in postsecondary education.
RQ 2: How did high school counselors and college advisors select students for dual-credit
education, advise them into enrolling in dual-credit courses, and coordinate advising
services?
Because Texas law does not prescribe how HEIs should advise dual-credit students, models of
dual-credit advising vary considerably. Qualitative research conducted during Phase I found
that some community colleges that delivered dual-credit education relied on high school
counselors to advise dual-credit students, while other community colleges employed college
advisors. Phase I also found that the degree to which college advisors interacted and engaged
with dual-credit students and their families differed depending on resource constraints,
geographic proximity to the high school, and the types of courses colleges offered dual-credit
students.
Based on Phase I research, it is difficult to discern the extent to which these different
approaches adequately support dual-credit students as they navigate the complexities of
college. To address this knowledge gap, AIR conducted in-depth, semi-structured interviews
with high school guidance counselors and college advisors working with dual-credit students in
dual-credit education partnerships that represented the full spectrum of models delivered
across the state. These interviews collected information on a range of topics that accurately
characterized partnerships’ advising approaches and solicited suggestions for how to improve
advising processes. The interviews specifically addressed (1) the types of students who were
targeted for dual-credit education; (2) the roles of high school guidance counselors and college
advisors and how they worked together to coordinate advising activities; (3) the factors that
high school counselors and college advisors considered when counseling students regarding
specific dual-credit courses; (4) the challenges that dual-credit advisors or counselors
encountered when counseling dual-credit students; and (5) suggestions from high school
counselors and college advisors for improving dual-credit student advising.
It is important to note that we designed the advising study to include a broad range of DC
partnerships, including ECHS, DC delivered by two and four-year colleges in both urban and
rural settings, and DC programs that deliver a significant number of CTE dual credit courses.
Dual-Credit Education Programs in Texas: Phase II
AMERICAN INSTITUTES FOR RESEARCH | AIR.ORG 15
However, the study provided richer information about advising for academic DC courses
delivered by two-year colleges, since such courses represent the vast majority of DC courses
delivered in the state.
RQ 3: How were dual-credit students taught and assessed relative to college-credit only
students?
Institutionss have considerable latitude over how they deliver dual-credit instruction. Phase I
found that colleges employed a higher percentage of high school teachers to teach college
courses that counted for dual-credit versus those courses counting for college credit only.
Further, Phase I discovered that instructors who taught dual-credit courses were more likely to
be adjunct professors and were less likely to hold doctoral degrees compared with instructors
who taught college-credit only courses.
How do these differences affect the quality of instruction that dual-credit students receive, and
to what extent is dual-credit instruction on par with college-credit only instruction in terms of
academic rigor? To address these questions, we examined content, instructional strategies,
student assignments, and graded student work across three course types: (1) dual-credit
courses taught by HSDCs, (2) dual-credit courses taught by DCs, and (3) college-credit only
courses taught by CCs. For this analysis, AIR focused on two common courses taken by dual-
credit students: College Algebra (Math 1314/1414) and English Composition (English 1301).
Using a rubric vetted by content and curriculum experts, AIR assessed the extent to which there
were systematic, discernible differences in the rigor and quality of dual-credit versus college-
credit only materials, including syllabi, student assignments, and graded work products (e.g.,
examinations, assignments, portfolios). In addition, AIR administered an instructional survey to
participating teachers and faculty to collect information on the use of instructional practices
across HSDC, DC, and CC courses.
It is important to note that this component of the study focused only of dual-credt and college-
credit only courses delivered by community colleges, and does not distinguish between courses
delivered through ECHS versus regular dual credit partnerships.
RQ 4: What were the annual costs of delivering dual-credit education, and how were they
distributed among stakeholders? Also, how did these costs compare to the benefits of dual-
credit education?
A key limitation of the Phase I research was its inability (due to the defined parameters of its
focus) to investigate costs related to the delivery of dual-credit education programs. In Texas,

Dual-Credit Education Programs in Texas: Phase II
AMERICAN INSTITUTES FOR RESEARCH | AIR.ORG 16
both HEIs and school districts receive formula funding to deliver dual-credit education; but they
also rely on other financial sources (e.g., students, families, communities) and employ different
staffing structures to support the administration of those programs. Texas lawmakers lack
evidence on whether state and local funding sources for HEIs are sufficient to account for the
additional costs that HEIs incur through dual-credit education or whether the state’s
investment in dual-credit education provides monetary returns that exceed associated costs.
Phase II shed light on this particular issue by estimating the overall cost of delivering dual-credit
education in the state. It did so by calculating how the cost of delivering dual-credit education
was shared among a variety of stakeholders and by conducting an analysis that compared costs
of delivering dual-credit education against the monetizable benefits derived from dual-credit
programs. In carrying out this study, AIR relied on a mix of data sources, including THECB and
TEA administrative records; dual-credit Memoranda of Understanding (MOUs); and interviews
with HEI, school district, and high school administrators to uncover the visible and hidden costs
of delivering dual-credit education.
The cost study focused only on academic dual-credit courses delivered by community colleges,
so the findings cannot speak to costs of CTE dual credit. However, we included a sufficient
number of ECHSs in our sample to estimate the costs of DC delivered through regular DC
partnerships versus ECHSs. While we purposefully included DC partnerships that deliver DC
courses to rural high schools in our sample to make the cost estimates more reflective of the
state as a whole, we are unable to provide separate cost estimates for DC delivered in urban
versus rural settings.
RQ 5: Which factors contributed to racial and ethnic disparities in dual-credit participation?
Quantitative analyses conducted during Phase I showed that students of color (e.g., Black and
Latino students) were less likely to participate in dual-credit courses compared to White
students, despite the fact that students in that group experienced the largest gains in dual-
credit participation since 2000 among all student groups. These data raised an important
question: Why are students of color participating in dual-credit programs at lower rates than
White students? Phase II answered this question by drawing on TEA and THECB administrative
records to examine the extent to which the following factors could explain these participation
rates:
Differences in the preparation and demand for dual-credit education across demographic
groups

Dual-Credit Education Programs in Texas: Phase II
AMERICAN INSTITUTES FOR RESEARCH | AIR.ORG 17
Access to dual-credit education and alternative forms of advanced coursework (e.g.,
Advanced Placement [AP], International Baccalaureate [IB]) across high schools
The influence of advising practices on dual-credit participation gaps
The interviews conducted with high school guidance counselors and college advisors as part of
the advising component of the study also were used to explore whether implicit bias or
discrimination in advising practices might have contributed to these disparities.
RQ 6: What were the patterns in dual-credit participation, success, and delivery before and
after HB 505?
Passed in 2015, HB 505 prohibited the state from limiting access to dual-credit education to
juniors and seniors or from restricting the number of dual-credit semester credit hours high
school students could take. Since then, lawmakers have expressed concern that the rules
around who can participate in dual-credit education programs have become too lax, allowing
students who are not academically or emotionally prepared to enroll in dual-credit education to
do so. Although Phase I descriptively examined changes in dual-credit participation and
delivery, as well as the outcomes of dual-credit students, it did so using data compiled only
prior to fiscal year 2015. As such, Texas lawmakers had a minimal understanding of whether
there were any changes in dual-credit participation, success, and delivery since passage of HB
505.
AIR filled this information gap by drawing on THECB and TEA administrative data to specifically
examine the extent to which current dual-credit participation rates overall, by grade, and by
various student characteristics (e.g., race/ethnicity, academic background) have changed since
passage of HB 505. Complementing this analysis, AIR also investigated changes in college
enrollment, course performance, and college completion, as well as the average number of dual-
credit semester credit hours with which a student matriculated to complete a four-year degree.
The Role of THECB in Phase II Research
AIR is strongly committed to connect research to improve education policy and practice. Our
researchers and technical consultants work closely with state policymakers and local
practitioners to identify problems of policy and practice, as well as to address their research
needs. In partnership with THECB, AIR determined dual‐credit education to be a matter of
interest, and THECB staff contributed their expertise to properly contextualize results and to
ensure that the study could inform the Board’s legislative recommendations. In addition, THECB
Dual-Credit Education Programs in Texas: Phase II
AMERICAN INSTITUTES FOR RESEARCH | AIR.ORG 18
staff facilitated access to administrative data collected by the Board and the TEA, supported AIR
efforts to collect data, and collected MOUs from Texas dual-credit partnerships. To avoid
compromising the objectivity and integrity of the research, however, THECB was not involved in
designing the study, gathering primary data, or analyzing primary or secondary data.
Roadmap of This Report
This report is divided into five chapters. Chapter 1 presents research conducted to examine (1)
the impact of dual-credit education programs on student outcomes and efficient degree
completion, (2) the factors contributing to racial and ethnic disparities in dual-credit education
participation, and (3) changes in dual-credit education occurring since passage of HB 505.
Chapter 2 examines how students were advised relative to dual-credit education programs and
how they were guided through dual-credit education coursework, as well as how HEIs and high
schools worked together to deliver dual-credit advising. Chapter 3 examines how dual-credit
students are taught and assessed relative to college-credit only students. Chapter 4 quantifies
the costs of delivering dual-credit education, explains how these costs are shared among
stakeholders, and describes the costs of delivering dual-credit education compared with its
benefits. Chapter 5 concludes this report with key findings from each study component.
Acknowledgements
The authors gratefully acknowledge the Texas Foundation for Higher Education, with support
from Educate Texas, a public‐private initiative of Communities Foundation of Texas, Greater
Texas Foundation, Houston Endowment, and the Meadows Foundation, which made this study
possible. We also acknowledge the support of THECB and TEA for providing the administrative
data that allowed us to conduct this research. We are thankful for feedback received,
particularly from Stacey Avery, Linda Battles, Jerel Booker, Julie Eklund, David Gardner, Ginger
Gossman, Andrew Lofters, Raymund Paredes, and Rex Peebles who helped us to understand
crucial aspects of how dual-credit education programs are delivered to high school students in
Texas. Finally, we thank the Publication and Creative Services team at AIR, which edited and
formatted this report, as well as Kerstin Le Floch from AIR who provided expertise as an outside
reader.

Dual-Credit Education Programs in Texas: Phase II
AMERICAN INSTITUTES FOR RESEARCH | AIR.ORG 19
Chapter 1: Quantitative Findings
In this chapter, we present results from our quantitative analysis of dual-credit programs in
Texas. We designed our quantitative analysis to address three of the primary RQs from the
larger study. Specifically, we addressed the following questions:
RQ 1 What factors contribute to racial / ethnic disparities in dual-credit participation?
RQ 2 What changes in dual-credit participation, success, and delivery have occurred since the
passage of HB 505?
RQ 3 To what extent does dual-credit participation increase college enrollment, degree
attainment, and efficient degree completion?
Questions 1 and 2 are descriptive in nature, while question 3 requires the use of state-of-the-
art econometric methods to assess the causal impact of dual-credit participation on student
outcomes.
Background and Policy Context
Dual-credit education has been held as a policy option that could improve college participation
and completion and is expanding rapidly nationwide. Advocates of dual-credit programs argue
that it can help students adjust to college expectations, provide academically challenging
courses, help to align curriculum across high school and colleges, and may help lower costs to
students and reduce overall time to earning a degree. Although public sentiment regarding
dual-credit is positive, it is not without critics. Specific criticisms include concerns over the rigor
of dual-credit courses relative to college-credit only courses, difficulties surrounding the
transfer of dual-credit courses once students enroll after high school, as well as concerns that
limited access and quality of dual-credit courses for disadvantaged students could exacerbate
already large inequities in college enrollment and completion.
A large and growing body of national research on the impact of dual-credit education sheds
light on some of these issues, but significant gaps remain. Indeed, a recent Intervention Report
from the U.S. Department of Education’s What Works Clearinghouse (WWC) concluded that the
national research on dual-credit education has been largely positive but is lacking in many ways
(U.S. Department of Education, 2017). The vast majority of the 35 studies of dual-credit
considered by the WWC for the Intervention Report found that dual-credit education programs
are related to positive student outcomes. However, most studies of general dual-credit
education were descriptive in nature, with just three studies (An, 2013; Giani, Alexander, &

Dual-Credit Education Programs in Texas: Phase II
AMERICAN INSTITUTES FOR RESEARCH | AIR.ORG 20
Reyes; 2014; Struhl & Vargas, 2012) employing quasi-experimental methods that met WWC
standards “with reservations.” Although two experimental studies of ECHSs (Berger, Tuck-
Bicacki, Garet, Knudson, & Hoshen, 2014; Edmunds et al., 2015) met WWC “without
reservations” and found positive impacts on high school completion and college enrollment, it
is unclear how those results translate to dual-credit education generally—where models of
advising and instruction are less prescribed. Moreover, nearly all studies of dual-credit
education and ECHSs focused overwhelming on short-term outcomes like high school
completion and college enrollment, so lawmakers know very little about the extent to which
dual-credit programs improve college completion or the degree to which it reduces credits or
time to degree, particularly for students who are traditionally less likely to pursue a
postsecondary credential after high school.
Our causal impact study addresses a number of gaps in the research base. In particular, it is one
of the first studies to use methods designed to isolate the causal impact of general dual-credit
programs at scale short- and long-term student outcome, and is one of the first to examine the
impact of dual-credit participation on time and semester credit hours (SCH) to degree.
Organization of Chapter
We begin by describing the data we used to address each of the three RQs. Next, we describe the
general approach to the descriptive analyses we used to address questions 1 and 2 and present
results related to each of those questions. Next we describe our econometric approach to
addressing question 3 and go on to present relevant findings from the causal impact study. We
end the chapter by summarizing the key findings from the quantitative analyses.
Data
Our analyses draw on administrative databases from THECB and TEA that allow us to track
Texas public high school students through high school and into any public college or university
in Texas.2 For FY 2000–17, we can use these files to capture individual-level information on
student demographics and student participation in dual credit in high school, including the
number of SCH earned in high school as dual-credit. During these years, we are also able to
capture information on enrollment SCH earned and degree completion at any public or private
college in Texas. For all college-level courses completed in 2012–17, which include those
2 As described in the Appendix A, some analyses also track students into any private colleges in Texas, while others also track students into out-of-state colleges. We only have this data for some cohorts and outcomes, so not all analyses track students to these colleges.

Dual-Credit Education Programs in Texas: Phase II
AMERICAN INSTITUTES FOR RESEARCH | AIR.ORG 21
delivered for dual-credit, we can also capture more detailed course-level information, including
information about the course modality (face-to-face, online, or hybrid), faculty characteristics
(tenured, adjunct, and whether the instructor of record was also employed as a high school
teacher), and location of delivery (on a college campus, on a high school campus, or at an
ECHS). We also draw on data from the National Student Clearinghouse, which allows us to
capture enrollment and degree completion during Academic Year (AY) 2008-17.
We use the files above to develop two analytic data files that we draw upon for various
analyses. Our primary analytic data file that we use for questions 1 and 3 tracks the 2001–16
cohorts of juniors at Texas public high schools through high school and into Texas colleges and
universities, capturing information on demographics, dual-credit participation, college
enrollment and completion, and SCH and time to degree. Because HB 505 was not passed until
2015, we use a different analytic file to address question 2. Specifically, we observe dual-credit
participation and success for all then-current Texas public high school students from 2012–17.
We define a student being enrolled in an ECHS if the high school they attend is an ECHS or if it
shares a campus with an ECHS. Prior to 2015, we cannot directly see if a student attending a
high school that shares a campus with an ECHS is enrolled in dual-credit through the ECHS or
through the traditional high school. As such, we treat all students on a campus with an ECHS as
attending an ECHS. For questions 1-2, we omit students attending an ECHS from the analysis.
For descriptive analyses in question 3 that examine the prevalence of ECHS relative to other
forms of dual-credit, our estimates can be taken as an upper bound.
We describe the individual administrative data files that we draw on and the approach we used
to link them to develop our analytic data files in Appendix A.
Approach to Questions 1 and 2
We use our two analytic data files to paint a rich descriptive picture of patterns in dual-credit
participation, delivery and course taking in Texas over time, and we primarily rely on simple
descriptive statistics presented in intuitive figures and tables to achieve this. However, where
appropriate, we employ regression methods to make more nuanced comparisons. Throughout
this section, unless otherwise noted, all reported differences in relevant variables are
statistically significant at conventional levels (95%).

Dual-Credit Education Programs in Texas: Phase II
AMERICAN INSTITUTES FOR RESEARCH | AIR.ORG 22
Racial Disparities
Findings Related to Question 1: What Factors Contribute to Disparities in Dual-Credit
Participation?
In Phase I of the dual-credit study, RAND found disparities in dual-credit participation across
race / ethnicity and income. Figure 1.1 that follows is taken from RAND’s Interim Report and
shows dual-credit participation rates by race/ethnicity for the 2001–15 cohorts of Texas public
high school graduates. The results demonstrated that Whites and Asians had higher
participation rates than Blacks and Hispanics throughout the study period. Dual-credit
participation rates of White high school graduates peaked at about 30% in 2011 and declined to
26% in 2015. Dual-credit participation rates of Blacks peaked at about 13% in 2009 and declined
to approximately 10% by 2015. Similarly, dual-credit participation rates of Hispanics peaked at
about 20% in 2011 and declined to approximately 16% by 2015.
Figure 1.1. Dual-Credit Participation Rates by Race/Ethnicity (2001–15)
Figure 1.2 reports the dual-credit participation rate by race/ethnicity for the 2001–16 cohorts of
Texas high school juniors using our updated data and confirms gaps in dual-credit participation
by race/ethnicity. Specifically, while 24.7% of White Texas public high school juniors took a
dual-credit course during their junior or senior year of high school, the corresponding figure for
Blacks and Hispanics was 10.6% and 15.6%, respectively.

Dual-Credit Education Programs in Texas: Phase II
AMERICAN INSTITUTES FOR RESEARCH | AIR.ORG 23
Figure 1.2. Dual-Credit Participation by Race/Ethnicity (Student Cohorts of Juniors Enrolled in
Dual-Credit Education in 11th and / or 12th Grade: 2001–16; n = 3,422,095)
While Phase I documented the persistent disparities in dual-credit participation, it was only
able to hypothesize about potential reasons underlying their existence. In this section, we use
descriptive analyses to assess the extent, if any, to which different factors underlying gaps in
dual-credit participation across race/ethnicity. Our analysis focuses on the following potential
factors: (1) differences in dual-credit access across high schools in Texas, (2) differences in
academic preparation, (3) differences in income, (4) differences in access to alternative forms
of college-level coursework in high school, such as AP and IB courses, (5) differences in access
to tuition and fee waivers for dual-credit students across high schools, and (6) differences in the
types of high schools they attend. We also investigate in Chapter 2 whether dual-credit advising
practices may contribute to disparities in dual-credit participation by race/ethnicity.
To assess the extent to which different factors contributed to the gaps shown in Figure 1.2, we
began by running a series of Ordinary Least Squares (OLS) regression models predicting the
probability of dual-credit participation as a function of a student’s race/ ethnicity, holding each
factor considered constant. We then use the results of these regression models to replicate the
analysis used to create Figure 1.2, holding the factor constant at the mean value for White
24.7
10.6
15.6
20.7
19.0
05
10
15
20
25
Dua
l C
redit P
art
icip
ation
Pe
rcen
t
Baseline
White Black
Hispanic Asian
Other

Dual-Credit Education Programs in Texas: Phase II
AMERICAN INSTITUTES FOR RESEARCH | AIR.ORG 24
students across race and ethnic groups. We describe these models and the process used to
develop the adjusted figures in greater detail in Appendix A.
Differences in Dual-Credit Access Explains Very Little of the Gap in Dual-Credit
Participation Across Race/Ethnicity
One factor that could partially explain gaps in dual-credit participation across race/ethnicity is
differential access to dual-credit courses. Our analysis shows that during the 2015–16 academic
year, 93% of high schools in Texas offered at least one dual-credit course3. Although the rate is
high statewide, it is possible that underrepresented minorities are more concentrated in schools
without dual-credit programs, which would contribute to the gap in dual-credit participation
across race/ethnicity. To explore this hypothesis, the rightmost set of columns in Figure 1.3 shows
the predicted difference in dual-credit participation across race and ethnic groups in Texas when
holding differences in dual-credit access constant across race and ethnic groups. Here, we say a
student has dual-credit access if, during his/her junior year, s/he attended a high school that
offered at least one dual-credit course. The leftmost set of columns in Figure 1.3 show the raw
unadjusted difference in dual-credit participation by race/ethnicity that are reported in Figure
1.2. The fact that the adjusted and unadjusted dual-credit participation rates are nearly identical
suggests that differences in dual-credit access across race/ethnicity explains very little of the
observed gaps in dual-credit participation across those groups.
3 The majority of high schools that did not offer dual-credit courses were non-traditional schools such as alternative, charter, or disciplinary schools.

Dual-Credit Education Programs in Texas: Phase II
AMERICAN INSTITUTES FOR RESEARCH | AIR.ORG 25
Figure 1.3. Dual-Credit Participation by Race/Ethnicity, Adjusting for Differences in Dual-
Credit Access (Student Cohorts of Juniors Enrolled in Dual-Credit Education in 11th and / or
12th Grade: 2001–16; n = 3,422,095)
Differences in Academic Preparation Explain Some, But Not All, of the Gap in Dual-
Credit Participation Across Race/Ethnicity
Another factor that could partially explain differences in dual-credit participation across
race/ethnicity is differences in academic preparation. Dual-credit participation is limited to
students who are academically prepared to take dual-credit courses, and eligible students with
lower levels of baseline preparation may be less likely to participate in dual credit due to the
difficulty of the course or lower desire to enroll in college after high school. Because we know
that underrepresented minorities tend to have lower achievement test scores compared to
Whites on average, this factor is likely to contribute to the observed differences in dual-credit
participation across race/ethnicity. To examine this, the rightmost columns of Figure 1.4 shows
the predicted difference in dual-credit participation across race and ethnic groups in Texas
when holding differences in academic preparation constant across race and ethnic groups. We
proxy for academic preparation in a student’s junior year by controlling for his/her score on
that state mathematics and reading achievement tests, the Texas Assessment of Academic
24.7
10.6
15.6
20.7
19.0
05
10
15
20
25
Dual C
redit P
art
icip
ation P
erc
ent
Baseline
24.5
10.6
15.5
20.4
18.9
05
10
15
20
25
Dual C
redit P
art
icip
ation P
erc
ent
High School offering DC
White Black
Hispanic Asian
Other

Dual-Credit Education Programs in Texas: Phase II
AMERICAN INSTITUTES FOR RESEARCH | AIR.ORG 26
Skills (TAAS), Texas Assessment of Knowledge and Skills (TAKS), or State of Texas Assessments
of Academic Readiness (STAAR) exams, in the eighth grade. The results suggest that differences
in academic preparation across race/ethnicity contribute significantly to the observed gaps in
dual-credit participation. For example, if Hispanic students had the same eighth grade
mathematics and reading scores as the typical White student, then their dual-credit
participation rate would increase from 15.6% to 20.8%. Similarly, if Black students had the same
eighth grade mathematics and reading scores as the typical White student, then their dual-
credit participation rate would increase from 10.6% to 17.8%. The adjusted participation rates
for underrepresented minorities are still below the dual-credit participation rate of 24.7% for
White students, suggesting that differences in academic preparation do not fully explain the
dual-credit participation gap.
Figure 1.4. Dual-Credit Participation by Race/Ethnicity, Adjusting for Differences in Eighth-
Grade Achievement Test Scores (Student Cohorts of Juniors Enrolled in Dual-Credit Education
in 11th and / or 12th Grade: 2001–16; n = 3,422,095)
24.7
10.6
15.6
20.7
19.0
05
10
15
20
25
Dual C
redit P
art
icip
ation P
erc
ent
Baseline
24.7
17.8
20.8
18.2
20.2
05
10
15
20
25
Dual C
redit P
art
icip
ation P
erc
ent
Eighth Grade Test Scores
White Black
Hispanic Asian
Other

Dual-Credit Education Programs in Texas: Phase II
AMERICAN INSTITUTES FOR RESEARCH | AIR.ORG 27
Differences in Income Explain Some, But Not All, of the Gap in Dual-Credit
Participation Across Race/Ethnicity
Another factor that could partially explain differences in dual-credit participation across
race/ethnicity is differences in income. In many cases, dual-credit participants must contribute
to tuition and fees or purchase books and other course materials for dual-credit courses. In
other cases, students may need transportation to attend dual-credit courses on college
campus. Because we know that underrepresented minorities tend to have lower income
compared to Whites on average, this factor is likely to contribute to the observed differences in
dual-credit participation across race/ethnicity. To explore this factor, Figure 1.5 shows the
predicted difference in dual-credit participation across race and ethnic groups in Texas when
holding differences in income (measured by free or reduced-price lunch eligibility) constant
across race and ethnic groups at the mean value for White students. The results suggest that
differences in income across race/ethnicity contribute significantly to the observed gaps in
dual-credit participation. For example, if Hispanic students had the same rate of free or
reduced-price lunch eligibility as the typical White student, then their dual-credit participation
rate would increase from 15.6% to 19.0%. Similarly, if Black students had the same rate of free
and reduced price eligibility as the typical White student, then their dual-credit participation
rate would increase from 10.6% to 13.2%. The adjusted participation rates for
underrepresented minorities are still well below the dual-credit participation rate of 24.7% for
White students, suggesting that differences in income do not fully explain the dual-credit
participation gap.
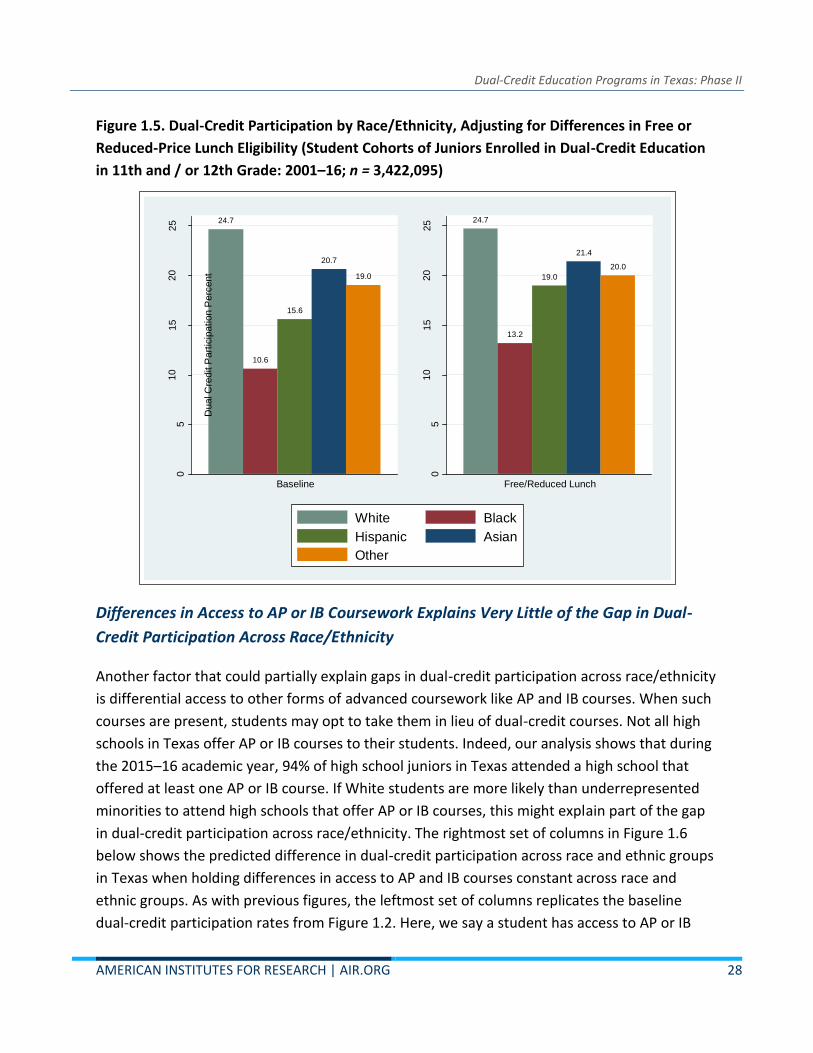
Dual-Credit Education Programs in Texas: Phase II
AMERICAN INSTITUTES FOR RESEARCH | AIR.ORG 28
Figure 1.5. Dual-Credit Participation by Race/Ethnicity, Adjusting for Differences in Free or
Reduced-Price Lunch Eligibility (Student Cohorts of Juniors Enrolled in Dual-Credit Education
in 11th and / or 12th Grade: 2001–16; n = 3,422,095)
Differences in Access to AP or IB Coursework Explains Very Little of the Gap in Dual-
Credit Participation Across Race/Ethnicity
Another factor that could partially explain gaps in dual-credit participation across race/ethnicity
is differential access to other forms of advanced coursework like AP and IB courses. When such
courses are present, students may opt to take them in lieu of dual-credit courses. Not all high
schools in Texas offer AP or IB courses to their students. Indeed, our analysis shows that during
the 2015–16 academic year, 94% of high school juniors in Texas attended a high school that
offered at least one AP or IB course. If White students are more likely than underrepresented
minorities to attend high schools that offer AP or IB courses, this might explain part of the gap
in dual-credit participation across race/ethnicity. The rightmost set of columns in Figure 1.6
below shows the predicted difference in dual-credit participation across race and ethnic groups
in Texas when holding differences in access to AP and IB courses constant across race and
ethnic groups. As with previous figures, the leftmost set of columns replicates the baseline
dual-credit participation rates from Figure 1.2. Here, we say a student has access to AP or IB
24.7
10.6
15.6
20.7
19.0
05
10
15
20
25
Dual C
redit P
art
icip
ation P
erc
ent
Baseline
24.7
13.2
19.0
21.4
20.0
05
10
15
20
25
Dual C
redit P
art
icip
ation P
erc
ent
Free/Reduced Lunch
White Black
Hispanic Asian
Other

Dual-Credit Education Programs in Texas: Phase II
AMERICAN INSTITUTES FOR RESEARCH | AIR.ORG 29
courses if, during his/her junior year, s/he attended a high school that offered at least one AP
or IB course. The fact that adjusted participation rates in the rightmost columns of Figure 1.6
are nearly identical to the baseline dual-credit participation rates in the leftmost columns
suggests that differences in access to AP and IB courses across race/ethnicity explains very little
of the observed gaps in dual-credit participation across those groups.
Figure 1.6. Dual-Credit Participation by Race/Ethnicity, Adjusting for Differences in Access to
AP and IB Courses (Student Cohorts of Juniors Enrolled in Dual-Credit Education in 11th and /
or 12th Grade: 2001–16; n = 3,422,095)
Differences in High Schools Attended by Students of Different Race/Ethnic Groups
Explains Some, But Not All, of the Gap in Dual-Credit Participation
Another factor that could explain some of the gap in dual-credit participation across race/ethnic
groups is differences in the high schools attended across race/ethnicity. White student are
more likely to attend better resourced schools in more affluent areas. Attendance at such
schools may promote dual-credit participation by better preparing students for dual-credit
coursework, by more actively promoting dual-credit programs to students, or by exposing
students to more peers with college aspirations. To explore this factor, Figure 1.7 shows the
24.7
10.6
15.6
20.7
19.0
05
10
15
20
25
Dual C
redit P
art
icip
ation P
erc
ent
Baseline
24.6
10.7
15.7
20.9
19.1
05
10
15
20
25
Dual C
redit P
art
icip
ation P
erc
ent
High School offering AP/IB
White Black
Hispanic Asian
Other

Dual-Credit Education Programs in Texas: Phase II
AMERICAN INSTITUTES FOR RESEARCH | AIR.ORG 30
predicted difference in dual-credit participation across race and ethnic groups in Texas when
holding high school attendance patterns constant across race and ethnic groups at the mean
value for White students.4 The results suggest that differences in high school factors across
race/ethnicity contribute significantly to the observed gaps in dual-credit participation for Black
students, but not much for Hispanic students. For example, if Black students attended the same
high schools in equal rates as White students, then their dual-credit participation rate would
increase from 10.6% to 13.7%. Although the results suggest that if Hispanic students attended
the same high schools in equal rate as White students, then their dual-credit participation rate
would decrease slightly from 15.6% to 14.6%, this difference is not statistically significant. In
either case, the adjusted participation rates for underrepresented minorities are still well below
the dual-credit participation rate of 24.7% for White students, suggesting that differences in
where students go to high school do not fully explain the dual-credit participation gap.
4 To do so, we run an OLS model predicting dual credit participation by race/ethnicity and including a high school fixed effect. We then project the dual credit participation rate for each race/ethnic group for a student with a weighted average of the high school fixed effects, where the weight for a given high school is the share of White students at the high school divided by the total number of White students in the state.

Dual-Credit Education Programs in Texas: Phase II
AMERICAN INSTITUTES FOR RESEARCH | AIR.ORG 31
Figure 1.7. Dual-Credit Participation by Race/Ethnicity, Adjusting for Differences in Where
Students Attended High School (Student Cohorts of Juniors Enrolled in Dual-Credit Education
in 11th and / or 12th Grade: 2001–16; n = 3,422,095)
Differences in Access to Tuition and Fee Waivers Across High Schools Within Texas
Explains Very Little of the Gap in Dual-Credit Participation Across Race/Ethnicity
Another factor that could explain some of the gap in dual-credit participation across
race/ethnicity is access to tuition and fee waivers for dual-credit courses. As described later in
Chapter 4, policies governing the charging of tuition and fees for dual-credit students varies
considerably across dual-credit programs. Many community colleges do not charge tuition to
any of their dual-credit students, some charge the same tuition for a dual-credit course as they
would for a college credit only course, and still others charge some tuition but a lower rate than
is charged for the equivalent college-credit only course. In some cases, community colleges
offer tuition and fee waivers or discounted tuition to some dual-credit students but not others.
If White students are more likely to attend high schools with community college partners that
offer tuition and fee waivers than are underrepresented minorities, this could explain some of
the gap in dual-credit participation across race/ethnicity. To explore this factor, we obtained
data from the Texas Association of Community Colleges on tuition and fee waiver policies for
24.7
10.6
15.6
20.7
19.0
05
10
15
20
25
Dual C
redit P
art
icip
ation P
erc
ent
Baseline
24.2
13.714.6
25.7
22.2
05
10
15
20
25
Dual C
redit P
art
icip
ation P
erc
ent
Campus FEs
White Black
Hispanic Asian
Other

Dual-Credit Education Programs in Texas: Phase II
AMERICAN INSTITUTES FOR RESEARCH | AIR.ORG 32
the 2016–17 academic year at all community colleges in Texas. The data provide information on
whether each community college provided a full or partial tuition and fee waiver to all or some
of the students taking dual-credit courses at their institution. The rightmost set of columns in
Figure 1.8 below shows the predicted difference in dual-credit participation across race and
ethnic groups in Texas when holding differences in access to tuition and fee waivers constant
across race and ethnic groups. Figure 1.8 was only calculated using AY 2015–16 junior students,
and the baseline figure was replicated with the changing sample. Here, we say a student has
access to a tuition/fee waiver if, during his/her junior year, s/he attended a high school that
that partnered with a community college that offered a full or partial tuition and fee waiver to
all of its students. Although the adjusted participation rates for underrepresented minorities in
the rightmost columns of Figure 1.8 are slightly higher than the corresponding unadjusted rates
in the leftmost columns, the difference is never statistically significant. This suggests that
differences in access to tuition and fee waivers across high schools in Texas explains little of the
gap in dual-credit participation by race/ethnicity. It is important to note that this does not mean
that tuition and fees are not a barrier to dual-credit participation for underrepresented or low-
income students. In particular, our analysis only examines whether differences in access to
tuition and fee waivers across race/ethnicity explain gaps in dual-credit participation; it does
not examine whether tuition and fee waivers improve dual-credit participation rates overall or
for underrepresented minorities or low income students.

Dual-Credit Education Programs in Texas: Phase II
AMERICAN INSTITUTES FOR RESEARCH | AIR.ORG 33
Figure 1.8. Dual-Credit Participation by Race/Ethnicity, Adjusting for Differences in Dual-
Credit Tuition and Fee Waivers (Student Cohorts of Juniors Enrolled in Dual-Credit Education
in 11th and / or 12th Grade: 2016; n = 311,383)
Combined, the Six Observable Factors Considered Explain Most, But Not All, of Gap in
Dual-Credit Participation Across Race/Ethnicity
The previous analysis has shown that differences in academic preparation, income, and high
school attendance patterns each explain some, but not all, of the gap in dual-credit
participation across race/ethnicity. At the same time, differences in access to dual-credit and AP
and IB courses and tuition and fee waivers do not appear to explain much of this gap. The
analysis so far has examined each of these factors on its own. To take the analysis a step
further, we used a similar approach to assess the extent to which all of these factors combined
contribute to gaps in dual-credit participation. To do so, we ran a regression model predicting
the probability of dual-credit participation as a function of a student’s race/ethnicity, holding all
of these observable factors considered constant, and then used the results to project the dual-
credit participation rate by race/ethnicity holding all factors constant at the median value for
27.1
11.3
15.4
19.520.6
010
20
30
Dual C
redit P
art
icip
ation P
erc
ent
Baseline
27.1
11.8
15.7
19.820.9
010
20
30
Dual C
redit P
art
icip
ation P
erc
ent
Tuition and Fee Waivers
White Black
Hispanic Asian
Other

Dual-Credit Education Programs in Texas: Phase II
AMERICAN INSTITUTES FOR RESEARCH | AIR.ORG 34
White students.5 Figure 1.9 displays these results graphically and demonstrate that the factors
we considered explain most, but not all, of the dual-credit participation gap. For example, if
Hispanic students had the same value for all factors as the typical White student, then their
dual-credit participation rate would increase from 15.6% to 21.8%. Similarly, if Black students
had the same value for all factors as the typical White student, then their dual-credit
participation rate would increase from 10.6% to 15.6%. The adjusted participation rates for
Black and Hispanic students are only slightly lower than the White participation rate of 24.7%,
suggesting that the factors explain most of the overall gap in dual-credit participation. Overall,
this suggests that if underrepresented minorities were equally prepared academically. had
similar incomes to and attended similar schools as white students, then gaps in DC participation
would be quite small.
Figure 1.9. Dual-Credit Participation by Race/Ethnicity, Adjusting for Differences in All Factors
Considered Previously (Student Cohorts of Juniors Enrolled in Dual-Credit Education in 11th
and / or 12th Grade: 2001–16; n = 3,422,095)
5 Note that to implement this approach for all cohorts, we could not include access to tuition and fee waivers in the model. This is because we had data on tuition and fee waivers only for the 2016-17 academic year.
24.7
10.6
15.6
20.7
19.0
05
10
15
20
25
Dual C
redit P
art
icip
ation P
erc
ent
Baseline
25.1
22.721.8
26.025.2
05
10
15
20
25
Dual C
redit P
art
icip
ation P
erc
ent
All
White Black
Hispanic Asian
Other

Dual-Credit Education Programs in Texas: Phase II
AMERICAN INSTITUTES FOR RESEARCH | AIR.ORG 35
One additional factor that could contribute to differences in dual-credit participation across
race/ethnicity is differences in advising practices. If high school and college staff who advise
students for dual-credit courses exhibit explicit or implicit biases that disadvantage
underrepresented minorities, this could contribute to gaps in dual-credit participation. We
were unable to explore this factor quantitatively but assess it qualitatively in Chapter 2 and find
little evidence to support the existence of biases in advising practices.
HB 505 Study
What Changes in Dual-Credit Participation, Success, and Delivery Have Occurred Since
the Passage of HB 505?
In 2015, the 84th Texas Legislature passed HB 505, which loosened prior restrictions on dual-
credit access in a number of ways. Specifically, HB 505 did the following:
1. Removed limitations on the number of dual-credit courses a student may take during
high school
2. Removed limitations on the number of dual-credit courses a student may take each
academic year
3. Allowed ninth and 10th grade students to enroll in dual-credit coursework that is not
delivered in an ECHS
Phase I did not examine trends in dual-credit participation, success, and delivery since the
passage of HB 505. In this section, we address that gap by using THECB and TEA data6 to
descriptively examining changes in student participation and outcomes, as well as changes in
how institutions are delivering dual-credit education to high school students.
Note that data examining trends in student participation and outcomes, and in the delivery of dual-credit education prior to the passage of HB 505 include the 2012–15 fiscal years; data examining these same trends after the passage of HB 505 include the 2016–17 fiscal years.
6 As described in Appendix A, given how recently HB 505 was passed, we use an analytic file that observed dual credit participation and success for all Texas public high school students from 2012–17. This allowed us to capture trends in dual credit participation by grade for the 2012–17 academic years.

Dual-Credit Education Programs in Texas: Phase II
AMERICAN INSTITUTES FOR RESEARCH | AIR.ORG 36
Changes in Dual-Credit Participation Since HB 505
Overall Dual-Credit Participation Rate Held Relatively Steady Since HB 505
Given that HB 505 loosened restrictions on dual-credit participation in a number of ways, we
were interested in whether dual-credit participation had increased since the bill’s passage.
Figure 1.10 shows trends in the overall dual-credit participation rate from 2012–17 and
demonstrates that dual-credit participation held relatively flat over that time frame. The
participation rate among all ninth to 12th grade students was 7.47% prior to the passage of HB
505 from 2012–15, and increased slightly to 8.54% from 2016–17.
Figure 1.10. Dual-Credit Participation Rate Among All Texas Public High School Students
(2012–17; n = 8,580,735)
Dual-Credit Participation Among Ninth and 10th Graders Increased Significantly But Is
Still Low Overall
Since HB 505 specifically loosened restrictions on dual-credit participation among ninth and
10th graders, we also assessed trends in dual-credit participation rates by grade from 2012–17.
7.478.54
01
02
03
04
05
0
Pe
rcen
t
Before After
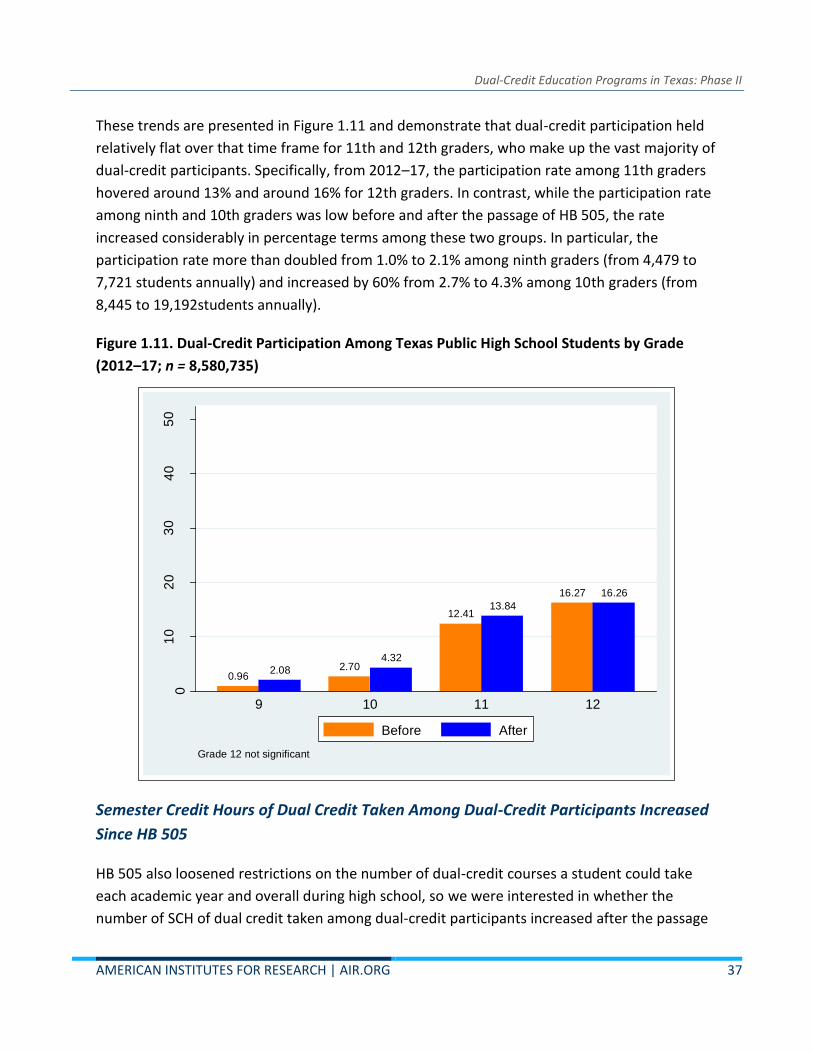
Dual-Credit Education Programs in Texas: Phase II
AMERICAN INSTITUTES FOR RESEARCH | AIR.ORG 37
These trends are presented in Figure 1.11 and demonstrate that dual-credit participation held
relatively flat over that time frame for 11th and 12th graders, who make up the vast majority of
dual-credit participants. Specifically, from 2012–17, the participation rate among 11th graders
hovered around 13% and around 16% for 12th graders. In contrast, while the participation rate
among ninth and 10th graders was low before and after the passage of HB 505, the rate
increased considerably in percentage terms among these two groups. In particular, the
participation rate more than doubled from 1.0% to 2.1% among ninth graders (from 4,479 to
7,721 students annually) and increased by 60% from 2.7% to 4.3% among 10th graders (from
8,445 to 19,192students annually).
Figure 1.11. Dual-Credit Participation Among Texas Public High School Students by Grade
(2012–17; n = 8,580,735)
Semester Credit Hours of Dual Credit Taken Among Dual-Credit Participants Increased
Since HB 505
HB 505 also loosened restrictions on the number of dual-credit courses a student could take
each academic year and overall during high school, so we were interested in whether the
number of SCH of dual credit taken among dual-credit participants increased after the passage
0.962.08 2.70
4.32
12.4113.84
16.27 16.26
01
02
03
04
05
0
Pe
rcen
t
9 10 11 12
Grade 12 not significant
Before After

Dual-Credit Education Programs in Texas: Phase II
AMERICAN INSTITUTES FOR RESEARCH | AIR.ORG 38
of HB 505. Figure 1.12 presents trends in the number of SCH of dual credit taken among dual-
credit participants by grade before and after HB 505. The results demonstrate that the number
of SCH of dual credit taken by dual-credit participants increased among 10th–12th graders, but
declined slightly among ninth graders after HB 505. Overall, the number of SCH of dual credits
taken by dual-credit participants was highest among 11th and 12th participants who took an
average of 9.7 and 9.4 SCH of dual credit prior to HB 505 versus 10.6 and 10.1 SCH after HB 505.
Although the overall dual-credit participation rate was low among ninth and 10th graders, the
number of SCH of dual-credit taken by participants in those grades was relatively high (6.2 and
7.1 SCH before HB 505 versus 5.9 and 7.7 SCH afterward).
Figure 1.12. SCH of Dual Credit Taken Among Dual-Credit Participants by Grade (2012–17;
n = 673,151)
6.235.85
7.087.67
9.67
10.59
9.41
10.13
03
69
12
15
SC
H
9 10 11 12
Before After

Dual-Credit Education Programs in Texas: Phase II
AMERICAN INSTITUTES FOR RESEARCH | AIR.ORG 39
Changes in Dual-Credit Context Since HB 505
Dual-Credit Course Offerings Similar Since HB 505 and Are Concentrated Within the
Academic Core
Table 1.1 presents the 10 most common dual-credit courses before and after the passage of HB
505. The most common dual-credit courses include English Composition (English 1301 and
1302), government, history, economics, and College Algebra and have remained relatively
unchanged since the passage of HB 505. This suggests that while HB 505 loosened restrictions
around the number of dual-credit courses that students can take, postsecondary institutions
and partner high schools may be nevertheless implementing advising policies that restrict the
types of dual-credit courses that students can take. This finding is consistent with qualitative
evidence on advising practices that is presented in Chapter 2. In addition, it is consistent with
the fact that the state restricts the actual courses that can be offered and / or funded for dual
credit.
Table 1.1. Most Common Dual-Credit Courses for All Students (2012–17)
Before HB 505 After HB 505
Course Percent of all DC SCH
represented by course
Course Percent of all DC SCH
represented by course
ENGL 1301 10.69% ENGL 1301 9.67%
ENGL 1302 10.00% ENGL 1302 8.59%
HIST 1302 7.30% HIST 1302 6.47%
HIST 1301 6.79% GOVT 2305 6.25%
GOVT 2305 5.74% HIST 1301 6.24%
ECON 2301 4.30% ECON 2301 3.77%
MATH 1314/1414 3.57% MATH 1314/1414 3.48%
PSYC 2301 1.90% PSYC 2301 2.09%
ENGL 2322 1.71% ENGL 2322 1.88%
ENGL 2323 1.42% GOVT 2306 1.73%
Dual-Credit Education Programs in Texas: Phase II
AMERICAN INSTITUTES FOR RESEARCH | AIR.ORG 40
Dual-Credit Course Offerings Among Ninth and 10th Graders Are Rarely Within the
Academic Core
We also examined the most common dual-credit courses before and after HB 505 by grade.
These results are presented in Table 1.2 and show little differences in common dual-credit
courses over time across grades. However, more interestingly, Table 1.2 also demonstrates that
while 11th and 12th graders mostly take courses within the academic core, ninth and 10th
grade students take courses that help them build study skills or rarely require demonstrating
college readiness, such as Learning Frameworks (Education 1300) and Art Appreciation (Art
1301). The course-taking patterns observed here are consistent with qualitative findings from
Chapter 2, which suggest that high school guidance counselors tend to usher younger students
into dual-credit courses that do not require students to demonstrate college readiness to
prepare them for more rigorous dual-credit courses they will encounter as juniors and seniors.

Dual-Credit Education Programs in Texas: Phase II
AMERICAN INSTITUTES FOR RESEARCH | AIR.ORG 41
Table 1.2. Most Common Dual-Credit Courses Before and After HB 505, by Grade (Percent of
All DC SCH Represented by Course)
Ninth and 10th Grade 11th and 12th Grade
Before HB 505 After HB 505 Before HB 505 After HB 505
Course
%
DC
SCH
Course
%
DC
SCH
Course
%
DC
SCH
Course
%
DC
SCH
EDUC 1300 5.07% EDUC
1300 6.09% ENGL 1301
11.65
% ENGL 1301
10.99
%
SPCH 1311 5.02% ARTS
1301 4.36% ENGL 1302
10.99
% ENGL 1302 9.85%
HIST 1302 4.40% SPCH
1315 4.28% HIST 1302 7.63% GOVT 2305 7.03%
ARTS 1301 3.97% HIST
1302 3.96% HIST 1301 7.23% HIST 1302 6.90%
SPCH 1315 3.35% SOCI
1301 3.63% GOVT 2305 6.16% HIST 1301 6.84%
PSYC 2301 3.24% PSYC
2301 3.40% ECON 2301 4.65% ECON 2301 4.31%
HIST 1301 2.97% SPAN
1411 3.33%
MATH
1314/1414 3.69%
MATH
1314/1414 3.72%
COSC 1301 2.96% SPCH
1311 2.95% ENGL 2322 1.90% ENGL 2322 2.21%
SPAN 1411 2.60% HIST
1301 2.75% PSYC 2301 1.75% PSYC 2301 1.87%
MATH
1314/1414 2.51%
COSC
1301 2.71% ENGL 2323 1.58% GOVT 2306 1.80%
Characteristics of Dual-Credit Courses Changed Modestly Since HB 505
We also examined trends in characteristics of dual-credit courses after the passage of HB 505.
Figure 1.13 shows changes in key design features of dual-credit courses that we can capture in
administrative records before and after the passage of HB 505. The results show that there has

Dual-Credit Education Programs in Texas: Phase II
AMERICAN INSTITUTES FOR RESEARCH | AIR.ORG 42
been very little change in the characteristics of dual-credit courses since the passage of HB 505.
Specifically, the percentage of dual-credit courses taught in a face-to-face format held relatively
constant at a little more than 80%. The percentage of dual-credit courses taught on a college
campus (as opposed to a high school campus) held constant at roughly 54%.
Figure 1.13. Delivery of Dual-Credit Courses Among Dual-Credit Participants Before and After
HB 505 (2012 –17; n = 1,868,920)
Figure 1.14 shows trends in other course features before and after HB 505. The share of courses
that were academic (versus career and technical education [CTE]) held relatively stable at just
under 90% (just over 10%). However, the share of courses delivered via an ECHS rose
considerably from 12.5% before to 20.1% after HB 505. Finally, given that HB 505 loosened
restrictions that required institutions to seek preapproval to develop dual-credit partnerships
with high schools outside of their service area, we were interested in whether there was an
increase in dual-credit courses delivered to students whose high school was not within the service
area of the college. Figure 1.14 shows that the share of dual-credit courses delivered to a high
school partner within the service area of the college declined from 45% to 40% since HB 505.
53.9 54.2
46.1 45.8
82.284.0
14.911.8
2.9 4.2
02
04
06
08
01
00
Pe
rcen
t
College Campus HS Campus Face to Face Online Hybrid
Before After
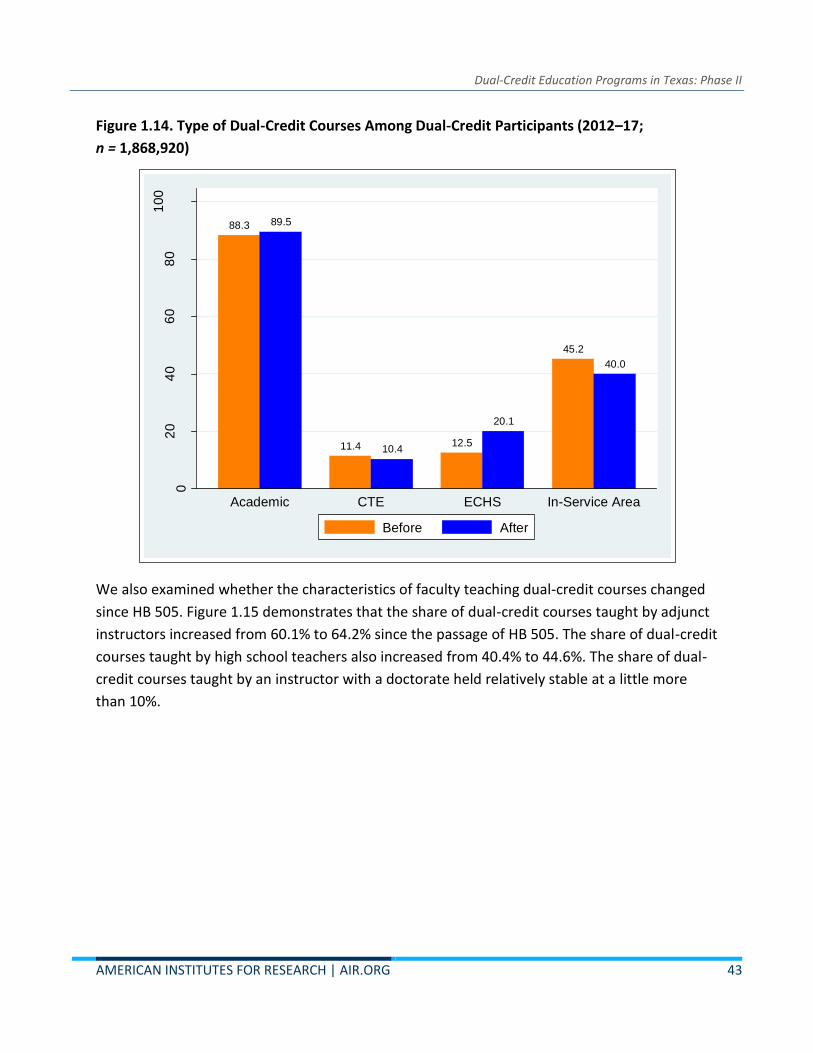
Dual-Credit Education Programs in Texas: Phase II
AMERICAN INSTITUTES FOR RESEARCH | AIR.ORG 43
Figure 1.14. Type of Dual-Credit Courses Among Dual-Credit Participants (2012–17;
n = 1,868,920)
We also examined whether the characteristics of faculty teaching dual-credit courses changed
since HB 505. Figure 1.15 demonstrates that the share of dual-credit courses taught by adjunct
instructors increased from 60.1% to 64.2% since the passage of HB 505. The share of dual-credit
courses taught by high school teachers also increased from 40.4% to 44.6%. The share of dual-
credit courses taught by an instructor with a doctorate held relatively stable at a little more
than 10%.
88.3 89.5
11.4 10.412.5
20.1
45.2
40.0
02
04
06
08
01
00
Pe
rcen
t
Academic CTE ECHS In-Service Area
Before After

Dual-Credit Education Programs in Texas: Phase II
AMERICAN INSTITUTES FOR RESEARCH | AIR.ORG 44
Figure 1.15. Faculty Characteristics of Dual-Credit Courses at Two-Year Colleges (2012–17;
n = 1,268,365)
Changes in Academic Preparation of Dual-Credit Participants
Little Evidence That Overall Academic Preparation of Dual-Credit Participants
Systematically Changed Since HB 505
Given that HB 505 allowed 9th and 10th graders to enroll in dual-credit courses and prevented
the state from limiting the number of dual-credit courses that students could enroll in, some
stakeholders voiced concerns that this might lead to an increase in the number of
underprepared students taking dual-credit courses in high school. To assess this concern, we
analyzed trends in academic preparation of dual-credit participants before and after the
passage of HB 505. Figure 1.16 shows the average score on the 8th grade statewide assessment
(the TAKS and STAAR) in both reading and mathematics among dual-credit participants before
and after the passage of HB 505. Here, the scores were centered around the mean test score
among all Texas public school eighth grade test takers, which is set at zero. Thus, a one-point
increase represents a test score that is a full standard deviation above the mean. Figures 1.16
shows that before and after the passage of HB 505, dual-credit participants scored above the
10.8 10.2
60.164.2
48.345.3
40.444.6
02
04
06
08
01
00
Pe
rcen
t
Doctorate Adjunct Full Time Teach HS
Before After

Dual-Credit Education Programs in Texas: Phase II
AMERICAN INSTITUTES FOR RESEARCH | AIR.ORG 45
average on eighth grade mathematics and reading standardized tests, which suggests that they
are more academically prepared than the average eighth grade student. Examining changes
after Texas loosened restrictions around dual-credit enrollment, our result show that, while the
average eighth grade reading test scores of dual-credit participants marginally increased from
0.57 to 0.62 standard deviations above the mean, the average TAKS and STAAR mathematics
score also slightly decreased from 0.67 to 0.56 standard deviations above the mean. These
results provide little evidence that the academic preparation of dual-credit participants
changed in a systematic way since the passage of HB 505.
Figure 1.16. Average Score on the Eighth-Grade Standardized State Assessment (TAKS and
STAAR Examinations) Among Dual-Credit Participants (2012–17; n = 620,716)
Academic Preparation of Ninth and 10th Grade Dual-Credit Participants Has Declined
Since HB 505
HB 505 also prohibits the state from implementing rules that prevent ninth and 10th graders
from enrolling in dual-credit education, so we investigated the extent to which the academic
preparation of ninth and 10th graders has shifted given that younger students can now enroll in
dual-credit coursework. Figure 1.17 breaks the data presented in Figure 1.16 out by grade. Akin
0.57
0.62
0.67
0.56
0.2
.4.6
.81
Z-S
core
Eighth Grade Reading Score Eighth Grade Math Score
Before After

Dual-Credit Education Programs in Texas: Phase II
AMERICAN INSTITUTES FOR RESEARCH | AIR.ORG 46
to results presented in Figure 1.16, results show that dual-credit participants across all grades
scored about half a standard deviation above the average on the state’s standardized tests in
eighth grade reading and mathematics, which shows that dual-credit students are academically
superior students. However, results also show that the reading and mathematics test scores of
ninth and 10th graders participating in dual-credit declined after the passage of HB 505.
Notably, the typical ninth and 10th grade dual-credit student had a mathematics test score that
was 0.64 standard deviations above the average before HB 505, but just 0.48 standard
deviations above the average after HB 505. Results show a similar decline in reading, as the
mean reading test score for ninth and 10th graders declined from 0.63 to 0.58 standard
deviations above the mean after HB 505 passed. Although these results show that freshmen
and sophomores who took dual credit before HB 505 were more academically prepared than
those who took dual credit after HB 505, it is nevertheless important to note that students pre-
and post-HB 505 scored significantly higher than the statewide average in both subjects.
Figure 1.17. Average Score on the Eighth-Grade Standardized State Assessment (TAKS and
STAAR Examinations) Among Dual-Credit Participants by Grade (2012–17; n = 620,716)
0.63
0.580.56
0.64 0.64
0.48
0.67
0.58
0.2
.4.6
.81
Z-S
core
Reading Grade 9 & 10Reading Grade 11 & 12
Math Grade 9 & 10Math Grade 11 & 12
Before After

Dual-Credit Education Programs in Texas: Phase II
AMERICAN INSTITUTES FOR RESEARCH | AIR.ORG 47
Changes in Dual-Credit Course Performance
Slightly Higher Grades in Dual-Credit Courses Since HB 505, Particularly for Ninth
Graders
Given the decline in mathematics and reading test scores of ninth and 10th grade dual-credit
participants since the passage of HB 505, one might be concerned that these less prepared
students would have lower success rates in their dual-credit courses. To assess these concerns,
Figure 1.18 shows the share of dual-credit participants receiving an A in their dual-credit course
by grade. The results demonstrate that course grades increased slightly after HB 505 for all
groups, but particularly for ninth graders. Prior to HB 505, about 40.2% of dual-credit course
grades overall were As and that number increased to 42.5% after HB 505. Among ninth grade
dual-credit participants, the share of course grades that were As increased from 40.7% to 46.9%
since HB 505. This suggests that as less prepared ninth and 10th grade students have begun
taking dual-credit courses since HB 505, instructors may have reduced course standards to keep
success rates up, rather than letting pass rates decline as we had initially hypothesized.
Figure 1.18. Share of Dual-Credit Course Grades That Were As by Grade (2012–17;
n = 1,868,920)
40.70
46.9243.78
45.85
40.69 41.8239.27
41.88
02
04
06
08
01
00
Pe
rcen
t
9 10 11 12
Before After

Dual-Credit Education Programs in Texas: Phase II
AMERICAN INSTITUTES FOR RESEARCH | AIR.ORG 48
Higher Grades in College Algebra (Math 1314/1414) and English Composition I (English
1301) Since HB 505
To further assess trends in dual-credit course grades since the passage of HB 505, we looked at
the distribution of course grades in two common dual-credit courses: College Algebra (Math
1314/1414) and English Composition I (English 1301). Figures 1.19 and 1.20 show the
distribution of course grades in those subjects before and after the passage of HB 505. The
results show that in both courses, the grade distribution shifted significantly upward, with more
As and fewer Bs or lower. For example, the share of course grades that were As in Math
1314/1414 increased from 37.5% to 40.1% after HB 505, with grades that were Bs and lower
correspondingly decreasing. A Kolmogorov-Smirnov test of distribution equality confirmed that
this upward shift in the dual-credit course grade distribution for both courses was statistically
significant. The fact that HB 505 lessened restrictions around access to dual-credit courses
suggests that these patterns are more consistent with an overall pattern of grade inflation in
college courses, as opposed to an improvement in actual course performance after HB 505.
Figure 1.19. Distribution of Dual-Credit Course Grades in College Algebra (Math 1314/1414)
(2012–17; n = 87,853)
37.52
40.11
31.0730.56
18.5617.79
4.50 4.182.77 2.46
5.58 4.91
01
02
03
04
05
0
Pe
rcen
t
A B C D F I/W
Before After

Dual-Credit Education Programs in Texas: Phase II
AMERICAN INSTITUTES FOR RESEARCH | AIR.ORG 49
Figure 1.20. Distribution of Dual-Credit Course Grades in English Composition I (English 1301)
(2012–17; n = 192,174)
Causal Impact Study
Approach to Question 3
In Phase I, RAND found that prior to HB 505, students who participated in dual-credit
outperformed students who did not. Results from Phase I showed that dual-credit students had
higher grades in dual-credit courses in the same subject as their nondual-credit peers and
higher grades in follow-on courses in the same subject. Dual-credit students also had higher
college enrollment rates after they graduated from high school, particularly at four-year
colleges, and were significantly more likely to persist in and complete college. Moreover, dual-
credit students took, on average, half an academic year less to complete a four-year degree, yet
completed their degrees with roughly the same number of SCH as students who did not take a
dual-credit course, which suggests that dual-credit students, like their counterparts, equally
suffer from the problem of excess credit hours
40.0842.02
38.0236.16
14.5314.04
2.39 2.71 2.37 2.33 2.61 2.74
01
02
03
04
05
0
Pe
rcen
t
A B C D F I/W
Before After

Dual-Credit Education Programs in Texas: Phase II
AMERICAN INSTITUTES FOR RESEARCH | AIR.ORG 50
Although the findings from Phase I suggest that dual-credit education may usher in more
success for students, they also demonstrated that students who took dual-credit courses were
less likely than nonparticipants to be underrepresented minorities or eligible for free or
reduced-price lunch and more likely to be considered gifted and talented—all factors that are
generally positively related to academic outcomes. Taken together, these results raise the
question of whether dual-credit participants would have performed just as well even if they had
not participated in dual-credit education programs because they enter dual-credit with above
average academic skills. Based on the descriptive analysis conducted in Phase I, RAND could not
determine the extent to which the benefits experienced by dual-credit participants were
directly attributable to their participation in dual-credit education or to other factors such as
their level of academic preparation or motivation to succeed.
To isolate the impact of dual-credit education on student outcomes, we designed a quasi-
experimental approach that takes advantage of changes in the timing and the rate of students
participating in dual-credit education programs across high schools in Texas. By employing this
advanced approach, or what economists call an instrumental variable identification strategy,
we are able to compare outcomes for similar students, the only difference being that one group
of students had more access to and enrolled in dual-credit education whereas the other group
of students did not have the same access and did not enroll in dual credit. In our estimation, we
also control directly for a number of student characteristics, including race/ethnicity, free or
reduced-price lunch eligibility, eighth grade standardized test scores, and differences across
high schools and cohort years. For the sake of continuity, we focus on the same set of outcomes
from Phase I, namely, college enrollment and completion, time-to-degree, and SCH-to-degree,
and add new ones, namely, high school graduation, and completion of a workforce certificate.
For this analysis, we examine outcomes for juniors enrolled in Texas public high schools starting
in 2001 and ending in 2016. We describe our econometric approach in detail in Appendix A.
It is important to note that our causal impact study focuses only on the impact of traditional
academic dual-credit courses that were delivered prior to HB 505. As such, we are unable to
speak to the impact of ECHSs, dual-credit CTE, or the impact of dual credit since HB 505.
Although ECHS is a large and growing form of dual-credit in Texas and nationally, our study
design, which leveraged differences over time and across schools in the share of students
participating in dual-credit, did not allow us to assess the impact of dual-credit courses
delivered by ECHSs. This is because, by design, all students within an ECHS take dual-credit
courses. As we have noted previously, while prior experimental research has documented the
positive effects of ECHS participation on a range of student outcomes, there is less rigorous
evidence on the impact of general dual-credit programs, so we do not see this as a major
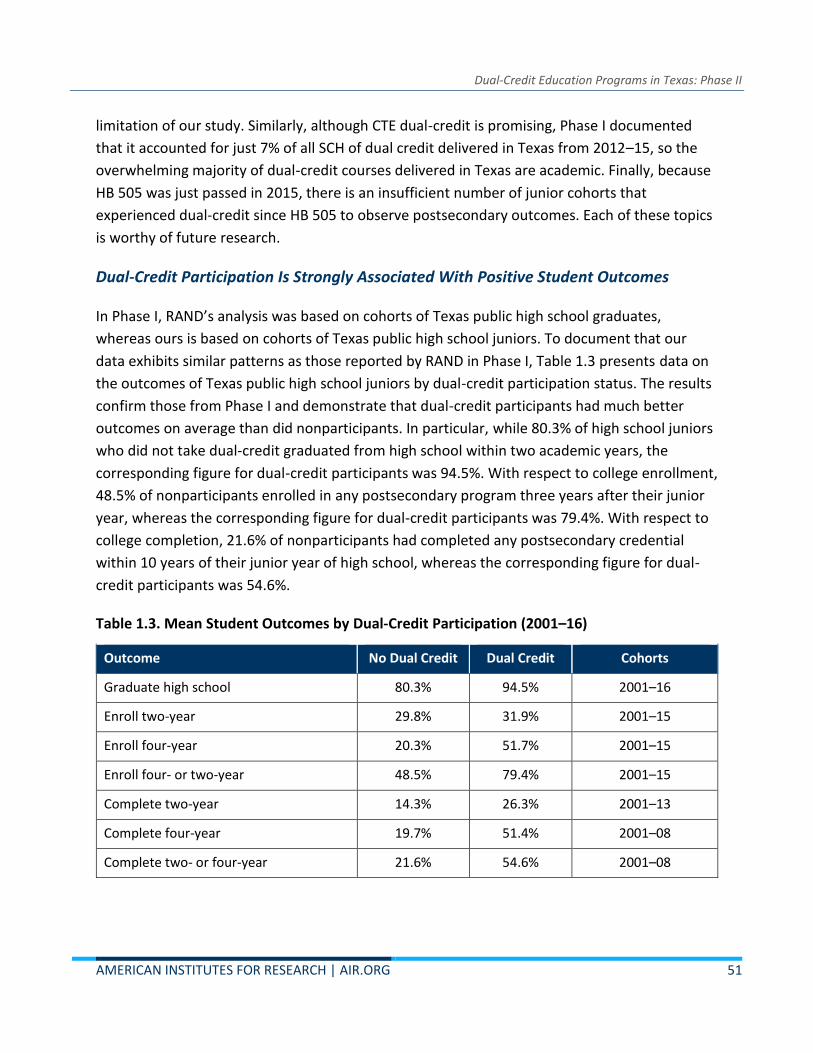
Dual-Credit Education Programs in Texas: Phase II
AMERICAN INSTITUTES FOR RESEARCH | AIR.ORG 51
limitation of our study. Similarly, although CTE dual-credit is promising, Phase I documented
that it accounted for just 7% of all SCH of dual credit delivered in Texas from 2012–15, so the
overwhelming majority of dual-credit courses delivered in Texas are academic. Finally, because
HB 505 was just passed in 2015, there is an insufficient number of junior cohorts that
experienced dual-credit since HB 505 to observe postsecondary outcomes. Each of these topics
is worthy of future research.
Dual-Credit Participation Is Strongly Associated With Positive Student Outcomes
In Phase I, RAND’s analysis was based on cohorts of Texas public high school graduates,
whereas ours is based on cohorts of Texas public high school juniors. To document that our
data exhibits similar patterns as those reported by RAND in Phase I, Table 1.3 presents data on
the outcomes of Texas public high school juniors by dual-credit participation status. The results
confirm those from Phase I and demonstrate that dual-credit participants had much better
outcomes on average than did nonparticipants. In particular, while 80.3% of high school juniors
who did not take dual-credit graduated from high school within two academic years, the
corresponding figure for dual-credit participants was 94.5%. With respect to college enrollment,
48.5% of nonparticipants enrolled in any postsecondary program three years after their junior
year, whereas the corresponding figure for dual-credit participants was 79.4%. With respect to
college completion, 21.6% of nonparticipants had completed any postsecondary credential
within 10 years of their junior year of high school, whereas the corresponding figure for dual-
credit participants was 54.6%.
Table 1.3. Mean Student Outcomes by Dual-Credit Participation (2001–16)
Outcome No Dual Credit Dual Credit Cohorts
Graduate high school 80.3% 94.5% 2001–16
Enroll two-year 29.8% 31.9% 2001–15
Enroll four-year 20.3% 51.7% 2001–15
Enroll four- or two-year 48.5% 79.4% 2001–15
Complete two-year 14.3% 26.3% 2001–13
Complete four-year 19.7% 51.4% 2001–08
Complete two- or four-year 21.6% 54.6% 2001–08

Dual-Credit Education Programs in Texas: Phase II
AMERICAN INSTITUTES FOR RESEARCH | AIR.ORG 52
Positive Association Between Dual-Credit Participation and High School Completion Is
Mostly Driven by Selection
Although the results presented in Table 1.3 suggest that students respond positively to dual-
credit education, they do not provide proof that dual-credit participation directly improves
student outcomes. After all, we know that dual-credit students are more academically prepared
than nondual-credit students, so we would expect them to have better outcomes even if they
had never enrolled in dual-credit education. To improve the analysis presented previously, we
directly compare outcomes for dual-credit and nondual-credit students who are similar across a
range of dimensions. We accomplish this by running simple Ordinary Least Squares (OLS)
regression models that control directly for a student’s level of academic preparation,
race/ethnicity, and gender, among other dimensions. Although these models match students
on what economists call observable characteristics, or factors that can be easily documented
with quantitative data, they do not include other dimensions students may differ on, including
motivation, self-efficacy, or desire to go to college. To account for these dimensions in our
analysis, we employed our Instrumental Variable (IV) model that is described in detail in
Appendix A.
Figure 1.21 presents results estimating the impact of dual-credit participation on high school
degree completion. The first set of columns shows the raw, unadjusted high school completion
rate for dual-credit participants and nonparticipants. The second set of columns presents
results from our OLS models that adjust differences in high school completion rates by dual-
credit participation status based on differences in observable student characteristics including
race/ethnicity, free or reduced-price lunch status, and standardized test scores in eighth grade
reading and mathematics. The models also include a high school fixed effect, which accounts
for differences in the types of high schools attended by dual-credit participants and
nonparticipants and a cohort fixed effect, which accounts for differences across junior cohorts.
The third set of columns, present the results from our IV models, which account for unobserved
factors like motivation, self-efficacy, and desire to go to college, and can be interpreted as the
causal impact of dual-credit participation on high school completion. Results presented in
Figure 1.21 clearly indicate that models that do not control for the characteristics of students
who enroll in dual credit produce biased estimates of the impact of dual-credit education
programs. In column 1, we see that the high school completion rate among dual-credit
participants was 94.7%, noticeably higher than nonparticipants at 80.6%: a difference of 14.1
percentage points. When we control for factors like race, free or reduced-price lunch eligibility
and prior academic preparation, the estimate of the impact of dual-credit education on student
decreases, suggesting that observable characteristics account for some, but not all, of the

Dual-Credit Education Programs in Texas: Phase II
AMERICAN INSTITUTES FOR RESEARCH | AIR.ORG 53
difference in high school completion rates among dual-credit participants and nonparticipants.
Specifically, although the adjusted high school completion rate among dual-credit participants
was 90.5%, the corresponding rate among nonparticipants was 81.6%, a difference of 8.9
percentage points.
Finally, the third set of columns present results from our IV model, which account for
unobserved factors and can be interpreted as the causal impact of dual-credit participation on
high school completion. At first glance, we notice that estimates presented in the third column
are significantly smaller than those in the first and second set, which suggests that most of the
observed differences in high school completion by dual-credit participation are driven by
selection on unobservable variables that OLS and descriptive statistics are unable to account
for. Although the fully adjusted high school completion rate among dual-credit participants was
83.8%, the corresponding rate among nonparticipants was 83.1%. The difference of 0.7
percentage points is not statistically different from zero in this case. We thus find no evidence
that dual-credit participation increases high school completion.
Figure 1.21. Causal Impact of Dual-Credit Participation on High School Completion (Student
Cohorts of Juniors Enrolled in Dual-Credit Education in 11th and / or 12th Grade: 2001–16; n =
3,411,286)
80.6
94.7
81.6
90.5
83.1 83.8
02
04
06
08
01
00
Hig
h S
cho
ol G
rad
ua
tion
Rate
Raw Difference OLS IV
No DC DC

Dual-Credit Education Programs in Texas: Phase II
AMERICAN INSTITUTES FOR RESEARCH | AIR.ORG 54
Modest Positive Impact of Dual-Credit Participation on College Enrollment
Figure 1.22 replicates Figure 1.21 using college enrollment as the outcome. Results suggest that
most, but not all, of the difference in college enrollment rates among dual-credit participants
and nonparticipants is driven by self-selection into dual-credit programs or, in other words, the
characteristics of students who enroll in dual-credit programs. The raw unadjusted difference in
college enrollment rates, presented in the leftmost columns, show that dual-credit participants
were 30.9 percentage points more likely to enroll in a two- or four-year college within two
years after their junior year of high school. However, the rightmost columns demonstrate that
once we fully account for observable and unobservable characteristics of students who enroll in
dual-credit education into the model, this difference drops to just 2.4 percentage points.
Although this represents a large and meaningful increase in college enrollment that is
attributable to dual-credit participation, it is much more modest than what has been found in
past descriptive research, including the results that were presented in the Interim Report.
Figure 1.22. Causal Impact of Dual-Credit Participation on College Enrollment (Student
Cohorts of Juniors Enrolled in Dual-Credit Education in 11th and / or 12th Grade: 2001–15; n =
3,223,430)
48.5
79.4
50.3
72.0
54.056.4
01
53
04
56
07
5
En
rollm
ent R
ate
in
Tw
o-
or
Fou
r-Y
ea
r C
olle
ge
s
Raw Difference OLS IV
No DC DC

Dual-Credit Education Programs in Texas: Phase II
AMERICAN INSTITUTES FOR RESEARCH | AIR.ORG 55
Impact of Dual-Credit Participation on College Enrollment Driven by Enrollment at
Two-Year Colleges
We wanted to assess the extent to which the increase in college enrollment attributable to
dual-credit participation channels through two- versus four-year colleges, so we ran our favored
IV model separately for enrollment in a two-year college and enrollment in a four-year
university. Results from both models are presented in Figure 1.23 below. The leftmost set of
columns shows the predicted enrollment rate at two-year colleges for dual-credit participants
and nonparticipants. The rightmost set of columns replicates the analysis for four-year
universities. Results demonstrate that participation in dual-credit education increased the
probability of enrolling at a two-year college by 1.6 percentage points, but we do not find a
statistically significant impact on enrollment at four-year colleges. This suggests that the
increase in college enrollment attributable to dual-credit participation primarily channels
through two-year colleges.
Figure 1.23. Causal Impact of Dual-Credit Participation on Two- Versus Four-Year College
Enrollment (Student Cohorts of Juniors Enrolled in Dual-Credit Education in 11th and / or 12th
Grade: 2001–15; n = 3,223,430)
29.931.5
26.2 26.9
01
53
04
56
07
5
Colle
ge
En
rollm
ent R
ate
Enroll two-year Enroll four-year
No DC DC

Dual-Credit Education Programs in Texas: Phase II
AMERICAN INSTITUTES FOR RESEARCH | AIR.ORG 56
Modest Positive Impact of Dual-Credit Participation on College Completion
Figure 1.24 replicates Figure 1.21 using college completion as the outcome. Here, we define
college completion as completing a four- or two-year degree or any certificate program at a
public or private nonprofit college in Texas within 10 years of a student’s junior year of high
school. We use a 10-year follow-up window to ensure sufficient time for nondual-credit
participants to catch up with participants and also because many students who start at two-
year colleges take upward of eight years to complete a four-year degree and may never obtain
a two-year degree along the way. The results suggest that most, but not all, of the difference in
college completion rates among dual-credit participants and nonparticipants is driven by
selection. The raw unadjusted difference in college completion rates, presented in the leftmost
columns, show that dual-credit participants were 33.0 percentage points more likely to
complete a college credential within 10 years after their junior year of high school. However,
the rightmost columns demonstrate that once we fully adjust for selection into dual credit, this
difference drops to an insignificant 1.1 percentage points. Although this represents a
meaningful increase in college completion rates that is attributable to dual-credit participation,
it is much more modest than what has been found in past descriptive research, including the
results that were presented in the Interim Report.

Dual-Credit Education Programs in Texas: Phase II
AMERICAN INSTITUTES FOR RESEARCH | AIR.ORG 57
Figure 1.24. Causal Impact of Dual-Credit Participation on College Completion (Student
Cohorts of Juniors Enrolled in Dual-Credit Education in 11th and / or 12th Grade: 2001–08; n =
1,542,629)
Slightly Larger Impact of Dual-Credit Participation on Upward Transfer or Completion
of College Credential from a Community College and Completion of a Four-Year Degree
Figure 1.25 presents estimates measuring the impact of dual-credit education on completing a
college credential from a community college and also on a four-year degree. To measure
college completion from a community college, we track students five years after their junior
year and consider them as “completers” if they obtain a two-year degree or any certificate or if
they transfer up to any public nonprofit college in Texas during that time frame. To measure
college completion from a four-year university, we examine whether they completed at a
minimum a bachelor’s degree within 10 years of initially enrolling as a high school junior. Figure
1.25 presents our results. The leftmost set of columns shows the predicted completion rate at
two-year colleges for dual-credit participants and nonparticipants. The rightmost set of columns
replicates the analysis for four-year colleges. The results demonstrate that dual-credit
participation increases the completion rate at two-year colleges by 3.5 percentage points. In
contrast, we find that dual-credit participation increases the probability of completing a four-
21.6
54.6
23.5
45.3
26.928.0
01
02
03
04
05
0
Colle
ge
Com
ple
tion
Rate
Raw Difference OLS IV
No DC DC

Dual-Credit Education Programs in Texas: Phase II
AMERICAN INSTITUTES FOR RESEARCH | AIR.ORG 58
year degree by a more modest 0.3 percentage points. This suggests that the increase in college
completion attributable to dual-credit participation primarily channels through two-year
colleges, but dual-credit participation does modestly increase the probability of completing a
four-year degree.
Figure 1.25. Causal Impact of Dual-Credit Participation on Two- Versus Four-Year College
Completion (Student Cohorts of Juniors Enrolled in Dual-Credit Education in 11th and / or
12th Grade: 2001–13; n = 2,754,765)
Dual-Credit Participation Slightly Increases SCH-to-Degree
Figure 1.26 replicates Figure 1.21 using SCH-to-degree as the outcome. Here, we restrict our
sample to students who completed a four-year degree within 10 years after their junior year of
high school and count the total number of SCHs that students earned, including those earned as
dual-credit in high school, before obtaining their degree. The results in Figure 1.26 suggest that
the difference in SCH-to-degree among dual-credit participants and nonparticipants is not as
sensitive to selection patterns as the outcomes we have examined so far. The raw unadjusted
difference in SCH-to-degree, presented in the leftmost (blue) columns, show that dual-credit
participants completed their degrees with an average of 129.7 SCH, while nonparticipants
16.0
19.5
24.9 25.2
01
02
03
04
05
0
Com
ple
tion
Rate
Credential two-year or Transfer Graduate four-year
No DC DC

Dual-Credit Education Programs in Texas: Phase II
AMERICAN INSTITUTES FOR RESEARCH | AIR.ORG 59
completed their degrees with an average of 128.6 SCH. The difference is a modest 1.1 SCH. The
rightmost columns demonstrate that once we fully adjust for selection into dual credit, this
difference increases to 4.3 SCH. Although this is a modest increase in SCH-to-degree, it is
important to note that SCH-to-degree among both dual-credit participants and nonparticipants
is quite high and well above the 120 SCH required under most four-year degree plans.
Figure 1.26. Causal Impact of Dual-Credit Participation on SCH-to-Degree (Student Cohorts of
Juniors Enrolled in Dual-Credit Education in 11th and / or 12th Grade Who Graduated From a
Four-Year College: 2001–08; n = 384,658)
Dual-Credit Participation Slightly Reduces Time-to-Degree
Figure 1.27 replicates Figure 1.21 using time-to-degree as the outcome. Like those for SCH-to-
degree, the results in Figure 1.27 suggest that the difference in time-to-degree among dual-
credit participants and nonparticipants is not as sensitive to selection patterns as other
outcomes. The raw unadjusted difference in time-to-degree, presented in the leftmost
columns, show that dual-credit participants completed their degrees in an average of 5.2 years
after high school, while nonparticipants completed their degrees in an average of 4.8 years. The
difference is a modest 0.4 years. The rightmost columns demonstrate that once we fully adjust
128.6 129.7 128.2 130.5127.5
131.8
02
04
06
08
01
00
120
140
SC
H to
Deg
ree
Raw Difference OLS IV
No DC DC

Dual-Credit Education Programs in Texas: Phase II
AMERICAN INSTITUTES FOR RESEARCH | AIR.ORG 60
for selection into dual credit, this difference decreases to 0.10 years, or approximately five
fewer weeks or the length of one summer term.
Figure 1.27. Causal Impact of Dual-Credit Participation on Time-to-Degree (Student Cohorts of
Juniors Enrolled in Dual-Credit Education in 11th and / or 12th Grade Who Graduated From a
Four-Year College: 2001–08; n = 375,715)
Larger Impact of Dual-Credit Participation on Two-Year College Enrollment but No
Impact on Degree Completion for Underrepresented Minorities
Figure 1.28 shows results that assess the extent to which all students benefit from participating
in dual-credit education. The leftmost section shows our estimates for the causal impact of
dual-credit participation on high school completion, college enrollment (overall, two year, and
four year) and degree completion for White students. The center section presents these results
for Black students, while the rightmost section presents the results for Hispanic students. Here,
the dot represents our estimate of the causal effect of dual-credit participation on the
outcome, while the line above and below it represents the 95% confidence interval, which is a
range of statistically plausible estimates. When the line crosses zero on the figure, we say that
the estimate is not statistically distinguishable from zero, which means that we are unable to
5.2
4.8
5.2
4.9
5.15.0
01
23
45
Tim
e to D
egre
e
Raw Difference OLS IV
No DC DC
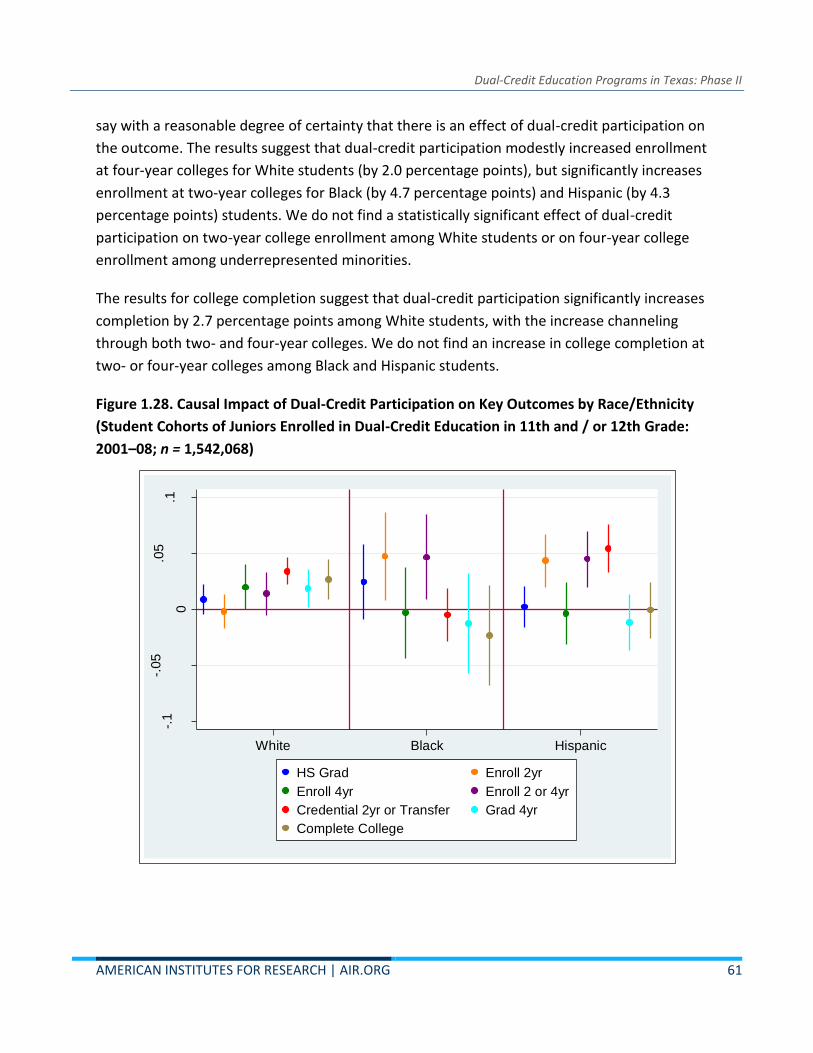
Dual-Credit Education Programs in Texas: Phase II
AMERICAN INSTITUTES FOR RESEARCH | AIR.ORG 61
say with a reasonable degree of certainty that there is an effect of dual-credit participation on
the outcome. The results suggest that dual-credit participation modestly increased enrollment
at four-year colleges for White students (by 2.0 percentage points), but significantly increases
enrollment at two-year colleges for Black (by 4.7 percentage points) and Hispanic (by 4.3
percentage points) students. We do not find a statistically significant effect of dual-credit
participation on two-year college enrollment among White students or on four-year college
enrollment among underrepresented minorities.
The results for college completion suggest that dual-credit participation significantly increases
completion by 2.7 percentage points among White students, with the increase channeling
through both two- and four-year colleges. We do not find an increase in college completion at
two- or four-year colleges among Black and Hispanic students.
Figure 1.28. Causal Impact of Dual-Credit Participation on Key Outcomes by Race/Ethnicity
(Student Cohorts of Juniors Enrolled in Dual-Credit Education in 11th and / or 12th Grade:
2001–08; n = 1,542,068)
-.1
-.05
0
.05
.1
Cha
ng
e in
Pe
rcen
tage
Po
ints
White Black Hispanic
HS Grad Enroll 2yr
Enroll 4yr Enroll 2 or 4yr
Credential 2yr or Transfer Grad 4yr
Complete College

Dual-Credit Education Programs in Texas: Phase II
AMERICAN INSTITUTES FOR RESEARCH | AIR.ORG 62
Negative Impact of Dual-Credit Participation on Low Income Students That Is Largely
Due to Lower Academic Preparation Among Low Income Students
To assess the extent to which the impact of dual-credit participation varied by the student’s
economic status, we ran our IV model by whether the student was eligible for free or reduced-
price lunch in high school. Results are presented in Figure 1.29. The rightmost section shows
our estimates for the key outcomes we used in Figure 1.29 for students who were not eligible
for free or reduced-price lunch, while the leftmost section show results for students who are
eligible for free or reduced-price lunch. The results suggest that the effect of dual-credit
participation varies considerably by the student’s economic status, with large positive effects
among those who are ineligible and large negative effects for most outcomes among those who
are eligible. For example, we find that dual-credit participation increased college enrollment by
5.5 percentage points and college completion by 4.5 percentage points for students who are
ineligible for free or reduced-price lunch. Conversely, participating in dual-credit education
significantly decreases college enrollment by 3.2 percentage points and significantly decreases
college completion by 6.7 percentage points for free or reduced-price lunch eligible students. It
is worth noting that our estimate for the effect of taking a dual-credit course on completing a
two-year degree or certificate or transferring upward to a four-year college within three years
for free or reduced-price lunch eligible students is positive overall but not statistically
significant.
To further probe these findings, we also estimated the effect of participating in dual credit for
students who are free or reduced price lunch eligible and had eighth grade standardized test
scores one standard deviation above the mean. We present these results in Appendix A. The
results from this analysis suggest that the negative results for free and reduced price lunch
eligible students were likely due to the fact that free and reduced price lunch eligible students
were more likely than ineligible participants to have lower eighth grade standardized test
scores that hindered their success in dual credit education courses. In particular, we find that
free or reduced price lunch eligible students with above average standardized test scores
largely benefited from participating in dual credit education, while those with average eight
grade standardized test scores did not.
Finally, it is also important to reiterate that our causal impact analysis does not include dual-
credit courses delivered by ECHS. Thus, the negative findings for free and reduced price lunch
eligible students with average eighth grade standardized test scores speak only to the impact of
traditional dual credit education programs. Rigorous experimental studies that have included

Dual-Credit Education Programs in Texas: Phase II
AMERICAN INSTITUTES FOR RESEARCH | AIR.ORG 63
some Texas ECHSs have documented the positive impact of ECHSs on a range of student
outcomes for traditionally underrepresented students.
Figure 1.29. Causal Impact of Dual-Credit Participation on Key Outcomes by Free or Reduced-
Price Lunch Eligibility (Student Cohorts of Juniors Enrolled in Dual-Credit Education in 11th
and / or 12th Grade: 2001–08; n = 1,542,068)
Larger Impact of Dual-Credit Participation on Four-Year College Enrollment and
Degree Completion Among Better Academically Prepared Students
We also wanted to assess whether the impact of dual-credit participation varied by academic
preparation, so we ran our IV model, interacting the main effect with a student’s normed score
on the eighth grade TAKS and STAAR exam in mathematics and reading. The results are
presented in Figure 1.30 and Figure 1.31. The left panel shows our estimates for the key
outcomes for a student scoring at the statewide average on the TAKS or STAAR mathematics
and reading standardized test, and the right panel shows results for a student with statewide
mathematics and reading scores one standard deviation above the mean. The results indicate
that students with better academic preparation benefit more from participating in dual credit.
For example, we find that dual-credit participation increases college enrollment and completion
-.1
-.05
0
.05
.1
Cha
ng
e in
Pe
rcen
tage
Po
ints
No Free/Reduced Lunch Free/Reduced Lunch
HS Grad Enroll 2yr
Enroll 4yr Enroll 2 or 4yr
Credential 2yr or transfer Grad 4yr
Complete College

Dual-Credit Education Programs in Texas: Phase II
AMERICAN INSTITUTES FOR RESEARCH | AIR.ORG 64
by 5.8 and 5.3 percentage points, respectively for students with standardized reading scores
that were one standard deviation above the mean. While we find no evidence of an effect of
dual-credit participation on college enrollment among students with mean standardized
reading scores, we find a significant 3.2 percentage point reduction in college completion. A
similar pattern holds for standardized mathematics scores. Interestingly, an opposite pattern
holds when considering high school completion as the outcome. In particular, we find that dual-
credit participation increases the high school completion rate by 1.8 percentage points among
students with average standardized reading scores, but we find no evidence that dual-credit
participation increases high school completion rates among students with standardized reading
scores that are one standard deviation above the mean.
Figure 1.30. Causal Impact of Dual-Credit Participation on Key Outcomes by Eighth-Grade
Reading TAKS and STAAR Scores (Student Cohorts of Juniors Enrolled in Dual-Credit Education
in 11th and / or 12th Grade: 2001–08; n = 1,542,068)
-.1
-.05
0
.05
.1
Cha
ng
e in
Pe
rcen
tage
Po
ints
Avg Reading Z-Score +1 Std. Deviation
HS Grad Enroll 2yr
Enroll 4yr Enroll 2 or 4yr
Credential 2yr or transfer Grad 4yr
Complete College

Dual-Credit Education Programs in Texas: Phase II
AMERICAN INSTITUTES FOR RESEARCH | AIR.ORG 65
Figure 1.31. Causal Impact of Dual-Credit Participation on Key Outcomes by Eighth-Grade
Mathematics TAKS and STAAR Scores (Student Cohorts of Juniors Enrolled in Dual-Credit
Education in 11th and / or 12th Grade: 2001–08; n = 1,542,068)
Limitations
First, it is important to reiterate that the analyses used to address questions1-2 are descriptive
in nature, and we cannot make any causal claims based on the results. In particular, our analysis
of patterns in dual-credit participation, success, and delivery before and after the passage of HB
505 was descriptive in nature. Importantly, there may be other factors aside from HB 505 that
drove the changes reported.
Second, although our causal impact study provides strong evidence on the impact of dual-credit
education on a wide range of academic outcomes, the study is limited in several ways. First, the
scope of the study is limited to focus only on the impact of regular academic dual-credit courses
that were delivered prior to HB 505. As such, we are unable to speak to the impact of ECHSs,
CTE dual credit, or the causal impact of dual credit since HB 505. Although ECHS is a large and
-.05
0
.05
.1
Cha
ng
e in
Pe
rcen
tage
Po
ints
Avg Math Z-Score +1 Std. Deviation
HS Grad Enroll 2yr
Enroll 4yr Enroll 2 or 4yr
Credential 2yr or transfer Grad 4yr
Complete College
Dual-Credit Education Programs in Texas: Phase II
AMERICAN INSTITUTES FOR RESEARCH | AIR.ORG 66
growing form of dual credit in Texas and nationally, our study design, which leveraged
differences over time and across schools in the share of students participating in dual credit, did
not allow us to assess the impact of dual-credit courses delivered by ECHSs. This is because, by
design, all students within an ECHS take dual-credit courses. However, while prior experimental
research has documented the positive effects of ECHS participation on a range of student
outcomes, there is less rigorous evidence on the impact of general dual-credit programs, so we
do not see this as a major limitation of our study. Similarly, while CTE dual credit is a promising
and growing intervention, Phase I documented that it accounted for just 7% of all SCH of dual
credit delivered in Texas from 2012–15, so the overwhelming majority of dual-credit courses
delivered in Texas are academic. Nevertheless, as described next, we are currently working to
adapt our IV model to be able to identify the effect of CTE dual credit from that of academic
dual credit and plan to incorporate those results into the final report. Finally, because HB 505
was just passed in 2015, an insufficient number of junior cohorts experienced dual credit since
HB 505 to observe postsecondary outcomes.
Third, there are a number of ways in which the assumptions underlying the causal
interpretation of our model may not hold. As described previously and in detail in the Appendix
A, our econometric model essentially compares two students with similar characteristics, one
who participated in dual credit because a large share of other students in his junior cohort did
so and another who did not participate because a smaller share of students in his junior cohort
did so. For this approach to be valid, we must believe that, conditional on the other variables
included in the model, the share of other students in a student’s junior cohort who participate
in dual credit does not independently influence the student’s academic outcomes. A primary
concern relates to peer effects. If the dual-credit participation rate of one’s peers is positively
related to the academic preparation of those peers and having more academically prepared
peers increases a student’s academic outcomes, then the dual-credit participation rate of one’s
junior cohort would have a positive impact on the student’s academic outcomes. To address
this concern, we ran models that used the dual-credit participation rate of the prior junior
cohort as the instrument. This mitigates concerns over peer effects because students from the
prior cohort are likely to have less influence on the student. The results are qualitatively similar
to those presented in the report.
Finally, it is important to note that the IV model we used does not isolate the causal impact of
dual credit for all students, but rather a weighted effect where the students who are most
responsive to the instrument are weighted the most; this is what economists refer to as the
local average treatment effect (LATE). In our case, this means that we identify the effect of dual
credit for students who would be most likely to switch from a nonparticipant to a dual-credit

Dual-Credit Education Programs in Texas: Phase II
AMERICAN INSTITUTES FOR RESEARCH | AIR.ORG 67
participant because they moved from a school with a larger share of dual-credit participants to
one with a smaller share.
Summary, Limitations, and Conclusions
In this chapter, we used quantitative analyses to assess three primary RQs:
RQ 1 What factors contribute to disparities in dual-credit participation?
RQ 2 What changes in dual-credit participation, success, and delivery have occurred since the
passage of HB 505?
RQ 3 To what extent does dual-credit participation increase college enrollment, degree
attainment, and efficient degree completion?
Racial Disparities Analysis
Differences in academic preparation, income, and high school attendance patterns serve as
major contributors to racial and ethnic disparities in dual-credit participation. Our descriptive
analyses showed that the dual-credit participation rate of White students was 24.7%, while the
corresponding rate for Blacks (Hispanics) was 10.6% (15.6%)—a gap of 14.1 percentage points
(9.1 percentage points). However, when we used regression methods to account for differences
in academic preparation and income, those gaps narrowed significantly. For example, our
analysis suggested that if Black (Hispanic) students had the same eighth Grade TAKS and STAAR
scores as White students, then the gap in dual-credit participation would decrease from 14.1
percentage points (9.1 percentage points) to 6.9 percentage points (3.9 percentage points). We
also ran similar models to assess whether differences in access to dual credit, access to AP/IB
courses, and access to tuition and fee waivers for dual-credit students also contributed to gaps
in dual-credit participation; however, we found little evidence that that these factors made any
difference in narrowing these disparities.
HB 505 Analysis
Increase in dual-credit participation and SCH since HB 505, primarily for ninth and 10th
graders. Our descriptive analysis showed that dual-credit participation among all ninth through
12th grade students was 7.5% prior to the passage of HB 505 from 2012–15, and increased to
8.5% from 2016–17. This represents a 13% increase in the dual-credit participation rate over a
6 year period. The rate of growth of dual-credit participation was particularly strong for ninth
and 10th graders. Ninth graders increased their dual-credit participation rate from 1.0% before
Dual-Credit Education Programs in Texas: Phase II
AMERICAN INSTITUTES FOR RESEARCH | AIR.ORG 68
HB 505 to 2.1% after, an increase of 110%. Tenth graders increased their dual-credit
participation rate by 60% from 2.7% before HB 505 to 4.3% after. There was also a significant
increase in the number of SCH taken per dual-credit participant, leading to a continued increase
in the number of SCH of dual-credit delivered statewide from 2012–17.
Suggestive evidence that standards in dual-credit courses for ninth and 10th graders may
have declined since HB 505. While ninth and 10th grade dual-credit participation remains low
relative to participation of 11th and 12th graders, our descriptive analysis showed that dual-
credit participation rates of ninth and 10th graders increased significantly in percentage terms
after the passage of HB 505. We examined whether there were concomitant changes in
academic preparation and dual-credit course pass rates among ninth and 10th-grade dual-
credit participants. The results demonstrated that academic preparation among ninth and 10th
grade dual-credit participants declined over this period, while dual-credit course pass rates
increased for those groups. These patterns were not evident among 11th- and 12th-grade dual-
credit participants. Taken together, these results are concerning and suggest that standards in
dual-credit courses for ninth and 10th graders may have declined since HB 505.
Causal Impact Analysis
Dual-Credit participation improves a range of student outcomes on average, but the causal
effect of dual-credit participation is much more modest than what has been reported in past
descriptive studies, including the Phase I Interim Report. Past studies have documented that
dual-credit participants have better outcomes than nonparticipants. For example, in Phase I,
RAND found that, after accounting for some observable characteristics, dual-credit participants
had college enrollment (completion) rates that were 17 (21) percentage points higher than
those for nonparticipants. Our study replicated these descriptive findings but also used more
rigorous econometric methods for causal inference to address selection into dual-credit
participation. The results indicated that most, but not all, of the observed difference in student
outcomes is due to differences in characteristics of dual-credit participants and nonparticipants.
After accounting for selection, dual-credit participation had the following effects:
Increased college enrollment by 2.4 percentage points primarily through an increase in
enrollment at two-year colleges
Insignificantly increased college completion by 1.1 percentage points by increasing
attainment of all types of postsecondary credentials

Dual-Credit Education Programs in Texas: Phase II
AMERICAN INSTITUTES FOR RESEARCH | AIR.ORG 69
Increased total SCH-to-degree by 4.2 but decreased time-to-degree by 0.1 years or 1.2
months.
The effect of dual-credit participation on student outcomes is more positive for White
students, higher income students, and students with higher levels of academic preparation;
the effect is negative in some cases for less advantaged groups. Our analysis indicated that
dual-credit participation increased enrollment and completion primarily at four-year colleges
for White students. For Black and Hispanic students, dual-credit participation increased
enrollment at two-year colleges but did not meaningfully influence college completion rates.
We also found that students with eighth grade standardized test scores that were one standard
deviation above the mean in mathematics and reading benefited significantly more from dual-
credit participation than did students with lower scores. Of particular concern, we found that,
on average, the impact of dual-credit participation for students who were eligible for free or
reduced-price lunch was negative for most outcomes. However, further analyses suggest that
these patterns were likely due to the fact that free and reduced price lunch eligible students
were more likely than ineligible participants to have lower 8th grade standardized test scores
that hindered their success in dual credit education courses.
Additional Analyses
We are currently working on two additional analyses that we plan to incorporate into the final
report.
An Examination of the Effect of CTE Dual Credit Relative to Academic Dual Credit
Currently, our causal impact analysis does not distinguish the effect of CTE dual credit separately
from that of academic dual credit. Given that more than 90% of dual-credit courses are academic,
the effect is mostly driven by participation in academic dual-credit courses. Beginning in 2012,
THECB began collecting course-level information that allows us to identify CTE vs. academic dual-
credit courses. We are working to adapt our IV model to identify the short-term effect of CTE
versus academic dual credit using the 2012–16 cohorts of high school juniors.
An Examination of TSIA Data
An important issue that we have not yet fully examined is how high school students became eligible
for dual-credit education before and after HB 505. We recently gained access to Texas Success
Initiative Assessment (TSIA) score data for all administrations of the TSIA since 2013 from the
College Board, but we have not had sufficient time to incorporate and analyze the data. We will use

Dual-Credit Education Programs in Texas: Phase II
AMERICAN INSTITUTES FOR RESEARCH | AIR.ORG 70
this data to determine the extent to which average scores on the TSIA have changed since HB 505
and the extent to which students entered into dual-credit education through other means.

Dual-Credit Education Programs in Texas: Phase II
AMERICAN INSTITUTES FOR RESEARCH | AIR.ORG 71
Chapter 2. Dual-Credit Advising Practices and Models
As states, districts, and education institutions look for ways to improve the effectiveness of
dual-credit education to boost students’ college access and completion, the dual-credit advising
process is an important consideration. College advisors and high school counselors may serve as
the primary source of information about dual-credit education for students and families as they
navigate the complexities of determining the best path forward to postsecondary attainment
and career success. The 2015 passage of HB 505 in Texas, which significantly lowered
restrictions on institutions delivering dual-credit courses, has heightened the potentially
important role of advisors and counselors in reducing the number of excess semester credit
hours dual-credit students obtain and ensuring course credits earned through dual-credit
transfer toward the requirements of a particular major or certificate. Indeed, a 2012 study of
dual-credit and high school advising on student persistence in college suggests there are two
critical components to advising. These include: strong advisor support and finding the balance
between supporting students and giving students the tools to problem solve and advocate for
themselves during the advising process (Raia-Taylor, 2012).
In this chapter, we present the findings from a set of qualitative interviews we conducted with
a sample of high school counselors and college advisors involved in dual-credit student advising.
We conducted these interviews with the goals of better understanding advising within the
current environment of dual-credit education in Texas, and offering practical, evidence-based
suggestions on how to improve dual-credit advising processes and practices.
Background and Policy Context
The wide variation in dual-credit education approaches across the state of Texas has resulted in
a vast array of dual-credit education contexts that affect the advising process, including the
types of students counselors and advisors target and encourage to pursue dual-credit education
and how they guide student course taking. The various contexts are shaped by the different
district policies, dual-credit partnership agreements between colleges and high schools, dual-
credit course delivery modes and range of course offerings, distance between the colleges and
their high school partners, financial supports for dual-credit education, school philosophies, and
student demographics. Dual-credit administrators interviewed as part of Phase I of this study,
for example, reported differences in student advising across programs stemming from factors
such as distance from the partner college, whether the high school was an ECHS, and to
resource availability (Miller et al., 2017). The wide array of approaches that are used to deliver dual-
credit coursework and advise students into the various course options raises questions about how

Dual-Credit Education Programs in Texas: Phase II
AMERICAN INSTITUTES FOR RESEARCH | AIR.ORG 72
differences in the roles advisors on the college and high school sides play affect the quality of advising in
dual-credit programs. Indeed, although college advisors and high school counselors carry out their
responsibilities within the requirements and guidelines of their particular dual-credit
partnership agreement, the manner with which these individuals interpret local dual-credit
policies and implement their practices will inevitably depend on their familiarity with the dual-
credit model and the benefits and potential pitfalls for dual-credit students in taking certain
courses or a certain number of courses, and also contain a degree of subjectivity that can affect
student participation, persistence, and outcomes.
This component of our Phase II study aims to deepen understanding about the dual-credit
advising process and seek to build on the results of Phase I, which raised some important issues
and questions. The Phase I study reported that, according to dual-credit administrators at the
community college level, the extent to which college advisors provided specialized and
individualized guidance to students and families hinged on available resources. In cases of
limited resources, high school counselors took on a more prominent advising role. For some
dual-credit administrators, this was a concern because they perceived the high school
counselors as having limited knowledge about the rigor and transferability of college-level
courses. In addition, concerns were raised among dual-credit administrators about high school
students taking dual-credit courses when they had not yet selected a major and the emotional
and academic preparation of high school students succeed in college-level coursework (Miller
et al., 2017). Specifically, this component of the study was designed to examine the following
RQs:
RQ 1 How are high school students advised into dual-credit education programs and courses?
RQ 2 How might different advising practices or models contribute to disparities in dual-credit
education participation?
RQ 3 What are some promising approaches to improve dual-credit advising to reduce the
average number of semester credit hours students who took dual-credit in high school
ultimately earn toward a college degree?
Framed by the theories of policy sociology (Gerwitz & Cribb, 2002), public management (Gray &
Jenkins, 2006), and sensemaking (Spillane, Reiser, & Reimer, 2002), this component of the study
examines how the scope, depth, and quality of advising of dual-credit students are influenced
by macro- and micro-level system pressures; resource constraints; governance structures; and
advisors’ and counselors’ prior knowledge, beliefs, and perspectives about dual-credit
education. The interviews were also used to explore the extent to which these factors may
influence student access to and participation in dual-credit education.
Dual-Credit Education Programs in Texas: Phase II
AMERICAN INSTITUTES FOR RESEARCH | AIR.ORG 73
The findings presented in this chapter contribute to a stronger understanding of dual-credit
advising policies and practices in Texas to help identify where improvements in advising can be
made to help reduce excess semester credit hours, ensure credit transfer to degree, and
promote equitable student access to dual-credit education opportunities.
Data Collection and Analysis
Data Sources and Collection Activities
The research team conducted semistructured telephone interviews with college advisors and
high school counselors across the state of Texas who were involved in dual-credit student
advising. Prior to each scheduled interview, the respondents completed an online
questionnaire, which gathered basic contextual information about their advising roles, the
students they served and their dual-credit partnership. (See Appendix B for the preinterview
questionnaire and interview protocols.) We used these data to tailor and streamline the
interview protocol and ask probing questions regarding their practices and the factors that
affected how they carried out their responsibilities.
The interviews took place between November 2017 and February 2018. The interview protocols
collected data on high school counselors’ and college advisors’ respective roles and
responsibilities in the dual-credit advising process, the factors they considered in advising
students into dual-credit education and into specific dual-credit courses, how they shared
information with students and families, and how they coordinated advising-related activities
with their dual-credit partners. In addition, the interviews asked college advisors and high
school counselors to describe the challenges they experienced in advising dual-credit students
and identify the supports they believed would help them overcome these challenges. The
interviews were audio recorded and transcribed to ensure accuracy and completeness of data.
Sample
The research team selected a purposeful sample of 52 IHEs and 50 high schools with dual-credit
partnerships to ensure the sample captured the variation of dual-credit delivery models
represented in the state. The criteria for selection included the following:
Type of IHE partner (two-year versus four-year institution)
Size of the dual-credit education programs—operationalized as the number of partnering
districts and schools and the number of dual-credit SCHs delivered, wherein the number of
Dual-Credit Education Programs in Texas: Phase II
AMERICAN INSTITUTES FOR RESEARCH | AIR.ORG 74
SCHs is defined as the number of contact hours per week delivered for a given course over a
semester
Type of dual-credit education delivered (academic versus CTE)
Approach to delivering dual-credit courses (ECHS designation)
Geographic region in the state
Location of partnering high school (rural versus urban)
Demographic characteristics of student population served (including socioeconomic status
of students and percentage students of color)
Our final interview sample included counselors and advisors from 50 high schools and 52 IHEs.
The characteristics of the final sample are provided in Appendix C.
Analytic Procedures
The analytic team developed a codebook and coded the transcribed interview data using NVivo
11 Plus, a qualitative data analysis software. The codebook development entailed two major
steps: (1) we first established a preliminary set of codes, based on our key constructs of interest
and associated questions in the preinterview form and interview protocol (e.g., roles and
responsibilities, targeted students, coordination between partners); (2) we used this
preliminary set of codes to code a sample of the interview transcripts, using both inductive and
deductive coding methods to generate a final set of codes. The final codebook is presented in
Appendix D. The final set of codes were structured so that analysts could apply more than one
code to the same interview passage as applicable and to facilitate within and cross-case
analyses. Throughout the analytic process, the team engaged in regular communications
throughout the coding process to ensure consistent application of the coding structure,
strategies, and rules for coding the data. Major emergent patterns and themes were also
shared and discussed to confirm a shared understanding and interpretation of the coded data.
The team’s approach to analysis was purposefully integrated, leveraging the data from both the
set of college advisor interviews and the set of high school counselor interviews to enhance our
understanding of dual-credit advising as a whole and to detect patterns among colleges and
high schools with different characteristics. Specifically, we undertook iterative thematic coding
of each major topic and interview question to surface recurring patterns and common themes
(Maxwell, 2013; Merriam, 1998) across all college advisor and high school counselor
respondents to assess the prevalence of practices across sites and to identify examples of

Dual-Credit Education Programs in Texas: Phase II
AMERICAN INSTITUTES FOR RESEARCH | AIR.ORG 75
advising practices and models that may be of interest to policymakers, school leaders, and
other educators. This same coding approach was used to conduct subgroup analyses to explore
advising practices overall and differences in advising approaches and experiences between high
school counselors and college advisors and to explore any differences in advising specific to
partnerships with an ECHS partner, with CTE making up 75% or more SCH delivered, and those
serving rural student populations.
These subgroup analyses were of interest based on the findings that emerged from the Phase I
study (Miller et al., 2017) and other scholarly literature suggesting that the types of students
targeted for dual-credit education, the factors that are considered when counseling students
into dual-credit education programs and courses, and the challenges and supports needed to
improve dual-credit student advising may be affected by these factors.
Limitations
Readers should note some limits to the interpretation and generalizability of the interview data
because the study sample did not fully reflect the total population of dual-credit partnerships,
and the large number of college advisors and high school counselors involved in dual-credit
student advising. The data obtained through these interviews also are limited to the recall and
perceptions of the individual respondents at the time of the interview. Thus, the full range of
advising practices, processes, procedures, and experiences may not have been captured.
However, it is expected that these limitations had a negligible effect on the findings.
Organization of Chapter
The remainder of this chapter is organized around key findings that address the three primary
RQs. We first report on the students targeted for dual-credit education, then the roles and
responsibilities of high school counselors and college advisors in the advising process and the
extent to which and how advising activities were coordinated between partners. We next
discuss the dual-credit course selection process, including how students were counseled into
specific dual-credit courses and the latitude students are afforded in the selection process. The
chapter concludes with a discussion of the reported challenges and supports needed to
improve student advising, particularly related to reducing risks of excess credit, increasing the
likelihood of dual-credit course transfer to a specific major and postsecondary degree, and
ensuring greater equity in dual-credit participation and outcomes for dual-credit students.
Dual-Credit Education Programs in Texas: Phase II
AMERICAN INSTITUTES FOR RESEARCH | AIR.ORG 76
Findings
Students Targeted for Dual-Credit Education
The extent to which high school counselors and college advisors actively targeted
students for dual-credit education varied based on district policies and school
philosophies about which students could benefit from and succeed in dual-credit
courses.
All respondents indicated that they targeted students for dual-credit programs based on district
policies for dual credit and the MOUs that were in place with their partners. Within these
parameters, there was some variation in the extent to which high school counselors and
advisors actively recruited or encouraged certain types of students to apply. For example, about
three-quarters of the respondents reported that their partnerships encouraged all students to
participate in dual-credit education while close to one quarter reported partnerships that were
more selective, targeting only those students who were excelling in their high school classes
and demonstrating high levels of emotional maturity.
With respect to counselor’s and advisor’s direct involvement in selecting students for dual-
credit, nearly half of the respondents reported that they monitored student participation and
their eligibility for dual-credit programs but were not technically involved in “selecting”
students. Rather, students self-selected into dual credit if they were interested and met the test
score requirements on the TSIA or additional criteria. These counselors described their role in
the selection process as largely
telling [students] whether they can or cannot take it based on their TSI results or their
ACT or SAT exemption. We don’t tell who can and who can’t. We will make the
presentation to an entire classroom and then the only thing that we say is, “Yes, you can
take it based on your academic TSI test” or “No, you can’t because you’re not qualified.”
This finding is consistent with other studies of dual-credit student advising showing that
students were not specifically selected for dual-credit programs, but primarily sought out dual-
credit courses on their own initiative, with the college readiness placement test serving as the
gatekeeper to participation (Osumi, 2010; Piontek, Kannapel, & Stewart, 2016). This finding is
also consistent with a study of one Texas high school that reported more than 70% of Southeast
Texas high school dual-credit students named themselves as their greatest influence in deciding
to take a dual-credit class. Just 5% of students said their high school counselor had the greatest
influence on their decision to enroll in a dual-credit course (Ozmun, 2013).
Dual-Credit Education Programs in Texas: Phase II
AMERICAN INSTITUTES FOR RESEARCH | AIR.ORG 77
The other half of the high school counselors indicated that they played a larger role in selecting
students into dual-credit programs but still described their roles as fairly minor. For example,
most of these respondents said their schools maintained an “an open-door policy” but that
they were required to sign off and officially approve students for participation after reviewing
evidence of their readiness for dual credit. This occurred most often in districts that had
additional criteria to restrict access to dual credit beyond the basic eligibility standards
established by the state.7 Frequently in these cases, student behavior, discipline, attendance
records, or past performance in dual-credit courses (if applicable) were considered.
The majority of the high schools primarily targeted juniors and seniors, using grade level as the
proxy for ensuring students were academically prepared and mature enough for the dual-credit
class environment. The advisors and counselors in these partnerships targeted their
information sessions and reported that the districts designed their dual-credit course offerings
accordingly. For example, they started sharing information about dual-credit during students’
sophomore year and offered courses that aligned with the typical course sequences for juniors
and seniors.
As mentioned, close to one-quarter of the respondents described their dual-credit programs as
more selective in their approach student selection. Among these sites, academic performance
and student discipline, responsibility, time management, and emotional maturity were
emphasized during dual-credit information sessions and during more individual counseling
sessions. Several college advisors described using the information sessions with students and
families to communicate what types of students are good candidates for dual-credit as an
indirect way of “encouraging” certain students to apply. As one advisor reported, “We try to be
very frank with [the students] upfront and…. we try to make sure the parents have information
as well to understand that dual credit may not be the perfect choice for every student…they
need to be able to operate on their own in a self-motivated way especially in the online
courses.” The high school counselors in more selective dual-credit settings echoed this
sentiment and reported having candid conversations with parents and students about their
dual-credit prospects and potential risks. When asked about whether there were any students
she advised against taking dual credit, one counselor noted:
7 Basic eligibility standards do not require high school students to demonstrate college readiness through the TSIA or other alternative tests, but they do mandate students to exhibit some level of academic proficiency in reading, writing, or mathematics. Some of the tests used to assess readiness for dual credit courses are ones that high school students can take before they reach the 11th or 12th grade and include the PSAT, PLAN, and the STAAR EOC in Algebra I and English II, courses typically offered in the first two years of high school (Miller et al., 2017).

Dual-Credit Education Programs in Texas: Phase II
AMERICAN INSTITUTES FOR RESEARCH | AIR.ORG 78
I wouldn’t say, “advised against it,” but we have long talks with them and their parents,
students who have poor study skills or have low academic grades, especially in the
subject that they’re wanting to take the course in…. I tell them, I say, “Dual-credit can be
doubly good or doubly bad.” I say, “If you don’t pass it, then you don’t get credit in high
school and you also don’t get credit in college, and you have an F on the transcript.
Another explained,
All students have an opportunity to say, “Hey, this is the program that I think I might be
interested in.” However, what we might market as a good candidate for dual credit is a
student who has an overall B average or higher in their high school courses. … They
must’ve passed all their state exam requirements or their EOCs, earned all their credit….
If they’re already struggling at a high school level, we don’t want to put anything on
them that’s going to create more of a stress or more of a challenge or something that’s
going to stand in the way of them meeting those requirements that they need…. We do
let them know that they have to have good attendance. Their discipline record,
obviously they take these classes over at the college so being that independent learner.
Although nearly all college advisors and high school counselors stressed the importance of
emotional maturity and academic discipline during interviews, these more selective
partnerships more directly encouraged or discouraged students based on a student’s high
school rank, performance in high school courses (e.g., GPA), attendance and behavior, and
input from teachers. As one high school counselor stated,
We’ve got groups of students who are not academically successful…we don’t want them
taking dual-credit classes if they’re going to end up failing or dropping or getting a W on
their transcript or even getting a D. We don’t want them to do it just to do it. We want
to make sure they can be successful and then it’s going to pay off in the end.
In most cases, these schools targeted and encouraged the same students for dual credit as for
AP and IB programs, leaving it up to the student and their families to determine if they wanted
to enroll in both or one or the other. In a few cases, however, high school counselors indicated
targeting the highest performing students (those in the top 10%) for AP versus dual credit
because they perceived the rigor of AP courses as higher and then targeting those performing
in the top 20% to 25% for dual credit.

Dual-Credit Education Programs in Texas: Phase II
AMERICAN INSTITUTES FOR RESEARCH | AIR.ORG 79
Some schools, particularly those serving disadvantaged populations, had a clear focus
on access and encouraging all students to participate in dual-credit education.
The ECHS schools that, by design, target all their students (Grades 9–12) for dual-credit
education, followed this approach, but so did close to one quarter of the traditional high
schools in the sample. Many of these schools served first-generation or low-income students,
and counselors emphasized their school’s commitment to developing students’ awareness of
the postsecondary options available to them and to fostering a college-going culture. As one
high school counselor reported, “We try to encourage our kids to reach their highest potential
and realize that maybe we see something more in them than they might see in themselves and
so we talk to all of our kids about dual-credit classes and we differentiate between those
classes and how it’ll benefit them and how it won’t.” Similarly, another stated, “We really
[encourage] our dual-credit programs, so that the students who may be all their lives at home
have been told, ‘You’re not going to college. I didn’t go to college. We don’t need to go to
college,’… we really try to open those doors and [help students] realize that, ‘I can go to college.
I am smart enough.’” As a final example, one high school counselor described how the only
students they really went out of their way to encourage into dual-credit programs were the
students on free and reduced-price lunch because these were the students that often weren’t
as aware of the dual-credit opportunity as other students and/or as likely to perceive dual-
credit as an option even if they were strong candidates. She stated, “If they’re free/reduced
lunch, we do try to focus on our dual-credit student that is qualified one way or the other. [If]
they’re in the top 2%, we really seek those kids out that are meeting free/reduced lunch, try to
encourage them to use fee waivers for ACT and take advantage of those opportunities.”
Similarly, a few high school counselors indicated that, based on their prior observations and
experiences in advising students, they believed all students have the potential to succeed in
dual-credit courses. One explained,
my five years as a dual-credit advisor that students come whether they have physical
disabilities, whether they have mental disabilities, whether they have straight As or they
have a 2.2 GPA. I found that any type of these students can be successful in a college
class pending having the desire and the motivation to do so…. I’ve also seen students
who with their 3.5 GPA and have been in pre-A.P. classes all their lives who are right
now dropping their college course because they were not successful.
The counselor from another high school shared this sentiment noting that students were not
directly advised against dual-credit education because of the unpredictability of what types of

Dual-Credit Education Programs in Texas: Phase II
AMERICAN INSTITUTES FOR RESEARCH | AIR.ORG 80
students would be successful: “We have some students who are very immature or sheltered,
and I have thought they’re probably not going to do well, but then they really seem to enjoy the
challenge or the different atmosphere, different teachers.”
Rural schools, the schools with CTE dual-credit programs, or schools with a wider range of dual-
credit courses beyond the core were also more likely encourage a greater variety of students to
participate. In some cases, counselors perceived that any college course experience would
benefit their students by allowing them to more deeply explore or progress in a certain field of
interest or gain exposure to the college environment. One high school counselor indicated, for
example, that she believed dual-credit welding and art classes could challenge students to meet
the expectations of a college course and develop important skill sets that could benefit
students in their future endeavors while providing students with opportunities to “express
themselves in a little bit of a different way.” This counselor went on to explain, “We think all
kids are capable of that type of rigor and that type of level of thinking, even those that might
take a little longer to get there.”
Despite the variation in the extent to which certain types of students were actively targeted or
encouraged to pursue dual-credit education opportunities, we found no evidence to suggest
that implicit biases or discrimination in advising practices was leading to disparities in dual-
credit student participation. District policies and school philosophies appeared to have the
largest effect on which students were targeted and selected for dual-credit education.
Cost and extracurricular activities were most frequently reported barriers to student
participation in dual credit.
High school counselors and college advisors most commonly reported that the TSI, as the
primary gatekeeper to dual-credit education, was the only major barrier to student
participation in dual-credit programs. For the students to which dual-credit programs were
targeted, however, most did not perceive significant barriers to access. Respondents attributed
the lack of barriers to the school’s open-door policy to dual-credit education, which allowed all
interested students to apply; financial supports for students such as tuition waivers, discounts,
or scholarships; and proactive efforts to encourage all students to participate in dual credit
coupled with intervention and support services to prepare students for the rigor and
expectations of dual-credit classes. One respondent described how a local foundation helped
ensure equitable access to dual-credit:
We have an extremely generous community and foundation that offer an ample amount
of scholarship opportunities to our students of all backgrounds…so they encourage

Dual-Credit Education Programs in Texas: Phase II
AMERICAN INSTITUTES FOR RESEARCH | AIR.ORG 81
every student that’s interested in dual-credit to fill out college scholarship applications
and then of course any student on a [free or reduced-price] lunch, that particular grant
will cover six hours or the typical two courses that they would enroll in here at [the] high
school and so a lot of that credit is free to those kiddos. I would definitely say this is very
open to kids from various backgrounds.
Approximately one quarter of respondents, however, did report that some of their qualified
students were not able to participate in dual-credit education. The costs associated with taking
dual-credit classes was mentioned most frequently, particularly by advisors and counselors
serving rural communities where many of the students were economically disadvantaged. One
high school counselor remarked, “The other problem is our district does not pay students or
pay for students’ dual-credit classes like a lot of them do around here. I believe that we have a
lot of students that could take dual-credit and benefit from it, but they are unable to afford it.”
Another commonly perceived barrier among these respondents was the number of other
activities (including jobs) and extracurricular activities, such as sports, performances, and
honors societies, in which students were involved. High school counselors described the
difficulty some students had in fitting dual-credit courses into their daily schedules, with one
counselor explaining, “Those kids are also your NHS [National Honor Society] kids, your kids
that are involved in our National Technical Honor Society that are in band or cheer and now
they’re adding one more thing to their plate, which in turn affects their grades, which in turn –
it’s a cycle.” One school had taken action to help remedy this type of barrier by establishing
class periods during which students could work on their dual-credit coursework. According to
the high school counselor, in past years the students had to complete their online dual-credit
courses on their own time, but the new class periods gave them dedicated time during the
school day to complete their work, and she had seen an increase in student participation.
Counselors working at ECHS high schools and a few of the counselors at traditional high schools
also reported a more active advising role when students were not performing well in a course.
ECHS schools had a number of support systems on site, including college prep classes, study
skills classes, tutoring, and some social-emotional supports into which counselors could direct
struggling students. The traditional high school counselors more frequently described advising
students struggling in their dual-credit courses about the supports and services available to
them through the college, although one traditional high school had started a middle school
bridge program that continued into the high school to prepare and support dual-credit
students. Similarly, another high school counselor reported on a new school-based intervention
that they counseled students into if they needed support with their dual-credit courses:

Dual-Credit Education Programs in Texas: Phase II
AMERICAN INSTITUTES FOR RESEARCH | AIR.ORG 82
We’ve actually started something this spring, kind of a mentoring program with some of
our weaker students that are not maybe making the grades that they should be and
they’re struggling in some classes and/or they’re new to dual-credit and they’re taking
on a lot of classes all at once. We have a teacher assigned to maybe two students, and
they check on them weekly, if not daily, and get to know them better, know what makes
them tick, get to them on a personal level.
Roles of High School Counselors and College Advisors
The majority of high school guidance counselors played the primary role in advising
dual-credit students, with one quarter sharing this responsibility with college advisors.
Overall, high school counselors played a vital role in coordinating dual-credit student
registration, course scheduling, activities to build dual-credit awareness, and student
participation. They were the central point of contact for enrolling students and served as the
main liaison between the high school and the college with respect to dual-credit education. In
addition, with few exceptions, high school counselors served as the primary advisors for dual-
credit students, both with respect to selecting or determining student eligibility for dual-credit
education and working with students to select dual-credit courses.
Nearly all of the college advisors reported relying on the high school counselors or administrators
to identify the students for dual-credit participation per the partnership agreement and district
policies. Rarely were they reported as being involved in the actual selection of students into dual-
credit programs beyond confirming that students met the dual-credit college application
requirements. As one high school counselor indicated, “We pretty much do the advising. Our
college advisors are there to answer any questions that we may have…. They typically don’t meet
with the students face to face. We’re that mid person.” Similarly, a college advisor reported, “We
rely very much on the school counselor to say, ‘Yes, the student can be successful in this course,’
because they know those kids much better than we do. It’s the way that we operate. If the school
says, ‘Yes. We feel like they’re mature and they can handle it. They’re self-motivated. They can do
this,’ then we go ahead and put them in.”
This overall reliance on high school counselors may be significant in its implications for ensuring
high school counselors are armed with the knowledge and training they need to: assess the
academic and emotional readiness of their high school students for college-level coursework,
while still promoting equitable access to dual credit; and the have understanding of
postsecondary degree programs and requirements to help ensure students are streamlining

Dual-Credit Education Programs in Texas: Phase II
AMERICAN INSTITUTES FOR RESEARCH | AIR.ORG 83
their postsecondary pathways and not taking on excess credit. Moreover, high school
counselors are typically tasked with serving large numbers of students and not just dual-credit
students. As will be discussed later in this chapter, high school counselors frequently reported
struggling to find balance their dual-credit advising responsibilities with their other
responsibilities, resulting in less one-on-one advising time with dual-credit students. College
advisors typically played a secondary role, serving as the key point of contact for high school
counselors and sharing information about dual-credit with prospective students and their
families, except in special circumstances.
College advisors were most frequently involved in delivering in-person dual-credit education
information sessions to prospective students and their families, usually annually or biannually.
They presented on the key features of the dual-credit program, student eligibility, course
offerings, the registration process and required forms, and answered questions. Most college
advisors indicated that they also used these sessions to emphasize the important differences in
instructor expectations and rigor between dual-credit courses and traditional high school
courses. For example, one advisor reported,
I go heavy on the idea of their schedules with college-level courses and the rigor and the
expectations that the professors are going to have for them as college students. No
missed days, no excused absences, that kind of thing. … We go over the importance of a
syllabus and communicating with their professor.
College advisors also consistently described being in regular contact with the high school
counselors; so, even if they were not directly working with students, they were greatly involved
in coordinating activities and sharing information with these individuals.
A few college advisors reported becoming more involved in selecting or advising
students if they were “accelerated,” pursuing CTE dual-credit programs, or if they were
freshmen or sophomores.
College advisors became more directly involved in special circumstances, including in the case
of “accelerated students” or advising outside of the core, CTE dual-credit programs, freshmen
and sophomores, and poor performance. When a student was “accelerated,” or on track to
earn an associate’s degree at the same time as their high school diploma, college advisors
reported playing a larger role in advising. In such cases, the college advisor would typically meet
individually with the student to make sure they enrolled in the courses they needed to
complete their degree, while the high school counselor would continue to ensure students
were enrolling in courses that would satisfy high school graduation requirements. Similarly,

Dual-Credit Education Programs in Texas: Phase II
AMERICAN INSTITUTES FOR RESEARCH | AIR.ORG 84
some college advisors noted that they were not involved in advising students unless students
were interested in courses outside of the core. One of the partnerships in the sample, for
example, required that students looking outside of the core participate in an advising session
with a college advisor.
As another example, a college advisor talked about how she was not at all involved in the
advising process for students pursuing the academic dual-credit program because the courses
were limited to the academic core, but much more engaged in the CTE dual-credit advising
because of how customized those programs are in terms of coursework. She reported that the
high school counselor “gains their interest in the field, but I advise on what the next courses to
take and where they are in their level of certification because with each course and each
program, it’s more specialized… I work with her and the students individually to say, ‘These are
the courses you need here, and this is what you’ll accomplish with that in this certification.’”
Likewise, another college advisor indicated that she was more involved in advising for CTE
students stating,
It’s really only the workforce students that we help, and by that I just do some probing
questions. I ask them what their career goals are, I ask them why they’re thinking that
dual-credit is a good option for them, just trying to get to the reason behind why they
came to see me or why they told their counselor they were interested in talking about
dual-credit.
Others mentioned that they only became involved in the selection of students if they were
freshmen or sophomores, largely to help ensure the students were academically and socially
prepared to meet the demands and expectations of college-level course work. As one of these
advisors explained:
For [ninth and] 10th graders who are trying to enter dual-credit…. We do have a process
in place where I do individual assessment of their attendance records or discipline
records, their TSI scores, their high school transcripts, letters of recommendation to let
them into the program. Juniors and seniors, they’re just meeting the general admission
requirements for the college and they come in, but for our freshmen and sophomores,
there is a more hands-on direct advising experience.
College advisors also described becoming more directly involved in the advising process when
students were not performing well in their classes or there were concerns about attendance,
although their involvement remained primarily with the high school counselor. In these cases,
college advisor reported the concerns to the high school counselor who then took the lead on

Dual-Credit Education Programs in Texas: Phase II
AMERICAN INSTITUTES FOR RESEARCH | AIR.ORG 85
intervening with the student. One high school counselor reported, “[The college advisors] tell
us if a student is not doing very well in class. Throughout the school year, we are the mediators
between the professors and students and their parents as far as like their grades and things like
that, if they’re not doing well.”
About one quarter of the college advisors and high school counselors described more
of a shared responsibility in advising, with both parties equally involved in the process.
In these cases, both the college advisors and high school counselors had direct contact with
students or were more actively engaged in regular communications to make decisions about
how to guide students’ dual-credit course selections. One of the high school counselors
describing the advising process as “shared” stated,
[College advisors] meet with us twice a year…I [first] meet with kids and advise them
based on what pathway that they’re on [and] what class they should take. Then [the
students] meet with a [college] advisor as well, and the [advisors] will either agree with
me or they’d recommend them taking something else based on where they want to go
to school…and what they want to study.
In another case, a college advisor played an active role in student advising by talking often with
the high school counselors to make sure that the courses students were taking would apply not
just to a high school degree, but to a university or college degree.
In these cases of shared responsibility for advising, the college and high school were often
located close to one another, allowing college advisors more frequent access to students and
direct involvement. One of the high school counselors in this type of situation described how
their partner college was located just two blocks from the high school and the college advisor
had two offices—one at the college and one in the high school. This arrangement led to the
college advisor and high school counselor working in tandem to counsel students into dual-
credit and dual-credit courses. The high school counselor went on to explain, “[she] and I work
very closely…she assists in all of the advising so [she] and I will meet with [students] together so
they hear the same thing from both of us.” Similarly, another partnership had established an
advising structure where the college advisors had a dedicated high school counselor contact for
CTE dual-credit and one for academic dual-credit. The CTE counselor’s office was on the college
campus, which “offers a lot of convenience,” according to the college advisor; and on the
academic side, the college advisor reported having face-to-face meetings with the high school
counselor at least once or more a semester. Although the high school counselors still took the
lead on student recruitment, the college advisor indicated working very closely with the school

Dual-Credit Education Programs in Texas: Phase II
AMERICAN INSTITUTES FOR RESEARCH | AIR.ORG 86
to provide students with the information they needed and that they maintained an open-door
policy with dual-credit students. High school counselors referred students to the college
advisors if there were any questions or parent concerns related to a student’s participation in
dual-credit programs.
This more infrequent shared approach to advising dual-credit students may warrant further
exploration to determine the potential value add of having the college and high school
perspectives guide student selection and course taking.
Coordination of Advising Activities
Overall, high school counselors and college advisors described close working
relationships, most commonly to coordinate school visits and dual-credit information
sessions, registering students, and course scheduling.
All of the high school counselors and college advisors in the study described coordinating dual-
credit activities with their partners. They primarily coordinated efforts related to students’
application materials, registration, course scheduling, and transcripts and grades. They also
reported coordinating joint dual-credit information sessions for students and families, as
discussed earlier. These information sessions were usually held on the high school campus once
or twice a year and, in some cases, included presentations by both the high school counselor
and college advisor to share both perspectives.
Many counselors and advisors also reported that they worked with each other to develop
materials to help counsel students into certain courses or to help monitor and track students’
progress toward meeting their high school graduation requirements or an associate’s degree.
For example, high school counselors typically developed a course crosswalk to share with
advisors so they could see how the dual-credit courses mapped to high school graduation
requirements. Likewise, college advisors reported providing high school counselors with their
academic catalog “so that they’re familiar with any changes in our degree requirements and
they can also look at course descriptions to determine if they can crosswalk certain classes. We
also sometimes provide them with the syllabus for different courses if they’re needing to
compare student learning outcomes again to determine if they can crosswalk classes.”
In a few cases, advisors and counselors worked more closely together to decide which classes
would be offered as dual-credit each year. For example, one high school counselor described
being in the process of planning with the college advisor for the following year to put together

Dual-Credit Education Programs in Texas: Phase II
AMERICAN INSTITUTES FOR RESEARCH | AIR.ORG 87
the dual-credit course guidebook and a “choice sheet” for students that would outline the
classes available for the fall semester.
Nearly all advisors and counselors reported being in regular, if not constant, e-mail or phone
communication as advising questions, concerns, or other issues arose. They described open
lines of communication to check in on how students were doing in dual-credit courses, ask
questions about credit-transfer or course credit toward degree, relay questions from parents,
provide updates on new initiatives or policies, or to share scholarship and financial support
opportunities for dual-credit students. Some partners held more formal check-in meetings
throughout the year to review procedures and troubleshoot any concerns. One college advisor
reported holding counselor meetings with the high school every fall and spring semester
where we’ll go over all of the general housekeeping items, any concerns that are coming
up. We do this in group sessions and then I am out visiting face-to-face, at least a few
times a semester, to talk to them about different things, pass along information to see
what their concerns are and assist them with any questions, and then we provide
support and coordination via phone and e-mail, sometimes on a daily basis.
Another counselor described visiting the high school at least two or three times a semester to
have direct contact with the dual-credit students and meet in person with the counselors. This
counselor stated that these visits, as well as other activities such as college fairs, were planned
and coordinated in close collaboration with the high school counselor.
Close proximity to one’s partner was perceived as fostering effective coordination.
Although being far away from one’s partner was not reported as a major barrier to coordination,
the college advisors and high school counselors that were in close proximity to one another
emphasized the benefits of the face-to-face interactions they were afforded. As one college
advisor stated, “Conversations and e-mails are great, but when you’re able to sit down with
somebody and just deepen what’s already there, there’s benefits to that.” Many others talked
about how valuable it was for the partners to be “a familiar face” among students and for both
sides to have a firsthand knowledge of their respective campus cultures, students, staff, and
procedures. The opportunity for students to visit and spend time on the college campus was also
seen as helping ease students’ transition into dual credit, including their ability to adapt to the
college environment and raise their comfort level with being on a college campus.

Dual-Credit Education Programs in Texas: Phase II
AMERICAN INSTITUTES FOR RESEARCH | AIR.ORG 88
Course-Taking Considerations
Students’ postsecondary plans and likelihood of credit transfer were most commonly
considered in advising students into dual-credit courses; high school counselors also
frequently reported considering students’ grade level and high school graduation
requirements.
Postsecondary plans and credit transfer. Regardless of the extent of their involvement in
advising students, nearly all of the counselors and advisors emphasized the importance of
students’ postsecondary plans, including their planned major or desired CTE-degree certificate
and where they were interested in attending college in guiding dual-credit course taking
decisions. Respondents described how having this information allowed them to better counsel
students into taking courses that would transfer to a specific degree plan, whether they would
be seeking an associate’s degree or a four-year degree. Many high school counselors and
advisors expressed concern that if students were undecided in their major or uncertain about
their post-high school plans, they would be at risk of taking and spending money on courses
that would not transfer to a specific degree or college, particularly if they elected to attend an
out-of-state school or highly selective university.
Indeed, credit transfer was reported as a major advising consideration by the majority of high
counselors and college advisors and many reported sharing resources with students about
credit transfer; however, for the most part students were strongly counseled to conduct their
own research on credit transfer. For example, as one counselor described:
We don’t specifically review [credit transfer] ourselves. It’s indicated that the students
need a little bit of legwork to go along with that. We talk about certain courses and how
they transfer. As an example, political science, health, those can transfer to different
institutions within the state of Texas. We talk about the common core’s numbering
system to look at how classes are going to transfer. Then we talk about instances where
they might have to repeat a course depending on the institution that they transfer to
and what their major is going to be within that.
High school counselors and college advisors taking this approach reported strongly advising
students and their parents to call colleges directly to find out if a certain course would transfer
and to review credit transfer policies on college websites. A small number of high school
counselors and advisors, however, took a more active role in confirming credit-transfer
information for students and used this information to guide their conversations with students.

Dual-Credit Education Programs in Texas: Phase II
AMERICAN INSTITUTES FOR RESEARCH | AIR.ORG 89
One high school had developed templates to map certain courses onto specific majors and
degrees at some colleges. Similarly, another respondent described how the counselors would
pull the transfer sheets directly off college websites for students to “make sure that any class
that they’re interested in is something that will be, one, be part of their degree plan and two,
be something that’s commonly transferable.” One high school used a specific program called
Naviance8 with students. The program offers an online career interest survey and, according to
the high school counselor, “they match that career interest to a college major at a particular
university, and this program automatically pulls up a degree plan, courses that they would need
to take to graduate with that degree…. We can match their dual-credit to those courses.” At the
same time, this counselor still emphasized, “I’m very careful to tell them that until they meet
with their college advisor at that freshmen orientation, you really don’t know exactly what is
going to be accepted and what’s not.”
High school graduation requirements. High school counselors also frequently reported
considering the high graduation program of study and degree requirements when advising
students into dual-credit courses. They indicated that a critical part of their role was ensuring
that students were enrolling in dual-credit courses that were crosswalked to high school
diploma requirements or their selected high school endorsement area. As one high school
counselor explained, “If the student is a sophomore, for example, U.S. history is part of the 10th
grade curriculum in the high school, so what we would try to do is swap out what they would
take at the high school level for the equivalent dual-credit class.” Some college advisors also
reported considering high school graduation requirements, but largely relied on the high school
counselors to monitor students’ progress in satisfying those requirements.
Counselors working in high schools that offered a wider variety of course options, including CTE
dual credit in addition to academic dual credit, described a higher level of involvement in
counseling students into certain courses. In these cases, counselors described meeting
individually with students to help them decide which courses bet fit their interests, college, and
career aspirations and to counsel them into courses that mapped to earning an associate’s
degree or a certificate in a certain field. As one counselor put it, “We don’t mandate just a
menu of classes, complete menu for everyone. We individualize it. So students sign up for
classes then they have a three-to-four-week where we’re actually making class option changes,
and we discuss with them if they have questions about why they should choose dual-credit over
a regular AP class or vice versa.”
8 https://www.naviance.com/
Dual-Credit Education Programs in Texas: Phase II
AMERICAN INSTITUTES FOR RESEARCH | AIR.ORG 90
Grade level. Counselors and advisors frequently indicated that students’ grade level either
dictated or strongly informed which courses they guided students into. In many cases, grade
was used as a sort of proxy for determining students’ academic readiness for certain courses,
their maturity or preparation for the rigors and expectations of particular dual-credit courses.
Freshmen and sophomores typically had less choice than juniors and seniors (if they were
allowed to participate in dual-credit courses at all per district policy) and in some cases no
choice. For example, one high school counselor explained how very little advising occurred for
ninth and 10th graders because they were in sheltered classes “that are basically picked for
them.” Others noted that freshmen pursuing dual-credit education were automatically placed
into a Learning Frameworks course to orient them to dual credit and get them use to the
structure and expectations of dual credit.
Many other counselors and advisors working with freshmen and sophomores also described
how grade level was used to place students into courses that they believed would “ease” their
transition into dual-credit education or against specific courses that may be available for them
to take. As one respondent stated, “I would never let a freshman take an economics course or a
psychology course. I probably wouldn’t even let a sophomore take a psychology course just
because of the demand, and the rigor, and just the content of the subject.” Another counselor
stated, “We want to make sure that we get the students in the correct courses and if they can
handle the course load along with being a high school student and whatever else activities
they’re enrolled in. We generally give them the easier classes at first semester…and see how
they do with it. That way, we can always [recover] their credit if something were to happen.”
Likewise, a few respondents indicated that they guide freshmen away from taking any online
course offerings because of the maturity level they believed was necessary for success in these
types of learning environments
One counselor working with CTE dual-credit students also indicated new CTE dual-credit
students (typically sophomores) were counseled into an exploratory class designed to provide
an overview of the four CTE dual-credit programs available to students. According to the
counselor, they recently switched to this approach because they found the vast majority of
their students were selecting welding as a default, without having a full understanding of the
work and career opportunities of the other fields, such as air conditioning and electrical and
machine maintenance. Another counselor reported counseling younger students into the
general core classes because “they aren’t ready to declare a major” and to start mapping their
dual-credit courses to a specific degree track.

Dual-Credit Education Programs in Texas: Phase II
AMERICAN INSTITUTES FOR RESEARCH | AIR.ORG 91
Indeed, many counselors indicated that because juniors and seniors were typically more certain
of their postsecondary plans, they provided more targeted counseling. As one counselor
described, “grade level plays a big role, not so much with their first 6 to 12 hours. Because a lot
of students, they’re going to take the first two history and the first two English, which is pretty
much basic for everybody…But once we get past 9 to 12 hours, again then we’re going to start
being a little more careful because we may do government, [but] not do Texas government [if]
they’re going out of state.” Others noted that they advised juniors and seniors differently than
younger students because of the greater number of courses available to juniors and seniors
and, thus, the greater risk for excess credit. In addition, counselors and advisors indicated that
less frequently considered factors were students’ academic performance in prior dual-credit
courses and course load and extracurricular activities.
Students’ academic performance in previous dual-credit courses was raised as a key
consideration among close to half of the high school counselors and a small number of college
advisors. Some partnerships had stipulations in place that would not allow dual-credit students
to take certain classes or continue in dual-credit programs if they were performing poorly. For
example, one partnership did not let students sign up for another course in a specific discipline
if they did not make a C or higher in one of the discipline-specific classes. Although students
could try to take the course again, the counselor indicated students were often advised against
doing so because they saw it as a risk to earning credit and to graduation. Similarly, a college
advisor for another partnership reported that, for struggling students, “We might have a
conversation with them about maybe transitioning to more of a general studies track where
they would still complete the associate’s degree and the core curriculum, but maybe not
necessarily that life science or mathematics major with us.”
Others reported that they reviewed students’ performance in dual-credit classes to determine
whether to counsel them into academic support services. In some cases they referred students
to the support services available on the college campus, including free tutoring and student
success centers; in other cases, particularly at ECHS schools but not exclusively, students were
counseled into academic intervention services available on the high school campus.

Dual-Credit Education Programs in Texas: Phase II
AMERICAN INSTITUTES FOR RESEARCH | AIR.ORG 92
Advising Challenges
High school counselors and college advisors described challenges related to high
school students’ academic and emotional readiness for dual-credit education, the
latitude given to students in dual-credit course selection, and the limited time they had
to fulfill all of their dual-credit advising responsibilities.
High school counselors and college advisors reported a wide variety of challenges they
experienced in advising students into dual-credit education or into specific dual-credit courses,
describing some as relatively minor and others as more problematic. Addressing students’
academic and emotional readiness for dual-credit education was the most frequently shared
challenge, particularly among high school counselors. Approximately half of the high school
counselors and about one third of the college advisors reported this challenge, but experienced
it in different ways. Some, for example, experienced this type of challenge primarily during the
registration process. Counselors and advisors described having to constantly remind students
and parents to complete and submit their dual-credit paperwork in time and attributed this
challenge with parents and students failing to understand the more rigid structure and
requirements of college compared to high school. Or, in some cases, high school counselors
talked about having to do the work for the students, which they perceived as harming the
student in the long run. As one counselor noted,
It places a lot of the responsibility off of the students and puts it back on me. I think the
students lose those—they lose that experience of their college because it’s still all being
done for them just like we do for high school…they’re missing out on that college
experience of you have a deadline, you have to get in there and choose your class, and
get yourself registered for it.”
Many others reported that it was difficult to effectively communicate to parents and students
the importance of emotional maturity and the ability of students to responsibly conduct
themselves in college classrooms, meet instructor expectations for academic performance and
engagement, and responsibly manage interactions and communications with the instructor.
This finding is consistent with the results of the previous Phase I study of dual-credit education
in Texas (Miller et al., 2017), which also highlighted some concerns among community college
respondents about the undue pressures placed on students to enroll in dual credit even if it
might not be for the best for the student, especially for students who may need time to further
develop their sense of responsibility and maturity (Miller et al., 2017).

Dual-Credit Education Programs in Texas: Phase II
AMERICAN INSTITUTES FOR RESEARCH | AIR.ORG 93
According to counselors and advisors, feeding into this challenge was the various factors that
push students into dual-credit education even if it is not the best fit. These factors included
parental pressure, the weighting of dual-credit courses with respect to class rank and GPA, and
students’ feeling compelled because their peers were enrolling. One college advisor noted, for
example, “students get points toward their class ranking or they’re distinguished being towards
valedictorian, salutatorian by taking these dual-credit classes. The more they have, I guess the
better the points are and so they’re concerned with being top in their class.” A high school
counselor also reported,
I think that students and their parents are really very interested in dual credit. It’s been
sold to them as a cost-effective measure to help them pay for their college, but I don’t
think we spend enough time talking to them about the maturity that it requires, the
attendance that it requires, how it can negatively affect their degree plan on the college
level if they have too many hours.
It is important to note, however, that as found in the Phase I study, the majority of the
respondents in this study did not explicitly mention students’ underpreparedness or immaturity
as a challenge, suggesting that most high school counselors and college advisors believe that
the majority of high school students participating in dual-credit programs are meeting college-
level course expectations.
Nearly one quarter of both high school counselors and college advisors indicated that the sheer
number of dual-credit courses available to their students to choose from challenged their
abilities to guide students into efficient course-taking pathways. These counselors and advisors
were working under partnerships that placed few limits on dual-credit course offerings and the
number of courses students were allowed to take. These respondents suggested that this
approach to dual credit compelled students to take as many dual-credit classes as available and
were of interest, even if they were not likely to transfer to a specific degree. They reported
instances where high schools wanted to offer more elective-type classes such as “two or three
classes in mathematics or four classes of Spanish throughout the year because they have
people on their campus that are eligible to teach those and like teaching them and so they offer
them.” One college advisor noted as another example,
[The high school] had a handful of students who finished their associate’s degree at the
same time they graduate from high school, and when you look at their degree plan and
the course selections that they’ve taken, their electives are all over the place. It’s an art
appreciation, it’s a music appreciation, it’s a theatre class. They don’t fit within a one-
degree plan that a four-year institution would offer unless it is just a general studies

Dual-Credit Education Programs in Texas: Phase II
AMERICAN INSTITUTES FOR RESEARCH | AIR.ORG 94
degree. Those students pay college tuition, they went through the course, and wherever
they’re going to transfer to, their four-year institution is going to utilize some of those
credits, but they’re not going to be able to utilize all of those credits.
The third most frequently reported challenge, by approximately one quarter of high school
counselors and college advisors each, was the lack of time to complete all of their
responsibilities and provide the individualized counseling they felt was needed. Respondents
cited various reasons for these time constraints, but frequently reported that the logistics of
registering dual-credit students, monitoring and tracking student progress, and coordinating
activities with their dual-credit partners were very time consuming. In some cases, counselors
or advisors did not just focus on dual-credit students, so they had to balance their dual-credit
advising with the other roles they played. Time was particularly problematic for counselors
serving large numbers of students and in schools where the dual-credit student population had
grown in recent years. As one high school counselor reported, “We’ve grown from seven dual-
credit graduates to 90 last year. We forecast to go over 100 this year. I think as we grow, the
resources that are available now, we may need to change because we’re not advising 20
students in dual credit anymore. We’re advising over 500 or close to it.” Other counselors
serving large numbers of students frequently indicated that it was nt possible to meet
individually with all of the students interested in dual credit or taking dual-credit courses,
although they perceived that students could benefit from more independent counseling
sessions. This issue of time has been raised in previous research on dual-credit education and
similarly found that high school counselors perceived the work of managing dual-credit
programs, including the recruiting, advertising, communicating with postsecondary institutions,
finding instructors, monitoring financial aid opportunities, and tracking grades, as a full-time job
in itself (Piontek et al., 2016).
A couple of other challenges were raised by small numbers of high school counselors and
college advisors, but these were typically described as relatively minor. Course scheduling and
coordinating dual-credit courses with high schools’ calendars was one. This reported challenge
is consistent with the Phase I study finding that community college dual-credit coordinators
encountered challenges related to the differences in the way colleges and high schools
schedule courses and other logistics, such as bus schedules (Miller et al., 2017). In addition, the
distance between the high school and college partner was raised as a minor challenge, most
often when the high school partner was rural.

Dual-Credit Education Programs in Texas: Phase II
AMERICAN INSTITUTES FOR RESEARCH | AIR.ORG 95
Suggestions to Improve Student Advising
According to respondents, greater clarity on credit-transfer policies, early advising,
more college-advisor involvement, and robust training could improve student
advising.
Greater clarity on credit transfer policies. Nearly half of the high school counselors and about
one quarter of the college advisors sought more guidance and clarity on credit-transfer policies.
Although these respondents reported having sources they could turn to for this information,
primarily college websites and the Texas course numbering system, they would have preferred
a more streamlined and uniform process for finding transfer policies, particularly transfer to a
specific degree. Many reported that university websites were hard to navigate and sometimes
not up to date. Others noted that while many of the dual-credit courses often transferred, they
transferred only as electives and not to specific degree tracks, so more degree-specific
crossover documents are needed. One high school counselor, for example, stated,
If I had, for every public college in Texas, a site where I could do and print off core
curriculum, “Here are the courses you’re going to take. If you’re going to major in
architecture, here’s a plan. Here’s your course descriptions and your plans.” I want to be
the one to help the student make a choice or give them the information, but finding it
and getting it in their hands so that they can understand it and take their time with it is
challenging.
Many others reported wanting a similar sort of crossover document that would include
information for specific majors and what they require. A potentially promising practice was
described by one high school counselor who attended an event at the community college
partner where a number of four-year universities were on-site to share information. Each
university had its own station that students could visit and receive credit-transfer guide sheets
for specific majors. A few college advisors also suggested that policies that required better
alignment between the college and high school curriculum could lead to a greater likelihood of
credit transfer and reduce the risk of excess credit.
Early advising. Approximately one quarter of high school counselors and college advisors each
suggested a need to start advising students earlier about dual-credit education and dual-credit
pathways into college. They indicated that students and their families would benefit from an
introduction to dual-credit education options as early as sixth to eighth grade, depending on
when students became eligible for dual-credit education in their districts. According to these

Dual-Credit Education Programs in Texas: Phase II
AMERICAN INSTITUTES FOR RESEARCH | AIR.ORG 96
counselors and advisors, earlier advising that includes career exploration would better prepare
students and families to make more strategic decisions about dual-credit education, including
decisions about whether and when to pursue dual-credit education, and whether to take dual-
credit or AP courses, depending on the student’s maturity level, academic record, and
postsecondary plans. This need to build career exploration into early advising practices was
particularly emphasized among respondents. Although counselors and advisors noted that they
did not want to “pigeon-hole” students into a particular major or degree path, they indicated it
was important to “capture them earlier…and talk to them more about career and what their
goals are after high school.” As one college advisor that was supporting an initiative to promote
earlier advising stated,
We’re not trying to move the freshman and sophomore year of college in to the senior
high school—we’re not trying to shift college down a grade, if you will, but what we are
trying to do is get the appropriate information to students earlier so that they can make
more important decisions about the high school plan and what courses that they
could—should take for dual-credit if that’s what they want to do.
One high school counselor described a potentially promising approach to supporting students’
dual-credit decision making. The school required students to participate in a mentorship
program at the end of their junior year and one at the beginning of their senior year, “so they
get an opportunity to work with some person out in the community who is in the field that they
are interested in looking into. So, they get some practical experience just to help them.”
More college advisor involvement. Many respondents indicated an interest in having college
advisors play a more direct role in the advising process, either to fill gaps in the counselors’
knowledge about what courses would map to a specific degree or certificate or to bring the
college-level presence and perspective to the conversation. One counselor described the value
of having a college advisor speak directly to students saying, “[The students] hear us tell them
the same thing over and over, year after year, but when another outside person comes in and
sits with them from the university, it’s very eye-opening for the students.” Similarly, other
respondents further indicated that having a college presence helps “put a face to the
university,” gives more weight to the guidance students receive and allows for more strategic
and informed dual-credit advising. As one high school counselor noted when asked about
suggestions for improving advising: “I would like to see more involvement from the college
actually coming to our high school campus and sitting down with students and working with
students independently…I’ve always felt like that role and that responsibility should be coming
more from the community college.”

Dual-Credit Education Programs in Texas: Phase II
AMERICAN INSTITUTES FOR RESEARCH | AIR.ORG 97
The college advisors shared this sentiment, indicating that dual-credit student advising would
be improved if they had opportunities to engage students in individualized advising sessions, or
at least had more face time with groups of potential or admitted dual-credit students to share
information and guidance form the college perspective. One advisor raised a related, but
slightly different concern. She estimated that 90% of the advising responsibilities fell on the
high school counselors and stated, “They’re so overwhelmed just trying to do the high school
portion, and adding [dual-credit] is pretty burdensome. We’re really hoping to provide some
extra support with our advisors so that that weight isn’t completely on them.” Similarly, the
college advisor for another partnership reported that they were in the process of hiring a dual-
credit pathways coordinator who would be more involved in directly advising students to
improve their postsecondary pathways and success. She noted, “The whole point of this new
position is to become much more intentional in our pre-advising, our working with the student
as they make those decisions, and then the post-advising, to make sure that we get them to
that next step in higher ed, whether it’s community college or university.”
In the absence of a dedicated college advisor on campus, counselors recommended mandatory
sessions with college advisors at the college campus or by phone so students could hear from
college advisors directly. For rural sites or partnerships where in-person, individualized
counseling was not an option, one counselor suggested virtual advising sessions with the
college advisors, particularly when students change their plans and need more individualized
advising to reduce risks of excess credit and extra time to degree. Similarly, a college advisor
suggested using ITV to conduct an orientation session for newly admitted dual-credit students,
just like we do our regular freshman coming in. I think that’s probably something that’s
been lacking with all our partners…. These are actually full-fledged accepted South
Plains College students, and they need that orientation. They need to know how we do
everything in our departments, and what’s expected of them as college students, and
how you’re successful on an online class.
Another college advisor also emphasized that more formal orientation sessions for new dual-
credit students would be a benefit, especially to stress with students that college advisors are
available to them on the college campus and can be a service to them. Ideally, however, this
advisor stated that she would prefer having multiple days per week at the high school campus
to hold advising sessions with students because students had such limited time on the college
campus outside of attending their classes.
Robust Training. Overall, college advisors and high school counselors praised the relationship
they had with their partners and the extent to which they were able to seamlessly share

Dual-Credit Education Programs in Texas: Phase II
AMERICAN INSTITUTES FOR RESEARCH | AIR.ORG 98
important information and get the answers they needed related to student participation in dual
credit. However, some advisors and counselors mentioned that they felt that they could better
coordinate advising activities with their partners if there was greater clarity about their
respective roles. Frequently in these instances, multiple people were involved in the process on
both sides. One college advisor raising this challenge explained, “There’s just so many people
involved that sometimes things—one person thinks one person’s handling something and one
person thinks it’s somebody else.” Similarly, other advisors talked about how more role clarity
would help streamline the coordination of activities and also better support students’ needs by
helping establish a shared understanding between partners about the purpose of dual-credit
for high school students, how it can best benefit them, and how to get them on a more
strategic dual-credit path early on.
Few high school counselors reported receiving any training from the college or another entity on
how to advise dual-credit students and close to one quarter of the high school counselors and
nearly one third of the college advisors indicated that having well-trained, dedicated dual-credit
advisors would improve student advising. The lack of training was particularly problematic when
there was turnover in counseling or advising staff. For example, respondents noted that when
turnover occurred, they struggled to work with inexperienced counterparts who were not familiar
with the specifics of dual-credit education and the partnership or to get used to new role
expectations. As one college advisor explained, “Every year, it’s a full new staff…if you can
imagine the complexities of trying to learn a high school counseling job, especially if you’re
coming from an elementary or something, different background and the complexities of that, and
then we go, ‘Oh, by the way, you learn everything about college, dual credit.’” Similarly, another
college dealing with recent turnover in high school counseling staff indicated the challenges of
working with a new team, stating, “A lot of the information is just assumed that everybody knows
it, but we have people coming from all different places and different backgrounds, and I do think
refreshers on that information would be very just helpful.”
Among those that reported receiving training, a few described participating in formal meetings
or sessions coordinated by their college partner. One counselor, for example, reported that the
college held biannual meetings with all of their high school partners that involved the college
vice president, a representative from admissions, the counseling office, and, on the high school
side, the high school counselors and principal.
Most, however, described more informal “training” environments, such as meetings with their
college partner to learn about new updates or changes in policies and college procedures
related to the dual-credit partnership. For example, one college advisor met with the CTE
Dual-Credit Education Programs in Texas: Phase II
AMERICAN INSTITUTES FOR RESEARCH | AIR.ORG 99
education director at the partner high school and her group of counselors annually to speak to
them about the courses that were going to be available for dual credit, and the requirements
there would be for the students to be able to enter the dual-credit CTE programs.
On the college side, advisors rarely reported attending any trainings specific to their partnership,
a few indicated attending workshops by THECB that focused on dual credit, including any changes
or updates related to dual-credit education policy or practice. One college advisor found these
trainings, coupled with the follow-up trainings and meetings conducted by her institution’s
administrators as very valuable. She stated that as a result of these trainings, “I feel like we’re
given a lot of tools and support so that we’re knowledgeable in advising.”
This recommendation stemmed partly from the previously reported challenge of not having
enough time to fulfill their duties and provide individualized student counseling. Several
commented on the need for dedicated dual-credit advisors and counselors to adequately serve
dual-credit students, particularly because of the rapid expansion of dual-credit education in the
state. As one high school counselor stated, “Dual credit is becoming the norm clearly in our
environment here. It’s spreading like wildfire. There are so many counselors out there that are
so unequipped in being able to handle this.”
Coupled with having committed dual-credit staff, several of the respondents emphasized the
importance of more robust training for counselors and advisors. A few respondents indicated
that counselors and advisors would benefit alike from training on how to identify a good
student candidate for dual-credit; specifically, as one college advisor suggested “having some
more strategic guidelines on what is or what isn’t the appropriate type of student to start into
those college courses.”.”
Conclusions
In this chapter, we examined dual-credit student advising processes and procedures, as
reported by 50 high school counselors and 52 college advisors working in a variety of dual-
credit education partnerships and contexts. Following, we summarize our key findings in each
of the topic areas we examined:
Students targeted for dual-credit education. All respondents indicated that they targeted
students for dual-credit programs based on district policies for dual-credit and the MOUs that
were in place with their partners. Within these parameters, there was some variation in the
extent to which high school counselors and advisors actively recruited or encouraged certain
types of students to apply. For example, some schools strongly encouraged all students to

Dual-Credit Education Programs in Texas: Phase II
AMERICAN INSTITUTES FOR RESEARCH | AIR.ORG 100
participate in dual-credit education, while others were more selective, targeting only those
students who were excelling in their high school classes and demonstrating high levels of
emotional maturity. Schools serving disadvantaged populations, had a clear focus on access and
encouraging all students to participate in dual-credit education.
Roles of high school counselors and college advisors. The majority of high school guidance
counselors played the primary role in advising dual-credit students, with one quarter sharing
this responsibility with college advisors. College advisors typically played a secondary role,
serving as the key point of contact for high school counselors and sharing information about
dual credit with prospective students and their families. They became more involved, however,
in special circumstances, including in the case of “accelerated students” or advising outside of
the core, CTE dual-credit programs, freshmen and sophomores, and poor performance.
Coordination of advising activities. Overall, high school counselors and college advisors
described close working relationships, most commonly to coordinate school visits and dual-
credit information sessions, registering students, and course scheduling. They coordinated
efforts related to students’ application materials, registration, course scheduling, and
transcripts and grades. Many counselors and advisors reported that they worked with each
other to develop materials, such as degree maps and course crosswalks, to help counsel
students into certain courses or to help monitor and track students’ progress toward meeting
their high school graduation requirements or an associate’s degree.
Course-taking considerations. High school counselors and college advisors most commonly
reported considering students’ postsecondary plans and likelihood of credit transfer when
advising students into dual-credit courses. In addition, counselors and advisors frequently
indicated using grade level as an indicator of students’ readiness for certain courses. High school
counselors also commonly reported guiding students into dual-credit courses that crosswalked to
high school degree requirements or students’ selected high school endorsement areas.
Advising challenges. High school counselors and college advisors expressed challenges related
to high school students’ academic and emotional readiness for dual-credit education, the
latitude given to students in dual-credit course selection, and the limited time they had to fulfill
all of their dual-credit advising responsibilities.
Suggestions to improve advising. High school counselors and college advisors suggested that
greater clarity on credit-transfer policies and course alignment, starting the advising process
earlier, more involvement from the college partner, and greater clarity in advising roles and
having well-trained and dedicated dual-credit staff could improve student advising.

Dual-Credit Education Programs in Texas: Phase II
AMERICAN INSTITUTES FOR RESEARCH | AIR.ORG 101
Chapter 3. The Academic Rigor of Dual-Credit Courses
Academic rigor is the focus of many debates around the quality of dual-credit courses (Baker,
Burnett, & Ferguson, 2015). The concept of academic rigor is consistently brought up in dual-
credit discussions, yet there is no consensus on how to define it (Winston et al., 1994; Braxton,
1993; Hechinger Institute, 2009; Wagner, 2008; Blackburn, 2008). With enrollment in dual-
credit courses increasing, a common understanding of academic rigor is necessary to ensure all
dual-credit students have access to similar expectations and instructional methods.
Phase I of the study uncovered systematic differences in instructor characteristics across dual-
credit and college-credit only courses, which highlighted the need to determine the extent to
which dual-credit students are held to the same academic standards as students in college-
credit only courses (Miller et al., 2017). In response to this need, we designed a study to assess
whether there are systematic differences in course content, assessment methods and
standards, and teaching approaches between dual-credit and college-credit only courses. For
this study we answered three questions:
RQ 1 What are the similarities and differences in the content and skills being offered in dual-
credit courses and college-credit only courses?
What are the similarities and difference in the instructional practices being used in dual-credit
courses and college-credit only courses?
What are the similarities and differences in how instructors of dual-credit courses and college-
credit only courses assess student learning and student performance?
Given the large number of dual-credit programs and breadth of dual-credit courses being
delivered in Texas, we decided to focus our efforts on two of the most common DC courses:
English Composition I (English 1314) and College Algebra (Math 1314/1414). For each course,
we attempted to recruit a sample of four faculty members delivering the course in three
different settings:
RQ 1 As an entry-level college course taught by college faculty (CC),
As a dual-credit course taught on a college campus (DC), and
As a dual-credit course taught by a credentialed instructor on a high school campus (HSDC).
The findings presented in this chapter contribute to a stronger understanding of the
commonalities and differences in academic rigor between college-level courses and across the
primary dual-credit course delivery contexts and settings presently being used in Texas (DC and

Dual-Credit Education Programs in Texas: Phase II
AMERICAN INSTITUTES FOR RESEARCH | AIR.ORG 102
HSDC). These findings can help policymakers identify where improvements in ensuring
consistency in course rigor can be made to promote the long-term success of all dual-credit
students in postsecondary pathways.
Organization of This Chapter
The remainder of this chapter is structured as follows: We begin by describing each of the four
dimensions along which we compare courses in terms of their academic rigor. Next, we
describe the process we used to recruit faculty to participate in the study and the data we
collected from them. We go on to describe the protocol we used to assess courses. Finally, we
report our findings on the similarities and differences in the four dimensions above across
course settings for English 1301, and Math 1314/1414, respectively.
Research Design
In this section, we describe how we conducted this study. Specifically, we report information
about how we define academic rigor, our instructor sample, the data collected from sampled
instructors, and the process we used to examine rigor along these five dimensions.
Study Definition of Academic Rigor
There is no consensus on how to measure the academic rigor of a college-level course. Thus, it
was necessary to develop a proxy to evaluate the extent to which dual-credit students are
consistently receiving college-level instruction. To inform our work, we consulted the literature
on academic rigor in mathematics and English language arts and identified four course
dimensions that, together, serve as a reflection or gauge of academic rigor:
RQ 1 Content—The topics or domains of knowledge taught in a course
Demonstration of skills—The content specific skills students are asked to perform
Instructional strategies—The techniques or methods teachers use to help students reach their
learning objectives
Assessment of student learning and performance — The strategies instructors use to determine
student understanding of the content and the demonstration of knowledge.

Dual-Credit Education Programs in Texas: Phase II
AMERICAN INSTITUTES FOR RESEARCH | AIR.ORG 103
We recognize that this definition is limited and does not encompass all of the materials and
mechanisms instructors use to teach content and skills (e.g., it does not include course
materials such as textbooks and other assigned readings).
Instructor Sample
With support of THECB, we identified a point of contact from an initial sample of 15 community
colleges and 10 four-year institutions in order to identify HSDC, DC, and CC instructors who
taught Math 1314/1414 and English 1301 in the 2017 fall semester. These contacts, who were
department chairs, deans, provosts, and chief academic officers, then chose high school and
college-level instructors who fit our selection criteria. After obtaining contact information, we
sent out an e-mail to each selected instructor asking for their consent to participate. Because
this study is exploratory, and because of resource constraints, we set a goal of recruiting at
least four instructors from English 1301 and Math 1314/1414 across our three course types, so
a total of 24 faculty members.
In total, we secured 22 individuals from 17 HEIs, which included one four-year institution and
sixteen community colleges across Texas. Table 3.1. provides the number of instructors who
participated by the type of course they taught.
Table 3.1. Total Amount of Participants for Each Course Type
Course Type English 1301 Mathematics 1314/1414
College-Credit Only Course Taught by
College Faculty (CC) 4 3
Dual-Credit Course Taught by College
Faculty (DC) 4 4
Dual-Credit Course Taught by a High
School Teacher (HSDC) 3 4
Data Sources
From each instructor, we attempted to collect: (1) the course syllabus, (2) a set of detailed
assignments given to students at three different times points of the academic year, and (3)
graded student work, which represented the full spectrum of grades (e.g., A, B, C, and F [or D if
F not available]) that responded to the assignments that we collected. We also developed and

Dual-Credit Education Programs in Texas: Phase II
AMERICAN INSTITUTES FOR RESEARCH | AIR.ORG 104
administered a faculty survey to capture information about instructional practices, the types of
assessments used to assess student learning, and content covered in the course.
Following, we describe the data collected from each source and why we considered it an
appropriate source to assess content, the demonstration of skills, instructional strategies, and
the assessment of student learning and performance. As mentioned previously, these course
materials, individually and combined with instructor survey data, provide a holistic view of the
level of academic rigor and commonality of rigor across the course delivery settings of interest.
Course Syllabi: Course syllabi contain information about the topics the instructor teaches in
the course and the skills that students are required to demonstrate in order to receive
course credit. Data collected from the course syllabi analysis allowed us to compare the
types of topics and skills instructors covered in a course and to gauge whether or not
students in all course types have opportunities to engage with similar content and skill
expectations.
Student Assignments: We analyzed multiple assignments from English 1301 and
Mathematics 1314. Data collected allowed us to compare the level of rigor of instructor
expectations of students across course types. We asked instructors to upload one
assignment/assessment on specific commonly taught topics in English and mathematics.
English instructors uploaded a synthesis, a persuasive essay, and a final exam. Mathematics
instructors uploaded a chapter test on polynomials and rational functions, a chapter test on
exponential and logarithmic functions, and a final exam. We chose these topics from the
initial review of syllabi, choosing one taught earlier in the semester, one from mid semester,
and one from the end of the semester.
Graded Student Work: We analyzed graded student work samples to compare how
instructors graded students’ level of mastery within and across course types. We asked
instructors to submit an “A” or “B” sample of student work, a “C” and an “F” (or “D” if they
did not have an F assignment) connected to the assignments mentioned above. We asked a
varied set of samples so we could analyze different levels of mastery to determine if
instructors were grading in similar ways. These data allowed us to compare the similarities
and differences in the grading of student performance across course types in Mathematics
1314 and English 1301.
Instructor Survey: We administered a survey to collect information about the amount of
time instructors across all three course types dedicated toward using specific instructional
strategies, teaching common content topics, and employing different assessment methods.

Dual-Credit Education Programs in Texas: Phase II
AMERICAN INSTITUTES FOR RESEARCH | AIR.ORG 105
We also used data collected from the instructor survey to check whether content reported
in the syllabi was actually being delivered in practice.
Table 3.2 summarizes the course materials we attempted to gather from each participating
instructor.
Table 3.2. Instructor Materials Collected for Study
COURSE SYLLABUS ASSIGNMENTS STUDENT WORK SAMPLES
Final course syllabus
that satisfies the
requirements of
Texas HB 2504
English
• Synthesis essay
• Persuasive essay
• Final exam
Mathematics
• Chapter test on polynomials and
rational functions
• Chapter test on exponential and
logarithmic functions
• Final exam
For each academic assessment,
student work samples were
submitted:
• First sample: Scored an A or B
• Second sample: Scored a C
• Third sample: Scored an F (or D if
you do not have a sample scoring
an F)
Once we recruited instructors from all three course types, we sent them an e-mail with
information about the types of data we sought to collect. Specifically, we asked each recruited
instructor to complete a survey and upload syllabi, student assignments, and graded student
work samples to an online data collection system. Table 3.3 shows the number of materials
collected from instructors from each course type.
Table 3.3. Data Collected From Participants
English 1301—English Composition
Survey Course Syllabus Student
Assignments
Graded Student
Work
CC 4 4 6 18
DC 4 4 13 32
HSDC 3 3 9 21
Overall Totals 11 11 28 71

Dual-Credit Education Programs in Texas: Phase II
AMERICAN INSTITUTES FOR RESEARCH | AIR.ORG 106
Math 1314/1414—College Algebra
Survey Course Syllabus Student
Assignments
Graded Student
Work
CC 3 3 9 16
DC 4 2 6 17
HSDC 4 3 12 36
Overall Totals 11 8 24 53
Note. Three Math 1314/1414 participants (two DC and one HSDC) took only the survey and did not upload
documents.
Metrics Used to Evaluate Academic Rigor
To assess course rigor across the four dimensions mentioned earlier (content, demonstration of
skills, instructional strategies, and assessment of student learning and performance), we
developed a protocol, adapted from David Conley’s work in Getting Ready for College, Careers
and the Common Core (2014), the Learning Sciences Marzano Center list of 13 Essential Strategies
for Rigor, and Part A of the Surveys of Enacted Curriculum in Mathematics and English Language
Arts, which was reviewed by three external experts (Conley, 2013; Marzano & Toth, 2014; The
Wisconsin Center for Education Research 2012a; 2012b ). We pilot tested the protocol with a
team of four independent reviewers, and then each study team reviewer assessed the course
materials independently without knowledge of the course setting (i.e., CC, DC, or HSDC). We then
systematically coded the course data we collected and distilled information to identify similarities
and differences across course settings. This approach allowed us to paint a rich picture of the
content and skill expectations, instructional strategies, assignments and assessment methods,
and graded student work employed across course settings in English 1301 and Math 1314/1414
and allowed us to objectively compare academic rigor across those settings.
Following, we describe the frameworks and sources we use to measure each dimension of
academic rigor and explain how we applied them within the context of this study.
Content and the Demonstration of Skills
We established a baseline for what is taught in college-level Math 1314/1414 and English 1301
based on two data sources:

Dual-Credit Education Programs in Texas: Phase II
AMERICAN INSTITUTES FOR RESEARCH | AIR.ORG 107
College Algebra and English Composition Syllabi: We reviewed a sample of 20 course syllabi
from Math 1314/1414 and English 1301 courses that were available online to identify
common topics taught in these courses along with the skills that students were required to
demonstrate to receive credit for the course.
The Lower-Division Academic Course Guide Manual (ACGM): According to the THECB, the ACGM
is the official list of approved courses for general academic transfer to public universities offered
for state funding by public community, state, and technical colleges in Texas. For all courses
listed in the ACGM, the THECB provides a list of student learning objectives (i.e., skills) that
students are required to demonstrate to receive credit for the course.
Table 3.4. Mathematics and English Content Areas
Mathematics 1314 English 1301
Polynomials Text analysis
Rational functions Source analysis
Radical functions Research Skills
Exponential functions Essay/composition development
Logarithmic functions Idea development
Systems of equations using matrices Audience, purpose, occasion
Graphing Stages of writing process
• invention
• researching
• drafting
Nonlinear inequities Thesis statements
Sequences and series Paragraph construction
Circles Informative, analytical and persuasive modes of
writing
Binomial Theorem Citation methods and technical aspects of writing
identify rhetorical purposes and methods of
organization appropriate to topic, thesis, and audience
Number systems Paragraph construction
Probability Audience, purpose and occasion

Dual-Credit Education Programs in Texas: Phase II
AMERICAN INSTITUTES FOR RESEARCH | AIR.ORG 108
Mathematics 1314 English 1301
Conics Citation methods and technical aspects of writing
identify rhetorical purposes and methods of
organization appropriate to topic, thesis, and audience
Revision strategies (individual and collaborative)
Table 3.5. Mathematics and English Content Skills
Mathematics 1314 English 1301
Critical Thinking Critical Thinking
Communication Communication
Empirical and quantitative Teamwork
Understand writing process (planning, drafting,
revising, editing)
Making Inferences
Drawing Conclusions
Command of grammatical structure
Develop computer literacy
Analyze various types of written works
Analyze purpose, audience, tone, style, and writing
strategy when in written works
To assess the rigor of the academic content and skills required of students taught across three
course types, we examined survey data and course syllabi from participating instructors.
Collected Syllabi: We reviewed course syllabi to determine whether instructors of CC, DC,
and HSDC courses taught common topics and required students to demonstrate specific
skills identified in Table 3.5.

Dual-Credit Education Programs in Texas: Phase II
AMERICAN INSTITUTES FOR RESEARCH | AIR.ORG 109
Instructor Survey: One component of the survey asked the participating HSDC, DC, and CC
instructors to report the amount of time they dedicated to teaching the specific topics
identified as common across Math 1314/1414 courses as well as English 1301 courses.
Unlike course syllabi, survey data allowed us to determine across the three course types
whether instructors actually delivered content reported in course syllabi, and the amount of
time they invested in teaching certain content and skills (by dedicating percent of time to
the topic or skill over the course of the semester).
What we checked
– Do instructors cover content topics common across the baseline sample of course syllabus?
– To what extent are common content topics being taught by instructors?
Instructional Strategies
To evaluate the rigor of instructional strategies used by instructors across HSDC, DC, and CC
courses, we drew on two frameworks:
Marzano Center Essentials for Achieving Rigor Model: This model, developed by Dr.
Marzano, an expert in content, pedagogy, and student assessment, evaluates the extent to
which instructors teach in ways that meet college and career readiness standards. The 13
instructional strategies included in Marzano’s model represent those that engage students
in general higher-order thinking skills (see Text Box 3.1).

Dual-Credit Education Programs in Texas: Phase II
AMERICAN INSTITUTES FOR RESEARCH | AIR.ORG 110
Text Box 3.1. Marzano’s 13 Strategies for Rigorous Instruction
Surveys of Enacted Curriculum in Mathematics and English Language Arts: These
instruments were developed by the Council of Chief State School Officers and the Wisconsin
Center for Education Research to examine the alignment between standards, curriculum,
instruction, and assessment. We drew on these surveys to identify rigorous instructional
practices specifically used in mathematics and English courses.
The instructor survey served as our primary source for assessing the rigor of the instructional
strategies used in HSDC, DC, and CC courses.
Instructor Survey: One component of the survey asked instructors to report on the amount
of time they dedicated to using the specific strategies included in Marzano’s model, and in
the Surveys of Enacted Curriculum in Mathematics and English Language Arts.
What we checked
– Do instructors use rigorous instructional strategies that engage students in general
higher-order thinking skills?
Interacting With New Content
• Identifying Critical Content
• Previewing New Content
• Organizing Students to Interact With Content
Practicing and Deepening New Content
• Helping Students Process Content
• Helping Students Elaborate on Content
• Helping Students Record and Represent Knowledge
• Managing Response Rates With Tiered Questioning Techniques
• Reviewing Content
• Helping Students Practice Skills, Strategies, and Processes
• Helping Students Examine Similarities and Differences
• Helping Students Examine Their Reasoning
• Helping Students Revise Knowledge
Cognitively Complex Tasks
• Helping Students Engage in Cognitively Complex Tasks

Dual-Credit Education Programs in Texas: Phase II
AMERICAN INSTITUTES FOR RESEARCH | AIR.ORG 111
– Do instructors use rigorous instructional strategies that engage students in general
higher-order thinking skills specific to mathematics and English instruction?
– To what extent are instructors using these instructional strategies in practice?
The Assessment of Student Learning and Performance
Assessment of Student Learning
We drew on two primary frameworks to assess the level of student learning in HSDC, DC, and
CC courses:
Marzano Center Essentials for Achieving Rigor Model: In addition to evaluating the rigor of
instructional strategies, Marzano’s model can also be used to evaluate the cognitive
complexity of student assignments. Broadly, cognitive complexity accounts for practices
that will help student engage with content at higher levels of cognitive demand. We
specifically used this model to examine the extent to which instructors asked students to
engage in cognitively complex tasks. Marzano defines cognitively complex tasks as tasks
that require students to (1) engage in decision making that draws on breadth of knowledge
and skills, (2) engage in problems solving within different contexts, (3) develop and test
hypotheses, and draw conclusions from these tests, and (4) solve dilemmas or puzzles. In
other words, these tasks require students to assess their knowledge and skills, and utilize
them to solve real-world problems. An example of a cognitively complex task is
summarizing news articles about the summer melt phenomenon and designing an
experiment to test the effectiveness of an intervention intended to address this problem.
Webb’s Depths of Knowledge (DOK) Levels Framework: Webb’s DOK framework is used to
examine the cognitive demand of student assessments (Webb, 2002). We define cognitive
demand as the degree of knowledge and level of thinking which students must demonstrate
to engage in a specific task. Categorized into four discrete levels, each level reflects a
different level of cognitive expectation, or depth of knowledge, required to adequately
respond to an assignment. Unlike Marzano’s model, the DOK framework specifically focuses
on the depth of understanding that is required of the student, not the design of the actual
task (See Text Box 3.2.)

Dual-Credit Education Programs in Texas: Phase II
AMERICAN INSTITUTES FOR RESEARCH | AIR.ORG 112
Text Box 3.2. Levels of Depth of Knowledge (Webb, 2002)
As mentioned previously, we analyzed data collected from student assignments, course syllabi,
and instructor surveys to assess how instructors across HSDC, DC, and CC course types assessed
student learning, specifically the cognitive complexity of student assignments, and the level of
cognitive demand that these assignments demanded of them.
Level 1: Recall and Reproduction
The lowest of all levels, tasks that fall under Level 1 require students to recall facts or perform rote
procedures and do not involve the transformation of knowledge. Students who respond to Level 1
tasks knows the answer or does not, i.e., does not have to figure it out. Example: Adding two
numbers.
Level 2: Skills and Concepts
At Level 2, a student must engage in some mental effort beyond what is needed to recall or
reproduce a fact. Level 2 tasks typically require students to classify information into meaningful
categories, transform information, explain relationships among other tasks. Example: Explaining how
to perform a particular task.
Level 3: Short-Term Strategic Thinking
At Level 3, students must engage in short-term use of higher-order thinking skills. For example, tasks
that fall under Level 3 require students to evaluate aspects of a scenario, solve real-world problems,
or make an argument for or against a particular position. Example: Developing a questionnaire to
gather information.
Level 4: Extended Thinking
Level 4 tasks require students to exert the highest level of cognitive effort. At this level, students
demonstrate that they can summarize information from a variety of sources, identify information,
come up with new solutions to problems where the outcome is unknown. Example: Designing an
experiment that tests a variety of hypothesis.
Adapted from: http://www.state.nj.us/education/AchieveNJ/resources/DOKWheel.pdf and
https://www.edutopia.org/blog/webbs-depth-knowledge-increase-rigor-gerald-aungs

Dual-Credit Education Programs in Texas: Phase II
AMERICAN INSTITUTES FOR RESEARCH | AIR.ORG 113
Student Assignments: Instructors from Math 1314/1414 and English 1301 across HSDC, DC,
and CC course types submitted specific assignments used to evaluate student learning. We
chose specific assignments for English and chapter tests for mathematics due to the nature
of instruction and content. College-level mathematics courses do not always collect specific
assignments, but all three types of courses do conduct chapter tests. We chose one
assignment that would be taught earlier in the semester, one from midsemester and one
from the end of the semester. For each assignment we collected, we examined the extent
to which tasks within that assignment could be considered cognitively complex and required
students to demonstrate higher levels of depth of knowledge. See Appendices F and G for
the rubric used to assess the cognitive complexity of student assignments and the cognitive
expectations that these assignments demanded in mathematics and English.
Course Syllabi: We identified what types of assignments instructors gave students as
reported in course syllabi. For example, we examined whether instructors in HSDC, DC, and
CC courses assigned problem sets or gave quizzes to students enrolled in Math 1314/1414.
Instructor Survey: One component of survey asked instructors to report on the types of
responses tasks within student assignments elicited. For example, the survey asked
instructors to report the percentage of course assignments that used multiple choice
responses versus those that required students to explain or justify a response.
What we checked
– Are assignments given to students cognitively complex?
– Do assignments require students to demonstrate higher levels of depth of knowledge?
– What kinds of assignments do instructors give students? And what kinds of responses
do they elicit?
Assessment of Student Performance
The graded student work we collected from instructors represented nearly the full spectrum of
grades that could be awarded (i.e., grades A, B, C, and F [or D if an F-graded sample was not
available]). To assess the extent to which the instructors in our sample consistently awarded A,
B, C, and F (or D) grades to student work of the same level of cognitive development and
competence, we drew on the Novice-to-Expert Continuum, which we describe in more detail
later.

Dual-Credit Education Programs in Texas: Phase II
AMERICAN INSTITUTES FOR RESEARCH | AIR.ORG 114
Novice-to-Expert Continuum: Developed by David Conley, an expert in college readiness, the
Novice-to-Expert Continuum is a seven-level scale that assesses a student’s cognitive
development and learner competence around six key concepts: (1) insight, (2) efficiency,
(3) idea generation, (4) concept formation, (5) integration, and (6) solution seeking (Conley,
2013). Instructors can use this continuum to assess the level at which students demonstrate
competence along these six concepts.
For each graded student work categorized as an A or B, C, and F (or D) across the three course
types, we examined whether the student had exhibited competencies embodied within the
seven levels of the Novice-to-Expert Continuum. For example, we assessed whether student
work given an A demonstrated the ability to apply knowledge gained in the course to other
contexts. In other words, did the student demonstrate a trait characteristic of an “Emerging
Expert” (highest level of the continuum)? To be categorized under a certain level, students had
to exhibit a majority of traits characteristic of that level. We adapted Conley’s continuum for
the purposes of the study.9
9 As one of our external reviewers, Dr. Conley reviewed and approved our adaptation of the Novice to Expert Continuum for this study.

Dual-Credit Education Programs in Texas: Phase II
AMERICAN INSTITUTES FOR RESEARCH | AIR.ORG 115
Table 3.6. Novice-to-Expert Continuum (Conley, 2013)
Levels Concepts
Emerging Expert Ability to apply knowledge in a variety of contexts Holistic understanding of subject matter rather than fractional understanding of
subject matter Abstract thinking and strong ability to synthesize and integrate information Developed “Conceptual understanding”—the why
Accomplished Strategic Thinker
Ability to apply abstract thinking, ability to synthesize and integrate variety of sources and information
Command of “conditional knowledge”—the when—when to apply the knowledge
Developing holistic understanding of subject matter rather than fractional understanding of subject matter
Developing “conceptual knowledge”—the why
Strategic Thinker Able to apply insight, idea generation, concept formation and integrate different subjects/topics
Deep understanding of subject matter Developing abstract thinking, analytical skills and ability to synthesize/integrate
information Developing command of “conditional knowledge”—the when—when to apply
the knowledge
Emerging Strategic Thinker
Developing ability to apply insight, idea generation, concept formation and integrate different subjects/topics
Able to analyze information and discern patterns in information due to familiarity with subject
Command of “procedural knowledge”—the how
Accomplished Novice
Connecting subject matter to big ideas, aware of complexity of subject Developing contextual knowledge Meets basic expectations and guidelines Ability to interpret and apply information Demonstrates “declarative/descriptive knowledge”—the what
Novice Thinker Superficial understanding of subject area, concept formation, solution seeking skills
Developing ability to interpret and discern rules and guidelines regarding basic standards
Emerging Novice Limited background in subject area, minimal contextual understanding of subject
Developing ability to meet basic standards and requirements

Dual-Credit Education Programs in Texas: Phase II
AMERICAN INSTITUTES FOR RESEARCH | AIR.ORG 116
What we checked
– To what extent does student demonstrate characteristics/competencies identified
within each level?
Data Analysis
AIR researchers identified the similarities and differences in content and skill expectations,
instructional and assessment practices, and student performance across courses through a
systematic analysis of the data. Four AIR researchers reviewed 22 sets of survey data, 19 syllabi,
52 assignments, and 124 student work samples for the purposes of the study. The researchers
were trained to use the online protocols, using sample syllabi, assignments, and student work
samples. The researchers conducted an initial analysis of the samples and then came together
to discuss and calibrate findings. Researchers then examined the uploaded data; two
researchers focused on the English syllabi, assignments, and student work samples, and two
researchers concentrated on the mathematics syllabi, assignments, and student work samples.
Two researchers examined each syllabus separately and later compared their responses and
categorizations to reconcile any differences and produce one agreed upon representation of
what was included in each syllabus. This then allowed for a baseline comparison of academic
expectations among courses in the different modalities. Each assignment was reviewed by a
single reviewer. After reviewing all assignments, the researchers who examined the English
assignments met to ensure they had been using similar definitions of terms and were
categorizing items similarly; likewise for the researchers working on mathematics assignments.
The process for reviewing the 53 mathematics and 71 English student work samples was similar
to the assignment review process. Each student work example was reviewed once by a single
reviewer, and after examining all examples, researchers working in the same subject areas
conferred to discuss any differences in approach or rating.
In April 2018, researchers came together in a full-day, face-to-face meeting to analyze all of the
data collected. Researchers were guided through a collaborative analytic process that focused on
understanding the data and data sources, identifying individual findings from each set of sources,
and developing main findings based off of recurring patterns and common themes (Maxwell,
2013; Merriam, 1998). Each reviewer was assigned to focus on a specific course type and
reviewed each data set from that perspective. Researchers identified individual data points from
the data and posted them under the key themes for this part of the study; what is taught
(content and skills expectations), how its taught (instructional strategies, assignments and

Dual-Credit Education Programs in Texas: Phase II
AMERICAN INSTITUTES FOR RESEARCH | AIR.ORG 117
assessments), and student performance. They then worked in teams to organize the data points
into main findings for each content area. These main findings are the basis for this report.
Limitations
The analysis presented in this chapter is exploratory in nature and reflects a relatively small
sample of dual-credit and college-credit only courses and course instructors in Texas. In
addition, our analysis is not based on any observations of instruction or any measure of quality
of instruction. The intent of the study is to provide initial insight into the content expectations,
the instructional strategies, and how instructors assessed student learning and performance
across different delivery types of dual-credit and entry-level college courses. Although this
study is limited in its ability to make definitive conclusions about the similarities and differences
in rigor across dual-credit and college-level courses, it provides a model methodology that
could be applied in future studies with larger numbers of participants. This would allow
researchers to draw stronger conclusions about the rigor of content covered instructional
approaches. In addition to a large-scale study, the methodology here could be used by a small
group of instructors to ensure standardization of course content, expectations for the cognitive
complexity and cognitive demand of assignments, and that students are being graded similarly
for demonstrating similar levels of content mastery.
Findings
English 1301—English Composition
Content
All course types focused on essay/composition development, idea development, stages of the
writing process, thesis statements, and informative, analytical, and persuasive modes of
writing. All syllabi reviewed across course types explicitly stated each of these topic areas
would be covered in the course. In addition, the instructor survey data indicated that
instructors in all three course types spend similar amounts of time on each of these core topics.
CC instructors had lower expectations around how to write a thesis statement and construct
paragraphs compared to HSDC and DC courses. CC had fewer requirements for developing of
thesis statements and paragraph construction, while almost all the HSDC and DC syllabi
reviewed included explicit guidelines for both. For example, a syllabus collected from a CC
included the following statement regarding development of thesis: “identify rhetorical
purposes and methods of organization appropriate to topic, thesis, and audience” yet had no

Dual-Credit Education Programs in Texas: Phase II
AMERICAN INSTITUTES FOR RESEARCH | AIR.ORG 118
assignments focusing on thesis development. Whereas in one DC syllabus, the expectations
regarding thesis statement skills were not only included in the course objectives but were also
paired with a reading assignment that explored how to write a thesis statement. Another HSDC
syllabus required students to take a thesis statement quiz with a paragraph construction
assignment in the first week of classes.
The Demonstration of Skills
Nearly all syllabi we reviewed required students to demonstrate similar skills. When
reviewing student assignments, every course type had the same skills listed: critical thinking
skills; communication skills; teamwork; understand writing process (planning, drafting, revising,
editing); analyze purpose, audience, tone, style, and writing strategy in written works. This
finding indicates that across course types, instructors believe that these seven skills are
essential to student success in English 1301. Based on our analysis, students at every course
level are expected to use the same skills for their English 1301 course work and will gain the
same skills throughout the curriculum.
Instructional Strategies
Instructors across HSDC, CC and DC courses reported that they devoted differing amounts of
instructional time for students to engage with any one task across course types. Instructors
across course types specified spending the highest amounts of time engaging students in
reviewing and revising work, and collecting, summarizing, and analyzing information or data
from multiple sources, and asking students to engage in the writing process to support
arguments with evidence. This correlates with course content and skill expectations for an
English 1301 course and is similar to the expectations found in the Surveys of Enacted
Curriculum in English. For CC, participation in whole-class discussion about writing and reading
exercises was given the second highest percentage of time, while for HSDC instructors reported
that students were engaged in computer use to learn, practice or explore writing and reading
content, for the second highest percentage of the time. For DC, use of computer was also the
second highest percentage of student engagement during instructional time, but not as high as
HSDC. On the opposite end, CC instructors gave the lowest amount of instructional time for
students maintain a portfolio, DC instructors gave the lowest amount of instructional time for
students to present or demonstrate to others, and HSDC instructors gave the lowest amount of
instructional time for students to do metacognitive exercises.

Dual-Credit Education Programs in Texas: Phase II
AMERICAN INSTITUTES FOR RESEARCH | AIR.ORG 119
Assessment of Student Learning and Performance
HSDC, CC, and DC instructors required students to respond to similar types of assignments.
Quizzes, papers, presentations, and student participation in class were almost always used for
assessing student learning and contributed to the overall grade for most courses. The weight
attributed to each assignment in determining the student’s overall student grade varied;
however, we did not find evidence showing that instructors of HSDC, DC, and CC courses used a
grading scheme specific to their course type.
There were no differences in assignments’ levels of cognitive demand between course types.
In our review of 30 assignments including final exams, persuasive and synthesis essays, we
found marked similarities across course types. All prompts for the persuasive essay were rated
as meeting the requirements for the third level of cognitive demand, Short-Term Strategic
Thinking. At this level, students are asked to engage in short-term use of higher-order thinking
skills. For example, tasks that fall under Level 3 require students to evaluate aspects of a
scenario, solve real-world problems, or make an argument for or against a particular position.
Similarly, all final exams were rated at the fourth level of cognitive demand, Extended Thinking.
At this level, students are asked to exert the highest level of cognitive effort. At this level,
students were required to demonstrate that they could summarize information from a variety
of sources, identify information, devise new solutions to problems where the outcome is
unknown.
There were also no differences in assignments’ levels of cognitive complexity between course
types. All assignments were rated with similar rankings. For instance, all of the synthesis essays
were ranked at the second level of cognitive complexity, which in the scale used was “practicing
and deepening new content.” The essays reviewed asked students to do more than interact
with new content, they asked students to elaborate on content, examine similarities and
differences, and examine their reasoning. Similarly, all of the final exams were rated at the third
level of cognitive complexity, Cognitively Complex Tasks. The final exams required students to
engage in solving a problem, analyzing options, and drawing conclusions.
There were no clear differences in the level of student performance across course types. In
our review of graded work samples, researchers found that the final exam and persuasive and
synthesis essays that were graded with an “A” or “B” across course types demonstrated the
qualities of the “Strategic Thinker” level of the Novice-to-Expert Continuum. For example, a
persuasive essay submitted by a HSDC instructor demonstrated that a student was able to use
insight to form a deep understanding of concepts related to specific subject matter, focusing on

Dual-Credit Education Programs in Texas: Phase II
AMERICAN INSTITUTES FOR RESEARCH | AIR.ORG 120
concussion protocol in football. Similarly, a persuasive essay submitted by a CC instructor
demonstrated that a student was able to apply insight and use analytical skills to
synthesize/integrate information focusing on organ donation. Similarly, all “C” work was
identified at the “Emerging Strategic Thinker” level and “D” and “F” work was rated at the
“Novice Thinker” level across all courses.
Mathematics—What Is Taught
Content
All course types focused on these core components: polynomials, rational functions, radical
functions, exponential functions, logarithmic functions, systems of equations using matrices,
and graphing. All syllabi reviewed across course types explicitly stated each of these seven
content areas. In addition, the instructor survey data indicated that instructors in all three
course types spend the largest percentage of instructional time on these core topics. These
findings indicate that these were the primary content areas taught consistently across the three
course types.
All course types spent minimal or no instructional time focused on circles and the Binomial
Theorem. No syllabi from any of the three course types indicated either circles or the Binomial
Theorem as a content focus. This was confirmed in the instructional survey, in which instructors
across all course types reported spending less than 10% of instructional time on circles content
or no time at all. Apart from one HSDC instructor who reported spending between 10% and
25% of instructional time on the Binomial Theorem, instructional survey responses indicated
minimal or no time spent on this topic across groups.
Content focused on number systems was more prevalent within CC courses. All the HSDC and
DC syllabi we reviewed omitted these content areas. However, number systems content was
present in two of the three CC syllabi reviewed. For DC courses, the instructional survey also
highlighted a lack of instructional time spent on this topic, with zero instructors indicating 10%
or more of instructional time spent on number systems, and three of four indicating that no
time is spent at all. For CC courses, instructional survey responses from two of the three
respondents indicated time spent on the number systems topic.
Less instructional time was spent on sequences and series in CC courses. None of the CC syllabi
review mentioned sequences and series as an instructional topic. These omissions were
confirmed by the instructor survey, in which two of three college-entry-level professors indicate
no time spent at all, and the third indicating less than 10% of instructional time spent on the
Dual-Credit Education Programs in Texas: Phase II
AMERICAN INSTITUTES FOR RESEARCH | AIR.ORG 121
sequences and series topic. Sequences and series were present in all reviewed DC syllabi, along
with two of the three HSDC syllabi.
Demonstration of Skills
Presentation and demonstration skills were developed minimally across all three course
types. Evidence from the survey responses also indicate that the use of instructional time
asking student to present or demonstrate to others is minimal across course types. All
respondents, apart from one, indicated that either less than 10% of time or no time at all was
used on presentations or demonstrations. One CC instructor indicated that he or she utilizes
between 10% and 25% of instructional time asking students to present or demonstrate.
All three course types spent a significant amount of time developing students’ skills in
technology, computer, and calculator use. Instructor survey responses from across course
types indicate that they spend time asking student to Use computers, calculator, or technology
to learn, practice or explore mathematics. Apart from one CC professor and one DC professor
who indicate minimal use of technology, the rest of the respondents across course types
reported that technology is used between 10% and 50% of instructional time. In addition, two
CDHS professors and one CC professor reported that technology is used during more than 50%
of instructional time.
General mathematics skills were consistently and explicitly stated in syllabi for CC courses.
Utilizing data from the course syllabi, it was determined that some courses establish
expectations for the development of core skills through the students’ engagement with the
content. The four skills targeted for development include Critical thinking skills, communication
skills, empirical skills, and quantitative skills. All four skills were explicitly listed in the CC syllabi,
with one referring to them as “in support of the objectives of the Texas core curriculum.” It was
also noted in the same syllabus that “[t]hese objectives form a foundation of intellectual and
practical skills that are essential for all learning.” None of these skills were listed in any of the
DCHS, and only one of the DC courses had them listed. The fact that these were explicitly stated
in all CC courses and not DCHS courses may signify a standardization of defined skills within
Algebra across Texas colleges.
CC instructors spent more instructional time developing reading and comprehension skills.
Survey responses indicate that CC courses spend more instructional time asking students to
Read and comprehend mathematics information from multiple sources, with responses ranging
from 10% to more than 50%. Meanwhile, three of four DC professors indicated spending less
than 10% of instructional time on the same skill, and the use of instructional time for HSDC
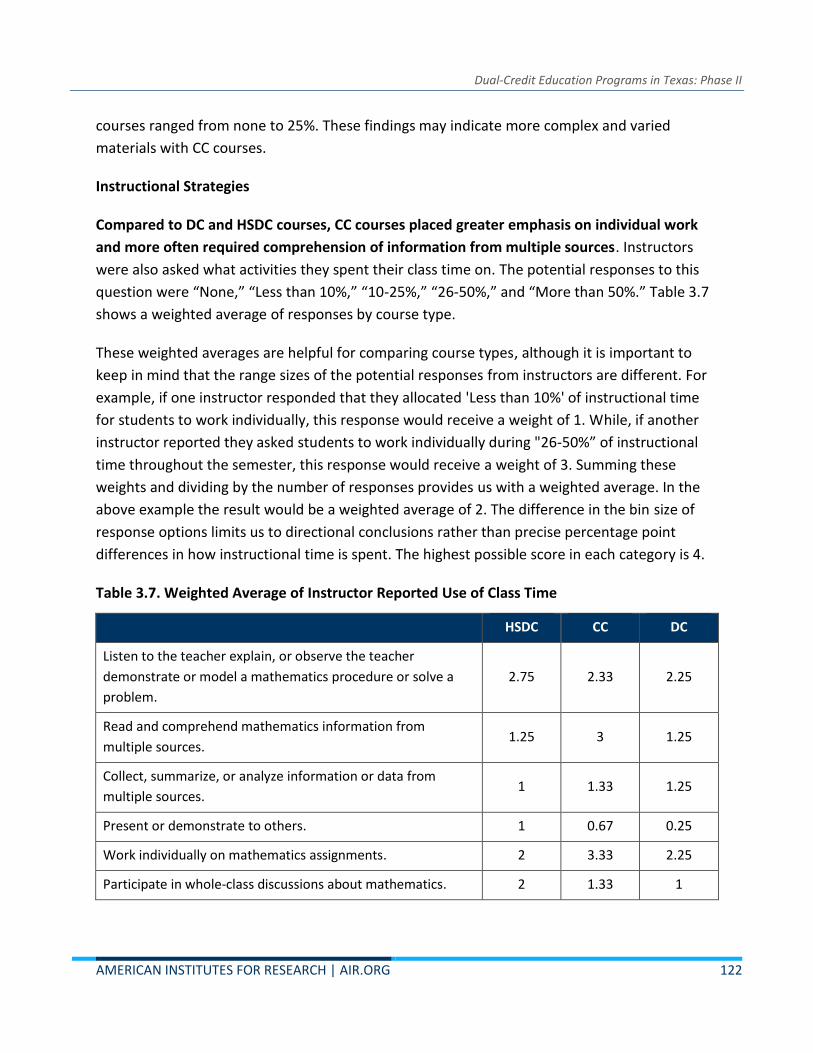
Dual-Credit Education Programs in Texas: Phase II
AMERICAN INSTITUTES FOR RESEARCH | AIR.ORG 122
courses ranged from none to 25%. These findings may indicate more complex and varied
materials with CC courses.
Instructional Strategies
Compared to DC and HSDC courses, CC courses placed greater emphasis on individual work
and more often required comprehension of information from multiple sources. Instructors
were also asked what activities they spent their class time on. The potential responses to this
question were “None,” “Less than 10%,” “10-25%,” “26-50%,” and “More than 50%.” Table 3.7
shows a weighted average of responses by course type.
These weighted averages are helpful for comparing course types, although it is important to
keep in mind that the range sizes of the potential responses from instructors are different. For
example, if one instructor responded that they allocated 'Less than 10%' of instructional time
for students to work individually, this response would receive a weight of 1. While, if another
instructor reported they asked students to work individually during "26-50%” of instructional
time throughout the semester, this response would receive a weight of 3. Summing these
weights and dividing by the number of responses provides us with a weighted average. In the
above example the result would be a weighted average of 2. The difference in the bin size of
response options limits us to directional conclusions rather than precise percentage point
differences in how instructional time is spent. The highest possible score in each category is 4.
Table 3.7. Weighted Average of Instructor Reported Use of Class Time
HSDC CC DC
Listen to the teacher explain, or observe the teacher
demonstrate or model a mathematics procedure or solve a
problem.
2.75 2.33 2.25
Read and comprehend mathematics information from
multiple sources. 1.25 3 1.25
Collect, summarize, or analyze information or data from
multiple sources. 1 1.33 1.25
Present or demonstrate to others. 1 0.67 0.25
Work individually on mathematics assignments. 2 3.33 2.25
Participate in whole-class discussions about mathematics. 2 1.33 1

Dual-Credit Education Programs in Texas: Phase II
AMERICAN INSTITUTES FOR RESEARCH | AIR.ORG 123
HSDC CC DC
Work in pairs or small groups on mathematics exercises,
problems, investigations, or tasks. 1.75 1 1.25
Use computers, calculator, or technology to learn, practice or
explore mathematics. 3.25 2.67 2
Maintain a portfolio of their own work. 1 0 0.75
Review and revise work. 2.25 2 1.75
Across all course types, instructors reported spending little to no instructional time asking
students to present to others or maintain portfolios of their work. Ten of the 11 instructors
reported spending either less than 10% or no class time asking students to present or
demonstrate to others. Similarly, nine out of 10 instructors reported spending either less than
10% or no class time asking students to maintain a portfolio of their own work.
Assessment of Student Learning and Performance
The three course types used similar assignments, primarily final exams, chapter
tests/midterms, quizzes, and homework, to determine students’ grades. Based on review of
course syllabi, the three course types use similar assignments to determine students’ grades. All
syllabi included a final exam, some form of chapter tests or midterms, and all but one included
some variant of homework as the main graded elements. Quizzes were used by all CC
instructors, two out of three HSDC instructors, and one out of two DC instructors.
The main assignments, final exams, chapter tests/midterms, quizzes, and homework
determined similar portions of students’ grades across course types. On average, cumulative
final exams made up roughly 20% of students’ final grades in all course types, chapter
tests/midterms accounted for roughly 50%, homework for 10% to 15%, and when included,
quizzes accounted for 15% to 20% of students’ final grades.
There were no differences in assignments’ levels of cognitive demand between course types.
In our review of 27 assignments including chapter tests/midterms and final exams, we found
marked similarities across course types. All assignments were rated as meeting the
requirements for the second level of cognitive demand, skill/concept. At this level, students are
asked to use conceptual knowledge to solve problems that often require two or more steps to
solve. Two sample activities that meet this requirement are “Retrieving information from a

Dual-Credit Education Programs in Texas: Phase II
AMERICAN INSTITUTES FOR RESEARCH | AIR.ORG 124
table, graph, or figure and using it to solve a problem requiring multiple steps” and “Solving a
routine problem requiring multiple steps, or the application of multiple concepts.”
There were also no differences in assignments’ levels of cognitive complexity between course
types. All assignments were also ranked at the second level of cognitive complexity, which in
the scale used was “practicing and deepening new content.” The exams reviewed asked
students to do more than interact with new content but did not meet the criteria for the
highest level of cognitive complexity as the problem solving involved was routine and not
asking students to devise new methods of finding solutions.
The results of the instructor survey showed that across all course types instructors used short
answer questions as the most common method of assessing students. Presentations, projects,
and portfolios were uncommon across all course types.
Table 3.8. Weighted Average of Instructor Reported Use of Assessment Strategies
HSDC CC DC
Multiple choice or true/false items 2 0.67 1.25
Short answer questions such as performing mathematical procedure
2.75 3.33 3.75
Extended response item for which students must explain or justify a solution
1.5 1 1
Performance tasks (hands-on activities) 1 1 1
Individual or group demonstration or presentation
0.25 0.67 0.5
Mathematics projects 0.5 0 0.5
Portfolios 0.25 0 0.25
HSDC instructors more frequently than traditional college instructors reported using multiple
choice and true/false questions. One potential difference between course types was in the use
of multiple choice and true/false questions, with CC courses using them least often and HSDC
courses using them more often. These findings are based on instructor survey responses and
are not based on actual counts of each question type or within assignments or type of
assignment reviewed.
There were no clear differences in the level of student performance between course types. To
measure student learning and mastery of content, we reviewed 70 examples of student work
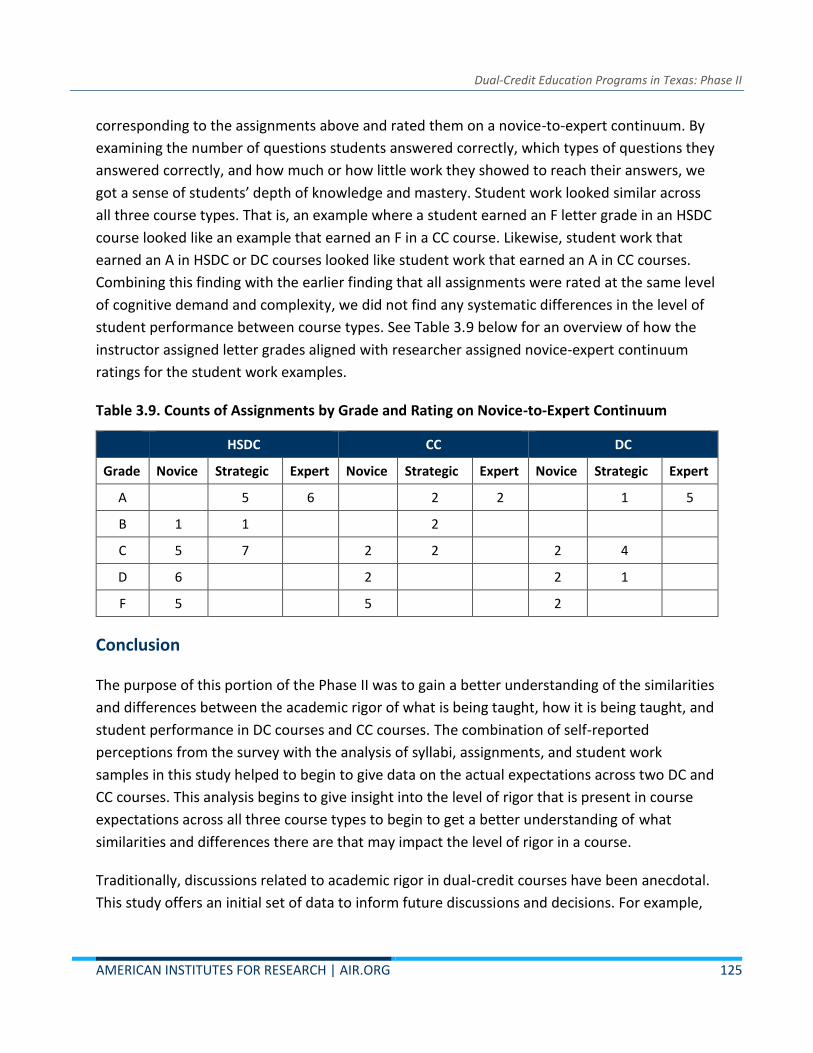
Dual-Credit Education Programs in Texas: Phase II
AMERICAN INSTITUTES FOR RESEARCH | AIR.ORG 125
corresponding to the assignments above and rated them on a novice-to-expert continuum. By
examining the number of questions students answered correctly, which types of questions they
answered correctly, and how much or how little work they showed to reach their answers, we
got a sense of students’ depth of knowledge and mastery. Student work looked similar across
all three course types. That is, an example where a student earned an F letter grade in an HSDC
course looked like an example that earned an F in a CC course. Likewise, student work that
earned an A in HSDC or DC courses looked like student work that earned an A in CC courses.
Combining this finding with the earlier finding that all assignments were rated at the same level
of cognitive demand and complexity, we did not find any systematic differences in the level of
student performance between course types. See Table 3.9 below for an overview of how the
instructor assigned letter grades aligned with researcher assigned novice-expert continuum
ratings for the student work examples.
Table 3.9. Counts of Assignments by Grade and Rating on Novice-to-Expert Continuum
HSDC CC DC
Grade Novice Strategic Expert Novice Strategic Expert Novice Strategic Expert
A 5 6 2 2
1 5
B 1 1
2
C 5 7
2 2 2 4
D 6
2
2 1
F 5 5 2
Conclusion
The purpose of this portion of the Phase II was to gain a better understanding of the similarities
and differences between the academic rigor of what is being taught, how it is being taught, and
student performance in DC courses and CC courses. The combination of self-reported
perceptions from the survey with the analysis of syllabi, assignments, and student work
samples in this study helped to begin to give data on the actual expectations across two DC and
CC courses. This analysis begins to give insight into the level of rigor that is present in course
expectations across all three course types to begin to get a better understanding of what
similarities and differences there are that may impact the level of rigor in a course.
Traditionally, discussions related to academic rigor in dual-credit courses have been anecdotal.
This study offers an initial set of data to inform future discussions and decisions. For example,
Dual-Credit Education Programs in Texas: Phase II
AMERICAN INSTITUTES FOR RESEARCH | AIR.ORG 126
these data could be used when considering course content requirements and the development
of common syllabi. The findings provide more specificity about the commonalities in
expectations across courses and begin to identify discrete differences that can be addressed to
begin to ensure academic rigor across course types. The design of this study and the findings
offer opportunities to begin to have conversations around instructional strategies that focus on
academic rigor and how to develop assignments and assessments at higher levels of cognitive
demand and higher on the novice-to-expert continuum (Marzano & Toth, 2014; Webb, 2002;
Conley, 2013). Although the results reported in this chapter are based on a very small sample
size, the findings offer an opportunity to reflect on current practices in HSDC, DC, and CC to
improve the academic rigor across course types. We hope the results of this study will help
contribute to an informed, continued discussion of academic rigor to ensure all students
enrolled in dual-credit programs have access to a rigorous course of study.

Dual-Credit Education Programs in Texas: Phase II
AMERICAN INSTITUTES FOR RESEARCH | AIR.ORG 127
Chapter 4: The Costs of Delivering Dual-Credit Education
The availability of dual-credit courses in Texas has expanded rapidly over the last decade. At
South Texas College, for example, dual-credit courses were first offered in 2006 to 28 students.
By 2016, almost 16,000 students took courses as dual-credit students (Perez-Hernandez, 2016).
Statewide, dual-credit enrollment increased by 215% from 2006 to 2015 (Legislative Budget
Board Staff, 2017).
One concern with the rapid expansion of dual credit is the cost of such courses, and the manner
in which those costs are distributed across stakeholders. Here, we define costs as the monetary
value of the resources used to deliver dual-credit education programs that would not be
otherwise be used to deliver high school instruction and support services. Explicitly excluded
from this definition is revenue, or appropriations, allocated by federal and state government
that is used to fund higher and secondary education institutions to administer dual-credit
programs. Federal, state, and local funding including tuition payments represent cash transfers
that help pay for the cost of dual credit, and we discuss the role of these cash transfers as part
of our analysis of cost.
The purpose of this study is to estimate the cost to deliver dual-credit programs, and to
determine how these costs are shared among community colleges, public school districts, and
students and their families. In addition, we compare the costs of delivering dual credit
education against the amount of state funding that is allocated to education institutions for the
purpose of administering dual-credit education. We also explore how different tuition
agreements alter the distribution of costs among stakeholders. Finally, we examine the benefits
of dual-credit education and how the monetary value of benefits compares with the costs of
dual-credit education.
Who Bears the Cost of Delivering Dual-Credit Education?
Community colleges, school districts, and students and their families are the key stakeholders
who bear the cost to cover the delivery of dual-credit education. In particular, tuition agreements
play a central role in determining who bears the costs of dual credit. According to the work by
Pierce (2017), Texas is one of 13 states (plus the District of Columbia) where the decision about
who pays for tuition is made at the local level by community colleges and school districts.
According to data collected by the Texas Association for Community Colleges (TACC) (2017), in FY
2016 community colleges in Texas employed a variety of tuition arrangements, with the most
generous being waiving tuition and fees completely. The most common approach, according to

Dual-Credit Education Programs in Texas: Phase II
AMERICAN INSTITUTES FOR RESEARCH | AIR.ORG 128
TACC data, was to provide a partial waiver or charge a flat fee per semester credit hour that was
generally less than full tuition. As a result of offering college courses at a discounted rate, colleges
have been concerned that revenue sources are not covering the cost of providing dual-credit
courses (South Texas College, 2015; Express-News, 2018).
The cost to colleges, however, is but one source of the overall costs of providing dual credit.
There are also costs to school districts, which have to coordinate dual-credit opportunities with
colleges and advise students regarding dual-credit opportunities, and potential costs to
students, who may be responsible for purchasing textbooks, traveling to community colleges,
and paying tuition and fees. Furthermore, the cost burden might be shared in a variety of ways
by the three parties that make up a dual-credit partnership (community colleges, public school
districts, and students and their families), leading to substantial variation across Texas
regarding who pays the costs of dual credit. This adds a level of complexity to the analysis and
reporting of findings (Legislative Budget Board Staff, 2017).
While the rapid expansion of dual-credit poses its challenges, with cost being one of them, the
expansion of dual-credit options also has benefits for high school students. Participation in
higher education has been shown to have many benefits to individuals in the form of higher
earnings and other factors improving quality of life as well as society at large (McMahon, 2009).
Because of these benefits, Texas has created 60x30TX, the state’s ambitious Higher Education
Strategic Plan. This plan sets goals of 60% of 25- to 34-year old Texans having a certificate or
college degree by 2030, increasing the number of students per year completing a certificate or
degree, improving marketable skills of college graduates, and reducing debt (Texas Higher
Education Coordinating Board, 2015). Increasing the participation of economically
disadvantaged high school students in dual credit and other college-level courses is one
strategy for helping the state attain these ambitious goals.
Purpose
The goal of the cost component of the Texas Dual-Credit Education Study is to estimate the cost
of providing dual-credit programs across the state, while showing what accounts for the costs
and which stakeholders pay for the costs. The cost analysis is designed to yield several types of
information that will be useful to policymakers, practitioners, and researchers.
First, the cost analysis provides an understanding of the types and quantities of personnel and
nonpersonnel resources used to deliver dual-credit courses to students, as well as the
corresponding cost of those resources. To this end, the cost information shows the cost of

Dual-Credit Education Programs in Texas: Phase II
AMERICAN INSTITUTES FOR RESEARCH | AIR.ORG 129
replicating a dual-credit program at a new site and thus provides information to determine the
feasibility of doing so. The information is valuable not only in providing a general account of the
costs, but also as a reference that can be used to consider how resource usage might be
adjusted to improve delivery of dual-credit courses. In addition, knowing the costs of providing
dual-credit courses is important for understanding the total effort involved in sustaining such
programs over time.
Second, the study sheds light on how the burden of these costs is shared over a variety of
stakeholders, including community colleges, public school districts, and students and their
families. This information can be used by policymakers in refining mechanisms to appropriately
fund dual-credit programs.
Finally, beyond understanding the cost structure of dual-credit programs and who pays for
these programs, ultimately policymakers want to know if the investment worth it. To this end,
we examine the benefits of dual-credit education and compare these to costs. We monetize the
improvement in student outcomes identified in the impact analysis. Furthermore, we
categorize benefits as those benefiting the students who take dual credit and benefits to the
public at large. By categorizing benefits in this way, we can estimate both the private and public
return on investment for dual credit.
Cost Study Methodology
As defined earlier, the cost of dual-credit education is the total amount of resources provided
by colleges, school districts, and students, to deliver dual-credit education programs, that
would not otherwise be used in a traditional, nondual-credit high school setting. Importantly,
state funding for colleges and K–12 school districts, as well as tuition payments, are not costs,
but rather cash transfers that shift the burden of costs. As we discuss in the subsections below,
our study includes two analyses of cash transfers. First, we analyzed state funding data to
determine how any additional funding from the state that community colleges and school
districts receive for dual credit compares to the costs. Second, we studied how tuition
payments alter the distribution of costs. These two types of cash transfers – state funding and
tuition payments – do not add to the overall costs (as they are not tangible resources), but
rather shift how costs are distributed among stakeholders.
We also identify who is responsible for different types of costs. Costs can be paid for by
community colleges, school districts, or students and their families. Costs to community
colleges and school districts are “public” costs, which are funded through tax revenue raised at

Dual-Credit Education Programs in Texas: Phase II
AMERICAN INSTITUTES FOR RESEARCH | AIR.ORG 130
the local, state, and federal levels. Costs to students and families are private costs, which are
funded directly by the students and families of students receiving dual credit.
Sample Selection
For the cost analysis, we first selected a purposive sample of dual-credit partnerships,
consisting of community colleges and their partner public school districts and high schools
(Figure 4.1).10 The sample of partnerships were selected to ensure variation in geographic
location (including both urban and rural areas); dual-credit delivery models, including courses
offered on-site (i.e., at the community college campus) and off-site (i.e., at the high school); and
high school model (ECHSs and traditional high schools).11 Specifically, we first selected five
community colleges —three that serve relatively urban partnering high schools and two that
serve more rural high school partners.12,13 From those community colleges, we selected a set of
partnering public school districts of varying sizes containing high schools that use various dual-
credit delivery models. This sampling approach allowed for comparative analysis between dual-
credit programs in these various contexts. We used information on costs from both the college
and school districts to develop comprehensive costs of dual credit.
10 Several community colleges selected are community college districts having multiple campuses. 11 Due to the substantially different resources required for CTE dual credit, and the relatively low prevalence of this type of dual credit offering, we did not perform in-depth cost analysis of CTE dual credit programs. However, we performed a broad scan of the research on differential costs of CTE. In addition, all the community colleges sampled provided CTE courses. We captured elements of these programs in our data collection. 12 Urban and rural definitions are based on census locale definitions that are also used by the National Center for Education Statistics (see https://nces.ed.gov/programs/edge/docs/LOCALE_DEFINITIONS.pdf). 13 We chose to focus only on community colleges offering dual credit because community colleges offer approximately 95% of all dual-credit instruction in Texas.
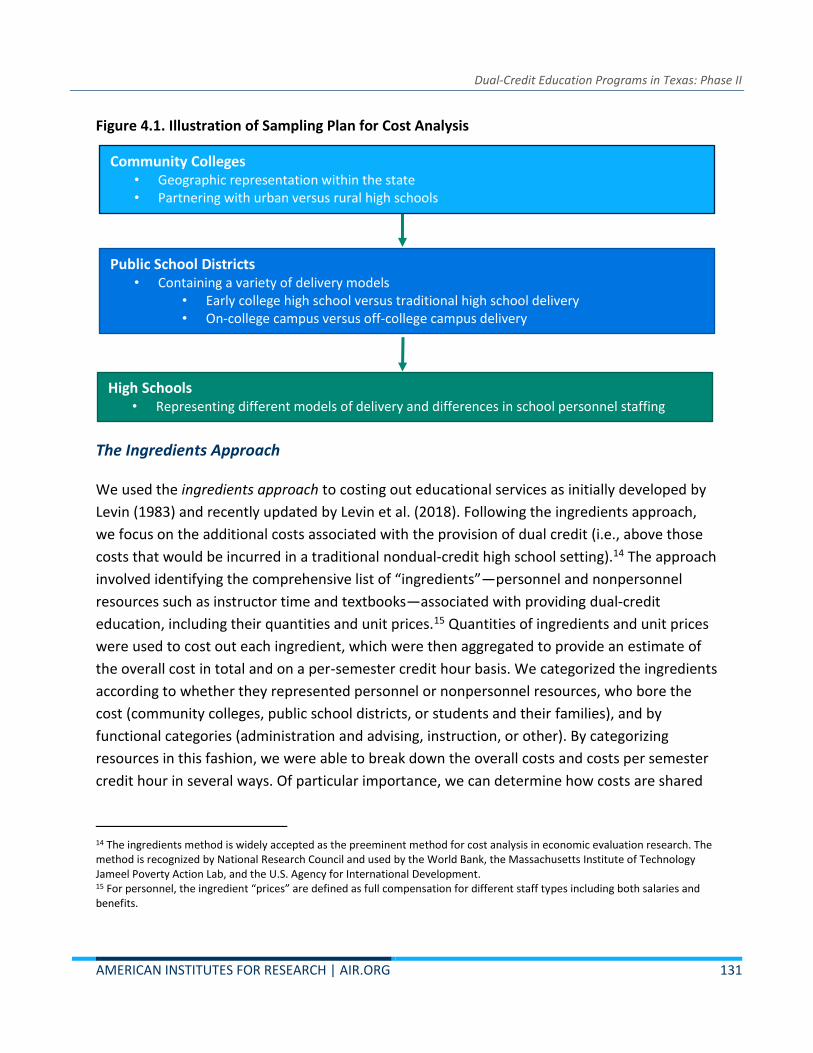
Dual-Credit Education Programs in Texas: Phase II
AMERICAN INSTITUTES FOR RESEARCH | AIR.ORG 131
Figure 4.1. Illustration of Sampling Plan for Cost Analysis
The Ingredients Approach
We used the ingredients approach to costing out educational services as initially developed by
Levin (1983) and recently updated by Levin et al. (2018). Following the ingredients approach,
we focus on the additional costs associated with the provision of dual credit (i.e., above those
costs that would be incurred in a traditional nondual-credit high school setting).14 The approach
involved identifying the comprehensive list of “ingredients”—personnel and nonpersonnel
resources such as instructor time and textbooks—associated with providing dual-credit
education, including their quantities and unit prices.15 Quantities of ingredients and unit prices
were used to cost out each ingredient, which were then aggregated to provide an estimate of
the overall cost in total and on a per-semester credit hour basis. We categorized the ingredients
according to whether they represented personnel or nonpersonnel resources, who bore the
cost (community colleges, public school districts, or students and their families), and by
functional categories (administration and advising, instruction, or other). By categorizing
resources in this fashion, we were able to break down the overall costs and costs per semester
credit hour in several ways. Of particular importance, we can determine how costs are shared
14 The ingredients method is widely accepted as the preeminent method for cost analysis in economic evaluation research. The method is recognized by National Research Council and used by the World Bank, the Massachusetts Institute of Technology Jameel Poverty Action Lab, and the U.S. Agency for International Development. 15 For personnel, the ingredient “prices” are defined as full compensation for different staff types including both salaries and benefits.
Public School Districts
• Containing a variety of delivery models • Early college high school versus traditional high school delivery • On-college campus versus off-college campus delivery
High Schools
• Representing different models of delivery and differences in school personnel staffing
Community Colleges
• Geographic representation within the state • Partnering with urban versus rural high schools

Dual-Credit Education Programs in Texas: Phase II
AMERICAN INSTITUTES FOR RESEARCH | AIR.ORG 132
among various stakeholders (i.e., community colleges, public school districts, and students and
their families). The cost burden to students and their families is of special interest, given the
student debt goal in 60x30TX.16
The costs we considered were only those related directly to the provision of dual credit and are
extraneous to the general operation of schools.17 The intention of the analysis is to isolate the
differential costs of dual-credit instruction compared to traditional high school instruction. That
is, how much more (or less) does it cost to provide students with dual-credit instruction
compared to traditional high school instruction?
Data Collection
To conduct the cost analysis, we gathered extant data and conducted primary data collection.
Specifically, extant data consisted of statewide data from 2016–17 obtained from THECB and TEA
on dual-credit enrollment, instructor salaries, and high school personnel staffing levels. We also
analyzed extant data, when available, from the sampled set of study sites. These data included
fiscal data on dual-credit spending from community college accounting systems, as well as
documentation of service arrangements between colleges and partnering school districts and
high schools. This documentation included information obtained through MOUs between
community college and school district partners. The extant data were used to determine
quantities of certain ingredients that were clearly identified in the data (e.g., the number of dual-
credit instructors who are full-time college faculty) and were used to establish average prices of
these ingredients (e.g., the compensation associated with a typical full-time college faculty
member providing dual-credit instruction). In addition, the extant data contained key information
such as the tuition arrangements between colleges and school districts.
Because the extant data were generally not sufficiently detailed or comprehensive enough to
identify all costs in the delivery of dual-credit programs, we also conducted interviews at each
community college and school district site. These interviews were necessary to obtain more
granular information on how the dual-credit program is delivered within each study site and the
specific resources that are required. For example, at each of the school districts sampled, an
administrator was responsible for overseeing dual credit. In some cases, this was their primary
responsibility, and in other cases, this was only one of many responsibilities. Some districts
provided administrative support for these staff and provided significant travel reimbursement
16 See http://www.60x30tx.com/goals/goal-four-student-debt/ 17 In addition, because costs related to facilities are relatively fixed—meaning they do not vary with respect to small changes in numbers of students—we did not include facilities costs in this analysis.
Dual-Credit Education Programs in Texas: Phase II
AMERICAN INSTITUTES FOR RESEARCH | AIR.ORG 133
throughout the school year, while others provided less support. To accurately calculate the cost
of delivering dual-credit courses, we asked interviewees to estimate the percentage of time
spent by the various staff involved with activities related to the dual-credit program.
Developing a Resource Cost Model
To calculate the overall costs associated with the dual-credit program at each of the
participating study sites, we developed what is known as a resource cost model (RCM). The
RCM is a tool to organize the resources identified in interviews and extant data, apply prices,
and calculate overall costs and costs per SCH. The RCM was developed using Microsoft Excel
and performs a series of calculations to convert types and quantities of resources into costs.
As previously mentioned, to calculate costs, we needed prices and quantities of ingredients.
The quantities of ingredients were largely obtained from interviews or extant data. In some
cases, quantities of resources were clear from these sources. In other instances, we had to
make some assumptions about the uptake of certain resources. For example, each site reported
that students must take the TSIA to determine their eligibility for many dual-credit courses. The
TSIA requires a fee per testing unit for each subject area. School districts did not have
information on the number of TSIA tests given over the course of a school year readily available
but could offer estimates on the number of testing units each dual-credit student takes. Based
on those estimates, we made assumptions of the number of testing units that districts paid for
each year. In most cases, the resources for which quantities were not clearly apparent from the
interviews were nonpersonnel items that were only minor contributors of cost.
In some cases, prices of ingredients also came from the interviews or extant data. In many
cases, however, we had to use alternative sources of information to determine prices.
Following the ingredients method, we assigned salaries commensurate with the experience and
educational level of personnel. This strategy allowed us to estimate the cost of producing dual
credit (the value of resources used), rather than the expenditures of dual credit that are specific
to a given context. In the case of instructors, we used data from THECB on salaries. For other
staff positions, such as administrative staff, counselors, and school principals, we used data
from the 2016 Bureau of Labor Statistics Occupational Employment Statistics data as standard
prices for various types of staff.
We used the quantities and prices of the various resources allocated to producing dual-credit
education to determine overall costs. The overall cost at each individual site was divided by the
total number of dual-credit SCHs provided in 2016–17 to determine a site-specific cost per
semester credit hour. We focus on the cost per semester credit hour per student, rather than

Dual-Credit Education Programs in Texas: Phase II
AMERICAN INSTITUTES FOR RESEARCH | AIR.ORG 134
the cost per student, because much of the costs involved in producing dual-credit education,
such as the instructor costs, vary with the number of courses, not the number of students. Our
estimates of the annual cost per semester credit hour can be converted to annual cost per
student simply by multiplying by the average number of semester credit hours that each
student takes each year.
Funding Analysis
To incorporate funding into the cost study, we examined the existing policies and state funding
formulas determining the amount of funding distributed to community colleges and K–12
school districts. State funding for community colleges is primarily delivered on a per-contact
hour basis, with funding rates differing according to the type of course. For K–12 school
districts, state funding is largely based on each district’s average daily attendance, with
adjustments related to district size, geographic location, and student population. However,
regardless of whether a student’s class schedule includes only traditional high school (nondual-
credit) courses or dual-credit courses (taken either on a high school campus or on a college
campus), the same amount of state funding is generated, even though there are clear
differences in costs associated with these models of instructional delivery.
By understanding the funding formulas in detail, we attempted to calculate the amount of state
funding going to both community colleges and K–12 districts on a per SCH or per course basis. We
then compared these state funding figures to the costs incurred by community colleges and school
districts to understand the magnitude of the difference between costs and state funding, with an
understanding that any difference between the two must be made up through other sources.
One additional source of revenue available to community colleges is tuition and fees paid for by
either the students or the school districts. We examined the different approaches to charging
tuition and fees taken by the community colleges in our sample to understand the impact of
this additional revenue source in making up the difference between costs and state funding at
the community college level.
Benefits Analysis
Upon completion of the cost analysis—which yielded an estimate of the cost of delivering dual-
credit programs—we conducted a benefit-cost analysis to understand whether the benefits of
dual-credit outweigh the costs of providing this intervention. To assess benefits, we assigned
dollar values associated with the following outcomes measured in the impact analysis: (1)
increases in the graduation rates from postsecondary education programs and (2) changes in

Dual-Credit Education Programs in Texas: Phase II
AMERICAN INSTITUTES FOR RESEARCH | AIR.ORG 135
the time and SCHs taken after high school graduation to complete postsecondary education
programs. These positive outcomes provide monetary benefits for both students and the state
of Texas.
We can think of benefits both in terms of those that are short term and long term. Short-term
benefits for students might include paying less for college, given that students have already
earned credits toward college completion while still enrolled in high school. In addition,
accelerated college completion results in earlier entry into the workforce, reducing the cost of
college and allowing recent graduates to begin earning a full-time salary. This last piece is salient
to the student debt goal in 60x30TX because less time in college and earlier entry into the
workforce should also decrease student debt. Long-term outcomes accrue from differential
earnings over the course of an individual’s lifetime. Long-term societal benefits may also include
lower levels of criminal activity, reduced use of social welfare or healthcare systems, and higher
tax revenues associated with a more educated and higher paid workforce (Trostel, 2009).18
Cost of Providing Dual-Credit Courses in Texas
In this section, we describe the results from our cost analysis. As mentioned previously, we
sampled five community colleges varying by size, geographic area within the state, and whether
they serve a more urban or rural population of students. We then selected a set of school
districts partnering with these community colleges of varying size and with varying delivery
models. We intended to select two school districts for each community college. However, due
to lack of availability or responsiveness, we were unable to gather data for districts partnering
with one of the community colleges. However, for two other community colleges we gathered
data from three rather than two school districts. In total, we retained a sample of 10 school
districts (two districts with two schools each and two districts with three schools each). In
reporting our results, we do not identify the community colleges or school districts and have,
instead, assigned each college a letter (A-E) and each school district a number along with the
letter of the partnering college (for example, District 1A).
In addition to being diverse in size and location, the community colleges sampled were also
diverse in the method of instructional delivery (Table 4.1). In four of the five community
colleges, dual credit was most commonly delivered at the high schools. There was substantial
variation across sites in terms of who was teaching the dual-credit courses. In two sites, dual-
credit courses were most commonly delivered by high school teachers who were approved to
18 We do not measure these benefits directly as part of this study, but instead apply estimated benefits based on prior research and knowledge on the benefits of increased education.

Dual-Credit Education Programs in Texas: Phase II
AMERICAN INSTITUTES FOR RESEARCH | AIR.ORG 136
teach dual credit by the community college; in one site, dual credit was overwhelmingly taught
by part-time (adjunct) community college faculty; and in two sites dual credit was most
commonly delivered by full-time college faculty.
Table 4.1. Sample of Community Colleges
College
Number of
Dual-Credit
SCHs
Serves
Mostly
Urban or
Rural
Courses Most
Commonly
Delivered at
High School or
College Campus
Most Common
Faculty Type
Teaching Dual
Credit
Number of
Partnering
Districts Included
in Study
A High Urban High School High School Teacher 3
B High Urban High School Part-Time College 2
C Moderate Urban College Full-Time College 2
D High Rural High School High School Teacher 3
E Moderate Rural High School Full-Time College 0
Notes: High number of dual-credit SCHs is more than 20,000 in 2016–17. Moderate number of dual-credit SCHs is
more than 10,000 and less than 20,000.
In addition to this variation across community college sites, there was also variation in how dual
credit was delivered across and within the sampled districts. Many of the districts included in
the sample operated dual credit in both a traditional manner (for students attending the
traditional comprehensive high schools) and as part of ECHS programs. ECHSs are high schools
where the goal is for students to earn a two-year degree or certificate while in high school.
Therefore, students enrolled in ECHSs take dual-credit courses in far greater numbers and often
begin enrolling in dual-credit during the ninth grade. ECHSs are also sometimes located on or
near a community college campus. Because of this, ECHS students more often take dual-credit
courses on a college campus and are taught by college faculty compared with traditional dual
credit. Finally, community colleges often use different tuition agreements for dual-credit in
ECHSs versus dual credit for students in traditional comprehensive high schools.
TEA established a blue print for ECHSs that requires, among other things, individualized student
plans and ongoing academic support, college readiness advising, and mentorship opportunities,
all of which likely require additional support staff. ECHSs are often smaller schools of
approximately 450 students with lower administrator-to-student ratios. We use school-level
staffing files to calculate the additional staff for ECHSs compared with traditional high schools in

Dual-Credit Education Programs in Texas: Phase II
AMERICAN INSTITUTES FOR RESEARCH | AIR.ORG 137
the same district and factor this into our cost analysis. In addition, both ECHSs and traditional
high schools with substantial numbers of students taking dual-credit not taught by high school
teachers are able to reduce teaching staff. Our data show that a typical high school teacher
teaches five course sections, each with an average class size of 24 students; therefore, for every
720 SCHs of dual credit taught by college faculty, a high school can hire one less teacher. We
factor these cost savings into our estimates of the cost of providing dual-credit opportunities.
In the rest of the chapter we present an overview of the costs for traditional and ECHS dual-
credit models, followed by our analysis of statewide costs of dual credit and the cost burden of
dual credit. In addition, short narratives describing the salient features of dual credit offered at
each college site along with a presentation of costs for each of the community college-school
district partnership can be found in Appendix E.
Dual Credit in Traditional Comprehensive High Schools
Costs for delivering traditional dual credit (delivered through traditional comprehensive high
schools as opposed to ECHSs) showed substantial variation across the colleges. Several factors
emerged as important predictors of differences in the cost of dual credit across sites, including
the type of instructor and the size of the school district. Following, we describe the main cost
factors contributing to the cost of dual credit in traditional high school settings.
Dual-credit costs vary substantially according to the type of instructor teaching the course.
The first factor impacting dual-credit costs is the type of instructor teaching the course. There
are generally three types of teachers for dual-credit courses: full-time college, part-time
(adjunct) college, and high school teachers. When college faculty teach courses, the college
pays for those faculty. Full-time college faculty are paid substantially more than adjunct college
faculty, making full-time college faculty a more expensive option. In addition, when dual-credit
courses are taught by college faculty, high schools can reduce the number of teaching staff at
their school. During interviews, school district administrators noted the cost savings associated
with assigning community college faculty as instructors of dual-credit courses. As one district
administrator reported, “If dual credit were to go away, then we would have to absorb those
kids back into our system and it would cost us a lot of money to do that. That instruction right
now, we would have to instruct those classes because [students] are counting on almost all of
them for graduation requirements.” Because districts can reduce teacher staffing levels by
assigning college faculty to teach high school classes, we accounted for cost savings on teacher
staffing in our estimates.
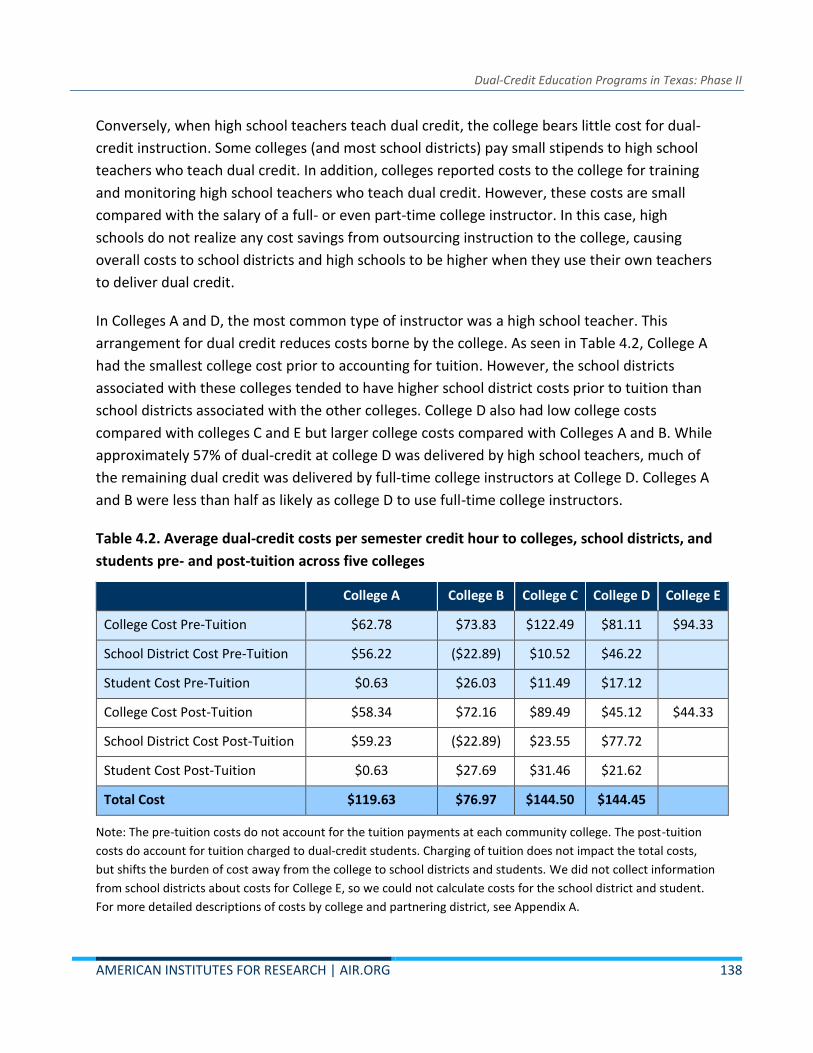
Dual-Credit Education Programs in Texas: Phase II
AMERICAN INSTITUTES FOR RESEARCH | AIR.ORG 138
Conversely, when high school teachers teach dual credit, the college bears little cost for dual-
credit instruction. Some colleges (and most school districts) pay small stipends to high school
teachers who teach dual credit. In addition, colleges reported costs to the college for training
and monitoring high school teachers who teach dual credit. However, these costs are small
compared with the salary of a full- or even part-time college instructor. In this case, high
schools do not realize any cost savings from outsourcing instruction to the college, causing
overall costs to school districts and high schools to be higher when they use their own teachers
to deliver dual credit.
In Colleges A and D, the most common type of instructor was a high school teacher. This
arrangement for dual credit reduces costs borne by the college. As seen in Table 4.2, College A
had the smallest college cost prior to accounting for tuition. However, the school districts
associated with these colleges tended to have higher school district costs prior to tuition than
school districts associated with the other colleges. College D also had low college costs
compared with colleges C and E but larger college costs compared with Colleges A and B. While
approximately 57% of dual-credit at college D was delivered by high school teachers, much of
the remaining dual credit was delivered by full-time college instructors at College D. Colleges A
and B were less than half as likely as college D to use full-time college instructors.
Table 4.2. Average dual-credit costs per semester credit hour to colleges, school districts, and
students pre- and post-tuition across five colleges
College A College B College C College D College E
College Cost Pre-Tuition $62.78 $73.83 $122.49 $81.11 $94.33
School District Cost Pre-Tuition $56.22 ($22.89) $10.52 $46.22
Student Cost Pre-Tuition $0.63 $26.03 $11.49 $17.12
College Cost Post-Tuition $58.34 $72.16 $89.49 $45.12 $44.33
School District Cost Post-Tuition $59.23 ($22.89) $23.55 $77.72
Student Cost Post-Tuition $0.63 $27.69 $31.46 $21.62
Total Cost $119.63 $76.97 $144.50 $144.45
Note: The pre-tuition costs do not account for the tuition payments at each community college. The post-tuition
costs do account for tuition charged to dual-credit students. Charging of tuition does not impact the total costs,
but shifts the burden of cost away from the college to school districts and students. We did not collect information
from school districts about costs for College E, so we could not calculate costs for the school district and student.
For more detailed descriptions of costs by college and partnering district, see Appendix A.
Dual-Credit Education Programs in Texas: Phase II
AMERICAN INSTITUTES FOR RESEARCH | AIR.ORG 139
College B largely used college faculty rather than high school teachers for dual-credit courses.
Most of those college faculty were adjunct, who are substantially less costly to employ. In
addition, the school districts partnered with College B receive cost savings from having college
faculty teach substantial numbers of its students. For the school districts associated with
College B, the cost savings associated with reduced teaching staff were substantially larger than
the administrative costs associated with operating dual-credit programs. Therefore, the school
districts associated with College B had an overall cost savings of $23 per SCH from students
participating in dual credit. Because the use of adjunct teaching staff results in lower costs on
the college side compared with full-time college teaching staff and provides school districts
with cost savings of having staff other than their own teachers deliver instruction, this
arrangement resulted in substantially lower overall costs compared with the other colleges
($77 per SCH compared to $120, $145, and $144 in College A, C, and D, respectively). These
results are described in greater detail in Appendix E.
The most common type of instructor for dual-credit courses in Colleges C and E were full-time
college faculty. For College C, more than 80% of dual-credit semester credit hours were
delivered by full time college faculty, and for College E, a little more than 72% were delivered
by full-time college faculty. The college instructional costs at Colleges C and E were substantially
higher than the other community colleges sampled, contributing to the higher college costs
pretuition observed at these schools. Because dual credit associated with College C is rarely
delivered using high school teachers, there were substantial cost savings associated with
reduction in numbers of high school teachers, lowering the overall pretuition cost to the school
district. This phenomenon is also likely the case in College E, where full-time college faculty
teach the majority of dual-credit course; however, we exclude district costs from Table 4.2
because we did not collect interview data on administration and advising costs for school
districts partnering with College E. For more detailed descriptions of costs of instructional
personnel, see the site-specific narratives found in Appendix E.
Small school districts delivering dual credit had higher school district administrative costs.
A second factor that affected cost differences was the size of the school district. We originally
hypothesized that rural dual-credit partnerships might have some additional costs not found in
urban partnerships due to differences in scale of operation and having larger distances between
high schools and community colleges. We observed some additional costs related to travel in
rural areas. For example, the dual-credit coordinators for colleges serving predominately rural
school districts described having to drive several hours one-way to visit their high school
partners. However, the costs of travel at the rural colleges were quite small compared with the

Dual-Credit Education Programs in Texas: Phase II
AMERICAN INSTITUTES FOR RESEARCH | AIR.ORG 140
personnel costs for administering dual credit and the instructional costs. In College D, for
example, travel costs for college administrators visiting high schools for outreach visits were
less than $0.50 per SCH. Therefore, there was little systematic difference in costs of dual credit
for partnerships with urban compared with rural districts.
Additional costs were related to scale on the district administrative side. District administrative
costs largely consisted of either central administrative staff or staff at individual high schools
involved in coordinating dual-credit delivery between school districts or high schools and the
community college partner. Several of the school districts partnering with College D in
particular were quite small. These were districts containing only one high school and providing
less than 2,000 SCHs of dual-credit instruction per year. In addition, one of the school districts
partnering with College C was a small district containing a single high school, while the other
was a fairly large urban district. In these single high school districts, the administrative staff on
the district side were more likely to be only in the high school rather than central district
administrative staff. For both College C and D, the smaller school districts had substantially
higher district administrative costs per semester credit hour compared with the larger school
districts. Because Table 4.2 reports average costs by community college, differences in cost
across larger and smaller districts partnering with the same community college are not
apparent within the table. (Appendix E shows costs for individual districts within each
partnering community college.)
In addition to administrative staff, districts also had staff involved in advising students related
to dual credit. In many cases, traditional high schools had a counselor who was assigned to
oversee advising related to dual credit. In some cases, the counselor spent all of their time on
dual-credit-related activities, while in other instances counselors devoted only part of their time
to dual credit.
Across all school district partners, district and high school administrative and advising costs
averaged $55.42 per semester credit hour. Districts delivering at least 3,500 semester credit
hours of dual-credit instruction had district and school administrative and advising costs around
$46 per SCH, while the same costs for smaller districts were $69 per SCH, a difference of
approximately $23 per SCH.
Differences in college administrative costs were not clearly related to college characteristics.
In addition to administration and advising on the school district side, there are also
administrative costs on the college side. Each college had someone serving as the director of
dual credit (or a similar title) who oversaw all dual-credit and ECHS partnerships for the college.

Dual-Credit Education Programs in Texas: Phase II
AMERICAN INSTITUTES FOR RESEARCH | AIR.ORG 141
In most instances this person devoted all their time to dual-credit-related activities. However, in
one of the colleges, “partnerships” was defined more broadly, so the person who oversaw dual
credit also oversaw other types of partnerships, such as delivering instruction to incarcerated
individuals. At each college, there were also one or more dual-credit coordinators who were
responsible for maintaining communication with particular district or high school partnerships.
Depending on the size of the college and the structure of the administrative team, the number
of coordinators varied from one to four.
In addition to staff dedicated to overseeing and administering dual credit, numerous other staff
at each college were involved in administering dual credit in some way. These staff included
deans, provosts, vice presidents, department chairs, registrars, human resources, and other
staff. In most of these cases, however, the amount of staff time devoted to dual credit was
relatively small.
The cost of college administration ranged from $23 per SCH to $51 per SCH. Colleges with a
greater number of SCHs typically had larger administrative costs overall; however, the
differences in college administrative costs per SCH did not seem to be related to any readily
observable college characteristics. The college with the highest administrative costs was College
A, a large urban college. College B, also a large urban college, had college administrative costs
of $32 per SCH. Likewise, the cost of college administration in the two rural colleges also were
quite different (see Appendix E for additional information about different categories of costs for
community colleges).
School districts decide whether to pay for textbooks and testing or whether students pay
those costs.
Costs of textbooks amounted to approximately $15 to $25 per SCH. This assumes that
community college textbooks must be replaced every 3 years, while textbooks for traditional
high school classes have a much longer span of use. None of the community colleges in our
sample provided textbooks to students. In each case, school districts decided whether to pay
for textbooks themselves or make students responsible for their own textbooks.
Another additional cost of dual credit is student testing. For many dual-credit courses, students
must demonstrate they are academically prepared by having a qualifying test score. All of the
districts in our sample administered the TSIA for the students in their district. Costs of testing
amounted to $2 to $4 per SCH. As with testing, districts decided whether to cover the cost of
testing or charge students.

Dual-Credit Education Programs in Texas: Phase II
AMERICAN INSTITUTES FOR RESEARCH | AIR.ORG 142
In addition to textbooks and testing, another moderately large nonpersonnel cost for school
districts is the cost of providing bus service to get students from the high school to the
community college when classes are taken on the college campus. Depending on the number of
trips to and from campus and the distance to campus, bus service for students at the sites
offering this service ranged from $5 to $20 per SCH.
Due to textbook and testing costs, the average cost of dual credit to students prior to any
tuition and fees was almost $13 per SCH. The cost of textbooks, testing, and student
transportation for school districts amounted to $17 per SCH on average. While some districts
covered the cost of TSIA and textbooks, we found that students paid for these items in most
districts in our sample.
Charging tuition shifts the cost of dual credit away from colleges to school districts and
students.
The tuition arrangements across the community colleges in our sample varied substantially.
These different tuition arrangements do not affect the total cost but shift the burden of the
cost from colleges to school districts and students when tuition or fees are charged. In Colleges
A and B, tuition is largely waived. In College A, districts pay tuition for courses taught by college
faculty, but this delivery mode is rare outside of ECHSs. In College B, tuition and fees are not
waived for a limited number of courses, and a flat fee of $100 is charged per course for ECHS
students, but the college waives tuition for the majority of dual credit. Because minimal tuition
and fees are charged for dual credit at these colleges, the cost burden shifts little when
accounting for tuition and fees.
In College C and E, a reduced tuition and fee amount is charged for dual-credit students. In one
of the partnering districts with College C, the district pays for this fee only for ECHS students
and any student eligible for free or reduced-price lunch. This means the bulk of the fee is paid
for by the district. In the other district partnering with College C, students pay for the fee,
shifting a substantial share of the burden to students.
College D has an interesting arrangement for charging tuition and fees. Rather than charge
districts or students on a per credit hour basis, the college allows districts to buy entire course
sections. So, the districts pay for sections of courses if they have enough students to fill an
entire section. For courses taken outside of those sections paid for by the district, students are
charged 85% of the tuition cost. In each of the colleges that charge some amount of tuition and
fees, the cost burden for the colleges is substantially reduced while the burden for districts and
students increases.

Dual-Credit Education Programs in Texas: Phase II
AMERICAN INSTITUTES FOR RESEARCH | AIR.ORG 143
ECHS Dual Credit
Although state law requires that dual-credit education be available in all Texas high schools, a
substantial number of students access dual-credit coursework by enrolling in an ECHS.19 ECHSs
are typically small high schools, enrolling on average approximately 450 students and providing
students with the opportunity to complete 60 SCHs leading to an associate’s degree. ECHSs
generally follow one of two models. Stand-alone ECHSs are located on community college
campuses and consists of buildings designed to hold just the ECHS students. A growing number
of ECHSs are designed as a school-within-school model, in which the ECHS is a program that
exists in a larger comprehensive high school. Districts often have separate MOUs for ECHSs that
require different staffing patterns or tuition agreements. As such, we calculate the annual per-
SCH cost of dual-credit education in ECHSs separately.
Costs per SCH of college and school district administrative are similar for dual credit delivered
through ECHSs and traditional high schools.
Interview data show that both community college and school district central office staff
generally have similar staffing allocations for ECHSs as for dual-credit in traditional high schools.
Administrators reported spending more of their time overseeing dual-credit education in
ECHSs; however, data show that ECHSs have a greater number of SCHs per student. In short,
while ECHSs require more administrator staff time per student, ECHS students receive a greater
number of SCHs on average, compared to students in traditional comprehensive high schools.
Therefore, the cost per SCH for community college and school district central office staffing is
similar in ECHSs and in non-ECHS traditional high schools.
Costs of school-level administrative and support staff are greater at ECHSs compared with
traditional high schools.
ECHSs have a fundamentally different approach to assigning instructional and noninstructional
personnel at the school level. For example, stand-alone ECHSs that are located on community
college campuses make it easy for students to enroll in courses at the community college
because students can simply walk to the community college campus from their high school. As
noted earlier, courses taught by community college faculty shift the cost of educating high
school students from school districts to community colleges. In school-within-school models,
19 HB 1 (2006) requires school districts to implement a program providing students the opportunity to earn at least 12 college semester credit hours through advanced placement, dual credit, or advanced technical credit courses, which may include locally articulated courses (79th Texas Legislature, 3rd Called Special Session, 2005).
Dual-Credit Education Programs in Texas: Phase II
AMERICAN INSTITUTES FOR RESEARCH | AIR.ORG 144
because a large number of students are interested in pursuing dual-credit coursework, districts
often provide bus transportation to nearby community college campuses so that students can
take dual-credit courses on the community college campus. In both cases, the amount of cost
savings from reduced teacher staffing is significantly larger compared to dual-credit education
in traditional high schools. School districts also design different staffing models for ECHSs, often
providing additional support staff and counselors and other support staff. In addition, because
ECHSs are smaller high schools, the staffing allocation often includes a greater number of
administrators per student.
We estimate the cost savings for reduced teacher staffing at ECHSs using similar methods to
those described earlier. Data show that 85% of dual-credit courses in ECHSs are taught by
community college faculty, compared to 71% in non-ECHS traditional high schools. In other
words, in non-ECHS traditional high schools, high school teachers are twice as likely to be the
instructor of record for a dual-credit course compared to ECHSs (29% compared to 15%). Most
of the difference results from a greater proportion of full-time community college faculty
teaching dual-credit, as opposed to part time. In ECHSs, 55% of SCHs are delivered by full-time
college staff, and 29% are delivered by part-time college staff, compared to 42% and 29%,
respectively, in non-ECHS traditional high schools. The cost savings for school districts
associated with reduced teacher staffing in ECHSs is $76 per SCH, compared to $60 per SCH in
non-ECHSs, on average statewide.
To estimate the additional costs associated with alternate staffing models, we draw on TEA
data that include information about the number of support staff and administrators at each
school in Texas. We compare the staffing ratios of ECHS to non-ECHS traditional high schools in
the same district. We focus on high schools in the same district, rather than comparing all
ECHSs across the state to all non-ECHSs to account for possible differences in overall staffing
ratios across districts. For example, if districts that have at least one ECHS generally provide
more staff per student in all high schools, compared to districts that do not have an ECHS, then
our results would show greater staffing levels in ECHSs. Among districts with at least one ECHS
and at least one non-ECHS, we find that ECHSs have 0.49 full-time equivalent (FTE) more
support staff and 0.48 FTE administrators per 100 students.20 Greater staffing ratios result in
20 As with all of our findings reported as state averages, these figures omit significant variation across contexts. For example, the stand-alone ECHS in District A1 has 0.75 FTE more support staff for each 100 students, but 0.35 FTE fewer administrators per 100 students. In contrast, the ECHS in District A3 has 1.09 FTE fewer support staff per 100 students, but 0.63 FTE more administrators for each 100 students. ECHSs employ far fewer educational aides (many do not hire any educational aides) but are less likely to serve English language learners or students in special education, and we therefore omit these cost savings. Note that we are unable to make within-district comparisons of staffing ratios between ECHSs and non-ECHSs for districts with no ECHS, such as District B2, or those in which all high schools are classified as ECHSs.

Dual-Credit Education Programs in Texas: Phase II
AMERICAN INSTITUTES FOR RESEARCH | AIR.ORG 145
additional annual costs for dual credit in ECHSs that amount to $2.46 for support staff and
$6.68 for administrators, respectively, for a total of $9.14 per SCH.
Overall costs for ECHSs and traditional dual-credit models are relatively similar, but colleges
bear more of the cost in ECHSs.
In summary, ECHSs affect dual-credit education resource allocation by both increasing the
overall costs and by shifting the costs to community colleges. These shifts happen because of
differences in the instructor assigned to teach the dual-credit course and because of differences
in staffing patterns in ECHSs. For dual-credit delivered in ECHSs, school districts and community
colleges pay 2.0% and 86.3% of the costs, respectively, whereas in non-ECHS traditional high
schools, those figures are 14.3% and 74.1%, respectively, prior to accounting for any tuition
arrangements. However, the overall average statewide costs of dual credit delivered in ECHS
compared with traditional high schools are relatively similar: $110 compared to $111 per SCH,
respectively. This is because the cost savings related to reduced dependence on high school
teachers largely offsets the additional costs of support staff and administrators.
Statewide Costs and the Burden of Dual Credit
Based on average costs calculated across the five colleges and 10 school district partners, we
extrapolated the costs of dual credit statewide, as shown in Table 4.3. This consisted of
calculating the percentage of teaching staff who were full-time college, part-time college, or
high school teachers for each partnership between a community college and high school. We
applied an average instructional cost for each type of teaching arrangement, with full-time
college instructors being the most expensive and high school teachers being the least
expensive. We then calculated the high school teacher cost savings associated with classes
being taught by full- or part-time college instructors for each partnership for traditional dual-
credit models. We also calculated the cost savings of reduced staffing needs for ECHSs. To these
costs, we applied average community college and school district administrative and advising
costs, and other district and students costs for non-administrative costs such as textbooks,
testing, and bus transportation. Because district administrative costs varied by district size in
our sample of districts, we also applied an additional administrative cost for districts providing
less than 3,500 SCHs of dual credit. Lastly, because we used statewide average prices to
calculate our costs at each college, to account for geographic variation in prices across the
state, we applied a geographic cost adjustment using the Comparable Wage Index (Taylor,
Glander, & Fowler, 2006).

Dual-Credit Education Programs in Texas: Phase II
AMERICAN INSTITUTES FOR RESEARCH | AIR.ORG 146
Table 4.3. Average Costs for Different Cost Categories Applied for the Calculation of
Statewide Costs
Cost Category Average Cost per SCH
Full-Time College Teacher $87.56
Part-Time College Teacher $35.03
High School Teacher $14.29
College Administration and Advising $38.51
District and High School Administration and Advising $46.39
Small District Additional Administration Cost $22.58
District and High School Other Costs $17.48
Costs to Students $12.83
ECHS High School Staffing Adjustment $9.14
Note: The costs noted here do not add up to the total cost per SCH. Each course will either be taught by a full-time
college, part-time college, or high school teacher. Additionally, this table does not include savings to school
districts when dual-credit courses are taught by college faculty. These savings depend on the proportion of dual
credit taught by college faculty as opposed to high school teachers.
In addition to calculating pretuition average costs, we applied some typical tuition
arrangements to examine how tuition arrangements, if applied statewide, would shift the cost
burden of dual-credit. Across districts and community colleges in our study, two colleges
waived tuition and fees, and tuition and fees in the remaining colleges ranged from $22 to $50
per SCH. The first tuition arrangement was that all tuition and fees were waived. The next three
tuition arrangements assumed that the college charged $40 per SCH in tuition and fees—an
amount within the range of tuition and fees represented in our sample. In the second scenario,
the district pays the entire tuition amount; in the third scenario, the student pays the entire
amount, and in the fourth, the cost is split evenly between the district and student.
Statewide, the cost of dual credit is $111 per SCH; colleges bear 77% of the cost prior to any
tuition and fee arrangements.
Statewide, we calculate an overall cost per SCH of $111. When tuition is waived completely,
77% of the overall burden of dual credit ($86 per SCH) is borne by the community colleges, 11%
is borne by school districts ($12 per SCH), and 12% is borne by students ($13 per SCH). When

Dual-Credit Education Programs in Texas: Phase II
AMERICAN INSTITUTES FOR RESEARCH | AIR.ORG 147
$40 of tuition and fees is charged per SCH, the cost to colleges is reduced substantially and
community colleges end up paying 41% of the overall cost for dual credit.
When colleges charge tuition, districts can choose whether to cover that cost out of the district
budget in full, in part, or not at all. Any amount of tuition and fees not covered by the district
must be paid by students and their families. In the three scenarios where $40 of tuition and
fees is charged per SCH, the amount of tuition and fees represents 36% of the overall cost of
dual-credit instruction. Tuition and fees represent a transfer of cost away from the college to
districts or students. In the case where the district pays the full tuition amount, the cost to
districts increases from $12 per SCH to $52 per SCH, increasing the share of dual-credit paid for
by the district from 11% to 47%.
Alternatively, the district could choose to not pay for tuition and fees. In this scenario the entire
tuition amount is paid for by students and their families, increasing the cost to students from
$13 to $53 per SCH, and increasing the share of dual-credit paid for by students from 12% to
48%. Lastly, the district could choose to partially pay for dual-credit. In the case of one of our
sampled districts, the district paid for dual credit only for students who were eligible for free or
reduced-price lunch. In another district, the district purchased blocks of commonly taken dual-
credit courses, but if students wanted to take a course outside of those common courses, the
students had to pay. In many partnerships, districts and students share the costs of dual-credit
tuition and fees. To model this scenario, we assumed the district paid for half. As shown in the
column furthest to the right in Table 4.4, the increased cost burden for dual-credit was shared
equally between districts and students when the tuition is equally shared (districts pay 29% of
the costs and students pay 30%).
Table 4.4. Statewide Costs per SCH and Total Costs
Tuition Waived Tuition Paid by
District
Tuition Paid by
Student
Tuition Split
Between District
and Student
College Costs per SCH $86 77.3% $46 41.2% $46 41.2% $46 41.2%
District Costs per SCH $12 11.1% $52 47.2% $12 11.1% $32 29.1%
Student Costs per SCH $13 11.6% $13 11.6% $53 47.8% $33 29.7%
Overall Costs per SCH $111 $111 $111 $111
College Total Costs $94,107,160 $50,086,440 $50,086,440 $50,086,440

Dual-Credit Education Programs in Texas: Phase II
AMERICAN INSTITUTES FOR RESEARCH | AIR.ORG 148
Tuition Waived Tuition Paid by
District
Tuition Paid by
Student
Tuition Split
Between District
and Student
District Total Costs $13,455,302 $57,476,024 $13,455,302 $35,465,664
Student Total Costs $14,119,646 $14,119,646 $58,140,368 $36,130,008
Overall Total Costs $121,682,108 $121,682,110 $121,682,110 $121,682,112
Note: The total costs are estimates based on 1,100,518 SCHs delivered in Texas in 2016–17.
Total estimated costs of dual-credit in 2016–17 were more than $121 million statewide.
When examining estimated total costs, rather than costs per SCH, we can see that these
changes in tuition and fee arrangements have large implications for the dollars being
contributed to dual-credit education by colleges, school districts, and students. In total, dual-
credit in 2016–17 cost more than $121 million statewide.21 If tuition and fees were waived
statewide, colleges would pay approximately $94 million of the total, while districts would pay
$13 million, and students would pay $14 million. Charging $40 of tuition and fees per SCH
statewide would result in a shift of $44 million away from colleges to districts and students.
Costs per SCH and who bears the cost of dual credit vary substantially according to the type of
dual-credit instructor.
As mentioned previously, the factor that seemed most predictive of costs, and who bears the
costs, is who is teaching the courses. In Table 4.5, we show our estimates of average costs for
partnerships where more than 75% of dual-credit instruction is taught by full-time college
instructors, part-time college instructors, or high school instructors. Based on these estimates,
who teaches the course has substantial implications for overall cost of dual credit and who
bears the cost. In the tuition waived scenario, when full-time college instructors teach more
than 75% of dual credit, the overall cost per SCH is $109 with colleges picking up 98% of the
overall cost. Charging $40 in tuition and fees reduces college costs to $67 or 61% of the overall
cost, shifting the cost to districts and students.
Having part-time college teachers as the primary dual-credit instructors is the least costly
scenario at only $82 per dual-credit SCH. In this scenario, with tuition waived, colleges still pick
21 This is based on the amount of semester credit hours provided for each dual credit partnerships. Because of data privacy issues, small partnerships serving less than 5 dual credit students were not included in the data we received. Therefore, this represents a slight underestimate of the cost of dual credit statewide.

Dual-Credit Education Programs in Texas: Phase II
AMERICAN INSTITUTES FOR RESEARCH | AIR.ORG 149
up the bulk of the cost. However, given the smaller overall cost, charging tuition and fees
reduces college costs to only $34 per SCH, or 42% of the overall cost. In both cases where
instruction occurs primarily through full-time or part-time college staff, school districts receive
a cost savings of not having their own instructional staff teach students for the time they are in
dual-credit courses. When instruction is primarily delivered by college faculty the cost to
districts, when not charging tuition, is negative. This means, school districts save money by
participating in dual credit when teachers other than high school teachers are delivering the
instruction. Several community colleges in our study have accounted for the differential cost
burden by charging a fee when college instructors teach dual credit, but waiving fees when dual
credit is taught by a high school teacher.
In the case of high school instructors teaching dual credit, the overall cost per SCH is $126
dollars, with school district bearing the most cost at $60 per SCH, or 48% of the overall cost,
and colleges paying $53 per SCH (42%). If, in this case, $40 in tuition and fees were assessed to
school districts, school districts would end up paying almost 80% of the cost of dual credit, with
colleges only paying 10% of the cost. In this case, it does not seem like charging the full amount
of tuition and fees would be reasonable. In fact, at several of the community colleges we
interviewed, discounted rates for dual-credit courses were provided when classes were taught
by high school instructors. This is also evident in many MOUs between colleges and school
districts regarding the provision of dual-credit instruction.
Table 4.5. Average Costs per SCH According to Predominant Instructor Type
Tuition Waived Tuition Paid by
District
Tuition Paid by
Student
Tuition Split
Between
District and
Student
Partnerships with more than 75% Full-Time College Instructors
College Costs per SCH $107 98.2% $67 61.3% $67 61.3% $67 61.3%
District Costs per SCH –$11 –10.0% $29 26.8% –$11 –10.0% $9 8.4%
Student Costs per SCH $13 11.8% $13 11.8% $53 48.6% $33 30.2%
Overall Costs per SCH $109 $109 $109 $109
Partnerships with more than 75% Part-Time College Instructors
College Costs per SCH $74 90.4% $34 41.5% $34 41.5% $34 41.5%
District Costs per SCH –$5 –6.1% $35 42.8% –$5 –6.1% $15 18.3%

Dual-Credit Education Programs in Texas: Phase II
AMERICAN INSTITUTES FOR RESEARCH | AIR.ORG 150
Tuition Waived Tuition Paid by
District
Tuition Paid by
Student
Tuition Split
Between
District and
Student
Student Costs per SCH $13 15.7% $13 15.7% $53 64.6% $33 40.1%
Overall Costs per SCH $82 $82 $82 $82
Partnerships with more than 75% High School Instructors
College Costs per SCH $53 42.2% $13 10.4% $13 10.4% $13 10.4%
District Costs per SCH $60 47.6% $100 79.4% $60 47.6% $80 63.5%
Student Costs per SCH $13 10.2% $13 10.2% $53 42.0% $33 26.1%
Overall Costs per SCH $126 $126 $126 $126
Note: Partnerships with more than 75% of SCHs delivered by full-time college instructors, delivered 249,588 SCHs,
representing 22.7% of all dual credit. Partnerships with more than 75% of SCHs delivered by part-time college
instructors delivered 64,231 SCHs, representing 5.8% of all dual credit. Partnerships with more than 75% of SCHs
delivered by high school teachers delivered 128,767 SCHs, representing 11.7% of all dual credit.
While costs of dual credit are similar in traditional and ECHS partnerships, the college bears
more cost in ECHS partnerships.
When examining the estimated costs of Early Colleges compared with traditional partnerships,
students attending ECHSs take more dual-credit course compared to students in traditional high
schools, so dual-credit delivery at ECHSs is more resource intensive on a per-student basis, but
there is relatively little difference, on average, in costs per SCH. Traditional models, on average
have slightly lower college costs, but higher district costs per SCH compared with Early Colleges.
This is the result of Early Colleges being less likely to use high school teachers to deliver dual
credit, generating additional costs for colleges and cost savings from reduced teaching staff for
high schools.

Dual-Credit Education Programs in Texas: Phase II
AMERICAN INSTITUTES FOR RESEARCH | AIR.ORG 151
Table 4.6 Average Costs per SCH According to Predominant Instructor Type
Tuition Waived Tuition Paid by
District
Tuition Paid by
Student
Tuition Split
Between
District and
Student
Traditional (non-ECHS) Partnerships
College Costs per SCH $82 74.1% $42 37.9% $42 37.9% $42 37.9%
District Costs per SCH $16 14.3% $56 50.5% $16 14.3% $36 32.4%
Student Costs per SCH $13 11.6% $13 11.6% $53 47.7% $33 29.7%
Overall Costs per SCH $111 $111 $111 $111
ECHS Partnerships
College Costs per SCH $95 86.3% $55 50.0% $55 50.0% $55 50.0%
District Costs per SCH $2 2.0% $42 38.3% $2 2.0% $22 20.2%
Student Costs per SCH $13 11.6% $13 11.6% $53 47.9% $33 29.8%
Overall Costs per SCH $110 $110 $110 $110
Note: Partnerships with more than 75% of SCHs delivered by full-time college instructors delivered 249,588 SCHs,
representing 22.7% of all dual credit. Partnerships with more than 75% of SCHs delivered by part-time college
instructors delivered 64,231 SCHs, representing 5.8% of all dual credit. Partnerships with more than 75% of SCHs
delivered by high school teachers delivered 128,767 SCHs, representing 11.7% of all dual credit.
Funding for School Districts and Community Colleges
Funding for School Districts
Texas uses a foundation formula as the primary method for allocating funding across school
districts, known as the Foundation School Program (FSP). The FSP has two main components –
operations funding and facilities funding. For the purposes of this study, we focus on operations
funding because this is the funding intended to cover the ongoing expenses school districts face
in providing instruction to students (TEA, 2017).
The operations component of the FSP operates through two formulas, called Tier I and Tier II.
Tier I provides schools with a basic level of funding, allotting schools districts funding for the
regular education program, as well as for programs related to student needs, such as special
Dual-Credit Education Programs in Texas: Phase II
AMERICAN INSTITUTES FOR RESEARCH | AIR.ORG 152
education, CTE, English learner education, compensatory education, and several others. Tier II
consists of supplemental funding provided to districts who set higher tax rates than the
minimum required to receive Tier I funding.
Each district’s enrollment size, student characteristics, and local tax rates determine the
district’s per-student funding level. The per-student funding level is multiplied by the average
daily attendance, or the total number of students in attendance for each instructional day
divided by the number of instructional days in the district, to determine each district’s total
funding level.
School districts do not receive any additional state funding for students taking dual-credit
courses.
In total, Tier I FSP funding provides approximately $7,400 per student, with slightly less than
half provided by the state and slightly more than half coming from local revenue.22 As such, an
average high school student, taking seven courses per semester over a year, is funded at a rate
of approximately $530 per semester-long class (or $177 per semester hour equivalent assuming
a class equals three SCHs). Students who enroll in dual-credit courses, regardless of whether
the courses take place on a high school campus or a community college campus, count toward
a district’s average daily attendance. In other words, districts receive the same level of funding
per student regardless of the number of students who enroll in dual credit. Because school
districts would be funded at the same levels in the absence of dual credit, the marginal funding
from students taking dual-credit courses is $0.
Funding for Community Colleges
Community colleges are funded by the state on a per contact hour basis. As a rule of thumb,
one SCH equates to 16 contact hours. On a yearly basis community colleges report to the
THECB the expenses per contact hour of various types of courses. The state then determines
the percentage of contact hour expense they can cover based on the available budget and
funds community colleges at a rate equivalent to the average reported expense per contact
hour multiplied by the percentage of contact hour expenses funded by the state. Funding rates
for 2016–17 varied from $2.21 per contact hour for psychology, social sciences, and history
courses to $9.41 per contact hour for career pilot courses. In general, CTE courses, such as
those for health occupations, had higher funding per contact hour with funding rates in the $3
22 Calculations made using the Statewide Summary of Finances Report for the 2016–17 school year. https://tealprod.tea.state.tx.us/fsp/Reports/ReportSelection.aspx

Dual-Credit Education Programs in Texas: Phase II
AMERICAN INSTITUTES FOR RESEARCH | AIR.ORG 153
to $5 per contact hour range, while academic courses such as English, mathematics, and
sciences generally had funding rates around $2.40 to $2.50 per contact hour.
Community colleges receive approximately $38 per SCH for academic dual-credit instruction.
Because our focus for the cost analysis is on academic courses, we assume an average funding
rate of $2.40 per contact hour. Based on the rule of thumb of 16 contact hours per SCH,
community colleges are funded at a rate of $38.40 per SCH for academic dual-credit courses.
This rate is the same regardless of whether a student is a dual-credit student or a traditional
college student. If dual-credit opportunities were not available to high school students, those
students would not attend the community college as dual-credit students. Therefore, the
marginal funding for each dual-credit SCH is the full funding amount per SCH of $38.40.
Comparison of Funding and Costs
State funding provided to colleges does not cover the costs to colleges when tuition is waived.
As described in the section on costs, on average, when tuition is waived completely, the cost to
colleges is approximately $86 per SCH, the cost to districts is approximately $12 per SCH, and
the cost to students is approximately $13 per SCH. Given that community colleges receive
approximately $38 per SCH in state funding per dual-credit SCH delivered, the remaining cost
for colleges is approximately $47 per SCH. This amounts to $51.8 million statewide, when the
cost per SCH is multiplied by the total number of dual-credit SCHs delivered. This is much higher
than the cost burden to districts and students ($13.5 million and $14.1 million, respectively).
For colleges, the remaining deficit of $51.8 million must be made up through other revenue
sources. The most common revenue sources available would be local funding and charging
tuition and fees for dual credit. As previously discussed, when colleges charge tuition, it usually
ranges from around $25 to $50 per SCH. In this case, any tuition less than $47 per SCH would
result in a remaining cost that would have to be funded through tuition from non-dual-credit
students or revenue from local taxes.
Because school districts do not receive additional funding for dual credit, they must cover
dual-credit costs from existing revenue sources.
In contrast to colleges, school districts do not receive additional funding from providing dual-
credit instruction. Therefore, any costs related to dual credit must be covered from their
existing revenue sources. Because the costs of dual credit for school districts vary substantially

Dual-Credit Education Programs in Texas: Phase II
AMERICAN INSTITUTES FOR RESEARCH | AIR.ORG 154
depending on the arrangement of dual-credit instruction, in some cases it may make sense to
charge some amount of tuition and fees to school districts. In particular, when dual credit is
largely delivered by college faculty rather than high school teachers, the burden to the college
increases, and the burden on school districts decreases. In many cases, districts actually save
money through this arrangement due to reductions in teaching staff. In these cases, it would
make sense to charge some tuition to districts to even out the cost burden. However, when
high school teachers teach dual credit, more of the cost burden shifts from the school district to
the college. Therefore, in these circumstances, charging the school districts tuition would only
exacerbate the already increased burden of dual credit placed on districts.
Benefits of Dual-Credit Course Taking
The analysis of the impacts of taking dual-credit courses on outcomes shows several statistically
significant impacts. We separate the outcomes into two types. The first type are outcomes that
have immediate impacts on how much is being spent on higher education by students and their
families or by public dollars supporting higher education. These outcomes include the total
number of credits completed to earn a four-year degree, the number of college credits needed
after completing high school to earn a four-year degree, and the amount of time after high
school required to complete a four-year degree. The benefits related to these outcomes can be
calculated through extant data on college spending per student and short-term earnings
information on the wage rate of a typical college graduate entering the workforce.
Furthermore, these benefits are limited to the 4 to 6 years when a student would typically be
enrolled in college after completing high school.
Table 4.7 displays the effects of dual credit on these outcomes. As shown, taking dual credit
actually increases the total number of credits to degree for a typical dual-credit student.
However, each dual-credit student took almost eight fewer credits after high school to earn a
college degree compared with non-dual-credit students. This indicates that the increase in
overall credit to degree is largely in the form of dual-credit courses and that there may be some
inefficiency in dual-credit course taking, where not all dual-credit courses count toward the
completion of a four-year degree. Lastly, a typical student who took dual credit and went on to
complete a four-year degree was able to graduate in slightly less time than students who did
not take dual-credit and completed a four-year degree. This time amounts to more than one
month per student. Alternatively, this could be thought of as one of 12 dual-credit students
finishing a year earlier.

Dual-Credit Education Programs in Texas: Phase II
AMERICAN INSTITUTES FOR RESEARCH | AIR.ORG 155
Table 4.7. Effects of Dual-Credit Course Taking on Credits and Time to Degree
Outcome Effect Interpretation
Credit to degree 4.2 more credits per dual-
credit student
Each dual-credit student completing a
four-year college degree took four
more credits in total.
Credit in college to degree
7.8 fewer credits after high
school completion per dual-
credit student
Each dual-credit student took almost
eight fewer credits after high school
to earn a college degree compared
with non-dual-credit students.
Time to degree
1.0 fewer months to degree
after high school completion
of those who completed
1 out of 12 dual-credit students
finished a year earlier compared with
non-dual-credit students.
The second type are outcomes related to increased enrollment in two- or four-year colleges
and completion of two- or four-year colleges. In contrast to the previous outcomes, which have
only short-term benefits relating to credits and time to degree completion, the benefits of
enrolling in and completing a two- or four-year college education accrue over a life time.
McMahon (2009) categorizes the benefits of higher education into three types:
Private market benefits: The increased benefits in the form of higher earnings to those who
completed more years of higher education
Private nonmarket benefits: The increased benefits, such as better health, to those who
completed more years of higher education in all forms other than earnings
Social benefits: The benefits to society from having more educated citizens
We will adopt this framework for accounting for the benefits of dual credit related to enrolling
in and completing higher education.
The research team examined numerous outcomes related to enrolling in and completing higher
education; however, many of the outcomes are strongly related or interdependent on one
another. Therefore, for the purposes of the benefits analysis we focus on one outcome. Results
from the impact study indicate that students who took dual credit are 2.2% more likely to
complete a two-year certification or degree. In other words, slightly more than two out of 100
students completed at least 2 years of higher education who would not have done so if they
were not able to take dual-credit classes in high school.

Dual-Credit Education Programs in Texas: Phase II
AMERICAN INSTITUTES FOR RESEARCH | AIR.ORG 156
All other outcomes examined related to long-term academic outcomes were positive, but many
were not statistically significant. The absence of any negative outcomes means that the
increase in two-year credentials did not displace other outcomes. In other words, the increase
in two-year credentials came from the pool of students who would not have obtained any
higher-education credentials because there was no decrease in the likelihood of students
completing a four-year degree.
Calculation of Benefits
Following we present our calculation of benefits. All benefits presented here are converted to
net present value 2017 dollars. One caveat for the benefits calculations and the subsequent
comparisons of costs to benefits is that these benefits calculations are based on dual credit that
was delivered from 2001 to 2014, while our cost estimates are based on the 2016–17 school
year.23 As mentioned previously, dual-credit instruction has changed rapidly over the past
decade. If the impact estimates measured from these years do not accurately depict the impact
of dual-credit in 2016–17, there will be misalignment between our estimated benefits and
costs.
Time to a Four-Year Degree
As mentioned previously, the results from the impact analysis indicate that dual-credit students
take more overall credits (due to inefficiency in dual-credit courses counting toward a degree);
however, dual-credit students end up taking fewer college courses after high school completion
and complete a four-year college degree in less time compared with students who did not take
any dual-credit courses in high school. Any costs associated with the additional courses taken as
dual-credit courses during high school are captured by our cost estimates of dual credit. Thus,
our benefits analysis must still account for the reduction of credits after high school and
decreased time to degree. Because time to degree should be dependent on credits earned, we
chose to focus our benefits calculation on time to degree.
23 Impacts for two-year college outcomes are based on cohorts of juniors from 2001 to 2013. Impacts on time to degree are based on cohorts of juniors from 2001 to 2008.

Dual-Credit Education Programs in Texas: Phase II
AMERICAN INSTITUTES FOR RESEARCH | AIR.ORG 157
Benefits from graduating a year earlier include reduced tuition and fees, costs of books and
supplies, as well an additional year of earnings from entering the workforce earlier.
We started by determining the benefits of reducing by one year the time required to complete
a four-year degree. For simplicity, we focus first on the benefits of reducing time to degree by
one year, and then adjust these figures to the point estimates from the impact study. On
average, Texas four-year public colleges spent $17,148 per full-time equivalent student.24
Students bear some of this cost in the form of tuition and fees. Average yearly tuition and fees
for these schools amounted to $8,379 (just under half of overall spending). In addition, students
on average paid $1,150 in books and supplies. Therefore, the benefits of not paying for one
more year of college are split fairly evenly across the students who must pay tuition and buy
textbooks and supplies and the taxpayers who fund the remaining cost of college.
In addition to spending less on college, a student who graduates earlier can enter the workforce
earlier. According to a survey from the National Association of Colleges and Employers (2017),
the average starting salary for a recent bachelor’s degree graduate of the class of 2017 was
$51,022. Therefore, students who graduate a year earlier potentially earn an extra $51,022 in
the year they would have spent in college had they not graduated a year earlier. We make the
assumption that 80% of this salary would be take-home pay and 20% would be tax revenue.
Converted to net present value, the overall benefit of graduating one year earlier is
approximately $61,590, with $44,732 benefiting the student directly and $16,858 benefiting the
public. However, the impact estimate indicates that dual-credit students spend about one
twelfth of a year less in school rather than a full year. Additionally, because this outcome was
measured only for students who went on to complete a four-year degree, it only applies to
approximately 25% of students. Therefore, the average benefit per dual-credit student resulting
from less time to completion is about $898 in personal benefits, $338 in public benefits, and
$1,236 overall, for a student who takes at least one dual-credit course, compared to a student
who does not take any. Because dual-credit students on average complete approximately 9.5
SCHs during high school, the overall benefits on a per SCH basis amount to $131, as shown in
Table 4.8.
24 Calculated using data from the National Center for Education Statistics’ Integrated Postsecondary Education Data System (IPEDS) for public four-year colleges in Texas.

Dual-Credit Education Programs in Texas: Phase II
AMERICAN INSTITUTES FOR RESEARCH | AIR.ORG 158
Table 4.8. Benefits Attributed to Dual-Credit Enrollment Resulting From Reduced Time to
Degree
Benefits of Graduating
1 Year Earlier
Benefits per Student
Attributed to Dual-
Credit Enrollment
Benefits per SCH
Student $44,732 $898 $95
Public $16,858 $338 $36
Overall $61,590 $1,236 $131
Note: The “benefits of graduating 1 year earlier” are the total benefits of a single student graduating 1 year earlier.
The “benefits per student attributed to dual-credit enrollment” are the total benefits shown in the first column
multiplied by the impact of less time to completion for four-year graduates (0.102 fewer years) and the proportion
of dual-credit students this impact applies to (0.25). The “benefits per SCH” are the benefits attributed to dual
credit divided by 9.5 (the average number of SCHs taken by dual-credit students).
Lifetime Benefits of Completing a Two-Year Degree
In addition to the short-term benefits resulting from finishing a four-year degree sooner,
students participating in dual-credit courses as high school students were also 2.2% more likely
to receive a two-year credential and were as likely to have graduated from a four-year college.
This indicates an overall increase in higher education for dual-credit students, resulting from
increased completion of two-year credentials. Increased education as a result of taking higher
education classes results in a host of benefits that accrue over an individual’s lifetime.
McMahon (2009) calculates the benefits of higher education in three buckets: private market
benefits, private nonmarket benefits, and social benefits. McMahon argues that the benefits
from higher education are due to the increased human capital gained from taking higher
education classes and argues against the notion that a diploma simply identifies individuals with
higher ability (who would have that higher ability whether they completed any higher
education or not). Based on human capital theory, the more time engaged in higher education
the more productive individuals should be, regardless of whether they obtained a degree or
not. However, many of the previously calculated benefits of higher education compare
individuals based on their terminal degrees, bachelor’s graduates compared to high school
graduates for example.

Dual-Credit Education Programs in Texas: Phase II
AMERICAN INSTITUTES FOR RESEARCH | AIR.ORG 159
Workers with associate’s degrees earn between $145,000 and $348,000 more than those with
only high school diplomas over their lifetime.
McMahon (2009) estimates an average yearly private market benefit of $8,220 (in 2017 dollars)
for each year of higher education completed. Assuming those who complete a two-year
credential have 2 additional years of higher education compared to those who did not, and
assuming a career lasts 40 years (age 25 to 65), this amounts to $347,746 in net present value
private market benefits for each student obtaining an additional 2 years of higher education.
Several alternative estimates to private market benefits are slightly more conservative.
Hershbein and Kearney (2014) estimate that individuals with associate’s degrees earn almost
$284,000 more than individuals with high school diplomas. Agan (2014) estimates that
individuals with AA degrees earn almost $145,000 more than high school graduates.25
Private nonmarket benefits, such as improved health and longevity, may be worth more than
the increase in earnings.
While many studies of benefits of higher education stop at the private market benefits,
McMahon (2009) argues that the private nonmarket benefits are as large or larger than the
private market benefits. The private nonmarket benefits included in McMahon’s overall
calculation include improvement in one’s own health, living a longer life, improvement in health
of individual’s children, better education and cognitive development for individual’s children,
better spousal health, better management of family size (fewer children), and better consumer
choices and ability to save money. In addition, McMahon argues that additional benefits that
could not be easily assigned dollar values include happiness, job location and amenities, and
lifelong learning. Based on McMahon’s calculations, the private nonmarket benefits of higher
education are more than 20% greater than the private market benefits. Based on these
calculations, total lifetime private nonmarket benefits of 2 years of higher education amount to
more than $425,000 per student. This figure is shown in Panel A of Table 4.9 as a private, non-
market benefit for students.
25 The estimates in Agan (2014) are particularly conservative because only 30 years after turning 18 are included in these calculations. Workers typically work much longer.

Dual-Credit Education Programs in Texas: Phase II
AMERICAN INSTITUTES FOR RESEARCH | AIR.ORG 160
Table 4.9. Lifetime Benefits of a Two-Year Credential
Benefits of 2 Years of
Higher Education
Benefits per Student
Attributed to Dual-
Credit Enrollment
Benefits per SCH
Panel A. Estimates from McMahon, 2009
Private Market $347,746 $7,581 $801
Private Nonmarket $424,769 $9,260 $979
Social $309,280 $6,742 $713
Overall Benefits $1,081,795 $23,583 $2,493
Panel B. Estimates from Agan, 2014 and from Carroll and Erkut, 2009
Private Market $144,884 $3,158 $334
Social $62,759 $2,067 $219
Overall Benefits $207,643 $5,226 $552
Note: All dollars represent net present value $2017 dollars. The “benefits of 2 years of higher education” are the
total benefits of a single student obtaining 2 years of higher education compared with a high school graduate. The
“benefits per student attributed to dual-credit enrollment” are the total benefits shown in the first column
multiplied by the impact of dual-credit on obtaining a two-year credential (0.0218). The “benefits per SCH” is the
benefits attributed to dual-credit divided by 9.5 (the average number of SCHs taken by dual-credit students).
The benefits to society and savings on governmental spending resulting from more education
are also substantial.
In addition to benefits to the individuals who engage in higher education, there are also societal
benefits—what McMahon calls social benefits—accruing to the population regardless of
whether they participated in higher education or not. In this group of benefits, McMahon
includes democratization (or functioning governmental institutions), support of human rights,
political stability, increased life expectancy, reduced economic inequality, reduced crime,
decreased costs of social supports (welfare, health care, prison costs), and improved
environment. McMahon estimates that the sum of these social benefits is almost has high as
private market benefits. Lifetime social benefits for each individual participating in two
additional years of higher education amount to more than $309,000.
McMahon’s concept of social benefits is certainly very inclusive of a wide range of benefits. In
contrast, Carroll and Erkut (2009) and Trostel (2010) calculate benefits to the government from

Dual-Credit Education Programs in Texas: Phase II
AMERICAN INSTITUTES FOR RESEARCH | AIR.ORG 161
individuals participating higher education. Carroll and Erkut (2009) simply accounts for the
increased tax revenue brought in by individuals with higher education levels and the decrease in
governmental spending on social programs and prisons. Their estimated benefits for individuals
with some college are much more conservative at $62,759. Trostel (2010) also accounts for
various types of taxes and decreased governmental spending on social supports and calculates a
benefit of $229,525 for individuals earning a bachelor’s degree. If we assume that the benefit
from an associate’s degree is half as much as a bachelor’s degree, this would amount to benefits
of $114,762. These figures are shown in Panel B of Table 4.9 as social benefits.
Total benefits attributable to dual-credit education from earning a two-year credential are
large.
Summing up the private market, private nonmarket, and social benefits from McMahon (2009),
the total lifetime benefit for a student completing a two-year credential amounts to a little
more than $1 million. Summing up the most conservative estimates of private and social
benefits from 2 years of college yields an estimate for total benefits of almost $208,000, as
shown in the bottom row of Panel B of Table 4.9.
The impact estimate indicates that students who took dual-credit are 2.2% more likely to earn a
credential from a two-year college, indicating completion of 2 years of college. Applying the
impact estimate to the benefits of 2 years of higher education, the benefit per dual-credit
student is almost $24,000: $7,600 in private market benefits, $9,300 in private nonmarket
benefits, and $6,700 in public benefits. When converted to a per SCH basis, the overall lifetime
benefits amount to almost $2,500 per dual-credit SCH taken. Even when we use the more
conservative estimates of benefits from Agan (2014) and Carroll and Erkut (2009), shown in
Panel B of Table 4.9, the benefits come to $552 per SCH resulting from being more likely to
complete 2 years of higher education.
Comparison of Costs and Benefits
The benefits attributable to dual credit far exceed the costs of dual credit.
With average statewide costs of $111 per SCH, the benefits that result from reduced time to
degree for four-year graduates alone is larger than the costs. Specifically, the benefits of
reduced time to degree of $131 per SCH exceed the costs by $20 per SCH, resulting in a benefit-
to-cost ratio of 1.18, meaning that the benefits from reduced time to degree alone are 18%
higher than the cost. In other words, each dollar invested in dual credit returns $1.18 from
students spending less time in college and entering the workforce earlier.

Dual-Credit Education Programs in Texas: Phase II
AMERICAN INSTITUTES FOR RESEARCH | AIR.ORG 162
The estimated benefit-cost ratio of 1.18 only includes the benefits associated with dual-credit
students finishing college earlier, compared to college completers without dual credit. Dual credit
also increases the likelihood a student completes a two-year credential, which provides monetary
benefits over the student’s lifetime. Using a conservative estimate of $552 per SCH for lifetime
benefits from earning a two-year credential, the benefits exceed the cost by $441. This results in
a benefit-to-cost ratio of 4.98, meaning that the lifetime benefits of dual credit exceed the cost by
almost 400%. Using the more inclusive set of benefits specified by McMahon (2008), the benefits
exceed the costs by almost $2,400 and the benefit-to-cost ratio is almost 22.
The social benefits under the most conservative approach represent benefits to the
government from increased tax revenue and decreased social spending. The social benefits
from earning two-year credentials exceed the cost of dual credit by $107, for a benefit to cost
ratio of almost 2.0. This indicates it is well worth the public investment in dual-credit
opportunities. With that said, the private return is even higher, indicating that students and
families should also be willing to contribute to the cost of dual credit.
Chapter Conclusion
In this chapter, we examined the cost of dual credit, reported average costs per SCH and total
costs of dual credit in the state, examined which stakeholders bear the cost of dual credit under
several tuition and fee scenarios, and compared the costs of dual credit to calculated benefits
of dual credit. Following, we summarize our key findings:
Overall cost of providing dual-credit instruction is $111 per SCH, or $121.7 million
statewide in 2016–17. On average, the cost of dual-credit education to colleges far
outweighs the additional state funding they receive from providing dual-credit instruction.
When community colleges waive tuition, the average cost of dual credit for community
colleges is $86 per SCH (77% of the total cost). Community colleges receive, on average, $38
per SCH in state funding.
Tuition and fees arrangements vary widely across the state and have significant effects on
the distribution of costs. When tuition is waived, colleges bear 77% of the cost, compared
to 11% for districts and 12% for students, on average. Conversely, when districts pay tuition
for dual-credit students, colleges pay, on average, 41% of costs, school districts pay 47%,
and students pay 12%. In some regions, tuition is waived for most classes, and districts pay
the costs of textbooks and placement test fees so that the upfront cost to the student is
effectively zero.

Dual-Credit Education Programs in Texas: Phase II
AMERICAN INSTITUTES FOR RESEARCH | AIR.ORG 163
The strongest predictor of overall costs and how costs are distributed across stakeholders
is the type of instructor teaching the course. Assigning part-time college faculty to teach
dual-credit courses is the least expensive delivery mechanism; however, this approach may
not be the most cost-effective because high school teachers or full-time college faculty may
be more effective instructors. Full-time college faculty members are 2.5 times more
expensive, on average, than part-time college faculty on a per SCH basis. When courses are
taught by college faculty, colleges bear more of the cost of dual-credit, and school districts
receive cost savings resulting from a reduction in the instructional burden on high school
teachers. The cost of dual-credit education is shifted from colleges to school districts when
courses are taught by high school teachers. Because of the difference in cost burden
according to who teaches the course, colleges should consider charging differential tuition
rates for various teaching arrangements (a model used in some of the sites we sampled).
The costs of dual-credit delivered through ECHSs is greater overall, but similar on a per-
SCH basis. Although ECHSs generally have greater staffing levels per student, each student
in an ECHS receives a greater number of SCHs, compared to students enrolling in dual credit
in traditional comprehensive high schools. As a result, the cost per SCH of administration
and advising is only slightly higher in ECHSs. ECHSs typically shift a substantial proportion of
costs from school districts to colleges because ECHSs are more likely to have dual-credit
courses taught by college faculty, rather than high school teachers.
The short-term benefits related to reduced time to degree are 1.18 times the cost of dual
credit. Long-term monetary benefits associated with a greater number of college
graduates are almost five times the cost of dual credit. Benefits from reduced time to
degree were $131 per SCH—18% larger than the cost of dual credit. The most conservative
estimate of lifetime benefits from increased earning of two-year credentials was $552 per
SCH—almost 400% larger than the cost of dual credit. The considerable value of benefits
compared with costs suggests that investments in dual credit will result in large future
payoffs to both individuals participating in dual credit and the public at large.

Dual-Credit Education Programs in Texas: Phase II
AMERICAN INSTITUTES FOR RESEARCH | AIR.ORG 164
Chapter 5: Conclusion
Dual-credit education represents an alternative to business-as-usual educational programming
and has the potential to integrate secondary and postsecondary sectors, widen college
opportunities, and boost college completion as a result. Dual-credit education programs, which
are jointly delivered by high schools and postsecondary education institutions, concomitantly
award high school and college credit to students who enroll in college-level coursework (Bragg
& Kim, 2004). Although originally developed to provide academically challenging content to
high-achieving students, dual-credit education programs across the United States now enroll
high school students with varying degrees of academic preparation and exposure to college and
with an array of postsecondary education goals and expectations.
Texas has witnessed a dramatic increase in dual-credit enrollment. Between fiscal years 2000
and 2016, the count of high school students taking at least one dual-credit course rose from
approximately 18,524 to 204,286, an increase of well over 1,100%. This rapid and substantial
increase has led to growing debate among Texas policymakers and practitioners regarding
whether dual-credit education can deliver on its promise to narrow demographic and economic
gaps in college enrollment and graduation and whether it can do so in an economically viable
way. This study builds on the findings from the Phase I report (Miller et al., 2017) to provide
lawmakers and other key stakeholders with answers to six RQs that have emerged from these
debates surrounding dual-credit education in Texas:
RQ 1 To what extent does dual-credit education increase college enrollment, credential
attainment, and efficient degree completion?
RQ 2 How do high school counselors and college advisors select students for dual-credit
education, advise them into enrolling in dual-credit courses, and coordinate advising
services?
RQ 3 How are dual-credit students taught and assessed relative to college-credit only
students?
RQ 4 What are the annual costs of delivering dual-credit education, and how are they
distributed among stakeholders? Also, how do these costs compare to the benefits of
dual-credit education?
RQ 5 Which factors contribute to racial and ethnic disparities in dual-credit participation?
RQ 6 What were the patterns in dual-credit participation, success, and delivery before and
after passage of HB 505?

Dual-Credit Education Programs in Texas: Phase II
AMERICAN INSTITUTES FOR RESEARCH | AIR.ORG 165
Following, we present the most salient findings from our investigation into each question,
starting with RQ 1 and ending with RQ 6.
Causal Impact Study Component
Participation in dual-credit programs prior to passage of HB 505 modestly improved a range
of student outcomes, suggesting that impact estimates reported in previous descriptive
studies were too high. Previous studies show that dual-credit participants have significantly
better short- and long-term educational outcomes than nonparticipants. However, these
studies fail to consider that students who enroll in dual credit often enter such programs with
more resources and with higher levels of achievement compared with students who do not
participate in dual credit. By taking these differences in account during this study, we found
that participation in dual-credit programs only modestly improved student outcomes.
Specifically, results showed the following overall effects of dual-credit programs:
Did not increase high school graduation rates
Increased college enrollment by 2.4 percentage points, primarily through increased
enrollment at two-year colleges
Increased college completion by 2.2 percentage points by increasing attainment of all types
of postsecondary credentials
Increased the total number of SCHs to a four-year degree by 2.9 SCH, but decreased the
time-to-degree by 1.2 months, or approximately one summer term
The effect on student outcomes of participation in dual-credit programs prior to passage of
HB 505 was more positive for traditionally advantaged student groups; the effect was
negative in some cases for less advantaged groups. Our analysis indicated that dual-credit
participation increased enrollment and completion—primarily at four-year colleges—for White
students. For Black and Hispanic students, dual-credit participation increased enrollment at
two-year colleges but did not meaningfully influence college completion rates. We also found
that students with eighth-grade standardized test scores one standard deviation above the
mean in mathematics and reading benefited significantly more from dual-credit participation
than did students with lower scores. Of particular concern, we found that, on average, the
impact of dual-credit participation for students who were eligible for free or reduced-price
lunch was negative for most outcomes. However, further analyses suggest that these patterns
were likely due to the fact that free and reduced price lunch eligible students were more likely

Dual-Credit Education Programs in Texas: Phase II
AMERICAN INSTITUTES FOR RESEARCH | AIR.ORG 166
than ineligible participants to have lower 8th grade standardized test scores that hindered their
success in dual credit education courses.
Advising Study Component
Most high school guidance counselors played the primary role in advising dual-credit
students, with one quarter sharing this responsibility with college advisors. Overall, high
school counselors served as the primary advisors for dual-credit students relative both to
selecting or determining student eligibility for dual-credit education and to working with
students to select dual-credit courses. High school guidance counselors also served a vital role
in terms of coordinating dual-credit student registration, course scheduling, activities to build
dual-credit awareness, and student participation.
College advisors typically played a secondary role in advising dual-credit students, serving as
the key point of contact for high school counselors and sharing information about dual credit
with prospective students and their families, except in special circumstances. College advisors
were most frequently involved in delivering general, in-person dual-credit education
information sessions to prospective students and their families, usually annually or biannually.
These sessions were used to share information about key features of a dual-credit program,
student eligibility, course offerings, the registration process, and required forms. In addition,
college advisors consistently described being in regular contact with high school counselors to
answer questions about course offerings and student course selections and to ensure that
advising processes and procedures were coordinated between partners. Generally, college
advisors became more directly involved in advising individual students only under special
circumstances involving accelerated students, freshmen and sophomores, or students with
performance issues; or advising outside of the Texas Core Curriculum or relative to CTE dual-
credit programs.
The extent to which high school counselors and college advisors actively targeted students for
dual-credit education varied based on several factors, including state and district policies and
school philosophies regarding which students could benefit from and succeed in dual-credit
courses. All interviewees indicated that they targeted students for dual-credit programs based
on a combination of state rules, district policies, and MOUs that were in place with their
partners. Within these parameters, there was some variation in the extent to which high school
counselors and advisors actively recruited or encouraged certain types of students to apply to
dual-credit programs. For example, some schools strongly encouraged all students to
participate in dual-credit education while others were more selective, targeting only those

Dual-Credit Education Programs in Texas: Phase II
AMERICAN INSTITUTES FOR RESEARCH | AIR.ORG 167
students who excelled in their high school classes and who demonstrated high levels of
emotional maturity. Schools serving disadvantaged populations typically emphasized access
and encouraged all students to participate in dual-credit education.
High school counselors and college advisors most commonly reported considering students’
postsecondary plans and potential for credit transfer when advising students on dual-credit
participation; high school counselors also frequently reported considering students’ grade
levels and high school graduation requirements. Nearly all interviewed counselors and
advisors emphasized the importance of considering students’ postsecondary plans, including
planned majors or desired CTE-degree certificates and colleges in which they were interested.
Interviewees used this information to better ensure that dual-credit courses would transfer to a
particular degree plan whether students were seeking an associate degree or a four-year
degree. At the same time, most high school counselors and college advisors noted that, while
they recognized and emphasized the importance of credit transfer when counseling students,
they generally guided students to confirm credit-transfer policies on their own. For example,
students were encouraged to call the colleges they were considering to determine whether a
specific dual-credit course would transfer or count toward a specific degree.
Counselors and advisors frequently indicated that students’ grade levels informed the courses
they encouraged students to take. In many cases, counselors and advisors used grades as a
proxy for determining students’ academic readiness for certain courses, their maturity or
preparation for the rigors and expectations of particular dual-credit courses, or which dual-
credit courses would meet high school credit requirements and have the highest potential for
transfer to a postsecondary degree. Interviewees indicated that a critical element of their role
was ensuring that students enrolled in dual-credit courses that were crosswalked to high school
degree requirements or their selected high school endorsement areas.
High school students’ academic and emotional readiness for dual-credit education, the
latitude given to students in dual-credit course selection, and the limited time counselors had
to fulfill their dual-credit advising responsibilities were reported as major challenges to
adequate advising. Addressing students’ academic and emotional readiness for dual-credit
education was the most frequently shared challenge, especially among high school counselors.
Counselors reported that it was difficult to effectively communicate to parents and students the
importance of emotional maturity and the ability of students to responsibly conduct
themselves in college classrooms, meet instructor expectations for academic performance and
engagement, and responsibly manage interactions and communications with the instructor. In
addition, counselors and advisors alike described challenges when students were given multiple

Dual-Credit Education Programs in Texas: Phase II
AMERICAN INSTITUTES FOR RESEARCH | AIR.ORG 168
course offerings, particularly in partnerships that appeared to compel students to take as many
dual-credit classes as available and were of interest, even if they were unlikely to transfer to a
specific degree. Finally, some counselors and advisors indicated that they had too little time to
complete their responsibilities and to provide the individualized student counseling they felt
was needed.
High school counselors and college advisors most commonly suggested that greater clarity on
credit-transfer policies, having dedicated and well-trained dual-credit staff, and early
counseling could improve dual-credit student advising. Nearly half of interviewed high school
counselors and about one quarter of interviewed college advisors expressed a desire for more
guidance and clarity on credit-transfer policies and, specifically, on what courses transferred to
a given college or university to better guide dual-credit students’ course taking. Although
interviewees reported turning primarily to college websites and the Texas Common Course
Numbering System (TCCSN) for this information, they nevertheless wanted a more streamlined
and uniform process for locating credit-transfer information.
Nearly one quarter of the high school counselors and nearly one third of the college advisors
indicated that having well-trained, dedicated dual-credit advisors would improve student
advising. For example, many respondents noted the significant time required to provide robust
counseling services for dual-credit students given the amount of coordination and paperwork
involved and the number of students they served. In addition, few high school counselors
reported receiving any specific dual-credit advising training, and many counselors and college
advisors suggested that training for dual-credit advisors at both the college and high school
levels would be beneficial. Approximately one quarter of high school counselors and college
advisors suggested a need to begin advising students earlier about dual-credit education and
dual-credit pathways into college because they thought earlier counseling would better prepare
students and families to make more strategic decisions about dual-credit education. Other
suggestions included having college advisors play a more direct role in the advising process and
establishing greater role clarity at college and high school levels to streamline dual-credit
advising procedures and practices.
Academic Rigor Study Component
A high degree of similarity existed relative to the content and skills emphasized in English and
mathematics dual-credit courses taught by HSDCs, dual-credit courses taught by DCs, and
college-credit only courses taught by CCs. Across all course types, English 1301 syllabi required
students to demonstrate specific skills, including how to think critically, communicate thoughts

Dual-Credit Education Programs in Texas: Phase II
AMERICAN INSTITUTES FOR RESEARCH | AIR.ORG 169
and ideas clearly, and work in teams. Syllabi also had similar learning outcomes, including
understanding the stages of the writing process (planning, drafting, revising, editing) and
analyzing the purpose, audience, tone, style, and writing strategies of written works. Similarly,
Math 1314/1414 syllabi collected from all three course types revealed that each focused on
teaching students seven core concepts in Algebra: polynomials, rational functions, radical
functions, exponential functions, logarithmic functions, systems of equations using matrices,
and graphing.
Student grading was consistent across all course types in Mathematics 1314 and English 1301.
Letter grades given for similar assignments were aligned across course types. All student work
was individually analyzed using a novice–expert continuum. This analysis of student work
demonstrated grading consistency across course types; for example, student work graded as
“A” or “B” was scored as “Strategic Thinking Level” across all course types.
HSDC, DC, and CC English 1301 and Mathematics 1314 focused on different instructional
strategies in their courses. Instructors across English 1301 course types reported devoting
differing amounts of instructional time to the various instructional tasks. For HSDC and DC
English 1301 courses, instructors dedicated most of their time to whole-class discussions on
writing and reading exercises. CC English 1301 instructors devoted the majority of course time
to student engagement in computer-based writing assignments. Similarly, CC Mathematics
1314 instructors placed a greater emphasis on individual work and more often required
comprehension of information from multiple sources than did DC and HSDC instructors.
HSDC, DC, and CC English 1301 instructors used common methods for assessing student
performance. Across the three course types, English 1301 instructors reported using the
following assessment methods: quizzes, cumulative final examinations, papers, presentations,
and portfolios. Written essays were the most common work product instructors used to assess
student performance (50% of overall grade), with cumulative final examinations as the second
most common form of assessment (25% of overall grade).
HSDC, DC, and CC Mathematics 1314 instructors placed different emphasis on assessment
strategies. Although Mathematic 1314 instructors across all course types used some similar
forms of assessment (primarily final examinations, chapter tests/midterms, and homework) to
grade students, HSDC and DC instructors reported using multiple choice and true/false
questions more frequently compared with CC instructors. CC courses also placed greater
emphasis on extended response questions and more often required comprehension of
information from multiple sources compared with HSCD or DC courses.

Dual-Credit Education Programs in Texas: Phase II
AMERICAN INSTITUTES FOR RESEARCH | AIR.ORG 170
Cost Study Component
Our estimate of the overall cost of providing dual-credit instruction was $111 per SCH, or
$121.7 million statewide in 2016–17. On average, the cost to colleges of delivering dual-credit
education far outweighed the additional state revenues they received by providing dual-credit
instruction. When community colleges waived tuition, the average cost of dual credit for
community colleges was $82 per SCH (74% of the total cost). Community colleges received, on
average, $38 per SCH in state funding.
Tuition and fees arrangements varied widely across the state and had significant effects on
the distribution of costs. When tuition was waived, colleges bore 74% of the cost of dual-credit
instruction, compared with 14% for districts and 12% for students, on average. Conversely,
when districts paid tuition for dual-credit students, colleges paid, on average, 38% of costs,
school districts paid 51%, and students paid 12%. In some regions, tuition was waived for most
classes and districts paid the costs of textbooks and placement test fees so that the upfront
cost to students was effectively zero.
The strongest predictor of overall costs and of how costs were distributed across stakeholders
was the type of instructor teaching the course. When courses were taught by college faculty,
colleges bore more of the cost of dual credit. Full-time college faculty members were 2.5 times
costlier, on average, than part-time college faculty on a per-SCH basis. When courses were
taught by college faculty, school districts received cost savings resulting from reductions in the
instructional burden on high school teachers. The cost of dual-credit education shifted from
colleges to school districts when courses were taught by high school teachers. Assigning part-
time college faculty to teach dual-credit course was the least expensive delivery mechanism;
however, this approach may not have been the most cost-effective strategy because high
school teachers or full-time college faculty may have been more effective instructors. Given the
difference in cost burden according to who teaches the course, colleges should consider
charging differential tuition rates for various teaching arrangements (a model used in some of
the sites we sampled).
Our estimate of the cost of dual credit delivered through ECHSs was greater overall but were
similar on a per-SCH basis. Although ECHSs generally had larger staffing levels per student,
each ECHS student received a greater number of SCHs compared with students enrolled in dual
credit in traditional, comprehensive high schools. As a result, the cost per SCH of administration
and advising was only slightly higher in ECHSs. ECHSs typically shifted a substantial proportion

Dual-Credit Education Programs in Texas: Phase II
AMERICAN INSTITUTES FOR RESEARCH | AIR.ORG 171
of costs from school districts to colleges because ECHSs were more likely to have dual-credit
courses taught by college faculty rather than by high school teachers.
The short-term benefits related to reduced time to degree were 1.18 times the cost of dual
credit. Long-term monetary benefits associated with a greater number of college graduates
were almost five times our estimate of the amount of dual credit cost. Benefits from reduced
time to degree were $131 per SCH—18% greater than the cost of dual credit. The most
conservative estimate of lifetime benefits from increased earning of two-year credentials was
$552 per SCH—almost 400% greater than the cost of dual-credit. The considerable value of
benefits compared with costs suggests that investment in dual credit will result in large future
payoffs to both individuals participating in dual credit and the public at large.
Racial Disparities Study Component
Differences in academic preparation, family income, and high school attendance patterns
served as major contributors to racial and ethnic disparities in dual-credit participation. The
descriptive analyses showed that the dual-credit participation rate of White students was 24%,
while the corresponding rate for Blacks and Hispanics was 10.3% and 15.1%, respectively—a
gap of 13.7 percentage points and 8.9 percentage points, respectively. However, when we
accounted for differences in academic preparation and income between these groups,
participation gaps narrowed significantly. For example, if Black students had the same eighth-
grade standardized test scores in reading and mathematics as White students, then disparities
in dual-credit participation would have decreased from 13.7 percentage points to 6.7
percentage points. For Hispanics, that gap would have decreased from 8.9 to 3.7 percentage
points. However, we found no evidence suggesting that student access to dual-credit programs
or AP/IB courses or to dual-credit tuition and fee waivers played a role in narrowing these
disparities.
HB 505 Study Component
The percent of students participating in dual credit modestly increased after passage of HB
505 but was highest among ninth and 10th graders. The descriptive analysis showed that the
percentage of students participating in dual-credit programs increased by 1.0% (from 7.5% to
8.5%) after the passage of HB 505. This one-point increase represented a growth of 14% in the
dual-credit participation rate between 2012 and 2017. The rate of growth of dual-credit
participation was highest among ninth and 10th graders. The percentage of high school
freshmen participating in dual-credit programs increased from 1.0% before passage of HB 505

Dual-Credit Education Programs in Texas: Phase II
AMERICAN INSTITUTES FOR RESEARCH | AIR.ORG 172
to 2.1% after the bill’s passage, an increase of 110%. Similarly, the percentage of high school
sophomores enrolling in dual-credit programs increased by 60%, from 2.7% before HB 505 to
4.3% after HB 505. The number of SCHs taken by dual-credit students also increased—from an
average of 9.18 SCHs before the passage of HB 505 to 9.68 SCHs after passage. This increase
aligned with an overall upward trend in the number of dual-credit SCHs delivered statewide
from 2012 to 2017.
Standards of assessment may have declined for ninth and 10th graders taking dual credit, but
not for participating 11th and 12th graders. Results demonstrate that scores among ninth- and
10th-grade students who took eighth-grade state standardized tests in reading and
mathematics declined among dual-credit participants after HB 505, but dual-credit course pass
rates for those groups increased. These patterns were not evident among 11th- and 12th-grade
dual-credit participants.
Policy Recommendations
Determining how policy and practice should change based on our research is a nuanced and
complicated process that requires input from stakeholders representing various perspectives
and opinions. Until now, we have engaged stakeholders in this research on an ad hoc basis
(e.g., meetings with THECB leadership, a webinar for dual-credit administrators and faculty).
Publication of the first draft of this report and its posting for public comment moves us into a
new phase of more formal stakeholder engagement. The feedback we receive during the public
comment period will play a vital role in shaping how we will interpret findings and develop
recommended policy and practice reforms. Thus, we will incorporate proposed changes to
policy and practice into the final report following the close of the public feedback period.
Formal Feedback Process
This draft report was released for public comment at the THECB Board Meeting on July 26,
2018. The research team will host a webinar for interested stakeholders in early August and will
present detailed findings at the Texas Association of Community Colleges (TACC) annual
conference in Corpus Christi, Texas, on August 2, 2018. AIR welcomes comments and
suggestions to help us contextualize the study’s findings and develop practical policy
recommendations that are grounded in the research presented in this report and elsewhere.
The public comment period will be open through August 27, 2018.
The research team will host a second webinar in late September 2018 to summarize the
comments and suggestions we receive during the public comment period. At this time, we also
Dual-Credit Education Programs in Texas: Phase II
AMERICAN INSTITUTES FOR RESEARCH | AIR.ORG 173
will share a draft set of policy recommendations that are grounded in the research and
informed by the feedback received through the public comment period. Interested
stakeholders will have opportunities to submit feedback on the draft recommendations
through October 9, 2018. The research team will then revise its recommendations based on
feedback received and will present a final report at the October 25, 2018, THECB Board
Meeting.
Dual-Credit Education Programs in Texas: Phase II
AMERICAN INSTITUTES FOR RESEARCH | AIR.ORG 174
References
Agan, A. Y. (2014). Dissaggregating the returns to college. Princeton, NJ: Princeton University.
An, B. P. (2013). The impact of dual enrollment on college degree attainment: Do low-SES
students benefit? Educational Evaluation and Policy Analysis, 35, 57–75.
Bailey, T., Hughes, K. L., & Karp, M. M. (2002). What role can dual enrollment programs play in
easing the transition between high school and postsecondary education?
Blackburn, B. (2008). Rigor is not a four-letter word. Larchmont, NY: Eye On Education.
Bragg, D. D., & Kim, E. (2005). Dual credit in Illinois: Making it work. Champaign, IL: Office of
Community College Research and Leadership, University of Illinois at Urbana-
Champaign.
Braxton, J. M. (1993). Selectivity and rigor in research universities. Journal of Higher Education,
64(6), 657–75.
Berger, A., Tuck-Bicacki, L., Garet, M., Knudson, J., & Hoshen, G. (2014). Early college, continued
success: Early college high school initiative impact study. San Mateo, CA: American
Institutes for Research.
Carnevale, A. P., & Desrochers, D. M. (2002). The missing middle: Aligning education and the
knowledge economy. Washington, DC: The Office of Vocational and Adult Education.
Carroll, S. J., & Erkut, E. (2009). The benefits to taxpayers from increases in students'
educational attainment. Santa Monica, CA: RAND.
Conley, D. (2013) Getting ready for college, careers, and the Common Core: What every
educator needs to know. San Francisco, CA: Jossey-Bass.
Conley, D., Drummond, K., deGonzalez, A., Rooseboom, J., & Stout, O. (2011). Reaching the
goal: The applicability and importance of the common core state standards to college
and career readiness. Eugene, OR: Educational Policy Improvement Center.
Danielson, C. (1996). Enhancing professional practice: A framework for teaching. Alexandria,
VA: ASCD.
Dual-Credit Education Programs in Texas: Phase II
AMERICAN INSTITUTES FOR RESEARCH | AIR.ORG 175
Dounay, J. (2008). Strategies to empower low-income and minority students in gaining
admission to and pay for college. Policy brief. Denver, CO: Education Commission of the
States.
Eberly, M. B., Newton, S. E., & Wiggins, R. A. (2001). The syllabus as a tool for student-centered
learning. The Journal of General Education, 50(1), 56–74.
Edmunds, J., Unlu, F., Glennie, E., Bernstein, L., Fesler, L., Furey, J., & Arshavsky, N. (2016).
Smoothing the transition to postsecondary education: The impact of the early college
model. Journal of Research on Educational Effectiveness, 10(2), 297-325.
Edwards, L., & Hughes, K. (2011). Dual enrollment guide. New York, NY: Institute on Education
and the Economy, Community College Research Center, Columbia University.
Express-News. (2018, March 10). Cost, rigor of dual-credit programs raise concerns. Retrieved
from: https://www.mysanantonio.com/opinion/editorials/article/Cost-rigor-of-dual-
credit-programs-raise-concerns-12742318.php
Ferguson, C., Baker, P., & Burnett, D. (2015, March). Faculty members’ perceptions of rigor in
dual enrollment, accelerated programs, and standard community college courses.
Special Issue: Dual Enrollment Policies, Pathways, and Perspectives, 2015(169), 83–91.
https://doi.org/10.1002/cc.20135
Gewirtz, S., & Cribb, A. (2002). Plural conceptions of social justice: Implications for policy
sociology. Journal of Education Policy, 17(5), 499–509.
Giani, M., Alexander, C., & Reyes, P. (2014). Exploring variation in the impact of dual-credit
coursework on postsecondary outcomes: A quasi-experimental analysis of Texas
students. High School Journal, 97(4), 200–218.
Goldrick-Rab, S. (2010). Challenges and opportunities for improving community college student
success. Review of Education Research, 80, 437–467.
Gray, A., & Jenkins, B. (2006). From public administration to public management: Reassessing a
revolution? In Comparative Public Administration (pp. 543–572). West Yorkshire, UK:
Emerald Group Publishing Limited.
Hanson, J. M., Prusha, T., & Iverson, C. (2015). Principal, teacher, and counselor views of
concurrent enrollment. New Directions for Community Colleges, (169), 71–81.
Dual-Credit Education Programs in Texas: Phase II
AMERICAN INSTITUTES FOR RESEARCH | AIR.ORG 176
Harvey, J., & Houseman, N. (2004). Crisis or possibility? Conversations about the American high
school. Washington, DC: National High School Alliance.
Hechinger Institute. (2009). Understanding and reporting on academic rigor. New York, NY:
Teachers’ College Press.
Hershbein, B., & Kearney, M. (2014). Major decisions: What graduates earn over their lifetimes.
Washington, DC: The Hamilton Project.
Hoover, S., & Vargas, J. (2016, September). Realizing the time-saving promise of dual
enrollment. Boston, MA: Jobs for the Future.
Kirst, M., & Venezia, A. (2004). From high school to college: Improving opportunities for success
in postsecondary education. San Francisco: Josey-Bass Publishers.
Legislative Budget Board. (2017). Legislative budget board staff reports. Austin, TX: Author.
Levin, H., McEwan, P., Belfield, C., Bowden, B., & Shand, R. (2018). Economic evaluation in
education: Cost-effectiveness and cost-benefit analysis. Thousand Oaks, CA: SAGE
Publications.
Marzano, R. J., & Toth, M. D. (2014). Teaching for rigor: A call for a critical instructional shift.
West Palm Beach, FL: Learning Sciences Marzano Center.
Maxwell, J. A. (2013). Qualitative research design: An interactive approach (3rd ed.). Los
Angeles, CA: Sage.
McMahon, W. W. (2009). Higher learning, greater good. Baltimore, MD: Johns Hopkins
University Press.
Merriam, S. B. (1998). Qualitative research and case study applications in education. San
Francisco, CA: Jossey-Bass.
Miller, T., Kosiewicz, H., Wang, E., Marwah, E., Delhommer, S., & Daugherty, L. (2017). Dual
credit education in Texas: Interim report. Santa Monica, CA: The RAND Corporation.
National Association of Colleges and Employers. (2017). Salary survey: Preliminary starting
salaries for the class of 2017 new college graduates. Bethlehem, PA: Author.

Dual-Credit Education Programs in Texas: Phase II
AMERICAN INSTITUTES FOR RESEARCH | AIR.ORG 177
National Student Clearinghouse Research Center (2017). Term enrollment estimates: Fall 2017.
Herndon, VA: Author.,
Osumi, J. M. (2010). The influence of counselors and high school organization on the selection
of participants for a dual-credit program. (Order No. 3434485, University of Southern
California). ProQuest Dissertations and Theses, 179.
Ozmun, C. D. (2013). College and academic self-efficacy as antecedents for high school dual-
credit enrollment. The Community College Enterprise, 19(1), 61–72.
Perez-Hernandez, D. (2016, June 16). STC evaluating growing program to address quality
concerns. McAllen, TX.
Perna, L. W. (2006). Studying college choice: A proposed conceptual model. In J. C. Smart (Ed.),
Higher Education: Handbook of Theory and Research (Volume 21, pp. 99–157). New
York: Springer.
Pfeffer, F. (2018). Growing wealth gaps in education. Ann Arbor, MI: University of Michigan.
DOI: 10.31235/osf.io/s5dpm
Pierce, D. (2017). The rise of dual enrollment. Community College Journal, 87(5), 16–24.
Piontek, M. E., Kannapel, P. J., Flory, M., Stewart, M. S., Regional Educational Laboratory
Appalachia, & National Center for Education Evaluation and Regional Assistance. (2016).
The implementation of dual credit programs in six nonurban Kentucky school districts
(REL 2016-136). Washington, DC: U.S. Department of Education, Institute of Education
Sciences, National Center for Education Evaluation and Regional Assistance, Regional
Educational Laboratory Appalachia. Retrieved from
https://files.eric.ed.gov/fulltext/ED566740.pdf
Raia-Taylor, M., (2012, December). A case study examining the influence of dual enrollment and
high school advising on student persistence in college. Unpublished manuscript,
Northeastern University. Retrieved from
https://repository.library.northeastern.edu/files/neu:1186/fulltext.pdf
Smith, D. G. (2009). Diversity’s promise for higher education: Making it work. Baltimore, MD:
The Johns Hopkins University Press.
South Texas College. (2015). Dual Enrollment Program Cost-Analysis. McAllen, TX: Author.

Dual-Credit Education Programs in Texas: Phase II
AMERICAN INSTITUTES FOR RESEARCH | AIR.ORG 178
Spillane, J. P., Reiser, B. J., & Reimer, T. (2002). Policy implementation and cognition: Reframing
and refocusing implementation research. Review of Educational Research, 72(3), 387–
431. https://doi.org/10.3102/00346543072003387
Struhl, B., & Vargas, J. (2012). Taking college courses in high school: A strategy guide for college
readiness: The college outcomes of dual enrollment in Texas. Washington, DC: Jobs for
the Future.
Svinivki, M., & McKeachie, W. J. (2010). McKeachie’s teaching tips: Strategies, research and
theory for college and university teachers (13th ed.). Belmont, CA: Wadsworth.
Taylor, L. L., Glander, M. C., & Fowler, W. J. (2006). Documentation for the NCES Comparable
Wage Index Data Files. Washington, DC: U.S. Department of Education, Institute of
Education Sciences.
Texas Association of Community Colleges. (2017). Dual Credit Enrollment in 2016 [Dataset].
Texas Education Agency (TEA). (2017). Texas Public School Finance Overview. Austin, TX:
Author.
Texas Higher Education Coordinating Board. (2015). The 60x30 Texas Higher Education Strategic
Plan: 2015–2030. Austin, TX: Author.
Thomas, N., Marken, S., Gray, L., & Lewis, L. (2013, February). Dual credit and exam-based
courses in U.S. public high schools: 2010–11—First look (NCES 2013-001). Washington,
DC: National Center for Education Statistics. Retrieved from
https://nces.ed.gov/pubs2013/2013001.pdf
Trostel, P. A. (2009). The fiscal impacts of college attainment. Research in Higher Education, 51,
220–247.
U.S. Department of Education. (2017). What Works Clearinghouse intervention report: Dual
enrollment programs. Washington DC: Institute of Education Sciences. Retrieved from
https://ies.ed.gov/ncee/wwc/Docs/InterventionReports/wwc_dual_enrollment_022817
Wagner, T. (2008). Rigor redefined. Educational Leadership, 66(2), 20–24.

Dual-Credit Education Programs in Texas: Phase II
AMERICAN INSTITUTES FOR RESEARCH | AIR.ORG 179
Webb, N. (2002). Depth of knowledge levels for four content areas. Madison, WI: Wisconsin
Center for Educational Research. Retrieved from
http://ossucurr.pbworks.com/w/file/fetch/49691156/Norm%20web%20dok%20by%20s
ubject%20area.pdf
The Wisconsin Center for Education Research. (2012a) Surveys of enacted curriculum: Survey of
instructional practices, teacher survey, grades K–12, English, language arts, and reading.
Retrieved from:
https://secure.wceruw.org/seconline/Reference/SECelarSurvey2012.pdf
The Wisconsin Center for Education Research. (2012b) Surveys of enacted curriculum: Survey of
instructional practices, teacher survey, grades K–12, math. Retrieved from:
https://secure.wceruw.org/seconline/Reference/SECmathSurvey2012.pdf
Winston, R. B., Vahala, M. E., Nichols, E. C., Gillis, M. E., Wintrow, M., & Rome, K. D. (1994). A
measure of college classroom climate: The college classroom environment scales.
Journal of College Student Development, 35(1), 11–18.

Dual-Credit Education Programs in Texas: Phase II
AMERICAN INSTITUTES FOR RESEARCH | AIR.ORG 180
Appendix A. Data and Methods
In this Appendix, we describe the data used in our quantitative analyses and provide additional
details about specific methods used for particular analyses beyond what is reported in the main
report. We also provide more detailed results than what is provided in the body of the report.
We begin this appendix by describing the data and then describe the different methods we use
to conduct our analysis. We also go on to show results from analyses employing those methods.
Data
In this section, we describe the administrative data files that we used to conduct our
quantitative analyses, and how we linked them at the individual level and over time to
construct our analytic data files.
Administrative Data Files
We draw on administrative records collected by THECB and TEA for all quantitative analyses.
Below, we describe employed THECB administrative data files:
1. CBM001: Public Universities and Community, Technical and State Colleges Enrollment
Report (2001–17). This file captures college enrollment at all public HEIs in Texas, including
public two- and four-year colleges. The file captures the number of SCH attempted each
semester at all colleges in the state. Beginning in the 1999-2000 academic year, the file
began distinguishing between DC and traditional college SCH. We use the data starting in
academic year 2000-2001. The file also captures demographic information about all public
college students in the state. We use this file to capture information about DC participation,
college enrollment, and SCHs earned.
CBM001: Independent Colleges and Universities Enrollment Report (2003-2017). This file
captures college enrollment at all private HEIs in Texas, including private non-profit two- and
four-year colleges. First collected in the 2002-2003 academic year, the file captures the number
of SCH attempted each semester at all colleges in the state. The file also captures demographic
information about all private college students in the state. We use this file to capture
information about DC participation, college enrollment, and SCHs earned from private colleges
in Texas.
Dual-Credit Education Programs in Texas: Phase II
AMERICAN INSTITUTES FOR RESEARCH | AIR.ORG 181
CBM009: Public Universities and Community, Technical and State Colleges Graduation Report
(2001–17). This file captures information about all degrees and certificates conferred to
students who were enrolled at any public HEIs in Texas, including two- and four-year colleges.
We used this file to capture information about college completion.
CBM009: Independent Colleges and Universities Graduation Report (2003-2017). This file
captures information about all degrees conferred to students who were enrolled at any private
HEIs in Texas, including two- and four-year colleges. We used this file to capture information
about college degree completion.
CBM00S: The Student Schedule Report (2012-2017). This file captures detailed transcript-level
information for all students enrolled at any public two- or four-year HEI in Texas. We use this
file to capture detailed information about course performance in DC and courses taught for
college-credit only. We also use this file to capture detailed information about course mode and
location. This file is also used to examine changes in DC courses after HB505. Since THECB only
began collecting this information in 2012, we can only examine these data for 2012-2017 fiscal
years.
CBM008: The Faculty Report (2012-2017). This file captures detailed information about faculty
members teaching courses at public two- or four-year HEI in Texas. We use this file to capture
information about the rank, highest degree earned, and employment status (full time, part-
time or adjunct) for the faculty member of record for each course delivered at Texas public
two- and four-year colleges from 2012–2017.
We also draw upon several administrative files from TEA. These include:
RQ 1 TEA Enrollment File (2001–17). This file captures enrollment information on all students
of Texas public high schools. This includes demographic information and information about
the high school that the student attended. We use this file to identify cohorts of junior year
students to track into Texas public colleges and to identify the grade during which students
took DC courses, if any.
TEA High School Graduation File (2001–17). This file captures information about all graduates
of Texas public high schools. This includes the year in which the student graduated from high
school, and the high school that conferred the degree, and basic demographic information. We
use this file to examine high school graduation.
TEA Employment Records (2012-2017). This file captures information about all employees of
Texas public schools. We use this file to identify college courses delivered in 2012-2017 whose
faculty member of record was employed as a teacher in a Texas public school in those years.
Dual-Credit Education Programs in Texas: Phase II
AMERICAN INSTITUTES FOR RESEARCH | AIR.ORG 182
TEA Eighth-Grade Test Score (1998-2016). This file captures eighth-grade test score
information for all students of Texas public high schools. This includes the Texas Assessment of
Academic Skill (1998-2002), the Texas Assessment of Knowledge and Skills (2003-2011), and the
State of Texas Assessments of Academic Readiness (2012-2016). We center all student test
scores around the average of each year so that the test scores can be compared across years.
We use this to control for a student’s academic performance before high school.
National Student Clearinghouse
We also draw upon data collected by the National Student Clearinghouse (NSC). The NSC is a
nonprofit organization that provides enrollment and degree verification services for
postsecondary institutions. The overwhelming majority of postsecondary institutions nationally
outsource these services to the NSC. According to NSC, they capture 99% of all college
enrollment nationally. THECB contracts with NSC to obtain information on Texas public high
school graduates who enroll in postsecondary institutions outside of Texas. THECB has access to
NSC enrollment and degree records from 2009–17. We use this file to capture information
about college enrollment and degree completion outside the state of Texas
Early College High School Data
Finally, we also draw upon a file that captures information on the date when a public high
school was designated an ECHS by TEA. The file contains the codes for each ECHS, as well as an
indicator for whether or not the ECHS was a standalone high school or embedded within a
larger high school with the same TEA high school code. We use this file to develop indicators of
enrollment in ECHSs.
Construction of Datasets
We link the files above across time and at the individual student level using SSNs to create two
analytic files that we use in our quantitative analyses. Table AE.1 describes the key variables
included in each file and the cohorts for which each variable is available.
First Analytic File
The first file, referred to as the “Student File,” tracks cohorts of 11th-grade students for 2001–
16 students of Texas public high schools, capturing DC SCH starting in a student’s junior year of
high school and college enrollment and degree completion up to ten years starting with a
student’s junior year of high school. Since we only have enrollment data from 2001–17, we are

Dual-Credit Education Programs in Texas: Phase II
AMERICAN INSTITUTES FOR RESEARCH | AIR.ORG 183
only able to create certain indicators for specific cohorts, as described below. The file captures
detailed student information from the TEA enrollment file, including race / ethnicity, free lunch
status, eighth-grade test scores, an indicator for whether or not the student participated in a
Gifted and Talented program, an indicator for whether or not the student is considered at-risk
of dropping out of high school, and an indicator for whether the student was identified as an
English Language Learner.
This file also captures information about whether the student graduated from a HS that was
either a standalone ECHS or had an ECHS embedded within it. The file captures outcomes
including college enrollment (defined as enrolling full or part-time during the Fall or Spring
semester two years after their 11th grade in high school), and completion (defined as having
completed any postsecondary credential within ten years of their 11th grade in high school).
The file also has indicators for enrolling in a two-vs. four-year college, and completing different
postsecondary credentials. Finally, the file includes data on SCH-to-degree, SCH taken in college
to degree, and time-to-degree for students enrolling in a HEI during the Spring or Fall Semester
immediately following high school graduation and completing a four-year degree within ten
years of 11th grade.
Second Analytic File
The second file, referred to as the “Course File,” which contains all of the scheduling
information for dual-credit courses between 2012-2017 at all public and private HEIs in Texas.
This file gives information on the grade that students received in a DC course, where and how
the class was taught, and the characteristics of the teacher who taught that course. The data
was matched to TEA data to capture student level information for students taking the DC
courses including race / ethnicity, free/reduced priced lunch eligibility, eighth-grade test scores,
an indicator for whether or not the student participated in a Gifted and Talented program, an
indicator for whether or not the student is considered at-risk of dropping out of high school,
and an indicator for whether the student was identified as an English Language Learner. We use
the Course File to analyze how DC courses and the composition of DC courses have changed
after the passage of HB505.
Table A.1. Key Variables by Student and Course File
DC Participation Student Info Context Outcomes Efficiency
Student File: Variables Generally Available 2000-2016 Unless Otherwise Noted

Dual-Credit Education Programs in Texas: Phase II
AMERICAN INSTITUTES FOR RESEARCH | AIR.ORG 184
DC Participation Student Info Context Outcomes Efficiency
DC Participation
11th-12th Gr Race / Ethnicity
High School
information
Enroll two-- or
four-year SCH-to-Degree
DC SCH 11th-12th Gr
Free/Reduced
Price Lunch
eligibility
Graduation two- or
four-year
Net SCH-to-
Degree
8th Grade Test
Scores
Credential two-or
four-year Time-to-Degree
High School
Graduation
Additional Variables Available in Course File:Variables Generally Available 2012–17 Unless
Otherwise Noted
Specific DC Courses Race / Ethnicity Location
Grades and Pass
Rates in DC courses
Free/Reduced-
Price Lunch
eligibility Mode
Eighth-Grade
Test Scores
Faculty
Characteristics
Academic vs. CTE
Beginning in 2012, THECB began collecting detailed transcript-level information (CBM00S)
about all college courses taken at any public HEI in the state. The file includes detailed course
and section identifiers that allow us to link courses to information about their faculty member
of record from the CBM008. For students taking courses in 2012-2017, we link the student level
file above to additional course-level information about all college level courses taken by
students of Texas public high schools. The file includes information about enrollment and
course performance for particular DC courses, information on location (high school vs. college
campus, mode of instruction (face-to-face, online, or hybrid), faculty characteristics (whether or
not the instructor was employed as a public school teacher in Texas, highest degree earned,
full- or part-time status, and adjunct status.
The table below describes each outcome examined in our analysis. It details how each outcome
is defined, the high school graduate cohorts that is examined for each outcomes, the number of
the students in those cohorts, and the conditioning that is necessary to analyze each outcome.
Dual-Credit Education Programs in Texas: Phase II
AMERICAN INSTITUTES FOR RESEARCH | AIR.ORG 185

Dual-Credit Education Programs in Texas: Phase II
AMERICAN INSTITUTES FOR RESEARCH | AIR.ORG 186
Table A.2. Definition of Outcomes
Outcome Definition Cohorts Examined
Number of Students Conditioning
Graduated HS Student graduated from HS on time 2001–16 3,411,286
Enroll two-year Student enrolled in a two-year college two years after junior year.
2001–15 3,223,430
Enroll four-year Student enrolled in a four-year college two years after junior year.
2001–15 3,223,430
Enroll 2- or four-year Student enrolled in a two- or four-year college two years after junior year
2001–15 3,223,430
Graduated two-year Student completed an Associate’s degree from a two-year college within 5 years of junior year
2001–13 2,754,765
Certificate two-year Student received a certificate from a two-year college within 5 years of junior year
2001–13 2,754,765
Credential two-year Student received a certificate or Associate’s degree from a two-year college within 5 years of junior year
2001–13 2,754,765
Credential two-year or transfer
Student received a certificate or Associate’s degree from a two-year college or transferred to a four-year HEI within 5 years of junior year
2001–13 2,754,765
Graduated four-year Student completed a Bachelor’s degree from a four-year college within 10 years of junior year
2001–08 1,542,629

Dual-Credit Education Programs in Texas: Phase II
AMERICAN INSTITUTES FOR RESEARCH | AIR.ORG 187
Outcome Definition Cohorts Examined
Number of Students Conditioning
Graduated 2- or four-year
Student completed an Associate’s degree from a two-year college or a Bachelor’s degree from a four-year college within 10 years of junior year
2001–08 1,542,629
Credential 2- or four-year
Student received a certificate or Associate’s degree from a two-year college or a Bachelor’s degree from a four-year college within 10 years of junior year
2001–08 1,542,629
Time to four-year Degree
Years between graduating high school and completing a Bachelor’s degree from four-year college
2001–08 375,715 Conditioned on graduating from four-year school
Credit to four-year Degree
SCH earned at all institutions prior to obtaining the first Bachelor’s degree
2001–08 384,658 Conditioned on graduating from four-year school
Credit in College to four-year Degree
SCH earned at all institutions after graduating from high school and prior to obtaining the first Bachelor’s degree
2001–08 384,658 Conditioned on graduating from four-year school
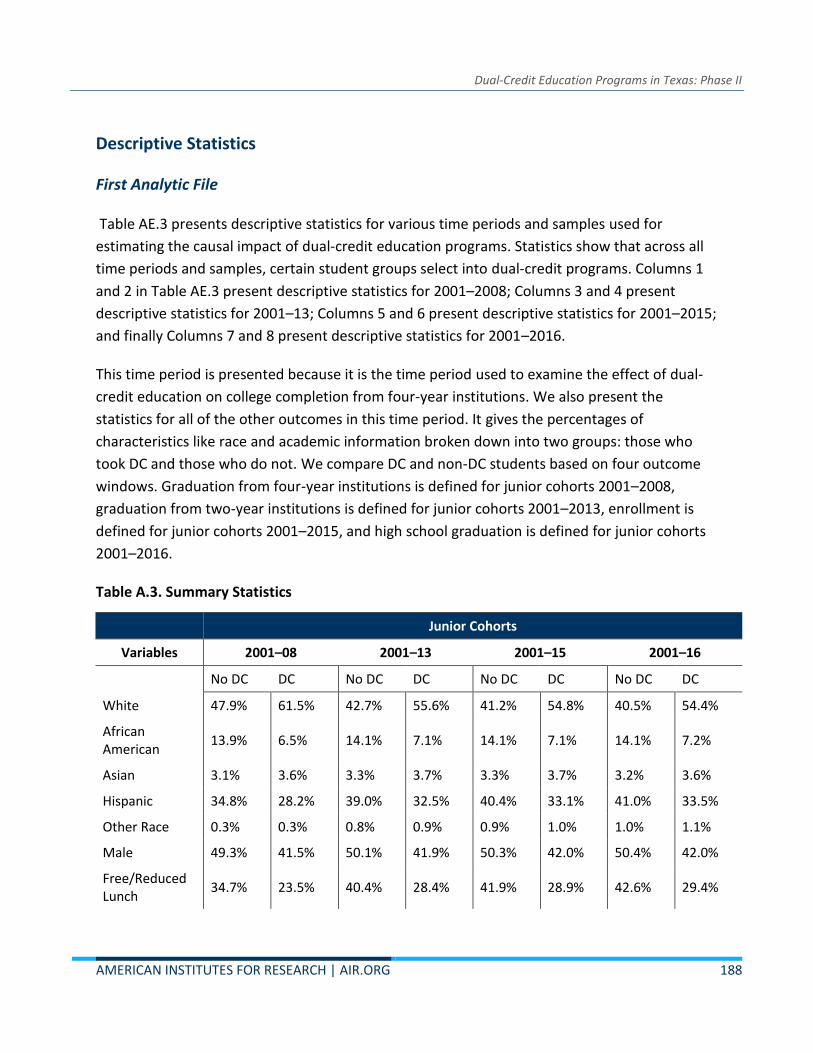
Dual-Credit Education Programs in Texas: Phase II
AMERICAN INSTITUTES FOR RESEARCH | AIR.ORG 188
Descriptive Statistics
First Analytic File
Table AE.3 presents descriptive statistics for various time periods and samples used for
estimating the causal impact of dual-credit education programs. Statistics show that across all
time periods and samples, certain student groups select into dual-credit programs. Columns 1
and 2 in Table AE.3 present descriptive statistics for 2001–2008; Columns 3 and 4 present
descriptive statistics for 2001–13; Columns 5 and 6 present descriptive statistics for 2001–2015;
and finally Columns 7 and 8 present descriptive statistics for 2001–2016.
This time period is presented because it is the time period used to examine the effect of dual-
credit education on college completion from four-year institutions. We also present the
statistics for all of the other outcomes in this time period. It gives the percentages of
characteristics like race and academic information broken down into two groups: those who
took DC and those who do not. We compare DC and non-DC students based on four outcome
windows. Graduation from four-year institutions is defined for junior cohorts 2001–2008,
graduation from two-year institutions is defined for junior cohorts 2001–2013, enrollment is
defined for junior cohorts 2001–2015, and high school graduation is defined for junior cohorts
2001–2016.
Table A.3. Summary Statistics
Junior Cohorts
Variables 2001–08 2001–13 2001–15 2001–16
No DC DC No DC DC No DC DC No DC DC
White 47.9% 61.5% 42.7% 55.6% 41.2% 54.8% 40.5% 54.4%
African American
13.9% 6.5% 14.1% 7.1% 14.1% 7.1% 14.1% 7.2%
Asian 3.1% 3.6% 3.3% 3.7% 3.3% 3.7% 3.2% 3.6%
Hispanic 34.8% 28.2% 39.0% 32.5% 40.4% 33.1% 41.0% 33.5%
Other Race 0.3% 0.3% 0.8% 0.9% 0.9% 1.0% 1.0% 1.1%
Male 49.3% 41.5% 50.1% 41.9% 50.3% 42.0% 50.4% 42.0%
Free/Reduced Lunch
34.7% 23.5% 40.4% 28.4% 41.9% 28.9% 42.6% 29.4%

Dual-Credit Education Programs in Texas: Phase II
AMERICAN INSTITUTES FOR RESEARCH | AIR.ORG 189
Junior Cohorts
At Risk 46.9% 20.4% 48.8% 21.0% 49.8% 21.3% 50.2% 21.5%
ESL 1.4% 0.1% 1.9% 0.2% 2.2% 0.3% 2.4% 0.3%
Gifted 11.1% 28.3% 10.2% 25.1% 9.8% 24.3% 9.4% 23.6%
Grad HS 79.8% 94.3% 79.7% 94.5% 80.3% 94.6% 80.3% 94.5%
Enroll two-year 30.2% 31.0% 29.9% 31.8% 29.6% 31.8%
Enroll four-year 18.8% 45.8% 17.6% 44.2% 17.2% 44.1%
Enroll four- or two-year
47.4% 72.9% 46.0% 72.2% 45.4% 72.0%
Grad two-year 2.2% 5.2% 2.4% 6.3%
Certificate two-year
1.1% 1.5% 1.1% 2.0%
Credential two-year
3.2% 6.4% 3.3% 7.9%
Credential two-year or Transfer
16.3% 27.9% 14.4% 26.2%
Grad four-year 19.9% 51.5%
Grad two- or four-year
20.9% 53.6%
Credential two- or four-year
21.8% 54.7%
Causal Impact Study: Methods and Results
In this section, we describe the quasi-experimental methods used to estimate the causal impact
of dual-credit education programs in Chapter 1. We also present detailed findings and
regression output.
First, we describe our identification strategy using an instrumental variable approach and why
using an instrumental variable strategy is necessary in this setting, along with the necessary
identifying assumptions. Then we present our results in terms of the average effect of dual-
credit education, the dosage effect of dual-credit education, and the heterogeneous effects of
dual-credit education.
Dual-Credit Education Programs in Texas: Phase II
AMERICAN INSTITUTES FOR RESEARCH | AIR.ORG 190
Identification Strategy
As documented in Phase I as well as Table AE.3, students who decide to enroll in dual-credit
education are different across many dimensions from students who do not participate in dual-
credit education, including race, gender, economic status, and academic preparation. While we
can control for these observable characteristics, it is likely that these students differ on
unobservable characteristics like motivation, future aspirations, work ethic, among others.
Hence, even when only controlling for observable characteristics like race/ethnicity, income,
and academic preparation, results estimating the effect of dual-credit on student outcomes will
likely be biased because factors like motivation will also likely affect how well a student
performs in high school and college.
To address this issue, we employ a quasi-experimental approach for causal inference called
instrumental variables estimation (IV). In this approach, we predict dual-credit status using a
variable (the instrument) that is uncorrelated with the educational outcomes we examine but is
correlated with dual-credit status, and then use the fitted values from that regression to predict
the outcome of interest. In doing so, this approach uses only the variation in DC that is driven
by differences in the instrument to predict the outcome of interest. In our case, we use as our
instrument the percentage of other students in a school taking dual-credit, a measure of
implementation of DC within the school, to predict a student’s dual-credit status when looking
at average effect. Thus, our analysis uses only the variation in DC participation that is driven by
differences in DC implementation over time and across schools to assess the impact of DC
participation on student outcomes. Such variation is less problematic because students are
unlikely to choose schools based on the extent to which have implemented DC programs. We
show that our instrument is highly related to DC participation, or it has a “strong first stage.”
Our identifying assumption in these models is that, conditional on the student characteristics
we include in the model and all time constant factors at the high school level, a student’s future
educational outcomes are uncorrelated with the percentage of other students in her junior
cohort taking dual-credit in a high school.
Empirical Models
We run three models using our IV approach to assess the causal impact of DC education. First,
we examine the average effect of DC education, then we look at the dosage effect of DC
education, and finally, we examine the heterogeneous effects of DC education. To assess the
average effect of DC education, we instrument for a student taking any DC education with the
DC participation rate of other students in the same cohort at the same high school. For the
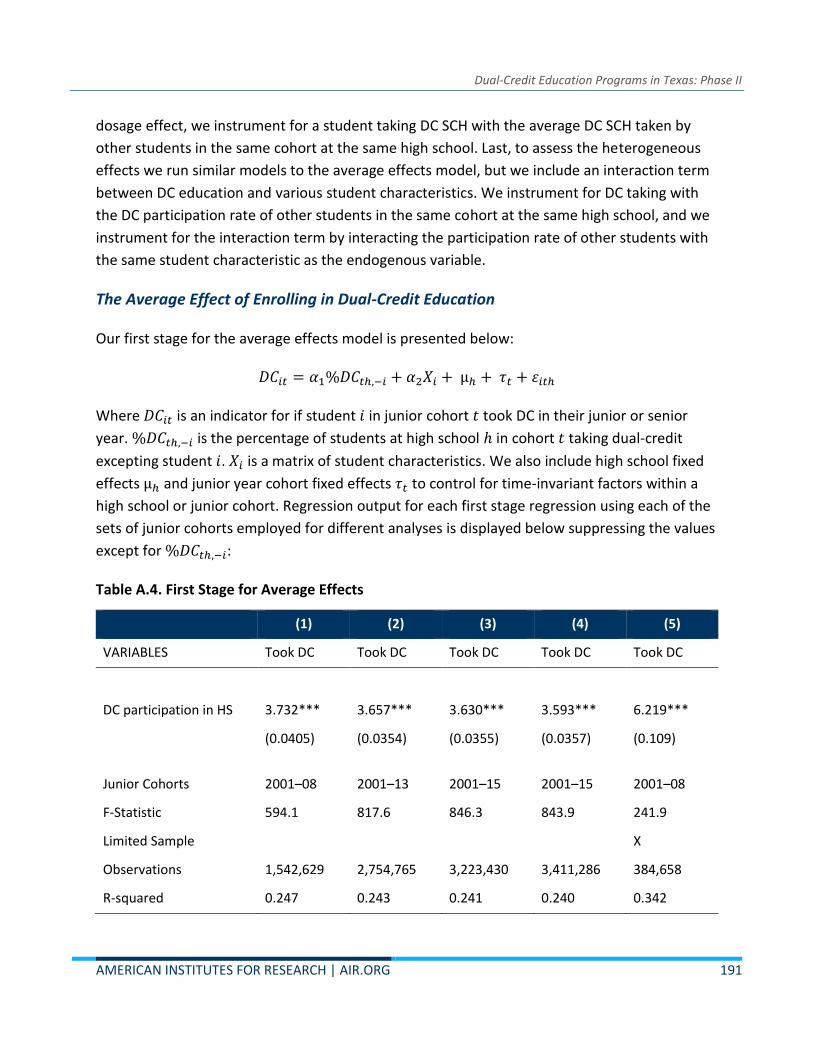
Dual-Credit Education Programs in Texas: Phase II
AMERICAN INSTITUTES FOR RESEARCH | AIR.ORG 191
dosage effect, we instrument for a student taking DC SCH with the average DC SCH taken by
other students in the same cohort at the same high school. Last, to assess the heterogeneous
effects we run similar models to the average effects model, but we include an interaction term
between DC education and various student characteristics. We instrument for DC taking with
the DC participation rate of other students in the same cohort at the same high school, and we
instrument for the interaction term by interacting the participation rate of other students with
the same student characteristic as the endogenous variable.
The Average Effect of Enrolling in Dual-Credit Education
Our first stage for the average effects model is presented below:
𝐷𝐶𝑖𝑡 = 𝛼1%𝐷𝐶𝑡ℎ,−𝑖 + 𝛼2𝑋𝑖 + µℎ + 𝜏𝑡 + 휀𝑖𝑡ℎ
Where 𝐷𝐶𝑖𝑡 is an indicator for if student 𝑖 in junior cohort 𝑡 took DC in their junior or senior
year. %𝐷𝐶𝑡ℎ,−𝑖 is the percentage of students at high school ℎ in cohort 𝑡 taking dual-credit
excepting student 𝑖. 𝑋𝑖 is a matrix of student characteristics. We also include high school fixed
effects µℎ and junior year cohort fixed effects 𝜏𝑡 to control for time-invariant factors within a
high school or junior cohort. Regression output for each first stage regression using each of the
sets of junior cohorts employed for different analyses is displayed below suppressing the values
except for %𝐷𝐶𝑡ℎ,−𝑖:
Table A.4. First Stage for Average Effects
(1) (2) (3) (4) (5)
VARIABLES Took DC Took DC Took DC Took DC Took DC
DC participation in HS 3.732*** 3.657*** 3.630*** 3.593*** 6.219***
(0.0405) (0.0354) (0.0355) (0.0357) (0.109)
Junior Cohorts 2001–08 2001–13 2001–15 2001–15 2001–08
F-Statistic 594.1 817.6 846.3 843.9 241.9
Limited Sample
X
Observations 1,542,629 2,754,765 3,223,430 3,411,286 384,658
R-squared 0.247 0.243 0.241 0.240 0.342

Dual-Credit Education Programs in Texas: Phase II
AMERICAN INSTITUTES FOR RESEARCH | AIR.ORG 192
Column 1 gives the first stage for examining four-year higher education outcomes: graduation
four-year, graduation two- or four-year, and credential two- or four-year. Column 2 gives the
first stage for examining two-year higher education outcomes: graduation two-year, certificate
two-year, credential two-year, and credential two-year or transfer to four-year. Column 3 gives
the first stage for enrolling in higher education: enroll two-year, enroll four-year, and enroll
two- or four-year. Column 4 gives the first stage for if a student graduates from high school.
Finally, Column 5 gives the first stage for the degree completion where the regression is
conditional on a student graduating from a four-year institution.
Results from the first stage model clearly suggest that our instrument is relevant for estimating
whether a student took dual-credit in high school. Typically, a strong first stage has an F-
statistic greater than 30, which is clearly satisfied using this instrument. The first stage
regressions have F-statistics greater than 500 for all specifications except for the last first stage
displayed, which has a value of 242. The first stage also suggests a positive relationship
between the instrument and taking dual-credit, which is what one would intuitively expect.
Our second stage for the average effects model is presented below:
𝑌𝑖𝑡ℎ = 𝛽1𝐷𝐶𝑖�� + 𝛽2𝑋𝑖 + µℎ + 𝜏𝑡 + 휀𝑖𝑡ℎ
Where 𝑌𝑖𝑡ℎ is the educational outcomes for student 𝑖. The notation for the second stage is the
same as the first stage. The regression output is displayed below:
Table A.5. Second Stage for Average Effects
Outcome OLS Estimate
of DC IV estimate of DC Observations Junior Cohorts
Panel A: Short-Term Academic Outcomes
HS Grad 0.0892*** 0.00641 3,411,286 2001–16
(0.00142) (0.00698)
Enroll two-year 0.0385*** 0.0164* 3,223,430 2001–15
(0.00273) (0.00857)
Enroll four-year 0.199*** 0.00671 3,223,430 2001–15
(0.00277) (0.0107)
Enroll two- or four-year 0.217*** 0.0239*** 3,223,430 2001–15
(0.00297) (0.00925)
Panel B: Long-Term Academic Outcomes

Dual-Credit Education Programs in Texas: Phase II
AMERICAN INSTITUTES FOR RESEARCH | AIR.ORG 193
Outcome OLS Estimate
of DC IV estimate of DC Observations Junior Cohorts
Graduation two-year 0.0293*** 0.00896*** 2,754,765 2001–13
(0.00107) (0.00263)
Certificate two-year 0.00723*** 0.0162*** 2,754,765 2001–13
(0.000847) (0.00238)
Credential two-year 0.0345*** 0.0218*** 2,754,765 2001–13
(0.00138) (0.00354)
Credential two-year or Transfer
0.0954*** 0.0355*** 2,754,765 2001–13
(0.00229) (0.00735)
Graduation four-year 0.209*** 0.00345 1,542,629 2001–08
(0.00318) (0.00802)
Graduation two- or four-year
0.217*** 0.00790 1,542,629 2001–08
(0.00316) (0.00812)
Credential two- or four-year
0.218*** 0.0113 1,542,629 2001–08
(0.00310) (0.00824)
Panel C: Degree Completion
Credit to Degree 2.255*** 4.199*** 384,658 2001–08
(0.285) (0.892)
Credit in College to Degree
-7.017*** -7.774*** 384,658 2001–08
(0.315) (0.921)
Time to Degree -0.318*** -0.0803*** 375,715 2001–08
(0.00766) (0.0196)
Panel D: Limited Sample of Panel A
HS Grad 0.0855*** 0.0178 1,542,629 2001–08
(0.00203) (0.0122)
Enroll two-year 0.0231*** 0.0199** 1,542,629 2001–08
(0.00387) (0.00941)
Enroll four-year 0.208*** 0.00248 1,542,629 2001–08
(0.00340) (0.0101)

Dual-Credit Education Programs in Texas: Phase II
AMERICAN INSTITUTES FOR RESEARCH | AIR.ORG 194
Outcome OLS Estimate
of DC IV estimate of DC Observations Junior Cohorts
Enroll two- or four-year 0.210*** 0.0168 1,542,629 2001–08
(0.00401) (0.0114)
Panel E: Limited Sample of Panel A
HS Grad 0.0956*** -0.0195 1,680,767 2009–15
(0.00163) (0.0131)
Enroll two-year 0.229*** 0.0199 1,680,767 2009–15
(0.00299) (0.0138)
Enroll four-year 0.199*** -0.00304 1,680,767 2009–15
(0.00284) (0.0120)
Enroll two- or four-year 0.0518*** 0.0389*** 1,680,767 2009–15
(0.00270) (0.0142)
Panel F: Graduation Windows
Grad four-year within 4 yrs of HS
0.120*** 0.0260*** 1,989,304 2001–10
(0.00242) (0.00415)
Grad four-year within 5 yrs of HS
0.176*** 0.0139** 1,989,304 2001–10
(0.00299) (0.00604)
Grad four-year within 6 yrs of HS
0.193*** 0.00914 1,989,304 2001–10
(0.00292) (0.00676)
For our results, we present the OLS estimates of the effect of dual-credit education and
compare them against our IV estimates to show the degree of bias resulting from self-selection
into dual-credit courses. This is accentuated by the IV estimate being smaller in magnitude for
most of the outcomes. For instance, the OLS estimate for graduating from a four-year college
suggests that enrolling in dual-credit programs increases a student’s likelihood of graduating
from a four-year college by 20.9 percentage points, but the IV estimates suggest dual-credit
increases the likelihood by 1.3 percentage points
Dual-Credit Education Programs in Texas: Phase II
AMERICAN INSTITUTES FOR RESEARCH | AIR.ORG 195
High School Graduation, College Enrollment and Completion
Panel A shows the impact of dual-credit education on short-term educational outcomes (e.g.,
high school graduation). Our IV estimates show that dual-credit education has a positive effect
on enrolling in a two-year college as well as enrolling in any college within two years of their
junior year in high school, but we find no significant effect on enrolling in four-year schools. We
also find no statistically significant effect of DC participation on high school graduation.
In Panel B, we look at long-term education outcomes (e.g., college completion) and find that
dual-credit education positively impacts a student’s likelihood of earning an Associate’s degree
by 0.9 percentage points, earning a two-year certificate by 1.6 percentage points, and earning
any credential from a two-year school or having an upward transfer by 3.6 percentage points.
DC education had an insignificantly positive effect on four-year outcomes. Similar to what we
saw in Panel A, the largest coefficients were concentrated in outcomes from two-year schools.
This is not surprising since most of dual-credit is delivered by community colleges, so one might
expect that the effects would be seen the strongest in two-year colleges.
Credits to Degree, Time to Degree
In Panel C, we examine the effect of dual-credit education on how many total credits (including
those earned through dual-credit programs) a student took to complete a four-year degree,
how many credits a student took in college to complete a four-year degree, and time to
complete a four-year degree. We conditioned these regressions on a student graduating from a
four-year college because a student’s credit or time to a degree would be undefined otherwise.
Results show that enrolling in dual-credit education increases the total amount of credits a
student graduates with by approximately 4 credits, but it reduces the amount of credits taken
in college by about 8 credits. We also find that dual-credit education decreases time to
competition by about a month, or the first or second summer term, on average.
Timing of Taking DC for Short-term Outcomes
In Panel D and E, we split the sample in half to examine how the effect of DC changed over time
for students. Panel D presents the effect of DC education on high school graduation and
enrollment for junior cohorts 2001–08, and Panel E presents the effect of DC on the same
outcomes for junior cohorts 2009–15. In Panel D, we find that there is a significant effect of DC
increasing the likelihood of enrolling in a two-year college on-time by 2.0 percentage points.
We find the same point estimate in Panel E, but it is insignificant, suggesting that there is less
precision in the estimate. We find insignificantly positive effects from DC education for the rest

Dual-Credit Education Programs in Texas: Phase II
AMERICAN INSTITUTES FOR RESEARCH | AIR.ORG 196
of the outcomes in Panel D. In Panel E, there’s only a significant effect from DC education
increasing the likelihood of enrolling on-time in any higher education institution by 3.9
percentage points. The results in Panel D and E suggest that there is the effect on enrolling in
two-year institution is the same over time, but the variance has been increasing over time,
resulting in a less precise estimate in Panel E. There’s also has been an increase in the effect of
DC education on enrolling in any college over time.
On-Time Graduation
Panel F measures the effect of dual-credit education on graduating from college on time. As we
reported earlier in this appendix, we follow students for 10 years after the start of their junior
year to observe if they completed a four-year degree. For this analysis, we follow juniors for 6
years, 7 year, and 8 years starting with their junior year to observe the same outcome. Results
from Panel F show that the effect of dual-credit education on the completion of a four-year
degree becomes smaller as the window of time becomes wider. Specifically, we find that dual-
credit education increases the likelihood of graduating from a four-year college within 6 years
significantly by 2.6 percentage points; within 7 years significantly by 1.4 percentage points;
within 8 years insignificantly by 0.9 percentage points, and within 10 years significantly by 0.3
percentage points. These results suggest dual-credit education gives an advantage that
becomes smaller over time as non-dual-credit students are able to catch up. These results are
consistent with our findings that DC education increases time to completion.
The Effect of the Dosage of Dual-Credit Education
Our previous section provides the average effect of enrolling in any amount of dual-credit
education. However, the effect of enrolling in dual-credit education may vary depending on the
amount of dual-credit SCH students take. To answer this question, we estimate the effect of a
single DC SCH on student outcomes using OLS. We instrument for the amount of dual-credit
SCH that a student takes with the average amount of DC SCH in a given high school taken by the
other students.
Empirical Models
The first stage equation for the dosage model is below:
𝐷𝐶_𝑆𝐶𝐻𝑖𝑡 = 𝛼1𝐷𝐶_𝑆𝐶𝐻ℎ𝑡,−𝑖 + 𝛼2𝑋𝑖 + µℎ + 𝜏𝑡 + 휀𝑖𝑡ℎ

Dual-Credit Education Programs in Texas: Phase II
AMERICAN INSTITUTES FOR RESEARCH | AIR.ORG 197
Where 𝐷𝐶_𝑆𝐶𝐻𝑖𝑡 is the amount of dual-credit SCH taken by student 𝑖 in cohort 𝑡. 𝐷𝐶_𝑆𝐶𝐻ℎ𝑡,−𝑖
gives the average dual-credit SCH taken at high school ℎ taken by students other than student 𝑖
in cohort 𝑡. 𝑋𝑖 is a matrix of observable student characteristics. We also include high school
fixed effects µℎ and junior year cohort fixed effects 𝜏𝑡 to control for time-invariant factors
within a high school or junior cohort. Regression output is displayed below suppressing the
values except for 𝐷𝐶_𝑆𝐶𝐻ℎ𝑡,−𝑖
Table A.6. First-Stage for Dosage Effects
(1) (2) (3) (4) (5)
VARIABLES DC SCH DC SCH DC SCH DC SCH DC SCH
Average DC SCH at HS 3.896*** 3.726*** 3.621*** 3.503*** 7.618*** (0.0435) (0.0356) (0.0370) (0.0381) (0.159)
Junior Cohorts 2001–08 2001–13 2001–15 2001–15 2001–08
F-Statistic 498.7 709.8 654.52 583.4 162.5
Limited Sample
X
Observations 1,542,629 2,754,765 3,223,430 3,411,286 384,658
R-squared 0.264 0.278 0.277 0.274 0.421
Column 1 gives the first stage for examining four-year higher education outcomes: graduation
four-year, graduation 2- or four-year, and credential four-year. The Column 2 gives the first
stage for examining two-year higher education outcomes: graduation two-year, certificate two-
year, credential two-year, and credential two-year or transfer to four-year. Column 3 gives the
first stage for enrolling in higher education: enroll two-year, enroll four-year, enroll 2- or four-
year. Column 4 gives the first stage for if a student graduates from high school. Finally, Column
5 gives the first stage for the degree completion where the regression is conditional on a
student graduating from a four-year institution.
Results from the first stage model clearly suggests that our instrument is relevant for estimating
how much a student took dual-credit in high school. Typically, a strong first stage has a F-
statistic greater than 30, which is clearly satisfied using this instrument. The first stage
regressions have F-statistics greater than 500 for all specifications except for the last first stage
displayed, which has a value of 170. The first stage also suggests a positive relationship
between the instrument and taking dual-credit SCH, which is what one would intuitively expect.
The first stage for the dosage effects looks similar to the first stage for the average effects.

Dual-Credit Education Programs in Texas: Phase II
AMERICAN INSTITUTES FOR RESEARCH | AIR.ORG 198
Our second stage equation for the dosage model is presented below:
𝑌𝑖𝑡ℎ = 𝛽1𝐷𝐶_𝑆𝐶𝐻𝑖𝑡 + 𝛽2𝑋𝑖 + µℎ + 𝜏𝑡 + 휀𝑖𝑡ℎ
Where 𝑌𝑖𝑡ℎ is the educational outcomes for student 𝑖. The notation for the second stage is the
same as the first stage. The regression output is displayed below:
Table A.7. Second Stage for Dosage Effects
OLS IV
Outcomes DC Credit SCH DC Credit SCH Observations
Panel A: Short-Term Academic Outcomes
HS Grad 0.00518*** 0.000246 3,411,286 (0.000113) (0.000442)
Enroll two-year 0.000596*** -0.000770 3,223,430 (0.000179) (0.000580)
Enroll four-year 0.0137*** 0.00169*** 3,223,430 (0.000239) (0.000630)
Enroll two- or four-year 0.0129*** 0.000931 3,223,430 (0.000262) (0.000575)
Panel B: Long-Term Academic Outcomes
Graduation two-year 0.00301*** 0.00120*** 2,754,765 (0.000181) (0.000217)
Certificate two-year 0.000922*** 0.00154*** 2,754,765 (0.000110) (0.000209)
Credential two-year 0.00373*** 0.00243*** 2,754,765 (0.000206) (0.000303)
Credential two-year or Transfer 0.00675*** 0.00273*** 2,754,765 (0.000206) (0.000491)
Graduation four-year 0.0162*** 0.00119** 1,542,629 (0.000315) (0.000575)
Graduation two- or four-year 0.0169*** 0.00172*** 1,542,629 (0.000311) (0.000595)
Credential two- or four-year 0.0172*** 0.00212*** 1,542,629 (0.000298) (0.000611)
Panel C: Degree Completion
Credit to Degree 0.330*** 0.335*** 384,658 (0.0210) (0.0515)
Credit in College to Degree -0.670*** -0.665*** 384,658 (0.0210) (0.0515)
Time to Degree -0.0268*** -0.00740*** 375,715 (0.000527) (0.00119)

Dual-Credit Education Programs in Texas: Phase II
AMERICAN INSTITUTES FOR RESEARCH | AIR.ORG 199
OLS IV
Panel D: Limited Sample of Panel A
HS Grad 0.00598*** 0.000762 1,542,629 (0.000150) (0.000864)
Enroll two-year 6.41e-05 0.000346 1,542,629 (0.000310) (0.000818)
Enroll four-year 0.0160*** 0.00191** 1,542,629 (0.000302) (0.000745)
Enroll two- or four-year 0.0145*** 0.00185* 1,542,629 (0.000374) (0.000964)
Panel E: Limited Sample of Panel A
HS Grad 0.00524*** -0.00117 1,680,767 (0.000130) (0.000761)
Enroll two-year 0.00100*** 0.000983 1,680,767 (0.000174) (0.000879)
Enroll four-year 0.0131*** -0.000429 1,680,767 (0.000250) (0.000768)
Enroll two- or four-year 0.0128*** -0.000197 1,680,767 (0.000275) (0.000773)
Panel F: Graduation Windows
Grad four-year within 4 yrs of HS 0.0103*** 0.00237*** 1,989,304 (0.000230) (0.000288)
Grad four-year within 5 yrs of HS 0.0137*** 0.00154*** 1,989,304 (0.000283) (0.000408)
Grad four-year within 6 yrs of HS 0.0146*** 0.00115** 1,989,304 (0.000286) (0.000458)
Main Results
Similar to the average effects regression output, we present the OLS estimates with the IV
estimates for comparison to show the same pattern of positive selection seen in the average
effects sections. Similar to the average effects of dual-credit education on student outcomes,
we find that for most student outcomes the OLS estimates are larger in magnitude than the IV
estimates. To examine the effect of one dual-credit course, which is typically 3 SCH, one would
multiply the coefficients given by 3.
In Panel A, we find that for taking additional DC SCH, a student’s chances of enrolling in a four-
year university is increased by 0.17 percentage points and statistically significant. However, we
find an insignificant effect on enrolling in a two-year, which differs from what we found in the
average effects. However, the results in Panel B are consistent with the previous results for
average effects. In particular, all of the two-year outcomes are significantly positively affected

Dual-Credit Education Programs in Texas: Phase II
AMERICAN INSTITUTES FOR RESEARCH | AIR.ORG 200
by dual-credit. The average DC student takes about 10 DC SCH, and if one multiplies these
effects by 10, then the estimates given by the dosage effect are about the same as the average
effect estimates. For example, the average effect of DC education increases the likelihood of
getting a certificate from a two-year school by 1.62 percentage points. We find that the effect
for taking a 1 DC SCH increases the likelihood of earning a certificate from a two-year school by
0.15 percentage points. The average DC student takes about 10 DC SCH, so our dosage
estimates suggest that the average student would increase the likelihood of earning a
certificate from a two-year school by 1.5 percentage points.
The dosage effects differ from the average effects though when examining four-year outcomes.
Our dosage model suggests that the four-year outcomes are significantly and positively affected
by one additional DC SCH, but DC education has no significant effect on four-year outcomes in
our average effect model.
We find similar effects in Panel C for both dosage and average effects. Our results suggest that
DC SCH works as a substitute for credits in college. One additional DC SCH increases the total
SCH taken to a four-year degree by 0.335, and it decreases the total credits taken in college to a
four-year degree by 0.665. This suggests that DC courses and regular college courses are
substitutes but not perfectly.
In Panel D and E, we split the sample in half to see how the effect of DC education changes over
time for the dosage effects. In Panel D, we find a significant effect for enrolling in a four-year
and any college with an additional DC SCH increasing the likelihood by 0.2 percentage points for
both outcomes. We find no significant effect for any outcome examined in Panel E, suggesting
that there is a decrease the effect of the dosage in DC SCH.
Panel F gives the effect of DC dosage on graduating from college by different time windows. For
this analysis, we follow juniors for 6 years, 7 years, and 8 years starting with their junior year to
observe graduation from four-year colleges. Results from Panel F show that the effect of dual-
credit education on the completion of a four-year degree becomes smaller as the window of
time becomes wider. These results are consistent in terms of sign and magnitude to what we
saw in Panel F for the average effects. Specifically, we find that an additional DC SCH increases
the likelihood of graduating from a four-year college within 6 years significantly by 0.24
percentage points; within 7 years significantly by 0.15 percentage points; within 8 years
insignificantly by 0.12 percentage points, and within 10 years significantly by 0.12 percentage
points. To find the average effect, one would multiply these effects by 10, which is the average
amount of DC SCH taken by students participating in DC, then these estimates are similar in

Dual-Credit Education Programs in Texas: Phase II
AMERICAN INSTITUTES FOR RESEARCH | AIR.ORG 201
magnitude to what we found in the average effects model. These results suggest dual-credit
education gives an advantage that becomes smaller over time as non-dual-credit students are
able to catch up. These results are consistent with our findings that DC education increases
time to completion.
Heterogeneous Effect of Dual-Credit Education
For this section of the appendix, we examine the average effect of dual-credit education by
student sub group. To conduct this analysis, we employed an empirical model similar to the one
that examined the average effect of dual-credit education on student outcomes. The only
difference is that in this particular model, we included a term that interacts enrolling in dual-
credit education with certain student characteristics. Formally, we estimate these equations:
With the first stage equations:
For 𝑗 = 1 to 𝑗 = 𝐽:
𝐷𝐶𝑖𝑡 = 𝛼0%𝐷𝐶𝑡ℎ,−𝑖 + 𝛼𝑗%𝐷𝐶𝑡ℎ,−𝑖 ∗ 𝑥𝑖𝑗 + 𝜙0𝑋𝑖 + µℎ + 𝜏𝑡 + 휀𝑖𝑡ℎ
𝐷𝐶𝑖𝑡 ∗ 𝑥𝑖𝑗 = 𝜃0%𝐷𝐶𝑡ℎ,−𝑖 + 𝜃𝑗%𝐷𝐶𝑡ℎ,−𝑖 ∗ 𝑥𝑖𝑗 + 𝜙𝑗𝑋𝑖 + µℎ + 𝜏𝑡 + 휀𝑖𝑡ℎ
IV equations:
For 𝑗 = 1 to 𝑗 = 𝐽:
𝑌𝑖𝑡ℎ = 𝛽0𝐷𝐶𝑖�� + 𝛽𝑗𝐷𝐶𝑖𝑡 ∗ 𝑥𝑖𝑗 + 𝛾1𝑋𝑖 + 𝛾2𝑍𝑡ℎ + µℎ + 𝜏𝑡 + 휀𝑖𝑡ℎ
Our notation is the same as the previous equations. 𝑋𝑖 is a 𝐾𝑥1 vector of observable student-
level characteristics such that 𝐾 ≥ 𝐽. 𝑥𝑖𝑗 is characteristic 𝑗 of student 𝑖 in cohort 𝑡. The 𝐽
characteristics that we interact for are sex, race, normalized eighth-grade test scores and if they
are designated by TEA as economically disadvantaged.
𝛽0 gives the effect of dual-credit for students that lack characteristic 𝑗, and 𝛽𝑗 gives the
differential effect of dual-credit education for student with characteristic 𝑗. 𝛽0 + 𝛽𝑗 gives the
total effect of dual-credit for students with characteristic 𝑗. This differs for normalized eighth-
grade test scores since the mean test score gives a value of 0. In this instance, 𝛽0 represents the
effect of dual-credit for a student with average eighth-grade test scores, and 𝛽0 + 𝛽𝑗 gives the
total effect of dual-credit for students with a test score of one standard deviation higher than
the average. We display the total effect for those that do and do not receive free/reduced

Dual-Credit Education Programs in Texas: Phase II
AMERICAN INSTITUTES FOR RESEARCH | AIR.ORG 202
priced lunch in Table AE.8. We display the effect of DC for students with average eighth-grade
test scores and those with a one standard deviation increase in test scores in Table AE.9, and
we display the effect of DC by race in Table AE.10.
Disadvantaged Students
We define disadvantaged students as students who are eligible for free or reduced priced
lunch. The results show that the impact of dual credit participation for students who are eligible
for free or reduced price lunch is less than that for students who are ineligible, and is negative
in most cases. For example, our estimates suggest that dual credit participation reduces college
enrollment by 3.2 percentage points and reduces college completion by 6.7 percentage points
for free and reduced price lunch eligible students. However, we also find that participation in
dual-credit increases the likelihood of earning a certificate by 2.1 percentage points for these
students.
Table A.8. Heterogeneous Effects of DC for Students Eligible and Ineligible for Free or
Reduced-Price Lunch
(1) (2)
Variables Ineligible for Free or Reduced-Price Lunch
Eligible for Free or Reduced-Price Lunch
Panel A: Short-Term Academic Outcomes
HS graduation 0.0243*** -0.0257** (0.00624) (0.0106)
Enrollment two-year 0.0205*** 0.00874 (0.00794) (0.0139)
Enrollment four-year 0.0375*** -0.0497*** (0.00971) (0.0144)
Enrollment two- or four-year 0.0545*** -0.0320** (0.00977) (0.0141)
Panel B: Long-Term Academic Outcomes
Graduate two-year 0.0128*** 0.00169 (0.00267) (0.00400)
Certificate two-year 0.0136*** 0.0210*** (0.00194) (0.00372)
Credential two-year 0.0230*** 0.0196*** (0.00333) (0.00552)
Credential two-year or Transfer 0.0458*** 0.0161 (0.00627) (0.0122)
Graduate four-year 0.0369*** -0.0736***

Dual-Credit Education Programs in Texas: Phase II
AMERICAN INSTITUTES FOR RESEARCH | AIR.ORG 203
(0.00845) (0.0152)
Graduate two- or four-year 0.0416*** -0.0697*** (0.00851) (0.0154)
Credential two- or four-year 0.0452*** -0.0669*** (0.00864) (0.0156)
Panel C: Degree Completion
Credit to Degree 4.711*** 2.313 (0.911) (1.430)
Credit in College to Degree -7.442*** -9.774*** (0.933) (1.482)
Time to Degree -0.0746*** -0.111*** (0.0196) (0.0361)
Panel D: Limited Sample of Panel A
HS Grad 0.0388*** -0.0307 (0.0105) (0.0197)
Enroll two-year 0.0289*** -0.000962 (0.00928) (0.0164)
Enroll four-year 0.0247** -0.0487** (0.00974) (0.0176)
Enroll two- or four-year 0.0451*** -0.0483*** (0.0113) (0.0208)
Panel E: Other Limited Sample of Panel A
HS Grad 0.0142 -0.0588*** (0.0108) (0.0170)
Enroll two-year 0.0622*** 0.0116 (0.0132) (0.0182)
Enroll four-year 0.0503*** -0.0654*** (0.0116) (0.0159)
Enroll two- or four-year 0.0952*** -0.0682*** (0.0138) (0.0191)
Panel F: Graduation Windows
Grad four-year within 4 yrs of HS 0.0513*** -0.0255*** (0.00440) (0.00666)
Grad four-year within 5 yrs of HS 0.0446*** -0.0484*** (0.00656) (0.0103)
Grad four-year within 6 yrs of HS 0.0416*** -0.0570*** (0.00727) (0.0115)

Dual-Credit Education Programs in Texas: Phase II
AMERICAN INSTITUTES FOR RESEARCH | AIR.ORG 204
High Achieving Students
We find nearly universally significantly positive effects from dual-credit education on high-
achieving students. Students who score one standard deviation above the average on
standardized tests in eighth-grade reading and mathematics have significantly positive effects
for nearly all outcomes. It is also notable for these high achieving students that dual-credit
seems to more positively affect outcomes related four-year graduation and enrollment instead
of two-year graduation and enrollment. This differs from the average effect from dual-credit
education which showed larger effects for outcomes related to two-year colleges like enrolling
in two-year college and graduating from two-year colleges. Students that have high tests scores
on reading, one standard deviation above the mean score, are 5.8 percentage points more
likely to enroll in any college and 5.3 percentage points to graduate from any college. The
results are similar for mathematics test scores with DC positively affecting enrollment and
completion by 4.2 and 3.3 percentage points, respectively.
Participating in dual-credit education decreased college completion overall by 3.2 percentage
points for students with average eight grade standardized test scores in reading, while the
effect for students with average mathematics scores was negative but statistically insignificant.
At the same time, dual credit participation also increased high school completion by 1.8
percentage points for students with average eighth grade reading scores, and increased
completion or upward transfer from two year colleges by about 3.9 percentage points for
students with average standardized test scores in both reading and mathematics. Students
with average reading and math eighth-grade test scores also graduate more quickly after taking
DC education than their peers with higher test scores. A possible explanation for this finding is
that higher ability students might be less likely to be able to transfer dual credit courses to their
particular major. On average, students with average reading scores graduate 0.17 years (62
days) more quickly following DC education compared with students with reading scores one
standard deviation above the mean, who graduate 0.04 years (15 days) more quickly following
DC education.
Table A.9. Heterogeneous Effects of DC for Students by Eighth-Grade Test Scores
(1) (2) (3) (4)
Variables Avg. Reading Score +1 Std. Dev. Above Avg.
Reading Score
Avg. Mathematics
Score
+1 Std. Dev. Above Avg.
Mathematics Score
Panel A: Short-Term Academic Outcomes
HS graduation 0.0183* -0.00858 0.0121 0.000544
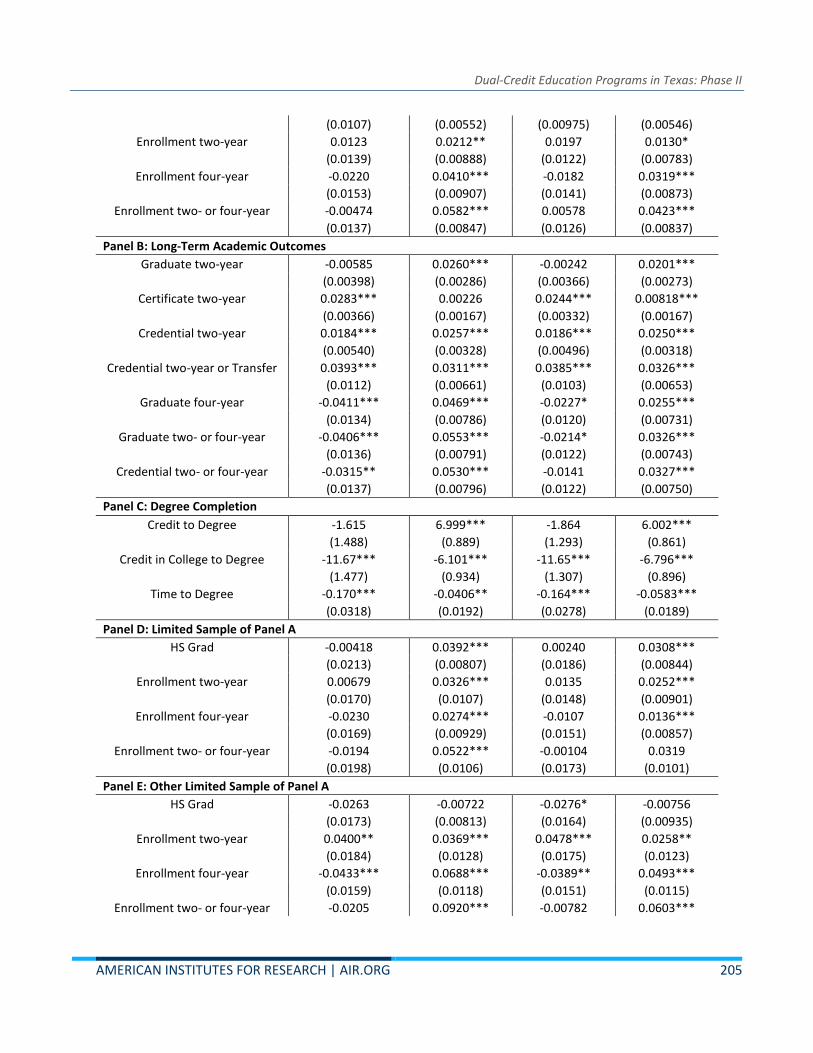
Dual-Credit Education Programs in Texas: Phase II
AMERICAN INSTITUTES FOR RESEARCH | AIR.ORG 205
(0.0107) (0.00552) (0.00975) (0.00546)
Enrollment two-year 0.0123 0.0212** 0.0197 0.0130* (0.0139) (0.00888) (0.0122) (0.00783)
Enrollment four-year -0.0220 0.0410*** -0.0182 0.0319*** (0.0153) (0.00907) (0.0141) (0.00873)
Enrollment two- or four-year -0.00474 0.0582*** 0.00578 0.0423*** (0.0137) (0.00847) (0.0126) (0.00837)
Panel B: Long-Term Academic Outcomes
Graduate two-year -0.00585 0.0260*** -0.00242 0.0201*** (0.00398) (0.00286) (0.00366) (0.00273)
Certificate two-year 0.0283*** 0.00226 0.0244*** 0.00818*** (0.00366) (0.00167) (0.00332) (0.00167)
Credential two-year 0.0184*** 0.0257*** 0.0186*** 0.0250*** (0.00540) (0.00328) (0.00496) (0.00318)
Credential two-year or Transfer 0.0393*** 0.0311*** 0.0385*** 0.0326*** (0.0112) (0.00661) (0.0103) (0.00653)
Graduate four-year -0.0411*** 0.0469*** -0.0227* 0.0255*** (0.0134) (0.00786) (0.0120) (0.00731)
Graduate two- or four-year -0.0406*** 0.0553*** -0.0214* 0.0326*** (0.0136) (0.00791) (0.0122) (0.00743)
Credential two- or four-year -0.0315** 0.0530*** -0.0141 0.0327*** (0.0137) (0.00796) (0.0122) (0.00750)
Panel C: Degree Completion
Credit to Degree -1.615 6.999*** -1.864 6.002*** (1.488) (0.889) (1.293) (0.861)
Credit in College to Degree -11.67*** -6.101*** -11.65*** -6.796*** (1.477) (0.934) (1.307) (0.896)
Time to Degree -0.170*** -0.0406** -0.164*** -0.0583*** (0.0318) (0.0192) (0.0278) (0.0189)
Panel D: Limited Sample of Panel A
HS Grad -0.00418 0.0392*** 0.00240 0.0308*** (0.0213) (0.00807) (0.0186) (0.00844)
Enrollment two-year 0.00679 0.0326*** 0.0135 0.0252*** (0.0170) (0.0107) (0.0148) (0.00901)
Enrollment four-year -0.0230 0.0274*** -0.0107 0.0136*** (0.0169) (0.00929) (0.0151) (0.00857)
Enrollment two- or four-year -0.0194 0.0522*** -0.00104 0.0319 (0.0198) (0.0106) (0.0173) (0.0101)
Panel E: Other Limited Sample of Panel A
HS Grad -0.0263 -0.00722 -0.0276* -0.00756 (0.0173) (0.00813) (0.0164) (0.00935)
Enrollment two-year 0.0400** 0.0369*** 0.0478*** 0.0258** (0.0184) (0.0128) (0.0175) (0.0123)
Enrollment four-year -0.0433*** 0.0688*** -0.0389** 0.0493*** (0.0159) (0.0118) (0.0151) (0.0115)
Enrollment two- or four-year -0.0205 0.0920*** -0.00782 0.0603***

Dual-Credit Education Programs in Texas: Phase II
AMERICAN INSTITUTES FOR RESEARCH | AIR.ORG 206
(0.0185) (0.0112) (0.0174) (0.0117)
Panel F: Graduation Windows
Grad four-year within 4 yrs of HS -0.0120* 0.0680*** -0.00577 0.0561*** (0.00643) (0.00530) (0.00582) (0.00488)
Grad four-year within 5 yrs of HS -0.0255*** 0.0574*** -0.0158* 0.0421*** (0.00947) (0.00690) (0.00857) (0.00628)
Grad four-year within 6 yrs of HS -0.0290*** 0.0513*** -0.0190** 0.0358*** (0.0104) (0.00720) (0.00945) (0.00664)
Race/Ethnicity
We also run the models by race/ethnicity and find significant positive effects for Hispanic and
Black students on enrolling in a two-year college or in enrolling in any college. DC education
increases the likelihood of on-time enrollment at a two-year college for Black and Hispanic
students by 4.7 and 4.3 percentage points, respectively. There is also a positive effect on long-
term outcomes for Hispanic students for two-year colleges. After taking dual-credit education,
Hispanic students are more likely to graduate or earn a certificate from a two-year college as
well as more likely to have a transfer to a four-year college. However, we do not find this effect
for Black students, who appear to be less likely to graduate from a two-year school following
dual-credit education. Dual-credit education does not appear to significantly affect four-year
college outcomes for Black and Hispanic students. Hispanic students that take DC education
also appear to graduate from four-year colleges at a faster rate, reducing their time to degree
by 0.17 years or 62 days.
Table A.10. Heterogenous Effects of DC for Students by Race
(1) (2) (3) (4) (5)
Variables Asian Black Hispanic Other Race White
Panel A: Short-Term Academic Outcomes
HS graduation -0.0349 0.0243 0.00203 0.0180 0.00898 (0.0228) (0.0170) (0.00943) (0.0170) (0.00672)
Enrollment two-year -0.0828*** 0.0474** 0.0433*** 0.000829 -0.00184 (0.0293) (0.0200) (0.0122) (0.0213) (0.00795)
Enrollment four-year -0.0791*** -0.00309 -0.00352 0.0138 0.0199* (0.0298) (0.0208) (0.0140) (0.0228) (0.0101)
Enrollment two- or four-year -0.135*** 0.0466** 0.0451*** 0.0278 0.0139 (0.0360) (0.0194) (0.0127) (0.0228) (0.00994)
Panel B: Long-Term Academic Outcomes
Graduate two-year 0.0164 -0.0185*** 0.0157*** 0.00961 0.00785*** (0.0164) (0.00477) (0.00385) (0.0105) (0.00254)
Certificate two-year 0.00473* -0.000627 0.0270*** 0.0113** 0.0118***

Dual-Credit Education Programs in Texas: Phase II
AMERICAN INSTITUTES FOR RESEARCH | AIR.ORG 207
(0.00280) (0.00362) (0.00392) (0.00555) (0.00195)
Credential two-year 0.0203 -0.0195*** 0.0388*** 0.0205* 0.0161*** (0.0165) (0.00594) (0.00556) (0.0120) (0.00310)
Credential two-year or Transfer -0.0731*** -0.00501 0.0543*** 0.0145*** 0.0339*** (0.0272) (0.0122) (0.0111) (0.0197) (0.00611)
Graduate four-year -0.110*** -0.0124 -0.0119 -0.0311 0.0187** (0.0306) (0.0229) (0.0127) (0.0397) (0.00884)
Graduate two- or four-year -0.108*** -0.0175 -0.00564 -0.00257 0.0232*** (0.0304) (0.0225) (0.0127) (0.0414) (0.00888)
Credential two- or four-year -0.107*** -0.0233 -0.000737 -0.0114 0.0270*** (0.0300) (0.0227) (0.0128) (0.0420) (0.00900)
Panel C: Degree Completion
Credit to Degree 7.821*** 2.884 3.854*** -5.074 4.393*** (2.790) (2.574) (1.457) (6.658) (0.939)
Credit in College to Degree -5.563** -7.325*** -8.590*** -16.31** -7.729*** (2.574) (2.566) (1.442) (6.648) (0.969)
Time to Degree 0.0779 -0.0537 -0.165*** -0.336** -0.0626*** (0.0601) (0.0492) (0.0316) (0.157) (0.0198)
Panel D: Limited Sample of Panel A
HS Grad 0.0124 -0.00987 -0.00878 0.0438 0.0360*** (0.0182) (0.0380) (0.0168) (0.0371) (0.00999)
Enrollment two-year -0.0964*** -0.00122 0.0311*** 0.0534 0.0205** (0.0271) (0.0258) (0.0155) (0.0427) (0.00923)
Enrollment four-year -0.0924*** -0.000180 0.00202 -0.00589 0.00695 (0.0288) (0.0275) (0.0155) (0.0369) (0.00983)
Enrollment two- or four-year -0.162*** -0.00757 0.0279 0.0494 0.0205* (0.0357) (0.0264) (0.0178) (0.0467) (0.0114)
Panel E: Other Limited Sample of Panel A
HS Grad -0.0326 0.0139 -0.0314** -0.0209 -0.0112 (0.0360) (0.0204) (0.0155) (0.0215) (0.0119)
Enrollment two-year -0.0664 0.0583** 0.0385** 0.0186 0.0444*** (0.0423) (0.0272) (0.0172) (0.0259) (0.0133)
Enrollment four-year -0.0633* -0.0430* -0.00988 -0.0246 0.0239* (0.0372) (0.0235) (0.0146) (0.0252) (0.0122)
Enrollment two- or four-year -0.136*** 0.00387 0.0116 -0.00476 0.0508*** (0.0504) (0.0278) (0.0169) (0.0263) (0.0137)
Panel F: Graduation Windows
Grad four-year within 4 yrs of HS -0.00212 0.00205 -0.00355 0.0326 0.0485*** (0.0186) (0.00966) (0.00613) (0.0216) (0.00474)
Grad four-year within 5 yrs of HS -0.0617** 0.00189 -0.00786 0.0280 0.0319***
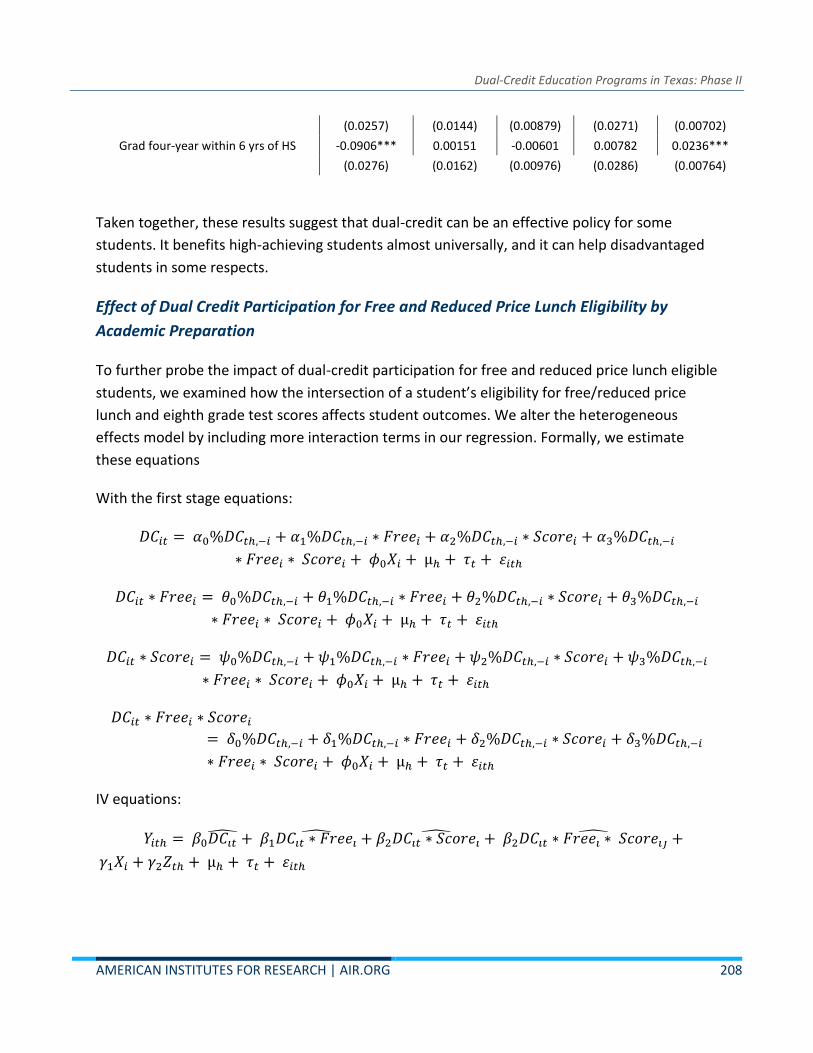
Dual-Credit Education Programs in Texas: Phase II
AMERICAN INSTITUTES FOR RESEARCH | AIR.ORG 208
(0.0257) (0.0144) (0.00879) (0.0271) (0.00702)
Grad four-year within 6 yrs of HS -0.0906*** 0.00151 -0.00601 0.00782 0.0236*** (0.0276) (0.0162) (0.00976) (0.0286) (0.00764)
Taken together, these results suggest that dual-credit can be an effective policy for some
students. It benefits high-achieving students almost universally, and it can help disadvantaged
students in some respects.
Effect of Dual Credit Participation for Free and Reduced Price Lunch Eligibility by
Academic Preparation
To further probe the impact of dual-credit participation for free and reduced price lunch eligible
students, we examined how the intersection of a student’s eligibility for free/reduced price
lunch and eighth grade test scores affects student outcomes. We alter the heterogeneous
effects model by including more interaction terms in our regression. Formally, we estimate
these equations
With the first stage equations:
𝐷𝐶𝑖𝑡 = 𝛼0%𝐷𝐶𝑡ℎ,−𝑖 + 𝛼1%𝐷𝐶𝑡ℎ,−𝑖 ∗ 𝐹𝑟𝑒𝑒𝑖 + 𝛼2%𝐷𝐶𝑡ℎ,−𝑖 ∗ 𝑆𝑐𝑜𝑟𝑒𝑖 + 𝛼3%𝐷𝐶𝑡ℎ,−𝑖
∗ 𝐹𝑟𝑒𝑒𝑖 ∗ 𝑆𝑐𝑜𝑟𝑒𝑖 + 𝜙0𝑋𝑖 + µℎ + 𝜏𝑡 + 휀𝑖𝑡ℎ
𝐷𝐶𝑖𝑡 ∗ 𝐹𝑟𝑒𝑒𝑖 = 𝜃0%𝐷𝐶𝑡ℎ,−𝑖 + 𝜃1%𝐷𝐶𝑡ℎ,−𝑖 ∗ 𝐹𝑟𝑒𝑒𝑖 + 𝜃2%𝐷𝐶𝑡ℎ,−𝑖 ∗ 𝑆𝑐𝑜𝑟𝑒𝑖 + 𝜃3%𝐷𝐶𝑡ℎ,−𝑖
∗ 𝐹𝑟𝑒𝑒𝑖 ∗ 𝑆𝑐𝑜𝑟𝑒𝑖 + 𝜙0𝑋𝑖 + µℎ + 𝜏𝑡 + 휀𝑖𝑡ℎ
𝐷𝐶𝑖𝑡 ∗ 𝑆𝑐𝑜𝑟𝑒𝑖 = 𝜓0%𝐷𝐶𝑡ℎ,−𝑖 + 𝜓1%𝐷𝐶𝑡ℎ,−𝑖 ∗ 𝐹𝑟𝑒𝑒𝑖 + 𝜓2%𝐷𝐶𝑡ℎ,−𝑖 ∗ 𝑆𝑐𝑜𝑟𝑒𝑖 + 𝜓3%𝐷𝐶𝑡ℎ,−𝑖
∗ 𝐹𝑟𝑒𝑒𝑖 ∗ 𝑆𝑐𝑜𝑟𝑒𝑖 + 𝜙0𝑋𝑖 + µℎ + 𝜏𝑡 + 휀𝑖𝑡ℎ
𝐷𝐶𝑖𝑡 ∗ 𝐹𝑟𝑒𝑒𝑖 ∗ 𝑆𝑐𝑜𝑟𝑒𝑖
= 𝛿0%𝐷𝐶𝑡ℎ,−𝑖 + 𝛿1%𝐷𝐶𝑡ℎ,−𝑖 ∗ 𝐹𝑟𝑒𝑒𝑖 + 𝛿2%𝐷𝐶𝑡ℎ,−𝑖 ∗ 𝑆𝑐𝑜𝑟𝑒𝑖 + 𝛿3%𝐷𝐶𝑡ℎ,−𝑖
∗ 𝐹𝑟𝑒𝑒𝑖 ∗ 𝑆𝑐𝑜𝑟𝑒𝑖 + 𝜙0𝑋𝑖 + µℎ + 𝜏𝑡 + 휀𝑖𝑡ℎ
IV equations:
𝑌𝑖𝑡ℎ = 𝛽0𝐷𝐶𝑖�� + 𝛽1𝐷𝐶𝑖𝑡 ∗ 𝐹𝑟𝑒𝑒𝑖 + 𝛽2𝐷𝐶𝑖𝑡 ∗ 𝑆𝑐𝑜𝑟𝑒𝑖
+ 𝛽2𝐷𝐶𝑖𝑡 ∗ 𝐹𝑟𝑒𝑒𝑖 ∗ 𝑆𝑐𝑜𝑟𝑒𝑖𝑗 +
𝛾1𝑋𝑖 + 𝛾2𝑍𝑡ℎ + µℎ + 𝜏𝑡 + 휀𝑖𝑡ℎ

Dual-Credit Education Programs in Texas: Phase II
AMERICAN INSTITUTES FOR RESEARCH | AIR.ORG 209
Our notation is the same as the previous equation with two exceptions. 𝐹𝑟𝑒𝑒𝑖 is an indicator for
if student 𝑖 is eligible for free/reduced price lunch, and 𝑆𝑐𝑜𝑟𝑒𝑖 is the normalized eighth-grade
math or reading score for student 𝑖. The interpretation of these coefficients is that 𝛽0
represents the effect of dual-credit for a student that is not eligible for free/reduced price lunch
with average eighth-grade test scores, 𝛽0 + 𝛽1 represents the effect of dual-credit for a
student that is eligible for free/reduced price lunch with average eighth-grade test scores, 𝛽0 +
𝛽2 represents the effect of dual-credit for a student that is not eligible for free/reduced price
lunch with a test score of one standard deviation higher than the average, and finally, 𝛽0 +
𝛽1 + 𝛽2 + 𝛽4 represents the effect of dual-credit for a student that is eligible for free/reduced
price lunch with a test score of one standard deviation higher than the average. We display
these combined coefficients in Table A.11.
Table A.11. Heterogeneous Effects of DC for Students by Eligibility for Free/Reduced Price
Lunch and Eighth-Grade Reading Test Scores
Ineligible for Free/Reduced Price Lunch Eligible for Free/Reduced Price Lunch
Avg Eighth Grade Reading Score
+1 Std. Dev. Above Avg Reading Score
Avg Eighth Grade Reading Score
+1 Std. Dev. Above Avg Reading Score
Panel A: Short-Term Academic Outcomes
HS graduation 0.0665*** -0.00959* -0.0264* -0.0182*
(0.0100) (0.00531) (0.0137) (0.00967)
Enrollment two-year 0.0444*** 0.00780 -0.00927 0.0445***
(0.0125) (0.00948) (0.0195) (0.0120)
Enrollment four-year
0.0324** 0.0415*** -0.0738*** 0.0258*
(0.0137) (0.00923) (0.0184) (0.0144)
Enrollment two- or four-year
0.0766*** 0.0432*** -0.0719*** 0.0725***
(0.0149) (0.0104) (0.0186) (0.0109)
Panel B: Long-Term Academic Outcomes
Credential two-year or Transfer
0.0696*** 0.0283*** 0.0119 0.0295***
(0.0105) (0.00749) (0.0151) (0.00991)
Graduate four-year 0.0134 0.0517*** -0.106*** 0.0194
(0.0134) (0.00874) (0.0196) (0.0159)
Credential two- or four-year
0.0324** 0.0541*** -0.104*** 0.0338**
(0.0137) (0.00884) (0.0204) (0.0161)

Dual-Credit Education Programs in Texas: Phase II
AMERICAN INSTITUTES FOR RESEARCH | AIR.ORG 210
Table A.12. Heterogeneous Effects of DC for Students by Eligibility for Free/Reduced Price
Lunch and Eighth-Grade Math Test Scores
Ineligible for Free/Reduced Price Lunch Eligible for Free/Reduced Price Lunch
Variables Avg Eighth Grade
Math Score +1 Std. Dev. Above Avg
Math Score Avg Eighth Grade
Math Score +1 Std. Dev. Above Avg
Math Score
Panel A: Short-Term Academic Outcomes
HS graduation 0.0469*** 0.0108** -0.0283** -0.0176**
(0.00884) (0.00547) (0.0132) (0.00827)
Enrollment two-year
0.0458*** 0.0121 -0.00583 0.0249**
(0.0107) (0.00836) (0.0184) (0.0103)
Enrollment four-year
0.0275** 0.0428*** -0.0694*** 0.0125
(0.0127) (0.00917) (0.0176) (0.0119)
Enrollment two- or four-year
0.0721*** 0.0500*** -0.0642*** 0.0401***
(0.0130) (0.0101) (0.0176) (0.00972)
Panel B: Long-Term Academic Outcomes
Credential two-year or Transfer
0.0650*** 0.0363*** 0.00969 0.0295***
(0.00927) (0.00670) (0.0146) (0.00971)
Graduate four-year 0.0279** 0.0395*** -0.0954*** -0.00694
(0.0121) (0.00839) (0.0186) (0.0136)
Credential two- or four-year
0.0435*** 0.0454*** -0.0942*** 0.00675
(0.0123) (0.00857) (0.0193) (0.0136)
Tables A.11 and A.12 show how the intersection of eligibility for free/reduced price lunch and
test scores changes the effect of DC education. These results seem consistent with our previous
results showing that students that are eligible for free/reduced price lunch have negative
outcomes after taking DC education, and student with high eighth grade test scores see more
gains from DC education. Interestingly though, students that are both eligible for free/reduced
price lunch and have high test scores have significant and positive outcomes. In particular,
students that are eligible for free/reduced price lunch and have average eighth grade reading
scores are less likely to enroll in college by 7.2 percentage points after taking DC education, but
the students with similar eligibility but with a one standard deviation above the mean in their
eighth grade reading scores are 7.3 percentage points more likely to enroll in college after DC
education. We find a similar pattern with college completion. Free/reduced price lunch eligible
students with average reading scores are 10 percentage points less likely to complete college,

Dual-Credit Education Programs in Texas: Phase II
AMERICAN INSTITUTES FOR RESEARCH | AIR.ORG 211
but students with similar eligibility but with a one standard deviation above the mean in their
eighth grade reading scores are 3.4 percentage points more likely to complete college. We find
a similar pattern based on eighth grade math scores.
When looking at students that are eligible for free/reduced price lunch, many of the outcomes
are negatively affected by DC education as evidenced in Table A.8. However, once include
interaction terms to account for differences in eighth grade test scores, we find that many of
these significantly negative effects become no different from zero or in some cases positive for
high-achieving students. This is not surprising given that Table A.9 demonstrates that students
with higher eighth grade test scores have more positive effects from taking DC courses. Tables
A.11 and A.12 demonstrate that when we simultaneously control for these two characteristics,
we find that the positive effects from having a high eighth grade test score outweighs the
negative effects from being eligible for free/reduced price lunch.
Racial Disparities Study: Methods and Results
In this section, we explain the methods and results for the analysis describing racial disparities
in the DC participation. We used a regression analysis to determine how different factors
contributed to racial disparities in DC participation. For the baseline, we regressed a student’s
race on DC participation and then added covariates one at a time to assess how specific
covariates changed the participation rate.
Specifically, we ran this regression:
𝐷𝐶𝑖𝑡 = 𝛽𝑋𝑖 + 𝜏𝑡 + 휀𝑖𝑡
𝐷𝐶𝑖𝑡 is an indicator variable for if student 𝑖 in cohort 𝑡 participates in DC education, 𝑋𝑖 is a
vector of indicator variables for a student’s race. 𝜏𝑡 is cohort fixed effects, which controls for
any cohort specific confounders. Finally, 휀𝑖𝑡 is the error term. White is the omitted category to
prevent collinearity.
Then we predict the values for participating in DC, which we call 𝐷𝐶𝑖��. This is done by taking the
coefficients given by race (𝛽) and rerunning the regression to retrieve the predicted values. We
then plot those predicted values in the bar graph.
To see the effect of including different covariates, we add covariates one by one and then use
them all together. Specifically we run this regression:
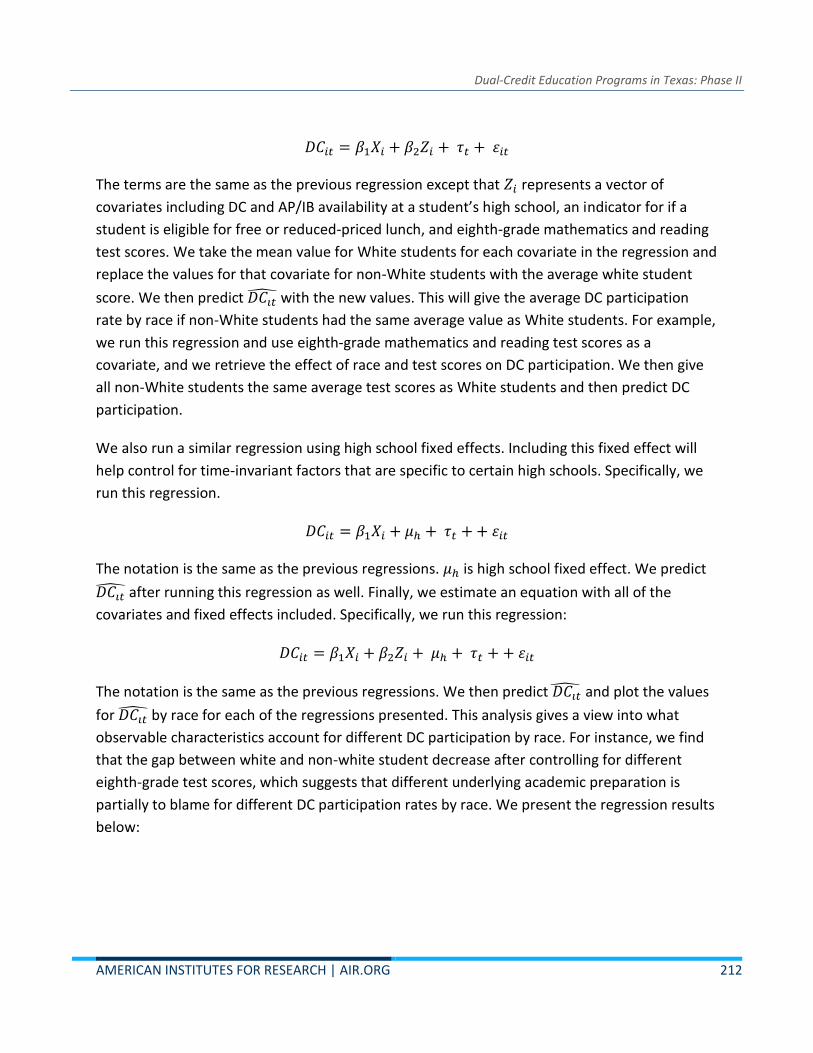
Dual-Credit Education Programs in Texas: Phase II
AMERICAN INSTITUTES FOR RESEARCH | AIR.ORG 212
𝐷𝐶𝑖𝑡 = 𝛽1𝑋𝑖 + 𝛽2𝑍𝑖 + 𝜏𝑡 + 휀𝑖𝑡
The terms are the same as the previous regression except that 𝑍𝑖 represents a vector of
covariates including DC and AP/IB availability at a student’s high school, an indicator for if a
student is eligible for free or reduced-priced lunch, and eighth-grade mathematics and reading
test scores. We take the mean value for White students for each covariate in the regression and
replace the values for that covariate for non-White students with the average white student
score. We then predict 𝐷𝐶𝑖�� with the new values. This will give the average DC participation
rate by race if non-White students had the same average value as White students. For example,
we run this regression and use eighth-grade mathematics and reading test scores as a
covariate, and we retrieve the effect of race and test scores on DC participation. We then give
all non-White students the same average test scores as White students and then predict DC
participation.
We also run a similar regression using high school fixed effects. Including this fixed effect will
help control for time-invariant factors that are specific to certain high schools. Specifically, we
run this regression.
𝐷𝐶𝑖𝑡 = 𝛽1𝑋𝑖 + 𝜇ℎ + 𝜏𝑡 + + 휀𝑖𝑡
The notation is the same as the previous regressions. 𝜇ℎ is high school fixed effect. We predict
𝐷𝐶𝑖�� after running this regression as well. Finally, we estimate an equation with all of the
covariates and fixed effects included. Specifically, we run this regression:
𝐷𝐶𝑖𝑡 = 𝛽1𝑋𝑖 + 𝛽2𝑍𝑖 + 𝜇ℎ + 𝜏𝑡 + + 휀𝑖𝑡
The notation is the same as the previous regressions. We then predict 𝐷𝐶𝑖�� and plot the values
for 𝐷𝐶𝑖�� by race for each of the regressions presented. This analysis gives a view into what
observable characteristics account for different DC participation by race. For instance, we find
that the gap between white and non-white student decrease after controlling for different
eighth-grade test scores, which suggests that different underlying academic preparation is
partially to blame for different DC participation rates by race. We present the regression results
below:
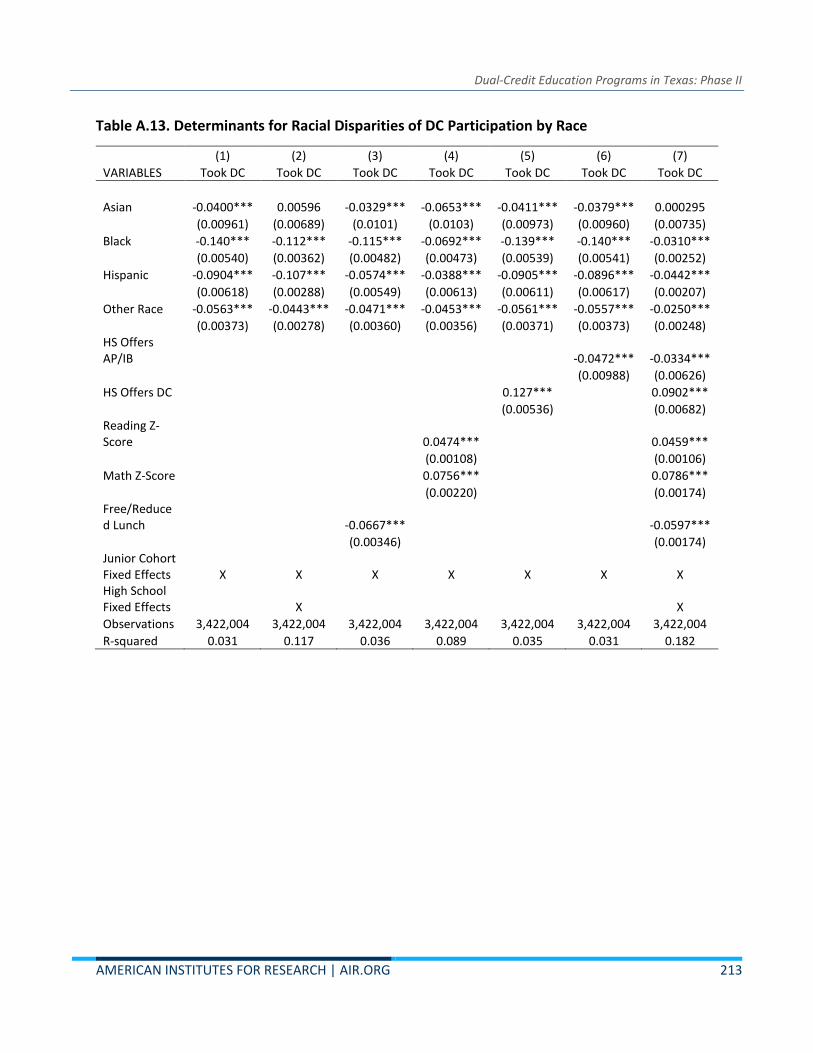
Dual-Credit Education Programs in Texas: Phase II
AMERICAN INSTITUTES FOR RESEARCH | AIR.ORG 213
Table A.13. Determinants for Racial Disparities of DC Participation by Race
(1) (2) (3) (4) (5) (6) (7)
VARIABLES Took DC Took DC Took DC Took DC Took DC Took DC Took DC
Asian -0.0400*** 0.00596 -0.0329*** -0.0653*** -0.0411*** -0.0379*** 0.000295
(0.00961) (0.00689) (0.0101) (0.0103) (0.00973) (0.00960) (0.00735)
Black -0.140*** -0.112*** -0.115*** -0.0692*** -0.139*** -0.140*** -0.0310***
(0.00540) (0.00362) (0.00482) (0.00473) (0.00539) (0.00541) (0.00252)
Hispanic -0.0904*** -0.107*** -0.0574*** -0.0388*** -0.0905*** -0.0896*** -0.0442***
(0.00618) (0.00288) (0.00549) (0.00613) (0.00611) (0.00617) (0.00207)
Other Race -0.0563*** -0.0443*** -0.0471*** -0.0453*** -0.0561*** -0.0557*** -0.0250***
(0.00373) (0.00278) (0.00360) (0.00356) (0.00371) (0.00373) (0.00248) HS Offers AP/IB -0.0472*** -0.0334***
(0.00988) (0.00626)
HS Offers DC 0.127*** 0.0902***
(0.00536) (0.00682) Reading Z-Score 0.0474*** 0.0459***
(0.00108) (0.00106)
Math Z-Score 0.0756*** 0.0786***
(0.00220) (0.00174) Free/Reduced Lunch -0.0667*** -0.0597***
(0.00346) (0.00174) Junior Cohort Fixed Effects X X X X X X X High School Fixed Effects X X
Observations 3,422,004 3,422,004 3,422,004 3,422,004 3,422,004 3,422,004 3,422,004
R-squared 0.031 0.117 0.036 0.089 0.035 0.031 0.182

Dual-Credit Education Programs in Texas: Phase II
AMERICAN INSTITUTES FOR RESEARCH | AIR.ORG 214
Appendix B: Advising Data Collection Instruments
THECB/AIR STUDY OF DUAL-CREDIT PROGRAM ADVISING PRE-INTERVIEW FORM BACKGROUND
1. What is your official title? __________________________
2. What role do you play in advising dual-credit students? (Select all that apply)
a. __ I directly advise dual-credit students b. __ I oversee high school guidance counselors or college advisors who offer dual-credit
counseling c. __ I offer professional development and support to high school guidance counselors and
college advisors who advise dual-credit students d. __ other: Please specify_________________________________
3. What types of students do you advise?: (Select all that apply)
__high school students who are enrolled in dual-credit courses at a traditional high school __high school students who are enrolled in dual-credit courses at an Early College High School __high school students who are not enrolled in dual-credit courses __college students __other: Please specify_______________________
4. Approximately how many students, including dual-credit students, overall do you currently advise? _____
5. Approximately what proportion of these students are enrolled in dual-credit courses? _______
6. For which program(s) does your institution offer dual-credit advising? (Select all that apply) a. ___academic programs b. ___career and technical education programs
7. For which grades do you provide dual-credit advising? (Select all that apply) __ 9th grade __ 10th grade __ 11th grade __ 12th grade

Dual-Credit Education Programs in Texas: Phase II
AMERICAN INSTITUTES FOR RESEARCH | AIR.ORG 215
8. On average, how frequently do you hold an advising session with each dual-credit students you advise? (Select one response) __ weekly __ biweekly __ monthly __quarterly __ once during the semester __ never
9. On average, how many minutes do you spend advising dual-credit students in a single advising session? __________________
10. Who initiates the majority of dual-credit advising sessions? (Select one response) __ high school students __ dual-credit advisors or counselors
11. What is the typical format of an advising session for dual-credit students? (Select one response)
__one-on-one sessions __group meetings with all advisees
__other: Please specify_________________________________
12. Who leads these advising sessions? (Select all that apply) __high school guidance counselor __college advisor __high school teacher __college faculty __other: Please specify
13. How does your institution deliver advising to dual-credit students? (Select all that apply) __ face-to-face __ online __ a hybrid model that combines face-to-face and online modalities __ other: Please specify_______________________
14. What percent of your time do you dedicate to the following activities to provide guidance to dual-credit students? [Please make sure that percentages add to 100] __helping students select dual-credit courses __helping students develop time management and study skills __helping students navigate class schedules and registration waitlists __setting up student email accounts __providing emotional supports to students __helping students apply for financial aid __coordinating activities and meetings with dual-credit partners __other: Please specify:__________________________________

Dual-Credit Education Programs in Texas: Phase II
AMERICAN INSTITUTES FOR RESEARCH | AIR.ORG 216
AIR/THECB STUDY OF DUAL-CREDIT ADVISING IN TEXAS INTERVIEW PROTOCOL Introductory Script [5 minutes] [Note to Interviewer: Say additional words/phrases in brackets if group interview format used.] Thank you for sharing your time with me today. My name is [insert name]. I am a researcher with Gibson Consulting, an education research firm. We have partnered with the American Institutes for Research (AIR), an independent non-profit research institute to conduct a study jointly funded by Educate Texas/ Communities Foundation of Texas, Greater Texas Foundation, Houston Endowment and the Meadows Foundation. This study is being conducted for the Texas Higher Education Coordinating Board (THECB) to learn about dual-credit advising policies and practices, and will not be used for compliance or accountability purposes. This study is an opportunity for stakeholders to share information about dual-credit advising policies and practices to identify best practices in dual-credit education. [Today, we have assembled several of you from [insert institution name] in hopes that you could provide some insights on this topic.] Your participation in this [group] interview is voluntary. You may choose not to participate in the interview, decline to answer any question, or stop the interview at any time without penalty. Our study team will keep what you say confidential. We will not be linking your responses with names or any other identifying information. This data will only be used by the research team at AIR/Gibson Consulting for the study, and we will not share your individual responses with THECB, the TEA, your [institution/school], the U.S. Department of Education, or anyone else outside of the research team. [However, because this is a group interview, please do not say anything you would not want others to know and talk about, as we cannot promise you that others on the line will keep what is discussed anonymous and confidential. We do ask that everyone on the line please respect the confidentiality of other participants and not repeat what we discuss outside of this interview.] FOR COLLEGE ADVISORS ONLY Your institution may have established a dual-credit partnership with more than one high school. If this is the case and your advising role and/or activities differ across the partnering high schools with which you work, we ask that you respond with [NAME OF PARTNERSHIP] in mind. I estimate our conversation today will last about 60 minutes. [Because this is a group interview conducted by phone, speak clearly and one at a time so that we can hear everyone.] I will be jotting some notes so I can remember what you say. In addition, I would like to audio-record today’s discussion to check the accuracy of my notes. The notes and the audio-recordings will

Dual-Credit Education Programs in Texas: Phase II
AMERICAN INSTITUTES FOR RESEARCH | AIR.ORG 217
be destroyed as soon as the research team has completed data collection and analysis. Is this alright with you? Do you have any questions for me at this point before we begin? I. Context [Approximate length of time: 5 minutes]
1. GQ: For my notes, please state your name, title, and role in overseeing or providing dual-credit advising services.
2. SQ: For your particular partnership with [INSTITUTION/HIGH SCHOOL], can you describe what
dual-credit advising looks like from the start to the end of the academic year, and anything that
may occur after a student completes a dual-credit course?
3. SQ: To what extent are [high school guidance counselors/college advisors] involved in decisions around dual-credit advising? What roles do they take on?
For high school counselors who report providing guidance to dual-credit students and non-dual-credit students, ask:
4. SQ: How does advising for dual-credit students at [HIGH SCHOOL] differ from guidance you
provide to students enrolled in A.P. or I.B. courses? And to students who are not enrolled in any courses that may lead to college credit?
For college advisors who report providing guidance to dual-credit and college-credit only students, ask:
5. SQ: How does advising for dual-credit students at [HIGH SCHOOL] differ from guidance you
provide to students enrolled in college-credit only courses?
Listen for:
• Degree versus non-degree seeking
• Undeclared field of study or major
II. Selection into Dual-Credit Education: [Approximate length of time: 20 minutes] The next set of questions are about how you help select students for dual-credit education.
6. SQ: For your partnership with [INSTITUTION / HIGH SCHOOL], are you involved in the process of selecting students for dual-credit education?
• For college advisors, Is this also the case for your partnership with your [institution’s] other high school partners?
SKIP LOGIC: If yes to Question 6, answer the following questions:

Dual-Credit Education Programs in Texas: Phase II
AMERICAN INSTITUTES FOR RESEARCH | AIR.ORG 218
7. SQ: Are certain types of students encouraged to consider enrolling in dual-credit education? If yes, what are the characteristics of those students?
For high school counselors who report providing guidance to dual-credit students and nondual-credit students, ask:
8. SQ: How are the students who are encouraged to enroll in dual-credit education different from
the students who are encouraged to take A.P. or I.B. courses? 9. SQ: From your perspective are there any factors at [HIGH SCHOOL] that challenge or limit
certain groups of students’ access to or ability to enroll in dual-credit courses through this partnership?
10. SQ: Are there certain types of students at [HIGH SCHOOL] that you think should be advised against taking dual-credit courses? Why?
II. Course Selection [Approximate length of time: 20 minutes] I want to continue by asking a number of questions about how you help students choose dual-credit courses.
11. SQ: For your partnership with [INSTITUTION / HIGH SCHOOL], are you involved in the process of helping students choose which dual-credit courses to take?
• For college advisors, Is this also the case for your partnership with your [institution’s] other high school partners?
SKIP LOGIC: If yes to Question 11, answer the following questions:
12. SQ: In your partnership with [INSTITUTION/HIGH SCHOOL], what specific factors do you consider
when counseling students into academic dual-credit courses? [Ask ALL following probes]
• How does a students’ anticipated major, field of study, or career trajectory play a role in the advising students receive about which dual-credit courses to take?
• How does the student’s grade level play a role in the advising students receive about which dual-credit courses to take?
• Finally, how do non-cognitive characteristics, such as motivation or emotional maturity, play in advising dual-credit students around course-taking?

Dual-Credit Education Programs in Texas: Phase II
AMERICAN INSTITUTES FOR RESEARCH | AIR.ORG 219
13. SQ: In addition to these factors, do you also consider credit-transfer policies and review these policies with students?
• If yes, what is your source of information for credit-transfer policies? Are these policies clear to you?
• If no, can you explain why credit transfer is not a factor you consider in counseling students on which dual-credit courses to choose?
• To what extent do you feel more guidance to counselors/advisors on credit transfer policies for this partnership with [INSTITUTION/HIGH SCHOOL] would be helpful?
14. SQ: How much latitude do students have over selecting which and how many dual-credit
courses to take at [HIGH SCHOOL]?
15. SQ: Are students at [HIGH SCHOOL] required to design a program of study to help them map the courses they need to take to earn their desired degree? What does that program of study look like?
Ask only those who reported in the intake form that their institution delivers both academic and CTE dual-credit advising.
16. SQ: To what extent is advising students into CTE dual-credit courses different from advising into academic dual-credit courses? How?
II. Information Sharing [Approximate length of time: 10 minutes] Now I’d like to learn from you about the sorts of information and materials dual-credit students receive, and is shared between your institution and your dual-credit partner.
17. SQ: What kinds of information/materials do you provide to dual-credit students at [HIGH SCHOOL]?
Listen for: • Tuition and fees
• Financial aid
• Course catalogs and schedules
• Course sequences
• Course registration processes and procedures
• New student orientation resources (getting school ID care/use of library)
• Online sources of information/tools
• Key contacts at the college
• Credit transfer
• Career planning
• Student support services
• Choosing an academic field of study or a major

Dual-Credit Education Programs in Texas: Phase II
AMERICAN INSTITUTES FOR RESEARCH | AIR.ORG 220
18. SQ: How is this information shared with dual-credit students at [HIGH SCHOOL]? [PROBE:
electronically, face-to-face, mail]
Ask the next question of college advisors only:
19. SQ: How, if at all, does the information/materials for new college students differ from the information/materials provided to dual-credit students at [HIGH SCHOOL]?
20. SQ: What information do you share with your dual-credit education partner? What information
do they share with you?
IV. Coordination with Dual-Credit Partners [Approximate length of time: 15 minutes] Next, I’d like to hear from you about how you work with your counterparts to deliver dual-credit advising.
21. SQ: How would you describe the level of coordination you have with your [institution/high school] partner with respect to your advising responsibilities? Please elaborate on how you coordinate activities related to dual-credit advising.
22. SQ: Do you think greater coordination of information and/or activities between your
[school/institution] and your dual-credit partner(s) is needed? What would you change if you could?
23. SQ: Have you received any training specific to advising dual-credit students with respect to this
dual-credit partner specifically? If yes, please describe.
V. Challenges of Advising Dual-Credit Students [Approximate length of time: 5 minutes] Thank you for your answers thus far. Now, I would like to get your thoughts about the challenges of delivering dual-credit advising.
24. GQ: What are the main challenges you encounter in advising dual-credit students generally? Are there any challenges specific to the partnership you have with [institution/HIGH SCHOOL]?
Listen for: • Challenges related to pressure to counsel students into dual-credit education and specific
dual-credit courses that are relevant to their future degree or career plans
• Challenges related to working with/getting information from/coordinating with your dual-credit partner
• Challenges related to lack of or inconsistent guidance on how to advise students

Dual-Credit Education Programs in Texas: Phase II
AMERICAN INSTITUTES FOR RESEARCH | AIR.ORG 221
• Challenges related to how to determine which students are most likely to be successful in dual-credit education
• Challenges related with working with high school students and their parents
25. GQ: Thinking generally, what supports or improvements to the advising process would help you
overcome these challenges? What might help students become more strategic when choosing courses so they count towards their major or field of study?
VII. Wrap up
26. GQ: Is there anything else you’d like to share about your experiences as a dual-credit advisor, or
the advising process that we haven’t already discussed either generally or with the dual-credit
partner we asked specific questions about today?
Thank you for your time and participation in this interview!

Dual-Credit Education Programs in Texas: Phase II
AMERICAN INSTITUTES FOR RESEARCH | AIR.ORG 222
Appendix C. Advising Interview Sample
Our final interview sample included counselors and advisors from 50 high schools and 52 IHEs. To recruit our interviewees, we sent an email to the individual at each of our sampled institutions that oversaw and managed DC education at high schools. We asked them to identify individual(s) at their college and their high school partner we were targeting for our study who were involved in student advising and could answer questions about how students were counseled into DC programs and courses. Through this process we completed a total of 102 interviews, including 52 with college advisors (45 2-year college advisors and seven 4-year college advisors) and with 50 high school counselors. Table C1. provides the number and type of respondents that were interviewed by the key features of how their institutions and high schools and how they delivered DC education.
Table C1. IHE and High School Characteristics of the Interview Sample
Characteristics of DC Delivery in Sampled Institutions Interviews Interviews by Interviewee Type
Overall
102
2-year college advisors 45
4-year college advisors 7
High school guidance counselors
50
Urbanity
Rural high schools ≥ 75%
45
2-year college advisors 18
4-year college advisors 5
High school guidance counselors
22
Urban high schools < 75%
57
2-year college advisors 27
4-year college advisors 2
High school guidance counselors
28
ECHS
ECHS partner 25
2-year college advisors 8
4-year college advisors 3
High school guidance counselors
14
No ECHS partner 77
2-year college advisors 37
4-year college advisors 4
High school guidance counselors
36
CTE CTE ≥ 75% 4
2-year college advisors 2
4-year college advisors 0

Dual-Credit Education Programs in Texas: Phase II
AMERICAN INSTITUTES FOR RESEARCH | AIR.ORG 223
Characteristics of DC Delivery in Sampled Institutions Interviews Interviews by Interviewee Type
High school guidance counselors
2
CTE < 75% 98
2-year college advisors 43
4-year college advisors 7
High school guidance counselors
48
Online
Online/hybrid ≥ 50%
13
2-year college advisors 7
4-year college advisors 1
High school guidance counselors
5
Online/hybrid < 50%
89
2-year college advisors 38
4-year college advisors 6
High school guidance counselors
45
Student demographics
Minority 43
2-year college advisors 17
4-year college advisors 4
High school guidance counselors
22
Non-minority 59
2-year college advisors 28
4-year college advisors 3
High school guidance counselors
28
Low-income 100
2-year college advisors 45
4-year college advisors 6
High school guidance counselors
49
Not low-income 2
2-year college advisors 0
4-year college advisors 1
High school guidance counselors
1
Region
West Texas/Panhandle
18
2-year college advisors 7
4-year college advisors 0
High school guidance counselors
11
Central Texas 10 2-year college advisors 7
4-year college advisors 0

Dual-Credit Education Programs in Texas: Phase II
AMERICAN INSTITUTES FOR RESEARCH | AIR.ORG 224
Characteristics of DC Delivery in Sampled Institutions Interviews Interviews by Interviewee Type
High school guidance counselors
3
Houston/Gulf Coast
26
2-year college advisors 12
4-year college advisors 2
High school guidance counselors
12
Dallas/North Texas 16
2-year college advisors 7
4-year college advisors 0
High school guidance counselors
9
South Texas 11
2-year college advisors 4
4-year college advisors 3
High school guidance counselors
4
East Texas 21
2-year college advisors 8
4-year college advisors 2
High school guidance counselors
11

Dual-Credit Education Programs in Texas: Phase II
AMERICAN INSTITUTES FOR RESEARCH | AIR.ORG 225
Appendix D. Advising Interview Codebook
AIR/THECB STUDY OF DUAL-CREDIT INTERVIEW CODEBOOK
Construct/ “Code name”
Subconstruct/ “Subcode name”
Protocol Question #
Pre-interview Form Question # Code definition
Construct 1: Advisor/ counselor roles and responsibilities/ “Roles and responsibilities”
1, 3, 6, 11 1, 2, 14 Role of counselor/advisor in advising DC students, including whether counselor/advisor is involved in selecting students for DC and/or involved in helping students choose which courses to take; also includes time spent on specific topics/activities (e.g., DC course selection, time management and study skills, class schedules/registration, email account set up, emotional support, financial aid, etc.); Also include responses that speak to the role of their HS/IHE counselor/advisor counterpart at their partner school/institution
Construct 2: How DC advising differs from other student advising/ “Distinctness of DC advising”
4, 5, 16, 19
How/to what extent advising for DC students differs from advising for AP, IB, and CTE students, or students not enrolled in college-going courses; as well as from advising for students enrolled in college-credit only courses

Dual-Credit Education Programs in Texas: Phase II
AMERICAN INSTITUTES FOR RESEARCH | AIR.ORG 226
Construct/ “Code name”
Subconstruct/ “Subcode name”
Protocol Question #
Pre-interview Form Question # Code definition
Construct 3: Targeted students “Targeted students”
2, 6, 7, 8, 9, 10
3, 4, 5, 7, 8, 9, 10
The types and grade levels of students advised, how students are selected for DC, and how many students are enrolled in DC courses; as well as what types of students/what are the characteristics of students encouraged to enroll in DC; includes perceptions about whether students are being incorrectly advised into/out of DC
Construct 4: Format of advising sessions/ “Advising format”
2, 3, 17, 18
8, 9, 10, 11, 12
How frequently and for how long counselors/ advisors meet with students; how advising sessions are initiated; the format of the advising sessions, including who leads them, mode of delivery
Construct 5: Relationship/coordination between HS partner and college partner/ “DC partner coordination”
Construct 5.1: Information shared between partners/ “Information shared”
13, 20, 21, 22
Level of coordination between high school and college partner, including how high school guidance counselors work with college advisors. Also includes perceptions of whether greater coordination is needed. For 5.1: Information shared between the partners (including information about credit transfer policies); also includes perceptions of whether more/different
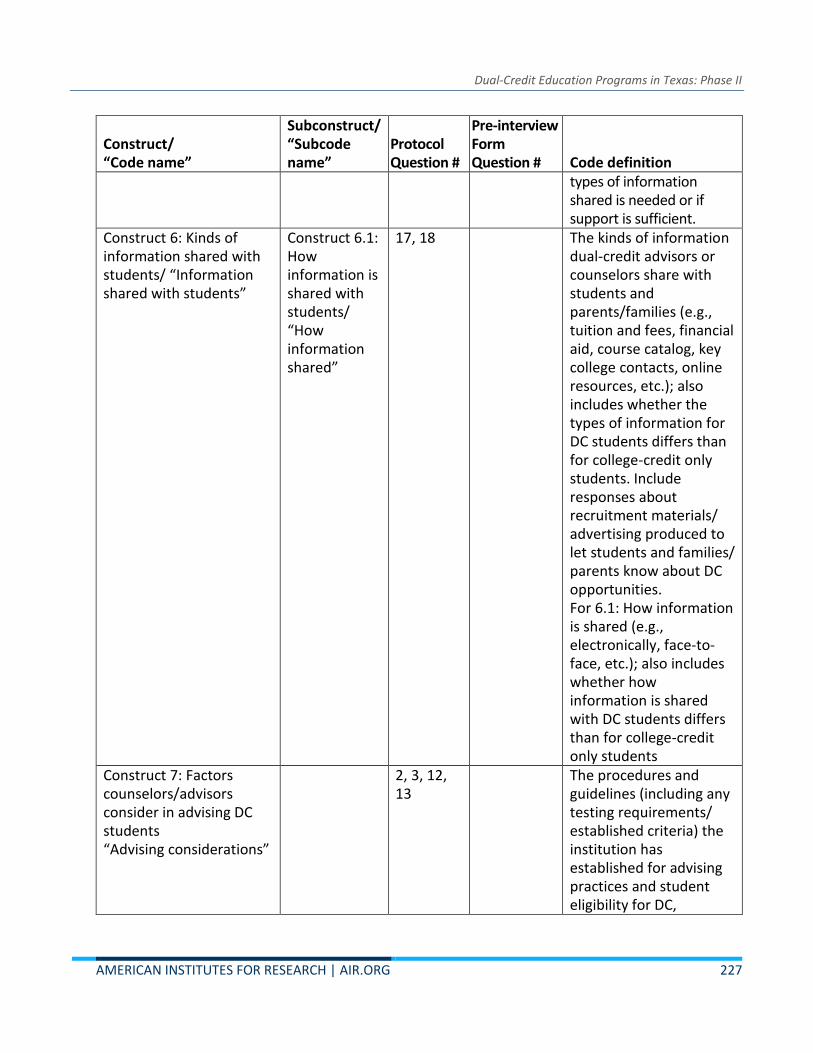
Dual-Credit Education Programs in Texas: Phase II
AMERICAN INSTITUTES FOR RESEARCH | AIR.ORG 227
Construct/ “Code name”
Subconstruct/ “Subcode name”
Protocol Question #
Pre-interview Form Question # Code definition
types of information shared is needed or if support is sufficient.
Construct 6: Kinds of information shared with students/ “Information shared with students”
Construct 6.1: How information is shared with students/ “How information shared”
17, 18 The kinds of information dual-credit advisors or counselors share with students and parents/families (e.g., tuition and fees, financial aid, course catalog, key college contacts, online resources, etc.); also includes whether the types of information for DC students differs than for college-credit only students. Include responses about recruitment materials/ advertising produced to let students and families/ parents know about DC opportunities. For 6.1: How information is shared (e.g., electronically, face-to-face, etc.); also includes whether how information is shared with DC students differs than for college-credit only students
Construct 7: Factors counselors/advisors consider in advising DC students “Advising considerations”
2, 3, 12, 13
The procedures and guidelines (including any testing requirements/ established criteria) the institution has established for advising practices and student eligibility for DC,

Dual-Credit Education Programs in Texas: Phase II
AMERICAN INSTITUTES FOR RESEARCH | AIR.ORG 228
Construct/ “Code name”
Subconstruct/ “Subcode name”
Protocol Question #
Pre-interview Form Question # Code definition
including how counselors and advisors consider a student’s academic and behavioral preparation, credit-transfer options, as well as a student’s major and/or career plans
Construct 8: Students’ roles in selecting DC courses/ “Student autonomy”
14, 15 Includes extent to which students have autonomy in selecting DC students and any requirements for DC students (e.g., completing a program of study to map out course taking).
Construct 9: Supports/trainings provided to counselors/advisors/ “Advisor training”
4, 23 Includes training on DC education generally, on how to advise students, and trainings specific to working with the partner of interest for this study.
Construct 10: Challenges/ “Challenges”
24 The challenges that dual-credit advisors or counselors encounter when advising dual-credit students, including challenges related to working with DC partner.
Construct 11: Supports needed to improve DC advising/ “Supports needed”
25 Any supports that advisors or counselors indicate are needed to improve the advising process for DC students. Include also any recommendations to improve the advising process, even if specific supports aren’t mentioned. Also include

Dual-Credit Education Programs in Texas: Phase II
AMERICAN INSTITUTES FOR RESEARCH | AIR.ORG 229
Construct/ “Code name”
Subconstruct/ “Subcode name”
Protocol Question #
Pre-interview Form Question # Code definition
any responses that indicate what might help students be more strategic in making DC course choices.
Construct 12: Notable practices
Double code any responses that indicate a certain practice/activity was reported as particularly beneficial or effective related to the advising process
Construct 12: General Comments
26 Include responses here that don’t neatly fit into other constructs/codes and we can figure out which other constructs additional comments may apply to.
Dual-Credit Education Programs in Texas: Phase II
AMERICAN INSTITUTES FOR RESEARCH | AIR.ORG 230
Appendix E: Detailed Cost Descriptions for Traditional Dual-
Credit Models by Community College
Costs for Community College A and Its District Partners
Community College A is a large community college serving an urban area with nine traditional
school districts and five charter school districts. Over the past decade, the college has actively
pursued certification of high school teachers to serve as dual-credit instructors. As a result, the
majority of DC courses in Community College A are taught by high school teachers, rather than
community college faculty. We conducted interviews with staff members at multiple
departments at the community college central office and at the three largest school districts in
the area, which collectively account for approximately three-quarters of all DC in the region.
Table E.1 shows the annual cost per SCH across these three districts for DC coursework that
takes place in traditional, non-ECHS. The per-SCH cost in Districts 1A, 2A, and 3A is $127, $111,
and $121, respectively. In general, the cost burden of dual credit is approximately equal
between the community college and school districts, with students bearing a very minor
proportion of costs. Differences in the cost across districts (and the cost burdens) result from
differences in school district central office staffing patterns and differences in who teaches
dual-credit courses in each district, on average (full-time community college faculty, part-time
community college faculty, or high school teachers). In the sub-sections below, we describe the
resources that generate these costs. We discuss, in turn, the community college central office
costs, school district administrative and advising costs, instructional costs for the community
college and school districts, and finally, all other costs associated with dual credit. We then
briefly describe how costs are distributed across stakeholders.
Community College Administrative and Advising Costs for Community College A
Community College A has a robust central office staffing model for DC. The College employs a
Dean of DC, who has two full-time administrative assistants. Two faculty members provide
additional assistance, allocating 20% of their time through a course-release of one course per
semester. Among other DC-related tasks, these individuals provide professional development
to new dual-credit teachers. An office of student services includes an associate director of DC
and two administrative assistants (one full-time and one part-time). A total of five
administrative and registrar specialists are assigned to dual credit. The counseling department
includes a counseling coordinator for DC, a districtwide academic counselor for DC, and an
academic counselor specialist for DC, each of whom allocate all of their time to DC-related

Dual-Credit Education Programs in Texas: Phase II
AMERICAN INSTITUTES FOR RESEARCH | AIR.ORG 231
efforts. These individuals are compensated based on the full-time community college faculty
salary schedule.
The Office of Instructional Deans includes a total of twelve subject-specific instructional deans
across various community college campuses. These individuals approve courses for a subset of
subject areas. The time allocation for these 12 deans is approximately commensurate with
proportion of DC and non-DC courses at the college. Community College A also employs faculty
coordinators, who are responsible for recommending course approval to subject-specific
instructional deans (for both DC and traditional community college courses), evaluating other
community college faculty and high school teachers assigned to DC, and evaluating labs and
other physical DC classroom space on high school campuses. Faculty coordinators are full time
community college faculty and typically oversee 15 courses or 45 SCH. These individuals receive
one course release for each 45 credits they are assigned. The last personnel category in the
Office of Instructional Deans is faculty liaisons who serve as liaisons for each high school
principal and community college staff. There is a total of five faculty liaisons, each of whom are
full time community college faculty who receive one course release for their services.
Other community college personnel at the central office include staff members from the Library
Services, Center for Students with Disabilities, Center for Distance Learning, Institutional
Research, Testing Center, Information Technology, and Office of Student ID Card. Staff
members from each of these offices reported allocating between 5%-10% of their time to DC.
As shown in Table E.1, the annual cost per SCH of central office staffing for Community College
A is $51.20. Community college central office costs per SCH are the same across districts
because we prorate costs across districts based on the number of SCH. One-third of those costs
result from the salaried work time of faculty coordinators, 15% come from the administrative
and registrar specialists, another 15% is generated through the Dean of DC and members of the
Dean’s staff, and the rest of the community college central office costs (approximately 40%) is
generated through all other staff members listed above.
School District Central Office and Site-Based Administrative and Advising Costs for
District Partners of Community College A
The three districts we sampled have similar central office staffing patterns for administering DC.
Each school district employs a DC liaison, who facilitates communication between the Dean of
DC and the district central offices. In District 1A, this person allocates half their salaried work
time to DC, whereas the DC liaison allocates 30% and 70% of their time in Districts 2A and 3A,
respectively. In District 1A, the Executive Director of curriculum and Instruction allocates 10% of
their time to support DC teacher certification and monitor DC course scheduling, whereas the
executive director of High School Academics takes on a similar role in District 2A. The associate

Dual-Credit Education Programs in Texas: Phase II
AMERICAN INSTITUTES FOR RESEARCH | AIR.ORG 232
Superintendent for High Schools in Actively involved in DC in Districts 2A and 3A, but no in
District 1A. District 1A has the highest administrative costs largely because four district-level
counselors in the central office, who supervise site-based counselors, allocate 20% of their time
each to DC education. Other staff members who allocate some time to DC education at the
central office level include the textbook warehouse service coordinator, the Director of
Language Proficiency Assessment Committee, and Texas Success Initiative (TSI) proctors and TSI
“bootcamp” teachers. Under Texas Education Code, students must be identified as “college
ready” prior to enrolling in college-level coursework including dual credit. Students gain this
designation by passing TSI assessments or through waivers granted to students who pass
Advanced Placement courses or who earn high scores on the SAT, ACT. The responsibility of
meeting TSI requirements falls on the student, but postsecondary institutions typically assist
students with the process. Community College A worked help certify district officials so that
students can complete TSI assessments on high school campuses. As a result, districts offering
dual-credit education incur costs for TSI testing, which include salaried work time for test
proctors, a week-long half-day test preparation session (the TSI bootcamp, held in all three
districts), and TSI testing units, which we discuss below.
School-level costs for DC include salaried work time for assistant principals and counselors.
Principal and assistant principal DC liaisons in Districts 1A and 2A estimated that at each high
school one academic counselor allocates approximately 0.10 FTE (about four hours per week)
for activities related to DC that they would otherwise allocate to other matters in the absence
of DC. Counselors in District 3A spent slightly less time (about 0.05 FTE). In exchange, these
counselors oversee a smaller number of students than other academic counselors in the
building (i.e., receive a “smaller alpha”). Similarly, across all three districts, one assistant
principal is selected to oversee DC, representing approximately 0.10 FTE of their typical work
week. Finally, the school district provides their own specialized professional development for
new dual-credit teachers.
Instructional Personnel Costs for Community College A and Its District Partners
Over that past 10 years, Community College A has partnered with the local 4-year university to
certify a substantial number of high school teachers to serve as DC instructors. According to
Texas Education Code, to teach a DC course, high school teachers must have a Master’s degree
and 15 credit hours in the subject area in which they will receive certification to teach DC
courses. To increase the number of teachers with DC certifications, the community college re-
directed external, philanthropic donations from student scholarships for DC to scholarships for
high school teachers. As a result of these efforts, high school teachers instruct most DC courses
at Community College A. As shown in Table E.1, the community college incurs instructional

Dual-Credit Education Programs in Texas: Phase II
AMERICAN INSTITUTES FOR RESEARCH | AIR.ORG 233
costs of $11, $9, and $15 per SCH in Districts 1A, 2A, and 3A, respectively. Most faculty at
Community College A are full-time, which generally increases costs; however, because the
majority of SCH are granted in courses taught by high school teachers, instructional costs for
Community College A are generally lower than in other community colleges in our sample.
Offering DC courses on a high school campus, taught by high school teachers, does not increase
teacher staffing costs for schools because DC courses count as regular high school courses (and
would exist in the absence of DC). In contrast, the school district can reduce teacher staffing
levels when dual-credit courses are taught by community college faculty, rather than high
school teachers. While the majority of DC at Community College A is taught by high school
teachers, DC liaisons and district administrators noted the cost savings associated with
assigning community college faculty as instructors of dual-credit courses. As one district
administrator reported, “If dual credit were to go away, then we would have to absorb those
kids back into our system and it would cost us a lot of money to do that. That instruction right
now, we would have to instruct those classes because [students] are counting on almost all of
them for graduation requirements.” We account for reduced teacher staffing costs based on
the number of SCH taught by a community college faculty member, assuming each DC course
taught by a community college faculty member is a DC course that does not need to be taught
by a high school teacher. Our data show that the average high school teacher course load is five
courses per semester (10 per year), the average class size is 24 students. Thus, the school
district can reduce one FTE teacher for each 720 SCH (3 SCH per student per course x 24
students per course x 10 courses per year). As shown in Table E.1 the average cost savings for
reduced teacher staffing in Districts 1A, 2A, and 3A are $7, $10, and $9, respectively.
Other Costs for District Partners of Community College A and Its Students
In addition to personnel costs, stakeholders incur non-personnel costs for textbooks, high
school teacher stipends, transportation, and TSI testing units. In all three districts, textbooks are
provided to students for who enroll in DC courses. Textbook for courses taught by community
college faculty are based on a one-semester cycle, whereas those taught by high school teacher
are typically replaced every four years (a requirement in each of the MOUs). We calculate the
costs of textbooks over and above the cost of textbook in traditional non-DC courses, in which
most textbooks run on a 10-year cycle. Stipends for teacher who teach dual credit ranged from
$100 to $600 per course.
School districts provide transportation for students from their local high school to a community
college campus. District officials reported that only about one-third of students use the
transportation (the other one-third provide their own transportation). We drew on publically
available TEA data to determine that the average per-student expenditures on transportation

Dual-Credit Education Programs in Texas: Phase II
AMERICAN INSTITUTES FOR RESEARCH | AIR.ORG 234
for the three largest district in the region is $244, or $81 per student if one third of students use
the service. This estimate is close to one district official’s estimate that the transportation costs
associated with 300 students enrolling in DC on a community college campus would typically
costs the district $25,000 or $83 per student.
Students also incur a small amount of costs related to transportation to community college
campuses. Because textbooks and tuition fees are all paid for by the school district, the only
cost is transportation to community colleges, for those students who choose not to use the
district-provided transportation. District officials estimated that approximately two-third of
students provide their own transportation and the typical student travels five miles two per
week to attend two courses on a community college campus.
School district incur the costs of credential teachers (although much of these costs are defrayed
through external funding provided through philanthropic donations). To be certified to teach
DC, high school teachers must have a master’s degree including 15 SCH in the content area.
Nearly 100 teachers in District 1A currently hold credentials to teach dual credit. Half of these
individuals already held an MA degree, while the other half completed their degree at the local
university to obtain DC certification. We estimate the cost of completing an MA degree, based
on the cost of tuition and books, approximately $8,000 (these figures are rounded to maintain
anonymity). Given the average tenure of teachers in the area is about 11 years, we annualize
these costs over 11 years using a discount rate of 5%. The resulting cost is $1,402 per teacher
per year for each credentialed teacher.
The final two non-personnel costs that school districts incur are related to the Texas School
Initiative. The district’s TSI “bootcamp” includes various materials that amount to
approximately $20 per participant. In addition, districts pay a fee per unit of $1.70 for TSI
testing credits. Districts purchase one credit for each student in each subject for a pre-test and
three credits for each test. On average, each dual-credit student requires approximately 7.5
units to become eligible for DC in two subjects.

Dual-Credit Education Programs in Texas: Phase II
AMERICAN INSTITUTES FOR RESEARCH | AIR.ORG 235
Tuition and Fees
Community College A charges school districts $100 per student per dual-credit course when the
course is taught by a community college faculty member. Tuition is waived for courses taught
by high school teachers and for courses taken by early college high school students. As shown in
Table E.1, tuition payments do not affect the total cost per SCH, but they decrease the cost
burden the community college and increase the cost burden to the school district. However,
because high school teachers are the instructors for the vast majority of DC courses in
Community College A, the total tuition payments per SCH are generally low.
Table E.1. Costs per semester credit hour for three school districts partnering with
Community College A
Cost Category District 1A District 2A District 3A
College Admin. and Advising $51.20 $51.20 $51.20
College Instructional Personnel $10.53 $9.49 $14.71
District and High School Admin and Advising $43.22 $34.00 $38.49
High School Teacher Cost Savings (6.55) (10.48) (8.76)
District and High School Other Costs $27.98 $26.32 $24.45
Costs to Students $0.59 $0.33 $0.97
College Cost Pre-Tuition $61.73 48.6% $60.69 54.7% $65.91 54.4%
School District Cost Pre-Tuition $64.65 50.9% $49.84 45.0% $54.18 44.8%
Student Cost Pre-Tuition $0.59 0.5% $0.33 0.3% $0.97 0.8%
College Tuition (Revenue) (4.31) (2.92) (6.07)
District/HS Tuition $4.31 $2.92 $6.07
Students Tuition $0.00 $0.00 $0.00
College Cost Post-Tuition $57.42 45.2% $57.77 52.1% $59.84 49.4%
School District Cost Post-Tuition $65.47 51.6% $60.60 54.7% $51.62 42.6%
Student Cost Post-Tuition $0.59 0.5% $0.33 0.3% $0.97 0.8%
Total Cost $126.98 $110.86 $121.06
Costs for Community College B and Its District Partners Community College B is located in an urban metropolitan area and enrolls over 20,000 students
with approximately one-quarter enrolled as high school students through dual credit. The
College partners with over 25 districts to offer dual-credit education courses. Community
College B uses adjunct faculty for about two-thirds of all courses, and adjunct faculty are
disproportionately assigned to dual-credit courses (teaching approximately three-quarters of all

Dual-Credit Education Programs in Texas: Phase II
AMERICAN INSTITUTES FOR RESEARCH | AIR.ORG 236
dual-credit courses). In the sub-section below on instructional costs, we describe how this
unique arrangement influences costs.
As shown in Table E.2, the annual cost of dual-credit education for dual credit administered in
comprehensive high schools through Community College B is $88 per-semester credit hour in
one sampled district and $66 in a second district, with the majority of the cost burden falling on
the community college. In the sub-sections below, we describe the resources that generate
these costs. As before, we first describe the community college central office costs, and then
describe school district administrative and advising costs, instructional costs for the community
college and school districts, and finally, all other costs associated with dual credit. We then
briefly describe how costs are distributed across stakeholders.
Community College Administrative and Advising Costs for Community College B
The central office administration in Community College B includes three separate offices that
together are responsible for administering dual credit: (a) a high school relations office that
works with area school districts; (b) an office of academic advising; and (c) an office of student
services (to maintain anonymity, we do not use the official office names). The high school
relations office includes an executive director, a full time administrative assistant, two data
entry administrators, and two coordinators. The office of academic advising includes an
executive director and an administrative assistant, and a total of four full-time advisors and two
advisor managers, all of whom are assigned 100% to dual credit. An office of student services
(enrollment) includes an executive director, a full time administrative assistant, two enrollment
managers, and seven enrollment coordinators.
A number of other staff members in various offices in Community College B allocate a portion
of time to dual credit. Librarians work with dual-credit students, particularly on Fridays, when
high school students are assigned to a community college campus, but are not in class (since
most classes meet either Mondays and Wednesdays or Tuesdays and Thursday). The executive
director of dual credit in the high school relations office estimated that two librarians spend
approximately two hours per week to oversee dual-credit students, amounting to a total of 4
hours per week or 0.10 full-time equivalent (FTE) librarians across all community college
campuses. Community college administrators estimated that three IT specialists allocated
approximately one-third of their time each to assisting dual-credit students. An additional staff
member who oversees student ID cards allocates approximately one-quarter of their time to
dual-credit students. Finally, dual credit creates the need for additional faculty evaluation.
Faculty evaluation in smaller departments is generally part of the daily work schedule of
department chairs (and represents only a small proportion of their time); however, larger

Dual-Credit Education Programs in Texas: Phase II
AMERICAN INSTITUTES FOR RESEARCH | AIR.ORG 237
departments form faculty evaluation committees and the chair of those committee receives
one course release per semester. Community college administrators estimated that a total of
16 departments have faculty evaluation committees, resulting in a total of 3.2 FTE community
college faculty members, given a teaching load of five courses per semester (16 / 5 = 3.2).
Administration of dual credit at the community college central office also involves non-
personnel costs including a customer relationship management (CRM) enrollment system the
community college purchased to help administer dual credit (a total cost of $40,000 per year or
about $0.67 per semester credit hour), reimbursement for community college faculty travel to
local high schools, and stipends to community college faculty for serving as mentors of new
dual-credit teachers ($400 per mentor). While we report findings based on the annual cost per
semester credit hour, we can also determine the total, per-student, and per-semester credit
hour costs at each high school, to gain a sense of the cost impact for an individual school or
district. To determine the costs for each high school (or district), we prorate community college
central office and advising costs across all schools with which Community College B partners,
based on the number of semester credit hours at each school. In total, the annual
administrative and advising cost for Community College B is $1.9 million or about $32 per SCH.
Table E.2 below shows the annual cost per semester credit hour of dual credit in
comprehensive high schools (we discuss the cost of dual credit in early colleges in a separate
section). As shown in Table E.2, this cost is the same across districts.
School District Central Office and Site-Based Administrative and Advising Costs for
District Partners of Community College B
The districts we sampled for Community College B are two of the area’s largest in terms of both
total enrollment and the total semester credit hours received, collectively accounting for about
one-third of all dual-credit semester credit hours granted per year through Community College
B. These two districts take somewhat different approaches to offering dual credit. District 1B
has prioritized dual credit as a major initiative and has opened high school programs that
specialize in dual-credit delivery, such as early colleges, in half of the district’s high schools. The
director of the college readiness office reported spending approximately half her salaried work
time on dual-credit education and estimated that the associate superintendent for high schools
allocated about one-quarter FTE. The district also has a director of early colleges who allocates
0.45 FTE to dual credit (their time is often pulled to other nondual-credit tasks). Central office
personnel also include the district registrar (10% FTE) and Texas School Initiative (TSI)
assessment proctors, who are either paraprofessionals assigned to proctor TSI assessments or
are external members hired on an hourly basis. At District 1B high schools, Principals and the
academic dean both allocate time to dual credit. The district uses non-certificated college

Dual-Credit Education Programs in Texas: Phase II
AMERICAN INSTITUTES FOR RESEARCH | AIR.ORG 238
advisors to provide academic advising to dual-credit students (allocated at 0.50 FTE for each
1,000 semester credit hours). These individuals also help promote FAFSA completion and
college applications. The presence of college advisors allows the Academic Counselors to focus
on ensuring students have the necessary requirements to finish high school. The district uses
the school-within-school early college model and has early college coordinators at each early
college high school, but those individuals are responsible for a wide number of tasks, such as
creating the master schedule, overseeing FAFSA applications, and other tasks not directly tied
to dual credit in particular (i.e., activities that would exist in the absence of dual credit). Early
college coordinators therefore allocate roughly 0.45 FTE to dual credit. The district also hires
substitutes or specifically allocates teachers to meet with dual-credit students on Friday
afternoons, when students are enrolled in dual-credit courses that meet only Mondays through
Thursdays, but the district would otherwise be responsible for students during this time anyway
and so substitutes and special teacher scheduling does not generate additional costs. In total,
the costs of school district administration and advising in District 1B is about $60 per semester
credit hour as shown in row 3 of Table E.2
District 2B has a leaner dual-credit administrative structure, despite the fact that the district’s
annual number of semester credit hours is almost has high as District 1B. As shown in in row 3
of Table E.2, the per-semester credit hour cost of district administration and advising District 2B
is $31. The district has only two individuals in the central office who allocate more than a trivial
amount of salaried work time to dual credit (a senior director of college readiness who serves
as the liaison between the district and community college, and a dual-credit coordinator).
District 2B also has TSI proctors assigned to multiple schools and we used the same formula to
determine the total FTE for TSI proctors (6 total hours for each 24 students who initially enrolls
in dual credit each year). At the school-level, academic counselors focus primarily on high
school completion and college readiness, while allocating only a small proportion of time to
dual-credit advising. Instead, the district hires dual-credit coordinators at each high school who
allocate approximately 75% of their time to dual credit.
Instructional Personnel Costs for Community College B and Its District Partners
In all districts partnering with Community College B, data show that the majority of dual-credit
courses are taught on a high school campus by adjunct community college faculty. While most
adjunct faculty teaching in high schools are employed primarily by the community college, a small
proportion are actually high school teachers. In contrast to other dual-credit delivery models, high
school teachers who teach dual credit go through the same interview process as other adjunct
faculty members and become formal employees of the community college. These individuals
receive compensation both as adjunct faculty and as K–12 teachers (they are reported as K–12

Dual-Credit Education Programs in Texas: Phase II
AMERICAN INSTITUTES FOR RESEARCH | AIR.ORG 239
teachers in our data; however, community college administrators reported that all high school
teachers who teach dual credit in the area are required to become adjunct community college
faculty). In District 1B, dual-credit teachers (who are also employed as adjunct community college
faculty) also receive a stipend of $1,000 (included as “other costs” below).
Because Community College B uses similar delivery mechanisms with each partnering district
(relying primarily on adjunct faculty traveling to high schools, with additional courses offered on
the community college campus), the cost of instructional personnel is similar across districts,
$43 and $41 in District 1B and 2B, respectively, as reported in row 2 of Table E.2. The slight
difference results from the specific number of full-time versus part-time community college
faculty teaching courses in each district and the amount of travel reimbursement (Community
College B reimburses faculty for travel to area high schools). These cost figures include
instructional costs for the community college for course taught on both high school and college
campuses, by both adjunct and full-time faculty, and both online and face-to-face. Online
courses have similar cost implications except the community college does not need to
reimburse faculty for travel, students and school districts do not incur transportation costs, and
districts need to assign a staff member to a classroom for online coursework that takes place
during the fall or spring semester. Interestingly, because of the low wages adjunct community
college faculty receive, dual-credit courses taught by adjunct faculty in high schools – the
primary delivery mechanism at Community College B – is the least expensive method. Although
some dual-credit courses are taught by adjunct faculty who are also full-time high school
teachers employed by the district who (in District 1B) receive stipends in addition to their
annual salary, that mechanism is generally less common in Community College B and as a
result, the annual cost per semester credit hour in Community College B is generally lower than
in other sites that we sampled.
Both school districts save a significant amount of money through reduced teacher staffing
associated with dual credit. As noted above, whether students leave campus to attend dual-credit
courses, or community college faculty come to the high school, district administrators reported
significant savings associated with reduced teacher staffing. Districts do not lose state funding as
long as they are present for four hours during the day (or meet other requirements, see Texas
Education Agency, 2017) and districts administrators schedule dual credit to meet this minimum
attendance requirement. We account for this savings using similar methods as described earlier.
As shown in Table E.2, District 1B receives an average of $80 per semester credit hour in cost-
savings, while District 2B receives $77 per semester credit hour. The difference in cost-savings
results from the fact that districts do not save money when high school teachers teach dual-credit
courses, which we can observe for each individual high school in our data.
Dual-Credit Education Programs in Texas: Phase II
AMERICAN INSTITUTES FOR RESEARCH | AIR.ORG 240
Other Costs for District Partners of Community College B and its Students
Other costs for school districts and students include textbooks, transportation, and TSI testing
units. District 1B pays for textbooks for students in early colleges, and splits the cost of
textbooks with students in dual-credit courses outside of early colleges. District administrators
estimated that courses taught by community college faculty require students to purchase a
textbook for each course, while textbooks run on a four-year cycle for dual-credit courses led
by high school teachers. The typical high school class textbook runs on a 10-year cycle, so the
costs of textbooks for dual credit is based on the additional costs associated with shorter cycles.
District 1B also encourages students to share textbooks or makes copies in some cases,
reducing the overall cost of textbook by an estimated 25%. In District 2B, students pay for all of
the costs of textbooks regardless of setting. Depending on the context and course delivery
mechanisms, textbooks represent between 10-15% of the total annual cost of dual-credit
education at Community College B.
Transportation in District 1B is provided to early college students free of charge. District officials
estimated that about one-third of students use this transportation, whereas students provide
their own transportation in all non-early college dual-credit courses in both districts. In general,
transportation represents a small proportion of the overall costs. Finally, both districts pay for
TSI testing units so that students can become eligible for dual-credit courses. As noted earlier,
in Texas, a student must be deemed “college ready” prior to enrolling in college-level
coursework including dual credit. Districts cover the cost of TSI testing units, which must be
purchased for students to take TSI assessments. Given the number of units each student takes,
district administrators estimated that each dual-credit student generates a cost of
approximately $20 for TSI testing units (5 to 10 TSI units across 2 to 3 subject areas). In District
1B, the annual cost of textbooks, dual-credit high school teacher stipends, and TSI units add up
to $18 per semester credit hour, as shown in Table E.2. District 1B also covers tuition charges
and transportation for early college students, which we discuss below. Because District 2B does
not pay for textbooks or transportation and does not offer teacher stipends, the only costs
beyond administration and advising (i.e., “other costs”) are for TSI units, which amount to $4.25
per semester credit hour, shown in row 5 of Table E.2.
The cost to students for dual credit in District 1B is $17 per semester credit hour, which includes
transportation, textbooks, and tuition (for courses ineligible for waivers or courses beyond the
initial 12-course tuition waiver). Community College B administrators estimate that only 5% of
all dual-credit courses are ineligible or are taken by students who have already passed the
initial 12-course tuition waiver, so this amounts to under $2 per semester credit hour. Students

Dual-Credit Education Programs in Texas: Phase II
AMERICAN INSTITUTES FOR RESEARCH | AIR.ORG 241
in District 2B incur a greater cost, $35 per semester credit hour, because the district does not
pay for textbooks.
Tuition and Fees
As noted earlier, Community College B grants tuition waivers for the first 12 courses of dual
credit. A limited number of courses are not eligible for the tuition waiver and these courses are
determined on a case-by-case basis and vary from semester to semester. Community College B
charges districts $100 per student per course in early college, which District 1B covers (District
2B does not have any early colleges). This fee is assessed because Community College B
guarantees that early college students will have access to the courses necessary to complete an
Associate’s degree.
Differences in Cost Burden for Community College B, Its District Partners, and Students
As shown in Table E.2, Community College B pays for the majority of costs of dual credit (84% in
District 1B and 111% in District 2B). Because districts save money through reduced teacher
staffing requirement, the proportion of dual-credit costs that districts incur is much lower,
amounting to only 19% in District 1B. The cost of dual credit is negative in both districts
because the cost savings associated with dual credit is greater than the sum of all other costs.
Moreover, in District 2B, Community College B actually incurs more costs per SCH than the total
cost (111%) because of the limited DC staffing at the District 2B central office and at district
high schools and because of the large cost savings incurred by the district through reduced
teacher staffing. Students pay a total of 19.4% of costs in District 1B and 53.2% in District 2B. If
we ignore the cost savings associated with reduced teacher staffing, the costs are more evenly
spread across community colleges, school districts and students (45%, 45%, and 10% in District
1 and 49%, 25%, and 26% in District 2, respectively). Finally, because tuition fees are waived for
the majority of dual credit in traditional comprehensive high schools, adding tuition to the cost
calculations has little impact on differences in the cost burden of dual students.

Dual-Credit Education Programs in Texas: Phase II
AMERICAN INSTITUTES FOR RESEARCH | AIR.ORG 242
Table E.2. Costs per Semester Credit Hour for Three School Districts Partnering With
Community College B
Cost Category District 1B District 2B
College Admin. and Advising $32.08 $32.08
College Instructional Personnel $42.93 $40.57
District and High School Admin and Advising $58.54 $31.07
High School Teacher Cost Savings (80.33) (77.28)
District and High School Other Costs $17.98 $4.25
Cost to students $17.12 $34.93
College Cost Pre-Tuition $75.01 84.9% $72.64 110.7%
School District Cost Pre-Tuition ($3.81) -4.3% ($41.96) -63.9%
Student Cost Pre-Tuition $17.12 19.4% $34.93 53.2%
College Tuition (Revenue) (1.67) (1.67)
District/HS Tuition $0.00 $0.00
Students Tuition $1.67 $1.67
College Cost Post-Tuition $73.34 83.0% $70.98 108.2%
School District Cost Post-Tuition -$3.81 -4.3% ($41.96) -63.9%
Student Cost Post-Tuition $18.79 21.3% $36.60 55.8%
Total Cost $88.32 $65.62
Note: Negative costs for school districts result from cost-savings associated with reduced teacher staffing (see text
for further detail). When we omit these cost-savings, the annual cost per semester credit hour is $168 and $143,
respectively, and the costs are more evenly spread across stakeholders. Tuition is only paid by students who enroll
in more than 12 DC courses while in high school (all other tuition is waived); therefore, our results do not change
substantially when the cost of tuition is included.
Costs for Community College C and Its District Partners
Community College C is a mid-sized community college located in an urban area. The college
serves a total of 16 traditional school districts and two charter school districts, and uses full-time
college faculty as instructors for most of its dual-credit education courses. Despite the large
number of partnerships, almost half of all dual-credit semester credit hours that Community
College C offers are directed to one large urban school district where there are eight high schools
offering dual-credit courses. We collected data from two school districts that Community College
C serves, which account for 56% of all dual-credit education courses for the community college.
One of these, District 1C, was the large school district previously mentioned, while District 2C is
relatively smaller serving only one high school. In this study, we calculated the total annual cost
and cost per semester credit hour of dual credit for both school districts.

Dual-Credit Education Programs in Texas: Phase II
AMERICAN INSTITUTES FOR RESEARCH | AIR.ORG 243
As Table E.3 shows, the total annual cost of dual-credit education per dual-credit semester hour
that Community College C provides to District 1C is $113; this cost increases to $176 for District
2C. The main burden of these costs, once tuition cost is taken into account, primarily shifts from
the districts to the college. Below, we describe in more detail the personnel and non-personnel
resources and their associated costs that make up the total dual-credit education cost.
Community College Administrative and Advising Costs for Community College C
Community College C spends around $45 in administration and advising costs per dual-credit
semester credit hour across all districts served. At Community College C, the dual-credit
program is run by a Director of Dual Credit and Early College Programs. This Director oversees
four Dual Credit and Early College Coordinators who are involved in the day-to-day
communication and outreach to school districts and high schools. This includes maintaining
relationships with high school counselors overseeing dual-credit students on the high school
side, and providing information sessions about dual-credit programs at each high school. Within
the Dual-Credit Program office, there is also a Workforce Programs Coordinator who manages
any partnerships with high schools providing career and technical dual-credit courses.
Additionally, there is a full time administrative assistant for the Dual-Credit Program Office.
These staff members who spend all their time on dual-credit programs account for more than
70% of the total college administrative and advising costs.
In addition to these staff who spend all their time on dual credit and early college programs,
there are other college administrative staff who devote some of their time toward overseeing
and administering the dual credit and early college programs at Community College C. These
staff include the ‘Provost and Vice President for Academic Affairs’, the ‘Vice President for
Student Affairs’, three Deans of various departments, and the ‘Director of Admissions’. These
higher-level administrators were estimated to spend approximately 25% to 30% of their overall
time on matters related to dual credit and early college programs. These higher-level
administrators account for the bulk of the remaining administrative costs for dual credit.
Lastly, there are some non-personnel costs related to college administration and advising for
dual credit. In total, these non-personnel costs account for only $1.14 per semester credit hour.
The largest of these non-personnel costs is the cost of travel for administrative staff who go out
to school districts and high schools for outreach visits.
School District Central Office and Site-Based Administrative and Advising Costs for
District Partners of Community College C
The two school districts partnering with Community College C had substantially different school
district central office and site-based administrative and advising costs. In District 1C, the large

Dual-Credit Education Programs in Texas: Phase II
AMERICAN INSTITUTES FOR RESEARCH | AIR.ORG 244
district with eight high schools offering dual credit, the administrative and advising costs for the
district amounted to $73 per semester credit hour. In District 2C, these costs came to $97 per
semester credit hour.
The scale of operations for the two districts seemingly played a large role in the difference. For
District 1C, much of the administrative burden occurred at the district level. While there were
no staff with dedicated positions related to dual credit, there were numerous staff in the
central office who spent some of their time on the administration of dual credit. These
individuals manage the district student records related to dual credit, making sure students are
properly enrolled, enter grades for dual-credit students, and run the purchasing and
warehousing of textbooks for dual credit. The district staff described that there are high volume
time periods at the beginning of the fall and spring semesters where they spend a lot of time on
dual credit, but in other parts of the year they devote relatively little time to dual credit. In
addition, there are staff at each high school that devote some time to dual-credit
administration, such as principals or vice principals and deans of instruction. In total,
administrative costs in District 1C amounted to $15 per semester credit hour.
Because District 2C is a single high school district, the bulk of the administrative burden
occurred at the high school, with the principal and a Dean of Instruction. Due to the devotion of
more school-level time for administration and the lower number of semester credit hours,
administrative costs per semester credit hour for District 2C amounted to $35.
On the advising side, each high school in District 1C has a counselor who devotes much of their
time to dual credit. Each high school has a ‘Dual-Credit Counselor’ who serves as the point of
contact between the high school and the college and also is responsible for coordinating testing
for students, ensuring that students properly enroll, and advising students on course taking. In
addition to these eight Dual-Credit Counselors, the other high school counselors were also
involved in advising their caseloads of students in a more minor way. Counselors are also
involved in monthly meetings that serve to update central office representatives on dual credit.
Dual credit advising costs for District 1C amounted to $58 per semester credit hour.
Similarly, District 2C has a ‘Director of College and Career Readiness’, who was a counselor
overseeing dual credit at the high school. This individual does the bulk of dual-credit advising,
while the other school counselors play a secondary role. Dual-credit advising costs for District
2C came to $61 per semester credit hour.
Instructional Personnel Costs for Community College C and Its District Partners
Community College C covers most, if not all, of the instructional personnel costs for school
Districts 1C and 2C. This is the result of almost all instructors delivering dual credit being college

Dual-Credit Education Programs in Texas: Phase II
AMERICAN INSTITUTES FOR RESEARCH | AIR.ORG 245
faculty as opposed to high school teachers. More than 80% of instructors teaching dual-credit
students in Community College C were full-time faculty. As full-time college faculty are
substantially more expensive than part-time faculty or high school teachers, the instructional
costs per semester credit hour paid for by Community College C were relatively high compared
with other colleges in our sample. In total, instructional costs amounted to $77 per semester
credit hour.
We also made the assumption that if enough students take dual-credit courses from non-high
school teachers, high schools should be able to reduce their own teaching staff. Our assumption
is that every 720 semester credit hours offered in a traditional high school would reduce the
need for high school teachers by one. This number was generated by the assumption that a
high school teaching load is five periods and an average class size of 24 students. Additionally,
we assumed that high schools would cut part of an FTE. So once a school hit 720 semester
credit hours, they would lose one FTE teacher, but under 720 semester credit hours they would
not lose any teachers. Using these assumptions, we calculated that District 1C would only lose
one teacher while District 2 would lose two teachers. This results in a cost savings of almost $19
per semester credit hour in District 1C and $85 in District 2C. The difference is due to District 1C
offering dual credit across numerous traditional high schools. Only one high school reached the
720-semester credit hour threshold. Despite offering less overall dual credit in District 2C, it was
all through a single high school.
Other Costs for District Partners of Community College C and Its Students
Other costs for delivering dual-credit program to high school students might include textbook,
testing, and transportation. These costs are mostly covered by the districts or the students
themselves, and not the Community College. District 1C pays $5.09 per dual-credit semester
hour for textbooks, which students are not required to pay for. The district covers the cost of
testing for all students who are eligible for free or reduced-price lunch, otherwise students pay
for the cost of testing. The district pays $1.13 while students pay $0.76 per dual-credit semester
hour for testing. District 1C does not offer any bus transportation option to the community
college. The total for other costs for District 1C is $6.97 per dual-credit semester hour – amount
which is shared by the district ($6.22) and students ($0.76).
In District 2C, other costs are largely split between the district and students. In District 2C,
students cover the cost of textbooks for non-CTE classes which adds up to $22.22 per dual-
credit semester hour. The district, however, covers the cost of testing ($3.91 per dual-credit
semester hour). An additional cost in District 2C, not found in District 1C is the cost of bus
transportation. In District 2C, a bus runs between the high school and the district twice a day. In

Dual-Credit Education Programs in Texas: Phase II
AMERICAN INSTITUTES FOR RESEARCH | AIR.ORG 246
total these other costs amount to $24 per semester credit hour for the district and $22 for
students.
Tuition and Fees
Community College C charges a flat fee of $33 per semester credit hour – or $99 per three-
credit course. Districts 1C and 2C differ in their approach to paying that fee. In District 1C, the
district pays the fee for all free or reduced-price lunch students and early college high school
students, while the students pay if they are not in either of those categories. In District 2C, the
students pay for all academic dual-credit courses. In both districts, the community college bears
the bulk of the cost burden prior to accounting for tuition and fees, while the district bears
most of the burden after accounting for tuition and fees. Additionally, in District 2C, the tuition
and fee arrangement along with textbooks being paid for by students places approximately 21%
of the cost burden on students and their families.
Differences in Cost Burden for Community College C, Its District Partners, and Students
Community College C pays the larger amount of dual-credit costs in District 1C and 2C,
contributing 79% and 51% of the costs, in each district respectively. Both districts benefit from
reduced high school teacher staffing as the districts can hire less teachers when some of their
students enroll in dual-credit courses. Before paying tuition, District 1C even makes 8.7% in
savings from reduced staffing. However, given the district pays the larger bulk of the $33 tuition
fees for its students, it ends up paying 14.3% of the total cost of dual-credit education. District
2C makes $90 in high school teacher cost savings and requires its students to pay the full tuition
amount, but overall contributes a 17.6% to the cost of dual credit. Students in District 1C pay a
total of 6.8%, whereas students in District 2C pay a total of 31%. If we ignore the cost savings
that both high schools make, that shifts the burden of the larger sum of the cost to the districts.
Not counting these savings, District 1C pays 52%, Community College C pays 44.2%, and
students pay 3.8% of the costs of dual-credit education. In District 2C, these numbers become
45.5%, 33.7%, and 20.8% for the district, the college, and students, respectively.

Dual-Credit Education Programs in Texas: Phase II
AMERICAN INSTITUTES FOR RESEARCH | AIR.ORG 247
Table E.3. Costs per Semester Credit Hour for Two School Districts Partnering With
Community College C
Cost Category District 1C District 2C
College Admin and Advising $45.41 $45.41
District and High School Admin and Advising $73.00 $96.58
Instructional Personnel $77.08 $77.19
High School Teacher Cost Savings ($89.10) ($90.19)
District and High School Other Costs $6.22 $24.41
Costs to Students $0.76 $22.22
College Cost Pre-Tuition $122.49 108.1% $122.60 69.8%
School District Cost Pre-Tuition ($9.88) -8.7% $30.81 17.5%
Student Cost Pre-Tuition $0.76 0.7% $22.22 12.7%
College Tuition (Revenue) ($33.00) ($33.00)
District/HS Tuition $26.07 $0.00
Students Tuition $6.93 $33.00
College Cost Post-Tuition $89.49 78.9% $89.60 51.0%
School District Cost Post-Tuition $16.18 14.3% $30.81 17.6%
Student Cost Post-Tuition $7.69 6.8% $55.22 31.4%
Total Cost $113.36 $175.63
Note: Negative costs for school districts result from cost-savings associated with reduced teacher staffing (see text
for further detail). When we omit these cost-savings, the annual pre-tuition cost per semester credit hour is
$202.47 in District 1 C and $265.82 in District 2C, and the costs are more spread across community colleges, school
districts and students (61%, 39%, and 0.4% in District 1C, and 46%, 46%, and 8% in District 2C, respectively). The
post-tuition cost after omitting cost-savings is 44%, 52% and 4% in District 1C, and 34% 46% and 21% in District 2C,
respectively.
Costs for Community College D and Its District Partners
Community College D is a large community college in a rural area, serving a total of twenty
traditional school districts. The College uses high school teachers as instructors for most of its
dual-credit courses. We collected data from three of the largest school districts that partner
with Community College D, and that collectively receive 30.5% of all the dual-credit education
that the College provides in the region. For each site, we calculated the distribution of the total
annual cost and cost per dual-credit semester hour.
As Table E.4 below shows, the total annual cost of dual-credit education per dual-credit
semester hour that Community College D provides to District 1D is $165, to District 2D is $123,

Dual-Credit Education Programs in Texas: Phase II
AMERICAN INSTITUTES FOR RESEARCH | AIR.ORG 248
and to District 3D is $145. Taking into account tuition fees, the districts in sites 1D and 3D are
the primary payers for dual-credit education costs, spending $113 and $74, respectively, per
dual-credit semester hour. In District 2D, the cost burden primarily falls on Community College
D, which pays $53, and the district, which pays $47. Below, we describe in more detail the dual-
credit personnel and nonpersonnel resources and their associated costs.
Community College Administrative and Advising Costs for Community College D
Community College D spends around $40.68 in administrative and advising costs across the
three school districts in our sample. The Community College has a team of 15 members who
dedicate some, or all, of their time to running the College’s dual-credit program. The program is
run by a ‘Dual-Credit Outreach Director’ who spends about 50% of their time on the program,
and by two coordinators who solely work on dual-credit related activities. These staff consult
with three school deans, each of whom spend an estimated 25% of their time on dual credit,
and with a vice president of student and academic services, who spends 40% of their time on
dual-credit related matters. The school also employed a faculty evaluator that helps—with
approximately 70% of their time—in assessing high school teachers’ ability to provide quality
dual-credit classes. Other staff, such as two coordinators and a college administrator, dedicate
all their time to the program.
Similar to other community colleges that provide dual-credit classes, Community College D also
has non-personnel dual-credit costs related to administering the program. The non-personnel
dual-credit costs include travel expenses to school districts for outreach and other purposes,
orientation meetings and materials, and other office expenses such as ones used in trainings of
the program’s administrative staff.
School District Central Office and Site-Based Administrative and Advising Costs for
District Partners of Community College D
The administrative and advising costs for the dual-credit program on the school district side, for
districts in our sample that partner with Community College D, varied substantially. The cost of
providing dual-credit education in District 1D was $74.01 per semester credit hour, while that
amount was $39.25 in District 2D, and $66.03 in District 3D. The higher administrative and
advising costs in District 1D could be the result of the smaller number of dual-credit students
that the district serves, and subsequently the fewer dual-credit semester hours, that the district
offers compared to the other districts. This smaller number of dual-credit semester hours
leaves District 1D with relatively higher operational costs when these costs. Similarly, the pricier
operational costs could also explain the difference in dual-credit administrative and advising

Dual-Credit Education Programs in Texas: Phase II
AMERICAN INSTITUTES FOR RESEARCH | AIR.ORG 249
costs between District 2D and District 3D, as the latter offers a little over than half the semester
credit hours that District 2D offers.
In terms of both personnel and non-personnel costs, District 1D had many staff, such as the
principal, the director of programs, the athletic director, and a technology consultant, who
contribute a little of their time to running the dual-credit program. District 2D and District 3D
on the other hand had key persons, such as a college and career specialist and a director for
Early College High Schools and CTE, who contribute most of their time to the program. There
were other staff members who provide support for dual-credit programs in District 2D and 3D,
however that level of support was minimal in District 2D. As for non-personnel costs, these
were mainly used to cover enrollment activities’ costs in all three Districts.
Instructional Personnel Costs for Community College D and Its District Partners
Instructional Personnel costs, similar to Administrative and Advising costs, were highest for
District 1D:$52.91 per dual-credit semester hour. District 2D and District 3D were alike in this
regard with costs of $40.97 and $39.38, respectively, per dual-credit semester hour. All districts
in our sample use a distant learning model to deliver some dual-credit courses. In addition, the
districts also have one or two high school teachers who teach dual-credit courses on the high
school’s campus. In Districts 1D and 3D, these teachers also offer other non-dual-credit courses
at their high schools, so the districts do not pay those teachers any extra costs specifically for
their instruction of dual-credit courses. On the other hand, District 2D provides a stipend for its
high school teachers who teach dual-credit courses. Finally, both District 1D and 2D cover
transportation costs for high school teachers when they visit the Community College for their
professional development.
In district 2D, there was also enough dual-credit courses provided by non-high school teaching
staff that could the district was able to reduce the amount of teaching staff in their district by
one teacher. This results in a cost savings of $18.90 per dual-credit semester credit hour. The
other districts had fewer dual-credit semester credit hours with a substantial percentage
already taught by high school teachers. Therefore, they did not realize cost savings associated
with reductions in high school teaching staff.
Other Costs for District Partners of Community College D and Its Students
Other costs related to the provision of dual-credit education in District 1D are $33.92, which are
much higher than District 2D’s $0.67 and District 3D’s $22.22. These costs include those of
textbooks, testing, and bus transportation. What sets out District 1D in this regard is that the

Dual-Credit Education Programs in Texas: Phase II
AMERICAN INSTITUTES FOR RESEARCH | AIR.ORG 250
district provides the textbooks for its students at no cost, unlike District 2D and 3D. District 1D
and 3D also incur student transportation costs to and from the community college, whereas
District 2D does not cover such costs.
Tuition and Fees
Community College D has different arrangements with school districts for charging dual-credit
courses tuition. The College charges District 2D a tuition of $28.74 per semester hour as a fixed
cost to school districts per student per semester credit hour. Districts 1D and 3D, pay a tuition
of $34.72 and $44.5 per semester credit hour, respectively. However, the arrangement is such
that the two school districts buy a block of dual-credit courses from Community College D that
are delivered on the districts’ high school campuses. If either District 1D or 3D were to request
additional courses beyond what is included in their purchase, , Community College D charges
the market price for any extra course (approximately 11 times the cost of a course included in
the bundle). Both Districts 1D and 2D waive tuition for students and take on the costs of the
dual-credit courses, while District 3D requires its students to pay 85% of the tuition cost if they
decide to take a certain class that is not included in the offered course package paid for by the
school district.
Differences in Cost Burden for Community College D, Its District Partners, and Students
As Table E.4 below shows, Districts 1D and 3D pay the larger sum (68% and 51%, respectively)
of the total cost of dual credit. In District 2D, Community College D covers 43% of the total cost,
while the district covers 38%, and the students cover 19%. If we do not account for any high
school teacher cost savings, which are savings from decreased high school staffing given
students’ enrollment in dual credit, some of the cost burden in District 2D shifts from the
college to the district. District 2D in that case pays 47%, and Community College pays 36.5% of
the total cost of dual credit. In Districts 1D and 3D, the distribution of burden is only
exaggerated in that case as districts pay a larger sum (73% and 60%, respectively) of the total
cost of dual credit. In the three districts, students’ contribution only slightly changes to 2.9%,
16.2% and 20%, respectively, of the total amount per dual-credit semester hour.

Dual-Credit Education Programs in Texas: Phase II
AMERICAN INSTITUTES FOR RESEARCH | AIR.ORG 251
Table E.4. Costs per Semester Credit Hour for Three School Districts Partnering With
Community College D
Cost Category District 1D District 2D District 3D
College Admin and Advising $40.68 $40.68 $40.68
District and High School Admin and Advising $74.01 $39.25 $66.03
Instructional Personnel $40.97 $40.97 $39.38
High School Teacher Cost Savings ($29.96) ($22.09) ($31.79)
District and High School Other Costs $33.92 $0.67 $8.61
Costs to Students $5.67 $23.47 $22.22
College Cost Pre-Tuition $81.64 49.4% $81.64 66.4% $80.05 55.2%
School District Cost Pre-Tuition $77.97 47.2% $17.83 14.5% $42.85 29.5%
Student Cost Pre-Tuition $5.67 3.4% $23.47 19.1% $22.22 15.3%
College Tuition (Revenue) ($34.72) ($28.74) ($44.53)
District/HS Tuition $34.72 $28.74 $31.04
Students Tuition $0.00 $0.00 $13.48
College Cost Post-Tuition $46.92 28.4% $52.90 43.0% $35.53 24.5%
School District Cost Post-Tuition $112.69 68.2% $46.57 37.9% $73.89 50.9%
Student Cost Post-Tuition $5.67 3.4% $23.47 19.1% $35.71 24.6%
Total Cost $165.28 $122.95 $145.12
Note: Negative costs for school districts result from cost-savings associated with reduced teacher staffing (see text
for further detail). When we omit these cost-savings, the annual cost per semester credit hour is $195, $145, and
$177 respectively, and the pre-tuition costs are more evenly spread across community colleges, school districts
and students (42%, 55%, and 3% in District 1D, 56%, 28% and 16% in District 2D, and 45%, 42%, and 13% in District
3D, respectively). When the cost of tuition is included, those percentages change to 24%, 73% and 3% in District
1D, 37%, 47% and 16% in District 2D, and 20%, 60% and 20% in District 3 respectively).
Costs for Community College E
Community College E is a medium-sized community college in a rural area, serving a total of
thirty traditional school districts. In this site, we only looked at the cost of dual credit from the
College’s side.
Community College Administrative and Advising Costs for Community College E
Community College E spends about $23.20 per dual-credit semester hour in administrative and
advising costs, as shown in Table E.5. The bulk of this amount is spent on administrative
personnel as the college has two staff members, a Director of Dual Credit and a Coordinator, who

Dual-Credit Education Programs in Texas: Phase II
AMERICAN INSTITUTES FOR RESEARCH | AIR.ORG 252
dedicate all their time to the program. The Dean of Instructional Administration at the college is
also heavily involved in the program. In terms of advising costs, the college has a full-time staff
member, on its advising services team, who attends to dual-credit students. Non-personnel costs
for dual-credit staff and activities are kept to a minimum at Community College E.
Instructional Personnel Costs for Community College E
Community College E spends $69.78 per dual-credit semester hour on instructional personnel
at the college. For districts that have high school teachers instruct the dual-credit courses,
Community College E either pays those teachers a part-time faculty rate or it provides the
districts with a stipend and lowers tuition fees for students. The college also provides those
high school teachers with mentoring and teaching demonstrations opportunities, and invites
them to teach summer classes at the college.
Table E.5. Costs per Semester Credit Hour at the College Level for Community College D
Cost Category College
College Admin and Advising $23.20
Instructional Personnel $69.78
College Cost Pre-Tuition $94.33
College Tuition (50.00)
College Cost Post-Tuition $44.33

Dual-Credit Education Programs in Texas: Phase II
AMERICAN INSTITUTES FOR RESEARCH | AIR.ORG 253
Appendix F. English Language Arts Protocol
Syllabus Review
Review of Syllabus – The purpose of the review of syllabi is to gather baseline information on
academic expectations between dual-credit and college-credit only courses. The analysis will be
based on the study team’s review of course syllabi submitted by instructors of record for these
courses. Please review the syllabus and respond to the following questions, accordingly.
Are the following skill objectives included in the syllabus?: Y/N/Unclear
Objectives Yes No Unclear
Critical thinking skills
Communication skills
Teamwork
Understand writing process (planning, drafting, revising, editing)
Analyze purpose, audience, tone, style, and writing strategy when in written works
Analyze various types of written works
Develop computer literacy
Command of grammatical structure
Drawing conclusions
Making inferences
Does the syllabus cover the following topics?: Y/N/Unclear
Topics Yes No Unclear
General
Text analysis
Source analysis
Research skills
Idea development
Audience, purpose, and occasion
Individual and collaborative writing processes
Thesis statement
Paragraph construction
Informative writing

Dual-Credit Education Programs in Texas: Phase II
AMERICAN INSTITUTES FOR RESEARCH | AIR.ORG 254
Essay/composition development
Persuasive writing
Analytical writing
Use of appropriate citation methods (as stated by instructions)
Technical aspects of writing identify rhetorical purposes and methods of organization appropriate to topic, thesis, and audience
Revision strategies (individual and/or collaborative)
Stages of writing process
Invention
Researching
Drafting
Are the following components included in the syllabus?: Y/N/Unclear
• Homework expectations – including hours of time students should spend on homework
• Plagiarism policies
• Class participation
• Student conduct
• Attendance policies
• Prerequisites are listed
• Provisions for students with special needs are outlined
• Expectations for technology use
• Grading
o Allowance of late work
o Options for extra credit
o Drop lowest test score
Are the following assignments included in the syllabus? Y/N/Unclear
Assignments
Yes No Unclear
Papers/essays
Presentations
Readings
In-class assignments
Journals

Dual-Credit Education Programs in Texas: Phase II
AMERICAN INSTITUTES FOR RESEARCH | AIR.ORG 255
Blogs
Peer reviews
Reading requirements
Papers assigned
Books required
Literary texts
Assignment Types
Assignments Yes No Unclear
Papers/essays
Presentations
In-class assignments
Journals
Blogs
Peer reviews
Reading requirements
Books required
Papers assigned
Informational texts
Literacy texts
Other
Are the following Graded Elements included in the syllabus and if so what percentage of the
final course grade does it represent
Assignments Not included
Under 10% 10%–20% 21%–30% 31%–40% 41%–50%
Quizzes
Pop Quizzes
Cumulative Final Exam
End of Chapter tests
Oral Exams
Midterms
Papers
Presentations
Homework
Participation
Research
Case Studies
Extra Credit
Portfolio
*percentages are the amount counted towards final grade—which should add up to 100%.

Dual-Credit Education Programs in Texas: Phase II
AMERICAN INSTITUTES FOR RESEARCH | AIR.ORG 256
Assignment Review STEP 1: Review the materials.
• Locate the assignment to be evaluated
• Locate the three student work that corresponds to the assignment.
• Scan the lesson/unit to see what it contains and how it is organized.
• Review the topic focus of the assignment
STEP 2: Identify which skill objectives(s) students will need to demonstrate or use in completing this assignment.
Critical thinking Skills
Communication Skills
Teamwork
Understand writing process (planning, drafting, revising, editing)
Analyze purpose, audience, tone, style, and writing strategy when in written works
Analyze various types of written works
Develop computer literacy
Draw conclusions from text Make inferences from text
STEP 3: Determine which level of cognitive complexity (what the assignment is actually asking the student to do with the content) the student is being asked to engage in (see appendix A for definitions and examples).
1: Interacting with new content (e.g., clarifying author’s meaning)
2: Practicing and deepening new content (e.g., arguing about text, using evidence to support)
3: Cognitively complex tasks (e.g., expressing original and abstract ideas and using course texts to support those ideas)
STEP 4: Determine which level of cognitive demand (the degree or complexity of knowledge that the assignment requires) the student is being asked to engage in (see appendix B for definitions).
Level 1
Level 2
Level 3
Level 4

Dual-Credit Education Programs in Texas: Phase II
AMERICAN INSTITUTES FOR RESEARCH | AIR.ORG 257
Review of Student Work STEP 5: Determine what level the student work reflects on the novice-expert continuum (see appendix C for definitions).
Emerging Expert
Accomplished Strategic Thinker
Strategic Thinker
Emerging Strategic Thinker
Accomplished Novice
Novice Thinker
Emerging Novice
Evidence:

Dual-Credit Education Programs in Texas: Phase II
AMERICAN INSTITUTES FOR RESEARCH | AIR.ORG 258
Rubric measuring Cognitive Complexity
Categories Definition Examples
Interacting with new content
Students must actively process new information in order to retain it Students are given the opportunity to process small chunks of new content
• Previewing and processing new content
• Identifying critical content,
• Elaborating on new information,
• Reflecting on learning
• Summarizing and clarifying content
Practicing and deepening content
Students must have opportunities to practice skills and deepen their understanding of information. Deeper awareness is forged through repeated exposure to knowledge, involving practice and knowledge-deepening activities Students wrestling with content as they build the stamina required to reach higher levels of thinking
• Examining similarities and differences
• Examining errors in reasoning
• Reviewing and revising knowledge
Cognitively complex tasks
Work that requires students to think on their own or with peers as they refine higher-order thinking skills. For students, the core of effectively engaging with content in a more complex way and they have the ability to produce and support claims. At this level students are able to master a structured and rigorous method for producing and supporting claims that include these steps: (1) State a claim (2) Establish grounds (3) Provide backing (4) Frame qualifiers to include describing counter-arguments as well as identifying thinking errors
Hypothesis generation and testing, Investigating, Problem-solving, Decision-making Experimental inquiry Inventing and student-designed tasks

Dual-Credit Education Programs in Texas: Phase II
AMERICAN INSTITUTES FOR RESEARCH | AIR.ORG 259
Cognitive Demand ELA Cognitive Demand Framework
Level Definition Sample Activities Verbs/Statements to look for
1 Recall/
Reproduction
Recall a fact,
information, or
procedure.
Process
information on a
low level.
a. Writing • Listing/generating ideas or words prior to developing
written composition (e.g., brainstorming, webbing) • Selecting or recalling appropriate vocabulary (words,
phrases, idioms) to achieve intended meaning in writing
• Writing simple sentences • Using punctuation marks and capitalization correctly in
writing and editing • Using Standard English conventions in writing and editing
to correct errors • Identifying misspelled words in a written passage • Applying conventional spelling patterns/rules to new
situations in writing • Using resources (dictionary, thesaurus) to correct
spelling in written passages • Using resources to identify Standard English
grammatical structures for correction • Using resources to apply basic formats for
documentation b. Reading
• Identify or describe characters, setting, sequence of events
Select appropriate words to use in context (e.g., content-specific words, shades of meaning) when intended meaning is clearly evident
Statements:
• Provide or recall facts, terms, definitions, conventions
• Locate literal answers in text
• Identify relevant information
• Explain simple concepts or routine procedures
Other potential verbs: Cite,
Define, Explain, Give Examples,
Illustrate, List, Name, Quote,
Report, Select, State

Dual-Credit Education Programs in Texas: Phase II
AMERICAN INSTITUTES FOR RESEARCH | AIR.ORG 260
Level Definition Sample Activities Verbs/Statements to look for
2 Skill/ Concept Use
information or
conceptual
knowledge,
two or more
steps
a. Writing • Note-taking or outlining as a means of organizing ideas for
writing • Developing text which may be limited to one paragraph • Using simple organizational strategies to structure written
work (e.g., basic paragraph form: indenting, main idea, supporting details; simple transitions)
• Constructing a variety of sentence types (e.g., simple and compound, sentences with embedded phrases)
• Writing summaries that contain the main idea of a reading selection and pertinent details or quotations
• Demonstrating basic understanding and appropriate use of such reference materials as a dictionary, thesaurus, or web site
• Editing final drafts of compositions for mechanics and conventions, including grammar, punctuation, and capitalization
b. Reading • Make basic inferences or draw basic conclusions about
information presented in text • Recognizing appropriate generalizations about text (e.g.,
possible titles, main ideas) • Identify and summarize the major events, problem,
solution, conflicts in a literary text • Distinguish between fact and opinion • Describe the characteristics or features of various types of text • Locate information to answer questions related to explicit
or implicit central ideas in informational texts • Identify use of literary devices (e.g., imagery, idioms,
exaggeration)
Statements:
• Show relationships • Apply a concept • Use context clues to
identify the meaning of unfamiliar words
• Describe the cause/effect of a particular event
• Predict a logical outcome • Identify patterns in events
or behavior Other potential verbs:
Categorize, Classify, Compare,
Construct, Describe,
Determine, Distinguish,
Explain, Extend, Extrapolate,
Formulate, Generalize, Infer,
Interpolate, Interpret, Modify,
Observe, Organize, Predict,
Relate, Represent, Show,
Simplify, Sort, Use

Dual-Credit Education Programs in Texas: Phase II
AMERICAN INSTITUTES FOR RESEARCH | AIR.ORG 261
Level Definition Sample Activities Verbs/Statements to look for
3 Strategic
Thinking
Requires
reasoning,
developing a
plan or a
sequence of
steps, some
complexity
a. Writing • Developing compositions that include multiple paragraphs • Using complex or varied sentence structures in written compositions • Demonstrating some synthesis and analysis in writing (making
inferences; determining relationships; generalizing, or connecting ideas)
• Showing awareness of audience and purpose through focus, organization, voice/tone
• Using appropriate organizational text structures (e.g., description; chronology; proposition/support; compare/contrast; cause/effect)
• Editing and revising to improve the quality and meaning of the composition
• Supporting ideas with details, examples, quotations, text references, and/or citations
• Revising final drafts to improve organization and precision of language to produce a logical progression of ideas
• Summarizing information from multiple sources to address a specific topic
b. Reading • Explain, generalize, or connect ideas, using supporting evidence
from the text or from other sources • Draw inferences about author’s purpose, author’s message or
theme (explicit or implied) • Make and support inferences about implied causes and effects • Describe how word choice, point of view, or bias affects the
interpretation of a reading selection • Summarize or compare information within and across text passages • Analyze interrelationships among elements of the text (plot,
subplots, characters, setting) • Analyze or interpret use of author’s craft (literary devices) to
Statements:
• Explain phenomena in terms of concepts
• Support ideas with details and examples
• Compile information from multiple sources to address a specific topic
• Develop a logical argument
• Identify and justify a solution
• Identify the author’s purpose and explain how it affects interpretation of a reading selection
Other potential verbs:
Appraise, Assess, Cite
evidence, Compare,
Compile, Conclude,
Contrast, Critique,
Decide, Defend, Describe,
Develop, Differentiate,
Distinguish, Examine,
Formulate, Identify, Infer,
Interpret, Investigate,
Judge, Justify, Reorganize,
Support

Dual-Credit Education Programs in Texas: Phase II
AMERICAN INSTITUTES FOR RESEARCH | AIR.ORG 262
Level Definition Sample Activities Verbs/Statements to look for
analyze or critique a literary text
4 Extended
Thinking
Requires an
investigation,
time to think
and process
multiple
conditions of
the problem.
a. Writing • Developing multi- paragraph compositions that demonstrate
synthesis and analysis of complex ideas or themes • Analyzing author’s craft (e.g., style, bias, literary techniques, point of
view) • Demonstrating evidence of a deep awareness of purpose and
intended audience. (e.g., in informational reports including hypotheses and supporting evidence)
• Creating compositions that demonstrate a distinct voice and that stimulate the reader or listener to consider new perspectives on the addressed ideas or themes
• Writing an analysis of two selections, identifying the common theme and generating a purpose that is appropriate for both
• Gathering, analyzing, and evaluating written information for the purpose of drafting a reasoned report that supports and appropriately illustrates inferences and conclusions drawn
b. Reading • Compare or analyze multiple works by the same author, including
authors’ craft • Compare or analyze multiple works from the same time period or
from the same genre • Gather, analyze, organize, and interpret information from multiple
(print and non-print) sources for the purpose of drafting a reasoned report
• Evaluate the relevancy and accuracy of information from multiple sources
Statements:
• Synthesize ideas into new concepts
• Connect common themes across texts from different cultures or areas
• Synthesize information from multiple sources
Other potential verbs:
Appraise, Connect,
Critique, Judge, Justify,
Prove, Report, Synthesize
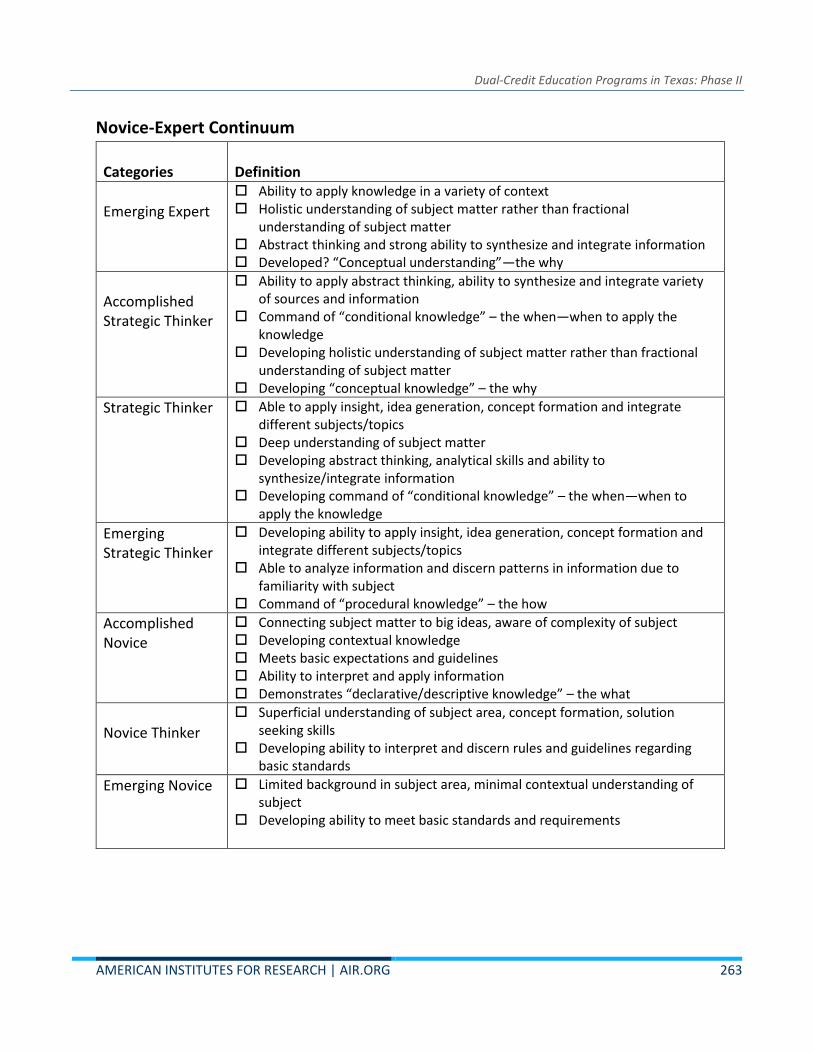
Dual-Credit Education Programs in Texas: Phase II
AMERICAN INSTITUTES FOR RESEARCH | AIR.ORG 263
Novice-Expert Continuum
Categories
Definition
Emerging Expert
Ability to apply knowledge in a variety of context Holistic understanding of subject matter rather than fractional
understanding of subject matter Abstract thinking and strong ability to synthesize and integrate information Developed? “Conceptual understanding”—the why
Accomplished Strategic Thinker
Ability to apply abstract thinking, ability to synthesize and integrate variety of sources and information
Command of “conditional knowledge” – the when—when to apply the knowledge
Developing holistic understanding of subject matter rather than fractional understanding of subject matter
Developing “conceptual knowledge” – the why
Strategic Thinker
Able to apply insight, idea generation, concept formation and integrate different subjects/topics
Deep understanding of subject matter Developing abstract thinking, analytical skills and ability to
synthesize/integrate information Developing command of “conditional knowledge” – the when—when to
apply the knowledge
Emerging Strategic Thinker
Developing ability to apply insight, idea generation, concept formation and integrate different subjects/topics
Able to analyze information and discern patterns in information due to familiarity with subject
Command of “procedural knowledge” – the how
Accomplished Novice
Connecting subject matter to big ideas, aware of complexity of subject Developing contextual knowledge Meets basic expectations and guidelines Ability to interpret and apply information Demonstrates “declarative/descriptive knowledge” – the what
Novice Thinker
Superficial understanding of subject area, concept formation, solution seeking skills
Developing ability to interpret and discern rules and guidelines regarding basic standards
Emerging Novice Limited background in subject area, minimal contextual understanding of subject
Developing ability to meet basic standards and requirements

Dual-Credit Education Programs in Texas: Phase II
AMERICAN INSTITUTES FOR RESEARCH | AIR.ORG 264
Appendix G. Mathematics Protocol
Syllabus Review
Review of Syllabus – The purpose of the review of syllabi is to gather baseline information on
academic expectations between dual-credit and college-credit only courses. The analysis will be
based on the study team’s review of course syllabi submitted by instructors of record for these
courses. Please review the syllabus and respond to the following questions, accordingly.
Does the syllabus cover the following topics?: Y/N/Unclear (will be set up as a table in an
online platform)
• Polynomial
• Rational functions
• Radical functions
• Exponential functions
• Logarithmic functions
• Systems of equations using matrices
• Graphing
• Non-linear inequities
• Sequences and series
• Circles
• Binomial Theorem
• Number systems
• Real number system
• Probability
• Conics
Are the following skill objectives included in the syllabus?: Y/N/Unclear
• Critical thinking skills
• Communication skills
• Empirical and quantitative skills
Are the following components included in the syllabus?: Y/N/Unclear
• Homework expectations – including hours of time students should spend on homework
• Plagiarism policies
• Class participation
• Student conduct
• Attendance policies
• Prerequisites are listed

Dual-Credit Education Programs in Texas: Phase II
AMERICAN INSTITUTES FOR RESEARCH | AIR.ORG 265
• Provisions for students with special needs are outlined
• Expectations for technology use
• Grading
o Allowance of late work
o Options for extra credit
o Drop lowest test score
Are the following assignments included in the syllabus?: Y/N/Unclear
Assignments
• Problem sets
• Presentations
• Reading
• Projects
• In class assignments
• Blogs
• Peer reviews
• Other
Are the following Graded Elements included in the syllabus and if so what percentage is given
to the element
Assignments Not included
Under 10% 10%–20% 21%–30% 31%–40% 41%–50%
Quizzes
Pop Quizzes
Cumulative Final Exam
End of Chapter tests
Oral Exams
Midterms
Projects
Papers
Presentations
Homework
Participation
Research
Case Studies
Extra Credit
Portfolio
Other
*percentages are the amount counted toward final grade

Dual-Credit Education Programs in Texas: Phase II
AMERICAN INSTITUTES FOR RESEARCH | AIR.ORG 266
Assignment Review
STEP 1: Review the Materials.
• Locate the assignment to be evaluated
• Locate the student work that corresponds to the assignment.
• Scan the lesson/unit to see what it contains and how it is organized.
• Review the topic focus of the assignment
STEP 2: Identify which skill objectives(s) students will need to demonstrate or use in completing this assignment.
Critical thinking Skills
Communication Skills
Empirical and quantitative skills
STEP 3: Determine which level of cognitive complexity (what the assignment is actually asking the student to do with the content) the student is being asked to engage in (see appendix A for definitions and examples).
1: Interacting with new content
2: Practicing and deepening new content
3: Cognitively complex tasks
STEP 4: Determine which level of cognitive demand (the degree or complexity of knowledge that the assignment requires) the student is being asked to engage in (see appendix B for definitions).
Level 1
Level 2
Level 3
Level 4

Dual-Credit Education Programs in Texas: Phase II
AMERICAN INSTITUTES FOR RESEARCH | AIR.ORG 267
Student Work
STEP 5: Determine what level the student work reflects on the novice-expert continuum (see appendix C for definitions).
Emerging Expert
Accomplished Strategic Thinker
Strategic Thinker
Emerging Strategic Thinker
Accomplished Novice
Novice Thinker
Emerging Novice
Evidence:

Dual-Credit Education Programs in Texas: Phase II
AMERICAN INSTITUTES FOR RESEARCH | AIR.ORG 268
Cognitive Complexity
Categories Definition Examples
Interacting with new content
Students must actively process new information in order to retain it Students are given the opportunity to process small chunks of new content
• Previewing and processing new content
• Identifying critical content,
• Elaborating on new information,
• Reflecting on learning
• Summarizing and clarifying content
Practicing and deepening content
Students must have opportunities to practice skills and deepen their understanding of information. Deeper awareness is forged through repeated exposure to knowledge, involving practice and knowledge-deepening activities Students wrestling with content as they build the stamina required to reach higher levels of thinking
• Examining similarities and differences
• Examining errors in reasoning
• Reviewing and revising knowledge
Cognitively complex tasks
Work that requires students to think on their own or with peers as they refine higher-order thinking skills with few interruptions by the teacher For students, the core of effectively engaging with content in a more complex way and they have the ability to produce and support claims. At this level students are able to master a structured and rigorous method for producing and supporting claims that include these steps: (1) State a claim (2) Establish grounds (3) Provide backing (4) Frame qualifiers to include describing counter-arguments as well as identifying thinking errors
Hypothesis generation and testing, Investigating, Problem-solving, Decision-making Experimental inquiry Inventing and student-designed tasks

Dual-Credit Education Programs in Texas: Phase II
AMERICAN INSTITUTES FOR RESEARCH | AIR.ORG 269
Cognitive Demand Mathematics Cognitive Demand Framework
Level Definition Sample Activities Verbs/Statements to look for
1 Recall/
Reproduction
Recall a fact,
information, or
procedure.
Process
information on a
low level
• Recall or recognize a fact, definitions, or term
• Apply a well-known algorithm
• Perform a specified or routine procedure
• Evaluate an expression
• Solve linear equations
• Identify a plane or three dimensional figure
• Determine the area or perimeter of rectangle or triangles given a drawing and labels
Verbs: Calculate, Draw, Label,
Locate, List, Match, Measure,
Perform, Select, Tabulate,
Recall, Identify, Recognize,
Use
2 Skill/Concept Use information
or conceptual
knowledge, two
or more steps
• Classify planes and three dimensional figures
• Use models to represent mathematical concepts
• Solve a routine problem requiring multiple steps, or the application of multiple concepts
• Compare and contrast figures
• Compare figures or statements
• Provide justifications for steps in a solution process
• Extend a pattern
• Retrieve information from a table, graph, or figure and use it to solve a problem requiring multiple steps
• Translate between tables, graphs, words and symbolic notation
• Select a procedure according to criteria and perform it
Verbs: Apply, Calculate,
Categorize, Classify, Compute,
Construct, Convert, Estimate,
Find, Graph, Identify patterns,
Predict, Relate, Represent,
Show, Simplify, Solve, Sort,
Use, Organize, Make
Observations, Collect and
Display Data, Compare Data

Dual-Credit Education Programs in Texas: Phase II
AMERICAN INSTITUTES FOR RESEARCH | AIR.ORG 270
Level Definition Sample Activities Verbs/Statements to look for
3 Strategic
Thinking
Requires
reasoning,
developing a plan
or a sequence of
steps, some
complexity
• Interpret information from a complex graph
• Explain thinking when more than one response is possible
• Make and/or justify conjectures
• Develop logical arguments from a concept
• Use concepts to solve problems
• Perform procedure with multiple steps and multiple decision points
• Generalize a pattern
• Describe, compare, and contrast solution methods
• Formulate a mathematical model for a complex situation
• Provide mathematical justifications
• Solve a multiple-step problem supported with a mathematical explanation that justifies the answer
• Formulate an original problem, given a situation
Verbs: Check, Critique, Decide,
Develop, Differentiate, Explain
how, Formulate, Hypothesize,
Interpret, Identify, Judge,
Justify, Reorganize, Solve,
Support
4 Extended
Thinking
Requires an
investigation,
time to think and
process multiple
conditions of the
problem.
• Relate mathematical concepts to other content areas
• Relate mathematical concepts to real-world applications in new situations
• Apply a mathematical model to illuminate a problem or situation
• Conduct a project that specifies a problem, identifies solution paths, solves the problem, and reports results
• Design a mathematical model to inform and solve a practical or abstract situation
NOTE: Level 4 requires applying one approach among many to solve problems. Involves complex restructuring of data, establishing and evaluating criteria to solve problems
Verbs: Appraise, Connect,
Create, Critique, Design,
Judge, Justify, Prove, Report,
Synthesize

Dual-Credit Education Programs in Texas: Phase II
AMERICAN INSTITUTES FOR RESEARCH | AIR.ORG 1
Novice-Expert Continuum
Categories
Definition
Emerging Expert
Ability to apply knowledge in a variety of context Holistic understanding of subject matter rather than fractional
understanding of subject matter Abstract thinking and strong ability to synthesize and integrate information Developed? “Conceptual understanding”—the why
Accomplished Strategic Thinker
Ability to apply abstract thinking, ability to synthesize and integrate variety of sources and information
Command of “conditional knowledge” – the when—when to apply the knowledge
Developing holistic understanding of subject matter rather than fractional understanding of subject matter
Developing “conceptual knowledge” – the why
Strategic Thinker
Able to apply insight, idea generation, concept formation and integrate different subjects/topics
Deep understanding of subject matter Developing abstract thinking, analytical skills and ability to
synthesize/integrate information Developing command of “conditional knowledge” – the when—when to
apply the knowledge
Emerging Strategic Thinker
Developing ability to apply insight, idea generation, concept formation and integrate different subjects/topics
Able to analyze information and discern patterns in information due to familiarity with subject
Command of “procedural knowledge” – the how
Accomplished Novice
Connecting subject matter to big ideas, aware of complexity of subject Developing contextual knowledge Meets basic expectations and guidelines Ability to interpret and apply information Demonstrates “declarative/descriptive knowledge” – the what
Novice Thinker
Superficial understanding of subject area, concept formation, solution seeking skills
Developing ability to interpret and discern rules and guidelines regarding basic standards
Emerging Novice Limited background in subject area, minimal contextual understanding of subject
Developing ability to meet basic standards and requirements

LOCATIONS
Domestic: Washington, (HQ) | Monterey, Sacramento, and San Mateo, CA | Atlanta, GA | Honolulu, HI | Chicago and Naperville, IL
Indianapolis, IN | Metairie, LA | Waltham, MA | Frederick and Rockville, MD | Chapel Hill, NC | New York, NY | Columbus, OH | Cayce, SC
Austin, TX | Reston, VA
International: El Salvador | Ethiopia | Haiti | Honduras | Zambia
4947_07/18
Established in 1946, the American Institutes for
Research (AIR) is an independent, nonpartisan,
not-for-profit organization that conducts behavioral
and social science research on important social
issues and delivers technical assistance, both
domestically and internationally, in the areas of
education, health, and workforce productivity.
MAKING RESEARCH RELEVANT
AMERICAN INSTITUTES FOR RESEARCH
1000 Thomas Jefferson Street NW
Washington, DC 20007-3835 | 202.403.5000
www.air.org