dtic se'ec - defense technical information center · ~aug se'ec0 4mte s a. m. johnson g...
TRANSCRIPT
AFWAL-TR-87-2089
OPTICAL FIRE DETECTOR TESTING IN THE AIRCRAFTENGINE NACELLE FIRE TEST SIMULATOR
DTICSE'ECTE~AUG 0 4M
S A. M. Johnson G 48BOEING ADVANCED SYSTEMS SFP.O. Box 3707Seattle, WA 98124-2207
March 1988FINAL REPORT for period July 1985-October 1986
Approved for public release; distribution is unlimited.
AERO PROPULSION LABORATORYAIR FORCE WRIGHT AERONAUTICAL LABORATORIESAIR FORCE SYSTEMS COMMANDWRIGHT-PATTERSON AIR FORCE BASE, OHIO 45433-6563

UNCLASSIFIEDSECURITY CLASSIFICATION OF THIS PAGE
REPORT DOCUMENTATION PAGEla REPORT SECURITY CLASSIFICATION lb. RESTRICTIVE MARKINGS
UNCLASSIFIED2a. SECURITY CLASSIFICATION AUTHORITY 3. OISTRIBUTION/AVAILABILITY OF REPORT
Approved for public release; distribution2b. DECLASSIFICATION/DOWNGRADING SCHEDULE is unlimited
N/A4. PERFORMING ORGANIZATION REPORT NUMBER(S) 5. MONITORING ORGANIZATION REPORT NUMBER(S)
D180- 30348-1 AFWAL-TR- 87-208964. NAME OF PERFORM;NG ORGANIZATION b. OFFICE SYMBOL 7a. NAME OF MONITORING ORGANIZATION
(Itappiabik) Air Force Wright Aeronautical LabsBoeing AdvaVice Systems Aero Propulsion Laboratory (AFWAL/POSF)
6c. ACDRESS (City. State and ZIP Code) 7b. ADDRESS (City. State and ZIP Code)
P0B 3707, M/S 33-14 Wright Patterson AFB, OH 45433-6563Seattle, WA 98124-2207
B.. NAME OF FUNDING/SPONSORING 8b. OFFICE SYMBOL 0. PROCUREMENT INSTRUMENT IDENTIFICATION NUMBERORGANIZATION (if aDplcable)
_ __-_ _F33615-84-C-2431Bc. ADDRESS (City, State and ZIP Code) 10. SOURCE OF FUNDING NOS.
PROGRAM PROJECT TkSK I WOPK UNOI1ELEMENT NO. NO. NO. NO.
11. TITLE (In Cude Security Classificationj 62203F 3048 07 94see continuation page
12. PERSONAL AUTHOR(S)
A.M. Johnson13. TYPE OF REPORT 13b. TIME COVERED 14. DATE OF REPORT (Yr., Mo.. Day) 18. PAGE COUNT
FINAL FROM July 85 TOA~t 86 March 1988 8516. SUPPLEMENTARY NOTATION
17 COSATI CODES 18. SUBJECT TERMS (Continue on reverse if neeessa and identfy by block number)
FIELD GROUP SUB. GR. crew warning unit, infrared, optical detector, sensor,21 04305 sensitivity, ultra-violet, fire detection
19 ABSTRACT (Con.inue on reverse it necessary and identity by blocl numberl
Optical fire detector systems for aircraft engine compartments provided by fire vendorswere evaluated in the Aircraft Engine Compartment Fire Test Simulator (AENFTS). Theirability to sense JP-4 fires of two sizes and provide fire warnings in a variety ofsimulated fliqht environments was monitored along with their freedom from false firewarnings. One systems was identified which provided fire warnings for every test fireand was completely free of false alarms.
20 DISTRIBUTION/AVAILABILITY OF ABSTRACT 21. ABSTRACT SECURITY CLASSIFICATION
UNCLASSIFIEO/UNLIMITED 4 SAME AS RPT. 0 OTIC USERS C UNCLASS I FI ED* 22& NAME OF RESPONSIBLE INDIVIDUAL 22b. TELEPHONE NUMBER 22c. OFFICE SYMBOL
(Include Area Code)
Lt. Maria D. Rodriquez (513) 255-4208 AFWAL/POSF
0O FORM 1473, 83 APR EDITION OF 1 JAN 73 IS OBSOLETE. UNCLASSIFIEDSECURITY CLASSIFICATION OF THIS PAGE
1111

I -IfCI ASSITTfnSECURITY CLASSIPICATION OF THIS PAGE
11. TITLE: Optical Fire Detector Testing in the Aircraft Engine Nacelle Fire TestSimul ator
ACcesion ForNTIS CRAMI
DTlC TABoUnannounced
Justificationi
By
Avil~ability codes
'Nap 4 DI~t Speial
UNCLASSI FIEDSECURITY CLASSIFICATION OF THIS PAGE

SUMMARY
Engine compartment optical fire sensors provided by Armtec, Pyrotector, Santa
Barbara Research Center and Walter Kidde Company were tested in the Aircraft
Engine Nacelle Fire Test Simulator (AENFTS) at WPAFB. Systron Donner and HTL/K
West were unable to complete development of their sensors within the time
deadline for AENFTS testing. Fenwall chose not to participate in the program.
Considerable optical fire sensor data had been obtained in the AENFTS facility
using an HTL/Graviner ultraviolet sensor. This device responded accurately to
all test fires but all these fires were relatively large fires. Accordingly,
the HTL/Graviner sensor was tested with small fires, 2or various nacelle
altitude and ram pressure simulations and against several false alarm sources.
The resulting performance data of the HTL/Graviner sensor were used as baseline
sensor performance data.
HTL/Graviner Sensor System
The HTL/Graviner sensor system consisted of a single UV detector cell with a
microcomputer and crew warning unit. With the larger (31.2 gallon per hour
(GPH)) fires, the sensor system provided a fire warning for every fire. With
the smaller (1 gallon per hour (GPH)) fires, the sensor system provided a fire
warning for six out of the seven planned test conditions. The exception
occurred at the highest nacelle airflow and ram air pressure simulation (2
lbs/sec at 24 psia), a condition projected for advanced aircraft but not
encountered on current aircraft.
No false alarms were observed during the hot engine soak tests, the hot enginebleed duct tests or with the aircraft strobe light. However, arc welding caused
the detector to indicate the presence of a fire within about one second after
the arc was struck.
Pyrotector Sensor System
The Pyrotector AENFTS optical fire sensor system installation consisted of a
small cylindrical sensor unit with a single flat lens covering the detectors, a
crew warning unit (CWU) box mounted above the AENFTS viewing window, and
[O iii

connecting cables. The sensor, which was mounted in the same position as the
HTL/Graviner sensor, reportedly contained one or more narrow band infrared (IR)
sensors and responded to flicker.
The Pyrotector sensor responded to every fire but did not respond to any of the
false alarms. No test time was lost due to modification, repair or replacement
of the Pyrotector equipment.
Armtec Sensor System
The Armtec optical fire sensor system consisted of a sensor unit containing
three detectors, which was mounted in the same position as the HTL/Graviner and
Pyrotector units, and a control unit containing a microprocessor that was
mounted outside AENFTS test section.
The Armtec sensor system also performed without equipment malfunction during the
entire test period. With the 1 GPH fires, the Armtec system provided fire
warnings for five of the seven planned test conditions; with the 31.2 GPH fires,
*it provided a fire warning for every fire. No fire warning resulted during any
of the false alarm tests.
Other Sensor Systems
Performance of the optical detector systems provided by Santa Barbara Research
Center and the Walter Kidde Company was significantly poorer than that of the
Pyrotector and Armtec systems. Descriptions of these systems and detailed
discussions of the tests results obtained with them are included in Section 3.0
and 4.0 of this document.
Sensor System Status
The sensor systems tested were in various stages of development and most would
require additional development to produce flightweight hardware and pass
environmental tests. The HTL/Graviner system employed as a baseline for these
tests has been flight qualified and subjected to Hil-Std-810 environmental
tasting.
iv
IS II

4
PREFACE
This is a technical operating report of work conducted under F33615-84-C-2431
and submitted by the Boeing Military Airplane Company, Seattle, Washingtcn for
the period 30 August 1985 through 10 October 1986. Program sponsorship and
guidance were provided by the Fire Protection Branch of the Aero Propulsion
Laboratory (AFUAL/POSH), Air Force Wright Aeronautical LaboratoLies, Air
Force Systems Command, Wright-Patterson Air Force Base, Ohio, Under Project
3048, Task 07, and Work Unit 94. Robert G. Clodfelter was the program manager.
Additional funds for this effort were provided by the Joint Technical
Coordinating Group on Aircraft Survivability (JTCG/AS).
The contents of this report cover a portion of the work defined under Task III
of the contract, Aircraft Engine Nacelle Fire Test Simulator (AENFTS) Test
Requirements. In general, the task requires utilization of the AENFTS to
establish the fire initiation, propagation, and damage effects exhibited by
aircraft combustible fluids under representative dynamic operational
environmental conditions, followed by the evaluation and development of
protection measures. One other report of results has been submitted to date
under Task III.
Boeing Document Number Title
D180-29965-1 Effects of Aircraft Engine Bleed Air
Duct Failures on Surrounding Aircraft
Structure (April 1987)
The test program was performed in conjunction with a similar program being
*conducted in the F-111 test aircraft at the Federal Aviation Administration's
Technical Center (FAA/TC) at Atlantic City, New Jersey. Both programs were
* initiated to determine whether current optical fire detector systems would
provide adequate sensitivity to fires and resistance to false alarms in
Lmv

aircraft engine compartments. The test program discussed herein emphasized
sensor performance whereas the FAA/TC program emphasizes the performance of
complete fire detection systems.
The main thrust of the AENFTS testing was to evaluate the response of various
sensors to large and small fires at simulated flight conditions and false alarm
signals. In the AENFTS the fire sensor location and the location of the fire
were predetermined. The testing at the FAA will focus on sensor response to
fires in a variety of locations throughout the engine compartment. The sensor
manufacturer will not have been advised concerning these locations prior to
testing. To protect the F-111 test article, smaller fires and more limited
flight simulations will be used, compared with those possible in the AENFTS.
Five optical fire sensors were tested in the AENFTS. Baseline tests were
performed on an HTL/Graviner system which is currently being flight tested on an
F-111 airplane. Tests were also conducted on sensors provided by Walter Kidde,
Santa Barbara Research Center, Armtec and Pyrotector. The Pyrotector sensor was
N the only sensor that responded to all the AENFTS fire tests and to none of the
simulated false alarms. All vendors agreed to public release of the test
results.
Boeing wishes to acknowledge with appreciation the contributions of the
following to this program: Lt. Maria D. Rodriguez, the Air Force Project
Engineer, who provided overall program direction, Robert E. Esch of SelectTech
Services Corp. of Dayton, the test technician, Albert J. Meyer, SelectTech, the
test instrumentation engineer and Tracey L. Ledwick, also of SelectTech, the
programmer and computer operator. Contributions from the various fire detector
vendors were particularly important and included help with the planning of the
0
Vi
program, provision of the systems for evaluation and their installation and
operation. Contributors included:
Walter Kidde Company
Anthony Scofield, Gordon Nelson, Dr. Edward Manring, Robert Glaser and
Mark Mitchell
SBRC
Mark Kern, Dan Snider and Ken Shamordola
Armtec
John Jordan and Art Pearson
HTL
Tom Hillman and Mike Cullen
Pyrotector
Robert Dunbar and David Estrela
Key Boeing contributors to the program were: Alan M. Johnson, test supervision,
and Lynn Desmarais, report preparation assistance.
vii
TABLE OF CONTENTS
Section Page
1.0 INTRODUCTION 1
1.1 Background 1
1.2 Objective and Approach 3
2.0 TEST FACILITIES 5
2.1 AENFTS Facility 5
2.2 F-16 Nacelle Simulator, Igniter and Flame Holder 8
2.3 Instrumentation, Data Acquisition and Data Reduction 11
2.3.1 Basic Test Instrumentation 11
2.3.2 AENFTS Video Instrumentation 14
2.3.3 Acquisition and Reduction of Basic AENFTS Data 14
2.3.4 Disposition of Test Data 16
2.4 Test Procedure 1602.4.1 Sensitivity Tests 16
2.4.2 False Alarm Tests 18
3.0 TEST ARTICLE 23
3.1 Baseline HTL/Graviner System 23
3.2 W. Kidde System 26
3.3 SBRC System 27
3.4 Armtec System 34
3.5 Pyrotector System 34
3.6 Suitability of the Sensors to an Aircraft Nacelle Environment 38
4.0 RESULTS 39
4.1 Sensitivity Testing 39
4.1.1 Baseline Tests with HTL/Graviner System 39
4.1.2 W. Kidde Company System Testing (First Series) 41
4.1.3 W. Kidde Company System Testing (Second Series) 41
4.1.4 Santa Barbara Research Center System Testing (SBRC) 43
4.1.5 Armtec System Testing 44
4.1.6 Pyrotector System Testing 45
viii
j
TABLE OF CONTENTS (Concluded)
Section Page
4.2 False Alarm Testing 45
4.2.1 Baseline Tests with HTL/Graviner System 45
4.2.2 W. Kidde System Testing (First Series) 46
4.2.3 W. Kidde System Testing (Second Series) 46
4.2.4 Santa Barbara Research Center System Testing 46
4.2.5 Armtec System Testing 47
4.2.6 Pyrotector System Testing 47
5.0 ANALYSIS OF RESULTS 48
5.1 Sensitivity 48
5.2 False Alarm Immunity 49
6.0 CONCLUSIONS AND RECOMMENDATIONS 50
6.1 Conclusions 50
6.2 Recommendations 51
REFERENCES 53
ACRONYMS AND ABBREVIATIONS 54
APPENDIX A
Operational Status of SM-ALC'S UVAFDS A-i
APPENDIX B
AENFTS Data Reduction Equations B-i
p
ix
R0040

LIST OF ILLUSTRATIONS
Figure Description Page
1 Components of the AENFTS 6
2 AENFTS Test Section 7
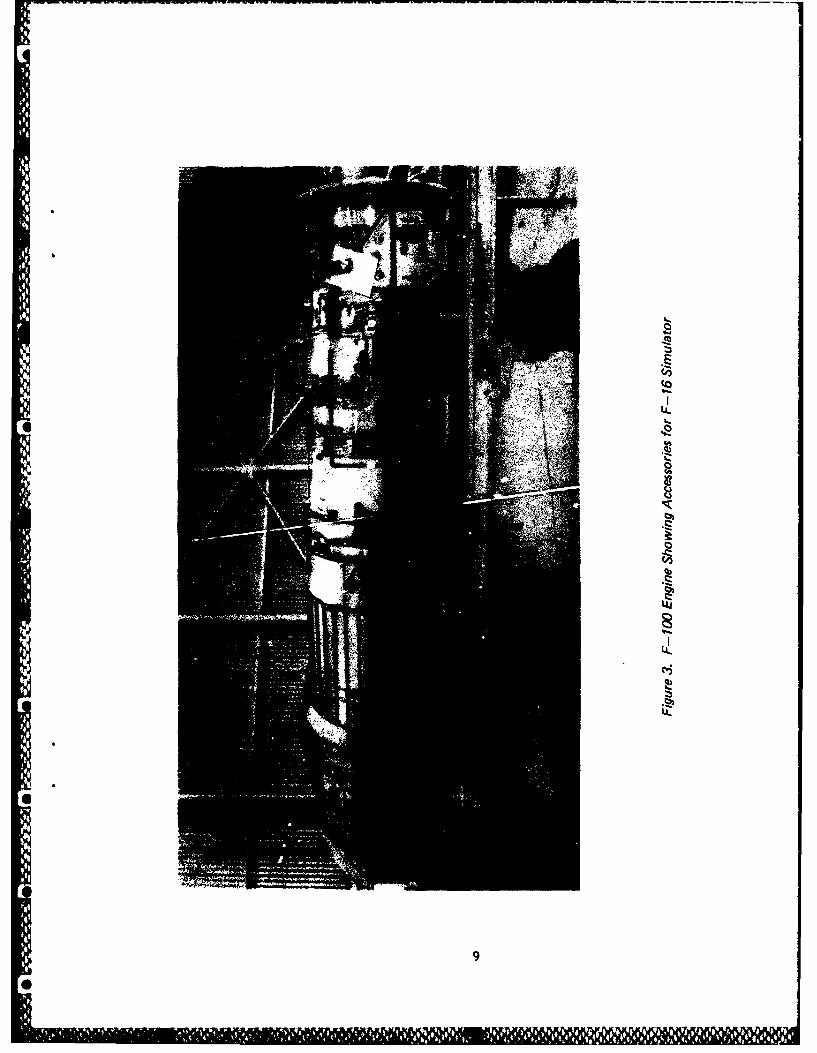
3 F-100 Engine Showing Accessories for F-16 Simulator 9
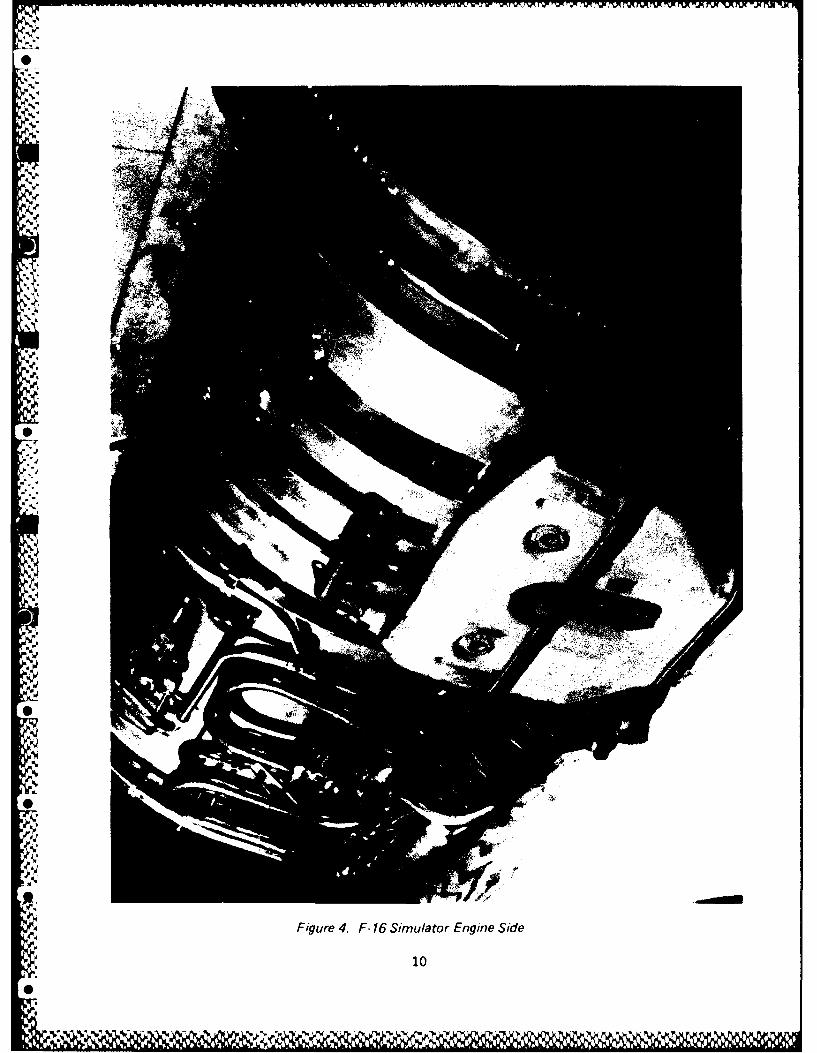
4 F-16 Simulator Engine Side 10
5 AENFTS Instrumentation Schematic 12
6 31.2 GPH Fires at Three Ventilation Flowrates 19
7 1.0 GPH ?ires at Three Ventilation Flowrates 20
8 Optical Fire Detector False Alarm Test Devices 22
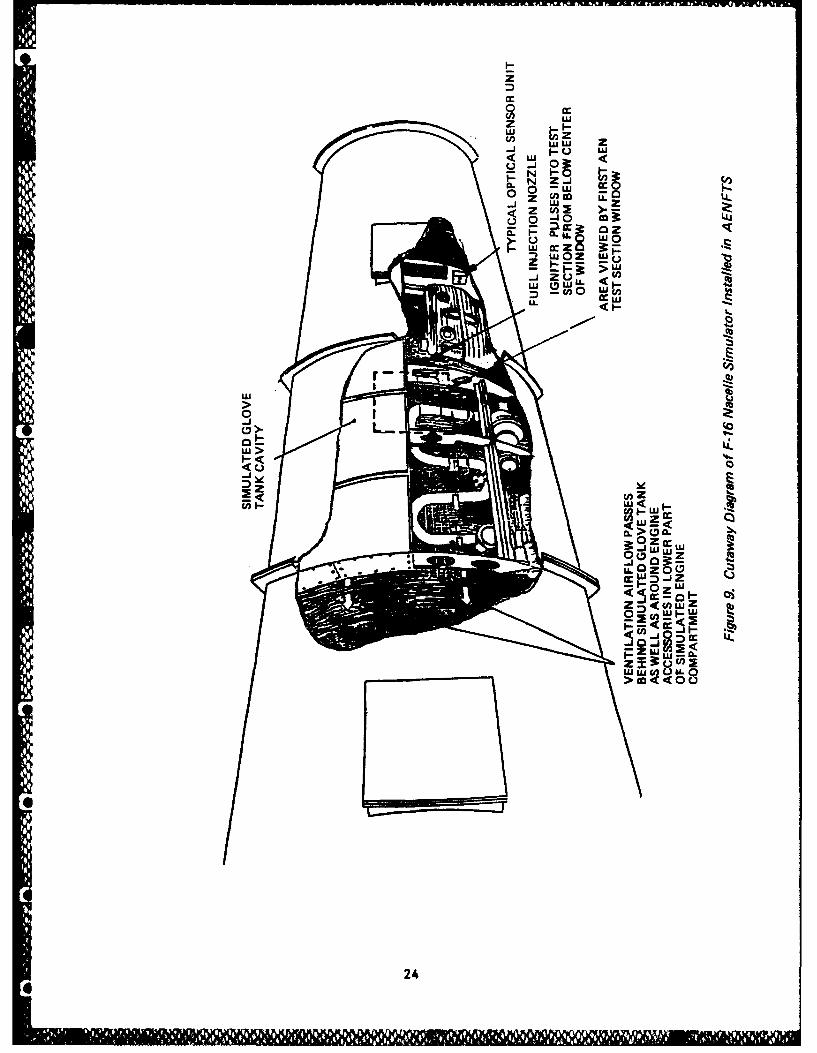
9 Cutaway Diagram of F-16 Nacelle Simulator Installed in AENFTS 24
10 HTL/Graviner UV Sensor Unit 25
11 W. Kidde Sensor Units Installed in AENFTS on Forward Bulkhead 25
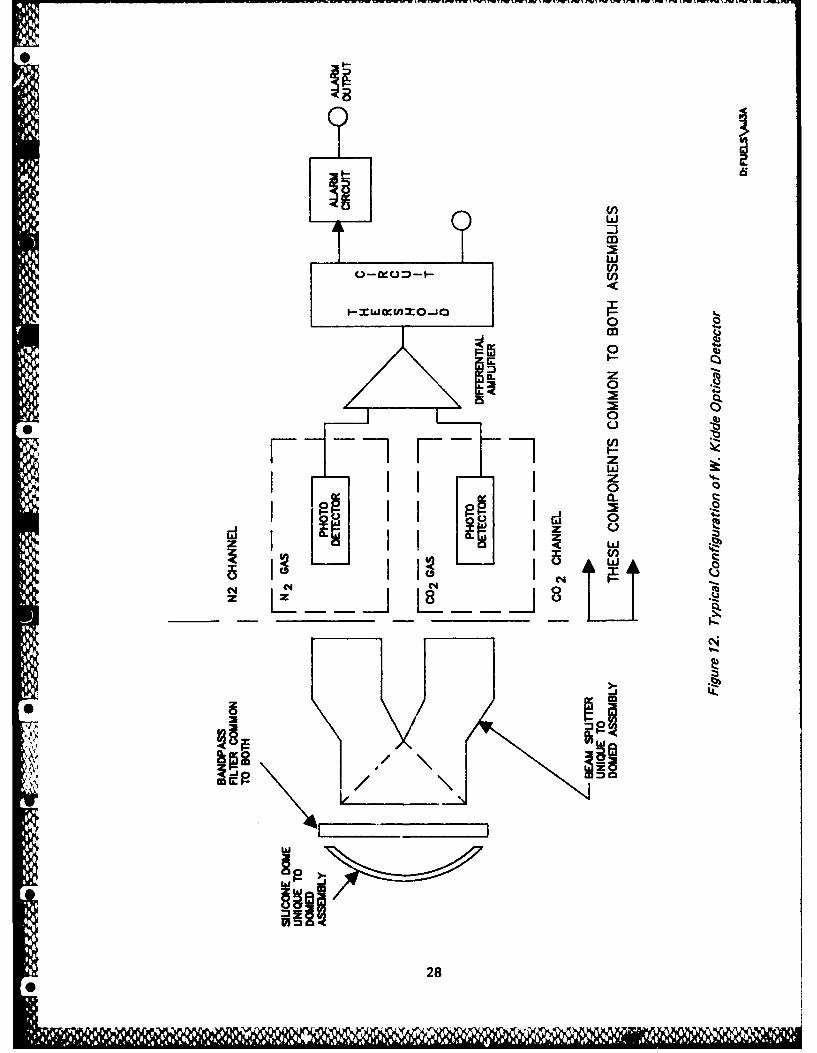
12 Typical Configuration of W. Kidde Optical Detector 28
0 13 CWU for W. Kidde System Installed Above AENFTS Viewing Window 29
14 W. Kidde Sensor Unit, Front View 30
15 W. Kidde Sensor Unit, Side View 30
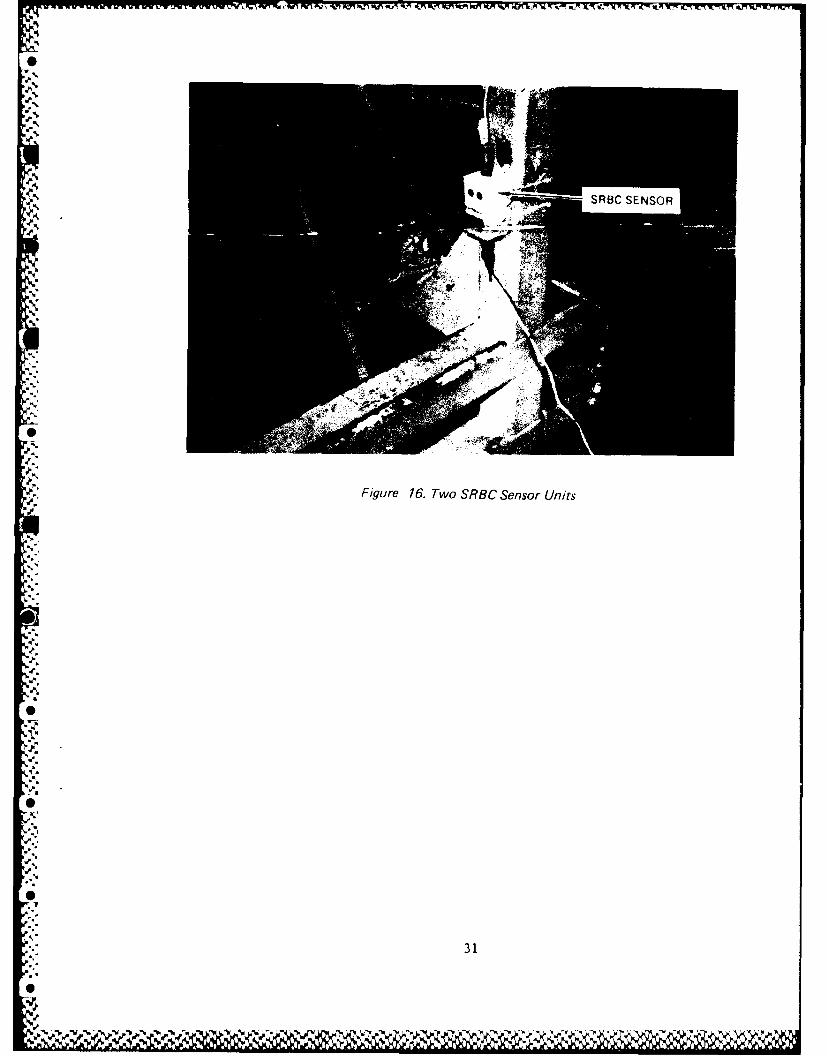
16 Two SRBC Sensor Units 31
17 SBRC Sensor Functional Diagram 33
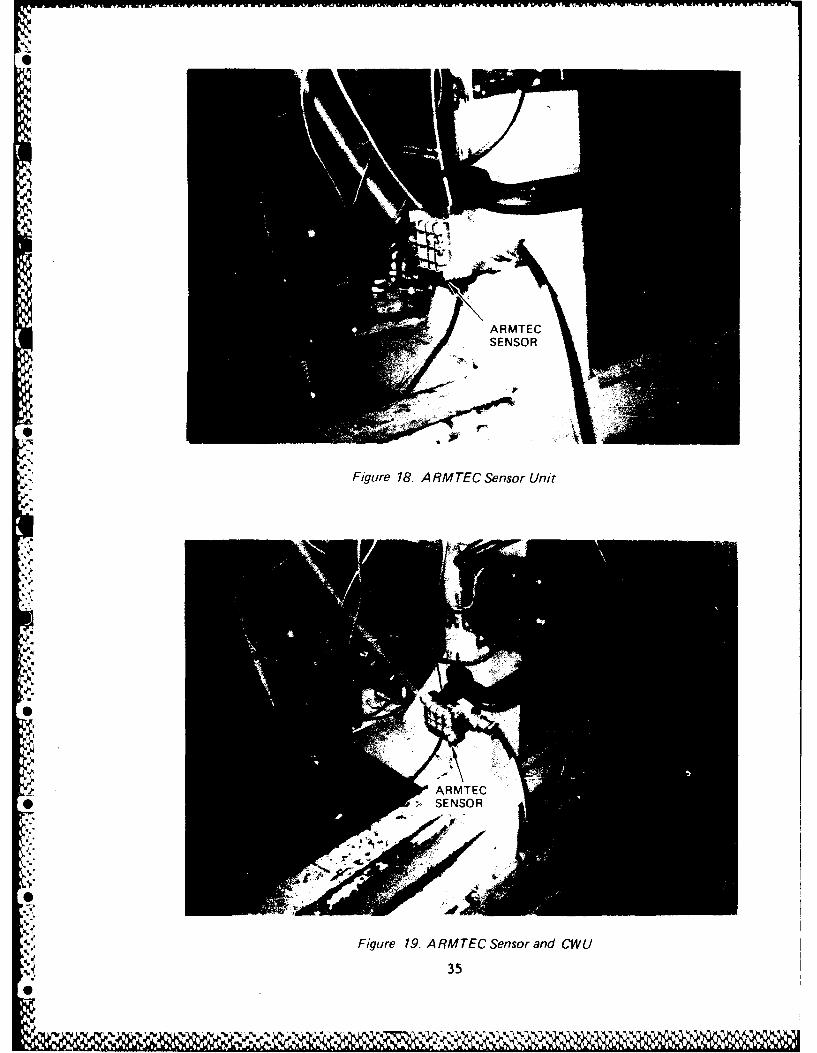
18 Armtec Sensor Unit 35
19 Armtec Sensor and CW 35
20 Block Diagram of Armtec Optical Detector 36
21 Pyrotector Detector Unit 37
22 Block Diagram of Pyrotector Optical Detect-r 37
a....)
S

LIST OF TABLES
Table Description Page
I Details of AENFTS Pressure Measurement 132 Details of AENFTS Temperature Measurement 15
3 Sensitivity Test Conditions 17
4 Summary of Test Results 40
4xi

1.0 INTRODUCTION
The suitability of curtently available optical fire sensors for use in aircraft
engine compartments was investigated in the Aircraft Engine Nacelle Fire Test
Simulator (AENFTS) at Wright Patte.son Air Force Base (WPAFB). Sensors provided
.by four vendors were evaluated and compared with a baseline ultraviolet (UV)
aircraft engine compartment fire sensor that had been used extensively in
previous AENFTS testing. The sensitivity of the sensors to JP-4 fires of
several sizes at various simulated flight conditions was investigated along
with their immunity to a variety of simulated false alarms.
1.1 Background
Most current Air Force aircraft have continuous loop fire detection systems
installed in their engine compartments to detect engine fires and/or overheat
7 conditions. Three major problems with this type of protection have been
experienced during the last several decades:
o These systems are prone to damage during maintenance work,
particularly during removal and replacement of engines.
o A small fire or a fire sufficiently far from the detector will not be
dcected.
o The relatively high false alarm rate has eroded crew confidence in
these systems.
During the late 1970's General Dynamics developed a prototype ultraviolet (UV)
fire sensor system under contract F33614-77-C-2029, with help from HTL
Industries Incorporated and Graviner LTD. This system was installed on an F-1ll
test airplane for evaluation as part of that contract. Tests on the UV system
indicated that its immunity to false alarms was significantly better than the
continuous element systems. Once the UV system was installed on the airplane,
however, its sensitivity to fires in that environment was never demonstrated.
0Following completion of the work under that contract, one of the two available
prototype systems remained on the flight test F-l1l for further evaluation and
the other was moved to WPAFB where it became available for evaluation in the
61, , •
AENFTS. A single detector head was installed in the F-16 Nacelle Simulator in
the AENFTS. The sensor's performance was observed over the the next two years as
several hundred fires were ignited and extinguished as part of agent evaluation
testing in the AENFTS (Ref. 1). The system's sensitivity to the AENFTS test
fires was excellent.
In July of 1985, representatives of all U.S. aircraft fire sensor system
manufacturers were invited to a meeting at the Federal Aviation Administration's
Technical Center (FAA/TC) at Atlantic City, New Jersey. The purpose of this
meeting was to identify promising new technology sensors and to conduct tests to
compare the performance of these sensors.
Included in this meeting were representatives from:
Armtec Industries, Incorporated
Fenwal Incorporated Division of Kidde, Incorporated
HTL K West/Systems Division of HTL Industries, Incorporated
Santa Barbara Research Center of the Hughes Aircraft Company
Systron Donner
- - Walter Kidde Division of Kidde, Incorporated
A test program was developed that involved fire tests in the AENFTS and in the
FAA/TC's F-ll test article. All the representatives indicated a desire to
participate, either during this meeting or subsequently. Later, contact was
also made with Pyrotector, Incorporated. The test program was described to them
and they also indicated a desire to participate. This document describes the
test program and results obtained during AENFTS testing at WPAFB between January
1986 and October 1986.
Incidental to progress in the subject test program, an opportunity arose to
.1 investigate the HTL/Graviner UV system's long term reliability and false alarm
immunity. Representatives from WPAFB's Fire Protection Branch, the USAF Safety
_ Center at Norton AFB, the F-ill and A-10 Program Offices, Boeing and
HTL/Graviner met at McClellan AFB in October of 1986 to review the long-term
performance of that system accumulated during the five years that it had been
installed on a flight test F-Ill since work under contract F33614-77-C-2029 was
2
0w k f-q 1

completed in 1981. Unfortunately, few records concerning the system's
performance had been kept during this period and the system did not appear to be
functional at the time of that meeting. Representatives from HTL/Graviner
investigated the current status of the system thoroughly and prepared a report
that is included in this document as Appendix A.
1.2 Objectives and Approach
Specific objectives of the AENFTS testing were to investigate the sensor's:
o Sensitivity to large and small fires in a simulated engine compartment
o Performance at simulated altitude and ram pressure conditions
o Immunity to simulated false alarms
I
o Response to high temperature airflow
The overall objective was to identify sensors that showed promise as the
foundation for advanced engine compartment fire detection systems.
To achieve these objectives the sensors were exposed to:
o Small fires (1 gallon per hour of JP-4 fuel) and large fires (31.2
gallons per hour of JP-4 fuel) in the AENFTS facility.
o Simulated engine compartment altitudes and ram air pressures
representative of conditions in current and advanced aircraft.
o Several false alarm radiation signals
0 Engine compartment airflow temperatures approaching 3000 F.
During the earlier AENFTS testing of the HTL/Gravimer system, a single optical
detector was installed in the AENFTS's F-16 nacelle simulator and a Crew Warning
Unit (CWU) was installed above the main AENFTS viewing window so that the fire
warning light could be observed in the control room and its response to the fire
r3

recorded on video tape. With the above objectives in mind, it was decided the
detector and CWU units and for the sensors to be evaluated would be installed in
the same position as had been employed for the HTL/Graviner sensor. False alarm
tests would be conducted with the sensors moved outside the AENFTS test section
to allow the false alarm signal sources to be easily operated and moved with
respect to the sensors.
During the period between the initial July 1985 meeting and the conduct of the
individual tests, the vendors were allowed brief test periods in the AENFTS
where they could set up sensors, spectral analysis equipment or combinations of
these and observe some of the tests. They were also provided with copies of
video tapes showing these test fires viewed through the main AENFTS viewing
window.
~I~4
IF!
I0I i 1 1 11

2.0 TEST FACILITIES
2.1 AENFTS Facility
The Aircraft Engine Nacelle Fire Test Simulator (AENFTS) is a ground test
facility designed to simulate potential fire hazards in the annular compartment
around an aircraft engine. The facility is installed in I-Bay of Building 71-B
in Area B of Wright-Patterson Air Force Base, Ohio. The facility includes air
delivery and conditioning equipment designed to simulate engine compartment
ventilation and bleed airflow, a test section within which fire testing can
safely be conducted and an exhaust system which can cool the combustion products
and scrub them sufficiently to allow their release into the atmosphere
(Figure 1).
The test section of the AENFTS (Figure 2) consists of a two radian (114 degree)
segment of the annulus between a 15 inch radius duct, which simulated an engine
case, and a 24 inch radius duct, which simulated the engine compartment outer
wall. It is approximately 14 feet long and is constructed from 1/4 inch
stainless steel. Various access ports and viewing windows are provided for
access to test equipment and instrumentation and for observation of the test
activities taking place within.
Aircraft engine compartment ventilation air velocity, pressure and temperature,
fan case temperature, nacelle geometry, and the introduction of aircraft
flammable fluids can be simulated. Aircraft fire extinguishing agent release
systems can be simulated using various extinguishants, and the effect of these
on fires in the AENFTS can be observed and recorded.
As shown in Figure 1, the AENFTS ventilation airflow conditioning systems
include a blower which provides air at atmospheric pressure to simulate low
speed sea level flight conditions, a high pressure compressor and air storage
* bottle farm which can provide ventilation airflow simulating ram pressure in low
altitude supersonic flight conditions and an air driven ejector which can
evacuate the test section to simulate high altitude flight conditions. The
shorter curved test section wall, which simulates the case of a turbojet or
turbofan engine, can be heated with radiant heaters. The test section can be
rotated 360 degrees allowing simulation of any 114 degree segment of an aircraft
engine compartment.
5
0IN IlWRE 11

I SCRUBBING FAIRi
ATMOSPHERIC
(ARROWS ~ ~ ~ ES INIAEAIFOECTION
Figure 1. Components of the AENFTS
6

00
z Li.
cn >oCLwwuJ -J ma
I. -
w Lu L>-LLJ 3- co-
x 2 Z La
0 - J<
0 Z Qw I .\ % 70n-z

Additional information concerning the AENFTS is available in Reference 2, the
AENFTS Operating Manual.
2.2 F-16 Nacelle Simulator, Igniter and Flame Holder
In an actual aircraft engine compartment, the ventilation airflow does not move
uniformly as in the clean AENFTS test section. Regions of reverse flow and flow
stagnation have been seen in the F-ill being tested by the Federal Aviation
Administration's Technical Center (FAA/TC) and the F-111 engine compartment is
cleaner and designed for higher ventilation airflow rates than the F-15 and F-16
engine compartments. To simulate a more realistic environment, having the
compX.A of tubes, ribs, clamps, wires, and other flow disturbances of a real
aircraft engine compartment, a region of the F-16 nacelle was simulated for
testing in the AENFTS during 1984.
The forward right side of the F-1O0 engine as it is installed in the F-16 is
shown in Figure 3. An early prototype F-1O0 engine was obtained and the
components in this region were removed and installed on a 5 foot long simulated
engine side stainless steel base plate constructed to fit the engine side of the
AENFTS test section (Figure 4). Intrusion into this region of the glove tank
and structural ribs was simulated in sheet metal and fitted into the AENFTS test
section over the engine side base plate. The remaining AENFTS test section
length, approximately 60 inches, simulated the less cluttered annulus around the
afterburner.
To further simulate the F-16 installation, the AENFTS test section was rotated
to the seven o'clock to eleven o'clock position (looking aft). A fused quartz
viewing window was provided in the 15 inch square access port on the nacelle
side of the AENFTS which opened onto the forward "arch" of the F-16 bleed duct
which was the planned fire zone.
In the F-16, ventilation air enters the engine compartment through a scoop inlet
on each side adjacent to the fan face of the engine and in some operating
conditions, through spring loaded fire doors near the base of the engine
compartment, about 18 inches aft of the scoops. These were simulated with an
inlet baffle plate at the fan face location with slotted openings approximating
one third of the area of the aircraft nacelle ventilation inlets and fire doors.
8
L-
4-b
0j
AM,-
0
dw,
Figure 4. F- 16 Simulator Engine Side
10
A baffle plate was also placed at the exit end of the last AENFTS test section
to simulate the flow area in the F-16 engine compartment as the ventilation flow
exits around the afterburner.
A fuel injection nozzle is located in the shelter of the simulated aircraft rib
structure adjacent to the leading edge of the viewing window. A "vee-channel"
flameholder is installed around the fuel nozzle. Two spray nozzles were
employed to inject JP-4 into the simulator for all optical fire sensor tests.
These included a 1.0 GPH oil burner nozzle, a duplicate of the nozzle to be
employed during the optical detector testing at FAA/TC and a 31.2 GPH stainless
Nsteel hollow core 80 degree atomizing spray nozzle.
Earlier AENFTS testing with the HTL/Graviner detector was complicated by the UV
sensor's response to a spark igniter that was installed adjacent to the
flameholder. A propane fueled igniter was developed which allowed the spark to
0 be relocated outside of the test section, eliminating this problem.
2.3 Instrumentation, Data Acquisition and Data Reduction
2.3.1 Basic Test Instrumentation
The basic test instrumentation (Figure 5) consisted of the sensors employed to
measure the simulated engine compartment ventilation air temperature, pressure
and flowrate, whether it was supplied by the atmospheric blower or by one of the
high pressure air systems, and the temperatures in the test section. Additional
equipment was employed to acquire video records of the testing.
Seventeen pressure transducers were used to acquire pressure data during these
tests. These transducers were standard commercial products manufactured by
Sensotec and Setra. They were precalibrated by their manufacturers with
standards traceable to the National Bureau of Standards. Their calibration had
* been periodically checked during the last several years using a dead weight
tester. Details of the transducer ranges, sensitivities and accuracies are
included in Table 1.
0_ Type J, K and T thermocouples were used to measure the simulated ventilation
airflow temperature at the flowmeters, the air temperature in the test section
11

US0
I 13-PRI ~nirz
SSWAIICO UE! 4
"D 0< 4 dzt, =
0 U. %Nui 0UH Ni ~=5*
olzi tl
01:101CO 'U 0 0
NO I -Ri
RL___ ccI-_r
0i J C
r4 V
0
A..
0j

Table 1. Details of AENFTS Pressure Measurement
PRESSURE MODCOMP SOFTWARE ITEM
NUMBER CHANNEL SYMBOL DESCRIPTION MFG&S/N RANGE ACCURACY
PT-1 57 PBLOUT Blower outlet press S-34212 0-50 in. H20 +0.25
PT-2 69 DPVENT 24" venturi delta P S-33659 0-60 in. H20 +0.5
PT-4 59 PNACIN AEN inlet press S-34214 0-30 psia +0.25
PT-5 60 PEXFAN Scrubber inlet press S-27984 0-16 in. H20 +0.25
PT-6 61 PHIFLO Hi press/hi flow
nozzle press 0-1000 psia +0.25
PT-7 62 PLOFLO Hi press/lo flow
nozzle press 0-640 psia +0.25
PT-8 63 PEJFLO Ejector nozzle press 0-500 psia +0.25
PT-9 64 PNCOUT AEN outlet press 0-30 psig +0.25
PT-10 65 P-STOR High press line press 0-2500 psig +0.25
* PT-1I 66 P-FUEL Fuel reservoir press 5-34218 0-420 psig +0.5
PT-12 67 P--HYD Hydraulic reservoir 0-5000 psig +0.25
PT-13 68 PBAROM Barometric press S-40737 26-32 in.Hg +0.25
PT-14 78 PNZFUL Fuel nozzle press S-48291 0-500 psig +0.25
PT-15 77 PNZHYD Hydraulic fluid
nozzle press 0-5000 psig +0.25
PT-16 79 PLFLIN 8" venturi inlet press S-50823 +1.3 psig +0.1
PT-17 51 DPVN-4 8" venturi delta P M-21784-1 0-4 in. N2o +0.15
PT-1 50 DPVN40 6" venturi delta P M-21784-2 0-40 in. M20 +0.15
Manufacturers: S: Sensotec
* QM: MKS
ST: Setra
*Percent of full scaie reading
6
13
6V

and surface temperatures along the AENFTS and the F-16 nacelle simulator. Table
2 describes the location, nomenclature, channel assignment, accuracy and
measurement location of all these thermocouples.
2.3.2 AENFTS Video Instrumentation
A closed circuit television camera equipped with a F 2.8, 15- to 150-mm zoom
lens was mounted on a pan and tilt platform. During these tests, the camera was
focused on the main AENFTS viewing window so that both the test fires and the
sensor system's CWU were observed. The output signal could be monitored on a
video monitor on the AENFTS control panel to allow the test operator to observe
the test fire and the sensor system's response.
A date/time generator provided date and time information (to the nearest second)
which was also displayed at the top of the screen on the control room video
monitor. A U-matic format video tape recorder also received signals from the
video camera in the test cell and from the date/time generator. Video tapes were
made of all the optical fire detector tests using this equipment. Because 60
video ficlds were acquired per second, the actual timing resolution available
replaying the tapes was about 1/60-th second.
2.3.3 Acquisition and Reduction of Basic AENFTS Data
The AENFTS facility computer is a 16-bit, general purpose, digital computer for
teal time multi-programming applications with 64 K RAM memory manufactured by
Modular Computer Systems Inc. (ModComp) of Ft. Lauderdale, Florida.
Data was acquired by the AENFTS computer and reduced to appropriate pressure and
temperature engineering units using previously acquired calibration data. Once
the ModComp computer had calculated engineering unit data for thu thermocouples
and pressure transducers and the bleed air system flow meter, these data were
displayed on the control console monitor and output to the line printer and
ModComp data disk for storage. The actual data reduction equations employed are
included in Appendix B of this report. Further details concerning the ModComp
computer and the software employed are available (References 3 and 4).
A video tape record was made of all tests to allow re-examination of test events
after their occurrenre, determination system response times and allow direct
comparison of tests run at different times.
14

T Table 2. DetailsofA ENFTS Temperature Measurement
THERMO-COUPLE MODCOMP SOFTWARENUMBER CHANNEL SYMBOL DESCRIPTION TYPE ACCURACY
TC-28 1 TENGIA Engine side skin temp zone 1 K +4 degrees F.TC-29 2 TENGIB Engine side skin temp zone 1TC-30 3 TENG2A Engine side skin temp zone 2TC-31 4 TENG2B Engine side skin temp zone 2TC-32 5 TENG3A Engine side skin temp zone 3TC-33 6 TENG3B Engine side skin temp zone 3TC-34 7 TENG4A Engine side skin temp zone 4TC-35 8 TENG4B Engine side skin temp zone 4TC-36 9 TENG5A Engine side skin temp zone 5TC-37 10 TENG5B Engine side skin temp zone 5TC-38 11 TENG6A Engine side skin temp zone 6TC-39 12 TENG6B Engine side skin temp zone 6TC-40 13 TAIR-1 Nacelle air temp zone 1TC-41 14 TAIR-2 Nacelle air temp zone 2TC-42 15 TAIR-3 Nacelle air temp zone 3TC-43 16 TAIR-4 Nacelle air temp zone 4TC-44 17 TAIR-5 Nacelle air temp zone 5TC-45 18 TAIR-6 Nacelle air temp zone 6TC-46 19 TNACIA Nacelle side skin temp zone 1TC-47 20 TNAC1B Nacelle side skin temp zone 1TC-48 21 TNAC2A Nacelle side skin temp zone 2TC-49 22 TNAC2B Nacelle side skin temp zone 2TC-50 23 TNAC3A Nacelle side skin temp zone 3TC-51 24 TNAC3B Nacelle side skin temp zone 3TC-52 105 TF6-1 Test article temp # zTC-53 106 TF16-2 Test article temp #2TC-54 107 TF16-3 Test article temp #3TC-55 108 TF16-4 Test article temp #4TC-56 109 TF16-5 Test article temp #5TC-57 110 TF16-6 Test article temp #6TC-58 i1 TF16-7 Test article temp #7TC-58 31 TOUTLG Nacelle outlet air temp (long)TC-59 32 TOUTSH Nacelle outlet air temp (short)
TC-60 33 TNACIN Nacelle inlet air temp KTC-61 34 TBL-08 Low flow venturi temp T
* TC-62 35 TBL-24 Blower outlet temp KTC-63 35 T-NIFL Hi flo/Hi press tempTC-64 .7 TSTKLO Lower exhaust stack tempTC-65 38 TSTKUP Upper exhaust stack tempTC-70 39 OATPAD Pad outside air temp
40 OAT-RF Roof outside air temp41 TNACRM Nacelle room air temp43 T-NPAD North pad temp K44 RTDREF Reference room temp T
TC-72 45 TGLYCO Cold glycol temp JTC-74 47 T--HYD Hyd. reservoir temp JTC-75 46 T-FUEL Fuel injection reservoir temp JTC-91 94 TLOFLO Lo-flo/Hi-press temp T +4 degrees F
15
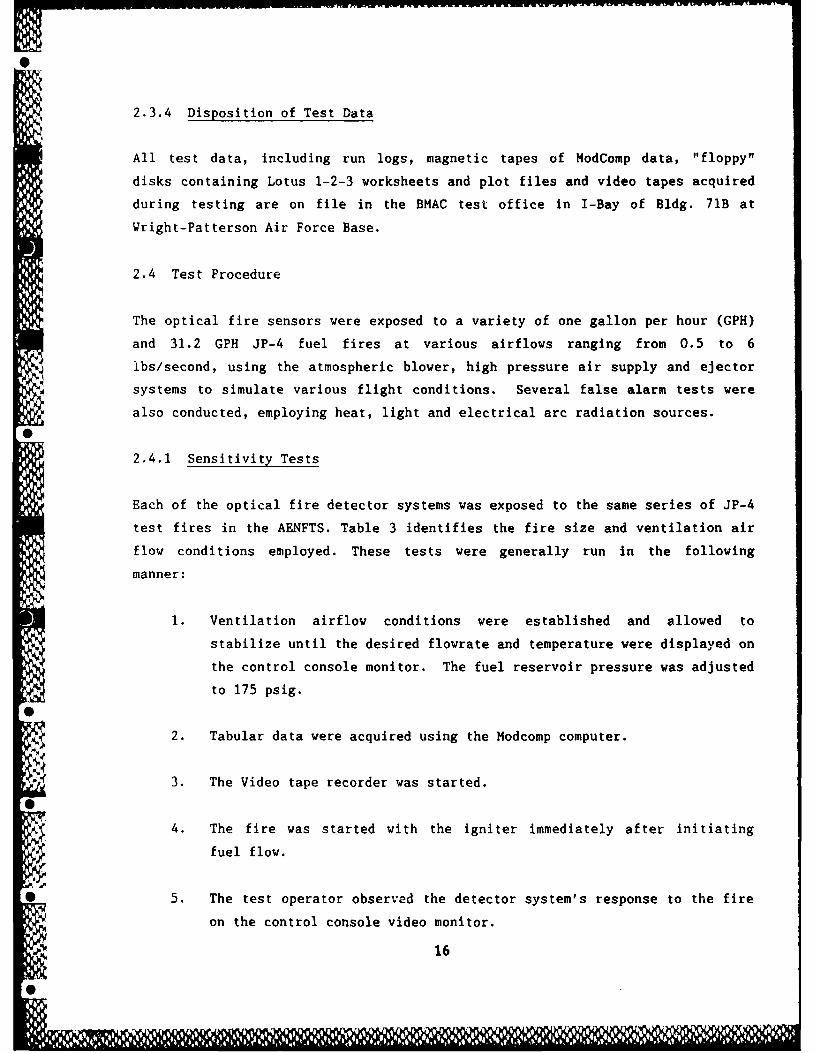
2.3.4 Disposition of Test Data
All test data, including run logs, magnetic tapes of ModComp data, "floppy"
disks containing Lotus 1-2-3 worksheets and plot files and video tapes acquired
during testing are on file in the BMAC test office in I-Bay of Bldg. 71B at
Wright-Patterson Air Force Base.
2.4 Test Procedure
The optical fire sensors were exposed to a variety of one gallon per hour (GPH)
and 31.2 GPH JP-4 fuel fires at various airflows ranging from 0.5 to 6
lbs/second, using the atmospheric blower, high pressure air supply and ejector
systems to simulate various flight conditions. Several false alarm tests were
also conducted, employing heat, light and electrical arc radiation sources.
2.4.1 Sensitivity Tests
Each of the optical fire detector systems was exposed to the same series of JP-4
test fires in the AENFTS. Table 3 identifies the fire size and ventilation air
flow conditions employed. These tests were generally run in the following
manner:
1. Ventilation airflow conditions were established and allowed to
stabilize until the desired flowrate and temperature were displayed on
the control console monitor. The fuel reservoir pressure was adjusted
to 175 psig.
2. Tabular data were acquired using the Modcomp computer.
3. The Video tape recorder was started.S
4. The fire was started with the igniter immediately after initiating
fuel flow.
5. The test operator observed the detector system's response to the fire
on the control console video monitor.
16

Table 3. Sensitivlty Test Conditions
VENTILATION TEST f TEST JP-4ITESTI AIRFLOW I SECTION I SECTION FLOWRATE IINO. I I PRESS I TEMP.
(Ib/sec) I (psia) J (deg F) (GPH) [
1 1 1.00 AMB 100 1.0_ 2 2.50 AMB 100 1.0
3 0.50 AMB 1 100 1.0* 4 0.50.1 7.0 1 100 1.0
5 1.00 1 10.0 1 100 1.06 1.00 20.0 100 1.07 2.00 24.0 100 1.08 1.00 AMB 300 1.09 1.00 AMB 100 31.2
10 3.50 AMB 100 31.2I11 6.00 AMB 100 31.212 0.50 7.0 100 31.213 1.00 10.0 100 31.214 2.00 24.0 100 31.215 6.00 24.0 100 31.216 1.00 AMB 300 31.2
17
6. After about ten seconds of burning, the fuel flow was terminated.
7. The video tape recorder was stopped.
8. A cool off period of about five minutes using the atmospheric blower
at a flowrate of about seven lbs/second was begun during which manual
notes were recorded and the AENFTS switchbox was updated to the next
test condition number.
9. When AENFTS side skin and F-16 simulator temperatures had fallen to a
maximum of 1500 F, the procedure was repeated for the next test
condition.
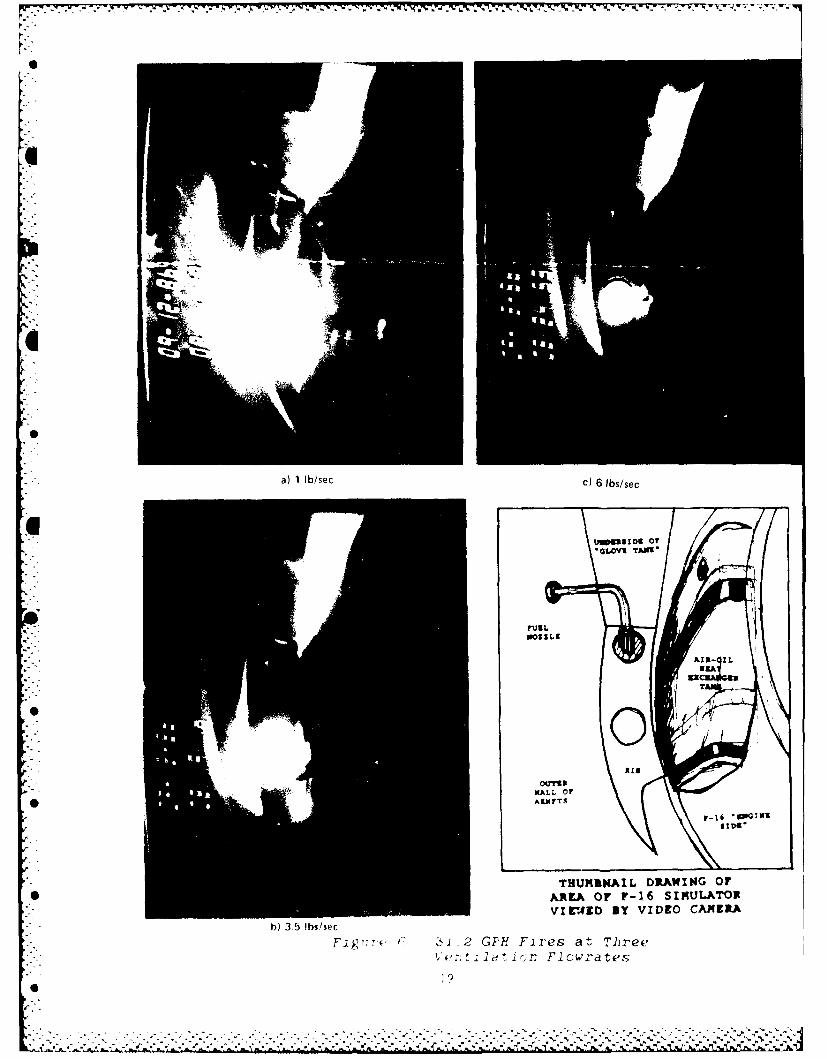
A black and white video camera was installed inside the AENFTS test section,
fastened to the forward bulkhead in place of the optical detector sensor units,
* so that it could be used to view the test fires from the same position as the
sensor units. Atmospheric blower tests were repeated so that video tape records
could be made of these tests. Photographs were made from single frames of the
tapes, and show the sensor's view of the six atmospheric tests (Figures 6
and 7). The camera was equipped with an automatic iris control which adjusted
to the available light. Hence, no conclusion should be drawn from Figures 6
and 7 regarding relative brightness of the test fires. The figures do
demonstrate that these were a line-of-sight view of some part of the fire in all
tests.
2.4.2 False Alarm Tests
Each of the optical fire sensors was also exposed to the same series of
simulated false alarm situations. These tests were generally run in the
following manner:
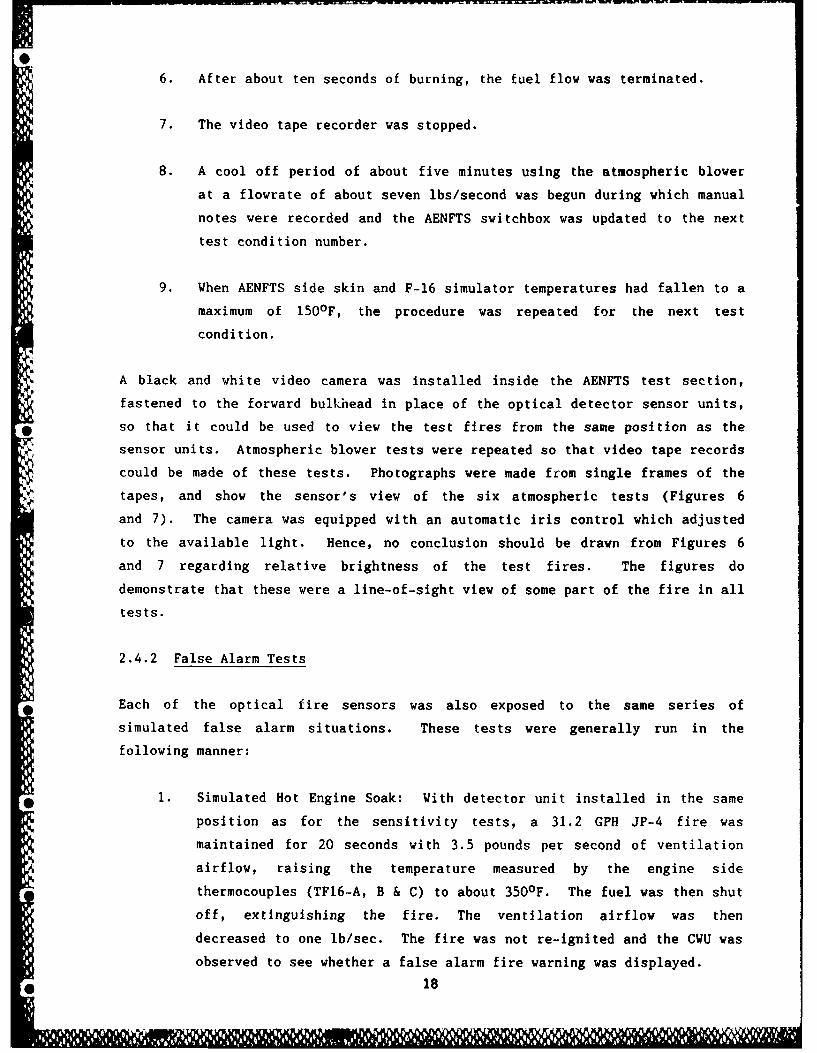
1. Simulated Hot Engine Soak: With detector unit installed in the same
position as for the sensitivity tests, a 31.2 GPH JP-4 fire was
maintained for 20 seconds with 3.5 pounds per second of ventilation
airflow, raising the temperature measured by the engine side
thermocouples (TF16-A, B & C) to about 3500F. The fuel was then shut
off, extinguishing the fire. The ventilation airflow was then
decreased to one lb/sec. The fire was not re-ignited and the CWU was
observed to see whether a false alarm fire warning was displayed.
18
--- w--a) 1 lbse c)Y 6~Y lbs/se c - .' -
ump XIj o6GOI JM
RIKALLID OF
b)~A 3.5-QILp
31 2, PH Flres atTlire1 F 1 r.,.- t v

,..,. ~ ~ ~ ~ a 0.5 - r WN N- p1b T X JVJs/Ii. 7 .I d Vsv- Y\ . 1xecA- ~A'c)25lb/e
Si.S
SS8
*.r orr16SMUAO
) 10. lbs/sec 2.I/s
-SS

At this point the sensor unit was removed from the AENFTS test section
and clamped to the AENFTS structure. Each false alarm source was
positioned on the sensor's nominal incidence axis.
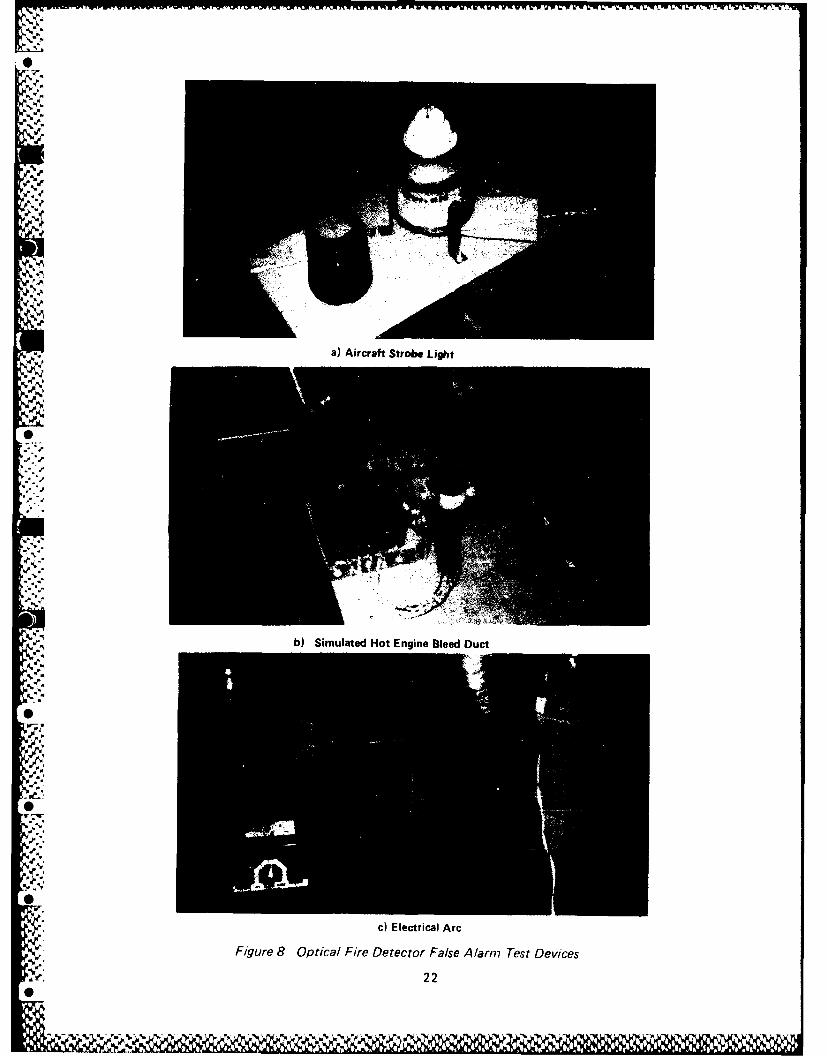
2. Aircraft Strobe Unit: A Whelen Aviation Lighting, Model A 470 strobe
light head assembly with a Whelen HR,DF 200 power supply and A 402
lens (red) was used (Figure 8a). This unit produced a double pulse
strobe flash at about 50 cycles per minute (it flashed twice followed
by a pause with no light for each cycle). With the red lens it
produced approximately 165 candlepower, and approximately 835
candlepower without the lens.
The fire sensor's immunity to this flashing was checked with and
without the red lens. The minimum distance at which it responded to
* the strobe was recorded in each case where there was a response.
3. Simulated Hot Engine Bleed Duct: A six and one half inch segment of
1.40-inch diameter stainless steel rod, drilled to contain three cal
rod heating elements (Figure 8b), was placed 64 inches from the
sensor. This rod was heated first to 8500 F, then to 1040OF and
finally to 12000 F. Any incidence of a fire warning was recorded. At
12000 F, the hot duct was moved closer to the detector. The distance
at which a fire warning was observed was recorded down to a minimum
separation of about 12 inches. The sensor's response to the 1200OF
bleed duct with the aircraft strobe light also operating was checked.
4. Electric Arc: An AC arc welder was operated and electric arcs were
struck at distances of 9 and 5 feet from the sensor (Figure 8c).
These tests employed a #8018 1/8 rod with the welding unit set for 160
amps which provided an erratic but powerful arc and a #6013 1/16 rod* with the welding unit set for 130 amps which provided a more
consistent electric arc. Any incidence of a fire warning was
recorded.
21
0
a) Aircraft Strobe Light
b) Simulated Hot Engine Bleed Duct
c)Eecrca r
Fiue8 pia ieDtctrFleAamTs eie
"22

3.0 TEST ARTICLE
The optical sensors being evaluated were supplied at no cost, although the
baseline HTL/Graviner system had been developed under Air Force contract. The
other four sensors employed one or more infrared (IR) detectors (in one case in
combination with a UV sensor) and microprocessors to process detector inputs and
'. provide a fire warning at some threshold of signal output. All were installed
on the forward bulkhead of the F-16 nacelle simulator (Figure 9). The vendors
were justifiably anxious to guard proprietary information and minimal
description of system components and microprocessor logic was provided. The
following information was approved by the vendors for public release.
3.1 Baseline HTL/Graviner Sensor
The HTL/Graviner sensor, as installed on the F-ill flight test airplane,
employed 5 UV sensors on each engine, located in various fire zones around the
engine compartment. The detector elements were coupled to microcomputers, one
for each engine which gathered historical data, performed self tests and
displayed system status on a single crew warning unit (CWU) in the cockpit.
The systems for the left engine and right engine were slightly different from
each other. The system on the left engine, identified as system A, had dual
detectors in each sensor to provide almost complete redundancy to improve
reliability. The system on the right engine, system B, had a single detector in
each sensor (Figure 10) and less redundancy to reduce costs. Details concerning
this equipment are presented in Reference 5.
The simplified system installed in the AENFTS during 1983 and 1984, consisted of
two sensors with a single detector in each sensor. One sensor was mounted in
the normal location on the forward bulkhead of the F-16 nacelle simulator. A
system B microprocessor computer control unit (CCU) was mounted on the AENFTS
frame adjacent to the upstream end of the first test section. A second system B
sensor was necessary for the CCU to operate, but this was placed in a closed
container where it was shielded from the UV signal. The HTL/Graviner crew
warning unit (CWU) was placed above the AENFTS viewing window where it could be
monitored from the control room and where the sensors response to the test fires
could be recorded on video tape. This simplified system was duplicated for the
23
0
z
-1 0N 4-N z3
CL o j cc
0w oa
uj 0
Lu ccZ 3: : @tuj 0 Z uI-
00
i@-J>
Lu(>
V~:o~o
244z

Figure 10. HTL/Graviner UV Sensor Unit
Figur 11. W. Kid*e Sensor Units Installed ini A ENFTS on Forward Bulkhead
25
0R511

* baseline tests. The HTL/Graviner sensor had a field-of-view approaching 360°F
and an optical self-test feature. This sensor had been qualified to the MIL-
STD-810 environment and an exposure to a 2000OF flame for one minute."
3.2 W. Kidde Sensor
The optical fire sensor which was provided for the first W. Kidde Company test
entry during February, consisted of a dual channel sensor contained in a three-
inch diameter by four-inch long cylinder with one channel responding to
background in the 4 to 5 micrometer wavelength band and the other responding to
background plus CO2 emission in this same wavelength region. The field of view
was about 53 degrees and was centered on the longitudinal axis of the sensor
assembly. The fire signal threshold level was set in the Walter Kidde Optical
Laboratory using the Army Tank Command standard fire, which is a 5-inch diameter
flame pot, located 48 inches from the sensor. This assembly contained the
necessary amplification and signal processing electronics to provide the
* remotely located control unit with analog signals and a fire signal. The fire
indicating light was located in the lower left corner of the control unit
assembly.
For the second test series during August, Kidde supplied two optical fire
sensors, both of which were single channel IR units containing two detectors,
both viewing the fire through a common narrow band filter. Within each, as with
the unit provided during the first test series, one detector was designed to
responded to CO2 peaks and the other to broad band IR. Both units were
installed on the forward bulkhead of the AENFTS'S F-16 nacelle simulator (Figure
11). One sensor had a hemispheric silicon dome with a field of view of 25
degrees. The other had a flat silicon window. Both were about 3 inches in
* diameter and about 5 inches long.
Each version of the two detectors contained one nitrogen and one carbon dioxide
filled photodetector. Each photodetector output its signal to an amplifier
• circuit. Amplification was necessary to provide an adequate signal to the
differential amplifier. Upon "seeing" a flame from the combustion of various
hydrocarbons the output of the nitrogen gas filled photodetector became much
larger than the output of the carbon dioxide filled photodetector. This caused
* the differential amplifier to output a large negative signal. This signal, upon
reaching a preset level (voltage) set within the threshold circuit, triggered an
alarm circuit.
26
V0111 1

The domed assembly "saw" along a single optical axis which was split just prior
to each detector. The planar (non-domed) assembly, on the otherhand, "saw"
along a single optical path for each photodetector.
Figure 12 is a sketch of the typical configuration showing a block diagram of
the components. Each sensor is similar to the right of the indicating line. To
the left of the line the components unique to the domed assembly are shown as
indicated.
The field of view of the domed assembly was limited to approximately 500 (double
angle) due to optical cutoff. The field of view of the planar assembly was
limited to approximately 900 (double angle) due to cosine effect.
These assemblies both contained the necessary amplification and signal
processing electronics to provide the remotely located control unit with analog
signals and a fire signal. Either could trigger a simulated crew warning light
which was installed above the main AENFTs viewing window (Figure 13) so that its
signal could be recorded on video tape along with the fire. The sensor units
were installed outside the AENFTS test section for the false alarm testing
(Figures 14 and 15).
3.3 SBRC System
Santa Barbara Research Centers' optical fire detection system consisted of a
dual channel IR sensor unit and an enunciator box which indicated the presence
of a fire with fire warning lights. The sensor unit was 2 x 2 x 1.5 inches
(Figure 16), and had a 90 degree solid cone angle field of view.
Three interchangeable sensors were evaluated, the most sensitive being installed
on the forward baffle plate
in the AENFTS's F-16 nacelle simulator. The other two were installed in access
plates downstream of the simulator, one in the small window in the top of the
middle test section, 36 inches aft of -he fuel nozzle and igniter, and the other
in the side window of the same test section.
27
011l ~i ORK1" A" " -
LAJ
ILW) ZOJ atC...V
0
CB z0
IF z
* 0
w
0 zo
.04
w ~'I.
22

CKAA
N
0
&
K
.czz
t0
0t3
N.*I
t ~Ml -'-N S
-A tr. 4-.
(t~
b
?0
4tw ~2
Pt'V c'j
V I-
Nt U)V I.-
*
*
S
N
A.NSt.NC;
S
290
5% ~ zQ~.r ) ~ >\.~.)-N 'N V 0 ~ - -

0r
24
z0uU)
Uj)
03
Pi ll ! Ill l( Il 1,4 -
'L
03

Due to mounting restrictions in the AENFTS test section, all sensors were
separated by a bulkhead from the section where the fuel nozzle was located. The
upstream view of the fires was limited to two 1.5 inch holes in the bulkhead.
The downstream sensor locations were similarly obscured from viewing the test
fires, except that flames from the 31.2 GPH fires penetrated the bulkhead
openings.
Referring to the functional block diagram in Figure 17, the sensors were dual
spectrum units with one detector that responded to short wave lengths (below 1
micron) and the other to long wavelengths (above 6 microns). The sensor system
contained the necessary amplification and signal processing electronics to
provide the remotely located enunciator unit with a fire signal.
The sensors, which were designed for and used during the Wright-Patterson Air
Force Base Dry Bay Test Program (Ref.6), used AND gate logic with inputs from
* each wavelength sensitive detector. Signal processing circuitry associated with
each cell incorporated a separate threshold prior to the AND gate.
Also, each sensor system had its own power conditioning, built-in-test (BIT) and
valve driver circuitry. Power conditioning included both voltage regulation and
lockout circuits to avoid detector responses to line transients up to 800 volt
spikes.
BIT was incorporated as an "interogate BIT" where a pulse sent in on pin D
generated a responding pulse on pin C only If the detector was fully
operational. The valve driver was a capacitive discharge circuit designed to
drive up to four squib valves. This valve driver was locked out during the BIT
mode.
In addition to the system used in the test program, SBRC brought a radiometer
system which was installed in a specially constructed adapter in the viewing
* window that was directed at the forward portion of the test fires. This
% equipment was removed once the radiometer testing was completed and was not part
of the sensitivity or the false alarm test installation.
SBRC stated that the detector units had been designed to operate in high
temperature environments, hence the units installed downstream of the F-16
simulator were in locations close to and actually enveloped In the test fire.
32
0 1' rL......p

NC
.1
333
Boom

3.4 Armtec System
The Armtec optical fire detection system consisted of a sensor unit and a
control unit containing a microprocessor. The control unit was mounted on the
AENFTS frame adjacent to the upstream end of the first test section. The sensor
was about 2 x 2 x 1.5 inches and had three small domes covering the detectors
(Figure 18), all protected by a metal screen. A terminal strip on the control
box provided electrical connections for a cockpit crew warning unit with
adjacent red fire, amber "fault" and green "system ready" lights and connection
to a 28-volt power supply (Figure 19). Boeing provided a red and a green light
on a mounting bracket above the main AENFTS viewing window so that the control
box fire and "system ready" output signals could be included in the video tape
data record.
* Referring to Figure 20, Armtec has described the detector unit as containing
three optical detectors which monitored, respectively, broad band IR signal,
narrow band IR signal centered on the CO2 emission and the shorter UVwavelengths. Outputs from these three detectors were monitored by the
microprocessor and its internal logic established combinations of signals that
would allow for determination of a fire condition with maximum discrimination
(i.e. actual fire versus false alarms).
The Armtec system functioned as intended during the entire test period. No test
time was lost due to redesign, repair or replacement of the Armtec equipment.
3.5 Pyrotector System
The Pyrotector optical fire detection system consisted of a cylindrical sensor
unit mounted in the normal position on the forward bulkhead of the F-16 nacelle
simulator, connected to a box mounted above the AENFTS viewing window. The
* sensor was 2.5 inches in diameter, 1-1/16 inch long and had a flat sapphire lens
covering the detectors. The unit contained batteries, a microprocessor, a
visible simulated crew warning light and reset switch (Figure 21). When a fire
warning was displayed, it was locked on until the reset switch was operated.
-4 34
ARTE
SESO
Figure 18. ARM TEC Sensor Unit
SESO
Figure 19. A RMTEC Sensor and CWUV 35

1-
aji-.-J
I-
C-)0C.)
I-(0
U4-
o 0* U
I.--oz C)oo '4.-
o(-)
U
L&JU..
1- >o ~w0
*
* 40 36

Figure 21. Pyrorector Detector Unit
4
FLAME SPECTRAL SENSOR AMPLFIER SIGNAL CONDITION ALARM ANDSOURCE ERLTER AND ANALYSIS RESET
Figure 22. Block Diagram of Pyrotector Optical Detector
37
wo
A block diagram of the Pyrotector system is shown in Figure 22. Pyrotector
reported that the sensor contained a narrow band IR detector specially filtered
to exclude all non-fire radiation. They also stated that the flicker content of
the fire affected the response time of the sensor. Pyrotector explained that
its approach was highly proprietary and depended on specially developed spectral
filtering as well as sensor technology and electronics exclusive to Pyrotector.
The Pyrotector equipment, which had no need for external power supplies
functioned as intended during the entire test period. No test time was lost due
to redesign, repair or replacement of the Pyrotector equipment.
3.6 Suitability of the Sensors to an Aircraft Engine Nacelle Environment
The HTL/Graviner system was validated in flight tests on an F-111 aircraft
(Appendix A) and has been in service on that airplane for seven years. The
* other prototype sensors tested had not attained this maturity at the time of
this test program.
Electronic components (e.g. photodiode detectors, op-amps and diodes) are
limited currently to temperatures below 2500F. Battery power for the detectors,
although appropriate for the AENFTS, would probably be replaced by an aircraft
power source in an actual installation. Since all prototype detector systems
except the HTL/Graviner system, had some solid state electronic components,
their ability to function properly at environmental temperatures approaching
500OF needs verification. Thermal insulation can minimize high temperature
problems as was demonstrated (but not qualified) during this test program.
Furthermore, no tests were conducted to evaluate the durability of the prototype
*systems.
38
0R E1 10 1 II 1 1 1 111

4.0 RESULTS
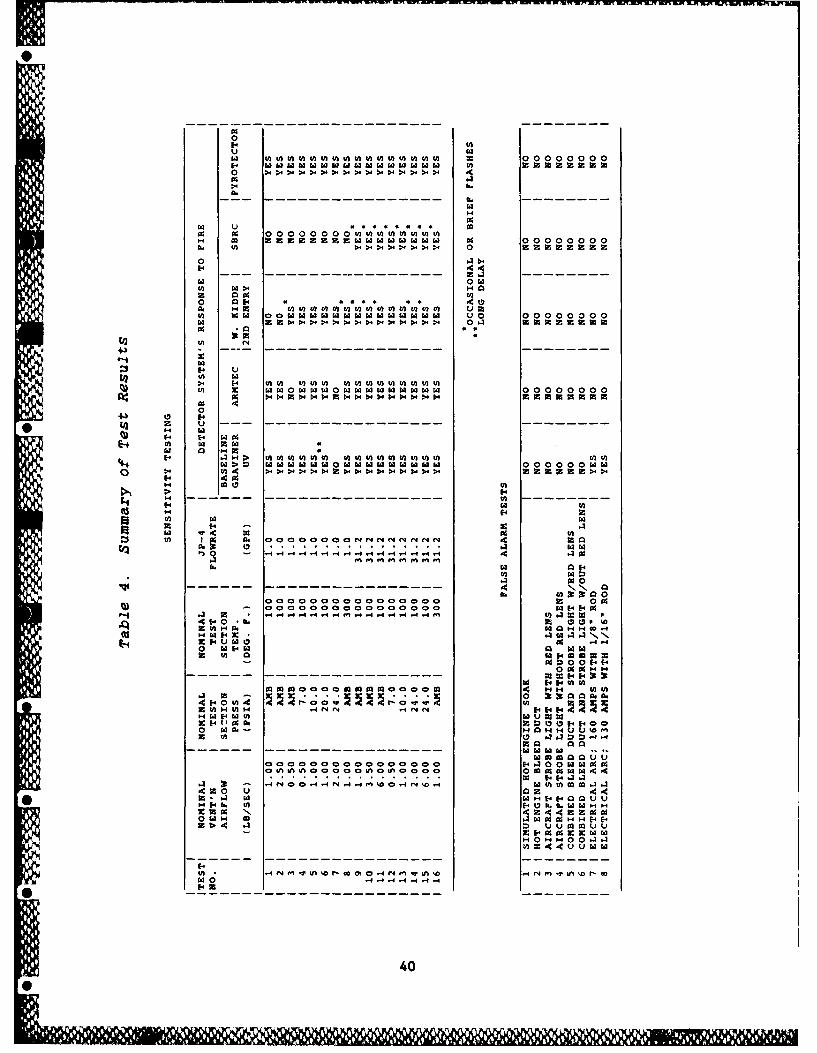
Sensitivity and false alarm test results are presented in Table 4. The
Pyrotector sensor was the only prototype sensor that responded to every fire and
ignored all false alarm signals. The HTL/Graviner system responded to all fires
for engine compartment pressures, temperatures and airflow rates typical of
current aircraft. The HTL/Graviner system did respond to arc welding but this
false alarm source is unlikely when the detection system Is activated. The
Armtec sensor did not respond to any of the false alarm signals but did miss one
fire under realistic, simulated flight condition.
Although 300OF ambient airflow tests were conducted, the thermal history of each
of the sensor housings was not measured. As a result, it is unclear whether
thermal equilibrium was reached during these tests.
4.1 Sensitivity Testing
4.1.1 Baseline Tests with HTL/Graviner System
With the smaller 1 GPH fires, the HTL/Graviner detector provided a fire warning
for six out of the seven planned test conditions. This included all but the
highest simulated engine compartment airflow rate and ram air pressure (2
lbs/sec at 24 psia), a condition not encountered on current aircraft but
projected for advanced aircraft. The sensor usually responded about one second
after the fire was ignited. For another (1 lb/sec at 20 psia) about six seconds
elapsed before the fire warning light indicated the presence of a fire. In all
the other tests, the fire warning light came on about one second after the fire
was ignited and remained on without flicker until about one second after the
fire was extinguished.
With the larger, 31.2 GPH fires, the detector provided a fire warning for every
0fire. Again, the fire warning light came on about one second after the fire was
ignited and remained on without flicker until about one second after the fire
was extinguished.
k77
39
061
0
w 00 00 0
O 9.
1.2 9 00000 1200 0 000000on W01.21.21.31.2w 1% 00000000
o .1 b
-l 1.. >-H
0. [. . * . 4. . 4. *. 4 t3
1.. b0 u 0 00000000
as 0
En z 000000001. D00t1z >4 1 zb4 1 144 1 4 D-4 1-. 0.4 0 00000
0
H9 w
F4 p 6 1.2E-4 M4 041 z.0. W0 ~ 3 2 U
ca 0 H
0o>D I
[a "14 to2
0 .4 ad
Hi 0 -
14 f.3 0 aC
V.3 H OuC 14 "0 1.3 1.3r.
0 0 0 f4E
1. "H WO0 ~ ~~ 3:290OOCN NN r4 N
r1. (1W.%3 0 1414z .4. 0
.4 00- - 4 . 9.3 W0r
404 .1. in tI! 0 10.0 t
Z -4 .4 H E 4 N' 0Um p k-4. t$40 1.0 HL H W "
0 0 ".12 0 1.21.10 Dn 0 .3 u 14w m u
MHOOOHH- 00414 w
- - - - - - ~ ~ ~~ -- - - - -14-- -- - - - -
IH1.2141 1.11111011
4.1.2 W. Kidde Company System Testing (First Series)
During initial tests employing the atmospheric pressure blower at 1.0 lb/sec and
the 1.0 GPH nozzle, the sensor failed to respond to any of three test fires. At
the request of the Kidde representative, the test section was opened and the
sensor was rotated 180 degrees. With the sensor in this position, the
atmospheric pressure tests were repeated with the 1.0 GPH nozzle and the 31.2
GPH nozzle. Fire warnings were observed for all but the highest airflow (3.5
lbs/sec) fires with the 1.0-GPH nozzle installed.
The Kidde representative elected to omit the altitude and ram simulation tests
at that time and concentrate on further investigation into the effects of sensor
rotation and other sensor sensitivity problems. Hence the atmospheric blower
sensitivity tests were repeated with the 1.0-GPH nozzle and 1.0-lb/sec airflow
while the sensor was rotated in its base to several other positions. Several
0other problems were identified during these tests.
It was determined that one channel of the sensor was excessively noise sensitive
and it was observed that operation of the high-flow/low-flow switch on the AEN
control console consistently caused the system to indicate the presence of a
fire. Kidde requested that they be allowed to terminate this test period and
allowed to return and try again once they had analyzed their problems and
developed modifications that would correct them.
4.1.3 W. Kidde Company System Testing (Second Series)
Initially, during preliminary tests with the smaller fuel nozzle and 1 lb/sec
airflow, a few problems were encountered with AENFTS instrumentation, the
ModComp computer and visibility of the the fire warning light that Kidde
supplied on the control console TV monitor. Once these were corrected, several
more preliminary tests were performed with this fire size and flow rate.
Momentary flickers of the fire warning light, usually at the start and end of
the fire tests were observed. The Kidde sensors appeared to still be sensitive
to the use of the high-flow/low-flow switch on the AENFTS control console.
Tests were conducted to examine whether this was electrical interference or
sensitivity to pressure changes and they indicated the latter.
41

The Kidde engineers examined the data they had acquired and decided that a
further try at pressure sealing the sensor bodies was necessary. An attempt at
sealing these with Permatex RTV Silicone Gasket material was made. They also
concluded that sensitivity of the sensors was acceptable and that all components
were working properly. Following this the planned sequence of sensitivity tests
was conducted.
As testing progressed, the detector still responded to ventilation airflow rate
change with a brief fire warning light but did not otherwise indicate any
presence of fire. On the third of these tests, a ventilation flow rate of 0.5
lbs/second, the fire warning light did respond briefly, a fraction of a second
after the fire was ignited. Since the light went out and remained out during
the duration of the fire, the sensor was probably responding to the ignition
overpressure and not to the fire's optical radiation.
* During the first simulated altitude test (7 psia test section pressure) with a
fuel flow rate of 0.5 lbs/second, the fire indicator flashed steadily during the
entire period that the fire was ignited. During the next altitude test (10 psia
test section pressure) 1.0 GPH fuel flow rate and 1 lb/second ventilation
airflow rate, the sensor again flashed briefly just after the fire was ignited,
again perhaps due to overpressure.
Last were two 1.0 GPH high pressure (ram simulation) runs, 1 lb/sec at 20 psia
and two lbs/sec at 24 psia. With these tests also, the sensor responded
Initially as the fire was ignited and then went out and remained out during the
remainder of the test. The Kidde crew attempted further pressure sealing prior
to continuing the sensitivity testing.
The sensitivity tests with 31.2 GPH fuel flow were completed next. The later
sealing attempt seemed to eliminate the sensor's sensitivity to airflow rate
changes. However, during the first two tries with 1.0 lb/min of ventilation
* airflow at atmospheric pressure, the sensor failed to provide any fire warning
even though these were substantially larger fires than those rur earlier. The
sensors were rotated in their bases and on the third try, a brief flash was
noted just after the fire was ignited. The planned sensitivity tests with the
* 31.2 GPH nozzle were repeated with the sensors repositioned and the sensors
responded to all to some degree, in some cases a brief flash at the start and in
some a steady fire light during the entire test.
42
0a
The last two test conditions employed heating the ventilation airflow to 300OF
so that potential damage to the detecors or wiring did not influence subsequent
test results. These involved 1 lb/sec airflow at ambient pressure and 31.2 GPH
and 1-GPH fuel flows. With the larger fuel nozzle there was a steady fire light
during the test, with the smaller nozzle there was a brief initial flash.
The question of whether the "brief flash" warnings had been a response to IR
radiation from the fire or overpressure from its ignition was addressed on
completion of the sensitivity tests. Both sensors were mounted outside the
AENFTS test section in preparation for the false alarm testing. A hand-held
pistol type propane torch was positioned at distances from one to three feet
from the sensors. When the torch was close to the sensors, the fire warning
light came on and remained on as long as the torch was lit. When the torch was
about three feet from the sensors, the fire light would come on only briefly as
the torch was lit and did not remain on even though the torch remained lit and
in the same position. Hence it is probable that the "brief flash" warning seen
during the later tests was due to IR radiation from the flame and not combustion
overpressure. Because additiunal sealing work was performed at various times
during the testing, whether all the responses were due to IR radiation is
uncertain.
4.1.4 Santa Barbara Research Center (SBRC) System Testing
Detectors designed for use in engine nacelles were still under development by
SBRC at the time of AEN testing, but were scheduled to be ready for the nextphase of testing to be conducted at the FAA Technical Center. Rather than not
participate in this program, SBRC chose to submit sensors for testing that were*: optimized for other applications. In this manner they could assess the critical
factors of engine compartment fire protection and thus be better qualified todevelop sensors suitable for the F-1l1 test rig.
Sensitivity tests, employing l-GPH and 31.2 GPH fuel flow fires, were conducted
with the SBRC sensors installed in the AENFTS and the results were quite
consistent. All three of the SBRC sensors provided a fire warning for all of
the 31.2 GPH fires. However, the number 1 sensor performed erratically during
the last three tests (fire warning lights flickered on and off). SBRC indicated
"- that this was normal, and that the output of these sensors would "vary with the
43
I , _ .. , ,

AC component of the flame." All three of the SBRC detectors failed to provide a
fire warning for all of the 1-GPH fires, at all ventilation flowrates and
pressures.
Following test condition 14, a low airflow (2 lbs/sec), high pressure (24 psia)
test, the number 1 sensor continued to indicate a fire until well after the fire
had been extinguished. During the next test, a high airflow (6 lbs/sec) test,
run at atmospheric pressure with 1 lb/sec airflow and with the airflow heated to
3000 F, the unit appeared to operate normally initially but then appeared to fail
after about five seconds.
SBRC initially concluded that the number 1 .ensor had been damaged during its
extended exposure to its high temperature environment (reaching about 2000OF on
test condition 14 after being exposed to the fire) and that on-site repairs were
not feasible. After removal from the AENFTS Simulator, it was noticed that the
* number 1 sensor was covered with a very thick layer of hard soot from immersion
in flames from the 31.2 GPH conditions and did not respond to test flames as the
other sensors did. Later, when the soot layer was cleaned from the windows, the
number 1 sensor was found to be still operational.
4.1.5 Armtec System Testing
3 With the l-GPH fuel flow fires, the Armtec detector provided a fire warning for
five out of the seven test conditions. This included all but the lowest airflow
,, sea level test (0.5 lbs/sec at 14.1 psia) and the higher airflow/ram air
pressure simulation test (2 lbs/sec at 24 psia). The fire warning light
flickered during two of the test conditions where it indicated a fire, the
intermediate airflow sea level test (2.5 lbs/sec at 14.4 psia) and the lower
airflow/ram air pressure simulation test (1 lb/sec at 20 psia). The test was
repeated because the air temperature was 830 F rather than 100OF as planned
during the latter test. With the air temperature at 100OF the flicker was no
*• longer present.
With the 31.2 GPH fires, the sensor provided a fire warning for every fire. With
the highest airflow sea level case (6 lbs/sec at 15.5 psia) the fire warning
light flashed on and off during the fire. With the lowest airflow altitude
condition (0.5 lbs/sec at 7 psia) the warning light flashed on and off several
times before remaining on for the duration of each fire.
44
V0
- ~ V % Z

The time delay between ignition of the fire and the appearance of the red
warning light varied from 0.3 to 1.9 seconds, and apparently was not a function
of the fire intensity.
4.1.6 Pyrotector System Testing
Unlike other systems evaluated during this test program, the Pyrotector system
responded to every fire.
The time delay between ignition of the fire and the appearance of the fire
warning light varied from about one to four seconds. No information was
available concerning when the detector ceased to indicate a fire, since the fire
warning light was locked on as soon as it was displayed.
4.2 False Alarm Testing
4.2.1 Baseline Tests with HTL/Graviner System
With the HTL/Graviner sensor mounted in its normal position on the forward inlet
bulkhead of the F-16 nacelle simulator, the simulated hot engine soak did not
cause a false alarm. The sensor indicated a fire warning only while the fire
was present. Once the fuel injection was terminated the fire warning light went
out as the fire decreased in size to a few flickers of residual fuel. No false
alarm was observed during the soak period.
The remaining false alarm tests were performed with the sensor outside the AEN
test section, clamped to a structural upright. Neither the simulated hot engine
bleed duct at 1200OF nor the aircraft strobe light cause a fire warning, even
when combined at a distance of 12 inches from the detector.
Electric arcs generated with both the #8018 1/8 welding rod and the #6016 1/16
welding rod caused the sensor to indicate a fire within about one second of the
arc being struck, even at nine feet from the sensor. In both cases if the arc
was pulsed so that its duration was less that one second, followed by a pause of
about the same duration, the detector did not indicate a fire.
45
M
4.2.2 W. Kidde System Testing (First Series)
The W. Kidde sensor was insensitive to the simulated hot engine soak, the
aircraft strobe light with or without its red lens and to electric arcs. With
the simulated hot engine bleed duct at 12000 F, a fire warning was seen at a
distance of 28 inches from the detector. The test was repeated twice and the
fire warning occurred at 28 inches (within 1/2 inch) all three times.
4.2.3 W. Kidde System Testing (Second Series)
During the second test entry, the Kidde sensor was totally insensitive to the
false alarm signals. While the system responded to the simulated hot engine
bleed duct at 1200OF at a distance of 28 inches from the detector in the unit
was totally insensitive during the second test series. The unit continued to be
unaffected by the aircraft strobe light and electric arcs, at any distance.
* Since the system had been completely insensitive to the hot engine soak test
during the first series, this test was unnecessary.
4.2.4 Santa Barbara Research Center System Testing
Because the SRBC number 1 sensor was assumed to have been damaged in the last of
the sensitivity tests, the false alarm testing of the SBRC system was limited to
the number 2 and number 3 sensors. No false alarm was noted with either the
simulated hot engine soak test or the simulated hot engine bleed duct test.
The number 2 sensor was totally insensitive to the aircraft strobe light, with
or without its red lens, down to a minimum distance of 12 inches. The more
* sensitive number 3 sensor provided a fire warning when the red lens was used, at
distances of 64, 32 and 12 inches; it did not give a fire warning without the
red lens at a distance of 64 inches, but did at 32 and 12 inches. When the
strobe unit was operated with its red lens at the same time as heated bleed
duct, the number 3 sensor did indicate a false alarm but the number 2 sensor did
not.
Electric arcs caused no false alarms, with either type of welding rod or at any
• distance.
N46
0

4.2.5 Armtec System Testing
The Armtec sensor also performed perfectly in the false alarm tests. It was
interesting to note that when the aircraft strobe unit was operated with its red
lens, bv itself or in addition to the hot bleed duct, the strobe's flashing did
cause the green "ready" light to flash on and off at distance between 16 inches
and 64 inches. Since no fire warning was observed, this was not interpreted as
a false alarm. In all the other false alarm tests, including the simulated hot
engine soak, the simulated hot engine bleed duct and the arc welding, the unit
provided neither a false fire warning nor a flashing green "ready" light.
4.2.6 Pyrotector System Testing
The Pyrotector system also passed all the false alarm tests. These again
included the simulated hot engine soak test, the hot engine bleed duct simulator
heated to 12000 F, the aircraft strobe light (with or without its red lens)
within 12 inches of the detector and the electric arcs generated with eitheL the
1/16-inch or the 1/8-inch welding rods.
47

5.0 ANALYSIS OF RESULTS
The participating fire detection system vendors were understandably reluctant to
endanger their competitive positions by being completely open about the design
details of their systems. Some details were provided, however, which allowed
limited analysis of the results in terms of the advantages of their approaches
to the problem of identifying the optical signals from small simulated engine
compartment fires relatively far from the sensors, while remaining immune to the
false alarm optical signals.
5.1 Sensitivity
In the baseline tests, the HTL/Graviner IV sensors had good sensitivity duringthe atmospheric blower (high pressure ram air) and altitude tests. While the
video tape records of ram air pressure simulation tests indicate equally visible
* fires, the sensor had some difficulty responding to the UV components emitted.
One test fire was not detected at all, and a second required six seconds for the
detector to respond rather than the usual one second. The HTL representative
agreed that the higher density air attenuated the UV signal and that this has
less effect on IR signals.
The Armtec ard Pyrotector systems performed better than the baseline system.
The Armtec sensor which had three optical detectors, examined a narrow radiation
band centered on the wavelength of CO2 emissions (IR), a broad band IR signal,
and the shorter wavelength UV emissions. The Pyrotector system was said to be
examining more than one band of IR emissions. In both cases the sensitivity was
as good as the HTL/Graviner UV unit.
The denser air which existed in the test section during high pressure ram
simulation tests did not seem to Inhibit either the Armtec or the Pyrotector
sensor's ability to identify even the smallest fires. The Armtec sensor
responded to five out of seven of the 1.O-GPH fires and seemed to be affected by
the fire size as much as by the air density, since one of these was the lower
airflow atmospheric blower test. The Pyrotector unit saw all the test fires in
all simulated flight conditions.
48

5.2 False Alarm Immunity
During the baseline tests with the HTL/Graviner UV sensor, no false alarms
occurred with the simulated hot engine soak or hot engine bleed duct tests, or
with the aircraft strobe light. As the HTL representative had expected, however,
this unit provided a fire warning any time an electric arc was struck by the arc
welder. Only if the arc was pulsed so that its duration was shorter than the one
second period that the units microprocessor required to indicate a fire, could
the false alarm could be prevented.
The Kidde Company system provided no false fire warnings during its second test
period. Recalling that increased sensitivity increases the probability of false
alarm unless false alarm sources are actively inhibited by the detection device,
it was speculated, based on previous test results, that the Kidde unit may not
have been sensitive enough to observe the false alarm sources.
The SBRC system was also relatively free of false fire warnings, although its
most sensitive (number 3) detector unit responded to the aircraft strobe unit
any time the red lens was installed. Since the SBRC system was insensitive to
all of the smaller test fires, it can be speculated that, as with the Kidde
Company system, the SBRC unit may not have been sensitive enough to observe the
false alarm sources.
49

6.0 CONCLUSIONS AND RECOMMENDATIONS
6.1 Conclusions
The AENFTS facility provided a time and cost effective environment for the
evaluation of optical fire sensors in an environment representative of a typical
aircraft engine compartment. The facility allowed direct comparison of the
performance of dissimilar systems. Simulation of ram pressure in the test
section was found to be particularly valuable. The following conclusions were
reached.
1. Despite initial concern about detector system saturation, no
situations were found where the larger, 31.2 GPH JP-4 fires were
more difficult to sense than the smaller, 1.0-GPH JP-4 fires.
Hence the use of only the smaller fires in the ongoing testing at
* the FAA/TC should not compromise that program.
2. The Pyrotector sensor was more sensitive to small JP-4 test fires
than the baseline HTL/Graviner system in simulated altitude tests with
the engine compartment at ambient pressure. The Armtec sensor was
more sensitive to small fires than the baseline sensor for test
simulating high (20 to 24 psia) engine compartment pressure due to ram
pressure effects. Although the highest simulated ram air pressures
are much higher than those in current aircraft, sensor response at
high pressure may be of interest for future aircraft. Both the
Pyrotector and Armtec systems were immune to all simulated false alarm
sources. As mentioned previously, the HTL/Graviner sensor was immune
* to all false alarm signals except arc welding, which is a very
unlikely source when the sensor is active.
3. The use of UV sensors, both in the case of the HTL/Graviner baseline
* sensor which employed UiV detectors only, and the Armtec sensor which
employed one UV detector in combination with two IR detectors, did not
seem to provide greater sensitivity than a combination of IR sensors.
Simulated engine compartment ram air pressures seemed to compromise
the performance of both systems. Reliance on UV sensors seemed to
degrade those systems' immunity to the simulated false alarm
emissions.50
0

4. The possibility of small fires being sufficiently far from the
existing continuous element detection systems to be undetected Is
enough to conclude that the baseline UV, Pyrotector and Armtec systems
would have sensitivity advantages over current Air Force engine
compartment fire detection systems. False alarm immunity of the
Pyrotector and Armtec systems was also found to be acceptable.
6.2 Recommendations
The AENFTS results indicate that current problems with continuous element
detection systems in aircraft engine compartments could be largely eliminated by
replacing those systems with optical sensor based systems. Prior to such a
change on a major scale, however, other related problems need to be addressed:
1. The proximity of the sensor to the test fire was fixed in the AENFTS
testing, and known in advance by the vendors. Testing of these same
optical sensors is currently underway in the FAA/TC's F-111 test
article at Atlantic City. The vendor's will not have had advance
information on the location of the test fires within the engine
compartment and will need to provide enough sensors appropriately
positioned to detect a relatively small fire in any location within
the engine compartment. While those tests will not include altitude
and ram pressure simulation, they will provide a more severe
evaluation of the complete detector systems' sensitivity to fires at
ambient pressure.
2. Continuous element systems are capable of sensing overheat
conditions and hot engine bleed leakage in the engine compartment
whereas the optical sensors evaluated in this program probably would
not. An improved engine compartment fire detection system .ay require
optical sensors to provide fire warning in combination w'th a
continuous element system, perhaps smaller than current systems, in
areas where overheat and bleed air duct leakage are potential
problems. A system which could sense both threats should be developed
and evaluated before present continuous element systems could be
eliminated.
51
0

3. Long term reliability, compatibility and durability of any detection
system must be established prior to aircraft installation. Although
the HTL/Graviner system has been used in an F-ill airplane since 1980
(see Section 3.2.1), much of the information relating to reliability
was not recorded. HTL concluded (Appendix A) that, except for the
optical test emitter, the overall system reliability was excellent,
especially considering that no system maintenance was performed since
1981. Excluding the test emitter, HTL concluded that their system has
demonstrated its ability to operate in a satisfactory manner in an
aircraft engine compartment environment.
4. Testing of optical fire detection systems at FAA/TC should be
completed. Detection system compatibility with environmental
conditions, such as vibration, sustained high temperature (5000F)
operation, and shock, as well as sensitivity to additional false alarm
sources should be demonstrated for any candidate system. Since the
HTL/Graviner system has been subjected to these kinds of tests, this
system could again serve as a baseline. The information obtained,
when used in conjunction with the test results contained in this
document, should allow selection of one or more candidate systems for
further evaluation.
5. The results of the ongoing reliability and false alarm evaluation of
HTL/Graviner system currently installed in flight test F-Ill should be
monitored. Flight and maintenance crews should be informed of
importance of the testing, and of adequate record keeping. The
perfect record of the HTL/Graviner sensors for false alarm immunity
should be emphasized as an important reason for continuing study of
optical detection.
6. Consider a similar flight test evaluation program of a more advanced
optical detection system. This could be performed on the same flight
test F-111 by replacing either the A side, or the B side of the
HTL/Graviner UV system with the system selected (when and if the
criteria described in Items 3 and 4 is addressed and met)."
52

REFERENCES
1. Johnson, A. M., "Aircraft Engine Nacelle Fire Tests Evaluating Hot Surface
Ignition of Aircraft Fluids and Effectiveness of Halon Agent Extinguishant
Systems," BMAC Test Document, December 1984 (preliminary).
2. Dirling, F. N. and A. M. Johnson, "AENFTS Operating Manual," November 1984
(draft).
3. Ledwick, T. L., "ModComp II Computer System Software Technical Manual,"
November 1984 (draft).
4. Ledwick, T. L., "ModComp II Computer System Software User's Manual,"
November 1984 (draft).
5. Springer, R. J., et al, "Advanced Ultraviolet (IV) Aircraft Fire Detection
System, Volume I - System Description and Flight Test," AFWAL-TR-82-2062,
August 1982.
6. Robaidek, M. F., "Aircraft Dry Bay Fire Protection," AFWAL-TR-87-3032, July
1987.
7. Kunkle, J. S., et al, "Compressed Gas Handbook," NASA GSP-3045, 1969.
8. Britton, C. L., Flow Measurement Systems Memo to P. Hughes of SRL, July 7,
1978.
53

ACRONYMS AND ABBREVIATIONS
AENFTS aircraft engine nacelle fire test simulator
BIT Built-In Test
CWU crew warning unit
CCU computer control unit
FAA/TC Federal Aviation Administration/Technical Center
GPH gallons per hour
IR infrared
psia pounds per square inch, absolute
UV ultraviolet
0
4
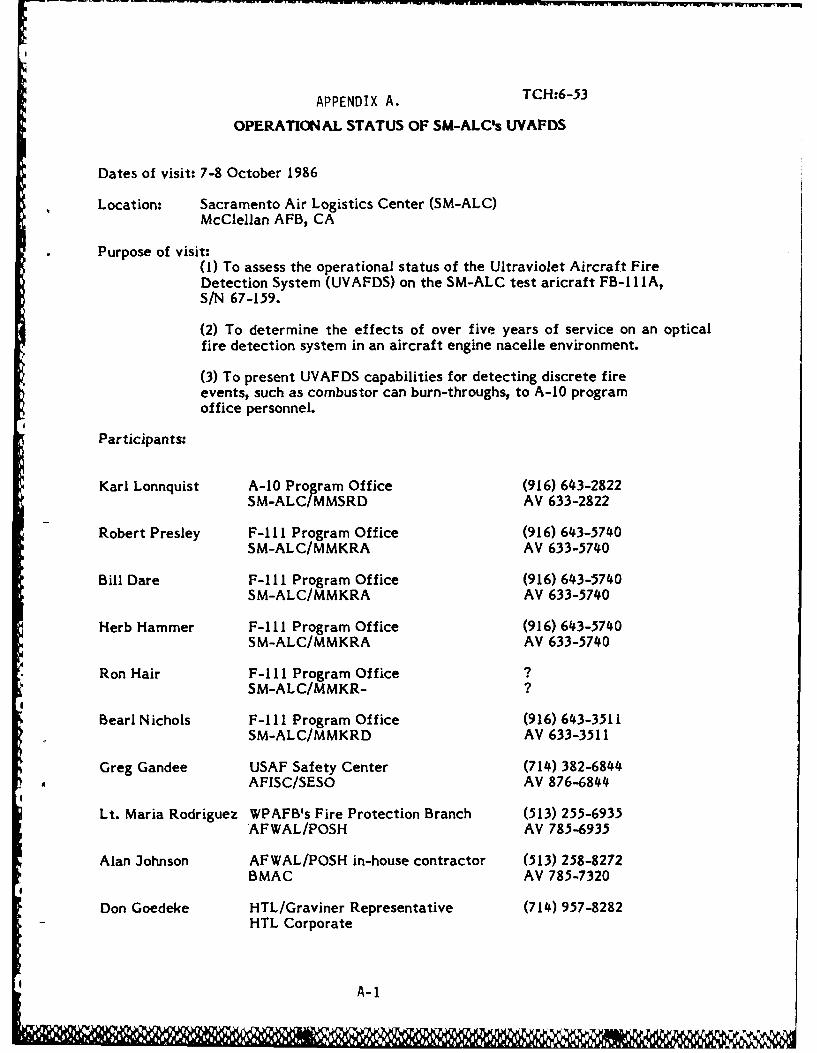
APPENDIX A. TCH:6-53
OPERATIONAL STATUS OF SM-ALC's UVAFDS
Dates of visit: 7-8 October 1986
Location: Sacramento Air Logistics Center (SM-ALC)McClellan AFB, CA
Purpose of visit:(1) To assess the operational status of the Ultraviolet Aircraft FireDetection System (UVAFDS) on the SM-ALC test aricraft FB-I I IA,S/N 67-159.
(2) To determine the effects of over five years of service on an opticalfire detection system in an aircraft engine nacelle environment.
(3) To present UVAFDS capabilities for detecting discrete fireevents, such as combustor can burn-throughs, to A-10 programoffice personnel.
Participants:
Karl Lonnquist A-10 Program Office (916) 643-2822SM-ALCIMMSRD AV 633-2822
Robert Presley F-I lI Program Office (916) 643-5740SM-ALC/MMKRA AV 633-5740
Bill Dare F-I l Program Office (916) 643-5740SM-ALC/MMKRA AV 633-5740
Herb Hammer F-I I Program Office (916) 643-5740SM-ALC/MMKRA AV 633-5740
Ron Hair F-I l Program Office ?SM-ALC/MMKR- ?
Bearl Nichols F-I l Program Office (916) 643-3511SM-ALC/MMKRD AV 633-3511
Greg Gandee USAF Safety Center (714) 382-6844AFISC/SESO AV 876-6844
Lt. Maria Rodriguez WPAFB's Fire Protection Branch (513) 255-6935AFWAL/POSH AV 785-6935
Alan Johnson AFWAL/POSH in-house contractor (513) 258-8272BMAC AV 785-7320
Don Goedeke HTL/Graviner Representative (714) 957-8282HTL Corporate
A-i

OpraioalStatus' SM-ALC's UVAFDS
TCH:6-53 Page 2Oct.
Vince Rowe HTL/Graviner Representative (714) 957-8282HTL K West/Systems
Tom Hillman HTL/Graviner Representative (714) 957-8282HTL K West/Systems
* A- 2

Operational Status of SM-ALC's UVAFDSTCH:6-53 Page 3Oct.
UVAFDS System Description:
Two versions of the microprocessor-coupled Ultraviolet Aircraft Fire Detection System(UVAFDS) were developed under USAF Contract F33615-77-C-2029. One version,System A, uses dual head sensors (i.e., two UV detectors mounted onto one housing) withessentially complete subsystem redundancy. Redundancy is defined as the duplication ofa component or subsystem so that if the primary component fails, the seconaarycomponent is still capable of providing the desired function. System A operates as twocomplete and separate subsystems. It utilizes two microprocessors and two control/testelectronics assemblies housed into a single computer control unit (CCU) assembly. Thissystem is designed such that the two channels are each independently fed signals fromone half of a fire sensor head (i.e., one detector head of the dual head sensor) andelectronically proC-ssed through one of the microprocessors. The second channel is thenfed signals from the other detector on the sensing head and similarly processed throughthe second microprocessor. Both channels must identify a fire warning before anindication is sent to the crew warning unit (CWU). This is termed "AND" logic.
The design of the system is such that no single failure of any part affects the firedetection capability of the system, and hence, no CWU indication of a fault is indicated(even though it is acknowledged and stored internally and later indicated wheninterrogated by the ground support equipment).
If for some reason one entire channel of this two channel system fails, the systemrecognizes this and ignores the output from the faulty channel. The remaining channelwill then solely operate its half of the two headed sensors and continue to providecomplete engine detection coverage. Similarly, if the fault is isolated to a single UVdetector (i.e., one half of a dual head sensor), the controlling microprocessor wouldignore this detector's output and the decision of whether a fire is present would be madeby the other half of the sensing head.
The technique to determine if a part or component is faulty is implemented by anautomatic test feature. Each detector head has a ultraviolet test emitter which excitesthe UV detector every 15 seconds, and a series of tests are performed through each ofthe microprocessors. These tests include testing the UV detector, its output signal path,the internal microprocessor program, and the opposite microprocessor's signaling andprocessing ability. If for some reason some portion of the system does not operate, it isshut down and the system reconfigures to ignore the faulted system's output.
System B, the other version of UVAFDS, uses single head sensors (i.e., one UV detectormounted onto one housing) and has limited redundancy features. It operates through asingle channel through a single microprocessor. Like System A, it has both manual andautomatic test features with the automatic test also being capable of informing itsmicroprocessor of a faulty sensor head, hence, ignoring its output.
One feature that both Systems A and B use is adjacency. Adjacency is defined as twosensors viewing the same area/volume. Figure I illustrates UVAFDS adjacency designand the location of each of the sensor housings. As can be seen, sensors one and twoview one hazard zone, two and three view a second hazard zone, and sensors four and
A-3
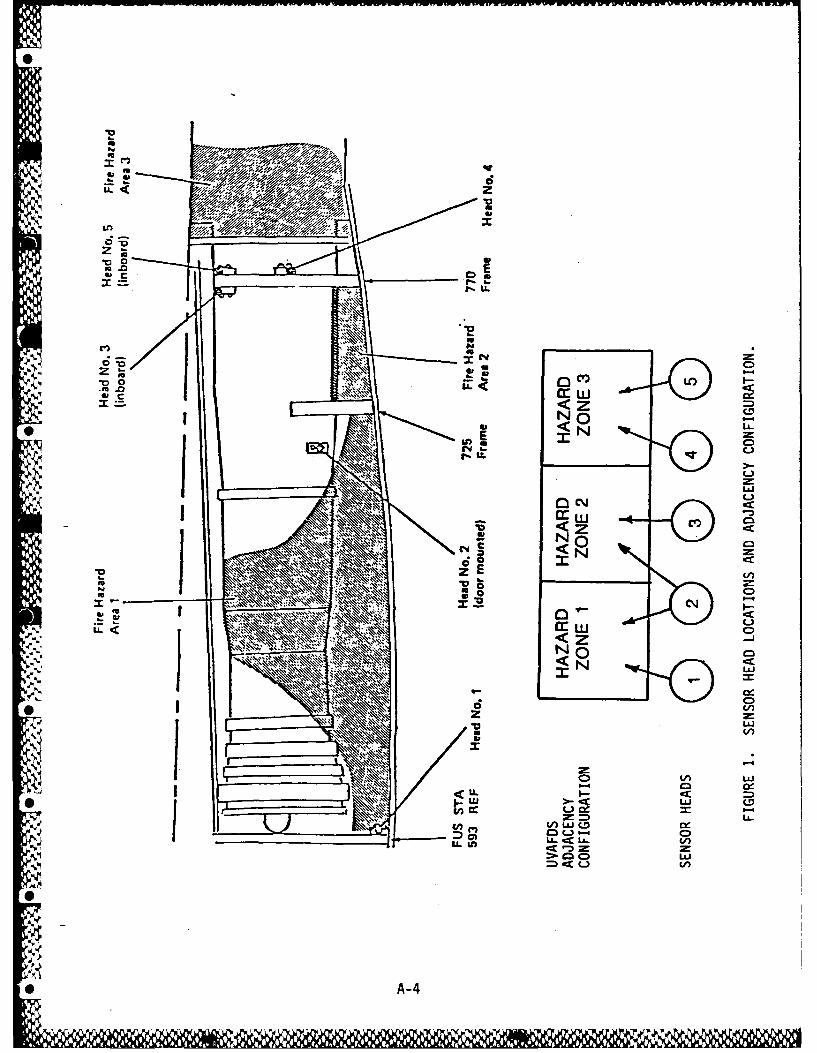
01
V wVUC,
N0 c-
Ln LW
ft C)
ZC-* LaJ
INNERC-z E
.3'C)
Il cz'.
a D '.s
t. w >- 0 ,
LU
S0 Co
A-44

Operational Status of SM-ALC's UVAFDSTCH:6-53 Page 4Oct.
five view a third hazard zone. This means that System A has four UV detectors viewingeach hazard zone area, whereas System B only has two. Thus, System A can lose up tothree of its four detectors without losing hazard zone coverage. System B, however, canonly lose one detector and still provide hazard zone coverage. If hazard zone coverage islost, a fault lamp is illuminated on the cockpit display (CWU). For example, in HazardZone I System A has head I (with UV detectors Xl and YI) and head 2 (with detectorsX2 and Y2) providing detection coverage. Any fire signals from Xl and YI, or Xl andY2, or X2 and YI, or X2 and Y2 would illuminate a fire lamp on the CWU. If detectorXI was damaged, the system would ignore Xl's output and wait for fire signal inputsfrom either YI and X2 or X2 and Y2. If detector YI is nonoperational, the systemreconfigures to X2 and Y2 only. If the Y2 detector fails, then the system reconfigures sothat the output from only detector X2 is capable of triggering a fire warning. Finally, ifX2 fails, the fault lamp is illuminated on the CWU.
System B's adjacency operates similarly but is limited to single detector reconfigurationtechnique. For example, under normal operating conditions, the system will send a fire
* ewarning if a fire output is received from either detectors X1 or X2 on sensing heads Iand 2, respectively. If either XI or X2 detector is faulty, the remaining detectorcontinues to provide zonal coverage. If it then fails, a fault indication will appear onthe CWU.
Both System A and B use one second response times to respond to a fire so as tominimize false warnings due to transient radiation sources, such as lightning. Also,system component operational status is retained in the respective computer control unit(CCU), so that if maintenance is necessary the location of the faulty "line replacableunit" can be identified through the ground support equipment (GSE).
More detailed information about the design and operating features of both System A andB versions of UVAFDS can be found in the USAF technical report entitled, "AdvancedUltra-Violet (UV) Aircraft Fire Detection System, Volumes I, II, and II," AFWAL-TR-82-2062.
--• A- 5

Operational Status of SM-ALC's UVAAFDSTCH:6-53 Page 5Oct.
Findings:
Ron Hair, the line crew chief responsible for the maintenance of the F-I 11 test aircraft(FB-IIIA, S/N 67-159) which UVAFDS was installed upon, reported that no maintenancewas performed on either version (System A or B) of UVAFDS since approximately 1983.It was understood that this was the time frame when the first signs of UVAFDSmalfunction was first observed (i.e., a fault light appeared on the CWU), and Mr. Hairdeemed maintenance was required. It was also the HTL representatives' impression thatlittle or no maintenance was performed (such as, cleaning sensor heads, interrogatingsystem operation through the GSE, etc.) on UVAFDS since 1981 after the GeneralDynamics/HTL/Graviner contract was completed.
Upon initial inspection of the FB-IIIA and UVAFDS, it was found that the right enginefault light was illuminated on the CWU. This is the engine side which has System Bversion of UVAFDS installed. The left engine UVAFDS system (System A) indicated thatit was still operational when a manual self check was initiated through the CWU (NOTE -the CWU-initiated self-check only verifies that complete engine fire hazard zonecoverage is present but does not identify if any sensor heads or their respectivedetectors are faulty).
Upon interrogation of the left engine UVAFDS (System A) with the GSE, it was foundthat Sensor I (detectors I and 2), half of sensor 2 (detector 1), half of sensor 4 (detector1), and sensor 5 (detectors I and 2) were "nonoperational." The GSE interrogationmethod excites each detector's test emitter for ten seconds so that detector can verifythat it can "see" a radiation source (NOTE - System A has five sensor housings each withtwo UV detectors per housing, hence ten UV test emitters). After reviewing the HTLrecords, it was discovered that sensor 5 was disconnected in 1981 (for reasons which willbe discussed later). The fact that the other four detectors were shut-down indicatedthat either these UV detectors were faulty; or these UV detectors had sufficientcontaminant build-up to obscure their field-of-view; or their test emitters had sufficientcontaminant build-up to reduce their radiation emission properties making the CCU thinkthat the detector heads had faulted; or the test emitters were faulty (again making theCCU think the detectors had faulted). To identify which of the above was the actualcase, a UV emitting wand was placed near each sensor housing during a GSE
* interrogation (i.e., when the test emitter was supposed to be activated), and eachdetector's response was again recorded. It was confirmed that four of the ten testemitters had failed. It was also verified that one UV detector (sensor 1, detector 1) hadfaulted. Table ! summarizes the findings.
The reason that sensor 5 was disconnected in 1981 was that due to its orientation in the* engine nacelle it was capable of observing the engine afterburner plume and therefore
responded. Sensor 4, due to its similar location, also responded to the afterburner plume.However, it was successfully partially masked with black paint to avoid afterburnerplume detection while still providing fire zone coverage. In an effort to minimize costsand maintenance, the Air Force/General Dynamics opted to disconnect sensor 5 on bothengines rather than remove the engines and mask them.
Although so many sensors/detectors were faulty (or the CCU thought they were faultybased on its automatic self test which utilizes the test emitter), the fault light on theCWU was not activated. The reason is that the left engine still had complete fire
* A-6
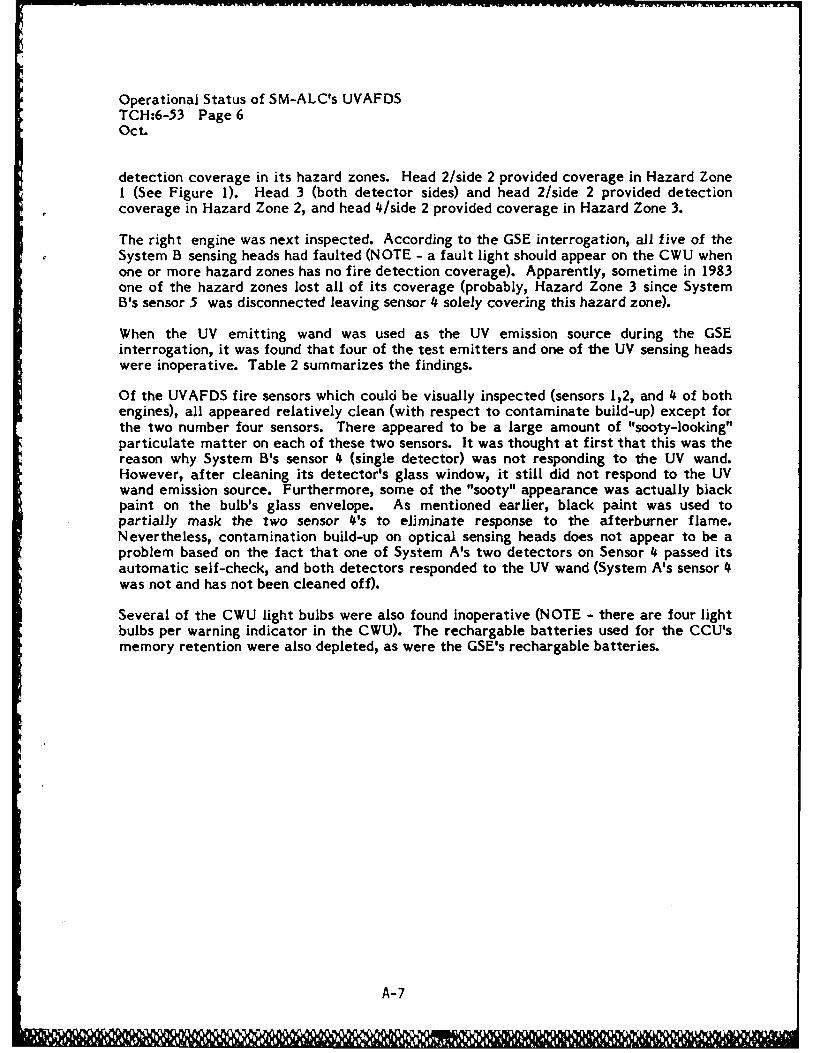
Operational Status of SM-ALC's UVAFDSTCH:6-53 Page 6Oct.
detection coverage in its hazard zones. Head 2/side 2 provided coverage in Hazard ZoneI (See Figure 1). Head 3 (both detector sides) and head 2/side 2 provided detectioncoverage in Hazard Zone 2, and head 4/side 2 provided coverage in Hazard Zone 3.
The right engine was next inspected. According to the GSE interrogation, all five of theSystem B sensing heads had faulted (NOTE - a fault light should appear on the CWU whenone or more hazard zones has no fire detection coverage). Apparently, sometime in 1983one of the hazard zones lost all of its coverage (probably, Hazard Zone 3 since SystemB's sensor 5 was disconnected leaving sensor 4 solely covering this hazard zone).
When the UV emitting wand was used as the UV emission source during the GSEinterrogation, it was found that four of the test emitters and one of the UV sensing headswere inoperative. Table 2 summarizes the findings.
Of the UVAFDS fire sensors which could be visually inspected (sensors 1,2, and 4 of bothengines), all appeared relatively clean (with respect to contaminate build-up) except forthe two number four sensors. There appeared to be a large amount of "sooty-looking"particulate matter on each of these two sensors. It was thought at first that this was thereason why System B's sensor 4 (single detector) was not responding to the UV wand.However, after cleaning its detector's glass window, it still did not respond to the UVwand emission source. Furthermore, some of the "sooty" appearance was actually biackpaint on the bulb's glass envelope. As mentioned earlier, black paint was used topartially mask the two sensor 4's to eliminate response to the afterburner flame.Nevertheless, contamination build-up on optical sensing heads does not appear to be aproblem based on the fact that one of System A's two detectors on Sensor 4 passed itsautomatic self-check, and both detectors responded to the UV wand (System A's sensor 4was not and has not been cleaned off).
Several of the CWU light bulbs were also found inoperative (NOTE - there are four lightbulbs per warning indicator in the CWU). The rechargable batteries used for the CCU'smemory retention were also depleted, as were the GSE's rechargable batteries.
A-7

Operational Status of SM-ALC;s UVAFDSTCH:6-53 Page 7Oct.
TABLE 1
Operational Status of FB-I1IA, S/N 67-159 Left Engine
UVAFDS System A
Sensor Detector Detector Emitter Status ofStatus Status Each Side of Sensor
Head I Side I Faulty Faulty NonoperationalSide 2 OK Faulty Nonoperational
0
Head 2 Side I OK Faulty NonoperationalSide 2 OK OK Operational
Head 3 Side I OK OK OperationalSide 2 OK OK Operational
Head 4 Side I OK Faulty NonoperationalSide 2 OK OK Operational
Head 5 Side I ? ? DisconnectedSide 2 ? ? Disconnected
S
6 A-8

Operational Status of SM-ALC's UVAFDSTCl-:6-53 Page 8Oct.
TABLE 2
Operational Status of FB-II IA, S/N 67-159 Right Engine
UVAFOS System B
Sensor/Detector Detector Emitter Sensor StatusStatus Status
*Head I OK Faulty N onoperational
Head 2 OK Faulty Nonoperational
Head 3 OK Faulty N onopera tional
Head 4 Faulty Faulty Nonoperational
Head 5 Disconnected
A-9
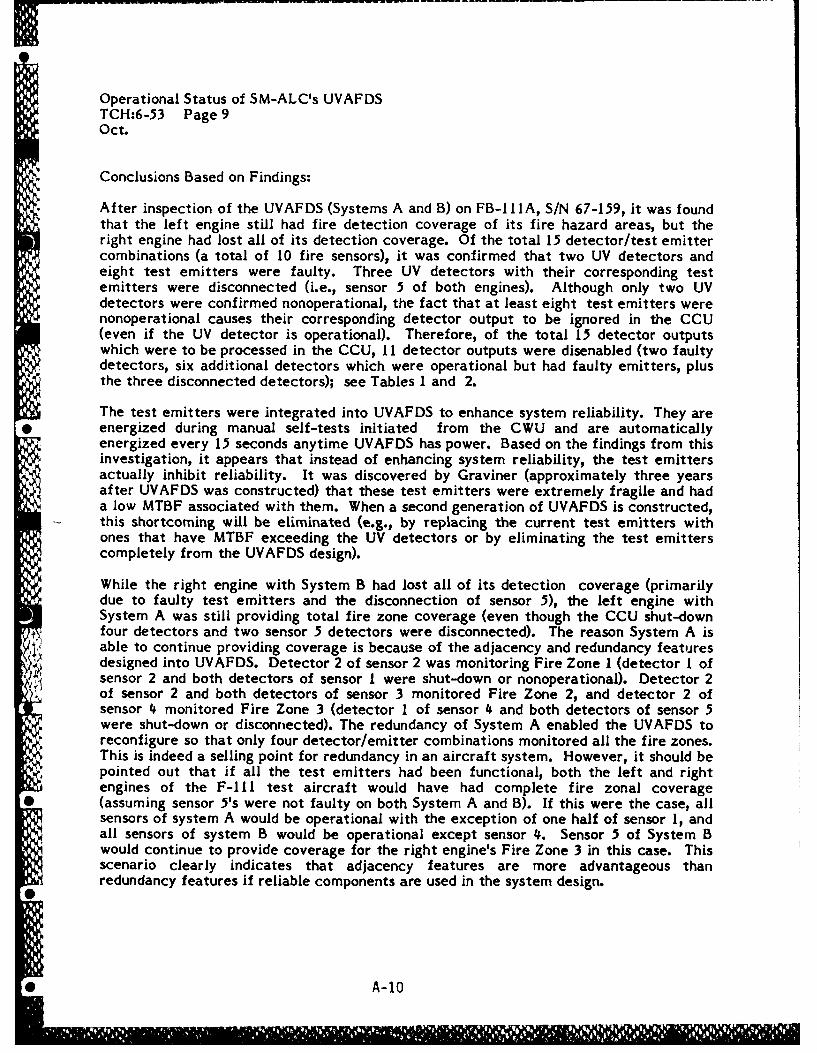
Operational Status of SM-ALC's UVAFDSTCH:6-53 Page 9Oct.
Conclusions Based on Findings:
After inspection of the UVAFDS (Systems A and B) on FB-I IA, S/N 67-159, it was foundthat the left engine still had fire detection coverage of its fire hazard areas, but theright engine had lost all of its detection coverage. Of the total 15 detector/test emittercombinations (a total of 10 fire sensors), it was confirmed that two UV detectors andeight test emitters were faulty. Three UV detectors with their corresponding testemitters were disconnected (i.e., sensor 5 of both engines). Although only two UVdetectors were confirmed nonoperational, the fact that at least eight test emitters werenonoperational causes their corresponding detector output to be ignored in the CCU(even if the UV detector is operational). Therefore, of the total 15 detector outputswhich were to be processed in the CCU, II detector outputs were disenabled (two faultydetectors, six additional detectors which were operational but had faulty emitters, plusthe three disconnected detectors); see Tables I and 2.
The test emitters were integrated into UVAFDS to enhance system reliability. They are* energized during manual self-tests initiated from the CWU and are automatically
energized every 15 seconds anytime UVAFDS has power. Based on the findings from thisinvestigation, it appears that instead of enhancing system reliability, the test emittersactually inhibit reliability. It was discovered by Graviner (approximately three yearsafter UVAFDS was constructed) that these test emitters were extremely fragile and hada low MTBF associated with them. When a second generation of UVAFDS is constructed,this shortcoming will be eliminated (e.g., by replacing the current test emitters withones that have MTBF exceeding the UV detectors or by eliminating the test emitterscompletely from the UVAFDS design).
While the right engine with System B had lost all of its detection coverage (primarilydue to faulty test emitters and the disconnection of sensor 5), the left engine withSystem A was still providing total fire zone coverage (even though the CCU shut-downfour detectors and two sensor 5 detectors were disconnected). The reason System A isable to continue providing coverage is because of the adjacency and redundancy featuresdesigned into UVAFDS. Detector 2 of sensor 2 was monitoring Fire Zone I (detector I ofsensor 2 and both detectors of sensor I were shut-down or nonoperational). Detector 2of sensor 2 and both detectors of sensor 3 monitored Fire Zone 2, and detector 2 ofsensor 4 monitored Fire Zone 3 (detector I of sensor 4 and both detectors of sensor 5were shut-down or disconnected). The redundancy of System A enabled the UVAFDS toreconfigure so that only four detector/emitter combinations monitored all the fire zones.This is indeed a selling point for redundancy in an aircraft system. However, it should bepointed out that if all the test emitters had been functional, both the left and rightengines of the F-111 test aircraft would have had complete fire zonal coverage
*(assuming sensor 5's were not faulty on both System A and B). If this were the case, allsensors of system A would be operational with the exception of one half of sensor 1, andall sensors of system B would be operational except sensor 4. Sensor 5 of System Bwould continue to provide coverage for the right engine's Fire Zone 3 in this case. Thisscenario clearly indicates that adjacency features are more advantageous thanredundancy features if reliable components are used in the system design.
0A-10
Operational Status of SM-ALC's UVAFDSTCH:6-53 Page 10Oct.
While it is unfortunate that HTL/Graviner chose such an unreliable component (testemitter) to test the integrity of a basically reliable system and gave this unreliablecomponent the "authority" to shut down an operational component (UV detector), it is adesign problem which has been resolved and will be corrected in the next generationUVAFDS.
With the exception of this particular problem, UVAFDS overall condition (considering ithad not received any maintenance attention for up to five years) was impressive.
HTL plans on continuing to pursue approaches for the next generation UVAFDS which isindependent of battery power (for CCU memory retention). The infrequent use of theSM-ALC's F-I I appears conducive to depleting their CCU batteries. Also, HTL willcontinue to seek longer lasting CWU light bulbs (as will the rest of the world).
A-11

Operational Status of SM-ALC's UVAFDSTCH:6-53 Page IlOct.
Recommended Action:
Since removal of UVAFDS from FB-II A (SIN 67-159) may upset the weight and balanceof that aircraft, it is recommended that UVAFDS remain onboard. It is furthermorerecommended that it be brought back up so that it is completely operational. Thefollowing is proposed as an interim plan to accomplish this:
(I) Determine UVAFDS operational status; complete
(2) Report operational status to USAF; pending release of this report
(3) Ship WPAFB UVAFDS system to HTL; complete
(4) Identify suitable components (from WPAFB's UVAFDS) for laterintegration into SM-ALC's F-Il l UVAFDS; 31 Oct. 86.
0 (5) HTL report status of WPAFB's UVAFDS to USAF; 14 Nov 86
(6) HTL return to SM-ALC with replacement components (includingWPAFB supplied components, new GSE batteries, new CCUbatteries, and new CWU light bulbs) and diagnostic test equipmentto repair SM-ALC's UVAFDS; as soon as FB-IIIA (S/N 67-159) isgrounded for one day.
(7) HTL report to USAF on SM-ALC's UVAFDS faults, causes, andfuture corrective action; two weeks after item (6) completed.
(8) HTL return all un-used UVAFDS hardware to WPAFB; two weeksafter item (6) completed
(9) HTL and WPAFB remain in contact with SM-ALC on a quarterlybasis for any required maintenance actions.
While this interim plan is being pursued, HTL plans on investigating the possibilities ofreplacing the UVAFDS test emitters with new-and-improved emitters and/orconstructing new sensing heads.
Please forward any comments or questions to the undersigned.
Thomas C. HillmanProgram ManagerAdvanced AircraftProtection Systems29 October, 19861tCH:lh
A-12-12

Operational Status of SM-ALC's UVAFDSTCH:6-53 Page 12Oct.
HTL Distribution: S.E. Leinwand P. HutchinsA.D. Goedeke M. CullenV. Rowe D. Guild (6 copies)P. Mehta D. Ball (Graviner Ltd)F. Kamkari
USAF Distribution:
SM-ALC/MMKRD AF WAL/POSHAttn: Mr. Bearl Nichols, Bldg. 200 Attn: Lt. Maria RodriquezMcClellan AFB, CA 95652 WPAFB, OH 45433
SM-ALC/MMKRD AFISC/SESOAttn: Mr. Karl Lonnquist, Bldg. 200 Attn: Mr. Gregory GandeeMcClellan AFB, CA 95652 Norton AFB, CA 92409
SM-ALC/MMKRAAttn: Mr. Robert Presley, Bldg. 200McClellan AFB, CA 92652
Boeing Military Airplane CompanyP.O. Box 33668Attn: Mr. Alan JohnsonDayton, OH 45433
* A- 13

APPENDIX B.
AEN DATA REDUCTION EQUATIONS
The following three sections provide the equations which will beused to calculate airflows and velocities for the eight and twentyfour inch venturlis, the high pressure air supply system and for
* the sonic nozzles used to measure simulated bleed airflow, ejectorflow and high pressure flow.
1.0 Calculation of 8 Inch Venturi Mass Flow and Velocity:
Per the Reference 7, Compressed Gas Handbook, the mass flowthrough a venturi meter in lbs/sec. is equal to:
/ (2 * g * rho * DP) /2/k (k-1)k 4W = Cd * A2 //r ( k )( 1 - r )(1-beta )
/ 4 /__ _ _ _ _ _ _ _ _ _ _ _ _ _ _ _ _ _ _ _ _
1-beta \/ 2/k 4(k-i) (1-r)(1-r * beta )
Where the first radical term is the incompressible flow equation and
the second radical term is the compressibility correction, and:
W = mass flow in lbs/sec
Cd = discharge coefficient
g = gravitational constant
rho = upstream density
DP = differential pressure across venturi
beta = ratio of throat diameter to upstream pipe diameter, D2/D1
k = specific heat ratio
r = ratio of upstream to downstream pressure, P2/PI
For air (k = 1.4) this simplifies to:
2 / rho * DP / 1.429 .2857 4W = .525 Cd * D2 /_* / r (3.5)(1-r )(1-beta )
/ 4 /\I 1 -beta \I 1.429 4
(1 - r) (1 - r * beta 4
B-1
C N. 91
1101=

Hence, substituting AEN parameters:
P1 = PFLIN (venturi upstream static pressure in psia)
DP = DPVN40 * .03606 (venturi differential pressure from highrange transducer when differential pressure
or greater than 4 inches of water)
DP = DPVN-4 * .03606 (venturi differential pressure from lowrange transducer when differential pressureless than 4 inches of water)
P1 * 144RHO = (Where TBL-08 is 8 Inch
Venturi Temperature)(53.35) * (TBL-08 + 460)
P1 - DP
R _ _or, if R < 0.6, or R > 1.0, substitute R = 1.0
0 P1
For the eight inch venturi, Cd 0.985, D2 = 4.1768, beta = 0.4968
2K = .525 * 0.985 * (4.1768) * \/ 3.5 = 16.877842
/ 1.429 0.2857/RHO * DP *(R )*(1 R )
WBL-08 = K * //
/ 1.429\/ ( 1 - R ) * [ 1 - ( R ) * 0.0609153]
This is the test section mass flow in lbs/second.
(0.152 * WBL-08) * (TNACIN + 460) Clean Test SectionVNAC-8 = : Velocity in
FT/SEC.PNCOUT
Where TNACIN is the test sectioninlet temperature in degrees F.and PNCOUT is the in test sectionpressure in psia.
B-2
C01

2.0 Calculation of 24 Inch Venturi Mass Flow and Velocity:
Using the same equation as for the eight inch venturip but with:
Cd = 0.9895, D2 = 10.158, beta = 0.4277
2K = 0.525 * 0.98975 * (10.158) * \/3.5 = 100.307926
P1 = PBLOUT (venturi upstream static pressure in psia)
DP = DPVENT * .03606 (venturi differential pressure)
If DP < O, DP = 0
P1 * 144RHO1 = (Where TBL-24 is 24 Inch
Venturi Temperature)(53.35) * (TBL-24 + 460)
P1 - DP
R = or, if R < 0.6, or R > 1.0, substitute R = 1.0
P1
K = 100.307926
/ 1.429 0.2857/RHO1 * DP *(R ) 1(1-R )
WBL-24 = K * // 1.429
\/ ( 1 - R ) * E 1 - ( R ) * 0.0334624]
This is the test section mass flow in lbs/second.
(0.152 * WBL-24) * (TNACIN + 460)VNAC24 =
PNCOUT
This is the clean test section velocity in ft/second where TNACIN isthe test section inlet temperature in degrees F. and PNCOUT is thetest section temperature in psia.
B-3

3.0 CALCULATION OF AIRFLOW FOR SONIC NOZZLES
The manufacturer of thesonic nozzles installed in the AEN, FlowMeasurement Systems, Inc., provides the following equation forcalculation of sonic nozzle airflow in Reference 8:
SP 0 *A * C C CdW - _ __
/
\/ T + 460
Where: W Airflow in lbs/second
P = Nozzle inlet stagnation pressure
C Critical fiow function for air
A Nozzle throat area in square inches
Cd = Nozzle discharge coefficient
* T = Nozzle inlet temperature, degrees Rankine
The Reference 8 memo further states that the ratio of nozzle stagnationto measured static pressure is a function of the approach Mach number
* and hence of the ratio of nozzle throat to pipe diameter. Thus it is aconstant for each nozzle. The Reference 8 memo provides diameters,areas, and stagnation to static pressure ratios for the original 3nozzles installed in the AEN. Using the same methods, the 4th nozzle,the bleed air heater system nozzle has been added to these:
- Nozzle No. Location Diameter Are p /P(inches) (in )
1 Hi flow/Hi pressure .9264 .6740 1.0019
1 2 Lo flow/Hi pressure .3712 .1082 1.0003
3 Ejector .8075 .5121 1.0011
4 Bleed air heater .2964 .0690 1.0001
*
_ C is obtained from NASA TN D-2565 and is relatively constantwithin the range of temperatures and pressures anticipated.It is equal to .5351 at 520 and 200 psia.
B-4
0
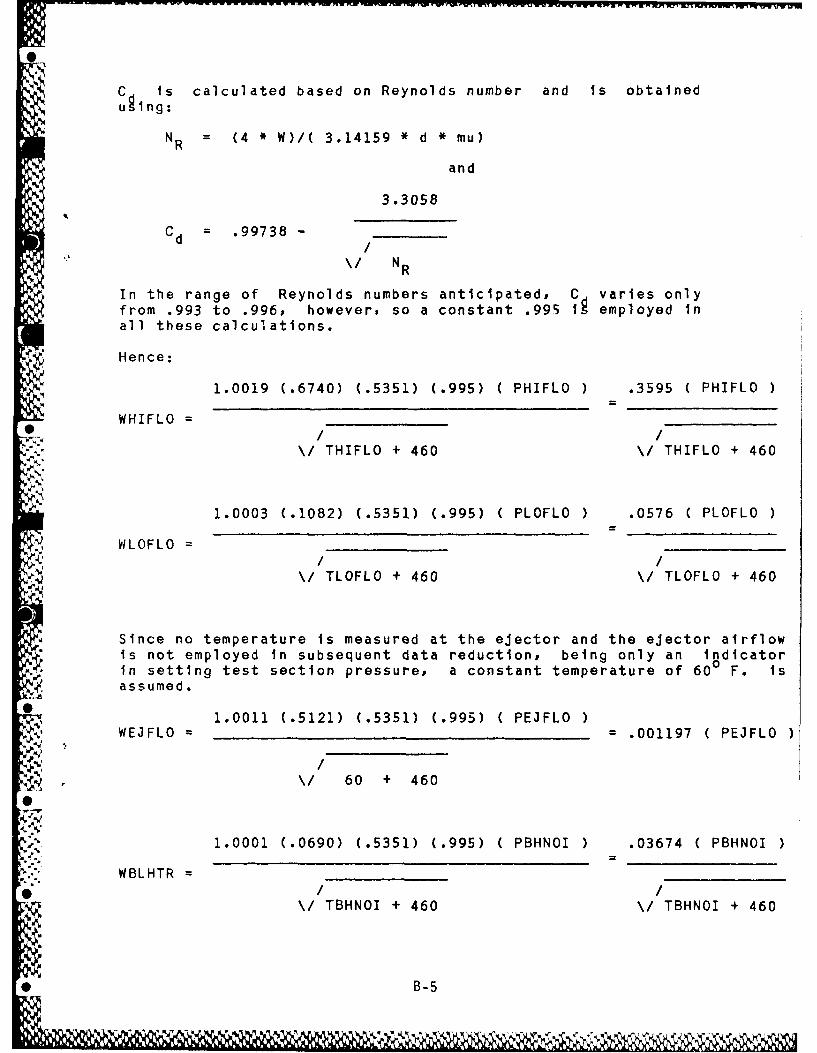
C is calculated based on Reynolds number and is obtaineduIng:
NR = (4 * W)/( 3.14159 * d * mu)
and
3.3058
Cd = 99738 -/
\/ NR
In the range of Reynolds numbers anticipated, C varies onlyfrom .993 to .996, however, so a constant .99Sig employed inall these calculations.
Hence:
1.0019 (.6740) (.5351) (.995) C PHIFLO ) .3595 ( PHIFLO )
WHIFLO =0 / /
\/ THIFLO + 460 \/ THIFLO + 460
1.0003 (.1082) (.5351) (.995) ( PLOFLO ) .0576 ( PLOFLO
WLOFLO = / /
\/ TLOFLO + 460 \/ TLOFLO + 460
Since no temperature is measured at the ejector and the ejector airflow
is not employed in subsequent data reduction, being only an indicator
in setting test section pressure, a constant temperature of 600 F. is
assumed.
WEJL0 1.0011 (.5121) (.5351) (.995) ( PEJFLO ); WEJFLO ==.001197 (PEJFLO)
\I 60 + 460
1.0001 (.0690) (.5351) (.995) (PBHNOI) .03674 (PBHNOI)
WBLHTR _
\1 TBHNOI + 460 \/ TBHNOI + 460
B-5