dsta horizons editorial team
TRANSCRIPT

DSTA HORIZONS EDITORIAL TEAM
EditorTan Yang How
MembersAng Liang Ann
Cheng Heng Ngom
Chiam Dasen
Chua Siew Ting Pearly
Heng Chye Hwee
Heng Eu Chang Leonard
Ho Kwee Peng Juli
Lee Eng Hua
Lee Kian Kong
Lee Yeaw Lip Alex
Lim Tze Kwang Terence
Lim Yan Lay
Loo Guat Hoon
Ng Keok Boon
Tan Hein Kiat Victor
Tan Tow Hua Joseph
Teo Chee Wah
Teo Chong Lai
Teo Siow Hiang
Wong Lock Liang
Wong Rong Fah
Yong Kai Ming Matthew
Zee Sow Wai
DSTA HorizonsIssue 12
ISSN 2339-529X (print) ISSN 2339-5303 (online) ©2017 Defence Science and Technology Agency
No part of this publication may be reproduced, stored or transmitted in any form or by any means without the prior written permission of the Defence Science and Technology Agency, Singapore.
The opinions and views expressed in this publication are those of the authors and do not necessarily reflect the views of the Defence Science and Technology Agency, Singapore.
All information correct at time of publication.
Readers can access current and past issues of DSTA Horizons at www.dsta.gov.sg/dstahorizons
We welcome your feedback. Please send all correspondence to:
DSTA Horizons Editorial TeamDSTA Academy1 Depot RoadSingapore 109679
Email: [email protected]
Technical EditorProfessor Khoo Boo CheongTemasek LaboratoriesNational University of Singapore
1DSTA HORIZONS | 2017
CONTENTS2 Editorial
4 Designing and Validating the Optimised Manning Concept for Littoral Mission Vessel ONG Beng Shen Aaron, CHAN Chong Weng Jerald, KOH Eng Tat Desmond, HUANG Yiwen
10 A Multi-Perspective Hazard Identification Approach for Complex System-of-Systems CHAN Yiyuan, ANG Ying Hann, LEK Soon Chor
18 Transforming Facilities Management with Information Technology CHEN Cien Sheng Gordan, SEAH Lye Kang, SIA Kok Huat
26 Leveraging Education Technologies – DSTA Academy Learning Management System LEE Kian Joo, LOW Chin Kok
34 Smart IT Development: Faster, Better, Cheaper WEE Teck Soon Alex, SEAH Yong Chuan Kenny, WONG Tian Soon Roger
40 Common Operating Environment – The Journey of Smart IT Interoperability for Enterprise LIM Tze Kwang Terence, HO Hao Xiang, TAN Kim Hong
56 A Robust Email System – Architecting a Highly Available and Secure Email System ONG Kar Leong, LIM Dawei
64 Enhancing Maritime Security Through Data Analytics LIM Ching Wu Leslie, TAN Chin Koon Adams, KANG Shian Chin, HO Cheeng Tse
70 Radio Frequency Mapping: An Adaptive Approach to Mitigate SATCOM-Radar Warning Receiver Electromagnetic Interference GOEI Sang Lang, NG Li Yun Iris, CHUNG Heng Hong
76 Finding Balance in Protective Design HENG Eu Chang Leonard, HO Chee Leong, YAP Yang Leng Ivan
84 Analysis of Weapon Danger Area on Fire Support for Flanking Troops YUEN Ming Fatt, YUAN Weiming, YAP Kah Leng
90 Towards Cost-Effective Reliability Verification in Defence Acquisition LEO Ding Yenn, TEO Yew Kheng
2 DSTA HORIZONS | 2017
EDITORIAL
Today, the technological landscape is transforming at
breakneck speed. It presents many challenges to those
who wish to maintain the status quo but also ample
opportunities for creative minds to innovate and change.
It is amid this rapidly changing environment that DSTA has
evolved continually to provide leading-edge solutions for
the Ministry of Defence and the Singapore Armed Forces
(SAF). The twelfth edition of DSTA Horizons thus features
12 articles that have been carefully curated to present our
work in developing new competencies and improving on
existing solutions across multiple disciplines to do things
more effectively, efficiently and creatively.
‘Design and Validating the Optimised Manning Concept
for Littoral Mission Vessel’ explores DSTA’s adoption of
a two-phase approach comprising cognitive analysis as
well as modelling and simulation to design and validate
the optimised manning concept for a new fleet of Littoral
Mission Vessels. This breakthrough methodology of
designing for support generated important insights for DSTA
and offers an innovative solution to overcoming the SAF’s
perennial manpower constraints. In ‘A Multi-Perspective
Hazard Identification Approach for Complex System-
of-Systems’, the use of multiple perspectives and analysis
techniques is proposed to identify emergent hazards in
System-of-Systems (SoS). With its application validated in
a networked air defence system, this approach provides a
more structured and broad framework for the identification
of emergent SoS hazards and represents DSTA’s leading
efforts in ensuring that the SoS delivered to the SAF is safe
to operate.
DSTA is always striving to enhance its operations by
spearheading transformative initiatives to exploit the non-
obvious potential of technologies. ‘Transforming Facilities
Management with Information Technology’ describes
DSTA’s move to augment the governance and efficiency
of Facilities Management (FM) with the incorporation of IT.
It also examines how the organisation is tapping Internet-
of-Things and big data technologies to change the way
FM operations are conducted for the SAF. ‘Leveraging
Education Technologies – DSTA Academy Learning
Management System’ outlines the way DSTA Academy is
harnessing education technologies and collaborative tools
such as the Learning Management System to facilitate
engaging and effective knowledge transfer. As a result,
course participants benefit from a more meaningful and
interactive learning experience, while course managers
are able to better manage their lessons. ‘Smart IT
Development: Faster, Better, Cheaper’ aims to address
the expectations and challenges that arise from the delivery
of IT with the implementation of the Smart IT Development
initiative. The initiative introduces three key enablers for
faster, simpler and more agile system delivery to keep
up with business changes. The trend of utilising smart
technologies and approaches continues in ‘Common
Operating Environment – The Journey of Smart IT
Interoperability for Enterprise’. The article traces DSTA’s
journey in managing and shaping the Common Operating
Environment through automation, smart optimisation and a
service-centric operations model.
Tan Yang HowPresidentDSTA Academy
3DSTA HORIZONS | 2017
‘A Robust Email System – Architecting a Highly
Available and Secure Email System’ illustrates the key
considerations of designing a robust enterprise email
system that ensures smooth and continuous business
operations by achieving high availability, as well as
designing for sustainment and security. ‘Enhancing
Maritime Security through Data Analytics’ delves
into the development and key concepts of the National
Maritime Security System. Employing data analytics, the
sensemaking system leverages and integrates disparate
data from various agencies to detect and identify potential
maritime threats more effectively. Using a past helicopter
upgrade programme as a case study, ‘Radio Frequency
Mapping: An Adaptive Approach to Mitigate SATCOM-
Radar Warning Receiver Electromagnetic Interference’
touches on the efforts of a DSTA team in overcoming
interference issues associated with radar warning
receivers and satellite communications, while ‘Finding
Balance in Protective Design’ details how adopting a
radically different perspective and approach to protective
infrastructure design may be key to creating buildings that
meet both peacetime and wartime needs.
‘Analysis of Weapon Danger Area on Fire Support for
Flanking Troops’ introduces the concept of Weapon
Danger Areas, along with their corresponding applications
and characteristics related to the provision of fire support
for flanking troops. In doing so, the article provides deeper
insights into achieving realistic, effective and safe live-firing
training. ‘Towards Cost-Effective Reliability Verification
in Defence Acquisition’ looks at the reasons behind the
high cost of system reliability verification, taking into account
the motives and issues faced by both defence customers
and contractors. It goes a step further by offering a solution
to manage the high cost by implementing an alternative
reliability verification approach for defence acquisitions.
Through these articles, we hope that readers will be
able to learn more about the various fields of defence
technology that DSTA is involved in and thus gain a better
understanding of the organisation’s contributions to the
defence and security of Singapore. We would also like
to express our appreciation to the authors for their hard
work and dedication. Moving forward, it is our wish that
DSTA Horizons will continue to enrich our readers through
the sharing of various domain knowledge and engineering
innovations. Thank you.
4 DSTA HORIZONS | 2017
DESIGNING AND VALIDATING THE OPTIMISED MANNING CONCEPT FOR LITTORAL MISSION VESSEL ONG Beng Shen Aaron, CHAN Chong Weng Jerald, KOH Eng Tat Desmond, HUANG Yiwen
ABSTRACT
This article examines how a two-phase approach was used to design and validate the optimised manning concept for a new fleet of Littoral Mission Vessels. The two phases of cognitive task analysis as well as modelling and simulation are described along with the insights reaped for the project. Finally, this article explores how the success of this approach has translated to a new capability for DSTA, and how this capability can contribute to future projects of similar nature.
Keywords: cognitive task analysis, CTA, modelling and simulation, concept validation
INTRODUCTION
When the Republic of Singapore Navy (RSN) embarked on the
acquisition of a new fleet of Littoral Mission Vessels (LMV) to
replace its Patrol Vessels (PV), one of the key design challenges
for DSTA was to reduce the crew size required to man the
vessel while having to increase the vessel’s overall capabilities
and missions. The need to reduce crew size had raised
concerns in workload as sufficient crew must be maintained
to ensure operators have the capacity to perform and react to
contingencies effectively.
The Integrated Command Centre (ICC) was hence
conceptualised in order to achieve optimised manning. The
ICC would co-locate the main operating centres of the vessel,
which include the Bridge, the Combat Information Centre and
the Machinery Control Room. This would centralise the crew at
the ICC to streamline work processes and better facilitate sub-
team activities and interactions.
A conventional approach to test the new ICC would be to use
standalone commercial-off-the-shelf (COTS) 3D modelling
software to visualise the system set-up and optimise console
positioning. However, there were two limitations to this
approach. First, the effectiveness of the ICC design could
not be verified until the vessel and onboard systems had
been acquired and integrated. Second, realistic onboard
scenarios and man-in-the-loop (MITL) experiments could not
be conducted effectively.
With foresight that MITL experiments were needed to evaluate
the ICC design in the context of future operations, a two-
phase validation process was developed to overcome the
limitations of the conventional approach. First, a Cognitive
Task Analysis (CTA) study was conducted. CTA is a technique
used to determine knowledge, thought processes and goal
structures that underlie observable task performances. It can
be used to model information needs and flow between various
system components, operators and mission requirements.
A Simulation-based Experiment (SBE) was conducted
subsequently. This new process involving CTA and SBE allowed
the involvement of key stakeholders in the design, analysis and
definition process, where they could interactively derive the
most effective design for implementation (see Figure 1).
5DSTA HORIZONS | 2017
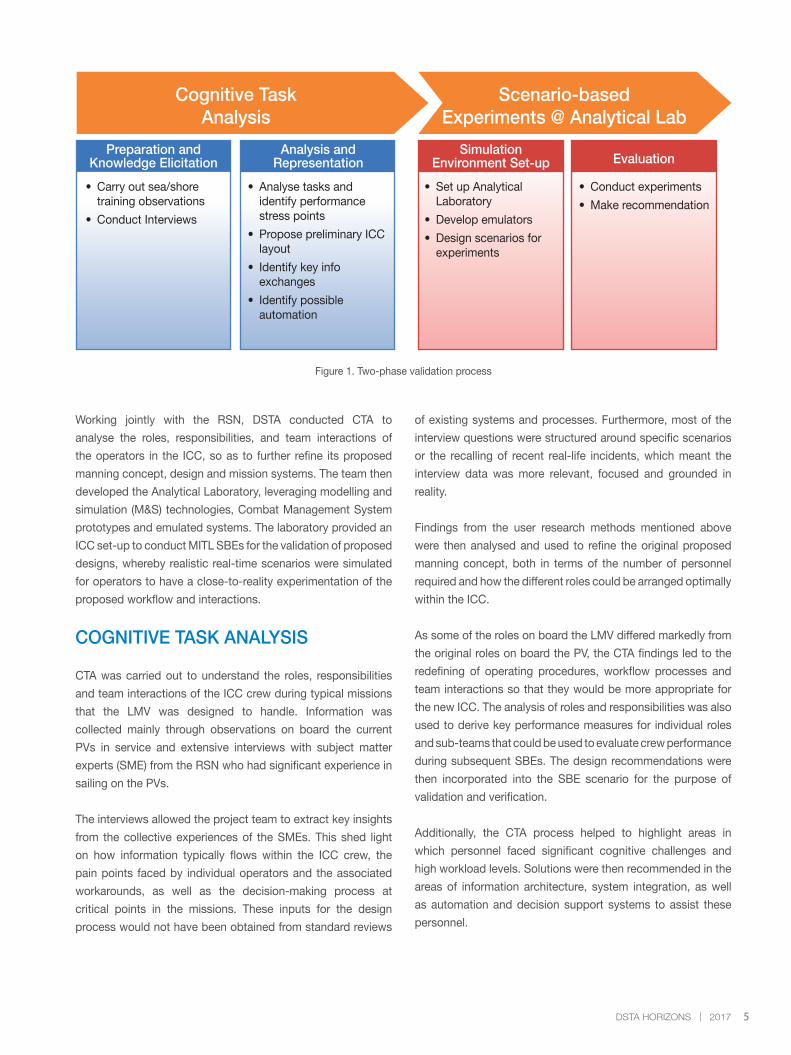
Figure 1. Two-phase validation process
Working jointly with the RSN, DSTA conducted CTA to
analyse the roles, responsibilities, and team interactions of
the operators in the ICC, so as to further refine its proposed
manning concept, design and mission systems. The team then
developed the Analytical Laboratory, leveraging modelling and
simulation (M&S) technologies, Combat Management System
prototypes and emulated systems. The laboratory provided an
ICC set-up to conduct MITL SBEs for the validation of proposed
designs, whereby realistic real-time scenarios were simulated
for operators to have a close-to-reality experimentation of the
proposed workflow and interactions.
COGNITIVE TASK ANALYSIS
CTA was carried out to understand the roles, responsibilities
and team interactions of the ICC crew during typical missions
that the LMV was designed to handle. Information was
collected mainly through observations on board the current
PVs in service and extensive interviews with subject matter
experts (SME) from the RSN who had significant experience in
sailing on the PVs.
The interviews allowed the project team to extract key insights
from the collective experiences of the SMEs. This shed light
on how information typically flows within the ICC crew, the
pain points faced by individual operators and the associated
workarounds, as well as the decision-making process at
critical points in the missions. These inputs for the design
process would not have been obtained from standard reviews
of existing systems and processes. Furthermore, most of the
interview questions were structured around specific scenarios
or the recalling of recent real-life incidents, which meant the
interview data was more relevant, focused and grounded in
reality.
Findings from the user research methods mentioned above
were then analysed and used to refine the original proposed
manning concept, both in terms of the number of personnel
required and how the different roles could be arranged optimally
within the ICC.
As some of the roles on board the LMV differed markedly from
the original roles on board the PV, the CTA findings led to the
redefining of operating procedures, workflow processes and
team interactions so that they would be more appropriate for
the new ICC. The analysis of roles and responsibilities was also
used to derive key performance measures for individual roles
and sub-teams that could be used to evaluate crew performance
during subsequent SBEs. The design recommendations were
then incorporated into the SBE scenario for the purpose of
validation and verification.
Additionally, the CTA process helped to highlight areas in
which personnel faced significant cognitive challenges and
high workload levels. Solutions were then recommended in the
areas of information architecture, system integration, as well
as automation and decision support systems to assist these
personnel.
Cognitive TaskAnalysis
Scenario-basedExperiments @ Analytical Lab
Preparation andKnowledge Elicitation
SimulationEnvironment Set-up Evaluation
Analysis andRepresentation
• Carry out sea/shore training observations
• Conduct Interviews
• Analyse tasks and identify performance stress points
• Propose preliminary ICC layout
• Identify key info exchanges
• Identify possible automation
• Set up Analytical Laboratory
• Develop emulators
• Design scenarios for experiments
• Conduct experiments
• Make recommendation
6 DSTA HORIZONS | 2017
SIMULATION-BASED EXPERIMENT
The simulation environment set-up was a key aspect in
conducting the SBE for the validation of the ICC concept.
RSN personnel were brought into the simulation environment
to conduct MITL experiments. SMEs from the RSN were also
present during the experiments to assess the crew’s efficiency
and effectiveness based on key performance measures
derived during the CTA. In addition, system data and voice
communication were captured for post-experiment analysis to
review if the objectives of the missions were met.
The following section describes some of the main challenges
faced during the design of the simulation environment and how
they were addressed:
Reconfigurable Simulation Set-up
In view of the numerous consoles required to create a
mock-up of the ICC, and that several ICC layout variants
would potentially be required during the SBE, it would be
advantageous to minimise reconfiguration effort. The team
hence adopted virtualisation and zero-client technologies,
enabling the simulation laboratory to be configured quickly
with minimal movement of workstations and rewiring. Creation
of virtual machines for new consoles or changing network
connectivity only required adjustments in the software at the
virtualisation servers. The use of virtualisation, which allows
multiple virtual machines to be installed on each physical
server, was especially apt in this case. As most of the consoles
in the ICC mock-up were not processor-intensive applications,
more virtual machines could be installed on each physical
server to fully utilise the processing capability of the server. This
in turn reduced the workstation footprint that would otherwise
be incurred if the traditional approach of physical workstations
was used.
Meeting Scenario Requirements“On Demand”
In engaging the users, the team refined the scenarios constantly
to ensure that they would be comprehensive enough for the SBE.
Faced with a tight project timeline, the team decided to build
upon DSTA’s in-house simulation engine and model repository
to create the simulation environment. This also allowed the
simulation components to be customised to user requirements
more easily and responsively. Reusing existing components and
models helped reduce the scenario development time as well.
Furthermore, as the simulation engine was designed to run on
multiple computers networked together, it was easy to increase
computational power by adding more computers, especially in
a virtualised environment, thus allowing it to simulate the huge
number of littoral vessel traffic that was potentially required.
Emulating Future Systems
As most of the systems on the eventual LMV had not been
developed yet, there was limited information available to
understand how the actual systems would behave and interact.
However, in order for the SBE to be conducted fruitfully,
emulators for the systems which incorporate essential mission
functionalities had to be developed.
To overcome this challenge, the team worked closely with
the RSN to review similar systems on other existing naval
platforms. With the information gathered, the team could then
envisage the behaviour of the systems that would be on board
the LMV and in turn develop the emulators. Finally, the end
users were asked to validate the emulators in the capacity of
their new roles on the LMV, providing feedback to fine-tune the
emulators. This was an iterative process which called for deep
involvement and cooperation from the users.
Eventually, some of the console emulators that were developed
only incorporated mission essential functions – dummy
buttons, which performed no functions upon clicking, were
added to create a realistic look and feel. Some emulators for
maritime navigation were acquired off the shelf, such as the
Electronic Chart Display Information System (ECDIS), of which
the message interface was developed in-house.
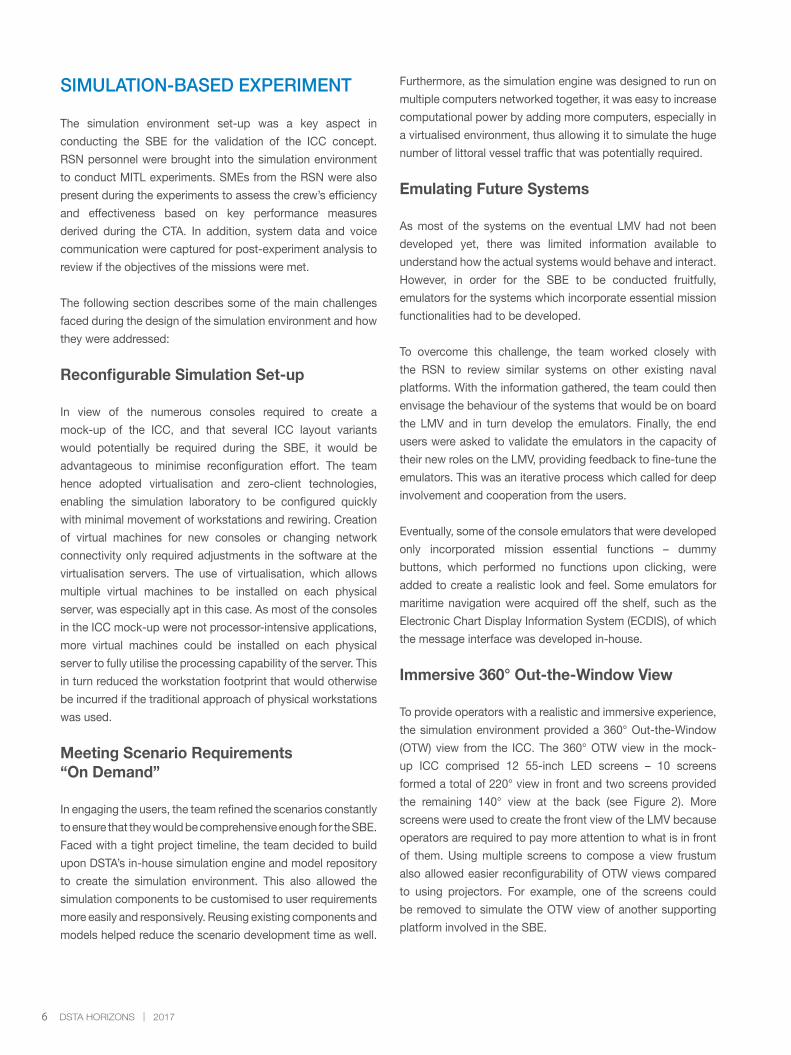
Immersive 360° Out-the-Window View
To provide operators with a realistic and immersive experience,
the simulation environment provided a 360° Out-the-Window
(OTW) view from the ICC. The 360° OTW view in the mock-
up ICC comprised 12 55-inch LED screens – 10 screens
formed a total of 220° view in front and two screens provided
the remaining 140° view at the back (see Figure 2). More
screens were used to create the front view of the LMV because
operators are required to pay more attention to what is in front
of them. Using multiple screens to compose a view frustum
also allowed easier reconfigurability of OTW views compared
to using projectors. For example, one of the screens could
be removed to simulate the OTW view of another supporting
platform involved in the SBE.
7DSTA HORIZONS | 2017
A physical workstation was used to generate two full high
definition OTW channels, making a total of six workstations
used to generate the 360° view. The use of virtual machines
was not feasible at that point in time due to the limited graphics
processing unit virtualisation technology available then.
The team also leveraged COTS image generation (IG) software
to construct the 3D visual scene for the OTW view. The
software allowed existing 3D models in M&S repositories
and existing Common Image Generator Interface – an open
simulation protocol for communication between a host device
and IG software – to be reused. More importantly, the software
allowed rapid terrain generation based on existing raw
Geographic Information System (GIS) data (e.g. digital terrain
Figure 2. Illustration of a set-up with OTW view
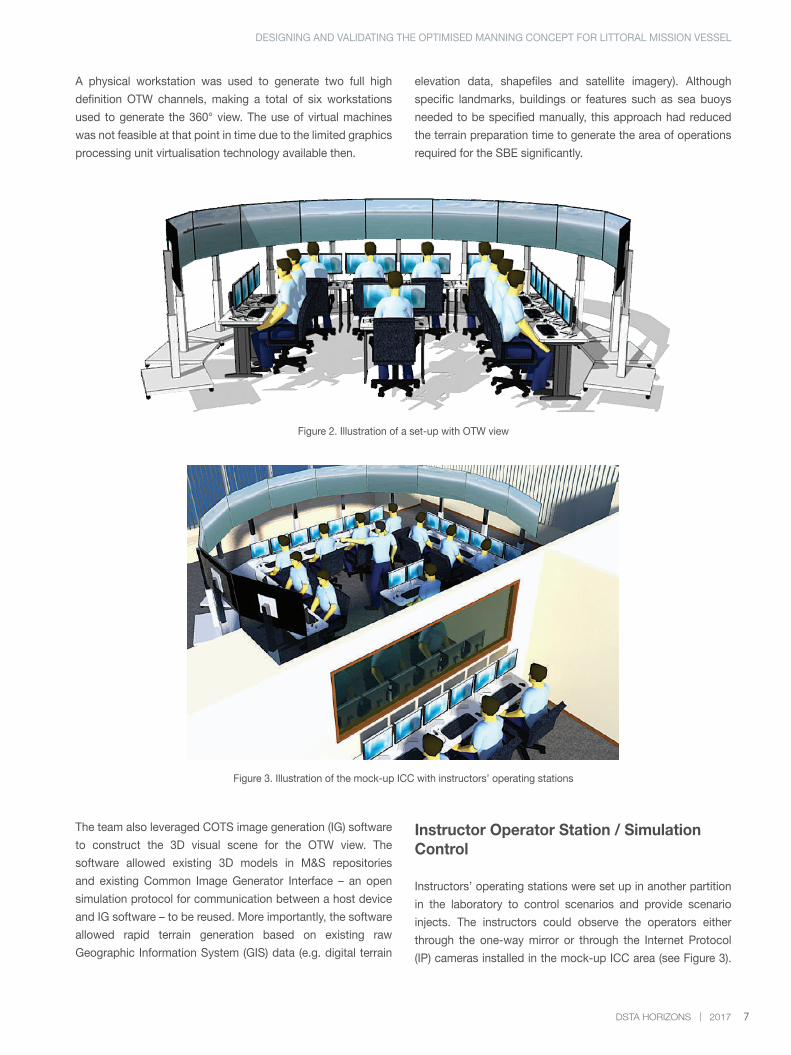
Figure 3. Illustration of the mock-up ICC with instructors’ operating stations
elevation data, shapefiles and satellite imagery). Although
specific landmarks, buildings or features such as sea buoys
needed to be specified manually, this approach had reduced
the terrain preparation time to generate the area of operations
required for the SBE significantly.
Instructor Operator Station / Simulation Control
Instructors’ operating stations were set up in another partition
in the laboratory to control scenarios and provide scenario
injects. The instructors could observe the operators either
through the one-way mirror or through the Internet Protocol
(IP) cameras installed in the mock-up ICC area (see Figure 3).
DESIGNING AND VALIDATING THE OPTIMISED MANNING CONCEPT FOR LITTORAL MISSION VESSEL
8 DSTA HORIZONS | 2017
In addition, communication between the operators could be
picked up by the instructors and recorded for subsequent
After-Action-Review if necessary. The instructors could inject
relevant developments and updates based on how the scenario
was unfolding and observe the reactions of the operators.
Computer Generated Forces
Computer Generated Forces (CGF) are autonomous simulated
forces to create a realistic simulation environment. Examples
for CGFs developed for the experiment includes littoral vessel
traffic, potential littoral threats, vessel crew behaviour, and the
motion and dynamics of the LMV. The motion and dynamics
were first modelled generically and subsequently refined
through feedback from the SMEs.
SBE Execution
The RSN crew was put into a realistic simulated environment
to execute various missions. IP-based voice communication
software was used for communication between mission
operators as well as with external agencies via simulation
control.
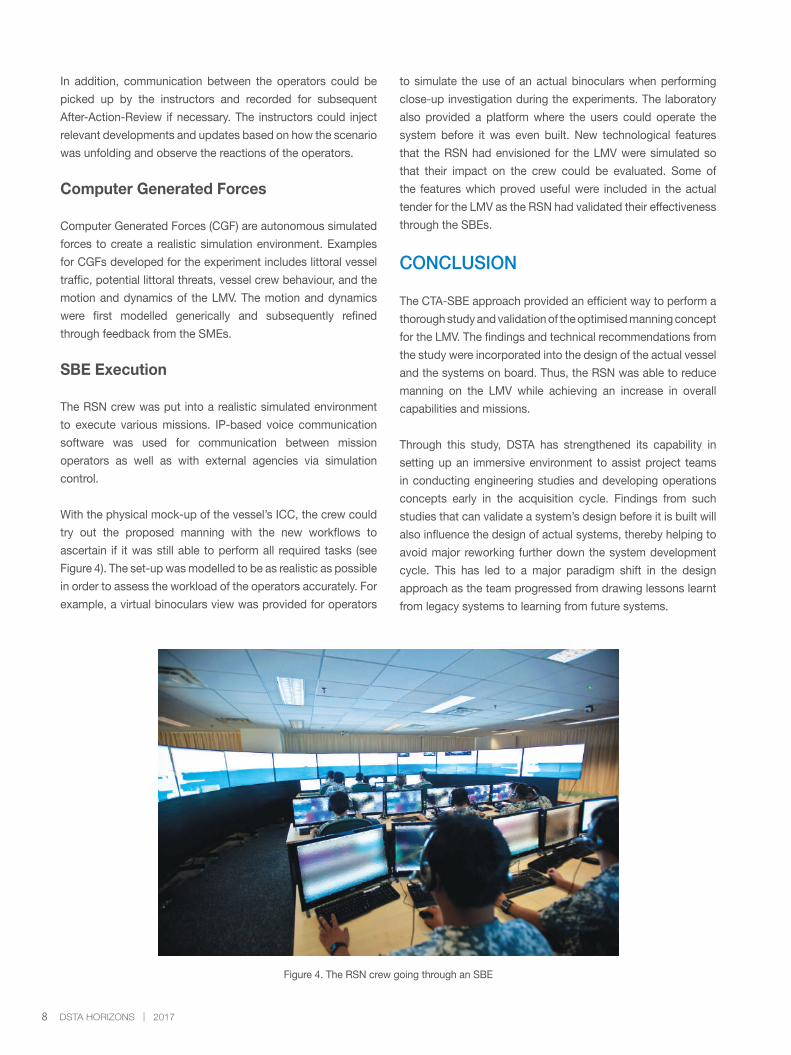
With the physical mock-up of the vessel’s ICC, the crew could
try out the proposed manning with the new workflows to
ascertain if it was still able to perform all required tasks (see
Figure 4). The set-up was modelled to be as realistic as possible
in order to assess the workload of the operators accurately. For
example, a virtual binoculars view was provided for operators
to simulate the use of an actual binoculars when performing
close-up investigation during the experiments. The laboratory
also provided a platform where the users could operate the
system before it was even built. New technological features
that the RSN had envisioned for the LMV were simulated so
that their impact on the crew could be evaluated. Some of
the features which proved useful were included in the actual
tender for the LMV as the RSN had validated their effectiveness
through the SBEs.
CONCLUSION
The CTA-SBE approach provided an efficient way to perform a
thorough study and validation of the optimised manning concept
for the LMV. The findings and technical recommendations from
the study were incorporated into the design of the actual vessel
and the systems on board. Thus, the RSN was able to reduce
manning on the LMV while achieving an increase in overall
capabilities and missions.
Through this study, DSTA has strengthened its capability in
setting up an immersive environment to assist project teams
in conducting engineering studies and developing operations
concepts early in the acquisition cycle. Findings from such
studies that can validate a system’s design before it is built will
also influence the design of actual systems, thereby helping to
avoid major reworking further down the system development
cycle. This has led to a major paradigm shift in the design
approach as the team progressed from drawing lessons learnt
from legacy systems to learning from future systems.
Figure 4. The RSN crew going through an SBE
9DSTA HORIZONS | 2017
Moreover, this new design approach creates a common
environment for operational needs to be translated to technical
implementations, generating greater understanding between
users and technologists. Furthermore, new technology can
be demonstrated to users for ease of understanding, unlike
the traditional means of communicating requirements or
technology which could lead to different interpretations. Thus,
evaluating new configurations and systems for future naval
platforms has become more productive, efficient and effective.
ACKNOWLEDGEMENTS
The authors would like to express their appreciation to SMEs
from the RSN and their colleagues from DSTA’s Naval Systems
Programme Centre for sharing their invaluable knowledge and
experience. The authors would also like to thank Mr Ang Boon
Hwa for his guidance and valuable inputs in the preparation of
this article.
BIOGRAPHY
ONG Beng Shen Aaron is a Senior Engineer
(C4I Development) managing a user
experience design team. Together with his
team, Aaron plans and leads user experience
activities for projects across DSTA to deliver
useful, usable and desirable systems. Aaron
graduated with a Bachelor of Science
(Electrical and Computer Engineering)
degree with Honours as well as a Master of Science (Electrical and
Computer Engineering) degree from Carnegie Mellon University,
USA, in 2008 and 2009, respectively.
CHAN Chong Weng Jerald is a
Development Manager (C4I Development)
working on training simulation software for
the Republic of Singapore Air Force. He led
the development of the Analytical Laboratory
that was used to validate the design of the
Integrated Command Centre of the Littoral
Mission Vessel. Jerald graduated with a
Bachelor of Science in Engineering (Computer Engineering) degree
from the University of Michigan, USA, in 2008. He further obtained
a Master of Science (Engineering Management) degree from the
University of Southern California, USA, in 2009.
KOH Eng Tat Desmond is a Development
Lead (C4I Development) who is currently
working on a simulation-based development
as part of a command and control trainer
project. He was previously involved
in the development of another navy
experimentation project involving crew
workload optimisation. Desmond graduated
with a Bachelor of Computing (Computer Science) degree with
First Class Honours from the National University of Singapore in
2011, and was awarded the Information Technology Management
Association Medal for being the top Singaporean student in the
four-year Bachelor of Computing programme.
HUANG Yiwen is a Development Manager
(C4I Development) responsible for
developing Combat Management Systems
for the Republic of Singapore Navy. She is
currently leading the development of the
Combat Management System for the Littoral
Mission Vessel, and is part of the team that
won the Defence Technology Prize Team
(Engineering) Award in 2016. Yiwen graduated with a Bachelor of
Engineering (Computer Engineering) degree with Honours from
Nanyang Technological University in 2006.
DESIGNING AND VALIDATING THE OPTIMISED MANNING CONCEPT FOR LITTORAL MISSION VESSEL
10 DSTA HORIZONS | 2017
A MULTI-PERSPECTIVE HAZARD IDENTIFICATION APPROACH FOR COMPLEX SYSTEM-OF-SYSTEMSCHAN Yiyuan, ANG Ying Hann, LEK Soon Chor
ABSTRACT
With the proliferation of System-of-Systems (SoS) to address today’s increasingly complex requirements, there is an overarching need to manage the emergent, and often unexpected, behaviours that these SoS-es bring. Safety is among the foremost concerns when emergent behaviours are considered. The complex nature of SoS is proving to be a challenge for traditional system safety techniques and practices, especially in eliciting emergent hazards due to the many interrelated and interdependent systems in an SoS. This article proposes an approach to identify emergent hazards in an SoS. The proposed approach adopts multiple perspectives to identify emergent hazards through four analysis techniques and subsequently synthesise the findings to establish the list of emergent hazards. This approach was employed for a networked air defence system, and the results showed that the approach provided a more comprehensive and systematic framework to identify emergent hazards.
Keywords: emergent hazards, hazard analysis, hazard identification, safety, system-of-systems
INTRODUCTION
System-of-Systems (SoS) has been defined as a set or
arrangement of systems that entails independent and useful
systems being integrated into a larger system that delivers
unique capabilities (Department of Defense [DoD], 2008).
These monolithic complex systems known as SoS-es are
increasingly prevalent in the Singapore Armed Forces and
are used to address the complex military requirements and
a rapidly changing threat environment. Among the various
characteristics found in SoS, emergent behaviour is of
particular concern to safety practitioners (Maier, 1998; Sage &
Cuppan, 2001). New hazards, otherwise known as emergent
hazards, which are borne out of these emergent behaviours,
are challenging to identify using traditional methods. As such,
to achieve a successful safety assessment for such a complex
SoS would require a hazard analysis methodology that
examines these complex system interactions (Pereira, Lee, &
Howard, 2006).
This article discusses the key challenges in identifying emergent
hazards and the considerations for effective emergent hazard
identification. It is proposed that a novel Multiple Perspective
Hazard Identification (MPHI) approach be taken to elicit
emergent hazards by studying SoS-es from four distinct angles
– holistic, scenario, interface and constituent system.
SOS EMERGENT HAZARDS
Emergent behaviours may bring about both beneficial and
detrimental effects to the SoS (DoD, 2008). When considering
these emergent behaviours, safety is among the foremost
concerns. These effects may give rise to emergent hazards,
which are not initially present in the constituent system but may
surface when they interoperate with other constituent systems
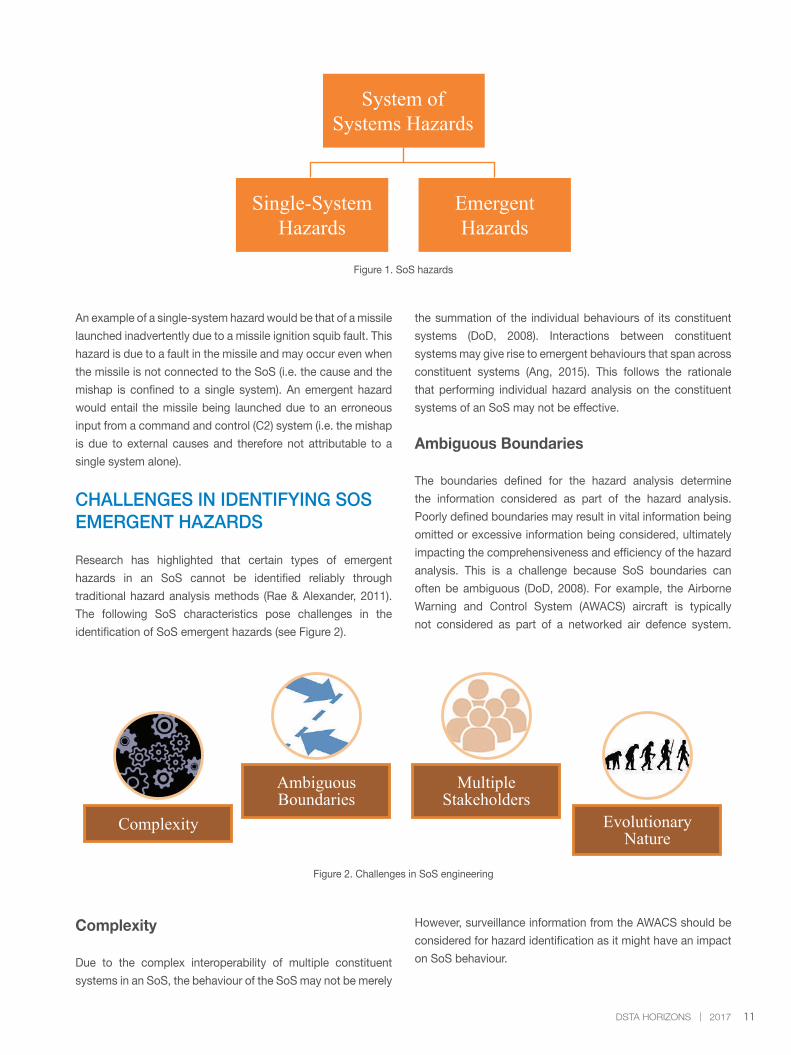
in the SoS. According to Redmond (2007), SoS hazards are
made up of both single-system hazards and emergent hazards
(see Figure 1). A single-system hazard is one that is attributable
to a single system alone. On the other hand, emergent hazards
are hazards that occur within an SoS and are not attributable
to a single system.
11DSTA HORIZONS | 2017
System ofSystems Hazards
Single-SystemHazards
EmergentHazards
Figure 1. SoS hazards
Figure 2. Challenges in SoS engineering
Complexity
Due to the complex interoperability of multiple constituent
systems in an SoS, the behaviour of the SoS may not be merely
An example of a single-system hazard would be that of a missile
launched inadvertently due to a missile ignition squib fault. This
hazard is due to a fault in the missile and may occur even when
the missile is not connected to the SoS (i.e. the cause and the
mishap is confined to a single system). An emergent hazard
would entail the missile being launched due to an erroneous
input from a command and control (C2) system (i.e. the mishap
is due to external causes and therefore not attributable to a
single system alone).
CHALLENGES IN IDENTIFYING SOS EMERGENT HAZARDS
Research has highlighted that certain types of emergent
hazards in an SoS cannot be identified reliably through
traditional hazard analysis methods (Rae & Alexander, 2011).
The following SoS characteristics pose challenges in the
identification of SoS emergent hazards (see Figure 2).
the summation of the individual behaviours of its constituent
systems (DoD, 2008). Interactions between constituent
systems may give rise to emergent behaviours that span across
constituent systems (Ang, 2015). This follows the rationale
that performing individual hazard analysis on the constituent
systems of an SoS may not be effective.
Ambiguous Boundaries
The boundaries defined for the hazard analysis determine
the information considered as part of the hazard analysis.
Poorly defined boundaries may result in vital information being
omitted or excessive information being considered, ultimately
impacting the comprehensiveness and efficiency of the hazard
analysis. This is a challenge because SoS boundaries can
often be ambiguous (DoD, 2008). For example, the Airborne
Warning and Control System (AWACS) aircraft is typically
not considered as part of a networked air defence system.
However, surveillance information from the AWACS should be
considered for hazard identification as it might have an impact
on SoS behaviour.
Complexity
AmbiguousBoundaries
MultipleStakeholders
EvolutionaryNature
12 DSTA HORIZONS | 2017
Multiple Stakeholders
An SoS typically straddles multiple engineering disciplines
whereby deep technical and operational knowledge and
expertise are embedded across many different experts (Ang,
2015). It is unlikely for any single individual to fully comprehend
the interactions and behaviour of the SoS. For example, a typical
networked air defence system comprises multiple stakeholders
from several different weapons, sensors and C2 systems.
Communication among the many different stakeholders can
hence be extremely challenging.
Evolutionary Nature
As the SoS evolves, the hazard analyses conducted for previous
configurations may cease to be accurate or relevant. New
capabilities and functions brought about with each evolution
may introduce emergent behaviours and this usually calls for
a re-analysis to be conducted on the new SoS configuration,
which may be impractical (Rae & Alexander, 2011). To further
compound the issue, the safety effort may expand exponentially
with each evolution due to the increasing number of interactions
between constituent systems. The effort required to perform a
full hazard analysis with each new SoS configuration may not
be sustainable or cost effective.
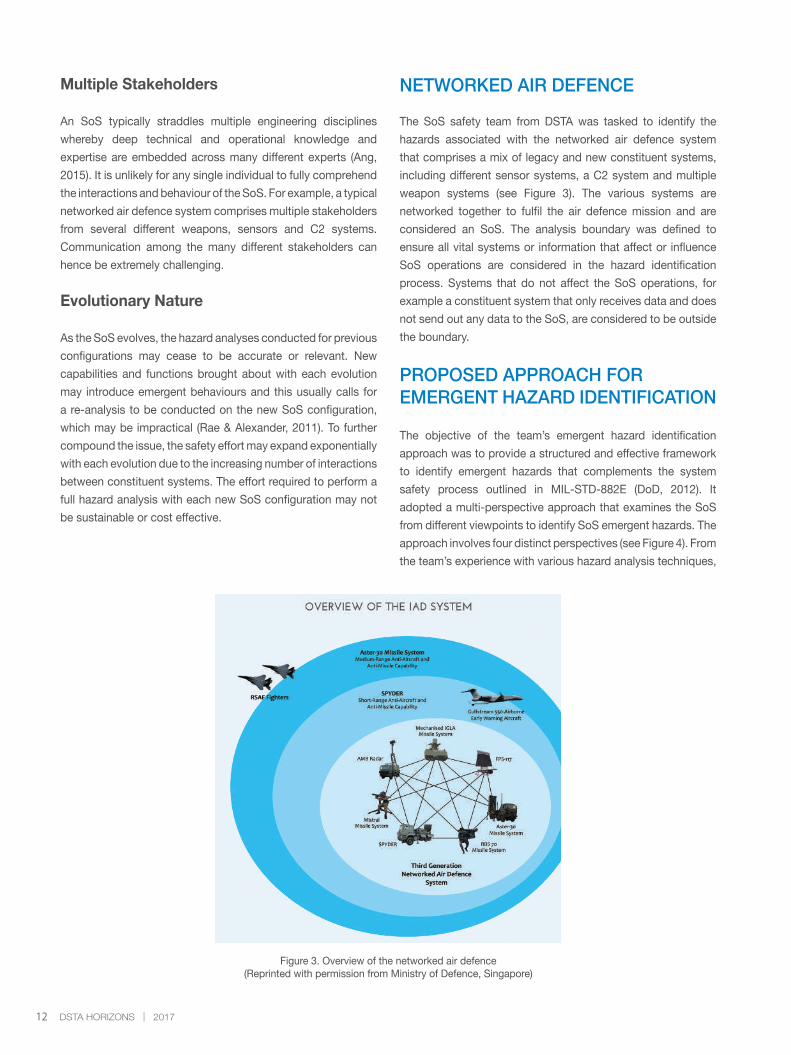
NETWORKED AIR DEFENCE
The SoS safety team from DSTA was tasked to identify the
hazards associated with the networked air defence system
that comprises a mix of legacy and new constituent systems,
including different sensor systems, a C2 system and multiple
weapon systems (see Figure 3). The various systems are
networked together to fulfil the air defence mission and are
considered an SoS. The analysis boundary was defined to
ensure all vital systems or information that affect or influence
SoS operations are considered in the hazard identification
process. Systems that do not affect the SoS operations, for
example a constituent system that only receives data and does
not send out any data to the SoS, are considered to be outside
the boundary.
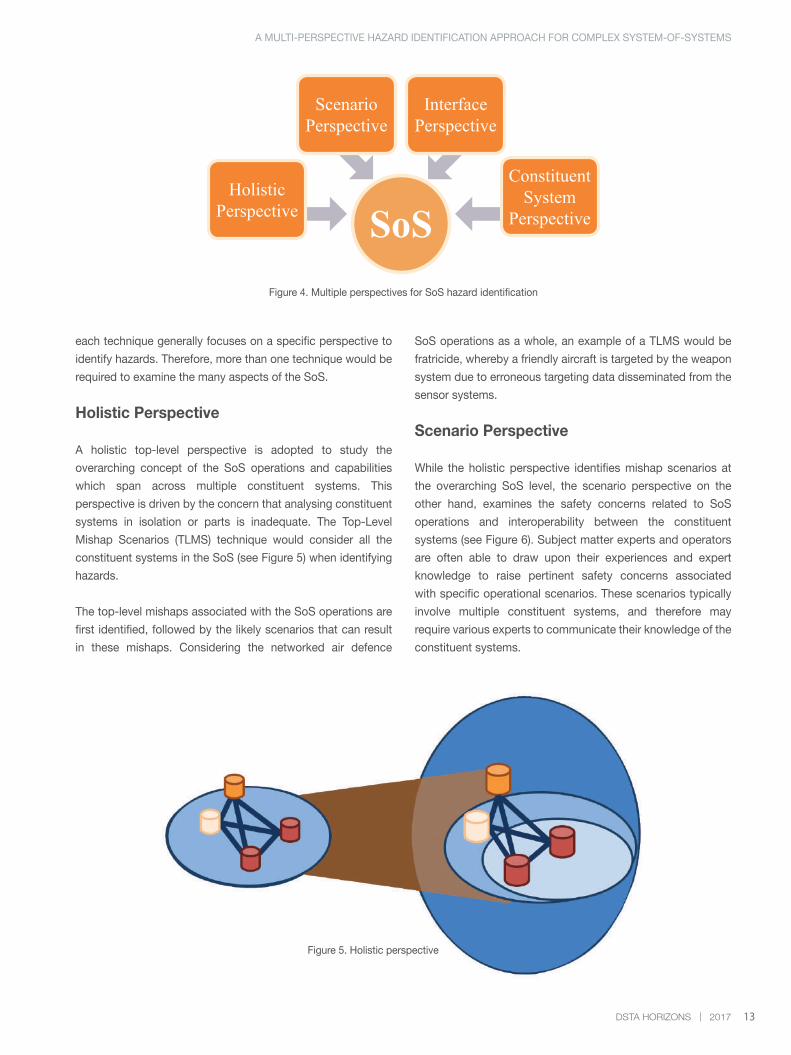
PROPOSED APPROACH FOR EMERGENT HAZARD IDENTIFICATION
The objective of the team’s emergent hazard identification
approach was to provide a structured and effective framework
to identify emergent hazards that complements the system
safety process outlined in MIL-STD-882E (DoD, 2012). It
adopted a multi-perspective approach that examines the SoS
from different viewpoints to identify SoS emergent hazards. The
approach involves four distinct perspectives (see Figure 4). From
the team’s experience with various hazard analysis techniques,
Figure 3. Overview of the networked air defence(Reprinted with permission from Ministry of Defence, Singapore)
13DSTA HORIZONS | 2017
Figure 4. Multiple perspectives for SoS hazard identification
Figure 5. Holistic perspective
each technique generally focuses on a specific perspective to
identify hazards. Therefore, more than one technique would be
required to examine the many aspects of the SoS.
Holistic Perspective
A holistic top-level perspective is adopted to study the
overarching concept of the SoS operations and capabilities
which span across multiple constituent systems. This
perspective is driven by the concern that analysing constituent
systems in isolation or parts is inadequate. The Top-Level
Mishap Scenarios (TLMS) technique would consider all the
constituent systems in the SoS (see Figure 5) when identifying
hazards.
The top-level mishaps associated with the SoS operations are
first identified, followed by the likely scenarios that can result
in these mishaps. Considering the networked air defence
SoS operations as a whole, an example of a TLMS would be
fratricide, whereby a friendly aircraft is targeted by the weapon
system due to erroneous targeting data disseminated from the
sensor systems.
Scenario Perspective
While the holistic perspective identifies mishap scenarios at
the overarching SoS level, the scenario perspective on the
other hand, examines the safety concerns related to SoS
operations and interoperability between the constituent
systems (see Figure 6). Subject matter experts and operators
are often able to draw upon their experiences and expert
knowledge to raise pertinent safety concerns associated
with specific operational scenarios. These scenarios typically
involve multiple constituent systems, and therefore may
require various experts to communicate their knowledge of the
constituent systems.
SoS
InterfacePerspective
ScenarioPerspective
HolisticPerspective
ConstituentSystem
Perspective
A MULTI-PERSPECTIVE HAZARD IDENTIFICATION APPROACH FOR COMPLEX SYSTEM-OF-SYSTEMS
14 DSTA HORIZONS | 2017
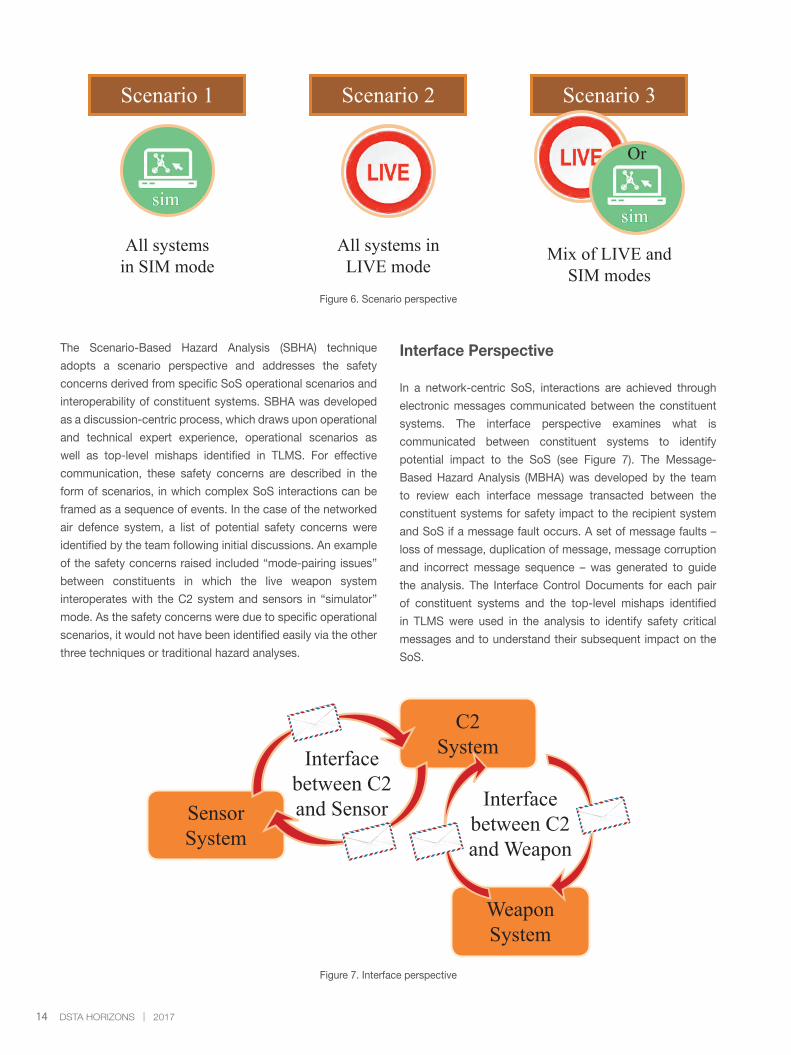
Figure 6. Scenario perspective
The Scenario-Based Hazard Analysis (SBHA) technique
adopts a scenario perspective and addresses the safety
concerns derived from specific SoS operational scenarios and
interoperability of constituent systems. SBHA was developed
as a discussion-centric process, which draws upon operational
and technical expert experience, operational scenarios as
well as top-level mishaps identified in TLMS. For effective
communication, these safety concerns are described in the
form of scenarios, in which complex SoS interactions can be
framed as a sequence of events. In the case of the networked
air defence system, a list of potential safety concerns were
identified by the team following initial discussions. An example
of the safety concerns raised included “mode-pairing issues”
between constituents in which the live weapon system
interoperates with the C2 system and sensors in “simulator”
mode. As the safety concerns were due to specific operational
scenarios, it would not have been identified easily via the other
three techniques or traditional hazard analyses.
Interface Perspective
In a network-centric SoS, interactions are achieved through
electronic messages communicated between the constituent
systems. The interface perspective examines what is
communicated between constituent systems to identify
potential impact to the SoS (see Figure 7). The Message-
Based Hazard Analysis (MBHA) was developed by the team
to review each interface message transacted between the
constituent systems for safety impact to the recipient system
and SoS if a message fault occurs. A set of message faults –
loss of message, duplication of message, message corruption
and incorrect message sequence – was generated to guide
the analysis. The Interface Control Documents for each pair
of constituent systems and the top-level mishaps identified
in TLMS were used in the analysis to identify safety critical
messages and to understand their subsequent impact on the
SoS.
All systems in SIM mode
Scenario 1
All systems in LIVE mode
Scenario 2
Mix of LIVE and SIM modes
Scenario 3
Or
Figure 7. Interface perspective
C2System
SensorSystem
WeaponSystem
Interfacebetween C2and Weapon
Interface between C2 and Sensor
15DSTA HORIZONS | 2017
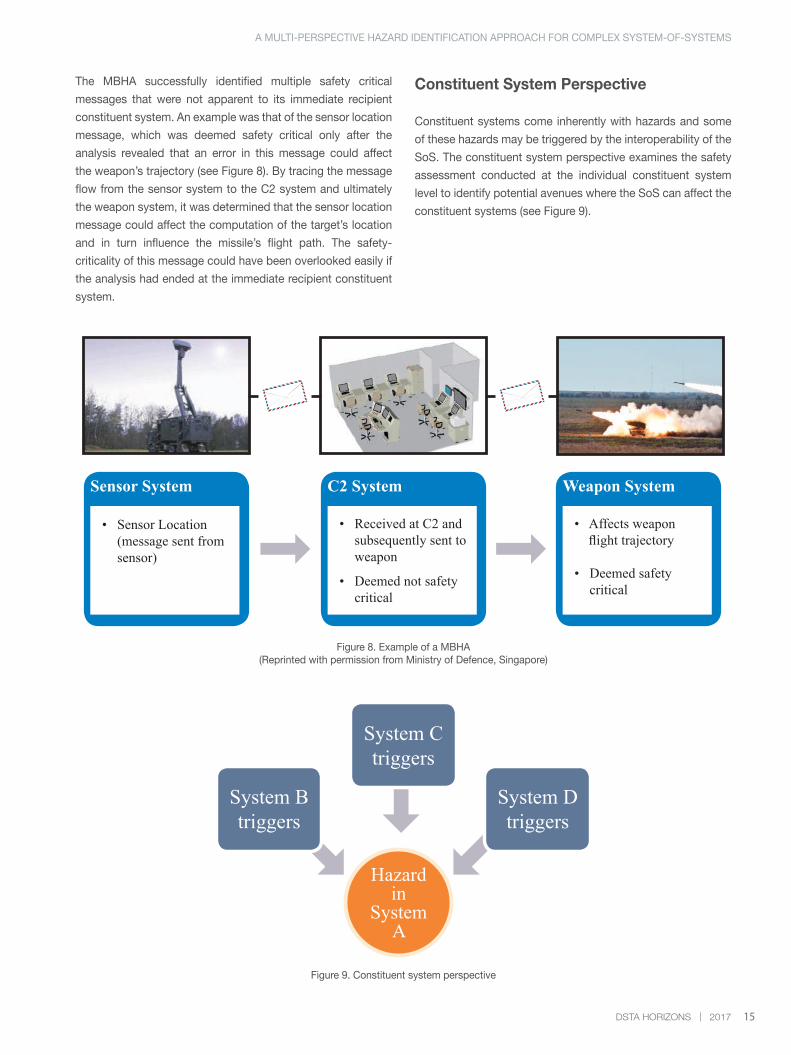
The MBHA successfully identified multiple safety critical
messages that were not apparent to its immediate recipient
constituent system. An example was that of the sensor location
message, which was deemed safety critical only after the
analysis revealed that an error in this message could affect
the weapon’s trajectory (see Figure 8). By tracing the message
flow from the sensor system to the C2 system and ultimately
the weapon system, it was determined that the sensor location
message could affect the computation of the target’s location
and in turn influence the missile’s flight path. The safety-
criticality of this message could have been overlooked easily if
the analysis had ended at the immediate recipient constituent
system.
Figure 8. Example of a MBHA(Reprinted with permission from Ministry of Defence, Singapore)
Constituent System Perspective
Constituent systems come inherently with hazards and some
of these hazards may be triggered by the interoperability of the
SoS. The constituent system perspective examines the safety
assessment conducted at the individual constituent system
level to identify potential avenues where the SoS can affect the
constituent systems (see Figure 9).
Sensor System C2 System Weapon System
• Sensor Location (message sent from sensor)
• Received at C2 and subsequently sent to weapon
• Deemed not safety critical
• Affects weapon flight trajectory
• Deemed safety critical
Figure 9. Constituent system perspective
Hazardin
SystemA
System Btriggers
System Ctriggers
System Dtriggers
A MULTI-PERSPECTIVE HAZARD IDENTIFICATION APPROACH FOR COMPLEX SYSTEM-OF-SYSTEMS

16 DSTA HORIZONS | 2017
To minimise duplication of effort, the approach builds upon
the hazard analyses previously conducted1 on the constituent
systems. It does so by leveraging the single-system hazards
as a prompt list to identify potential emergent hazards. Legacy
systems that are repurposed as constituent systems may
require reanalysis as the previously conducted hazard analyses
may be irrelevant to the SoS environment or mission.
A case of an emergent hazard identified through the Constituent
System Hazard Analysis (CSHA) was that of a missile launch
caused by a launch command submitted unintentionally by
the weapon system (see Figure 10). It was a single-system
hazard associated with the weapon system, where its hazard
components were localised within the system itself. Through
the CSHA process, it was revealed that the weapon system
could also be triggered to initiate a missile launch if it had
received a launch command from the C2 system.
Figure 10. Example of the CSHA(Reprinted with permission from Ministry of Defence, Singapore)
approach allows the identification of unique hazards that may
not be surfaced reliably if a conventional single-perspective
approach was adopted. While employing the four techniques
may result in overlapping findings, the MPHI approach
surfaces unique safety concerns and hazards that cannot be
easily identified otherwise. Although the MPHI approach is
more expensive to conduct compared to a single-perspective
approach, the resultant emergent hazard list is comparatively
more comprehensive.
Complex SoS-es continue to provide a fertile ground for new
emergent hazard analysis methodologies and the challenges
highlighted in this article provide the basis for more innovative
and effective methods to be developed. The next priority is to
enhance the approach to manage an ever-evolving SoS more
effectively.
CONCLUSION
One key concern in SoS hazard identification is whether the
emergent hazard list is comprehensive. Given the inherent
complexities, relying on a single top-down or bottom-up
technique would be severely inadequate. A multi-perspective
REFERENCES
Ang, Y. H. (2015). Investigating the Frustrations in Managing
and Engineering Defense System-of-Systems (Master’s thesis,
Massachusetts Institute of Technology, Cambridge, U.S.).
Constituent SystemHazard
Inadvertent missilelaunch
Local Causal Factors
Inadvertent missilelaunch command to
launcher from weaponconsole
Inadvertent ignition of missile rocket motor due
to faulty squib
External Causal Factors
Inadvertent launch command from C2
to weapon
No external CF
Weapon System ERROR ERROR
17DSTA HORIZONS | 2017
Department of Defense (DoD). (2008). Systems Engineering
Guide for Systems of Systems (Version 1.0). Washington, DC:
Office of the Deputy Under Secretary of Defense for Acquisition
and Technology, Systems and Software Engineering.
Department of Defense (DoD). (2012). Standard Practice
System Safety: MIL-STD-882E. U.S.: Headquarters Air Force
Materiel Command/ SES (System Safety Office).
Ericson, C. A. (2005). Hazard Analysis Techniques for System
Safety. Hoboken, New Jersey: John Wiley & Sons.
Maier, M. W. (1998). Architecting Principles for Systems of
Systems. Systems Engineering, 1(4), 267-284.
Pereira, S. J., Lee, G., & Howard, J. (2006). A System-Theoretic
Hazard Analysis Methodology for a Non-advocate Safety
Assessment of the Ballistic Missile Defense System. U.S.:
American Institute of Aeronautics and Astronautics.
Rae, A. J., & Alexander, R. D. (2011). Is the “System of Systems”
a Useful Concept for Hazard Analysis? Proceedings of the 29th
International System Safety Conference.
Redmond, P. J. (2007). A System of Systems Interface Hazard
Analysis Technique (Master’s thesis, Naval Postgraduate
School, Monterey, U.S.).
Sage, A. P., & Cuppan, C. D. (2001). On the Systems Engineering
and Management of Systems of Systems and Federation of
Systems. Information, Knowledge, Systems Management, 2(4),
325-345.
ENDNOTES
1 Each constituent system must first provide the assurance
that it is safe for standalone operations before it is permitted to
be integrated into the SoS. Therefore, each constituent system
would have had its hazard analysis conducted as a single
system prior to its integration with the SoS.
BIOGRAPHY
CHAN Yiyuan is a Senior Engineer (DSTA
Masterplanning and Systems Architecting)
who currently oversees the System-of-
Systems (SoS) safety for the Island Air
Defence System. Yiyuan graduated with
a Bachelor of Engineering (Electrical and
Electronics) degree with Honours from
Nanyang Technological University in 2007.
ANG Ying Hann is Head System Safety
(DSTA Masterplanning and Systems
Architecting) who leads a team responsible
for developing, sustaining and promulgating
system safety practices in DSTA. Ying Hann
graduated with a Bachelor of Engineering
(Electrical and Computer Engineering)
degree with Honours as well as a Master of
Engineering (Electrical and Computer Engineering) degree from
the National University of Singapore (NUS) in 2003 and 2006
respectively. He further obtained a Master of Science (Engineering
and Management) degree from the Massachusetts Institute of
Technology, USA, in 2015.
LEK Soon Chor is a Senior Principal
Engineer (Networked Systems) who
manages the system architecting and
solution development for the future
Airbase. He was involved in the project
management and various SoS engineering
aspects of the Island Air Defence System.
Soon Chor graduated with a Bachelor
of Science (Computer Science) degree as well as a Master of
Science (Computer Science) degree from NUS in 1991 and 1996
respectively.
A MULTI-PERSPECTIVE HAZARD IDENTIFICATION APPROACH FOR COMPLEX SYSTEM-OF-SYSTEMS
18 DSTA HORIZONS | 2017
TRANSFORMING FACILITIES MANAGEMENT WITH INFORMATION TECHNOLOGYCHEN Cien Sheng Gordan, SEAH Lye Kang, SIA Kok Huat
ABSTRACT
Facilities Management (FM) involves several challenges in terms of manpower needs, process efficiency and information management. This article explains how DSTA is transforming FM with its IT-enabled Facilities Management (ITeFM) project to strengthen governance and enhance efficiency. It also highlights the organisation’s efforts in overcoming the photography policy in Singapore Armed Forces (SAF) camps to optimise the effectiveness of the project. Finally, the article outlines DSTA’s emerging use of Internet-of-Things and big data technologies under the FM Control Centre (FMCC) concept to elevate the level of FM operations for the SAF. With real-time monitoring and analytical capabilities, the FMCC is envisaged to transform FM operations with a comprehensive awareness of maintenance, health status and utilities usage.
Keywords: facilities management, ITeFM, FMCC, computerised maintenance management system
INTRODUCTION
DSTA’s Building and Infrastructure (BI)1 Programme Centre
manages more than 6,000 Ministry of Defence (MINDEF) and
Singapore Armed Forces (SAF) buildings, facilities and estates.
Its scope of work includes a wide spectrum of service delivery2
through outsourced Facilities Mangement Agents (FMA) and
Integrated Building Contractors3 (IBC). The FMA’s role is to
provide maintenance management services, supervision and
certification of work done by the IBC.
CHALLENGES IN FACILITIES MANAGEMENT
However, Facilities Management (FM) is often manpower-
intensive and has inherent inefficiencies, as information
and process flow rely heavily on hard copies and sequential
workflows. Maintenance activities involve extensive manual
data entries and are hence prone to errors and lapses. This
issue is compounded by the voluminous transactions for large
real estates.
The following factors should be taken into account when
addressing these challenges to better support the SAF’s
operational outcomes.
a) Greater Efficiency – To provide effective and efficient
service, inefficient layers and duplicated efforts in FM processes
need to be eliminated. This should be supported by a common
and collaborative platform with real-time information and
seamless connectivity across all stakeholders and supporting
systems. Data should also be captured to ensure information
accuracy and currency.
b) Better Governance – Strengthening the accountability of
MINDEF and DSTA as stewards of public funds and resources
requires processes to be streamlined and standardised
to ensure an effective oversight of FM operations and the
performance of contractors. All outsourced maintenance
works should be completed and certified based on objective
evidence, which is any documented information that can attest
to the quality of an activity or item.
c) Enhanced Effectiveness – There is typically a lack in
visibility on the status and performance of BI systems. Although
some systems have basic monitoring capabilities, they are
19DSTA HORIZONS | 2017
disparate in nature and integrated loosely. This results in users
having to perform fault and incident reports manually and often
retrospectively. Moreover, turnaround time for response and
recovery can be reduced and user experience improved.
LEVERAGING INFORMATION TECHNOLOGY
In recent years, there has been an increasing application of IT
in the FM industry that is driven by the advent of 4G mobile
connectivity and mobile applications (app). An example is the
OneService Mobile App4 initiative launched in January 2015 by
the Municipal Services Office.
IT-enabled Facilities Management
The IT-enabled Facilities Management (ITeFM) project was
conceived by DSTA with the aim of leveraging advances in IT
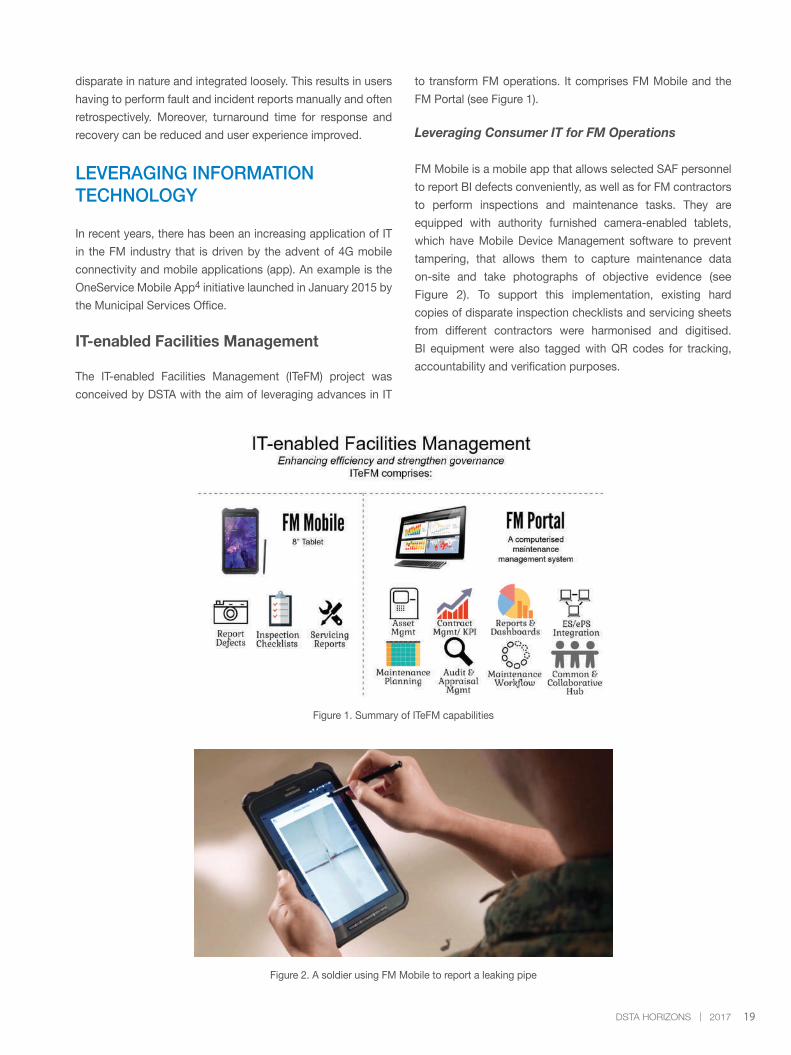
Figure 1. Summary of ITeFM capabilities
Figure 2. A soldier using FM Mobile to report a leaking pipe
to transform FM operations. It comprises FM Mobile and the
FM Portal (see Figure 1).
Leveraging Consumer IT for FM Operations
FM Mobile is a mobile app that allows selected SAF personnel
to report BI defects conveniently, as well as for FM contractors
to perform inspections and maintenance tasks. They are
equipped with authority furnished camera-enabled tablets,
which have Mobile Device Management software to prevent
tampering, that allows them to capture maintenance data
on-site and take photographs of objective evidence (see
Figure 2). To support this implementation, existing hard
copies of disparate inspection checklists and servicing sheets
from different contractors were harmonised and digitised.
BI equipment were also tagged with QR codes for tracking,
accountability and verification purposes.
20 DSTA HORIZONS | 2017
Leveraging Enterprise IT for Maintenance Management
The FM Portal is a computerised maintenance management
system that acts as a central tool for maintenance planning,
execution and control.
A Common and Collaborative Hub
The FM Portal serves as a one-stop platform for communication
among stakeholders within the FM community and provides
them with real-time information such as the job request costing
and the current job status. Hence, it prevents fragmentation
in the response and decision-making processes, and enables
a more agile deployment of resources. This means that the
relevant parties can better understand issues and carry out the
necessary actions or adjustments in a more timely manner. The
objective is to create a more holistic and integrated end-to-end
FM service delivery for a richer and deeper user experience.
Central Portal for Maintenance Planning, Execution and Control
The FM Portal, with a good workflow engine which clearly
illustrate FM work processes, provides greater control over the
voluminous transactions related to FM operations as well as
more effective governance due to dedicated audit trails. It also
allows FM personnel to monitor work progress and maintain
oversight for all FM work and services more efficiently. In
addition, the FM Portal automates labour intensive tasks such
as the generation of maintenance schedules and computation
of claims. This not only reduces manpower needs but also
mitigates the possibility of human error. Moreover, the vast
amount of data can be collected and harnessed to provide
deeper insights into FM operations.
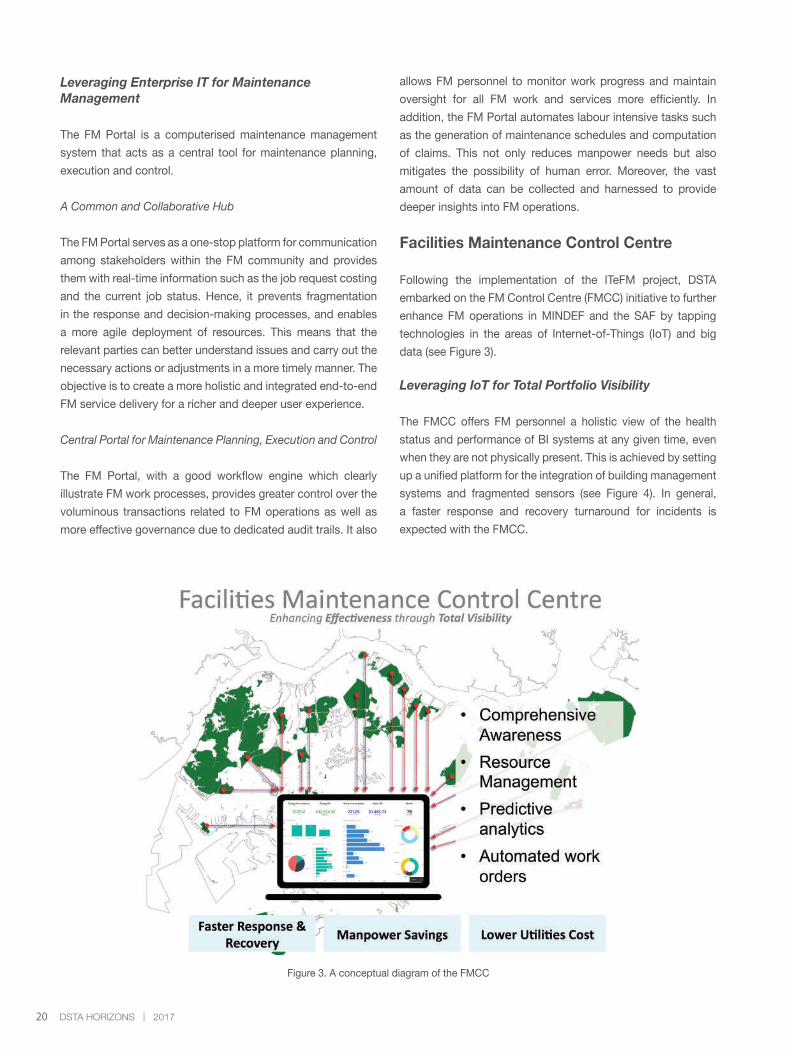
Facilities Maintenance Control Centre
Following the implementation of the ITeFM project, DSTA
embarked on the FM Control Centre (FMCC) initiative to further
enhance FM operations in MINDEF and the SAF by tapping
technologies in the areas of Internet-of-Things (IoT) and big
data (see Figure 3).
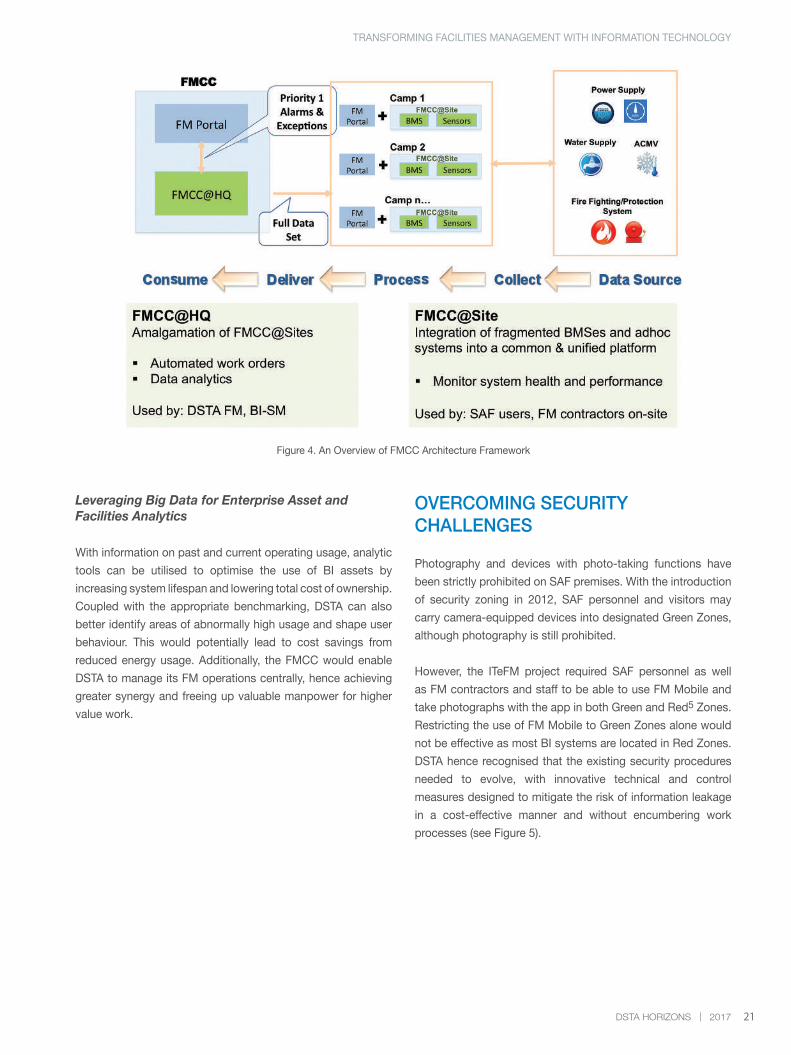
Leveraging IoT for Total Portfolio Visibility
The FMCC offers FM personnel a holistic view of the health
status and performance of BI systems at any given time, even
when they are not physically present. This is achieved by setting
up a unified platform for the integration of building management
systems and fragmented sensors (see Figure 4). In general,
a faster response and recovery turnaround for incidents is
expected with the FMCC.
Figure 3. A conceptual diagram of the FMCC
21DSTA HORIZONS | 2017
Figure 4. An Overview of FMCC Architecture Framework
Leveraging Big Data for Enterprise Asset and Facilities Analytics
With information on past and current operating usage, analytic
tools can be utilised to optimise the use of BI assets by
increasing system lifespan and lowering total cost of ownership.
Coupled with the appropriate benchmarking, DSTA can also
better identify areas of abnormally high usage and shape user
behaviour. This would potentially lead to cost savings from
reduced energy usage. Additionally, the FMCC would enable
DSTA to manage its FM operations centrally, hence achieving
greater synergy and freeing up valuable manpower for higher
value work.
OVERCOMING SECURITY CHALLENGES
Photography and devices with photo-taking functions have
been strictly prohibited on SAF premises. With the introduction
of security zoning in 2012, SAF personnel and visitors may
carry camera-equipped devices into designated Green Zones,
although photography is still prohibited.
However, the ITeFM project required SAF personnel as well
as FM contractors and staff to be able to use FM Mobile and
take photographs with the app in both Green and Red5 Zones.
Restricting the use of FM Mobile to Green Zones alone would
not be effective as most BI systems are located in Red Zones.
DSTA hence recognised that the existing security procedures
needed to evolve, with innovative technical and control
measures designed to mitigate the risk of information leakage
in a cost-effective manner and without encumbering work
processes (see Figure 5).
TRANSFORMING FACILITIES MANAGEMENT WITH INFORMATION TECHNOLOGY
22 DSTA HORIZONS | 2017
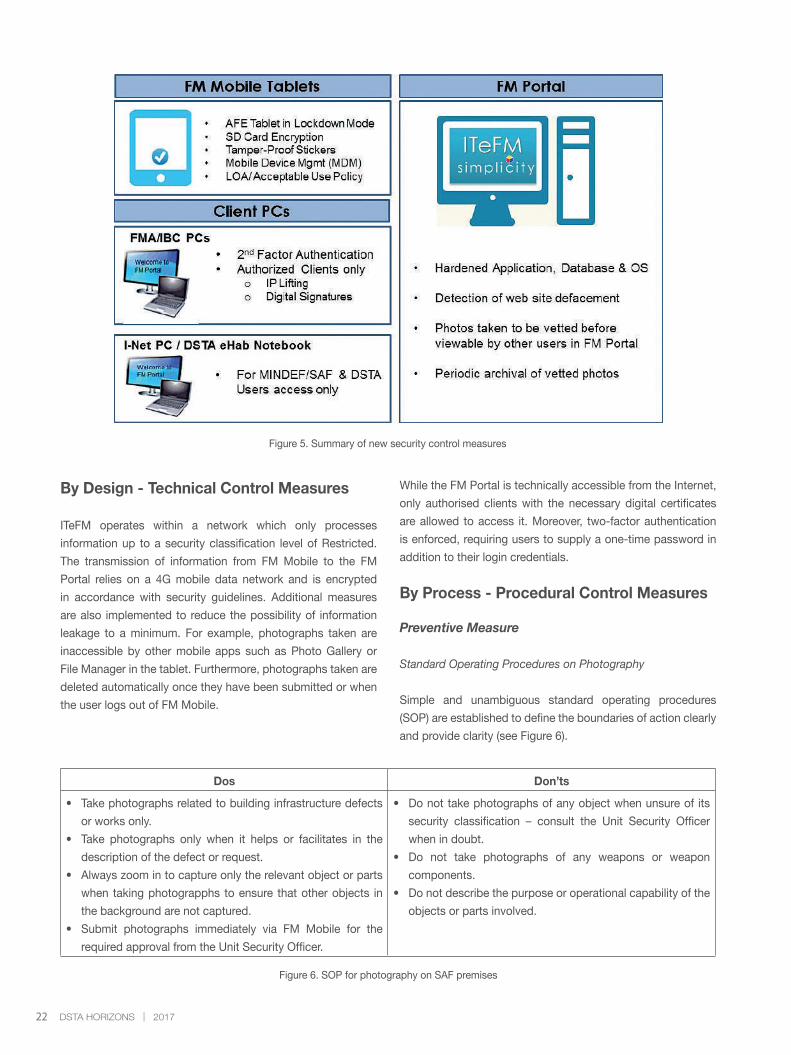
Figure 5. Summary of new security control measures
By Design - Technical Control Measures
ITeFM operates within a network which only processes
information up to a security classification level of Restricted.
The transmission of information from FM Mobile to the FM
Portal relies on a 4G mobile data network and is encrypted
in accordance with security guidelines. Additional measures
are also implemented to reduce the possibility of information
leakage to a minimum. For example, photographs taken are
inaccessible by other mobile apps such as Photo Gallery or
File Manager in the tablet. Furthermore, photographs taken are
deleted automatically once they have been submitted or when
the user logs out of FM Mobile.
While the FM Portal is technically accessible from the Internet,
only authorised clients with the necessary digital certificates
are allowed to access it. Moreover, two-factor authentication
is enforced, requiring users to supply a one-time password in
addition to their login credentials.
By Process - Procedural Control Measures
Preventive Measure
Standard Operating Procedures on Photography
Simple and unambiguous standard operating procedures
(SOP) are established to define the boundaries of action clearly
and provide clarity (see Figure 6).
Dos Don’ts
• Take photographs related to building infrastructure defects
or works only.
• Take photographs only when it helps or facilitates in the
description of the defect or request.
• Always zoom in to capture only the relevant object or parts
when taking photograpphs to ensure that other objects in
the background are not captured.
• Submit photographs immediately via FM Mobile for the
required approval from the Unit Security Officer.
• Do not take photographs of any object when unsure of its
security classification – consult the Unit Security Officer
when in doubt.
• Do not take photographs of any weapons or weapon
components.
• Do not describe the purpose or operational capability of the
objects or parts involved.
Figure 6. SOP for photography on SAF premises
23DSTA HORIZONS | 2017
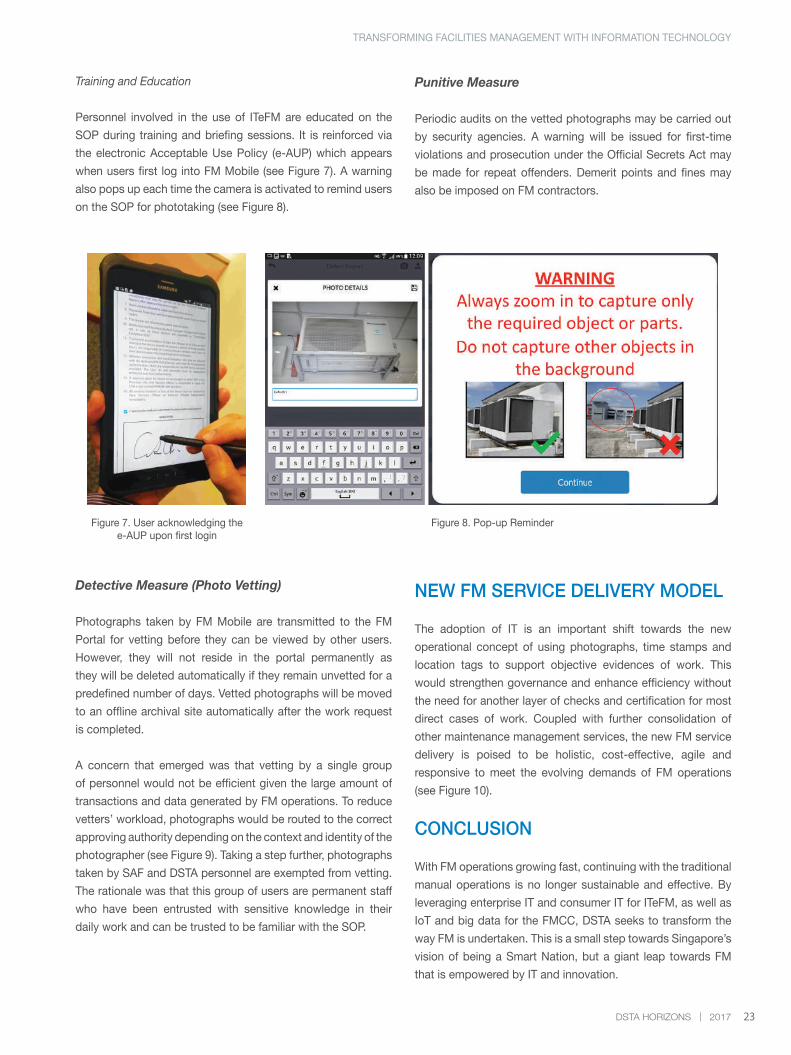
Training and Education
Personnel involved in the use of ITeFM are educated on the
SOP during training and briefing sessions. It is reinforced via
the electronic Acceptable Use Policy (e-AUP) which appears
when users first log into FM Mobile (see Figure 7). A warning
also pops up each time the camera is activated to remind users
on the SOP for phototaking (see Figure 8).
Figure 7. User acknowledging the e-AUP upon first login
Figure 8. Pop-up Reminder
Punitive Measure
Periodic audits on the vetted photographs may be carried out
by security agencies. A warning will be issued for first-time
violations and prosecution under the Official Secrets Act may
be made for repeat offenders. Demerit points and fines may
also be imposed on FM contractors.
Detective Measure (Photo Vetting)
Photographs taken by FM Mobile are transmitted to the FM
Portal for vetting before they can be viewed by other users.
However, they will not reside in the portal permanently as
they will be deleted automatically if they remain unvetted for a
predefined number of days. Vetted photographs will be moved
to an offline archival site automatically after the work request
is completed.
A concern that emerged was that vetting by a single group
of personnel would not be efficient given the large amount of
transactions and data generated by FM operations. To reduce
vetters’ workload, photographs would be routed to the correct
approving authority depending on the context and identity of the
photographer (see Figure 9). Taking a step further, photographs
taken by SAF and DSTA personnel are exempted from vetting.
The rationale was that this group of users are permanent staff
who have been entrusted with sensitive knowledge in their
daily work and can be trusted to be familiar with the SOP.
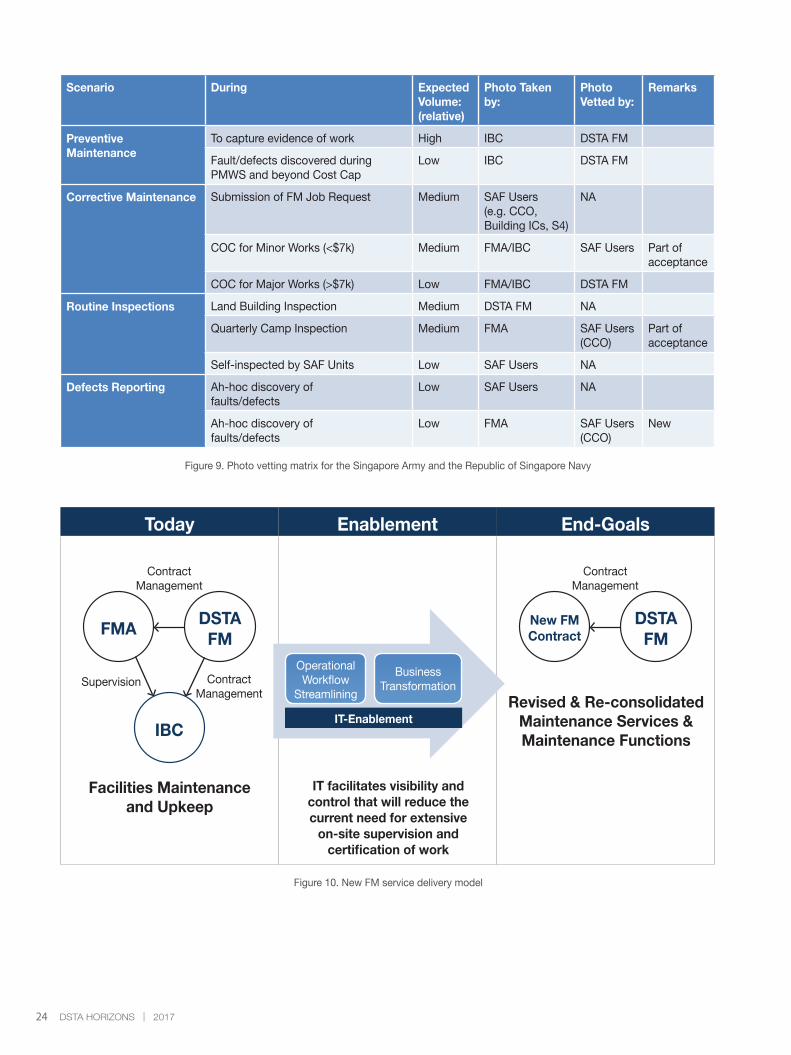
NEW FM SERVICE DELIVERY MODEL
The adoption of IT is an important shift towards the new
operational concept of using photographs, time stamps and
location tags to support objective evidences of work. This
would strengthen governance and enhance efficiency without
the need for another layer of checks and certification for most
direct cases of work. Coupled with further consolidation of
other maintenance management services, the new FM service
delivery is poised to be holistic, cost-effective, agile and
responsive to meet the evolving demands of FM operations
(see Figure 10).
CONCLUSION
With FM operations growing fast, continuing with the traditional
manual operations is no longer sustainable and effective. By
leveraging enterprise IT and consumer IT for ITeFM, as well as
IoT and big data for the FMCC, DSTA seeks to transform the
way FM is undertaken. This is a small step towards Singapore’s
vision of being a Smart Nation, but a giant leap towards FM
that is empowered by IT and innovation.
TRANSFORMING FACILITIES MANAGEMENT WITH INFORMATION TECHNOLOGY
24 DSTA HORIZONS | 2017
Figure 10. New FM service delivery model
Figure 9. Photo vetting matrix for the Singapore Army and the Republic of Singapore Navy
Scenario During Expected Volume: (relative)
Photo Taken by:
Photo Vetted by:
Remarks
PreventiveMaintenance
To capture evidence of work High IBC DSTA FM
Fault/defects discovered during PMWS and beyond Cost Cap
Low IBC DSTA FM
Corrective Maintenance Submission of FM Job Request Medium SAF Users(e.g. CCO,Building ICs, S4)
NA
COC for Minor Works (<$7k) Medium FMA/IBC SAF Users Part of acceptance
COC for Major Works (>$7k) Low FMA/IBC DSTA FM
Routine Inspections Land Building Inspection Medium DSTA FM NA
Quarterly Camp Inspection Medium FMA SAF Users(CCO)
Part of acceptance
Self-inspected by SAF Units Low SAF Users NA
Defects Reporting Ah-hoc discovery of faults/defects
Low SAF Users NA
Ah-hoc discovery of faults/defects
Low FMA SAF Users(CCO)
New
Today Enablement End-Goals
Facilities Maintenanceand Upkeep
IT facilitates visibility andcontrol that will reduce thecurrent need for extensive
on-site supervision andcertification of work
Revised & Re-consolidatedMaintenance Services &Maintenance Functions
New FMContract
DSTAFM
ContractManagement
FMADSTAFM
IBC
ContractManagement
Supervision ContractManagement
IT-Enablement
OperationalWorkflow
Streamlining
BusinessTransformation
25DSTA HORIZONS | 2017
ACKNOWLEDGEMENTS
The authors would like to thank subject matter experts from
MINDEF and the SAF, as well as colleagues from DSTA for their
support in realising the ITeFM project. The authors would also
like to express their appreciation to Mr Eugene Chang and Mr
Lek Jiunn Feng for their leadership and contributions to the
project.
ENDNOTES
1 DSTA’s FM team comprises more than 100 staff distributed
over three regional offices at Gombak, Keat Hong Camp and
Paya Lebar Air Base.
2 DSTA’s BI Programme Centre provides a wide spectrum of
service delivery for MINDEF and the SAF, ranging from cleaning
and grass-cutting services to the maintenance of complex
monitoring and evaluation systems.
3 Today, DSTA and the SAF works with three FMAs and six
IBCs. MINDEF and SAF facilities (including camps, bases and
training areas) are grouped into 26 clusters. Each cluster has a
FMA and IBC assigned.
4 A free mobile app for the public to provide feedback on
municipal issues through a common platform. The app will
route each feedback to the relevant agency automatically so
that more timely service and response can be provided.
5 Red Zones are areas where classified information and
equipment are processed and managed. As such, camera-
equipped devices are not allowed in these zones.
BIOGRAPHY
CHEN Cien Sheng Gordan is a Manager
(Building and Infrastructure) who is
currently overseeing the transformation
of facilities management (FM) with IT. He
is experienced in the implementation of
enterprise resource planning system, project
portfolio management system, maintenance
management systems and mobility solutions.
Gordan graduated with a Bachelor of Engineering (Computer
Engineering) degree from Nanyang Technological University (NTU)
in 2005.
SEAH Lye Kang is an Assistant Director
(Building and Infrastructure) for FM and is
the Operations Manager for the IT-enabled
Facilities Management (ITeFM) project. He
has more than 20 years of experience in
project management, defence procurement,
FM and systems management. Lye Kang
graduated with a Bachelor of Engineering
(Electrical Engineering) degree with First Class Honours from NTU in
1996. He further obtained a Master of Science (Power Engineering)
degree with Distinction from the University of Manchester Institute
of Science and Technology, UK, in 2000.
SIA Kok Huat is a Programme Manager
(Enterprise IT) leading the implementation of
mobile applications and web portals for the
ITeFM project. He has implemented various
IT systems across business domains such as
ammunition, supply, maintenance, finance
and National Service management. He is a
certified Project Management Professional
and Certified IT Project Manager (CITPM) certified by Singapore
Computer Society. Kok Huat graduated with a Bachelor of Science
(Computer Science and Information Systems) degree with Honours
from the National University of Singapore in 1996.
TRANSFORMING FACILITIES MANAGEMENT WITH INFORMATION TECHNOLOGY
26 DSTA HORIZONS | 2017
LEVERAGING EDUCATION TECHNOLOGIES – DSTA ACADEMY LEARNING MANAGEMENT SYSTEMLEE Kian Joo, LOW Chin Kok
ABSTRACT
The DSTA Academy Learning Management System (LMS) has transformed the delivery of courses in DSTA Academy. It introduces innovative approaches to course content management, participant collaboration, lessons delivery and examination assessment. It also facilitates the engagement of course participants, lecturers and course managers in a collaborative fashion both within and outside the traditional classroom setting. This article provides insights into the features of the LMS and shares how the implementation of the system has helped foster a positive and beneficial learning experience for course participants.
Keywords: learning management system, LMS, education technologies
INTRODUCTION
Professional training in business competency for DSTA was
formalised under the DSTA College when it was formed in
August 2004. The transformation of DSTA College to DSTA
Academy in 2012 led to a major review and changes to its
curriculum development and delivery. In November 2012, the
Basic Systems Engineering and Management (BSEM) course
was the first course to have its lessons delivered entirely on
DSTA’s eWorkplace Intranet platform. With course materials
hosted in a common teamsite for reference, participants could
learn and collaborate more easily.
This set the stage for implementing a Learning Management
System (LMS) as part of a wider initiative to transform the
DSTA learning landscape through better use of innovative
education technologies. Readily accepted by increasingly
technologically savvy and digitally adept course participants,
these technologies have proven to be more effective and
efficient than traditional classroom teaching methods.
EXPLOITING EDUCATION TECHNOLOGIES
Education technologies are enablers. Exploiting the right
education technologies and blending them with relevant
pedagogy have helped DSTA Academy to move towards the
goal of becoming a leading training institution in Systems
Engineering and Programme Management, and to respond
quickly to the organisation’s business and learners’ needs
(Benson-Armer, Gast, & van Dam, 2016). These technologies
have in turn supported new pedagogical approaches to
facilitate engaging and effective learning as well as efficient
course administration and management.
In its efforts to make better use of education technologies into
enhancing the transfer of knowledge to course participants,
DSTA Academy set out to achieve key broad objectives
encapsulated in the three Es: engaged, effective and efficient.
a) Engaged Course Participants – Engaging course
participants in a collaborative and structured manner ensures
that they can associate with the overall objective and learning
outcomes in the most meaningful way. It is also about targeting
and tailoring course curriculum to learners’ needs, with the aim
of encouraging them to ask and share.
27DSTA HORIZONS | 2017
b) Effective Course Delivery by Lecturers – Adopting and
deploying proven pedagogies such as case method, problem-
based learning, role playing and gamification improves learning
effectiveness.
c) Efficient Course Management and Administration –
Enhancing processes and adopting technologies to augment
the efficiency of training delivery, examination administration,
management of courses and programmes, and the gathering
of feedback for analysis, among others.
THE LEARNING MANAGEMENT SYSTEM AND IT-ENABLED EXAMINATION SYSTEM INITIATIVES
In 2014, DSTA Academy spearheaded new initiatives such as
the dedicated LMS and an IT-enabled examination system.
The LMS facilitates course delivery and content management
by harnessing online social networks for collaboration and
fostering interactions among learners and lecturers. The
IT-enabled examination system was developed with the
aim of improving the integrity and efficiency of managing
examinations.
These initiatives leverage advances in pedagogy and education
technologies to provide trainees with richer content, extended
learning opportunities beyond the classroom and improved
networking for social and collaborative sharing.
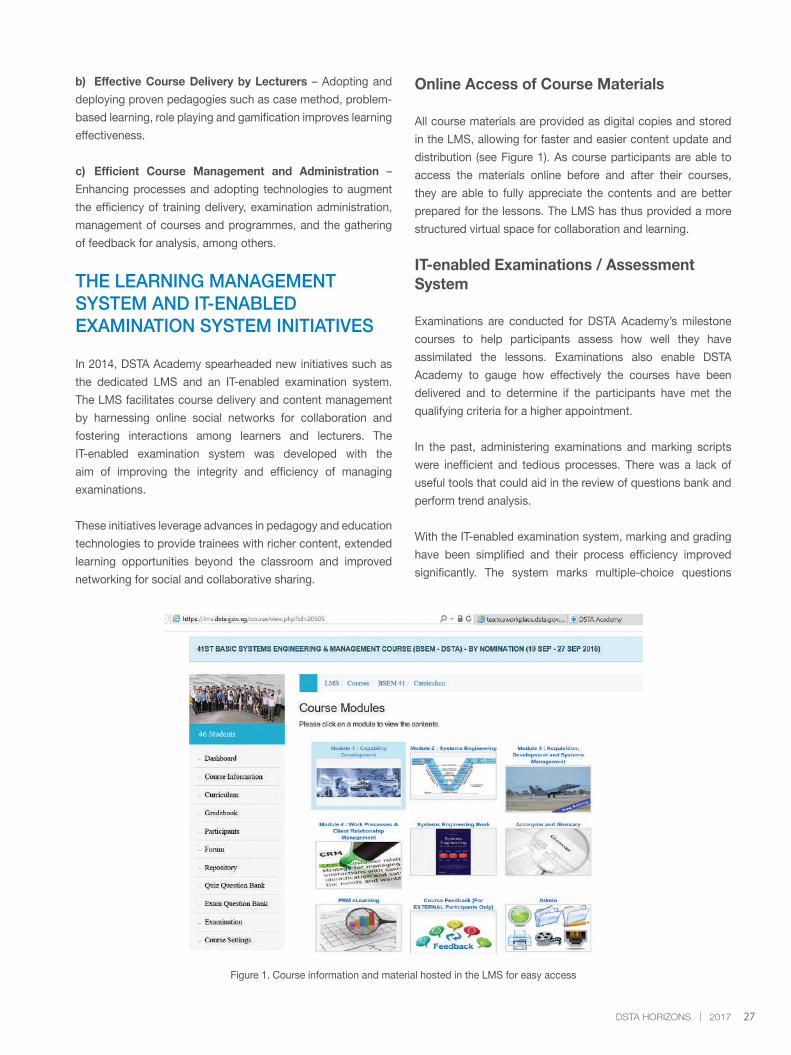
Online Access of Course Materials
All course materials are provided as digital copies and stored
in the LMS, allowing for faster and easier content update and
distribution (see Figure 1). As course participants are able to
access the materials online before and after their courses,
they are able to fully appreciate the contents and are better
prepared for the lessons. The LMS has thus provided a more
structured virtual space for collaboration and learning.
IT-enabled Examinations / Assessment System
Examinations are conducted for DSTA Academy’s milestone
courses to help participants assess how well they have
assimilated the lessons. Examinations also enable DSTA
Academy to gauge how effectively the courses have been
delivered and to determine if the participants have met the
qualifying criteria for a higher appointment.
In the past, administering examinations and marking scripts
were inefficient and tedious processes. There was a lack of
useful tools that could aid in the review of questions bank and
perform trend analysis.
With the IT-enabled examination system, marking and grading
have been simplified and their process efficiency improved
significantly. The system marks multiple-choice questions
Figure 1. Course information and material hosted in the LMS for easy access
28 DSTA HORIZONS | 2017
(MCQ) and true/false questions automatically, hence saving
time and effort that can be better utilised to assess open-ended
questions. The reports generated by the system can also be
used to analyse the performance of participants and the usage
frequency of questions in the examination questions bank.
These have helped DSTA Academy to improve the productivity,
consistency and standards for assessment.
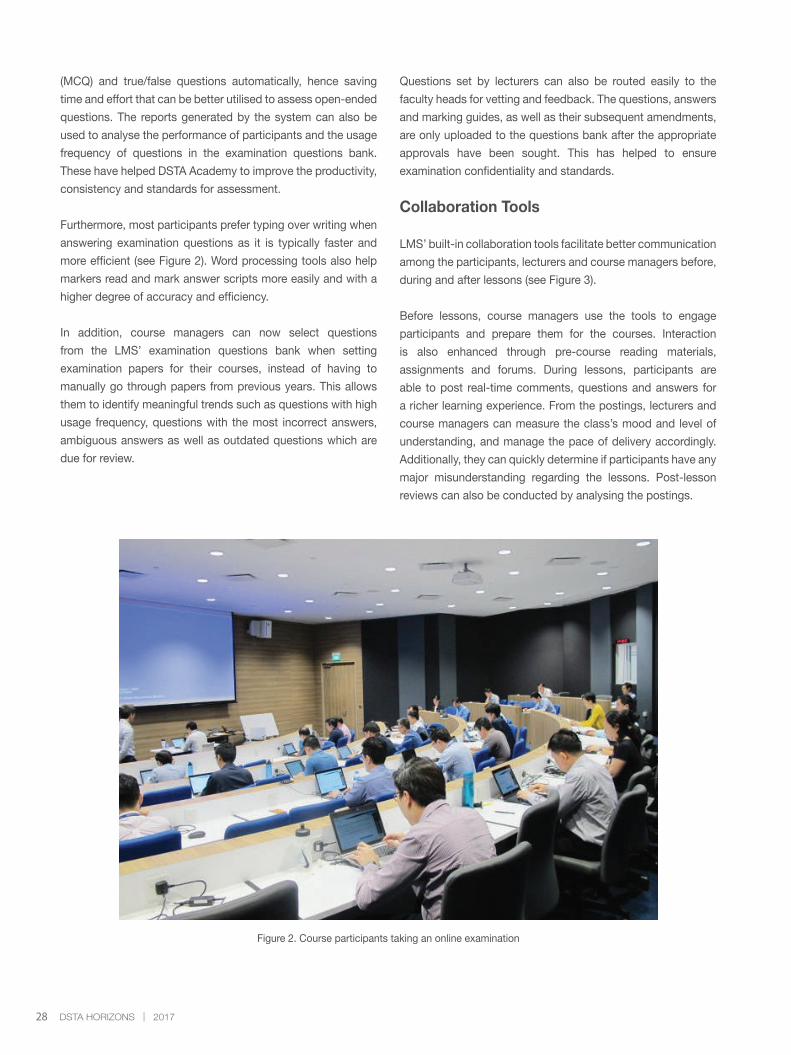
Furthermore, most participants prefer typing over writing when
answering examination questions as it is typically faster and
more efficient (see Figure 2). Word processing tools also help
markers read and mark answer scripts more easily and with a
higher degree of accuracy and efficiency.
In addition, course managers can now select questions
from the LMS’ examination questions bank when setting
examination papers for their courses, instead of having to
manually go through papers from previous years. This allows
them to identify meaningful trends such as questions with high
usage frequency, questions with the most incorrect answers,
ambiguous answers as well as outdated questions which are
due for review.
Figure 2. Course participants taking an online examination
Questions set by lecturers can also be routed easily to the
faculty heads for vetting and feedback. The questions, answers
and marking guides, as well as their subsequent amendments,
are only uploaded to the questions bank after the appropriate
approvals have been sought. This has helped to ensure
examination confidentiality and standards.
Collaboration Tools
LMS’ built-in collaboration tools facilitate better communication
among the participants, lecturers and course managers before,
during and after lessons (see Figure 3).
Before lessons, course managers use the tools to engage
participants and prepare them for the courses. Interaction
is also enhanced through pre-course reading materials,
assignments and forums. During lessons, participants are
able to post real-time comments, questions and answers for
a richer learning experience. From the postings, lecturers and
course managers can measure the class’s mood and level of
understanding, and manage the pace of delivery accordingly.
Additionally, they can quickly determine if participants have any
major misunderstanding regarding the lessons. Post-lesson
reviews can also be conducted by analysing the postings.
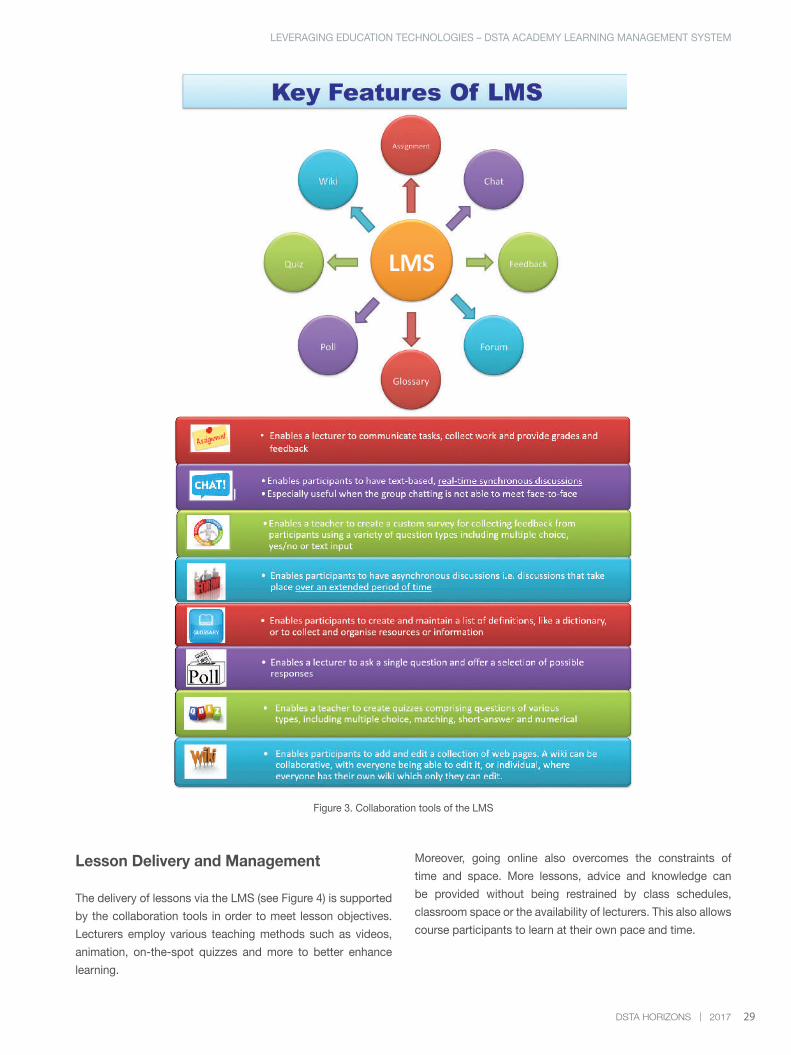
29DSTA HORIZONS | 2017
Figure 3. Collaboration tools of the LMS
Lesson Delivery and Management
The delivery of lessons via the LMS (see Figure 4) is supported
by the collaboration tools in order to meet lesson objectives.
Lecturers employ various teaching methods such as videos,
animation, on-the-spot quizzes and more to better enhance
learning.
Moreover, going online also overcomes the constraints of
time and space. More lessons, advice and knowledge can
be provided without being restrained by class schedules,
classroom space or the availability of lecturers. This also allows
course participants to learn at their own pace and time.
LEVERAGING EDUCATION TECHNOLOGIES – DSTA ACADEMY LEARNING MANAGEMENT SYSTEM
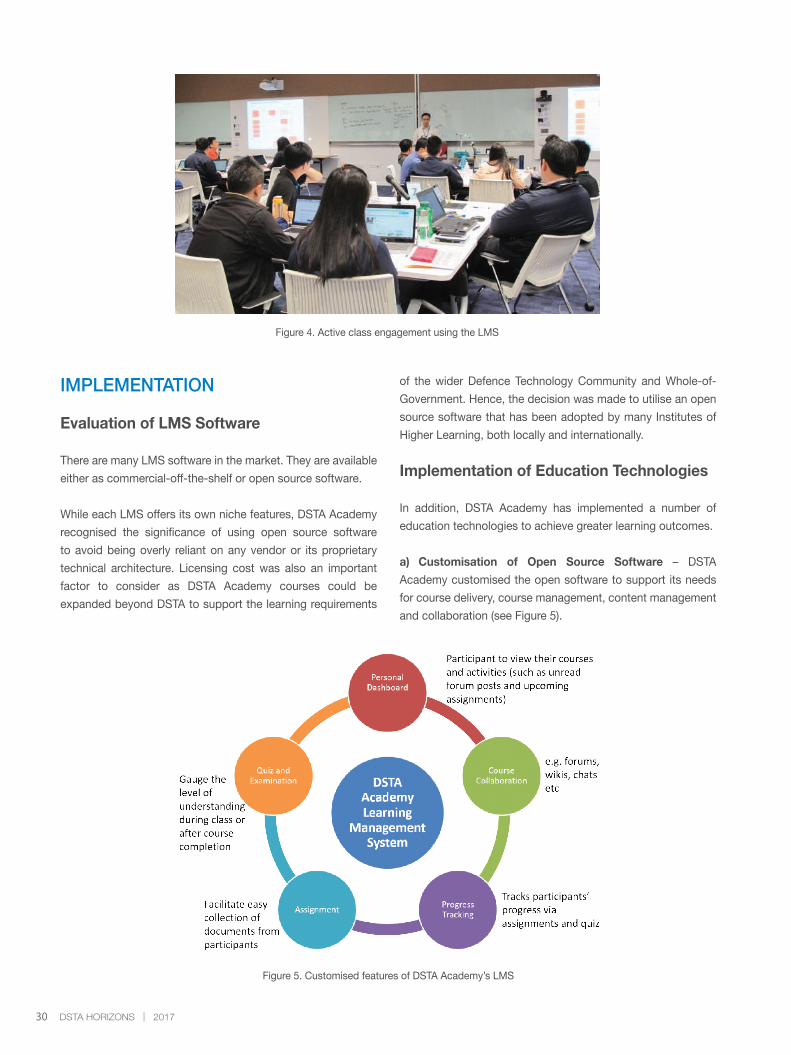
30 DSTA HORIZONS | 2017
Figure 4. Active class engagement using the LMS
IMPLEMENTATION
Evaluation of LMS Software
There are many LMS software in the market. They are available
either as commercial-off-the-shelf or open source software.
While each LMS offers its own niche features, DSTA Academy
recognised the significance of using open source software
to avoid being overly reliant on any vendor or its proprietary
technical architecture. Licensing cost was also an important
factor to consider as DSTA Academy courses could be
expanded beyond DSTA to support the learning requirements
of the wider Defence Technology Community and Whole-of-
Government. Hence, the decision was made to utilise an open
source software that has been adopted by many Institutes of
Higher Learning, both locally and internationally.
Implementation of Education Technologies
In addition, DSTA Academy has implemented a number of
education technologies to achieve greater learning outcomes.
a) Customisation of Open Source Software – DSTA
Academy customised the open software to support its needs
for course delivery, course management, content management
and collaboration (see Figure 5).
Figure 5. Customised features of DSTA Academy’s LMS
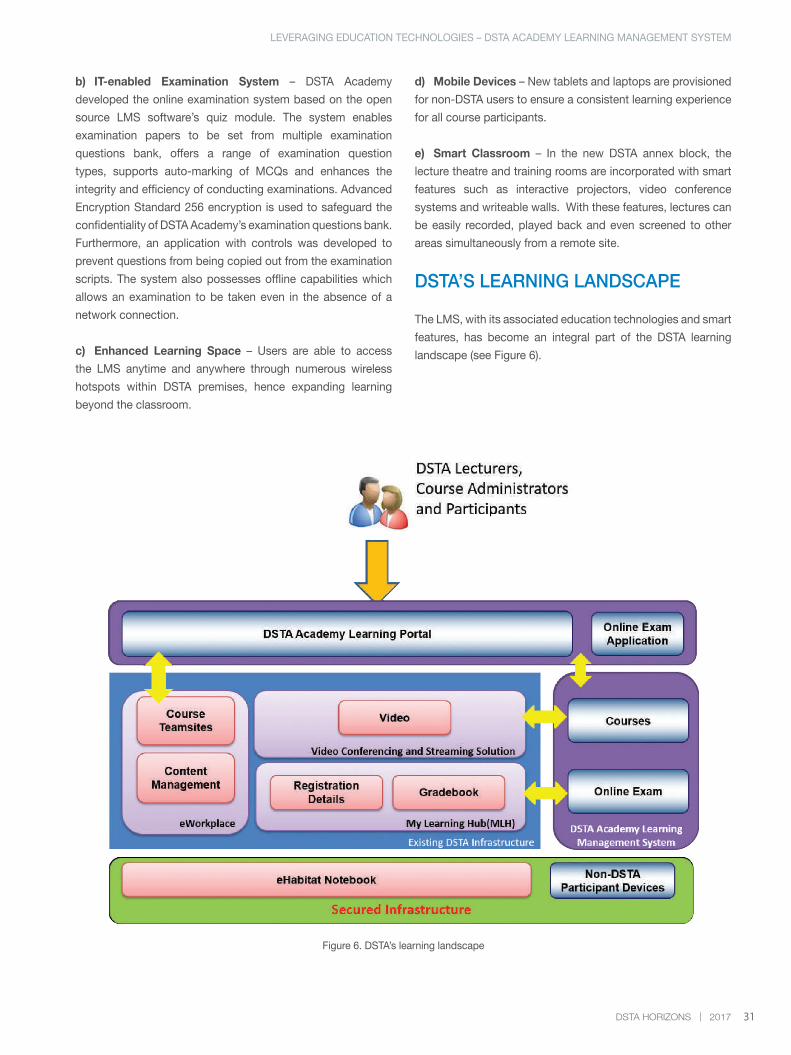
31DSTA HORIZONS | 2017
Figure 6. DSTA’s learning landscape
b) IT-enabled Examination System – DSTA Academy
developed the online examination system based on the open
source LMS software’s quiz module. The system enables
examination papers to be set from multiple examination
questions bank, offers a range of examination question
types, supports auto-marking of MCQs and enhances the
integrity and efficiency of conducting examinations. Advanced
Encryption Standard 256 encryption is used to safeguard the
confidentiality of DSTA Academy’s examination questions bank.
Furthermore, an application with controls was developed to
prevent questions from being copied out from the examination
scripts. The system also possesses offline capabilities which
allows an examination to be taken even in the absence of a
network connection.
c) Enhanced Learning Space – Users are able to access
the LMS anytime and anywhere through numerous wireless
hotspots within DSTA premises, hence expanding learning
beyond the classroom.
d) Mobile Devices – New tablets and laptops are provisioned
for non-DSTA users to ensure a consistent learning experience
for all course participants.
e) Smart Classroom – In the new DSTA annex block, the
lecture theatre and training rooms are incorporated with smart
features such as interactive projectors, video conference
systems and writeable walls. With these features, lectures can
be easily recorded, played back and even screened to other
areas simultaneously from a remote site.
DSTA’S LEARNING LANDSCAPE
The LMS, with its associated education technologies and smart
features, has become an integral part of the DSTA learning
landscape (see Figure 6).
LEVERAGING EDUCATION TECHNOLOGIES – DSTA ACADEMY LEARNING MANAGEMENT SYSTEM
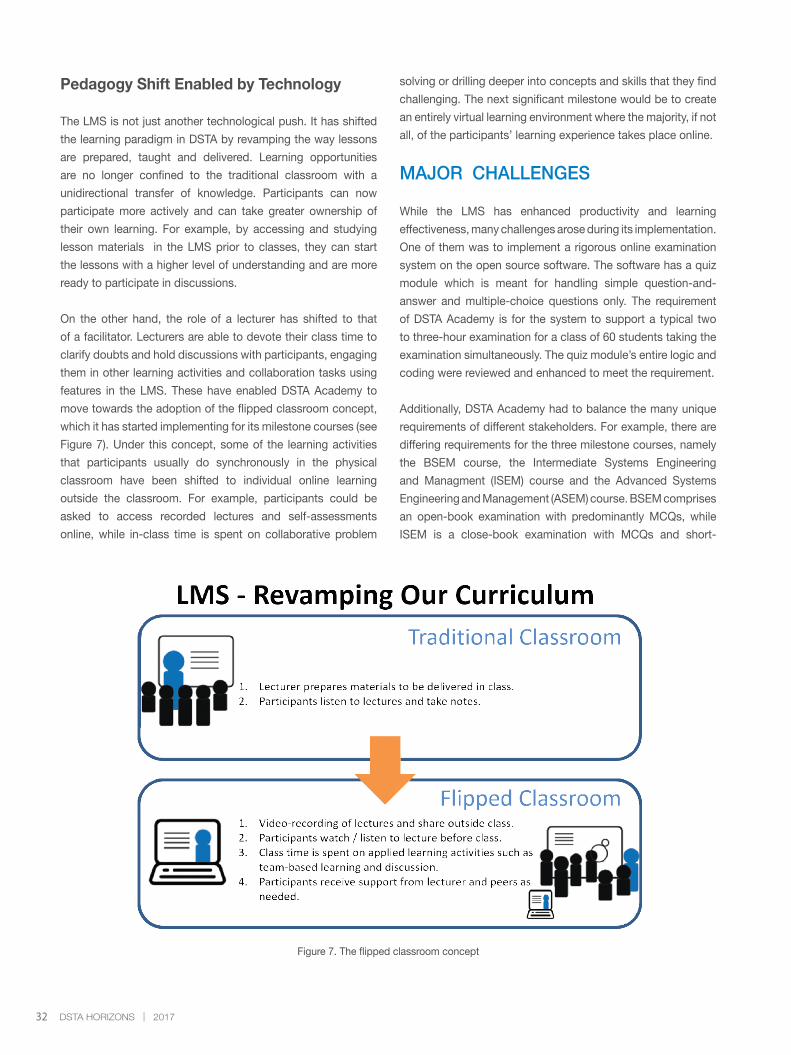
32 DSTA HORIZONS | 2017
Pedagogy Shift Enabled by Technology
The LMS is not just another technological push. It has shifted
the learning paradigm in DSTA by revamping the way lessons
are prepared, taught and delivered. Learning opportunities
are no longer confined to the traditional classroom with a
unidirectional transfer of knowledge. Participants can now
participate more actively and can take greater ownership of
their own learning. For example, by accessing and studying
lesson materials in the LMS prior to classes, they can start
the lessons with a higher level of understanding and are more
ready to participate in discussions.
On the other hand, the role of a lecturer has shifted to that
of a facilitator. Lecturers are able to devote their class time to
clarify doubts and hold discussions with participants, engaging
them in other learning activities and collaboration tasks using
features in the LMS. These have enabled DSTA Academy to
move towards the adoption of the flipped classroom concept,
which it has started implementing for its milestone courses (see
Figure 7). Under this concept, some of the learning activities
that participants usually do synchronously in the physical
classroom have been shifted to individual online learning
outside the classroom. For example, participants could be
asked to access recorded lectures and self-assessments
online, while in-class time is spent on collaborative problem
solving or drilling deeper into concepts and skills that they find
challenging. The next significant milestone would be to create
an entirely virtual learning environment where the majority, if not
all, of the participants’ learning experience takes place online.
MAJOR CHALLENGES
While the LMS has enhanced productivity and learning
effectiveness, many challenges arose during its implementation.
One of them was to implement a rigorous online examination
system on the open source software. The software has a quiz
module which is meant for handling simple question-and-
answer and multiple-choice questions only. The requirement
of DSTA Academy is for the system to support a typical two
to three-hour examination for a class of 60 students taking the
examination simultaneously. The quiz module’s entire logic and
coding were reviewed and enhanced to meet the requirement.
Additionally, DSTA Academy had to balance the many unique
requirements of different stakeholders. For example, there are
differing requirements for the three milestone courses, namely
the BSEM course, the Intermediate Systems Engineering
and Managment (ISEM) course and the Advanced Systems
Engineering and Management (ASEM) course. BSEM comprises
an open-book examination with predominantly MCQs, while
ISEM is a close-book examination with MCQs and short-
Figure 7. The flipped classroom concept
33DSTA HORIZONS | 2017
answer questions. ASEM is a close-book examination with
mainly essay questions and sub-questions that may be marked
by different adjunct faculty heads or lecturers. The challenge is
to develop one core exam module which is common to all and
yet would allow for different examination configurations. This
was done with a proper configuration control.
RESULTS ACHIEVED
Since the implementation of the LMS in October 2015, all DSTA
Academy courses have been delivered using the platform.
A survey was conducted six months after the implementation
with some 100 stakeholders from the initial batch of course
participants, lecturers, course managers, faculty heads and
administrative staff. On a scale of one to six, 85% of the
respondents gave a grading of five and above for system
usefulness and functionality, while 85% gave a grading of five
and above for an overall positive experience.
Moreover, the faculty heads and course managers have reported
a savings of 68% in time spent managing examinations,
marking and reporting. Course administrative staff have also
reported a savings of 80% in effort as they no longer need to
print, bind and distribute course material since soft copies are
available online. Other benefits include the reduction of paper
use as well as savings in printing costs.
CONCLUSION
DSTA Academy’s LMS has been leveraged effectively for
course delivery and online assessment. It has been established
as a key foundation of DSTA’s learning landscape and has
shaped new learning behaviours in the organisation.
Moving forward, there are other requirements to host
Programme Centre courses and other competency certification
courses in the LMS. The LMS is expected to play an even
greater role as an integral part of the learning landscape for the
whole of DSTA.
REFERENCES
Benson-Armer, R., Gast, A., & van Dam, N. (2016, May).
Learning at the speed of business. McKinsey Quarterly.
Retrieved from http://www.mckinsey.com/business-functions/
organization/our-insights/learning-at-the-speed-of-business
Demski, J. (2013). 6 expert tips for flipping the classroom.
Retrieved from https://www.theguardian.com/education/2013/
nov/13/human-interaction-distance-learning
Oblinger, D. G. (Ed.). (2012). Games changes: education
and information technologies. Retrieved from http://www.
educause.edu/research-publications/books/game-changers-
education-and-information-technologies
Teachonline.CA. (2014). A new pedagogy is emerging... and
online learning is a key contributing factor. Retrieved from
http://teachonline.ca/tools-trends/how-teach-online-student-
success/new-pedagogy-emerging-and-online-learning-key-
contributing-factor
BIOGRAPHY
LEE Kian Joo is a Senior Manager (DSTA
Academy) in charge of learning technologies
and services. He oversees the operation of
the Learning Management System (LMS)
and was instrumental in its development.
Prior to joining DSTA Academy in 2013,
Kian Joo accumulated more than 30 years
of experience working on various Enterprise
IT projects for the development and support of logistics enterprise
systems for the Ministry of Defence and the Singapore Armed
Forces. Kian Joo graduated with a Bachelor of Engineering
(Electronic Engineering) degree from the Kyoto University of
Japan in 1978. He further obtained a Master of Science (Industrial
Systems Engineering) degree from the National University of
Singapore in 1986.
LOW Chin Kok is a Senior Engineer
(Enterprise IT) who manages the
implementation of the LMS. He has worked
on areas such as content distribution
network deployment, last-mile infrastructure
implementation, integrated workforce and
computing devices proliferation, as well as
content development. Chin Kok graduated
with a Bachelor of Computing degree from Monash University,
Australia, in 2002.
LEVERAGING EDUCATION TECHNOLOGIES – DSTA ACADEMY LEARNING MANAGEMENT SYSTEM
34 DSTA HORIZONS | 2017
SMART IT DEVELOPMENT: FASTER, BETTER, CHEAPERWEE Teck Soon Alex, SEAH Yong Chuan Kenny, WONG Tian Soon Roger
ABSTRACT
The IT users in Ministry of Defence (MINDEF) have a rising expectation for faster pace of system delivery and greater agility in responding to business changes. This article shows how DSTA conceived and implemented the Smart IT Development initiative to address these challenges. It describes the three key enablers behind this initiative and shows how they reduce complexity and simplify IT system delivery to meet the desired outcomes of speed and agility.
Keywords: platform-as-a-service, rapid application development, reuse
INTRODUCTION
The use of IT has been an important proxy to the capabilities
of defence and also an important touch point for employees,
National Servicemen and the public from the perspective of
engagement and commitment to defence.
The recent trend of IT consumerisation1 has led to a higher
expectation for faster pace of system delivery and greater
agility in responding to business changes. However, the
current IT development process has become inadequate
to meet the desired outcomes of speed and agility. For
example, long lead time is required to derive costings for the
requirements, procurement, installation, configuration and
securing of IT resources such as servers and databases prior
to actual implementation. The process is manual and involves
collaboration with multiple parties largely through e-mail.
In addition, the use of the hand-coding method to develop
IT applications is tedious and does not cater well for rapidly
changing requirements. This is further compounded by the
difficulty in hiring skilled IT developers in the face of a shrinking
engineering resource pool in Singapore.
REALISING THE CONCEPT
The Smart IT Development initiative comprises three key
enablers. The first enabler is the establishment of a Corporate IT
(CIT) Development Store which gives project teams quick and
easy access to IT resources via a self-service web portal. The
second enabler is the adoption of a Model-driven Application
Development that enables rapid development of IT applications.
The third key enabler is the setting up of a Reuse Framework
to harvest and develop components commonly used by
development teams to speed up application development.
CIT Development Store
The CIT Development Store is a one-stop self-service portal
designed to eliminate the need for project teams to liaise with
many different parties in order to get the necessary resources
for their projects (see Figure 1).
The user experience has been thought through carefully
and designed to resemble an online shopping experience
such that project teams can easily use the CIT Development
Store without any training. The store also calculates project
costs upon selection of resources to facilitate the process
of obtaining budget approval, which is a pre-requisite for all
MINDEF CIT projects.
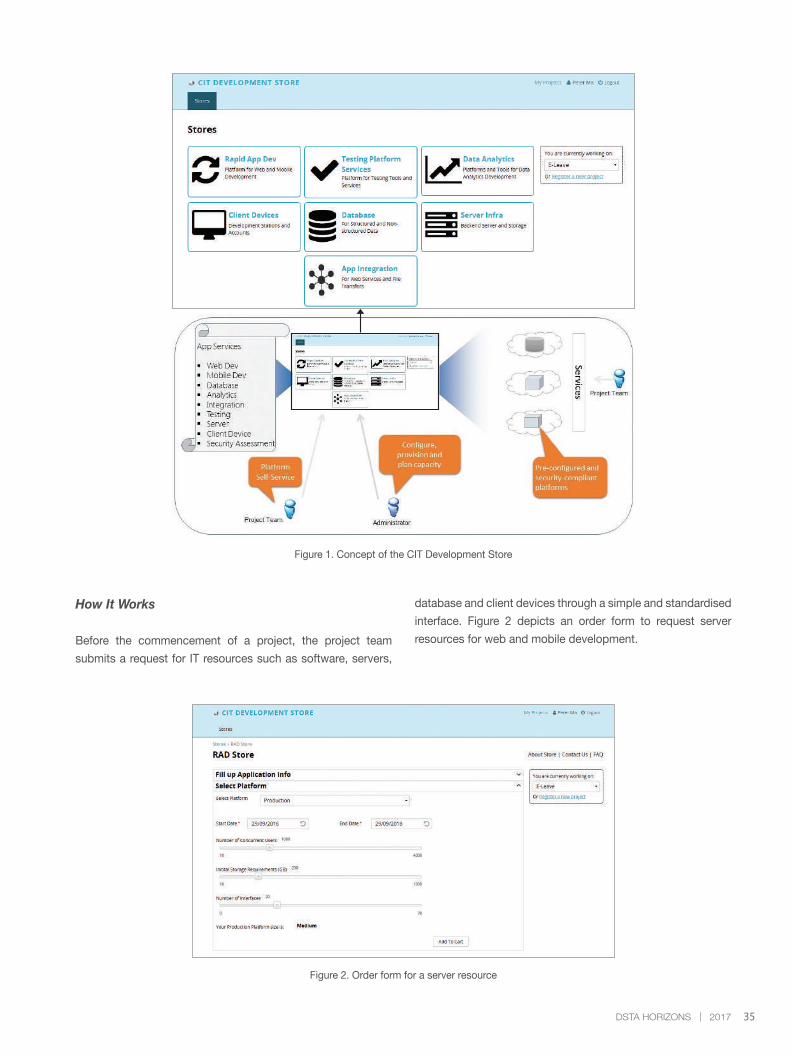
35DSTA HORIZONS | 2017
Figure 1. Concept of the CIT Development Store
How It Works
Before the commencement of a project, the project team
submits a request for IT resources such as software, servers,
database and client devices through a simple and standardised
interface. Figure 2 depicts an order form to request server
resources for web and mobile development.
Figure 2. Order form for a server resource
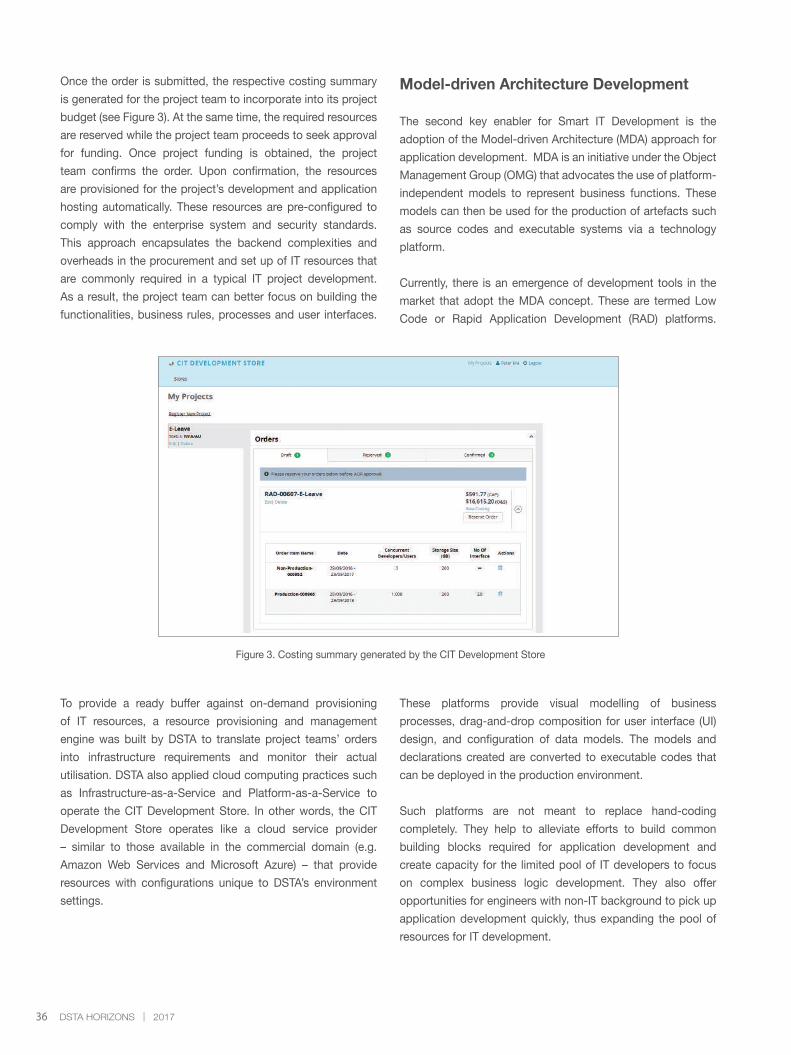
36 DSTA HORIZONS | 2017
Figure 3. Costing summary generated by the CIT Development Store
Once the order is submitted, the respective costing summary
is generated for the project team to incorporate into its project
budget (see Figure 3). At the same time, the required resources
are reserved while the project team proceeds to seek approval
for funding. Once project funding is obtained, the project
team confirms the order. Upon confirmation, the resources
are provisioned for the project’s development and application
hosting automatically. These resources are pre-configured to
comply with the enterprise system and security standards.
This approach encapsulates the backend complexities and
overheads in the procurement and set up of IT resources that
are commonly required in a typical IT project development.
As a result, the project team can better focus on building the
functionalities, business rules, processes and user interfaces.
To provide a ready buffer against on-demand provisioning
of IT resources, a resource provisioning and management
engine was built by DSTA to translate project teams’ orders
into infrastructure requirements and monitor their actual
utilisation. DSTA also applied cloud computing practices such
as Infrastructure-as-a-Service and Platform-as-a-Service to
operate the CIT Development Store. In other words, the CIT
Development Store operates like a cloud service provider
– similar to those available in the commercial domain (e.g.
Amazon Web Services and Microsoft Azure) – that provide
resources with configurations unique to DSTA’s environment
settings.
Model-driven Architecture Development
The second key enabler for Smart IT Development is the
adoption of the Model-driven Architecture (MDA) approach for
application development. MDA is an initiative under the Object
Management Group (OMG) that advocates the use of platform-
independent models to represent business functions. These
models can then be used for the production of artefacts such
as source codes and executable systems via a technology
platform.
Currently, there is an emergence of development tools in the
market that adopt the MDA concept. These are termed Low
Code or Rapid Application Development (RAD) platforms.
These platforms provide visual modelling of business
processes, drag-and-drop composition for user interface (UI)
design, and configuration of data models. The models and
declarations created are converted to executable codes that
can be deployed in the production environment.
Such platforms are not meant to replace hand-coding
completely. They help to alleviate efforts to build common
building blocks required for application development and
create capacity for the limited pool of IT developers to focus
on complex business logic development. They also offer
opportunities for engineers with non-IT background to pick up
application development quickly, thus expanding the pool of
resources for IT development.
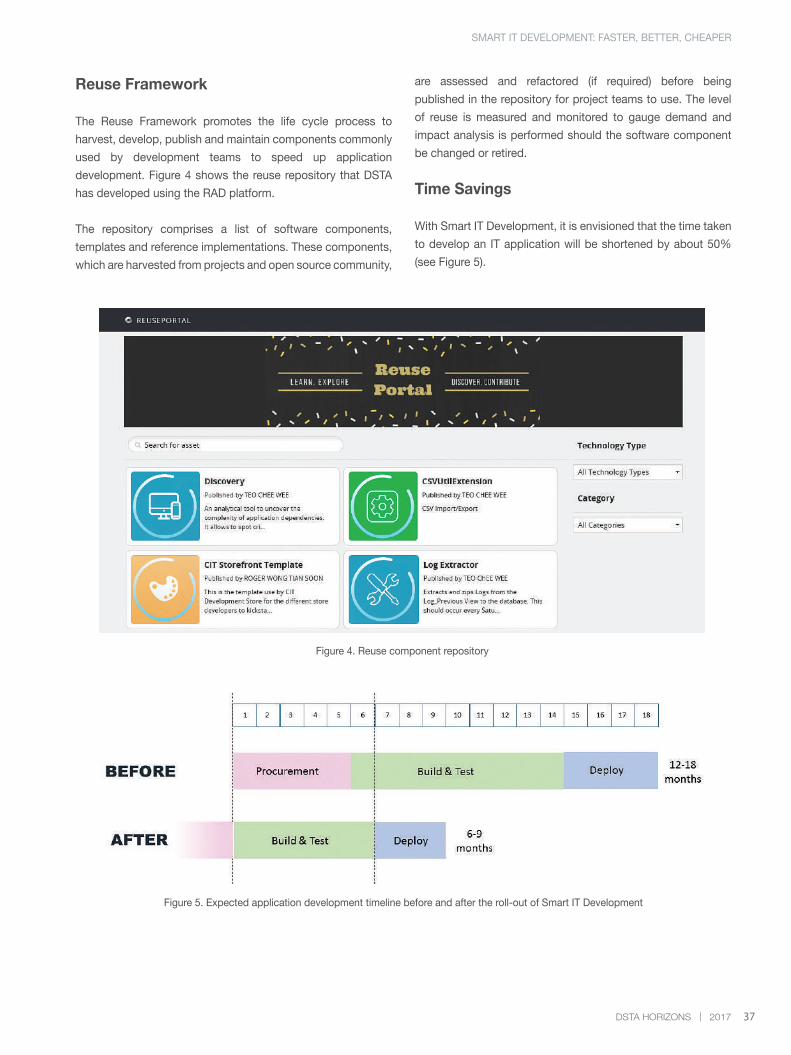
37DSTA HORIZONS | 2017
Figure 4. Reuse component repository
SMART IT DEVELOPMENT: FASTER, BETTER, CHEAPER
Reuse Framework
The Reuse Framework promotes the life cycle process to
harvest, develop, publish and maintain components commonly
used by development teams to speed up application
development. Figure 4 shows the reuse repository that DSTA
has developed using the RAD platform.
The repository comprises a list of software components,
templates and reference implementations. These components,
which are harvested from projects and open source community,
are assessed and refactored (if required) before being
published in the repository for project teams to use. The level
of reuse is measured and monitored to gauge demand and
impact analysis is performed should the software component
be changed or retired.
Time Savings
With Smart IT Development, it is envisioned that the time taken
to develop an IT application will be shortened by about 50%
(see Figure 5).
Figure 5. Expected application development timeline before and after the roll-out of Smart IT Development
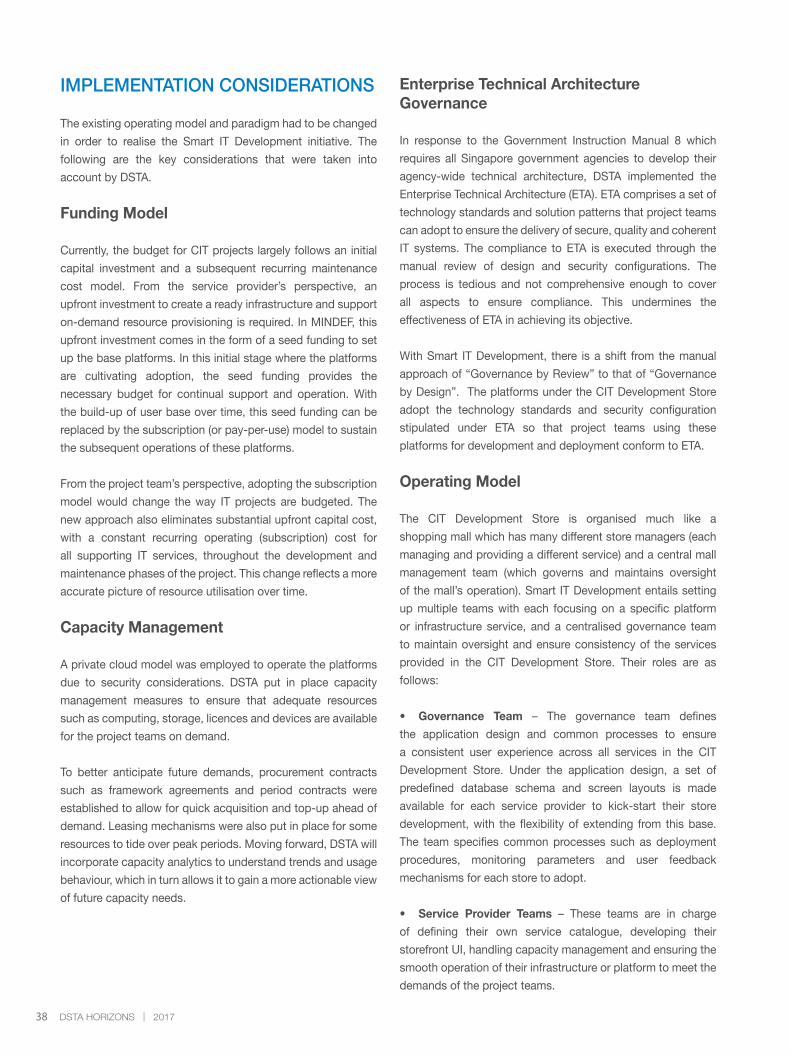
38 DSTA HORIZONS | 2017
IMPLEMENTATION CONSIDERATIONS
The existing operating model and paradigm had to be changed
in order to realise the Smart IT Development initiative. The
following are the key considerations that were taken into
account by DSTA.
Funding Model
Currently, the budget for CIT projects largely follows an initial
capital investment and a subsequent recurring maintenance
cost model. From the service provider’s perspective, an
upfront investment to create a ready infrastructure and support
on-demand resource provisioning is required. In MINDEF, this
upfront investment comes in the form of a seed funding to set
up the base platforms. In this initial stage where the platforms
are cultivating adoption, the seed funding provides the
necessary budget for continual support and operation. With
the build-up of user base over time, this seed funding can be
replaced by the subscription (or pay-per-use) model to sustain
the subsequent operations of these platforms.
From the project team’s perspective, adopting the subscription
model would change the way IT projects are budgeted. The
new approach also eliminates substantial upfront capital cost,
with a constant recurring operating (subscription) cost for
all supporting IT services, throughout the development and
maintenance phases of the project. This change reflects a more
accurate picture of resource utilisation over time.
Capacity Management
A private cloud model was employed to operate the platforms
due to security considerations. DSTA put in place capacity
management measures to ensure that adequate resources
such as computing, storage, licences and devices are available
for the project teams on demand.
To better anticipate future demands, procurement contracts
such as framework agreements and period contracts were
established to allow for quick acquisition and top-up ahead of
demand. Leasing mechanisms were also put in place for some
resources to tide over peak periods. Moving forward, DSTA will
incorporate capacity analytics to understand trends and usage
behaviour, which in turn allows it to gain a more actionable view
of future capacity needs.
Enterprise Technical Architecture Governance
In response to the Government Instruction Manual 8 which
requires all Singapore government agencies to develop their
agency-wide technical architecture, DSTA implemented the
Enterprise Technical Architecture (ETA). ETA comprises a set of
technology standards and solution patterns that project teams
can adopt to ensure the delivery of secure, quality and coherent
IT systems. The compliance to ETA is executed through the
manual review of design and security configurations. The
process is tedious and not comprehensive enough to cover
all aspects to ensure compliance. This undermines the
effectiveness of ETA in achieving its objective.
With Smart IT Development, there is a shift from the manual
approach of “Governance by Review” to that of “Governance
by Design”. The platforms under the CIT Development Store
adopt the technology standards and security configuration
stipulated under ETA so that project teams using these
platforms for development and deployment conform to ETA.
Operating Model
The CIT Development Store is organised much like a
shopping mall which has many different store managers (each
managing and providing a different service) and a central mall
management team (which governs and maintains oversight
of the mall’s operation). Smart IT Development entails setting
up multiple teams with each focusing on a specific platform
or infrastructure service, and a centralised governance team
to maintain oversight and ensure consistency of the services
provided in the CIT Development Store. Their roles are as
follows:
• Governance Team – The governance team defines
the application design and common processes to ensure
a consistent user experience across all services in the CIT
Development Store. Under the application design, a set of
predefined database schema and screen layouts is made
available for each service provider to kick-start their store
development, with the flexibility of extending from this base.
The team specifies common processes such as deployment
procedures, monitoring parameters and user feedback
mechanisms for each store to adopt.
• Service Provider Teams – These teams are in charge
of defining their own service catalogue, developing their
storefront UI, handling capacity management and ensuring the
smooth operation of their infrastructure or platform to meet the
demands of the project teams.
39DSTA HORIZONS | 2017
Industry Engagement
The majority of CIT development is performed by insourced
(as part of in-house development teams) and outsourced
industry resources assuming the roles of analysts, developers
and testers. The standardisation of application platforms and
tools under the Smart IT Development initiative allows DSTA
to influence and engage industry players to harmonise delivery
approaches. This creates opportunities for industry players
to organise and possibly specialise around technologies or
expertise within the delivery value chain. As a result, they
are able to deliver applications according to DSTA’s specific
standards, thereby establishing a software factory ecosystem.
The envisaged outcome is that the specialisation of local IT
players will lead to improved application quality and delivery
lead time for CIT projects.
IMPLEMENTATION
The first phase of the CIT Development Store has been
completed with three stores providing the RAD platform,
the testing platform and client devices. More stores will
be established in the future. The reuse repository has also
been set up with a set of utility components and DSTA will
continue to harvest more software components from project
implementations.
CONCLUSION
The Smart IT Development initiative represents a paradigm
shift from the current manual, reactive and code-driven
development to one that is service-centric, proactive, agile
and model-driven. It promotes “Governance by Design” as
the application development platform adheres inherently to
standard configuration and the codes generated are security
compliant. It has achieved the objective of simplifying and
speeding up IT delivery.
REFERENCES
Consumerization. (n.d.). In Gartner. Retrieved January 5, 2017,
from http://www.gartner.com/it-glossary/consumerization/
Object Management Group. (2014). Model Driven
Architecture (MDA): MDA Guide rev. 2.0 (OMG Document
ormsc/2014-06-01). Retrieved from http://www.omg.org/cgi-
bin/doc?ormsc/14-06-01.pdf
Rymer, J. R., Richardson, C., Mines, C. & Tajima, C. (2016).
The Forrester Wave™: Low-Code Development Platforms, Q2
2016. Forrester Research.
ENDNOTES
1 Consumerisation is the specific impact that consumer-
originated technologies can have on enterprises.
BIOGRAPHY
WEE Teck Soon Alex is a Programme
Manager (Enterprise IT) who currently
leads a team in advocating the Smart
IT Development initiative and providing
Platform-as-a-Service capabilities to all
Enterprise IT project teams. He has been
involved in various SAP implementation
and application integration projects for the
Ministry of Defence (MINDEF) and the Singapore Armed Forces.
Alex graduated with a Bachelor of Engineering (Electrical and
Electronics Engineering) degree from Nanyang Technological
University (NTU) in 1996.
SEAH Yong Chuan Kenny is Head
Enterprise Application Integration
(Enterprise IT). He oversees the planning,
architecting, implementation and operation
of the Enterprise Application Integration
infrastructure for over 50 MINDEF and DSTA
Corporate IT (CIT) systems. Kenny also leads
the implementation of the next-generation
secure enterprise gateway for MINDEF’s Intranet network. He
was previously involved in realising the adoption of Java 2
Platform, Enterprise Edition and subsequently Rapid Application
Development (RAD) technologies in MINDEF and DSTA. Kenny
obtained a Bachelor of Engineering (Electrical) degree from NTU
and a Master of Technology (Software Engineering) degree from
the Institute of Systems Science in 1998 and 2004 respectively.
WONG Tian Soon Roger is an Engineer
(Enterprise IT) who is involved in the
development of RAD applications under
the Smart IT Development initiative. He is
also one of the main developers in charge
of designing, architecting and implementing
the CIT Development Store. In addition,
he was actively involved in the setting up
of the RAD platform at various data centres where applications
will be deployed in. Roger graduated with a Bachelor of Science
(Electronic Commerce) degree with Honours from the National
University of Singapore in 2014.
SMART IT DEVELOPMENT: FASTER, BETTER, CHEAPER
40 DSTA HORIZONS | 2017
COMMON OPERATING ENVIRONMENT – THE JOURNEY OF SMART IT INTEROPERABILITY FOR ENTERPRISELIM Tze Kwang Terence, HO Hao Xiang, TAN Kim Hong
ABSTRACT
The computing environment is constantly changing, triggered by Operating System and software patches, hardware driver updates, introduction of new device models and new IT systems. The Common Operating Environment (COE) comprises the client configuration, hardware, enterprise IT systems and back-end infrastructure. COE testing and certification is essential to maintain the interoperability, stability and security posture of the environment, leading to increased user productivity, reduced IT support cost and improved IT systems usability.
This article describes DSTA’s journey in managing and transforming the COE. It expounds on the current landscape, processes and challenges involved, including increasing system vulnerabilities and patches, speed of testing and deployment, as well as improving the realism of test environments. The article also elucidates DSTA’s continuous efforts in introducing automation tools and technologies, undertaking smart optimisation of processes and transforming the operations model from a task-centric to a service-centric one.
Keywords: COE, testing, certification, usability, automation
INTRODUCTION
The Common Operating Environment (COE) comprises
standardised client configuration and security policies,
approved hardware models, certified enterprise IT systems and
supporting back-end infrastructure. All the constituents of the
COE need to be interoperable, stable and secure to provide a
usable, productive and reliable client computing experience for
the user.
The COE configuration is applied to enterprise clients and
supported by DSTA’s IT Systems Management Centre
(SMC). It is maintained via an enterprise patch management
infrastructure, managed centrally with common security
policies and settings, and built upon a verified COE baseline
image.
With the increase in cyber threats and patches, regular feature
upgrades and specific user demands, the COE is enhanced
and refreshed constantly. Measures could include regular
Operating System (OS) patches, software updates, enterprise
systems refresh to mitigate security vulnerabilities and urgent
fixes to resume business function and usability.
The COE was set up in the late 1990s and early 2000s as a key
enabler for the deployment of the Windows 95/98 client for a
network environment. Its main roles were to standardise client
software components, provide an enterprise image for cloning,
centralise client configuration management and manage
interoperability. The COE thus ensured that the configuration
of all enterprise clients were standardised, controlled and
interoperable. With increasing security hardening needs,
enterprise applications, varied usability customisations
and network separation, the scope of the COE expanded
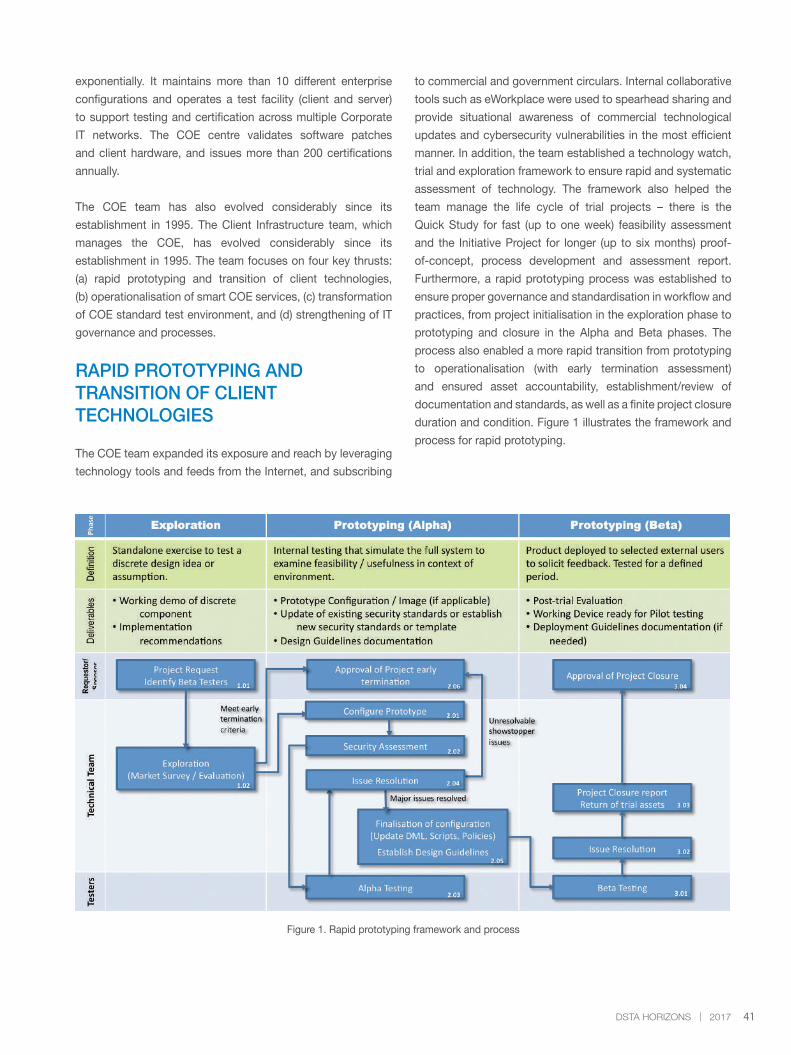
41DSTA HORIZONS | 2017
exponentially. It maintains more than 10 different enterprise
configurations and operates a test facility (client and server)
to support testing and certification across multiple Corporate
IT networks. The COE centre validates software patches
and client hardware, and issues more than 200 certifications
annually.
The COE team has also evolved considerably since its
establishment in 1995. The Client Infrastructure team, which
manages the COE, has evolved considerably since its
establishment in 1995. The team focuses on four key thrusts:
(a) rapid prototyping and transition of client technologies,
(b) operationalisation of smart COE services, (c) transformation
of COE standard test environment, and (d) strengthening of IT
governance and processes.
RAPID PROTOTYPING AND TRANSITION OF CLIENT TECHNOLOGIES
The COE team expanded its exposure and reach by leveraging
technology tools and feeds from the Internet, and subscribing
to commercial and government circulars. Internal collaborative
tools such as eWorkplace were used to spearhead sharing and
provide situational awareness of commercial technological
updates and cybersecurity vulnerabilities in the most efficient
manner. In addition, the team established a technology watch,
trial and exploration framework to ensure rapid and systematic
assessment of technology. The framework also helped the
team manage the life cycle of trial projects – there is the
Quick Study for fast (up to one week) feasibility assessment
and the Initiative Project for longer (up to six months) proof-
of-concept, process development and assessment report.
Furthermore, a rapid prototyping process was established to
ensure proper governance and standardisation in workflow and
practices, from project initialisation in the exploration phase to
prototyping and closure in the Alpha and Beta phases. The
process also enabled a more rapid transition from prototyping
to operationalisation (with early termination assessment)
and ensured asset accountability, establishment/review of
documentation and standards, as well as a finite project closure
duration and condition. Figure 1 illustrates the framework and
process for rapid prototyping.
Figure 1. Rapid prototyping framework and process
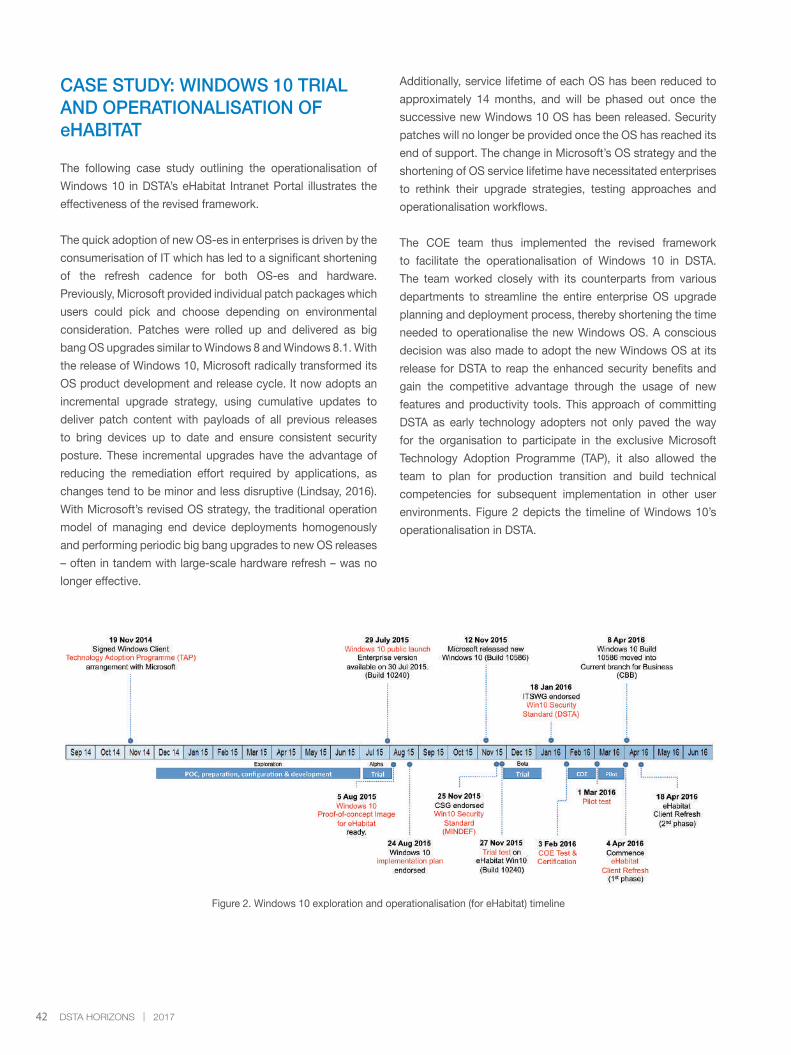
42 DSTA HORIZONS | 2017
CASE STUDY: WINDOWS 10 TRIAL AND OPERATIONALISATION OF eHABITAT
The following case study outlining the operationalisation of
Windows 10 in DSTA’s eHabitat Intranet Portal illustrates the
effectiveness of the revised framework.
The quick adoption of new OS-es in enterprises is driven by the
consumerisation of IT which has led to a significant shortening
of the refresh cadence for both OS-es and hardware.
Previously, Microsoft provided individual patch packages which
users could pick and choose depending on environmental
consideration. Patches were rolled up and delivered as big
bang OS upgrades similar to Windows 8 and Windows 8.1. With
the release of Windows 10, Microsoft radically transformed its
OS product development and release cycle. It now adopts an
incremental upgrade strategy, using cumulative updates to
deliver patch content with payloads of all previous releases
to bring devices up to date and ensure consistent security
posture. These incremental upgrades have the advantage of
reducing the remediation effort required by applications, as
changes tend to be minor and less disruptive (Lindsay, 2016).
With Microsoft’s revised OS strategy, the traditional operation
model of managing end device deployments homogenously
and performing periodic big bang upgrades to new OS releases
– often in tandem with large-scale hardware refresh – was no
longer effective.
Additionally, service lifetime of each OS has been reduced to
approximately 14 months, and will be phased out once the
successive new Windows 10 OS has been released. Security
patches will no longer be provided once the OS has reached its
end of support. The change in Microsoft’s OS strategy and the
shortening of OS service lifetime have necessitated enterprises
to rethink their upgrade strategies, testing approaches and
operationalisation workflows.
The COE team thus implemented the revised framework
to facilitate the operationalisation of Windows 10 in DSTA.
The team worked closely with its counterparts from various
departments to streamline the entire enterprise OS upgrade
planning and deployment process, thereby shortening the time
needed to operationalise the new Windows OS. A conscious
decision was also made to adopt the new Windows OS at its
release for DSTA to reap the enhanced security benefits and
gain the competitive advantage through the usage of new
features and productivity tools. This approach of committing
DSTA as early technology adopters not only paved the way
for the organisation to participate in the exclusive Microsoft
Technology Adoption Programme (TAP), it also allowed the
team to plan for production transition and build technical
competencies for subsequent implementation in other user
environments. Figure 2 depicts the timeline of Windows 10’s
operationalisation in DSTA.
Figure 2. Windows 10 exploration and operationalisation (for eHabitat) timeline
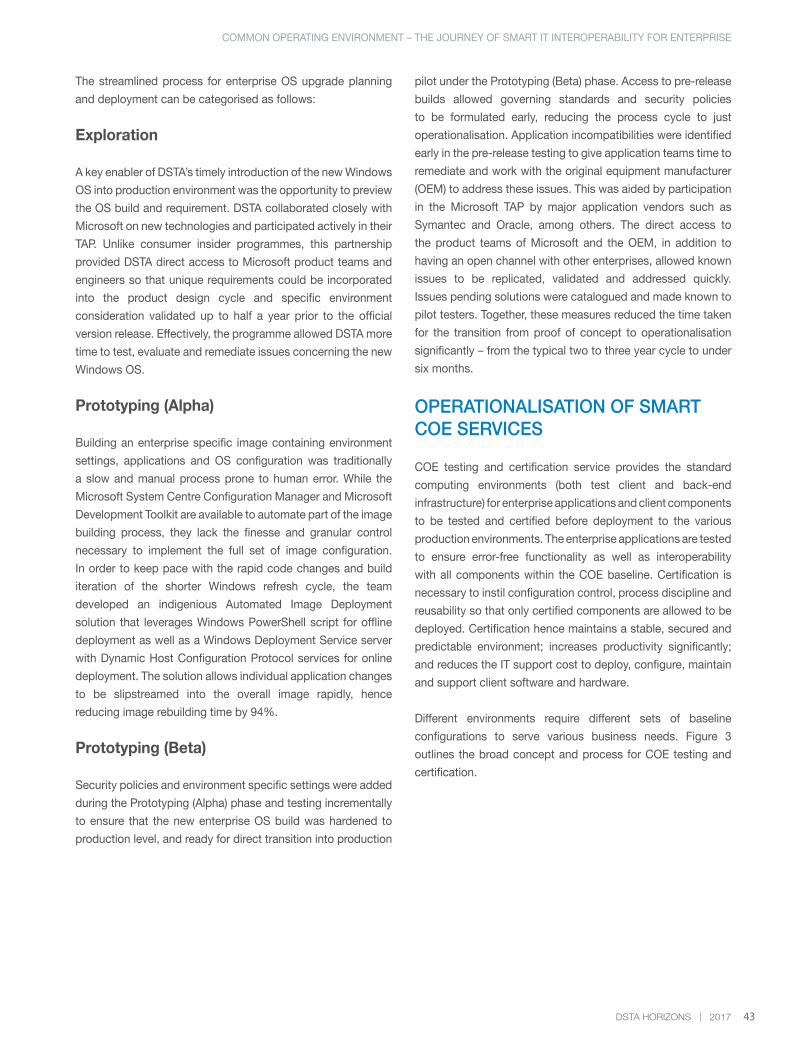
43DSTA HORIZONS | 2017
The streamlined process for enterprise OS upgrade planning
and deployment can be categorised as follows:
Exploration
A key enabler of DSTA’s timely introduction of the new Windows
OS into production environment was the opportunity to preview
the OS build and requirement. DSTA collaborated closely with
Microsoft on new technologies and participated actively in their
TAP. Unlike consumer insider programmes, this partnership
provided DSTA direct access to Microsoft product teams and
engineers so that unique requirements could be incorporated
into the product design cycle and specific environment
consideration validated up to half a year prior to the official
version release. Effectively, the programme allowed DSTA more
time to test, evaluate and remediate issues concerning the new
Windows OS.
Prototyping (Alpha)
Building an enterprise specific image containing environment
settings, applications and OS configuration was traditionally
a slow and manual process prone to human error. While the
Microsoft System Centre Configuration Manager and Microsoft
Development Toolkit are available to automate part of the image
building process, they lack the finesse and granular control
necessary to implement the full set of image configuration.
In order to keep pace with the rapid code changes and build
iteration of the shorter Windows refresh cycle, the team
developed an indigenious Automated Image Deployment
solution that leverages Windows PowerShell script for offline
deployment as well as a Windows Deployment Service server
with Dynamic Host Configuration Protocol services for online
deployment. The solution allows individual application changes
to be slipstreamed into the overall image rapidly, hence
reducing image rebuilding time by 94%.
Prototyping (Beta)
Security policies and environment specific settings were added
during the Prototyping (Alpha) phase and testing incrementally
to ensure that the new enterprise OS build was hardened to
production level, and ready for direct transition into production
pilot under the Prototyping (Beta) phase. Access to pre-release
builds allowed governing standards and security policies
to be formulated early, reducing the process cycle to just
operationalisation. Application incompatibilities were identified
early in the pre-release testing to give application teams time to
remediate and work with the original equipment manufacturer
(OEM) to address these issues. This was aided by participation
in the Microsoft TAP by major application vendors such as
Symantec and Oracle, among others. The direct access to
the product teams of Microsoft and the OEM, in addition to
having an open channel with other enterprises, allowed known
issues to be replicated, validated and addressed quickly.
Issues pending solutions were catalogued and made known to
pilot testers. Together, these measures reduced the time taken
for the transition from proof of concept to operationalisation
significantly – from the typical two to three year cycle to under
six months.
OPERATIONALISATION OF SMART COE SERVICES
COE testing and certification service provides the standard
computing environments (both test client and back-end
infrastructure) for enterprise applications and client components
to be tested and certified before deployment to the various
production environments. The enterprise applications are tested
to ensure error-free functionality as well as interoperability
with all components within the COE baseline. Certification is
necessary to instil configuration control, process discipline and
reusability so that only certified components are allowed to be
deployed. Certification hence maintains a stable, secured and
predictable environment; increases productivity significantly;
and reduces the IT support cost to deploy, configure, maintain
and support client software and hardware.
Different environments require different sets of baseline
configurations to serve various business needs. Figure 3
outlines the broad concept and process for COE testing and
certification.
COMMON OPERATING ENVIRONMENT – THE JOURNEY OF SMART IT INTEROPERABILITY FOR ENTERPRISE
44 DSTA HORIZONS | 2017
Figure 3. COE testing and certification framework
The framework provides the concept of operations at a higher
level. Over the years, the COE team has introduced smart
technologies to the COE to ensure sustainable operation and
support.
Certified Download Service
Application-specific cyber attacks constitute a significant
proportion of enterprise intrusion. There is therefore a need
to patch systems conscientiously and quickly whenever an
update is available. The majority of software components in
the COE (both client and server) such as OS, patches/updates
and applications/tools are commercial-off-the-shelf (COTS)
products. They are distributed through the software companies’
websites or portals which can be downloaded via the Internet.
A centralised download and integrity check system facilitates
the download of sources with greater assurance and ease with
a controlled distribution of sources internally. Various security
checks ensure that downloads are from an authoritative source
via a secure link to the Internet. Apart from anti-virus checks
on the downloaded files, there are also methods to ensure their
integrity and authenticity, including verifying the signatures
and hash values of the sources. This would prevent man-in-
the-middle attacks in which the sources are modified in transit.
Scripting was also incorporated to automate these checks
such that it is seamless for the user. DSTA also established a
process to standardise and document relevant approaches and
procedures with clear terms of reference of various roles (e.g.
Product Point of Contact, Distribution Point Point of Contact
and Service Provider). Figure 4 shows the stages, objectives,
process, checks and verification technologies encapsulated in
the Downloads Verification and Validation System Framework.
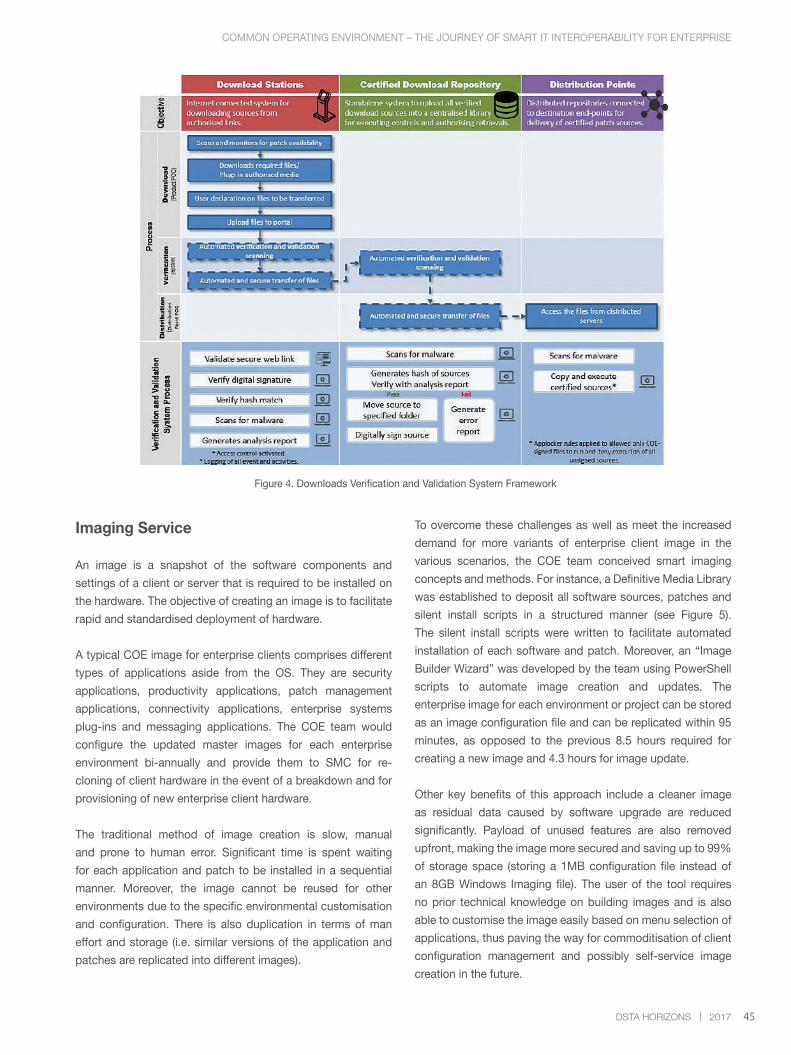
45DSTA HORIZONS | 2017
Figure 4. Downloads Verification and Validation System Framework
Imaging Service
An image is a snapshot of the software components and
settings of a client or server that is required to be installed on
the hardware. The objective of creating an image is to facilitate
rapid and standardised deployment of hardware.
A typical COE image for enterprise clients comprises different
types of applications aside from the OS. They are security
applications, productivity applications, patch management
applications, connectivity applications, enterprise systems
plug-ins and messaging applications. The COE team would
configure the updated master images for each enterprise
environment bi-annually and provide them to SMC for re-
cloning of client hardware in the event of a breakdown and for
provisioning of new enterprise client hardware.
The traditional method of image creation is slow, manual
and prone to human error. Significant time is spent waiting
for each application and patch to be installed in a sequential
manner. Moreover, the image cannot be reused for other
environments due to the specific environmental customisation
and configuration. There is also duplication in terms of man
effort and storage (i.e. similar versions of the application and
patches are replicated into different images).
To overcome these challenges as well as meet the increased
demand for more variants of enterprise client image in the
various scenarios, the COE team conceived smart imaging
concepts and methods. For instance, a Definitive Media Library
was established to deposit all software sources, patches and
silent install scripts in a structured manner (see Figure 5).
The silent install scripts were written to facilitate automated
installation of each software and patch. Moreover, an “Image
Builder Wizard” was developed by the team using PowerShell
scripts to automate image creation and updates. The
enterprise image for each environment or project can be stored
as an image configuration file and can be replicated within 95
minutes, as opposed to the previous 8.5 hours required for
creating a new image and 4.3 hours for image update.
Other key benefits of this approach include a cleaner image
as residual data caused by software upgrade are reduced
significantly. Payload of unused features are also removed
upfront, making the image more secured and saving up to 99%
of storage space (storing a 1MB configuration file instead of
an 8GB Windows Imaging file). The user of the tool requires
no prior technical knowledge on building images and is also
able to customise the image easily based on menu selection of
applications, thus paving the way for commoditisation of client
configuration management and possibly self-service image
creation in the future.
COMMON OPERATING ENVIRONMENT – THE JOURNEY OF SMART IT INTEROPERABILITY FOR ENTERPRISE
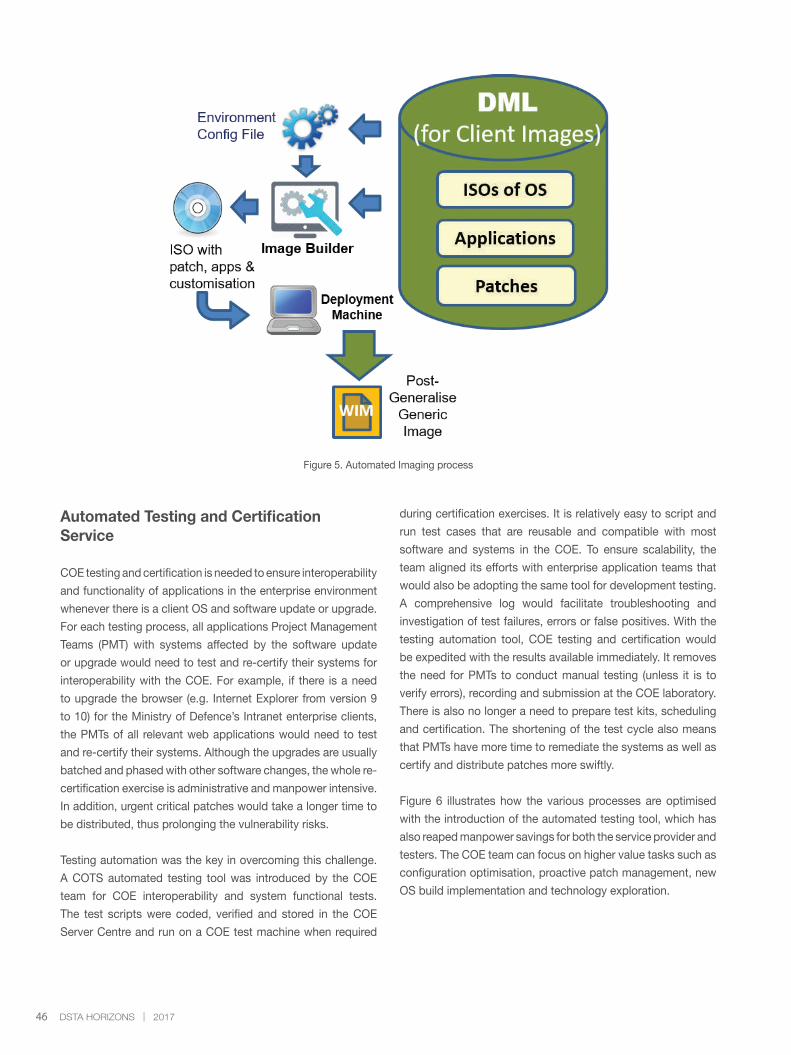
46 DSTA HORIZONS | 2017
Figure 5. Automated Imaging process
Automated Testing and Certification Service
COE testing and certification is needed to ensure interoperability
and functionality of applications in the enterprise environment
whenever there is a client OS and software update or upgrade.
For each testing process, all applications Project Management
Teams (PMT) with systems affected by the software update
or upgrade would need to test and re-certify their systems for
interoperability with the COE. For example, if there is a need
to upgrade the browser (e.g. Internet Explorer from version 9
to 10) for the Ministry of Defence’s Intranet enterprise clients,
the PMTs of all relevant web applications would need to test
and re-certify their systems. Although the upgrades are usually
batched and phased with other software changes, the whole re-
certification exercise is administrative and manpower intensive.
In addition, urgent critical patches would take a longer time to
be distributed, thus prolonging the vulnerability risks.
Testing automation was the key in overcoming this challenge.
A COTS automated testing tool was introduced by the COE
team for COE interoperability and system functional tests.
The test scripts were coded, verified and stored in the COE
Server Centre and run on a COE test machine when required
during certification exercises. It is relatively easy to script and
run test cases that are reusable and compatible with most
software and systems in the COE. To ensure scalability, the
team aligned its efforts with enterprise application teams that
would also be adopting the same tool for development testing.
A comprehensive log would facilitate troubleshooting and
investigation of test failures, errors or false positives. With the
testing automation tool, COE testing and certification would
be expedited with the results available immediately. It removes
the need for PMTs to conduct manual testing (unless it is to
verify errors), recording and submission at the COE laboratory.
There is also no longer a need to prepare test kits, scheduling
and certification. The shortening of the test cycle also means
that PMTs have more time to remediate the systems as well as
certify and distribute patches more swiftly.
Figure 6 illustrates how the various processes are optimised
with the introduction of the automated testing tool, which has
also reaped manpower savings for both the service provider and
testers. The COE team can focus on higher value tasks such as
configuration optimisation, proactive patch management, new
OS build implementation and technology exploration.
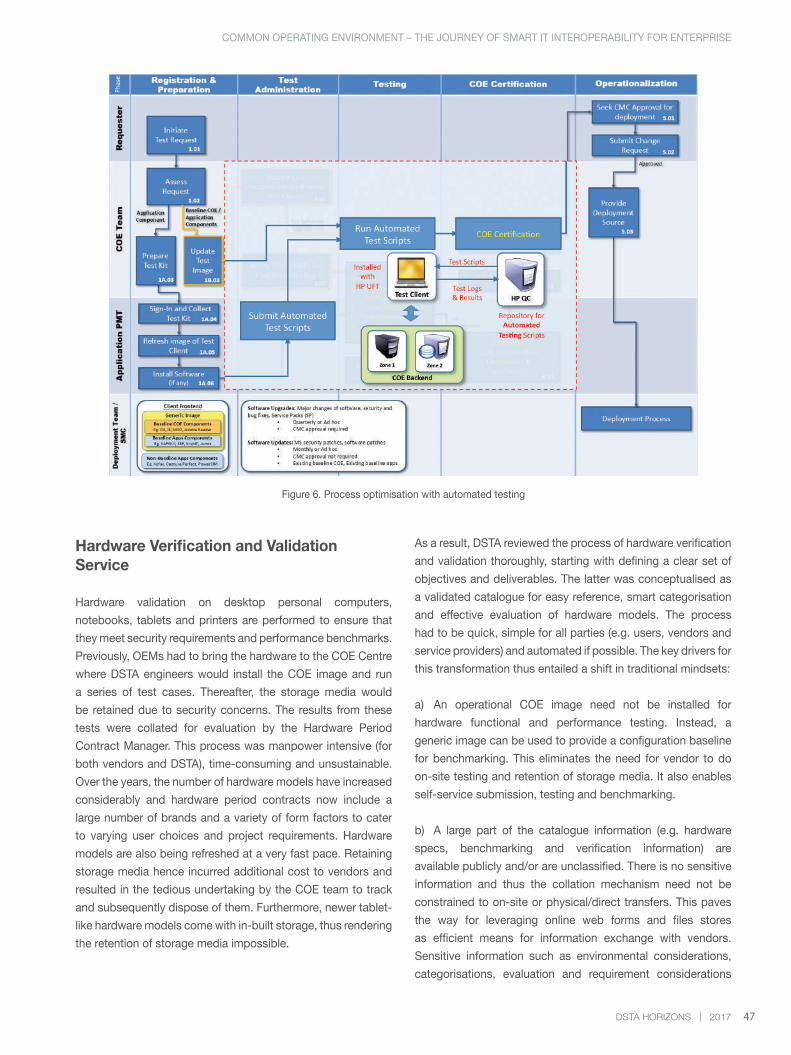
47DSTA HORIZONS | 2017
Figure 6. Process optimisation with automated testing
Hardware Verification and Validation Service
Hardware validation on desktop personal computers,
notebooks, tablets and printers are performed to ensure that
they meet security requirements and performance benchmarks.
Previously, OEMs had to bring the hardware to the COE Centre
where DSTA engineers would install the COE image and run
a series of test cases. Thereafter, the storage media would
be retained due to security concerns. The results from these
tests were collated for evaluation by the Hardware Period
Contract Manager. This process was manpower intensive (for
both vendors and DSTA), time-consuming and unsustainable.
Over the years, the number of hardware models have increased
considerably and hardware period contracts now include a
large number of brands and a variety of form factors to cater
to varying user choices and project requirements. Hardware
models are also being refreshed at a very fast pace. Retaining
storage media hence incurred additional cost to vendors and
resulted in the tedious undertaking by the COE team to track
and subsequently dispose of them. Furthermore, newer tablet-
like hardware models come with in-built storage, thus rendering
the retention of storage media impossible.
As a result, DSTA reviewed the process of hardware verification
and validation thoroughly, starting with defining a clear set of
objectives and deliverables. The latter was conceptualised as
a validated catalogue for easy reference, smart categorisation
and effective evaluation of hardware models. The process
had to be quick, simple for all parties (e.g. users, vendors and
service providers) and automated if possible. The key drivers for
this transformation thus entailed a shift in traditional mindsets:
a) An operational COE image need not be installed for
hardware functional and performance testing. Instead, a
generic image can be used to provide a configuration baseline
for benchmarking. This eliminates the need for vendor to do
on-site testing and retention of storage media. It also enables
self-service submission, testing and benchmarking.
b) A large part of the catalogue information (e.g. hardware
specs, benchmarking and verification information) are
available publicly and/or are unclassified. There is no sensitive
information and thus the collation mechanism need not be
constrained to on-site or physical/direct transfers. This paves
the way for leveraging online web forms and files stores
as efficient means for information exchange with vendors.
Sensitive information such as environmental considerations,
categorisations, evaluation and requirement considerations
COMMON OPERATING ENVIRONMENT – THE JOURNEY OF SMART IT INTEROPERABILITY FOR ENTERPRISE
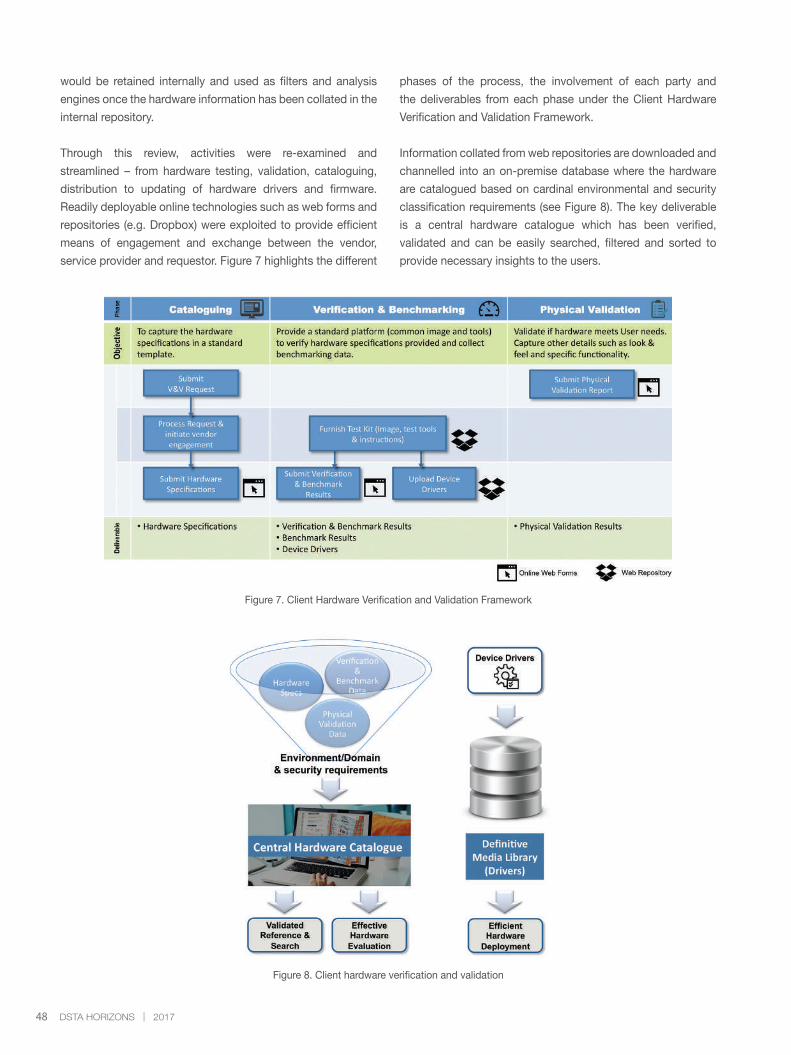
48 DSTA HORIZONS | 2017
would be retained internally and used as filters and analysis
engines once the hardware information has been collated in the
internal repository.
Through this review, activities were re-examined and
streamlined – from hardware testing, validation, cataloguing,
distribution to updating of hardware drivers and firmware.
Readily deployable online technologies such as web forms and
repositories (e.g. Dropbox) were exploited to provide efficient
means of engagement and exchange between the vendor,
service provider and requestor. Figure 7 highlights the different
Figure 7. Client Hardware Verification and Validation Framework
Figure 8. Client hardware verification and validation
phases of the process, the involvement of each party and
the deliverables from each phase under the Client Hardware
Verification and Validation Framework.
Information collated from web repositories are downloaded and
channelled into an on-premise database where the hardware
are catalogued based on cardinal environmental and security
classification requirements (see Figure 8). The key deliverable
is a central hardware catalogue which has been verified,
validated and can be easily searched, filtered and sorted to
provide necessary insights to the users.
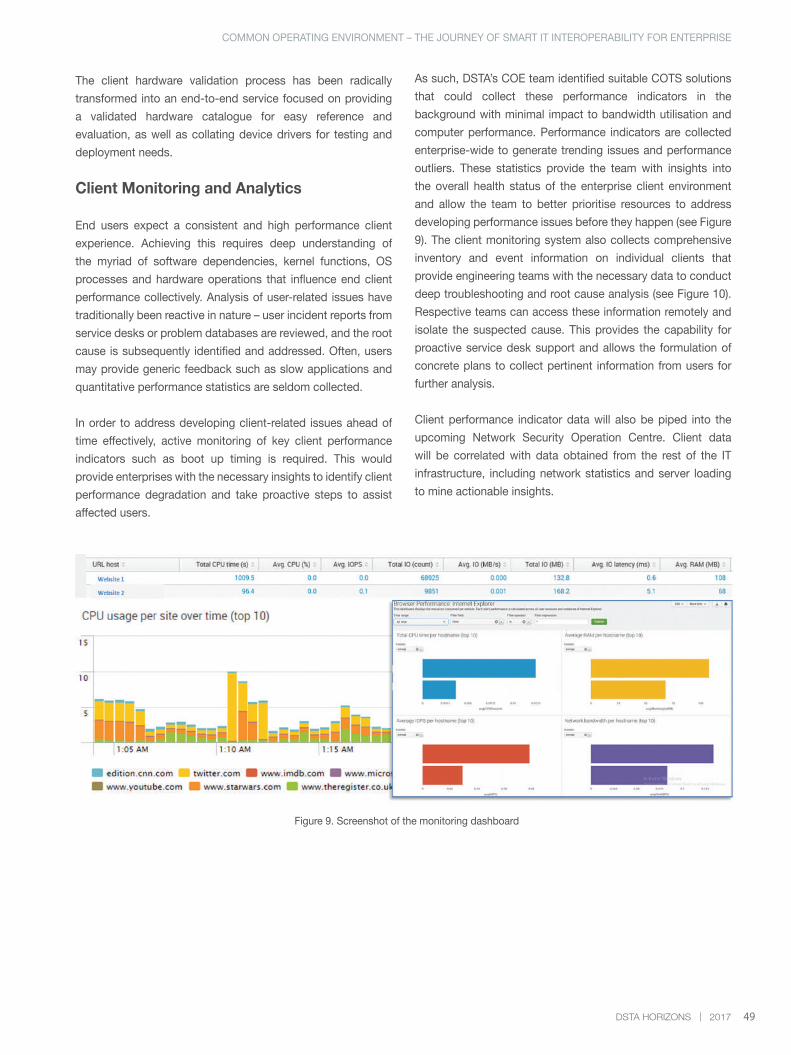
49DSTA HORIZONS | 2017
The client hardware validation process has been radically
transformed into an end-to-end service focused on providing
a validated hardware catalogue for easy reference and
evaluation, as well as collating device drivers for testing and
deployment needs.
Client Monitoring and Analytics
End users expect a consistent and high performance client
experience. Achieving this requires deep understanding of
the myriad of software dependencies, kernel functions, OS
processes and hardware operations that influence end client
performance collectively. Analysis of user-related issues have
traditionally been reactive in nature – user incident reports from
service desks or problem databases are reviewed, and the root
cause is subsequently identified and addressed. Often, users
may provide generic feedback such as slow applications and
quantitative performance statistics are seldom collected.
In order to address developing client-related issues ahead of
time effectively, active monitoring of key client performance
indicators such as boot up timing is required. This would
provide enterprises with the necessary insights to identify client
performance degradation and take proactive steps to assist
affected users.
As such, DSTA’s COE team identified suitable COTS solutions
that could collect these performance indicators in the
background with minimal impact to bandwidth utilisation and
computer performance. Performance indicators are collected
enterprise-wide to generate trending issues and performance
outliers. These statistics provide the team with insights into
the overall health status of the enterprise client environment
and allow the team to better prioritise resources to address
developing performance issues before they happen (see Figure
9). The client monitoring system also collects comprehensive
inventory and event information on individual clients that
provide engineering teams with the necessary data to conduct
deep troubleshooting and root cause analysis (see Figure 10).
Respective teams can access these information remotely and
isolate the suspected cause. This provides the capability for
proactive service desk support and allows the formulation of
concrete plans to collect pertinent information from users for
further analysis.
Client performance indicator data will also be piped into the
upcoming Network Security Operation Centre. Client data
will be correlated with data obtained from the rest of the IT
infrastructure, including network statistics and server loading
to mine actionable insights.
Figure 9. Screenshot of the monitoring dashboard
COMMON OPERATING ENVIRONMENT – THE JOURNEY OF SMART IT INTEROPERABILITY FOR ENTERPRISE
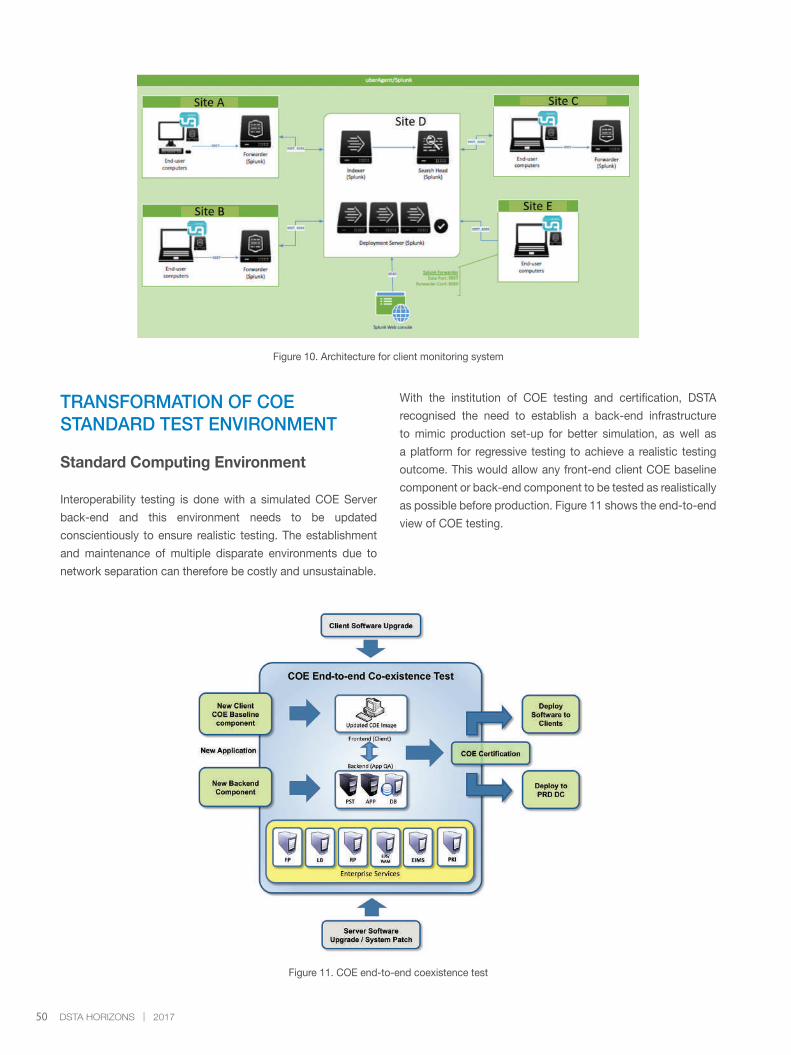
50 DSTA HORIZONS | 2017
Figure 10. Architecture for client monitoring system
Figure 11. COE end-to-end coexistence test
TRANSFORMATION OF COE STANDARD TEST ENVIRONMENT
Standard Computing Environment
Interoperability testing is done with a simulated COE Server
back-end and this environment needs to be updated
conscientiously to ensure realistic testing. The establishment
and maintenance of multiple disparate environments due to
network separation can therefore be costly and unsustainable.
With the institution of COE testing and certification, DSTA
recognised the need to establish a back-end infrastructure
to mimic production set-up for better simulation, as well as
a platform for regressive testing to achieve a realistic testing
outcome. This would allow any front-end client COE baseline
component or back-end component to be tested as realistically
as possible before production. Figure 11 shows the end-to-end
view of COE testing.
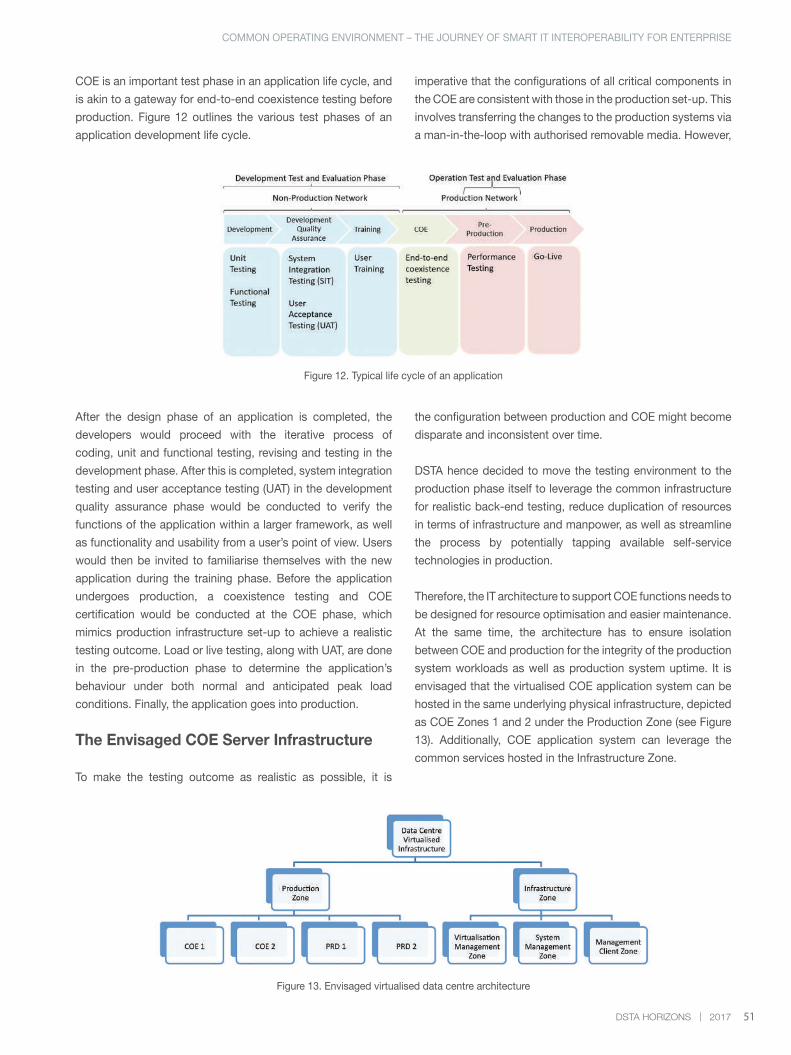
51DSTA HORIZONS | 2017
Figure 12. Typical life cycle of an application
COE is an important test phase in an application life cycle, and
is akin to a gateway for end-to-end coexistence testing before
production. Figure 12 outlines the various test phases of an
application development life cycle.
imperative that the configurations of all critical components in
the COE are consistent with those in the production set-up. This
involves transferring the changes to the production systems via
a man-in-the-loop with authorised removable media. However,
After the design phase of an application is completed, the
developers would proceed with the iterative process of
coding, unit and functional testing, revising and testing in the
development phase. After this is completed, system integration
testing and user acceptance testing (UAT) in the development
quality assurance phase would be conducted to verify the
functions of the application within a larger framework, as well
as functionality and usability from a user’s point of view. Users
would then be invited to familiarise themselves with the new
application during the training phase. Before the application
undergoes production, a coexistence testing and COE
certification would be conducted at the COE phase, which
mimics production infrastructure set-up to achieve a realistic
testing outcome. Load or live testing, along with UAT, are done
in the pre-production phase to determine the application’s
behaviour under both normal and anticipated peak load
conditions. Finally, the application goes into production.
The Envisaged COE Server Infrastructure
To make the testing outcome as realistic as possible, it is
the configuration between production and COE might become
disparate and inconsistent over time.
DSTA hence decided to move the testing environment to the
production phase itself to leverage the common infrastructure
for realistic back-end testing, reduce duplication of resources
in terms of infrastructure and manpower, as well as streamline
the process by potentially tapping available self-service
technologies in production.
Therefore, the IT architecture to support COE functions needs to
be designed for resource optimisation and easier maintenance.
At the same time, the architecture has to ensure isolation
between COE and production for the integrity of the production
system workloads as well as production system uptime. It is
envisaged that the virtualised COE application system can be
hosted in the same underlying physical infrastructure, depicted
as COE Zones 1 and 2 under the Production Zone (see Figure
13). Additionally, COE application system can leverage the
common services hosted in the Infrastructure Zone.
COMMON OPERATING ENVIRONMENT – THE JOURNEY OF SMART IT INTEROPERABILITY FOR ENTERPRISE
Figure 13. Envisaged virtualised data centre architecture
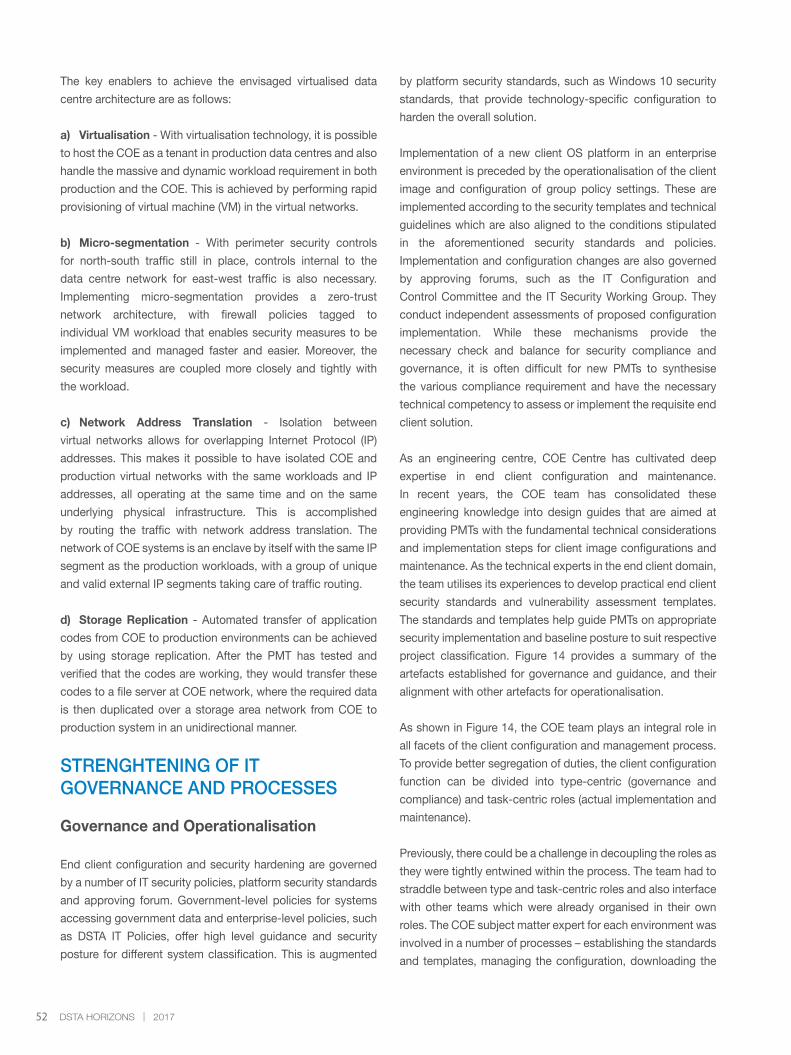
52 DSTA HORIZONS | 2017
The key enablers to achieve the envisaged virtualised data
centre architecture are as follows:
a) Virtualisation - With virtualisation technology, it is possible
to host the COE as a tenant in production data centres and also
handle the massive and dynamic workload requirement in both
production and the COE. This is achieved by performing rapid
provisioning of virtual machine (VM) in the virtual networks.
b) Micro-segmentation - With perimeter security controls
for north-south traffic still in place, controls internal to the
data centre network for east-west traffic is also necessary.
Implementing micro-segmentation provides a zero-trust
network architecture, with firewall policies tagged to
individual VM workload that enables security measures to be
implemented and managed faster and easier. Moreover, the
security measures are coupled more closely and tightly with
the workload.
c) Network Address Translation - Isolation between
virtual networks allows for overlapping Internet Protocol (IP)
addresses. This makes it possible to have isolated COE and
production virtual networks with the same workloads and IP
addresses, all operating at the same time and on the same
underlying physical infrastructure. This is accomplished
by routing the traffic with network address translation. The
network of COE systems is an enclave by itself with the same IP
segment as the production workloads, with a group of unique
and valid external IP segments taking care of traffic routing.
d) Storage Replication - Automated transfer of application
codes from COE to production environments can be achieved
by using storage replication. After the PMT has tested and
verified that the codes are working, they would transfer these
codes to a file server at COE network, where the required data
is then duplicated over a storage area network from COE to
production system in an unidirectional manner.
STRENGHTENING OF IT GOVERNANCE AND PROCESSES
Governance and Operationalisation
End client configuration and security hardening are governed
by a number of IT security policies, platform security standards
and approving forum. Government-level policies for systems
accessing government data and enterprise-level policies, such
as DSTA IT Policies, offer high level guidance and security
posture for different system classification. This is augmented
by platform security standards, such as Windows 10 security
standards, that provide technology-specific configuration to
harden the overall solution.
Implementation of a new client OS platform in an enterprise
environment is preceded by the operationalisation of the client
image and configuration of group policy settings. These are
implemented according to the security templates and technical
guidelines which are also aligned to the conditions stipulated
in the aforementioned security standards and policies.
Implementation and configuration changes are also governed
by approving forums, such as the IT Configuration and
Control Committee and the IT Security Working Group. They
conduct independent assessments of proposed configuration
implementation. While these mechanisms provide the
necessary check and balance for security compliance and
governance, it is often difficult for new PMTs to synthesise
the various compliance requirement and have the necessary
technical competency to assess or implement the requisite end
client solution.
As an engineering centre, COE Centre has cultivated deep
expertise in end client configuration and maintenance.
In recent years, the COE team has consolidated these
engineering knowledge into design guides that are aimed at
providing PMTs with the fundamental technical considerations
and implementation steps for client image configurations and
maintenance. As the technical experts in the end client domain,
the team utilises its experiences to develop practical end client
security standards and vulnerability assessment templates.
The standards and templates help guide PMTs on appropriate
security implementation and baseline posture to suit respective
project classification. Figure 14 provides a summary of the
artefacts established for governance and guidance, and their
alignment with other artefacts for operationalisation.
As shown in Figure 14, the COE team plays an integral role in
all facets of the client configuration and management process.
To provide better segregation of duties, the client configuration
function can be divided into type-centric (governance and
compliance) and task-centric roles (actual implementation and
maintenance).
Previously, there could be a challenge in decoupling the roles as
they were tightly entwined within the process. The team had to
straddle between type and task-centric roles and also interface
with other teams which were already organised in their own
roles. The COE subject matter expert for each environment was
involved in a number of processes – establishing the standards
and templates, managing the configuration, downloading the
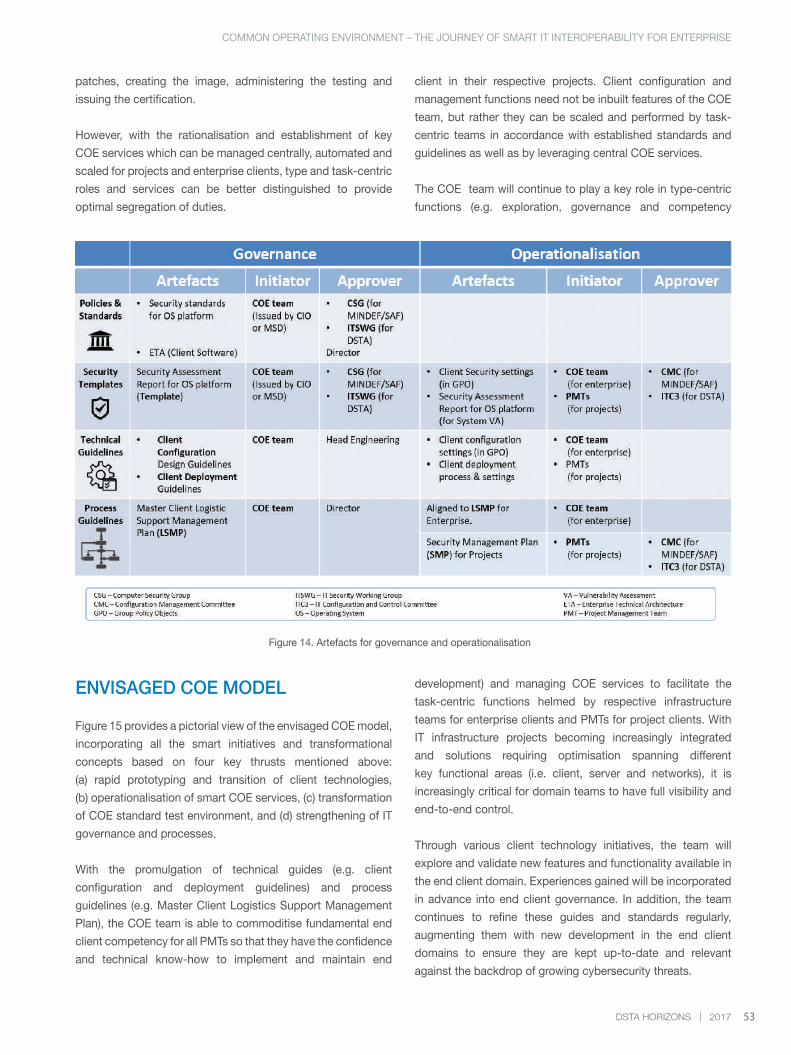
53DSTA HORIZONS | 2017
Figure 14. Artefacts for governance and operationalisation
patches, creating the image, administering the testing and
issuing the certification.
However, with the rationalisation and establishment of key
COE services which can be managed centrally, automated and
scaled for projects and enterprise clients, type and task-centric
roles and services can be better distinguished to provide
optimal segregation of duties.
ENVISAGED COE MODEL
Figure 15 provides a pictorial view of the envisaged COE model,
incorporating all the smart initiatives and transformational
concepts based on four key thrusts mentioned above:
(a) rapid prototyping and transition of client technologies,
(b) operationalisation of smart COE services, (c) transformation
of COE standard test environment, and (d) strengthening of IT
governance and processes.
With the promulgation of technical guides (e.g. client
configuration and deployment guidelines) and process
guidelines (e.g. Master Client Logistics Support Management
Plan), the COE team is able to commoditise fundamental end
client competency for all PMTs so that they have the confidence
and technical know-how to implement and maintain end
client in their respective projects. Client configuration and
management functions need not be inbuilt features of the COE
team, but rather they can be scaled and performed by task-
centric teams in accordance with established standards and
guidelines as well as by leveraging central COE services.
The COE team will continue to play a key role in type-centric
functions (e.g. exploration, governance and competency
development) and managing COE services to facilitate the
task-centric functions helmed by respective infrastructure
teams for enterprise clients and PMTs for project clients. With
IT infrastructure projects becoming increasingly integrated
and solutions requiring optimisation spanning different
key functional areas (i.e. client, server and networks), it is
increasingly critical for domain teams to have full visibility and
end-to-end control.
Through various client technology initiatives, the team will
explore and validate new features and functionality available in
the end client domain. Experiences gained will be incorporated
in advance into end client governance. In addition, the team
continues to refine these guides and standards regularly,
augmenting them with new development in the end client
domains to ensure they are kept up-to-date and relevant
against the backdrop of growing cybersecurity threats.
COMMON OPERATING ENVIRONMENT – THE JOURNEY OF SMART IT INTEROPERABILITY FOR ENTERPRISE
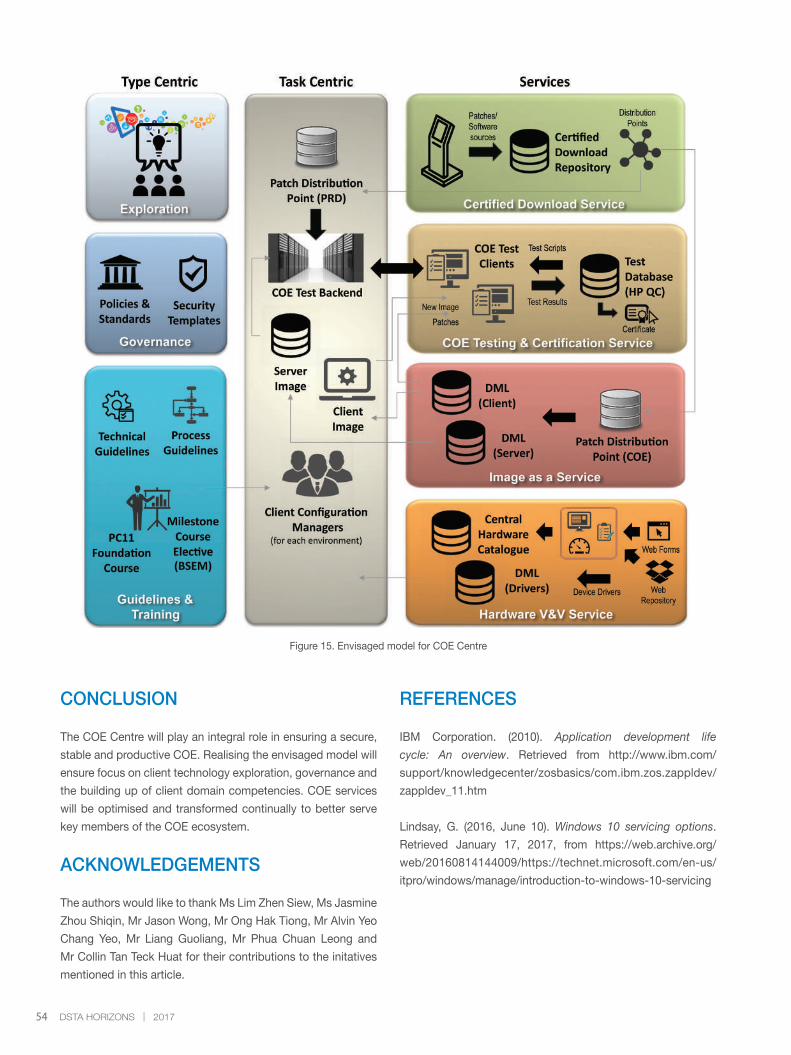
54 DSTA HORIZONS | 2017
Figure 15. Envisaged model for COE Centre
CONCLUSION
The COE Centre will play an integral role in ensuring a secure,
stable and productive COE. Realising the envisaged model will
ensure focus on client technology exploration, governance and
the building up of client domain competencies. COE services
will be optimised and transformed continually to better serve
key members of the COE ecosystem.
ACKNOWLEDGEMENTS
The authors would like to thank Ms Lim Zhen Siew, Ms Jasmine
Zhou Shiqin, Mr Jason Wong, Mr Ong Hak Tiong, Mr Alvin Yeo
Chang Yeo, Mr Liang Guoliang, Mr Phua Chuan Leong and
Mr Collin Tan Teck Huat for their contributions to the initatives
mentioned in this article.
REFERENCES
IBM Corporation. (2010). Application development life
cycle: An overview. Retrieved from http://www.ibm.com/
support/knowledgecenter/zosbasics/com.ibm.zos.zappldev/
zappldev_11.htm
Lindsay, G. (2016, June 10). Windows 10 servicing options.
Retrieved January 17, 2017, from https://web.archive.org/
web/20160814144009/https://technet.microsoft.com/en-us/
itpro/windows/manage/introduction-to-windows-10-servicing
55DSTA HORIZONS | 2017
BIOGRAPHY
LIM Tze Kwang Terence is Head Client
Infrastructure (InfoComm Infrastructure) who
leads the Common Operating Environment
(COE) team in the rapid adoption of new
client technology and capabilities. He and
his team ensure a secured, standardised
and stable enterprise client environment
for DSTA, the Ministry of Defence (MINDEF)
and the Singapore Armed Forces (SAF) by maintaining an
integrated testing infrastructure. Terence helmed the taskforce that
spearheaded the trial and operationalisation of Windows 10 for
DSTA, MINDEF and the SAF’s enterprise client refresh. He has also
led in the systems management of enterprise-level SAP systems
for MINDEF and the SAF and is a certified practitioner of SAP and
ITIL. Terence graduated with a Bachelor of Computing degree from
Monash University, Australia, in 2006.
HO Hao Xiang is a Manager (InfoComm
Infrastructure) who currently oversees the
operations and support of DSTA’s COE to
ensure a stable, secured and productive
end client experience. He also leads the
scouting of emerging client technology,
conducts technology exploration and
system integration, and establishes the
client technology road map to bring new client capabilities to
DSTA, MINDEF and the SAF. Hao Xiang graduated with a Bachelor
of Engineering (Electrical Engineering) degree with Honours from
the National University of Singapore (NUS) in 2010.
TAN Kim Hong is a Manager (InfoComm
Infrastructure) who governs the infrastructure
needed to support realistic integrated testing.
She was also involved in the design and
implementation of secure mobility, server
and network-related solutions for DSTA,
MINDEF and the SAF. Kim Hong graduated
with a Bachelor of Engineering (Electrical
and Electronic Engineering) degree with Honours from Nanyang
Technological University in 2005. Under the DSTA Postgraduate
Scholarship, she also concurrently obtained a Master of Science
(Defence Technology and Systems) degree from Temasek Defence
Systems Institute, NUS, as well as a Master of Science degree in
Electrical Engineering (Computer Networks) with Distinction from
the Naval Postgraduate School, USA, in 2012.
COMMON OPERATING ENVIRONMENT – THE JOURNEY OF SMART IT INTEROPERABILITY FOR ENTERPRISE
56 DSTA HORIZONS | 2017
A ROBUST EMAIL SYSTEM – ARCHITECTING A HIGHLY AVAILABLE AND SECURE EMAIL SYSTEMONG Kar Leong, LIM Dawei
ABSTRACT
Email is a pervasive and indispensable communication means in most enterprises today. Designing, implementing and operating a robust and secure email system is imperative in ensuring continuous business operations. This article outlines three principal considerations in architecting an enterprise email system: high availability, design for sustainment and design for security.
The article also describes the architecture and technologies deployed in building a highly available email system that requires minimal maintenance downtime and ensures quick recovery during disasters. It explains how email data is protected through a data redundancy and replication mechanism. In addition, the article shares how the email system is secure by design – incorporating features such as mail scanning and filtering, as well as identity verification methodologies to mitigate the risk of malware and unauthorised email access.
Keywords: email, availability, security, disaster recovery, email scanning
INTRODUCTION
Email is an important communication tool in today’s digital age
for both personal and enterprise use. Although other instant
messaging tools like WhatsApp and WeChat have become a
part of many people’s social lives, email still holds an important
place to keep people connected due to its ubiquity and utility.
In the enterprise, email remains an effective tool not just for
internal communication, but for external correspondence as
well, in part due to the unmistakeable “user@domain” that
uniquely identifies the users and their organisation to the
external world.
As email forms an integral part of the enterprise’s
communication and work processes, ensuring the continual
service availability of the email system is a critical consideration
for the IT department. There is also the need to balance service
availability with the cost of supporting the infrastructure,
especially in today’s climate where engineering manpower
is in short supply. With cyber threats necessitating vigilant
protection and monitoring of the infrastructure, the task of
architecting an email system becomes instrumental in ensuring
business expectations are met.
In architecting a robust email system, achieving high availability,
design for sustainment and design for security are critical for
success. This article thus outlines the high availability technology
covering hardware components, application design and site
considerations which help ensure the availability of the email
system. It also describes the concept of design for sustainment
to ensure optimal operations and support, covering areas such
as patch management, service automation and service failover.
Furthermore, the considerations for security in areas of mail
filtering, identity verification and event alerting are explained.
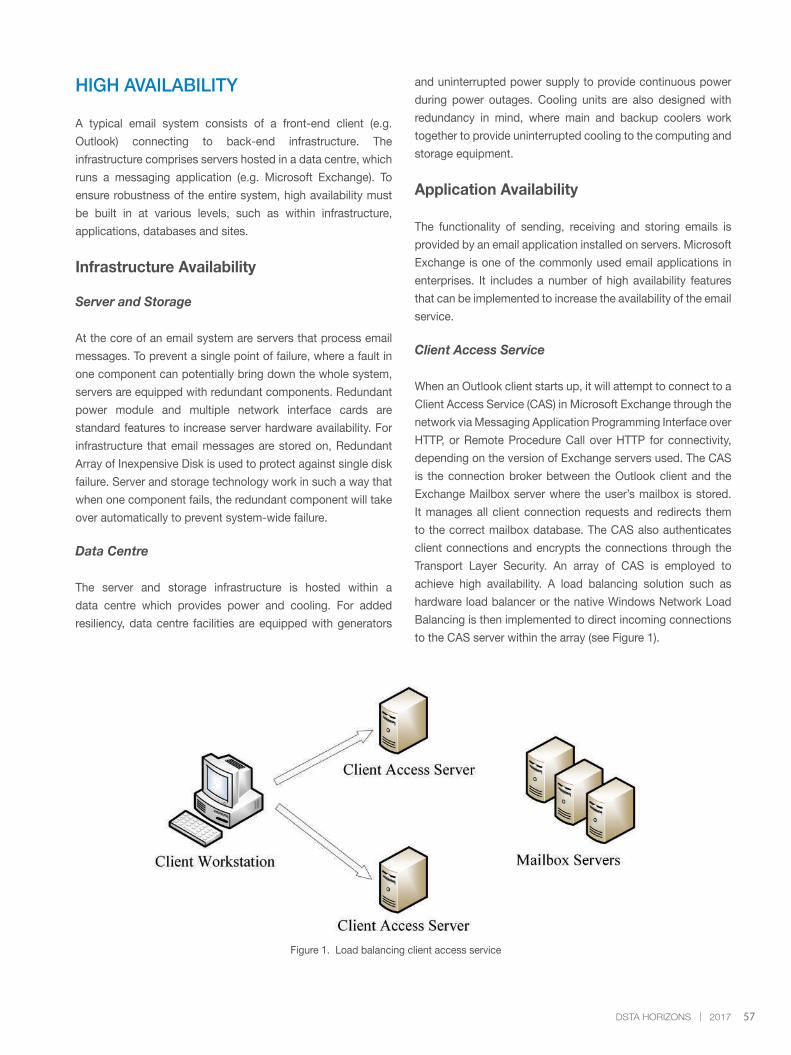
57DSTA HORIZONS | 2017
HIGH AVAILABILITY
A typical email system consists of a front-end client (e.g.
Outlook) connecting to back-end infrastructure. The
infrastructure comprises servers hosted in a data centre, which
runs a messaging application (e.g. Microsoft Exchange). To
ensure robustness of the entire system, high availability must
be built in at various levels, such as within infrastructure,
applications, databases and sites.
Infrastructure Availability
Server and Storage
At the core of an email system are servers that process email
messages. To prevent a single point of failure, where a fault in
one component can potentially bring down the whole system,
servers are equipped with redundant components. Redundant
power module and multiple network interface cards are
standard features to increase server hardware availability. For
infrastructure that email messages are stored on, Redundant
Array of Inexpensive Disk is used to protect against single disk
failure. Server and storage technology work in such a way that
when one component fails, the redundant component will take
over automatically to prevent system-wide failure.
Data Centre
The server and storage infrastructure is hosted within a
data centre which provides power and cooling. For added
resiliency, data centre facilities are equipped with generators
and uninterrupted power supply to provide continuous power
during power outages. Cooling units are also designed with
redundancy in mind, where main and backup coolers work
together to provide uninterrupted cooling to the computing and
storage equipment.
Application Availability
The functionality of sending, receiving and storing emails is
provided by an email application installed on servers. Microsoft
Exchange is one of the commonly used email applications in
enterprises. It includes a number of high availability features
that can be implemented to increase the availability of the email
service.
Client Access Service
When an Outlook client starts up, it will attempt to connect to a
Client Access Service (CAS) in Microsoft Exchange through the
network via Messaging Application Programming Interface over
HTTP, or Remote Procedure Call over HTTP for connectivity,
depending on the version of Exchange servers used. The CAS
is the connection broker between the Outlook client and the
Exchange Mailbox server where the user’s mailbox is stored.
It manages all client connection requests and redirects them
to the correct mailbox database. The CAS also authenticates
client connections and encrypts the connections through the
Transport Layer Security. An array of CAS is employed to
achieve high availability. A load balancing solution such as
hardware load balancer or the native Windows Network Load
Balancing is then implemented to direct incoming connections
to the CAS server within the array (see Figure 1).
Figure 1. Load balancing client access service
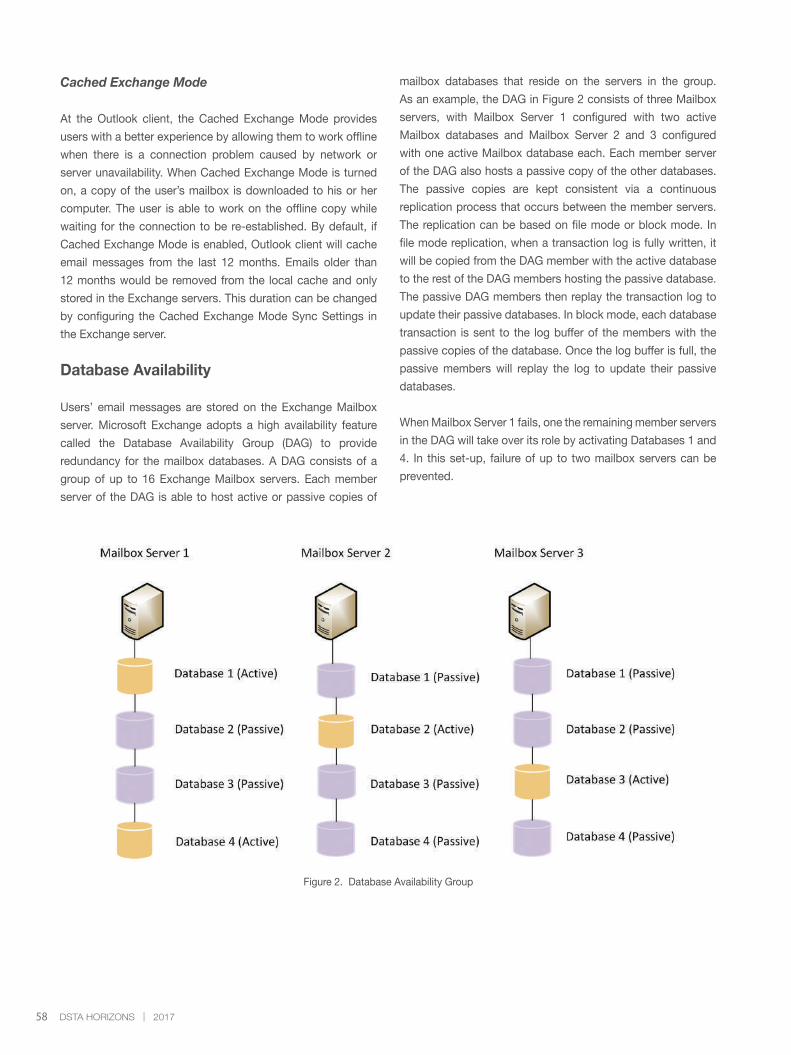
58 DSTA HORIZONS | 2017
Cached Exchange Mode
At the Outlook client, the Cached Exchange Mode provides
users with a better experience by allowing them to work offline
when there is a connection problem caused by network or
server unavailability. When Cached Exchange Mode is turned
on, a copy of the user’s mailbox is downloaded to his or her
computer. The user is able to work on the offline copy while
waiting for the connection to be re-established. By default, if
Cached Exchange Mode is enabled, Outlook client will cache
email messages from the last 12 months. Emails older than
12 months would be removed from the local cache and only
stored in the Exchange servers. This duration can be changed
by configuring the Cached Exchange Mode Sync Settings in
the Exchange server.
Database Availability
Users’ email messages are stored on the Exchange Mailbox
server. Microsoft Exchange adopts a high availability feature
called the Database Availability Group (DAG) to provide
redundancy for the mailbox databases. A DAG consists of a
group of up to 16 Exchange Mailbox servers. Each member
server of the DAG is able to host active or passive copies of
mailbox databases that reside on the servers in the group.
As an example, the DAG in Figure 2 consists of three Mailbox
servers, with Mailbox Server 1 configured with two active
Mailbox databases and Mailbox Server 2 and 3 configured
with one active Mailbox database each. Each member server
of the DAG also hosts a passive copy of the other databases.
The passive copies are kept consistent via a continuous
replication process that occurs between the member servers.
The replication can be based on file mode or block mode. In
file mode replication, when a transaction log is fully written, it
will be copied from the DAG member with the active database
to the rest of the DAG members hosting the passive database.
The passive DAG members then replay the transaction log to
update their passive databases. In block mode, each database
transaction is sent to the log buffer of the members with the
passive copies of the database. Once the log buffer is full, the
passive members will replay the log to update their passive
databases.
When Mailbox Server 1 fails, one the remaining member servers
in the DAG will take over its role by activating Databases 1 and
4. In this set-up, failure of up to two mailbox servers can be
prevented.
Figure 2. Database Availability Group
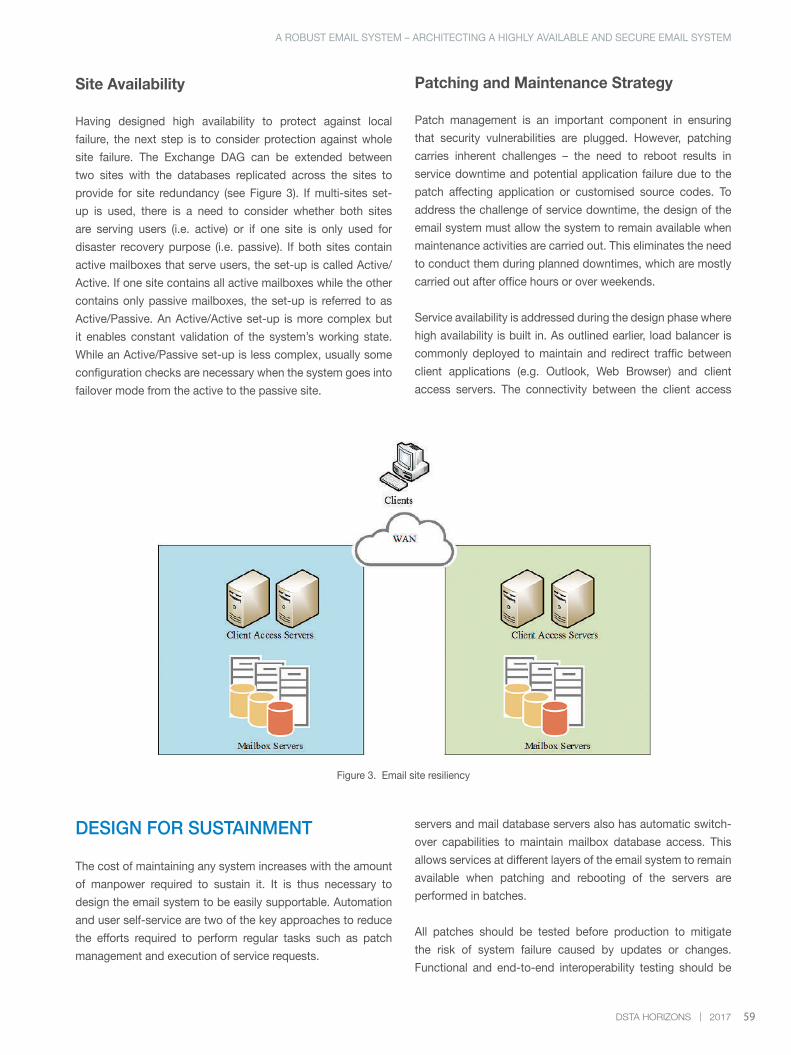
59DSTA HORIZONS | 2017
Site Availability
Having designed high availability to protect against local
failure, the next step is to consider protection against whole
site failure. The Exchange DAG can be extended between
two sites with the databases replicated across the sites to
provide for site redundancy (see Figure 3). If multi-sites set-
up is used, there is a need to consider whether both sites
are serving users (i.e. active) or if one site is only used for
disaster recovery purpose (i.e. passive). If both sites contain
active mailboxes that serve users, the set-up is called Active/
Active. If one site contains all active mailboxes while the other
contains only passive mailboxes, the set-up is referred to as
Active/Passive. An Active/Active set-up is more complex but
it enables constant validation of the system’s working state.
While an Active/Passive set-up is less complex, usually some
configuration checks are necessary when the system goes into
failover mode from the active to the passive site.
Figure 3. Email site resiliency
Patching and Maintenance Strategy
Patch management is an important component in ensuring
that security vulnerabilities are plugged. However, patching
carries inherent challenges – the need to reboot results in
service downtime and potential application failure due to the
patch affecting application or customised source codes. To
address the challenge of service downtime, the design of the
email system must allow the system to remain available when
maintenance activities are carried out. This eliminates the need
to conduct them during planned downtimes, which are mostly
carried out after office hours or over weekends.
Service availability is addressed during the design phase where
high availability is built in. As outlined earlier, load balancer is
commonly deployed to maintain and redirect traffic between
client applications (e.g. Outlook, Web Browser) and client
access servers. The connectivity between the client access
DESIGN FOR SUSTAINMENT
The cost of maintaining any system increases with the amount
of manpower required to sustain it. It is thus necessary to
design the email system to be easily supportable. Automation
and user self-service are two of the key approaches to reduce
the efforts required to perform regular tasks such as patch
management and execution of service requests.
servers and mail database servers also has automatic switch-
over capabilities to maintain mailbox database access. This
allows services at different layers of the email system to remain
available when patching and rebooting of the servers are
performed in batches.
All patches should be tested before production to mitigate
the risk of system failure caused by updates or changes.
Functional and end-to-end interoperability testing should be
A ROBUST EMAIL SYSTEM – ARCHITECTING A HIGHLY AVAILABLE AND SECURE EMAIL SYSTEM
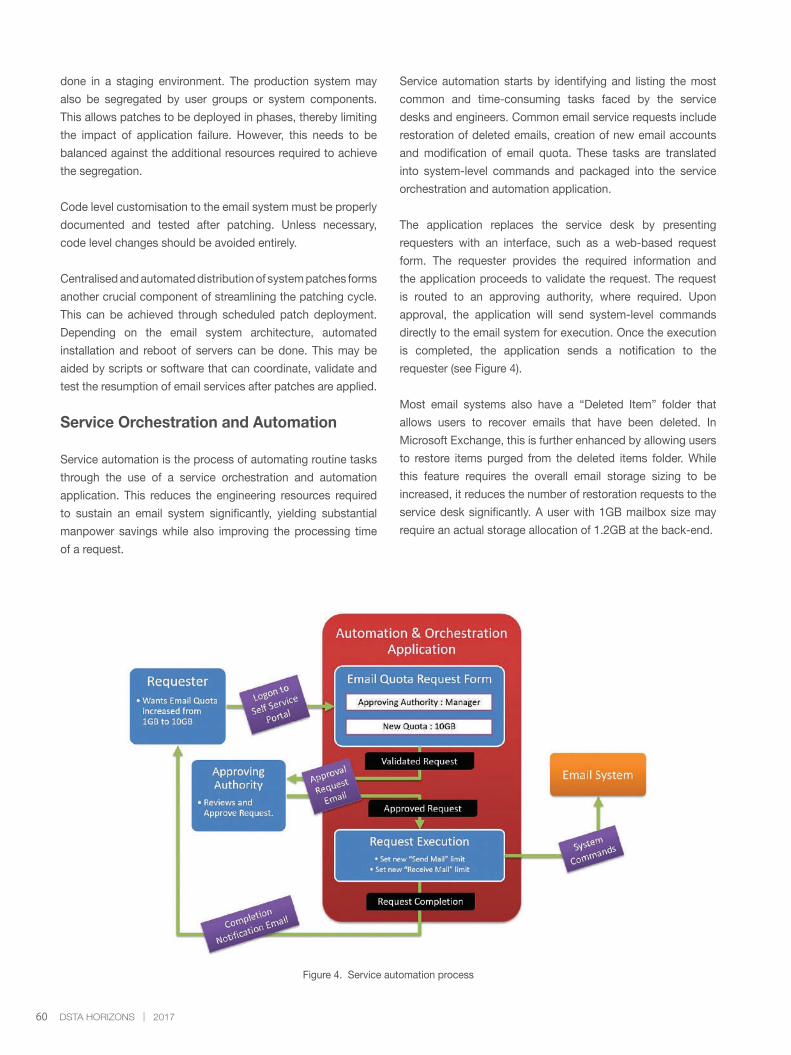
60 DSTA HORIZONS | 2017
Figure 4. Service automation process
done in a staging environment. The production system may
also be segregated by user groups or system components.
This allows patches to be deployed in phases, thereby limiting
the impact of application failure. However, this needs to be
balanced against the additional resources required to achieve
the segregation.
Code level customisation to the email system must be properly
documented and tested after patching. Unless necessary,
code level changes should be avoided entirely.
Centralised and automated distribution of system patches forms
another crucial component of streamlining the patching cycle.
This can be achieved through scheduled patch deployment.
Depending on the email system architecture, automated
installation and reboot of servers can be done. This may be
aided by scripts or software that can coordinate, validate and
test the resumption of email services after patches are applied.
Service Orchestration and Automation
Service automation is the process of automating routine tasks
through the use of a service orchestration and automation
application. This reduces the engineering resources required
to sustain an email system significantly, yielding substantial
manpower savings while also improving the processing time
of a request.
Service automation starts by identifying and listing the most
common and time-consuming tasks faced by the service
desks and engineers. Common email service requests include
restoration of deleted emails, creation of new email accounts
and modification of email quota. These tasks are translated
into system-level commands and packaged into the service
orchestration and automation application.
The application replaces the service desk by presenting
requesters with an interface, such as a web-based request
form. The requester provides the required information and
the application proceeds to validate the request. The request
is routed to an approving authority, where required. Upon
approval, the application will send system-level commands
directly to the email system for execution. Once the execution
is completed, the application sends a notification to the
requester (see Figure 4).
Most email systems also have a “Deleted Item” folder that
allows users to recover emails that have been deleted. In
Microsoft Exchange, this is further enhanced by allowing users
to restore items purged from the deleted items folder. While
this feature requires the overall email storage sizing to be
increased, it reduces the number of restoration requests to the
service desk significantly. A user with 1GB mailbox size may
require an actual storage allocation of 1.2GB at the back-end.
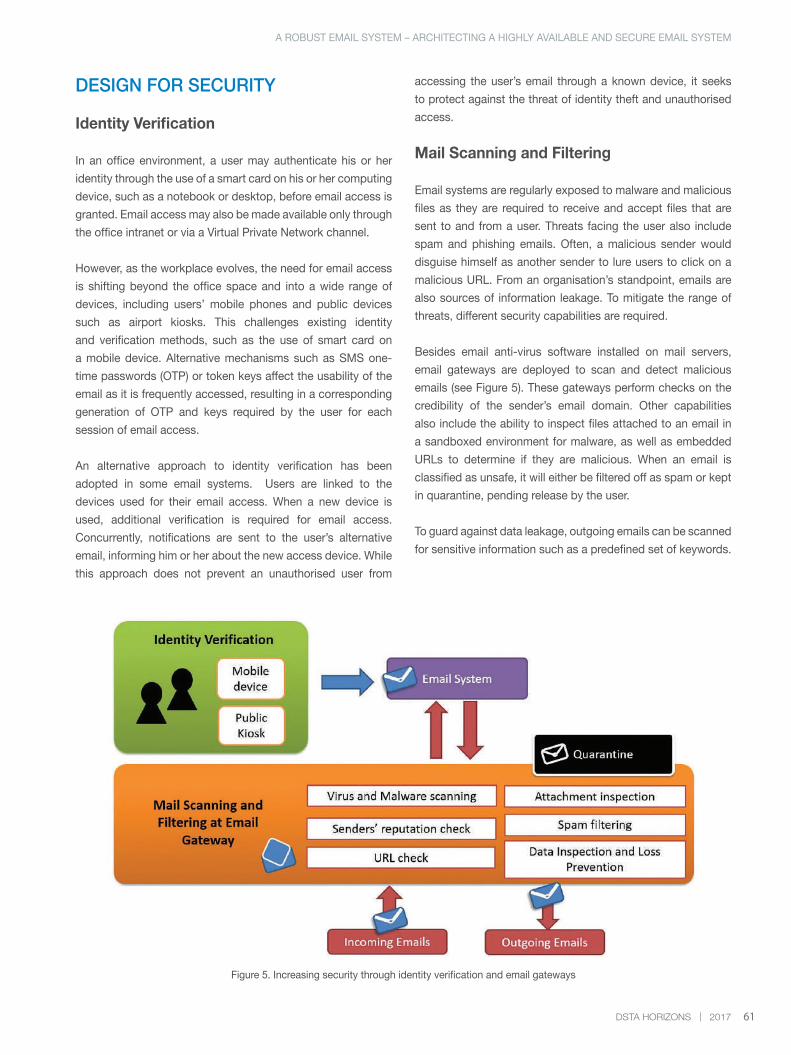
61DSTA HORIZONS | 2017
Figure 5. Increasing security through identity verification and email gateways
A ROBUST EMAIL SYSTEM – ARCHITECTING A HIGHLY AVAILABLE AND SECURE EMAIL SYSTEM
DESIGN FOR SECURITY
Identity Verification
In an office environment, a user may authenticate his or her
identity through the use of a smart card on his or her computing
device, such as a notebook or desktop, before email access is
granted. Email access may also be made available only through
the office intranet or via a Virtual Private Network channel.
However, as the workplace evolves, the need for email access
is shifting beyond the office space and into a wide range of
devices, including users’ mobile phones and public devices
such as airport kiosks. This challenges existing identity
and verification methods, such as the use of smart card on
a mobile device. Alternative mechanisms such as SMS one-
time passwords (OTP) or token keys affect the usability of the
email as it is frequently accessed, resulting in a corresponding
generation of OTP and keys required by the user for each
session of email access.
An alternative approach to identity verification has been
adopted in some email systems. Users are linked to the
devices used for their email access. When a new device is
used, additional verification is required for email access.
Concurrently, notifications are sent to the user’s alternative
email, informing him or her about the new access device. While
this approach does not prevent an unauthorised user from
accessing the user’s email through a known device, it seeks
to protect against the threat of identity theft and unauthorised
access.
Mail Scanning and Filtering
Email systems are regularly exposed to malware and malicious
files as they are required to receive and accept files that are
sent to and from a user. Threats facing the user also include
spam and phishing emails. Often, a malicious sender would
disguise himself as another sender to lure users to click on a
malicious URL. From an organisation’s standpoint, emails are
also sources of information leakage. To mitigate the range of
threats, different security capabilities are required.
Besides email anti-virus software installed on mail servers,
email gateways are deployed to scan and detect malicious
emails (see Figure 5). These gateways perform checks on the
credibility of the sender’s email domain. Other capabilities
also include the ability to inspect files attached to an email in
a sandboxed environment for malware, as well as embedded
URLs to determine if they are malicious. When an email is
classified as unsafe, it will either be filtered off as spam or kept
in quarantine, pending release by the user.
To guard against data leakage, outgoing emails can be scanned
for sensitive information such as a predefined set of keywords.
62 DSTA HORIZONS | 2017
CONCLUSION
Email has become an important and mainstream form of
documented communication. It has evolved from being the
mere exchanges of messages between persons, to becoming
a requirement for registering and receiving notifications from a
wide range of services. Hence, building a robust messaging
system encompassing the elements of high availability,
sustainability and security is critical.
High availability is required to be implemented at all levels
of the email system architecture, covering all layers of the
system from the client application, network load balancer, mail
applications, databases, and servers down to their individual
hardware components. It also extends to the data centre
level where an alternative data centre provides the messaging
services in parallel. In designing for sustainment, the downtimes
and risks associated with patching can be mitigated through
the design of high availability and having a scaled-down set-up
for patch testing. Separately, laborious service request tasks
can be identified and automated through the use of service
orchestration and management applications, which interface
directly between the user and email system. Email security
gateways are deployed in response to malware and malicious
email threats. They provide reputation checks and validate
embedded URLs and file content before delivering the email
to a user.
With the above principal considerations factored in during the
design phase, a robust, secure and supportable email system
can be achieved. The system is also able to deliver its intended
purpose without incurring excessive supporting resources.
REFERENCES
Baldwin, H. (2013). Email addiction: why the enterprise can’t
break free. Retrieved from http://www.computerworld.com/
article/2495420/enterprise-applications/email-addiction--why-
the-enterprise-can-t-break-free.html?page=2
Cunningham, P. (2010). Exchange Server 2010 database
availability group installation step by step. Retrieved from http://
exchangeserverpro.com/exchange-server-2010-database-
availability-group-installation-step-by-step/
Cunningham, P. (2013). Exchange Server 2013 database
availability groups. Retrieved from http://exchangeserverpro.
com/exchange-server-2013-database-availability-groups/
Goodman, S. (2012). Introducing load balancing in Exchange
Server 2013. Retrieved from http://www.msexchange.org/
articles-tutorials/exchange-server-2013/high-availability-
recovery/introducing-load-balancing-exchange-server-2013-
part1.html
Walther, H. (2010). Designing a site resilient Exchange 2010
solution (Part 1). Retrieved from http://www.msexchange.
org/articles-tutorials/exchange-server-2010/high-availability-
recovery/designing-site-resilient-exchange-2010-solution-
part1.html
Wilson, M. (2015). Some design principles for Microsoft
Exchange. Retrieved from http://www.markwilson.co.uk/
blog/2015/07/some-design-principles-for-microsoft-
exchange.htm
BIOGRAPHY
ONG Kar Leong is Head Operations
Support Network (InfoComm Infrastructure)
who manages the design, acquisition,
implementation and system management
of the network and messaging systems for
the Ministry of Defence (MINDEF) and the
Singapore Armed Forces (SAF). Kar Leong
graduated with a Bachelor of Engineering
(Mechanical Engineering) degree with Honours from the National
University of Singapore (NUS) in 1997. He further obtained a
concurrent Master of Science (Defence Technology and Systems)
degree from Temasek Defence Systems Institute, NUS, as well as
a Master of Science (Information Assurance) degree from the Naval
Postgraduate School, USA, in 2007.
LIM Dawei is a Programme Manager
(InfoComm Infrastructure) who oversees the
delivery and transformation of Corporate
IT client for MINDEF and the SAF. Dawei
graduated with a Bachelor of Computer
Engineering (Computer Science) degree
with Honours from Nanyang Technological
University in 2008.

63DSTA HORIZONS | 2017
A ROBUST EMAIL SYSTEM – ARCHITECTING A HIGHLY AVAILABLE AND SECURE EMAIL SYSTEM
64 DSTA HORIZONS | 2017
ENHANCING MARITIME SECURITY THROUGH DATA ANALYTICSLIM Ching Wu Leslie, TAN Chin Koon Adams, KANG Shian Chin, HO Cheeng Tse
ABSTRACT
Singapore maritime agencies face the challenge of identifying maritime crimes and threats such as piracy, smuggling and terrorist plots from thousands of vessels on Singapore waters daily. To address this issue, DSTA created a sensemaking system to identify suspicious vessels by fusing and exploiting data from Singapore maritime agencies and beyond through various data analytics techniques. This article describes the development of this system and outlines some of its key underlying concepts.
Keywords: data analytics, sensemaking, maritime security, Whole-of-Government
INTRODUCTION
Singapore is a maritime nation. According to the Maritime and
Port Authority of Singapore (MPA), maritime establishments
contribute about 7% to Singapore’s gross domestic product.
Annually, more than one million visitors to Singapore arrive
by sea, and over 130,000 ships arrive in Singapore. With
Singapore’s limited resources, it is critical that its maritime
security agencies (i.e. Immigration and Checkpoints Authority,
MPA, Police Coast Guard, the Republic of Singapore Navy
(RSN), and Singapore Customs) work closely together to keep
its sea lanes open and secure.
A team, consisting of members from DSTA, DSO National
Laboratories (DSO) and ST Electronics, thus developed the
National Maritime Sensemaking System (NMSS). The system
integrates data from various maritime security agencies and
utilises data analytics techniques to provide early identification
of suspicious vessels.
This article describes the development of the NMSS and
outlines some of its key underlying concepts.
MOTIVATIONS
Need for Common Situation Picture
Before the development of the National Maritime Sensemaking
System (NMSS), each maritime agency monitored its own area
of responsibility and no agency had a comprehensive picture of
shipping activities on Singapore waters. It was hence difficult
to determine which of the numerous vessels required closer
monitoring in order to detect and deter maritime crimes and
threats.
To have a more systematic manner of assessing vessels,
one must first have a comprehensive picture from which
assessment could be done holistically. The RSN and the team
initiated discussions with various maritime security agencies
on the idea of data sharing across agencies. Through these
discussions, the concept of a single system that would integrate
data, facilitate the sharing of information and provide insights to
the agencies, was born. The common fused maritime situation
picture, which incorporates open source and commercial
information for global coverage, augments the surveillance
coverage of individual agencies beyond their existing system
coverage. It also provides a common information baseline to
support collaboration among maritime security agencies in
jointly tackling maritime security threats.
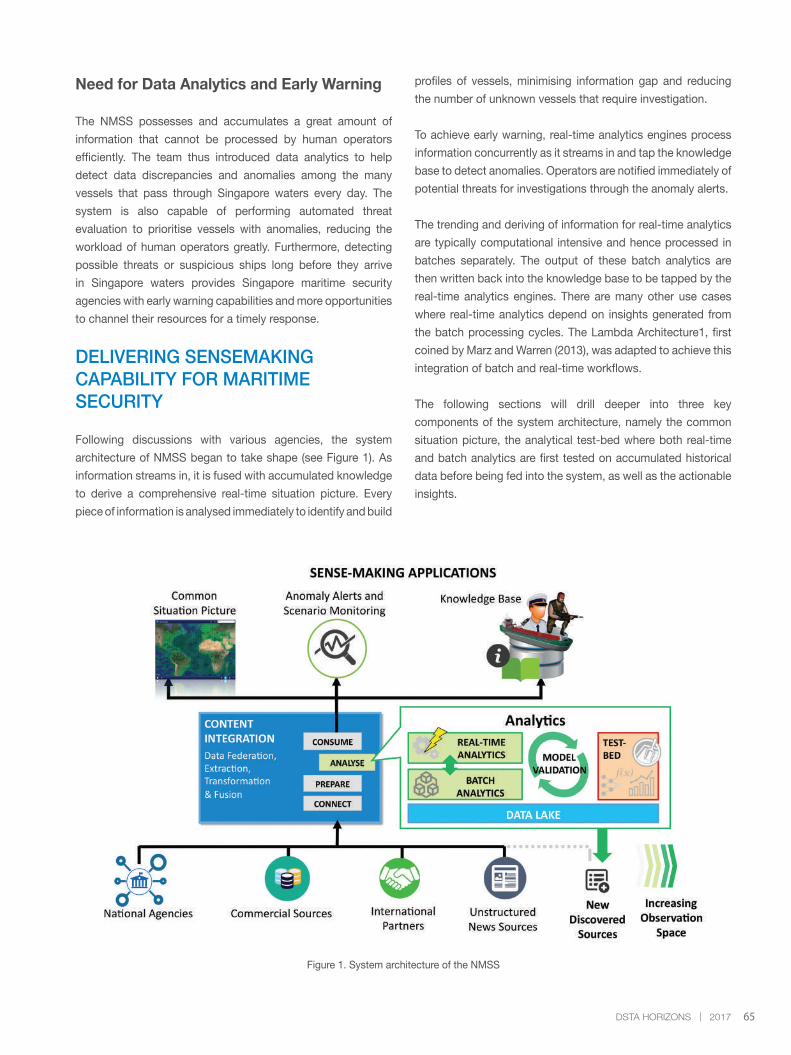
65DSTA HORIZONS | 2017
Need for Data Analytics and Early Warning
The NMSS possesses and accumulates a great amount of
information that cannot be processed by human operators
efficiently. The team thus introduced data analytics to help
detect data discrepancies and anomalies among the many
vessels that pass through Singapore waters every day. The
system is also capable of performing automated threat
evaluation to prioritise vessels with anomalies, reducing the
workload of human operators greatly. Furthermore, detecting
possible threats or suspicious ships long before they arrive
in Singapore waters provides Singapore maritime security
agencies with early warning capabilities and more opportunities
to channel their resources for a timely response.
DELIVERING SENSEMAKING CAPABILITY FOR MARITIME SECURITY
Following discussions with various agencies, the system
architecture of NMSS began to take shape (see Figure 1). As
information streams in, it is fused with accumulated knowledge
to derive a comprehensive real-time situation picture. Every
piece of information is analysed immediately to identify and build
Figure 1. System architecture of the NMSS
profiles of vessels, minimising information gap and reducing
the number of unknown vessels that require investigation.
To achieve early warning, real-time analytics engines process
information concurrently as it streams in and tap the knowledge
base to detect anomalies. Operators are notified immediately of
potential threats for investigations through the anomaly alerts.
The trending and deriving of information for real-time analytics
are typically computational intensive and hence processed in
batches separately. The output of these batch analytics are
then written back into the knowledge base to be tapped by the
real-time analytics engines. There are many other use cases
where real-time analytics depend on insights generated from
the batch processing cycles. The Lambda Architecture1, first
coined by Marz and Warren (2013), was adapted to achieve this
integration of batch and real-time workflows.
The following sections will drill deeper into three key
components of the system architecture, namely the common
situation picture, the analytical test-bed where both real-time
and batch analytics are first tested on accumulated historical
data before being fed into the system, as well as the actionable
insights.
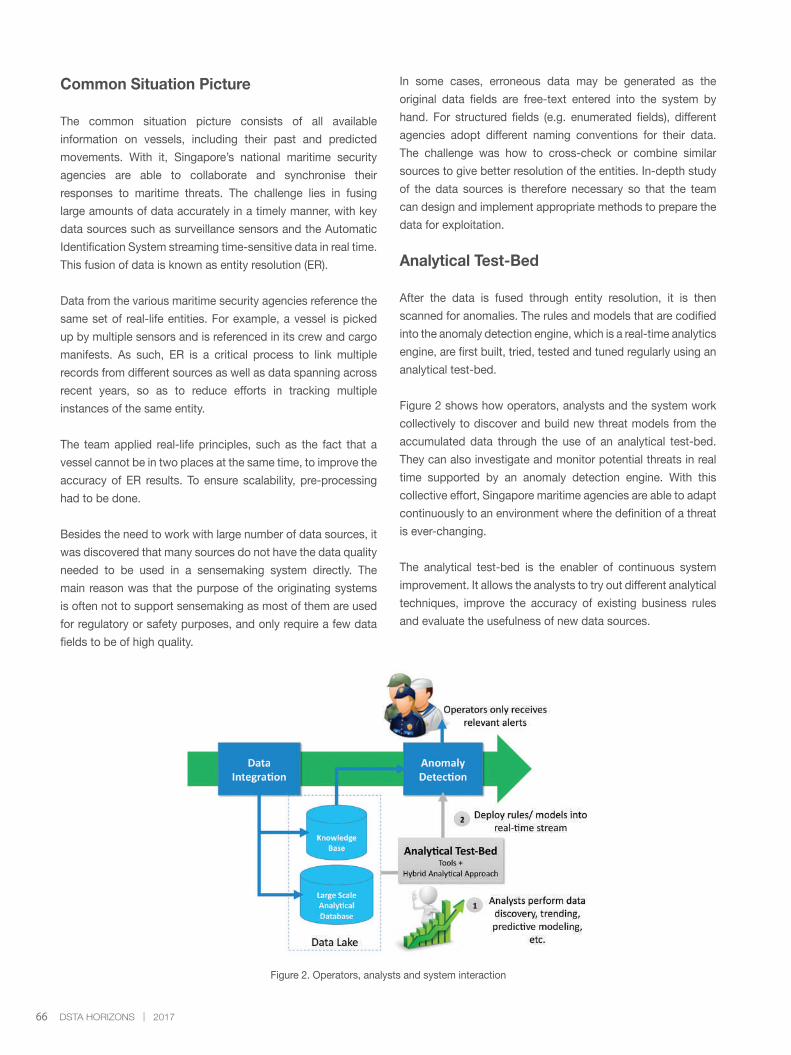
66 DSTA HORIZONS | 2017
Common Situation Picture
The common situation picture consists of all available
information on vessels, including their past and predicted
movements. With it, Singapore’s national maritime security
agencies are able to collaborate and synchronise their
responses to maritime threats. The challenge lies in fusing
large amounts of data accurately in a timely manner, with key
data sources such as surveillance sensors and the Automatic
Identification System streaming time-sensitive data in real time.
This fusion of data is known as entity resolution (ER).
Data from the various maritime security agencies reference the
same set of real-life entities. For example, a vessel is picked
up by multiple sensors and is referenced in its crew and cargo
manifests. As such, ER is a critical process to link multiple
records from different sources as well as data spanning across
recent years, so as to reduce efforts in tracking multiple
instances of the same entity.
The team applied real-life principles, such as the fact that a
vessel cannot be in two places at the same time, to improve the
accuracy of ER results. To ensure scalability, pre-processing
had to be done.
Besides the need to work with large number of data sources, it
was discovered that many sources do not have the data quality
needed to be used in a sensemaking system directly. The
main reason was that the purpose of the originating systems
is often not to support sensemaking as most of them are used
for regulatory or safety purposes, and only require a few data
fields to be of high quality.
In some cases, erroneous data may be generated as the
original data fields are free-text entered into the system by
hand. For structured fields (e.g. enumerated fields), different
agencies adopt different naming conventions for their data.
The challenge was how to cross-check or combine similar
sources to give better resolution of the entities. In-depth study
of the data sources is therefore necessary so that the team
can design and implement appropriate methods to prepare the
data for exploitation.
Analytical Test-Bed
After the data is fused through entity resolution, it is then
scanned for anomalies. The rules and models that are codified
into the anomaly detection engine, which is a real-time analytics
engine, are first built, tried, tested and tuned regularly using an
analytical test-bed.
Figure 2 shows how operators, analysts and the system work
collectively to discover and build new threat models from the
accumulated data through the use of an analytical test-bed.
They can also investigate and monitor potential threats in real
time supported by an anomaly detection engine. With this
collective effort, Singapore maritime agencies are able to adapt
continuously to an environment where the definition of a threat
is ever-changing.
The analytical test-bed is the enabler of continuous system
improvement. It allows the analysts to try out different analytical
techniques, improve the accuracy of existing business rules
and evaluate the usefulness of new data sources.
Figure 2. Operators, analysts and system interaction
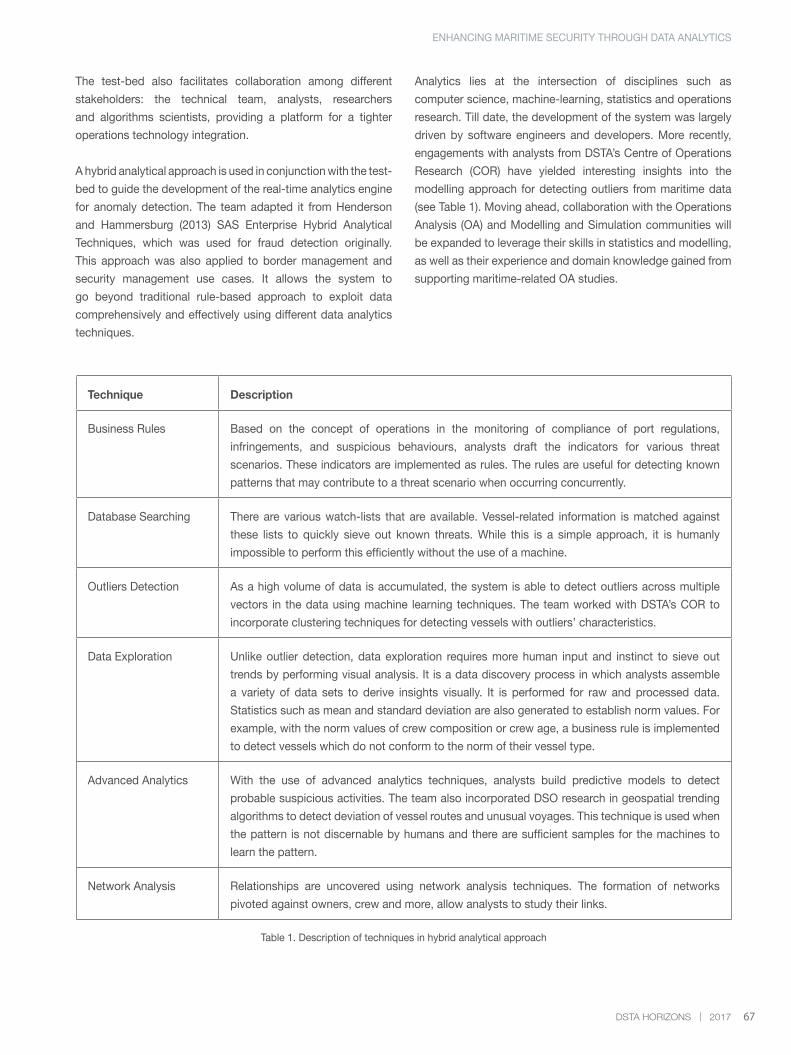
67DSTA HORIZONS | 2017
The test-bed also facilitates collaboration among different
stakeholders: the technical team, analysts, researchers
and algorithms scientists, providing a platform for a tighter
operations technology integration.
A hybrid analytical approach is used in conjunction with the test-
bed to guide the development of the real-time analytics engine
for anomaly detection. The team adapted it from Henderson
and Hammersburg (2013) SAS Enterprise Hybrid Analytical
Techniques, which was used for fraud detection originally.
This approach was also applied to border management and
security management use cases. It allows the system to
go beyond traditional rule-based approach to exploit data
comprehensively and effectively using different data analytics
techniques.
Analytics lies at the intersection of disciplines such as
computer science, machine-learning, statistics and operations
research. Till date, the development of the system was largely
driven by software engineers and developers. More recently,
engagements with analysts from DSTA’s Centre of Operations
Research (COR) have yielded interesting insights into the
modelling approach for detecting outliers from maritime data
(see Table 1). Moving ahead, collaboration with the Operations
Analysis (OA) and Modelling and Simulation communities will
be expanded to leverage their skills in statistics and modelling,
as well as their experience and domain knowledge gained from
supporting maritime-related OA studies.
ENHANCING MARITIME SECURITY THROUGH DATA ANALYTICS
Technique Description
Business Rules Based on the concept of operations in the monitoring of compliance of port regulations,
infringements, and suspicious behaviours, analysts draft the indicators for various threat
scenarios. These indicators are implemented as rules. The rules are useful for detecting known
patterns that may contribute to a threat scenario when occurring concurrently.
Database Searching There are various watch-lists that are available. Vessel-related information is matched against
these lists to quickly sieve out known threats. While this is a simple approach, it is humanly
impossible to perform this efficiently without the use of a machine.
Outliers Detection As a high volume of data is accumulated, the system is able to detect outliers across multiple
vectors in the data using machine learning techniques. The team worked with DSTA’s COR to
incorporate clustering techniques for detecting vessels with outliers’ characteristics.
Data Exploration Unlike outlier detection, data exploration requires more human input and instinct to sieve out
trends by performing visual analysis. It is a data discovery process in which analysts assemble
a variety of data sets to derive insights visually. It is performed for raw and processed data.
Statistics such as mean and standard deviation are also generated to establish norm values. For
example, with the norm values of crew composition or crew age, a business rule is implemented
to detect vessels which do not conform to the norm of their vessel type.
Advanced Analytics With the use of advanced analytics techniques, analysts build predictive models to detect
probable suspicious activities. The team also incorporated DSO research in geospatial trending
algorithms to detect deviation of vessel routes and unusual voyages. This technique is used when
the pattern is not discernable by humans and there are sufficient samples for the machines to
learn the pattern.
Network Analysis Relationships are uncovered using network analysis techniques. The formation of networks
pivoted against owners, crew and more, allow analysts to study their links.
Table 1. Description of techniques in hybrid analytical approach
68 DSTA HORIZONS | 2017
Deriving Actionable Intelligence
With the help of the analytical test-bed, the rules and models for
anomaly detection are more complex and would change over
time to suit the dynamic real world environment. Furthermore,
there is no uniformity across the data sources – each data
source has its own update rate and latency, resulting in the
order of observations across data sources to arrive at the
system in a dynamic manner.
It would take a lot of coding and software engineering of
the highest level to code the rules using any of the popular
procedural or object-oriented languages such as Java, thus
making the system hard to manage and maintain. Instead, the
team used complex event processing technology to detect
anomalies in data streams.
Anomalies are deviations from normalcy, which is the usual
behaviour for each and every entity such as a vessel and crew,
established across multi-year data. Normalcy can also be
seasonal trends, such as the typical percentage of a particular
class of vessels in anchorage on a daily or weekly basis.
With thousands of records arriving every second, there are
billions of records every month to work with for the generation
of normalcy. Even though representations of normalcy are
generated using batch workflows, the team had to introduce
several techniques to ensure that the execution time of the
batch workflows remain reasonable.
CONCLUSION
This article has highlighted some ways in which data analytics
has been used to detect suspicious vessels in the complex and
busy maritime environment of Singapore.
Data analytics provide the game-changing capability to sieve
through voluminous data, flag out potential threats and derive
useful insights. In spite of the progress made on the use of
advanced data analytics techniques, rules continue to play a
central role in sensemaking. The use of multiple data sources to
cross-validate observations will improve the accuracy of both
the situation picture and the detection of suspicious vessels.
In the development of the system, the team has tackled various
challenges and identified several areas to improve with further
research and technology injection.
ACKNOWLEDGEMENTS
The authors would like to acknowledge the members from
DSO led by Mr Chionh Wei Peng and Samuel Mui, as well as
the members from ST Electronics led by Mr Low Yee Loong
for their partnership in the development of the NMSS. The
authors would also like to thank Mr Lim Yeng Kiat, Mr Ng Zhi
Da, Ms Tammi Yeo and Mr Chng You Cheng from DSTA’s COR
for their contributions in applying OA techniques for maritime
data exploration. Lastly, the authors would like to express their
appreciation to the analysts and operators from RSN and other
maritime agencies for providing their expert knowledge and
valuable inputs during the system prototyping and operation
of the NMSS.
REFERENCES
Henderson, G., & Hammersburg, C. (2013). An enterprise approach
to fraud detection and prevention in government programs. Retrieved
from http://www.rockinst.org/forumsandevents/audio/2013-11-06/
fraud_wp.pdf
Lambda architecture. (n.d.). In Wikipedia. Retrieved September
20, 2016, from https://en.wikipedia.org/wiki/Lambda_architecture
Luckham, D. (2002). The power of events: An introduction to
complex event processing in distributed enterprise systems.
Boston, MA: Addison-Wesley Professional.
Maritime and Port Authority of Singapore (MPA). (2017).
Facts and trivia. Retrieved from http://www.mpa.gov.sg/web/
portal/home/maritime-singapore/introduction-to-maritime-
singapore/facts-and-trivia
Marz, N., & Warren, J. (2013). Big data: Principles and best
practices of scalable realtime data systems. Shelter Island, New
York: Manning Publications.
Scikit-learn. (n.d.). Choosing the right estimator. Retrieved from
http://scikit-learn.org/stable/tutorial/machine_learning_map/
index.html
ENDNOTES
1 Lambda architecture is a data-processing architecture
designed to handle massive quantities of data by taking
advantage of both batch- and stream-processing methods.
69DSTA HORIZONS | 2017
This approach to architecture attempts to balance latency,
throughput, and fault-tolerance by using batch processing
to provide comprehensive and accurate views of batch data,
while simultaneously using real-time stream processing to
provide views of online data.
BIOGRAPHY
LIM Ching Wu Leslie is a Development
Manager (C4I Development) who is currently
working on the development of maritime
security command and control systems. He
previously led teams in the development of
intelligence sensemaking systems for DSTA,
and is a certified and practising Scrum
Master and Scrum Product Owner. He was
also part of the team that won the Defence Technology Prize Team
(Engineering) Award in 2006 for the Intelligence Grid project. Leslie
graduated with a Bachelor of Engineering (Computer Engineering)
degree with Honours from Nanyang Technological University in
2005. He further obtained a Master of Science (Management of
Technology) degree from the National University of Singapore
(NUS) in 2008.
TAN Chin Koon Adams is a Principal
Engineer (C4I Development) who is involved
in the development of data analytics
capabilities in the maritime security domain.
He has previously led the design and
implementation of system architecture in
command and control systems in various
domains including maritime security,
intelligence as well as humanitarian and disaster relief. Adams
spearheaded the adoption of big data technologies to analyse
huge volume of data collected from public domain sources
through an open source intelligence sensemaking system. Adams
graduated with a Bachelor of Computing (Systems Development
and Multimedia) degree from Monash University, Australia, in 2002.
KANG Shian Chin is Head Digital Innovation
(Logistics) in Enterprise IT. He was
previously a Development Manager in the
C4I Development Programme Centre, where
he was involved in the creation of a maritime
security command and control systems.
Shian Chin graduated with a Diplome
d’Ingenieur in Mechanical and Electrical
Engineering from Ecole Speciale des Travaux Publiques, France,
in 2005. He further obtained a Master of Science (Industrial and
Systems Engineering) degree from NUS in 2009. In 2015, Shian
Chin attained a Master of Science (Computer Science) degree
from the Naval Postgraduate School, USA, where he received the
RADM Grace Murray Hopper Award for outstanding academic and
leadership accomplishments in the study of Computer Science.
HO Cheeng Tse is a Development
Programme Manager (C4I Development)
overseeing the development of maritime
security command and control systems for
the Republic of Singapore Navy and the
Police Coast Guard. Cheeng Tse graduated
with a Bachelor of Science (Computer
Engineering) degree and a Master of Science
(Electrical and Computer Engineering) degree from the University of
Illinois at Urbana-Champaign, USA, in 2006 and 2007 respectively.
ENHANCING MARITIME SECURITY THROUGH DATA ANALYTICS
70 DSTA HORIZONS | 2017
RADIO FREQUENCY MAPPING: AN ADAPTIVE APPROACH TO MITIGATE SATCOM-RADAR WARNING RECEIVER ELECTROMAGNETIC INTERFERENCEGOEI Sang Lang, NG Li Yun Iris, CHUNG Heng Hong
ABSTRACT
Military airborne platforms fitted with fire control radars and satellite communications (SATCOM) usually operate at the X band and Ku band frequencies. However, these active transmissions would cause interference with radar warning receivers due to their wider C band to K band radio frequency (RF) spectrum operation. As each system is dedicated to performing a particular function, there is a need to ensure coexistence and interoperability among them by adopting an adaptive approach to mitigate the RF interference. Drawing from past experiences involving a helicopter upgrade programme, this article illustrates a DSTA team’s efforts in implementing a RF compatibility solution to manage SATCOM transmissions.
Keywords: SATCOM, RWR, interoperability, blanking, look-through
INTRODUCTION
A helicopter upgrade programme had called for the additional
integration of a radar warning receiver (RWR) and a satellite
communications (SATCOM) system. As both systems operate
in the same frequency region, the SATCOM transmission would
interfere and degrade the sensor’s detection performance
due to in-band interference. This could potentially leave the
helicopter unprotected during SATCOM transmissions.
To tackle this issue, a team from DSTA reviewed several ideas
such as the traditional blanking scheme, look-through scheme
as well as installation of fairing to block the line-of-sight (LOS)
between the SATCOM and RWR antennas. However, none of
the solutions could enable the SATCOM and RWR to coexist
and interoperate satisfactorily.
This article presents the interference problem encountered by
the mission systems on board the helicopter, the approach to
solution development and the technical challenges involved.
INTEROPERABILITY CHALLENGES
The SATCOM system to be installed operates in Ku band, while
the RWR is a wide band receiver that detects radio frequency
(RF) emitters ranging from C band to K band. Due to the slight
overlap in the frequency spectrum, the SATCOM transmission
could potentially cause in-band interference with the RWR. If
left unaddressed, this interference could degrade the RWR’s
sensitivity and affect its operational performance, adversely
influencing its threat warning capability as well as increasing
the number of false alarms during SATCOM transmission. The
close proximity between the antennas of the SATCOM and
RWR on board the helicopter also made it challenging to have
sufficient RF isolation. To determine the level of interference
that the SATCOM transmission had on the RWR, an isolation
map was created to establish the severity of interference by
quantifying the amount of RF isolation available between the
antennas. The extent of isolation is dependent on the amount
of SATCOM transmitted power in decibel (dB) that would be
received by the RWR after accounting for the free space loss,
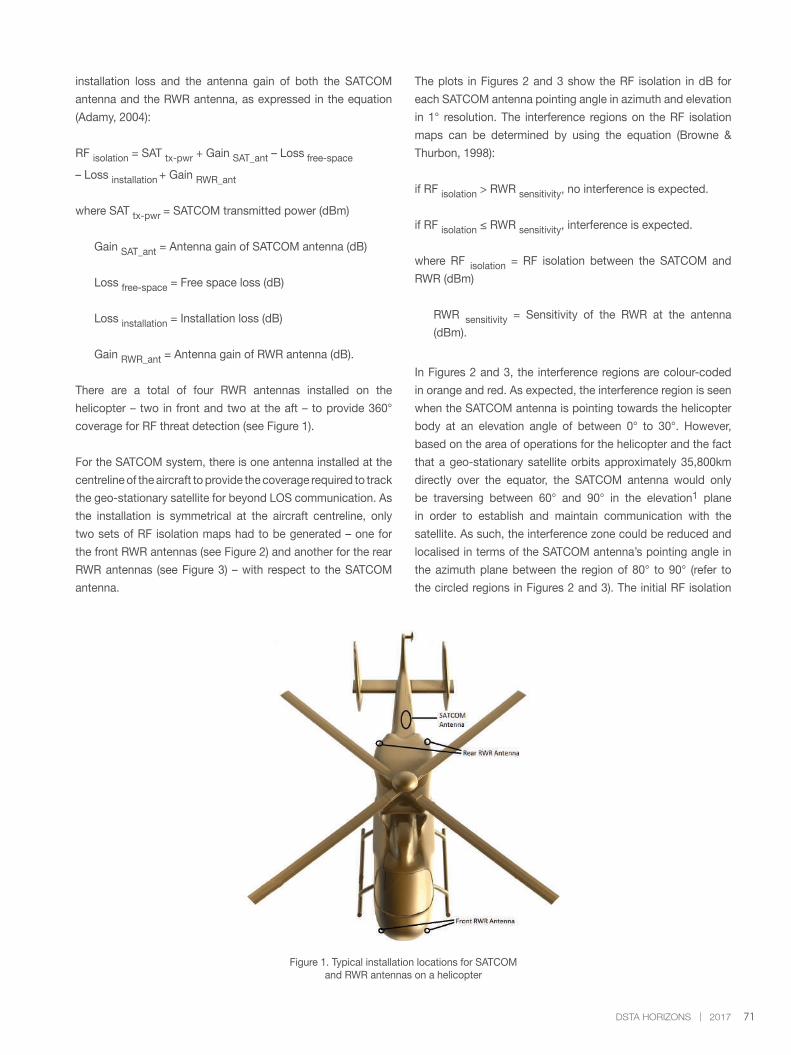
71DSTA HORIZONS | 2017
installation loss and the antenna gain of both the SATCOM
antenna and the RWR antenna, as expressed in the equation
(Adamy, 2004):
RF isolation = SAT tx-pwr + Gain SAT_ant – Loss free-space
– Loss installation + Gain RWR_ant
where SAT tx-pwr = SATCOM transmitted power (dBm)
Gain SAT_ant = Antenna gain of SATCOM antenna (dB)
Loss free-space = Free space loss (dB)
Loss installation = Installation loss (dB)
Gain RWR_ant = Antenna gain of RWR antenna (dB).
There are a total of four RWR antennas installed on the
helicopter – two in front and two at the aft – to provide 360°
coverage for RF threat detection (see Figure 1).
For the SATCOM system, there is one antenna installed at the
centreline of the aircraft to provide the coverage required to track
the geo-stationary satellite for beyond LOS communication. As
the installation is symmetrical at the aircraft centreline, only
two sets of RF isolation maps had to be generated – one for
the front RWR antennas (see Figure 2) and another for the rear
RWR antennas (see Figure 3) – with respect to the SATCOM
antenna.
The plots in Figures 2 and 3 show the RF isolation in dB for
each SATCOM antenna pointing angle in azimuth and elevation
in 1° resolution. The interference regions on the RF isolation
maps can be determined by using the equation (Browne &
Thurbon, 1998):
if RF isolation > RWR sensitivity, no interference is expected.
if RF isolation ≤ RWR sensitivity, interference is expected.
where RF isolation = RF isolation between the SATCOM and
RWR (dBm)
RWR sensitivity = Sensitivity of the RWR at the antenna
(dBm).
In Figures 2 and 3, the interference regions are colour-coded
in orange and red. As expected, the interference region is seen
when the SATCOM antenna is pointing towards the helicopter
body at an elevation angle of between 0° to 30°. However,
based on the area of operations for the helicopter and the fact
that a geo-stationary satellite orbits approximately 35,800km
directly over the equator, the SATCOM antenna would only
be traversing between 60° and 90° in the elevation1 plane
in order to establish and maintain communication with the
satellite. As such, the interference zone could be reduced and
localised in terms of the SATCOM antenna’s pointing angle in
the azimuth plane between the region of 80° to 90° (refer to
the circled regions in Figures 2 and 3). The initial RF isolation
Figure 1. Typical installation locations for SATCOMand RWR antennas on a helicopter
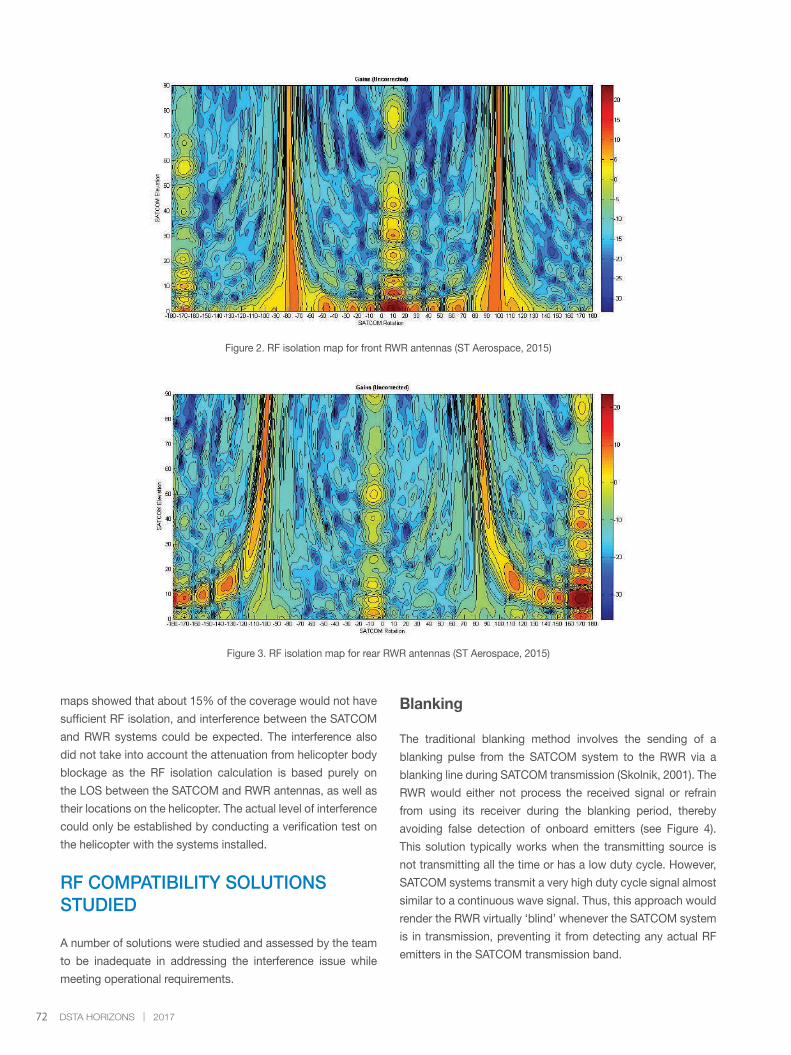
72 DSTA HORIZONS | 2017
Figure 2. RF isolation map for front RWR antennas (ST Aerospace, 2015)
Figure 3. RF isolation map for rear RWR antennas (ST Aerospace, 2015)
maps showed that about 15% of the coverage would not have
sufficient RF isolation, and interference between the SATCOM
and RWR systems could be expected. The interference also
did not take into account the attenuation from helicopter body
blockage as the RF isolation calculation is based purely on
the LOS between the SATCOM and RWR antennas, as well as
their locations on the helicopter. The actual level of interference
could only be established by conducting a verification test on
the helicopter with the systems installed.
RF COMPATIBILITY SOLUTIONS STUDIED
A number of solutions were studied and assessed by the team
to be inadequate in addressing the interference issue while
meeting operational requirements.
Blanking
The traditional blanking method involves the sending of a
blanking pulse from the SATCOM system to the RWR via a
blanking line during SATCOM transmission (Skolnik, 2001). The
RWR would either not process the received signal or refrain
from using its receiver during the blanking period, thereby
avoiding false detection of onboard emitters (see Figure 4).
This solution typically works when the transmitting source is
not transmitting all the time or has a low duty cycle. However,
SATCOM systems transmit a very high duty cycle signal almost
similar to a continuous wave signal. Thus, this approach would
render the RWR virtually ‘blind’ whenever the SATCOM system
is in transmission, preventing it from detecting any actual RF
emitters in the SATCOM transmission band.
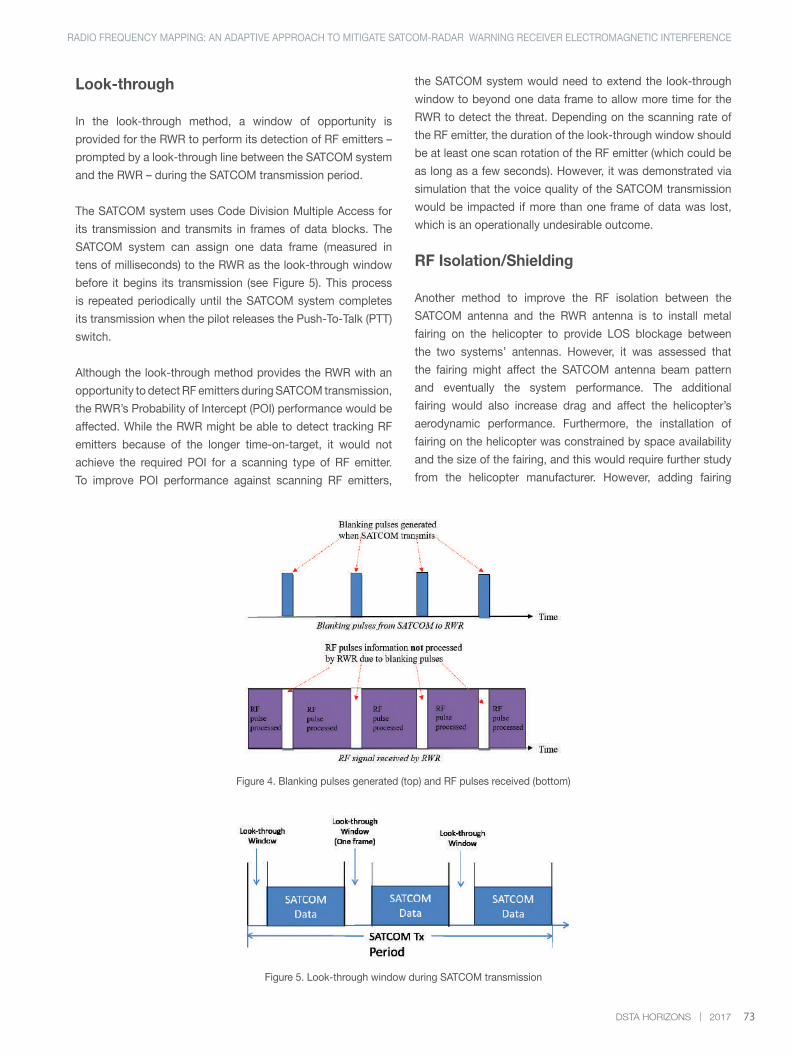
73DSTA HORIZONS | 2017
Look-through
In the look-through method, a window of opportunity is
provided for the RWR to perform its detection of RF emitters –
prompted by a look-through line between the SATCOM system
and the RWR – during the SATCOM transmission period.
The SATCOM system uses Code Division Multiple Access for
its transmission and transmits in frames of data blocks. The
SATCOM system can assign one data frame (measured in
tens of milliseconds) to the RWR as the look-through window
before it begins its transmission (see Figure 5). This process
is repeated periodically until the SATCOM system completes
its transmission when the pilot releases the Push-To-Talk (PTT)
switch.
Although the look-through method provides the RWR with an
opportunity to detect RF emitters during SATCOM transmission,
the RWR’s Probability of Intercept (POI) performance would be
affected. While the RWR might be able to detect tracking RF
emitters because of the longer time-on-target, it would not
achieve the required POI for a scanning type of RF emitter.
To improve POI performance against scanning RF emitters,
Figure 4. Blanking pulses generated (top) and RF pulses received (bottom)
the SATCOM system would need to extend the look-through
window to beyond one data frame to allow more time for the
RWR to detect the threat. Depending on the scanning rate of
the RF emitter, the duration of the look-through window should
be at least one scan rotation of the RF emitter (which could be
as long as a few seconds). However, it was demonstrated via
simulation that the voice quality of the SATCOM transmission
would be impacted if more than one frame of data was lost,
which is an operationally undesirable outcome.
RF Isolation/Shielding
Another method to improve the RF isolation between the
SATCOM antenna and the RWR antenna is to install metal
fairing on the helicopter to provide LOS blockage between
the two systems’ antennas. However, it was assessed that
the fairing might affect the SATCOM antenna beam pattern
and eventually the system performance. The additional
fairing would also increase drag and affect the helicopter’s
aerodynamic performance. Furthermore, the installation of
fairing on the helicopter was constrained by space availability
and the size of the fairing, and this would require further study
from the helicopter manufacturer. However, adding fairing
Figure 5. Look-through window during SATCOM transmission
RADIO FREQUENCY MAPPING: AN ADAPTIVE APPROACH TO MITIGATE SATCOM-RADAR WARNING RECEIVER ELECTROMAGNETIC INTERFERENCE
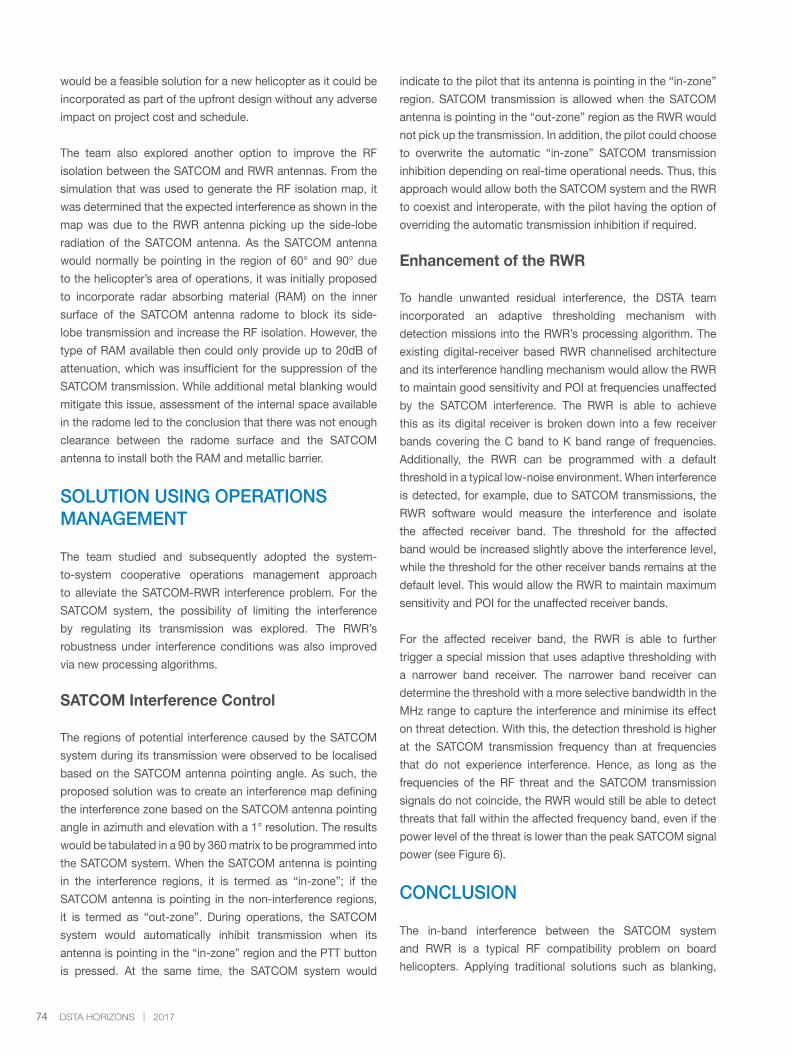
74 DSTA HORIZONS | 2017
would be a feasible solution for a new helicopter as it could be
incorporated as part of the upfront design without any adverse
impact on project cost and schedule.
The team also explored another option to improve the RF
isolation between the SATCOM and RWR antennas. From the
simulation that was used to generate the RF isolation map, it
was determined that the expected interference as shown in the
map was due to the RWR antenna picking up the side-lobe
radiation of the SATCOM antenna. As the SATCOM antenna
would normally be pointing in the region of 60° and 90° due
to the helicopter’s area of operations, it was initially proposed
to incorporate radar absorbing material (RAM) on the inner
surface of the SATCOM antenna radome to block its side-
lobe transmission and increase the RF isolation. However, the
type of RAM available then could only provide up to 20dB of
attenuation, which was insufficient for the suppression of the
SATCOM transmission. While additional metal blanking would
mitigate this issue, assessment of the internal space available
in the radome led to the conclusion that there was not enough
clearance between the radome surface and the SATCOM
antenna to install both the RAM and metallic barrier.
SOLUTION USING OPERATIONS MANAGEMENT
The team studied and subsequently adopted the system-
to-system cooperative operations management approach
to alleviate the SATCOM-RWR interference problem. For the
SATCOM system, the possibility of limiting the interference
by regulating its transmission was explored. The RWR’s
robustness under interference conditions was also improved
via new processing algorithms.
SATCOM Interference Control
The regions of potential interference caused by the SATCOM
system during its transmission were observed to be localised
based on the SATCOM antenna pointing angle. As such, the
proposed solution was to create an interference map defining
the interference zone based on the SATCOM antenna pointing
angle in azimuth and elevation with a 1° resolution. The results
would be tabulated in a 90 by 360 matrix to be programmed into
the SATCOM system. When the SATCOM antenna is pointing
in the interference regions, it is termed as “in-zone”; if the
SATCOM antenna is pointing in the non-interference regions,
it is termed as “out-zone”. During operations, the SATCOM
system would automatically inhibit transmission when its
antenna is pointing in the “in-zone” region and the PTT button
is pressed. At the same time, the SATCOM system would
indicate to the pilot that its antenna is pointing in the “in-zone”
region. SATCOM transmission is allowed when the SATCOM
antenna is pointing in the “out-zone” region as the RWR would
not pick up the transmission. In addition, the pilot could choose
to overwrite the automatic “in-zone” SATCOM transmission
inhibition depending on real-time operational needs. Thus, this
approach would allow both the SATCOM system and the RWR
to coexist and interoperate, with the pilot having the option of
overriding the automatic transmission inhibition if required.
Enhancement of the RWR
To handle unwanted residual interference, the DSTA team
incorporated an adaptive thresholding mechanism with
detection missions into the RWR’s processing algorithm. The
existing digital-receiver based RWR channelised architecture
and its interference handling mechanism would allow the RWR
to maintain good sensitivity and POI at frequencies unaffected
by the SATCOM interference. The RWR is able to achieve
this as its digital receiver is broken down into a few receiver
bands covering the C band to K band range of frequencies.
Additionally, the RWR can be programmed with a default
threshold in a typical low-noise environment. When interference
is detected, for example, due to SATCOM transmissions, the
RWR software would measure the interference and isolate
the affected receiver band. The threshold for the affected
band would be increased slightly above the interference level,
while the threshold for the other receiver bands remains at the
default level. This would allow the RWR to maintain maximum
sensitivity and POI for the unaffected receiver bands.
For the affected receiver band, the RWR is able to further
trigger a special mission that uses adaptive thresholding with
a narrower band receiver. The narrower band receiver can
determine the threshold with a more selective bandwidth in the
MHz range to capture the interference and minimise its effect
on threat detection. With this, the detection threshold is higher
at the SATCOM transmission frequency than at frequencies
that do not experience interference. Hence, as long as the
frequencies of the RF threat and the SATCOM transmission
signals do not coincide, the RWR would still be able to detect
threats that fall within the affected frequency band, even if the
power level of the threat is lower than the peak SATCOM signal
power (see Figure 6).
CONCLUSION
The in-band interference between the SATCOM system
and RWR is a typical RF compatibility problem on board
helicopters. Applying traditional solutions such as blanking,
75DSTA HORIZONS | 2017
look-through and fairing shield cannot resolve the interference
issue and meet the operational requirements concurrently.
An innovative approach was hence conceived by the DSTA
team to address the interference problem by implementing
a RF isolation map to limit the impact of interference and
improve the RWR’s detection robustness to handle such an
environment. This system-to-system cooperative management
approach was the first of its kind used in the handling of in-
band interference issues. Furthermore, it avoided changes to
the helicopter’s installation or redesign of RWR hardware which
would be costly and potentially affect the project schedule.
The proposed solution is also suitable for other platform types
equipped with SATCOM and RWR (or passive receiver).
ACKNOWLEDGEMENTS
The authors would like to thank Mr Low Boon Chew and ST
Aerospace’s Engineering and Development Centre for their
assistance in preparation of this article.
REFERENCES
Adamy, D. L. (2004). EW 102: A second course in electronic
warfare. Boston: Artech House.
Browne, J. P. R., & Thurbon, M. T. (1998). Electronic warfare
(Brassey’s Air Power: Aircraft Weapons Systems & Technology
Series Volume 4). London, Washington: Brassey’s.
Skolnik, M. I. (2001). Introduction to radar systems (3rd ed.).
Boston: McGraw Hill.
ST Aerospace. (2015). Clarification of RF isolation: coupling for
the SATCOM to RWR antenna [Memo]. Singapore: Author.
ENDNOTES
1 An elevation of 90° means that the SATCOM antenna
is pointing up, while an elevation of 0° means the antenna
is pointing horizontally. An azimuth of 0° indicates that the
SATCOM antenna is pointing forward towards the nose of the
aircraft. Negative and positive degree azimuth means that the
SATCOM antenna is pointing towards the left and right side of
the aircraft respectively.
BIOGRAPHY
GOEI Sang Lang is a Principal Engineer
(Air Systems) and the lead integrator for
electronic systems on board helicopters. He
was also a Project Manager for helicopter
acquisition projects. Sang Lang graduated
with a Bachelor of Engineering (Electrical
Engineering) degree from the National
University of Singapore (NUS) in 1997.
NG Li Yun Iris is a Senior Engineer
(Advanced Systems) involved in electronic
systems acquisition projects for helicopters.
Iris graduated with a Bachelor of Engineering
(Electrical and Electronic Engineering)
degree from Nanyang Technological
University in 2010.
CHUNG Heng Hong is Head Capability
Development (Advanced Systems) who
oversees electronic systems projects
across the Singapore Armed Forces. He
graduated with a Bachelor Of Technology
(Electronics Engineering) degree from
NUS in 1999.
Figure 6. Adaptive threshold mechanism
RADIO FREQUENCY MAPPING: AN ADAPTIVE APPROACH TO MITIGATE SATCOM-RADAR WARNING RECEIVER ELECTROMAGNETIC INTERFERENCE
76 DSTA HORIZONS | 2017
FINDING BALANCE IN PROTECTIVE DESIGN HENG Eu Chang Leonard, HO Chee Leong, YAP Yang Leng Ivan
ABSTRACT
In protective infrastructure design, building industry rules and regulations governing peacetime usage can sometimes run counter to the design intents for war. When designers try to meet regulatory requirements for both peacetime and also design for war, trade-offs often need to be made. However, the process of trade-offs produces buildings and infrastructures which are sub-optimal for either scenario. A dilemma thus occurs when a building infrastructure designer cannot find a way to fully satisfy both peacetime and wartime requirements for a building, and therefore has to manage trade-offs. Drawing from the context of prescribing fire safety in protective design, this article shows how such a dilemma may be resolved by adopting radically different approaches which involve technologies from non-building domains coupled with changing mindsets.
Keywords: design, trade-offs, dilemmas, balance
INTRODUCTION
Protective infrastructure, which includes buildings, roads,
water, power and communications utilities connecting the
building, is designed to withstand weaponised attacks and to
keep occupants, equipment and operations within the building
safe from associated weapon effects like bomb blasts. This
is traditionally achieved by limiting access to the building,
configuring ventilation points to reduce the impact of blasts,
and hardening building elements and systems.
Protective buildings house people through peace and war,
and are also governed by the same rules regulating all other
buildings in Singapore. However, some of these regulations
require the building to function in the exact opposite way to
what is required in protective design. This places designers in
a dilemma of having to choose peacetime over wartime design
considerations, which often leads to sub-optimal solutions.
TRADE-OFFS AND DILEMMAS IN DESIGN
Similar trade-offs also occur when designing for physical
security against intruders, versus ensuring the safe and rapid
escape of occupants in the event of a fire. In terms of fire safety
regulations, instead of keeping people in and threats out, fire
regulations function to allow people to exit and firefighters to
enter the building.
Fire Safety in Protective Design
Looking at fire safety and protective design in further detail, a
fire can occur if oxygen, fuel and heat are present.
When there is a fire, the assumptions are that people must
evacuate the building in the safest and fastest way. In addition,
the fire must not spread out of control and that firefighters need
to be able to put it out safely and effectively by entering the
building swiftly to remove heat and if possible, oxygen and fuel.
Keeping building contents undamaged and ensuring continuity
of operations in the building are often of lower priority.
Automated firefighting and fire management systems such as
automatic fire detectors, fire doors, exit staircases, smoke-stop
lobbies, emergency lighting, sprinklers, fire-rated dampers and
ducts, and smoke control fans are incorporated into buildings
which have been divided into fire-rated compartments. When
a fire occurs, the inherent fire compartments, fire doors and
exit staircases all serve to contain the fire within the affected
locations, and to maintain a protected egress and ingress
route for building occupants and firefighters, respectively.
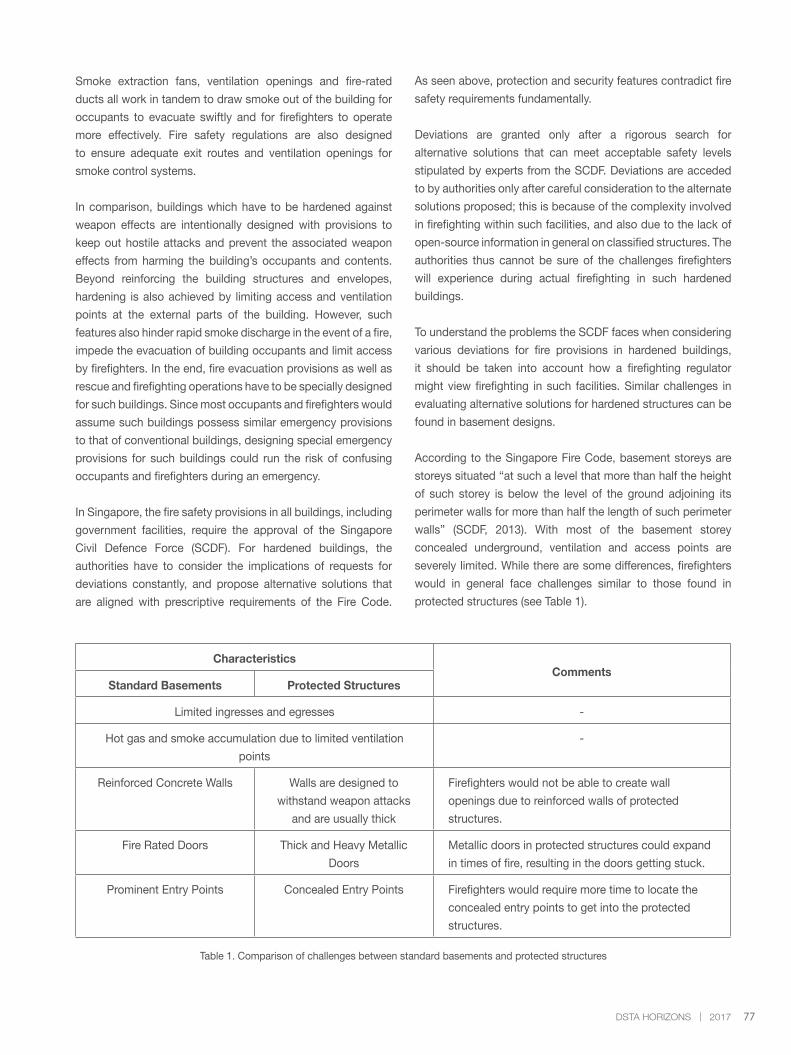
77DSTA HORIZONS | 2017
Smoke extraction fans, ventilation openings and fire-rated
ducts all work in tandem to draw smoke out of the building for
occupants to evacuate swiftly and for firefighters to operate
more effectively. Fire safety regulations are also designed
to ensure adequate exit routes and ventilation openings for
smoke control systems.
In comparison, buildings which have to be hardened against
weapon effects are intentionally designed with provisions to
keep out hostile attacks and prevent the associated weapon
effects from harming the building’s occupants and contents.
Beyond reinforcing the building structures and envelopes,
hardening is also achieved by limiting access and ventilation
points at the external parts of the building. However, such
features also hinder rapid smoke discharge in the event of a fire,
impede the evacuation of building occupants and limit access
by firefighters. In the end, fire evacuation provisions as well as
rescue and firefighting operations have to be specially designed
for such buildings. Since most occupants and firefighters would
assume such buildings possess similar emergency provisions
to that of conventional buildings, designing special emergency
provisions for such buildings could run the risk of confusing
occupants and firefighters during an emergency.
In Singapore, the fire safety provisions in all buildings, including
government facilities, require the approval of the Singapore
Civil Defence Force (SCDF). For hardened buildings, the
authorities have to consider the implications of requests for
deviations constantly, and propose alternative solutions that
are aligned with prescriptive requirements of the Fire Code.
As seen above, protection and security features contradict fire
safety requirements fundamentally.
Deviations are granted only after a rigorous search for
alternative solutions that can meet acceptable safety levels
stipulated by experts from the SCDF. Deviations are acceded
to by authorities only after careful consideration to the alternate
solutions proposed; this is because of the complexity involved
in firefighting within such facilities, and also due to the lack of
open-source information in general on classified structures. The
authorities thus cannot be sure of the challenges firefighters
will experience during actual firefighting in such hardened
buildings.
To understand the problems the SCDF faces when considering
various deviations for fire provisions in hardened buildings,
it should be taken into account how a firefighting regulator
might view firefighting in such facilities. Similar challenges in
evaluating alternative solutions for hardened structures can be
found in basement designs.
According to the Singapore Fire Code, basement storeys are
storeys situated “at such a level that more than half the height
of such storey is below the level of the ground adjoining its
perimeter walls for more than half the length of such perimeter
walls” (SCDF, 2013). With most of the basement storey
concealed underground, ventilation and access points are
severely limited. While there are some differences, firefighters
would in general face challenges similar to those found in
protected structures (see Table 1).
CharacteristicsComments
Standard Basements Protected Structures
Limited ingresses and egresses -
Hot gas and smoke accumulation due to limited ventilation
points
-
Reinforced Concrete Walls Walls are designed to
withstand weapon attacks
and are usually thick
Firefighters would not be able to create wall
openings due to reinforced walls of protected
structures.
Fire Rated Doors Thick and Heavy Metallic
Doors
Metallic doors in protected structures could expand
in times of fire, resulting in the doors getting stuck.
Prominent Entry Points Concealed Entry Points Firefighters would require more time to locate the
concealed entry points to get into the protected
structures.
Table 1. Comparison of challenges between standard basements and protected structures
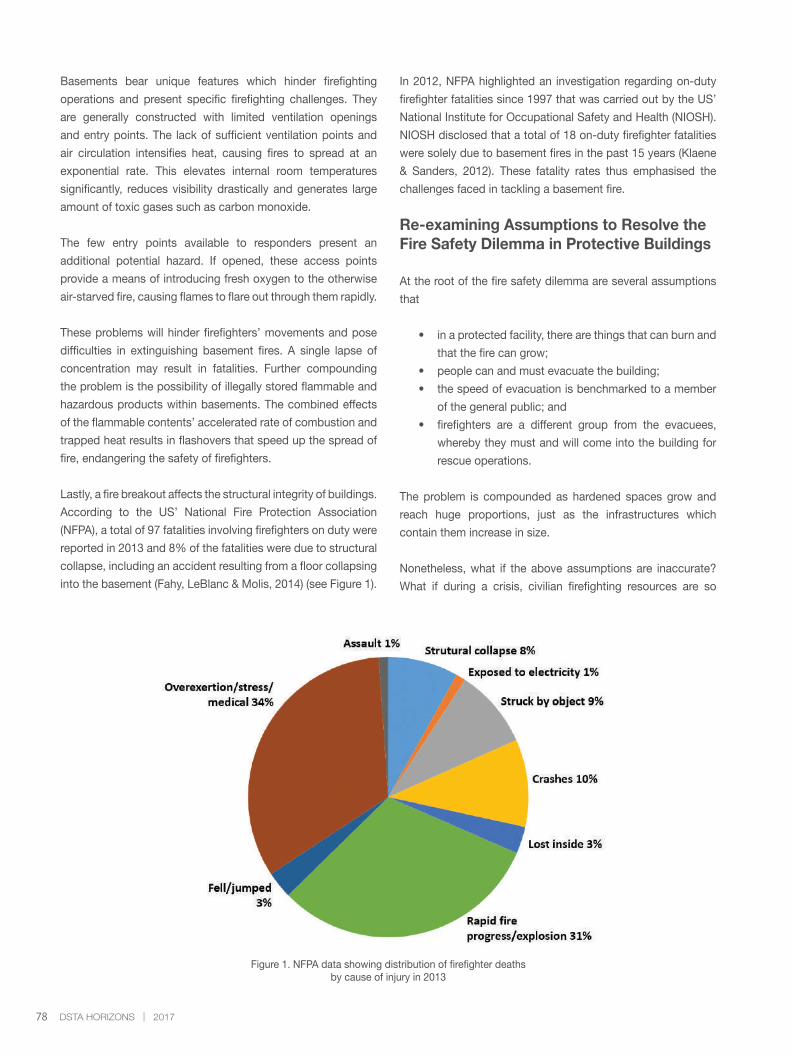
78 DSTA HORIZONS | 2017
Basements bear unique features which hinder firefighting
operations and present specific firefighting challenges. They
are generally constructed with limited ventilation openings
and entry points. The lack of sufficient ventilation points and
air circulation intensifies heat, causing fires to spread at an
exponential rate. This elevates internal room temperatures
significantly, reduces visibility drastically and generates large
amount of toxic gases such as carbon monoxide.
The few entry points available to responders present an
additional potential hazard. If opened, these access points
provide a means of introducing fresh oxygen to the otherwise
air-starved fire, causing flames to flare out through them rapidly.
These problems will hinder firefighters’ movements and pose
difficulties in extinguishing basement fires. A single lapse of
concentration may result in fatalities. Further compounding
the problem is the possibility of illegally stored flammable and
hazardous products within basements. The combined effects
of the flammable contents’ accelerated rate of combustion and
trapped heat results in flashovers that speed up the spread of
fire, endangering the safety of firefighters.
Lastly, a fire breakout affects the structural integrity of buildings.
According to the US’ National Fire Protection Association
(NFPA), a total of 97 fatalities involving firefighters on duty were
reported in 2013 and 8% of the fatalities were due to structural
collapse, including an accident resulting from a floor collapsing
into the basement (Fahy, LeBlanc & Molis, 2014) (see Figure 1).
Figure 1. NFPA data showing distribution of firefighter deaths by cause of injury in 2013
In 2012, NFPA highlighted an investigation regarding on-duty
firefighter fatalities since 1997 that was carried out by the US’
National Institute for Occupational Safety and Health (NIOSH).
NIOSH disclosed that a total of 18 on-duty firefighter fatalities
were solely due to basement fires in the past 15 years (Klaene
& Sanders, 2012). These fatality rates thus emphasised the
challenges faced in tackling a basement fire.
Re-examining Assumptions to Resolve the Fire Safety Dilemma in Protective Buildings
At the root of the fire safety dilemma are several assumptions
that
• in a protected facility, there are things that can burn and
that the fire can grow;
• people can and must evacuate the building;
• the speed of evacuation is benchmarked to a member
of the general public; and
• firefighters are a different group from the evacuees,
whereby they must and will come into the building for
rescue operations.
The problem is compounded as hardened spaces grow and
reach huge proportions, just as the infrastructures which
contain them increase in size.
Nonetheless, what if the above assumptions are inaccurate?
What if during a crisis, civilian firefighting resources are so
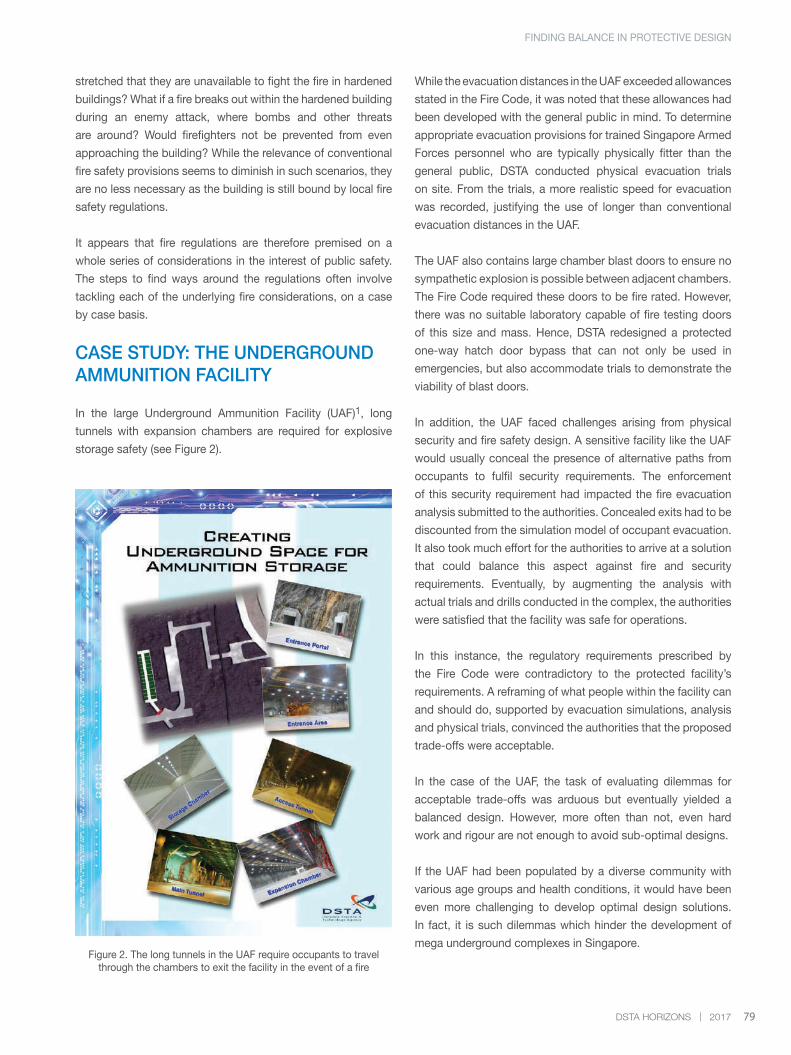
79DSTA HORIZONS | 2017
stretched that they are unavailable to fight the fire in hardened
buildings? What if a fire breaks out within the hardened building
during an enemy attack, where bombs and other threats
are around? Would firefighters not be prevented from even
approaching the building? While the relevance of conventional
fire safety provisions seems to diminish in such scenarios, they
are no less necessary as the building is still bound by local fire
safety regulations.
It appears that fire regulations are therefore premised on a
whole series of considerations in the interest of public safety.
The steps to find ways around the regulations often involve
tackling each of the underlying fire considerations, on a case
by case basis.
CASE STUDY: THE UNDERGROUND AMMUNITION FACILITY
In the large Underground Ammunition Facility (UAF)1, long
tunnels with expansion chambers are required for explosive
storage safety (see Figure 2).
Figure 2. The long tunnels in the UAF require occupants to travel through the chambers to exit the facility in the event of a fire
While the evacuation distances in the UAF exceeded allowances
stated in the Fire Code, it was noted that these allowances had
been developed with the general public in mind. To determine
appropriate evacuation provisions for trained Singapore Armed
Forces personnel who are typically physically fitter than the
general public, DSTA conducted physical evacuation trials
on site. From the trials, a more realistic speed for evacuation
was recorded, justifying the use of longer than conventional
evacuation distances in the UAF.
The UAF also contains large chamber blast doors to ensure no
sympathetic explosion is possible between adjacent chambers.
The Fire Code required these doors to be fire rated. However,
there was no suitable laboratory capable of fire testing doors
of this size and mass. Hence, DSTA redesigned a protected
one-way hatch door bypass that can not only be used in
emergencies, but also accommodate trials to demonstrate the
viability of blast doors.
In addition, the UAF faced challenges arising from physical
security and fire safety design. A sensitive facility like the UAF
would usually conceal the presence of alternative paths from
occupants to fulfil security requirements. The enforcement
of this security requirement had impacted the fire evacuation
analysis submitted to the authorities. Concealed exits had to be
discounted from the simulation model of occupant evacuation.
It also took much effort for the authorities to arrive at a solution
that could balance this aspect against fire and security
requirements. Eventually, by augmenting the analysis with
actual trials and drills conducted in the complex, the authorities
were satisfied that the facility was safe for operations.
In this instance, the regulatory requirements prescribed by
the Fire Code were contradictory to the protected facility’s
requirements. A reframing of what people within the facility can
and should do, supported by evacuation simulations, analysis
and physical trials, convinced the authorities that the proposed
trade-offs were acceptable.
In the case of the UAF, the task of evaluating dilemmas for
acceptable trade-offs was arduous but eventually yielded a
balanced design. However, more often than not, even hard
work and rigour are not enough to avoid sub-optimal designs.
If the UAF had been populated by a diverse community with
various age groups and health conditions, it would have been
even more challenging to develop optimal design solutions.
In fact, it is such dilemmas which hinder the development of
mega underground complexes in Singapore.
FINDING BALANCE IN PROTECTIVE DESIGN
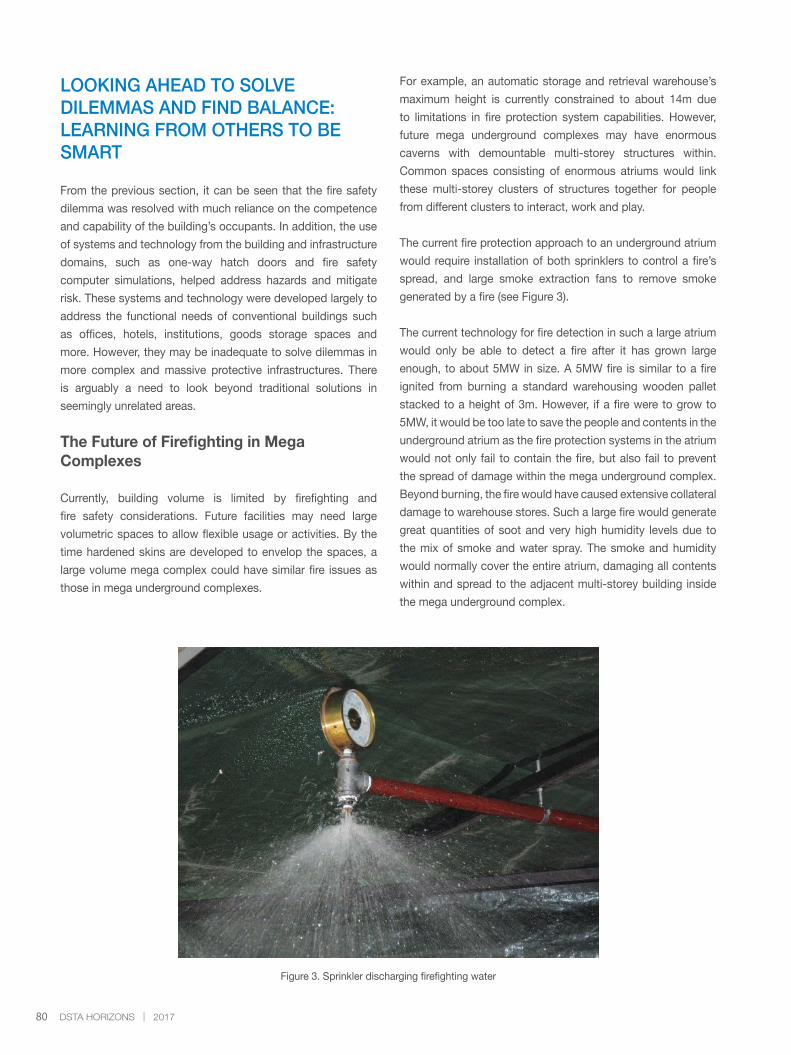
80 DSTA HORIZONS | 2017
LOOKING AHEAD TO SOLVE DILEMMAS AND FIND BALANCE: LEARNING FROM OTHERS TO BE SMART
From the previous section, it can be seen that the fire safety
dilemma was resolved with much reliance on the competence
and capability of the building’s occupants. In addition, the use
of systems and technology from the building and infrastructure
domains, such as one-way hatch doors and fire safety
computer simulations, helped address hazards and mitigate
risk. These systems and technology were developed largely to
address the functional needs of conventional buildings such
as offices, hotels, institutions, goods storage spaces and
more. However, they may be inadequate to solve dilemmas in
more complex and massive protective infrastructures. There
is arguably a need to look beyond traditional solutions in
seemingly unrelated areas.
The Future of Firefighting in Mega Complexes
Currently, building volume is limited by firefighting and
fire safety considerations. Future facilities may need large
volumetric spaces to allow flexible usage or activities. By the
time hardened skins are developed to envelop the spaces, a
large volume mega complex could have similar fire issues as
those in mega underground complexes.
For example, an automatic storage and retrieval warehouse’s
maximum height is currently constrained to about 14m due
to limitations in fire protection system capabilities. However,
future mega underground complexes may have enormous
caverns with demountable multi-storey structures within.
Common spaces consisting of enormous atriums would link
these multi-storey clusters of structures together for people
from different clusters to interact, work and play.
The current fire protection approach to an underground atrium
would require installation of both sprinklers to control a fire’s
spread, and large smoke extraction fans to remove smoke
generated by a fire (see Figure 3).
The current technology for fire detection in such a large atrium
would only be able to detect a fire after it has grown large
enough, to about 5MW in size. A 5MW fire is similar to a fire
ignited from burning a standard warehousing wooden pallet
stacked to a height of 3m. However, if a fire were to grow to
5MW, it would be too late to save the people and contents in the
underground atrium as the fire protection systems in the atrium
would not only fail to contain the fire, but also fail to prevent
the spread of damage within the mega underground complex.
Beyond burning, the fire would have caused extensive collateral
damage to warehouse stores. Such a large fire would generate
great quantities of soot and very high humidity levels due to
the mix of smoke and water spray. The smoke and humidity
would normally cover the entire atrium, damaging all contents
within and spread to the adjacent multi-storey building inside
the mega underground complex.
Figure 3. Sprinkler discharging firefighting water
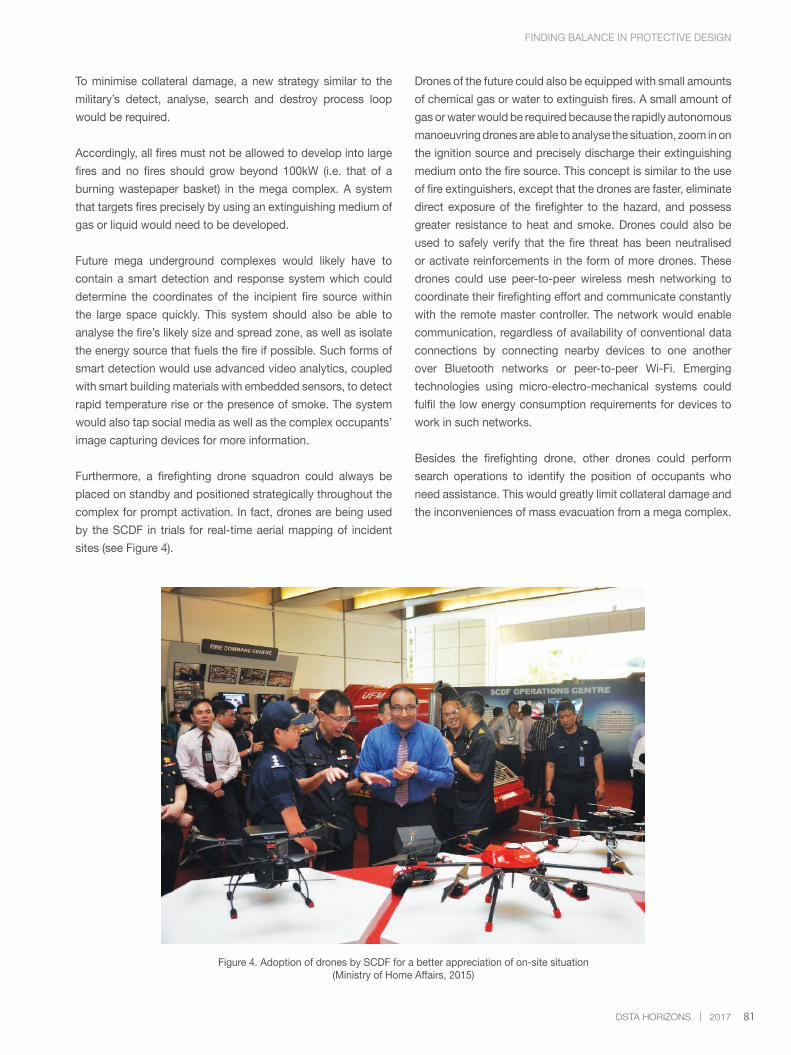
81DSTA HORIZONS | 2017
To minimise collateral damage, a new strategy similar to the
military’s detect, analyse, search and destroy process loop
would be required.
Accordingly, all fires must not be allowed to develop into large
fires and no fires should grow beyond 100kW (i.e. that of a
burning wastepaper basket) in the mega complex. A system
that targets fires precisely by using an extinguishing medium of
gas or liquid would need to be developed.
Future mega underground complexes would likely have to
contain a smart detection and response system which could
determine the coordinates of the incipient fire source within
the large space quickly. This system should also be able to
analyse the fire’s likely size and spread zone, as well as isolate
the energy source that fuels the fire if possible. Such forms of
smart detection would use advanced video analytics, coupled
with smart building materials with embedded sensors, to detect
rapid temperature rise or the presence of smoke. The system
would also tap social media as well as the complex occupants’
image capturing devices for more information.
Furthermore, a firefighting drone squadron could always be
placed on standby and positioned strategically throughout the
complex for prompt activation. In fact, drones are being used
by the SCDF in trials for real-time aerial mapping of incident
sites (see Figure 4).
Figure 4. Adoption of drones by SCDF for a better appreciation of on-site situation (Ministry of Home Affairs, 2015)
Drones of the future could also be equipped with small amounts
of chemical gas or water to extinguish fires. A small amount of
gas or water would be required because the rapidly autonomous
manoeuvring drones are able to analyse the situation, zoom in on
the ignition source and precisely discharge their extinguishing
medium onto the fire source. This concept is similar to the use
of fire extinguishers, except that the drones are faster, eliminate
direct exposure of the firefighter to the hazard, and possess
greater resistance to heat and smoke. Drones could also be
used to safely verify that the fire threat has been neutralised
or activate reinforcements in the form of more drones. These
drones could use peer-to-peer wireless mesh networking to
coordinate their firefighting effort and communicate constantly
with the remote master controller. The network would enable
communication, regardless of availability of conventional data
connections by connecting nearby devices to one another
over Bluetooth networks or peer-to-peer Wi-Fi. Emerging
technologies using micro-electro-mechanical systems could
fulfil the low energy consumption requirements for devices to
work in such networks.
Besides the firefighting drone, other drones could perform
search operations to identify the position of occupants who
need assistance. This would greatly limit collateral damage and
the inconveniences of mass evacuation from a mega complex.
FINDING BALANCE IN PROTECTIVE DESIGN
82 DSTA HORIZONS | 2017
Moreover, preventing large fires is beneficial to the environment
because it minimises the release of by-products from
combustion. It also reduces health threats to emergency
responders. Studies in the US (Willette, 2015) have found that,
products from combustion left on a fireman’s suit after a fire
incident could lead to later stages of cancer if they are not
removed thoroughly.
All in all, mega complexes could be built with unprecedented
high levels of fire safety and greatly reduce risks to firefighting
personnel.
However, the application of technology needs to be nestled
within a larger design framework to ensure coherence. One
possible framework to draw inspiration from may be that of the
human body.
Consider how the body can sense and interact with the
environment, shutting out or moderating harmful effects to
maintain its core functions. For example, humans instinctively
squint to reduce glare from bright lights and cover their ears
to reduce loud noises. In short, when a threat is detected,
the human body is designed to process the sensed data and
respond by reflex to preserve itself. Internally, the human body
has ways to heal injuries to a certain extent, and possesses
an immune system which sends white blood cells to affected
locations to protect the body from infectious diseases before
they cause appreciable damage. All of these functions are
controlled by the brain.
Similarly, a building has to be protected against various
weapon effects under all sorts of harmful environments, while
performing various functions and complying with many other
key considerations of peacetime usage such as fire, ventilation,
accessibility and more. Drawing inspiration from the design of
the human body, what is lacking in protective design is arguably
the ability to sense and respond to threats.
Building on the scenario of firefighting in future mega
complexes, complexes equipped with sensors would allow
them to respond to incipient fires before damage becomes
significant enough to affect business continuity. They might
also be designed to open or close different access points
automatically, and to have air flow directions and smoke
extraction systems adjusted depending on the fire’s spread
so that people, equipment and operations could remain safe
and secure. In hardened designs, technologies might also be
applied for protective purposes. If active defence systems
were built into the complexes, certain access points could be
opened to isolate and redirect fires while the systems provide
point coverage over these areas, thereby ensuring a balance
between protection and firefighting.
Firefighting drones that respond to instructions from a
centralised control and monitoring system would then serve as
the building’s ‘white blood cells’, targeting affected areas upon
detection.
In the future, technologies in buildings could evolve even
further to provide buildings with the ability to think, decide and
deploy autonomous means of repair. Advances in technology
could also be applied to solve design dilemmas of other types
of military buildings, such as those which arise from operations,
security, fire safety and ammunition safety.
CONCLUSION
Finding balance in design and solving dilemmas does not
rely solely on science and technology. Instead, a key enabler
lies in getting stakeholders and agencies on board to build a
shared vision and form a community that has the collective
will to revise bureaucratic and prescriptive regulations, but
will not accept any sub-optimal solutions from trade-offs. This
community has to search deep within every set of building
requirements to produce designs which integrate technologies
across domains, unfettered by building traditions, to produce
buildings which meet both peacetime and wartime needs.
REFERENCES
Fahy, R. F., LeBlanc, P. R., & Molis, J. L. (2014). Firefighter
fatalities in the United States - 2013. Quincy, MA: National Fire
Protection Association.
Klaene, B., & Sanders, R. (2012). Cellar threat: The challenge of
fighting basement fires. NFPA Journal, Sep/Oct.
Ministry of Home Affairs. (2015). SCDF Workplan 2015: Paving
the way forward with technology and community engagement
[Online image]. Retrieved January 13, 2017 from https://www.
hometeam.sg/article.aspx?news_sid=20150420ZnfTOI67o0Ie
Singapore Civil Defence Force. (2013). Fire code. Singapore:
SCDF.
Willette, K. (2015). The exposure factor: Firefighting, hazardous
environments, and NFPA standards. NFPA Journal, May/Jun.
83DSTA HORIZONS | 2017
ENDNOTES
1 The UAF is an underground facility carved out of a granite
rock quarry, and houses storage chambers which store
ammunition. The UAF was designed with long tunnels and
expansion chambers, such that in the event of any accidental
detonation of the ammunition in a storage chamber, the blast
and fragmentation effects are attenuated in a manner which
would prevent it from detonating the ammunition stored in
other chambers.
BIOGRAPHY
HENG Eu Chang Leonard is a Deputy
Director (Building and Infrastructure) in
charge of all technology aspects of building
and infrastructure. Leonard graduated with
a Bachelor of Engineering (Civil Engineering)
degree with Honours from the National
University of Singapore (NUS) in 1988 and
Masters in Weapons Effects on Structures
(RMCS-Cranfield University, UK) in 1993 and in Geotechnical
Engineering (NUS) in 2011.
HO Chee Leong is a Programme Manager
(Building and Infrastructure) who oversees
the development of mechanical building
services, systems and infrastructure within
airbases. Chee Leong graduated with
a Bachelor of Engineering (Mechanical
Engineering) degree with Honours from
Nanyang Technological University in 1996
and has a Masters in Fire Engineering from University of Canterbury,
New Zealand in 2010.
YAP Yang Leng Ivan is a Manager (Building
and Infrastructure). He manages the review
and update of the master plans of external
utility services within airbases, which include
water and fuel distribution networks. Ivan
graduated with a Bachelor of Engineering
(Mechanical Engineering) degree with
Honours from NUS in 2002. He further
obtained a Master of Engineering (Mechanical Engineering) degree
from NUS in 2005.
FINDING BALANCE IN PROTECTIVE DESIGN
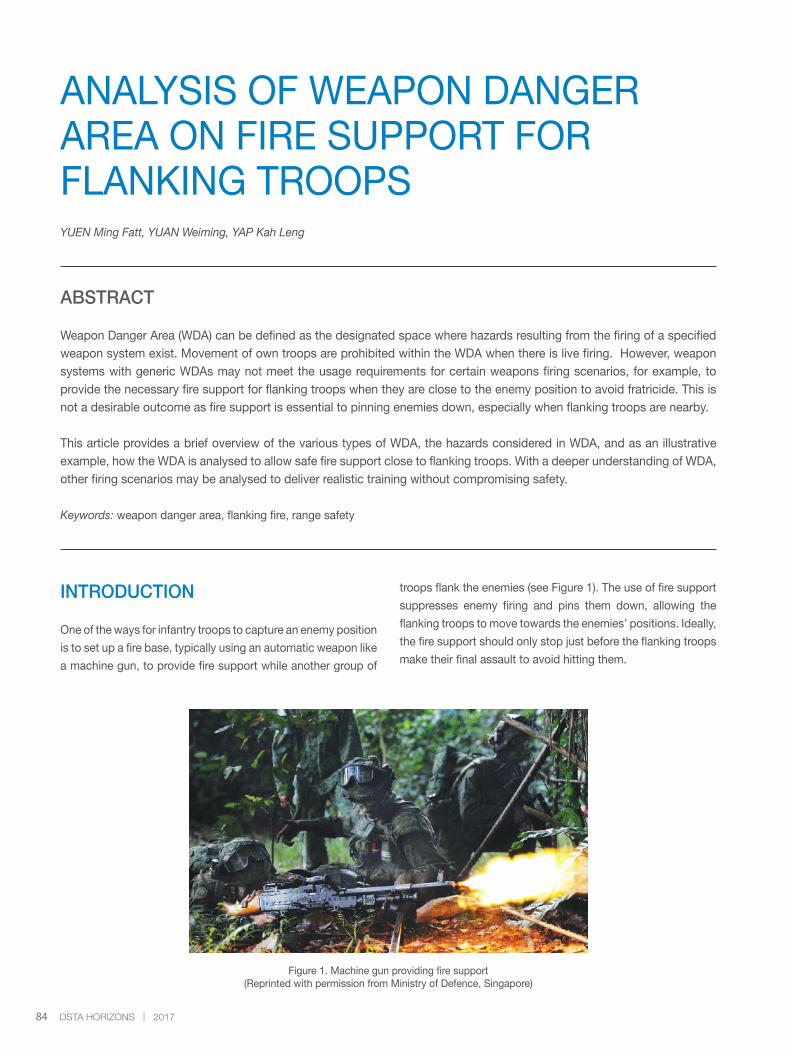
84 DSTA HORIZONS | 2017
ANALYSIS OF WEAPON DANGER AREA ON FIRE SUPPORT FOR FLANKING TROOPSYUEN Ming Fatt, YUAN Weiming, YAP Kah Leng
ABSTRACT
Weapon Danger Area (WDA) can be defined as the designated space where hazards resulting from the firing of a specified weapon system exist. Movement of own troops are prohibited within the WDA when there is live firing. However, weapon systems with generic WDAs may not meet the usage requirements for certain weapons firing scenarios, for example, to provide the necessary fire support for flanking troops when they are close to the enemy position to avoid fratricide. This is not a desirable outcome as fire support is essential to pinning enemies down, especially when flanking troops are nearby.
This article provides a brief overview of the various types of WDA, the hazards considered in WDA, and as an illustrative example, how the WDA is analysed to allow safe fire support close to flanking troops. With a deeper understanding of WDA, other firing scenarios may be analysed to deliver realistic training without compromising safety.
Keywords: weapon danger area, flanking fire, range safety
INTRODUCTION
One of the ways for infantry troops to capture an enemy position
is to set up a fire base, typically using an automatic weapon like
a machine gun, to provide fire support while another group of
Figure 1. Machine gun providing fire support(Reprinted with permission from Ministry of Defence, Singapore)
troops flank the enemies (see Figure 1). The use of fire support
suppresses enemy firing and pins them down, allowing the
flanking troops to move towards the enemies’ positions. Ideally,
the fire support should only stop just before the flanking troops
make their final assault to avoid hitting them.
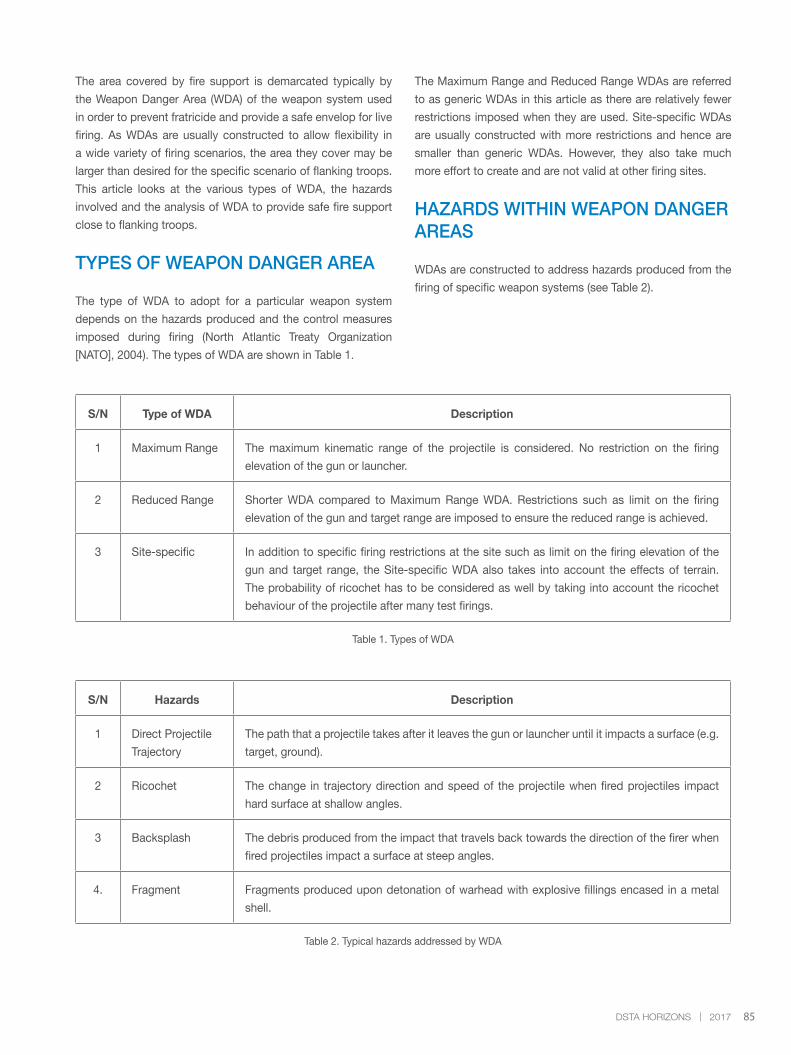
85DSTA HORIZONS | 2017
The area covered by fire support is demarcated typically by
the Weapon Danger Area (WDA) of the weapon system used
in order to prevent fratricide and provide a safe envelop for live
firing. As WDAs are usually constructed to allow flexibility in
a wide variety of firing scenarios, the area they cover may be
larger than desired for the specific scenario of flanking troops.
This article looks at the various types of WDA, the hazards
involved and the analysis of WDA to provide safe fire support
close to flanking troops.
TYPES OF WEAPON DANGER AREA
The type of WDA to adopt for a particular weapon system
depends on the hazards produced and the control measures
imposed during firing (North Atlantic Treaty Organization
[NATO], 2004). The types of WDA are shown in Table 1.
S/N Type of WDA Description
1 Maximum Range The maximum kinematic range of the projectile is considered. No restriction on the firing
elevation of the gun or launcher.
2 Reduced Range Shorter WDA compared to Maximum Range WDA. Restrictions such as limit on the firing
elevation of the gun and target range are imposed to ensure the reduced range is achieved.
3 Site-specific In addition to specific firing restrictions at the site such as limit on the firing elevation of the
gun and target range, the Site-specific WDA also takes into account the effects of terrain.
The probability of ricochet has to be considered as well by taking into account the ricochet
behaviour of the projectile after many test firings.
Table 1. Types of WDA
S/N Hazards Description
1 Direct Projectile
Trajectory
The path that a projectile takes after it leaves the gun or launcher until it impacts a surface (e.g.
target, ground).
2 Ricochet The change in trajectory direction and speed of the projectile when fired projectiles impact
hard surface at shallow angles.
3 Backsplash The debris produced from the impact that travels back towards the direction of the firer when
fired projectiles impact a surface at steep angles.
4. Fragment Fragments produced upon detonation of warhead with explosive fillings encased in a metal
shell.
Table 2. Typical hazards addressed by WDA
The Maximum Range and Reduced Range WDAs are referred
to as generic WDAs in this article as there are relatively fewer
restrictions imposed when they are used. Site-specific WDAs
are usually constructed with more restrictions and hence are
smaller than generic WDAs. However, they also take much
more effort to create and are not valid at other firing sites.
HAZARDS WITHIN WEAPON DANGER AREAS
WDAs are constructed to address hazards produced from the
firing of specific weapon systems (see Table 2).
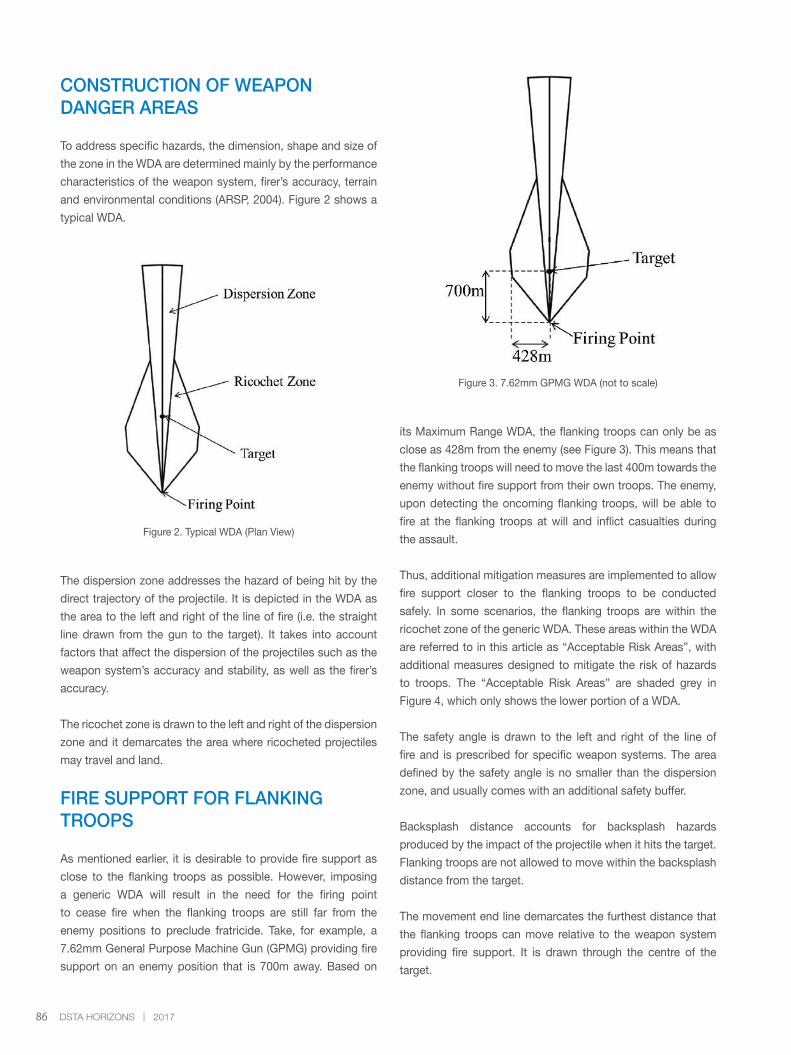
86 DSTA HORIZONS | 2017
CONSTRUCTION OF WEAPON DANGER AREAS
To address specific hazards, the dimension, shape and size of
the zone in the WDA are determined mainly by the performance
characteristics of the weapon system, firer’s accuracy, terrain
and environmental conditions (ARSP, 2004). Figure 2 shows a
typical WDA.
Figure 2. Typical WDA (Plan View)
Figure 3. 7.62mm GPMG WDA (not to scale)
The dispersion zone addresses the hazard of being hit by the
direct trajectory of the projectile. It is depicted in the WDA as
the area to the left and right of the line of fire (i.e. the straight
line drawn from the gun to the target). It takes into account
factors that affect the dispersion of the projectiles such as the
weapon system’s accuracy and stability, as well as the firer’s
accuracy.
The ricochet zone is drawn to the left and right of the dispersion
zone and it demarcates the area where ricocheted projectiles
may travel and land.
FIRE SUPPORT FOR FLANKING TROOPS
As mentioned earlier, it is desirable to provide fire support as
close to the flanking troops as possible. However, imposing
a generic WDA will result in the need for the firing point
to cease fire when the flanking troops are still far from the
enemy positions to preclude fratricide. Take, for example, a
7.62mm General Purpose Machine Gun (GPMG) providing fire
support on an enemy position that is 700m away. Based on
its Maximum Range WDA, the flanking troops can only be as
close as 428m from the enemy (see Figure 3). This means that
the flanking troops will need to move the last 400m towards the
enemy without fire support from their own troops. The enemy,
upon detecting the oncoming flanking troops, will be able to
fire at the flanking troops at will and inflict casualties during
the assault.
Thus, additional mitigation measures are implemented to allow
fire support closer to the flanking troops to be conducted
safely. In some scenarios, the flanking troops are within the
ricochet zone of the generic WDA. These areas within the WDA
are referred to in this article as “Acceptable Risk Areas”, with
additional measures designed to mitigate the risk of hazards
to troops. The “Acceptable Risk Areas” are shaded grey in
Figure 4, which only shows the lower portion of a WDA.
The safety angle is drawn to the left and right of the line of
fire and is prescribed for specific weapon systems. The area
defined by the safety angle is no smaller than the dispersion
zone, and usually comes with an additional safety buffer.
Backsplash distance accounts for backsplash hazards
produced by the impact of the projectile when it hits the target.
Flanking troops are not allowed to move within the backsplash
distance from the target.
The movement end line demarcates the furthest distance that
the flanking troops can move relative to the weapon system
providing fire support. It is drawn through the centre of the
target.
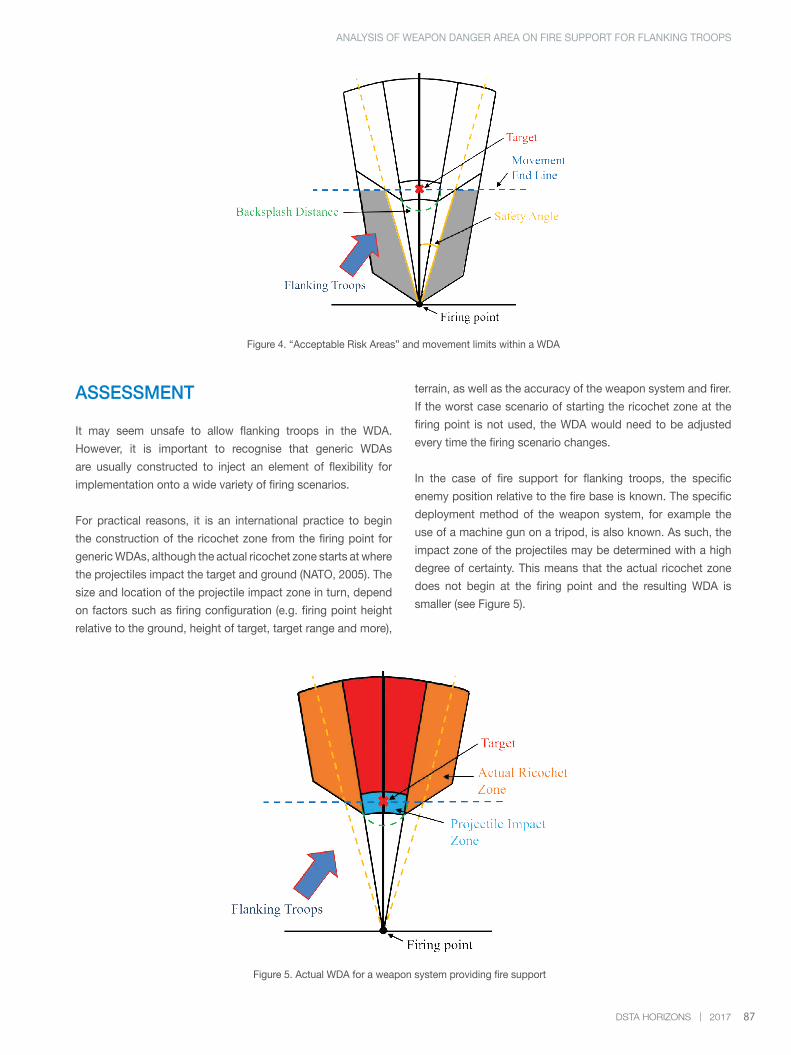
87DSTA HORIZONS | 2017
ASSESSMENT
It may seem unsafe to allow flanking troops in the WDA.
However, it is important to recognise that generic WDAs
are usually constructed to inject an element of flexibility for
implementation onto a wide variety of firing scenarios.
For practical reasons, it is an international practice to begin
the construction of the ricochet zone from the firing point for
generic WDAs, although the actual ricochet zone starts at where
the projectiles impact the target and ground (NATO, 2005). The
size and location of the projectile impact zone in turn, depend
on factors such as firing configuration (e.g. firing point height
relative to the ground, height of target, target range and more),
terrain, as well as the accuracy of the weapon system and firer.
If the worst case scenario of starting the ricochet zone at the
firing point is not used, the WDA would need to be adjusted
every time the firing scenario changes.
In the case of fire support for flanking troops, the specific
enemy position relative to the fire base is known. The specific
deployment method of the weapon system, for example the
use of a machine gun on a tripod, is also known. As such, the
impact zone of the projectiles may be determined with a high
degree of certainty. This means that the actual ricochet zone
does not begin at the firing point and the resulting WDA is
smaller (see Figure 5).
Figure 4. “Acceptable Risk Areas” and movement limits within a WDA
ANALYSIS OF WEAPON DANGER AREA ON FIRE SUPPORT FOR FLANKING TROOPS
Figure 5. Actual WDA for a weapon system providing fire support
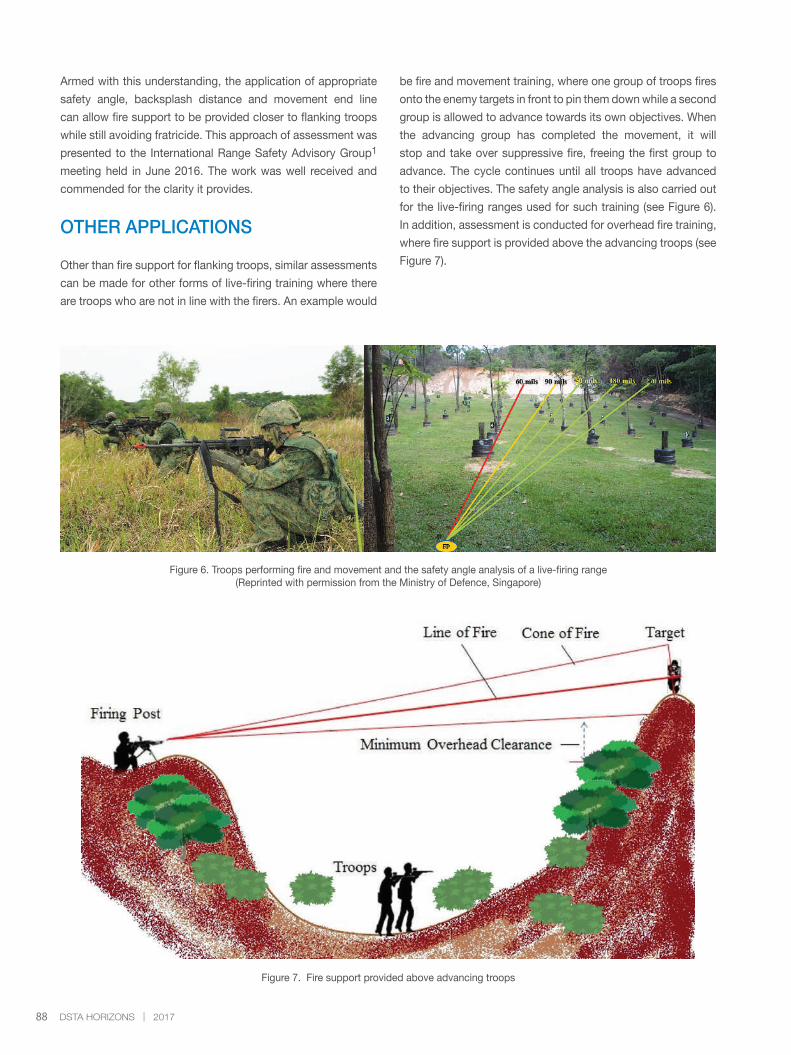
88 DSTA HORIZONS | 2017
Armed with this understanding, the application of appropriate
safety angle, backsplash distance and movement end line
can allow fire support to be provided closer to flanking troops
while still avoiding fratricide. This approach of assessment was
presented to the International Range Safety Advisory Group1
meeting held in June 2016. The work was well received and
commended for the clarity it provides.
OTHER APPLICATIONS
Other than fire support for flanking troops, similar assessments
can be made for other forms of live-firing training where there
are troops who are not in line with the firers. An example would
be fire and movement training, where one group of troops fires
onto the enemy targets in front to pin them down while a second
group is allowed to advance towards its own objectives. When
the advancing group has completed the movement, it will
stop and take over suppressive fire, freeing the first group to
advance. The cycle continues until all troops have advanced
to their objectives. The safety angle analysis is also carried out
for the live-firing ranges used for such training (see Figure 6).
In addition, assessment is conducted for overhead fire training,
where fire support is provided above the advancing troops (see
Figure 7).
Figure 6. Troops performing fire and movement and the safety angle analysis of a live-firing range(Reprinted with permission from the Ministry of Defence, Singapore)
Figure 7. Fire support provided above advancing troops
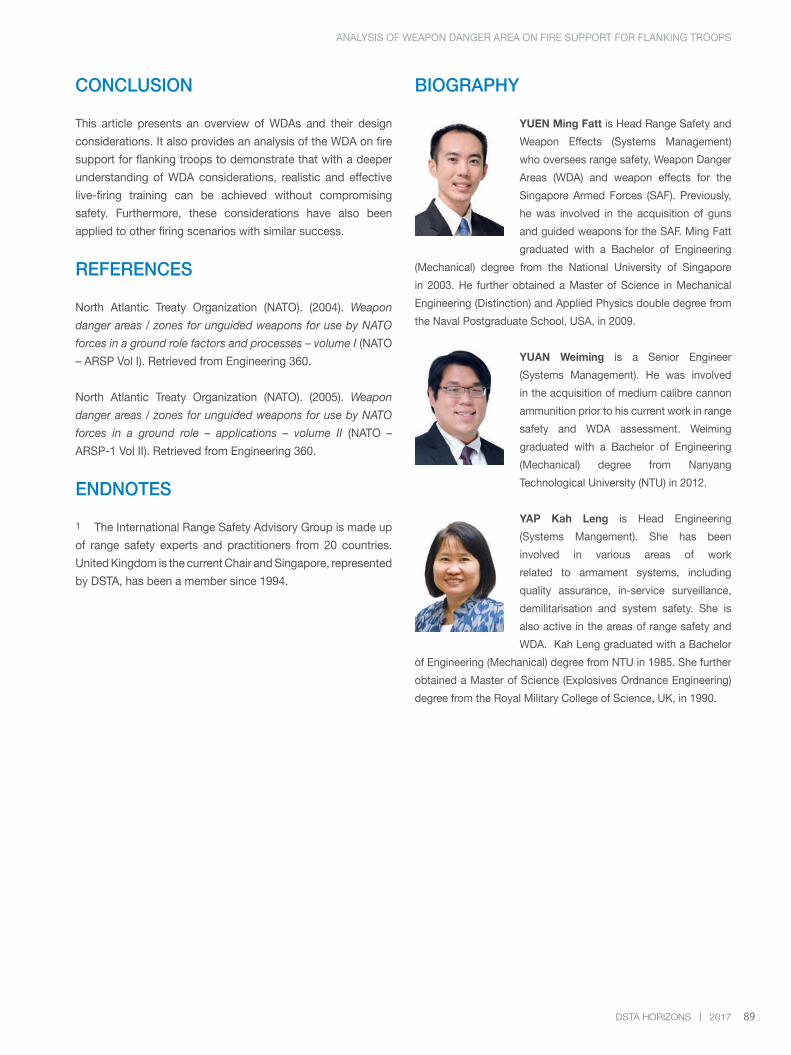
89DSTA HORIZONS | 2017
CONCLUSION
This article presents an overview of WDAs and their design
considerations. It also provides an analysis of the WDA on fire
support for flanking troops to demonstrate that with a deeper
understanding of WDA considerations, realistic and effective
live-firing training can be achieved without compromising
safety. Furthermore, these considerations have also been
applied to other firing scenarios with similar success.
REFERENCES
North Atlantic Treaty Organization (NATO). (2004). Weapon
danger areas / zones for unguided weapons for use by NATO
forces in a ground role factors and processes – volume I (NATO
– ARSP Vol I). Retrieved from Engineering 360.
North Atlantic Treaty Organization (NATO). (2005). Weapon
danger areas / zones for unguided weapons for use by NATO
forces in a ground role – applications – volume II (NATO –
ARSP-1 Vol II). Retrieved from Engineering 360.
ENDNOTES
1 The International Range Safety Advisory Group is made up
of range safety experts and practitioners from 20 countries.
United Kingdom is the current Chair and Singapore, represented
by DSTA, has been a member since 1994.
BIOGRAPHY
YUEN Ming Fatt is Head Range Safety and
Weapon Effects (Systems Management)
who oversees range safety, Weapon Danger
Areas (WDA) and weapon effects for the
Singapore Armed Forces (SAF). Previously,
he was involved in the acquisition of guns
and guided weapons for the SAF. Ming Fatt
graduated with a Bachelor of Engineering
(Mechanical) degree from the National University of Singapore
in 2003. He further obtained a Master of Science in Mechanical
Engineering (Distinction) and Applied Physics double degree from
the Naval Postgraduate School, USA, in 2009.
YUAN Weiming is a Senior Engineer
(Systems Management). He was involved
in the acquisition of medium calibre cannon
ammunition prior to his current work in range
safety and WDA assessment. Weiming
graduated with a Bachelor of Engineering
(Mechanical) degree from Nanyang
Technological University (NTU) in 2012.
YAP Kah Leng is Head Engineering
(Systems Mangement). She has been
involved in various areas of work
related to armament systems, including
quality assurance, in-service surveillance,
demilitarisation and system safety. She is
also active in the areas of range safety and
WDA. Kah Leng graduated with a Bachelor
of Engineering (Mechanical) degree from NTU in 1985. She further
obtained a Master of Science (Explosives Ordnance Engineering)
degree from the Royal Military College of Science, UK, in 1990.
ANALYSIS OF WEAPON DANGER AREA ON FIRE SUPPORT FOR FLANKING TROOPS
90 DSTA HORIZONS | 2017
TOWARDS COST-EFFECTIVE RELIABILITY VERIFICATION IN DEFENCE ACQUISITIONLEO Ding Yenn, TEO Yew Kheng
ABSTRACT
In defence systems, reliability is an important attribute as it has a profound impact on system availability and ownership cost. During the acquisition of defence systems, reliability verification in the customer’s field environment is carried out frequently as part of the acceptance process to ensure that delivered systems meet reliability requirements. While test plans from military handbook MIL-HDBK-781 are widely used for system reliability verification, there is an uptrend in the cost premium demanded by defence contractors for such verification efforts.
This article explores the reasons for the high cost premium associated with system reliability verification performed using MIL-HDBK-781 test plans. It also looks at the concerns and objectives of the defence customer and contractor with respect to reliability verification. In addition, the article proposes an alternative approach to manage the cost associated with reliability verification test plans from MIL-HDBK-781 so as to enhance the cost effectiveness of reliability verification in defence acquisition.
Keywords: availability, reliability, mean time between failure, reliability verification, defence acquisition
INTRODUCTION
System availability and ownership cost are both affected by
system reliability design. Adequate system reliability can
go a long way in reducing system failures so that system
unavailability and maintenance expenditure can be minimised.
System reliability is usually expressed as the system Mean
Time Between Failure (MTBF).
System availability is an important consideration in the
management of defence systems. Major defence systems,
such as fighter aircraft, radar systems and weapon systems,
require high system availability in order to fulfil their peacetime
and wartime roles effectively.
Cost of ownership is another important consideration. Due
to their high investment cost, defence systems are usually
designed with relatively long service life, typically greater than
10 years, to achieve a reasonable return-on-investment. As a
consequence of their long service life, recurring maintenance
and support costs contribute significantly to the total ownership
cost of defence systems.
MANAGING RELIABILITY IN DEFENCE SYSTEMS ACQUISITION
With respect to the application of systems engineering
methods, processes and tools in system acquisition, major
defence contractors generally have established in-house
systems engineering practices. Nevertheless, during the
acquisition of major defence systems, the customer may
contractually require the contractor to implement specific
systems engineering methods, processes and tools. This is
often the case for reliability design and verification.
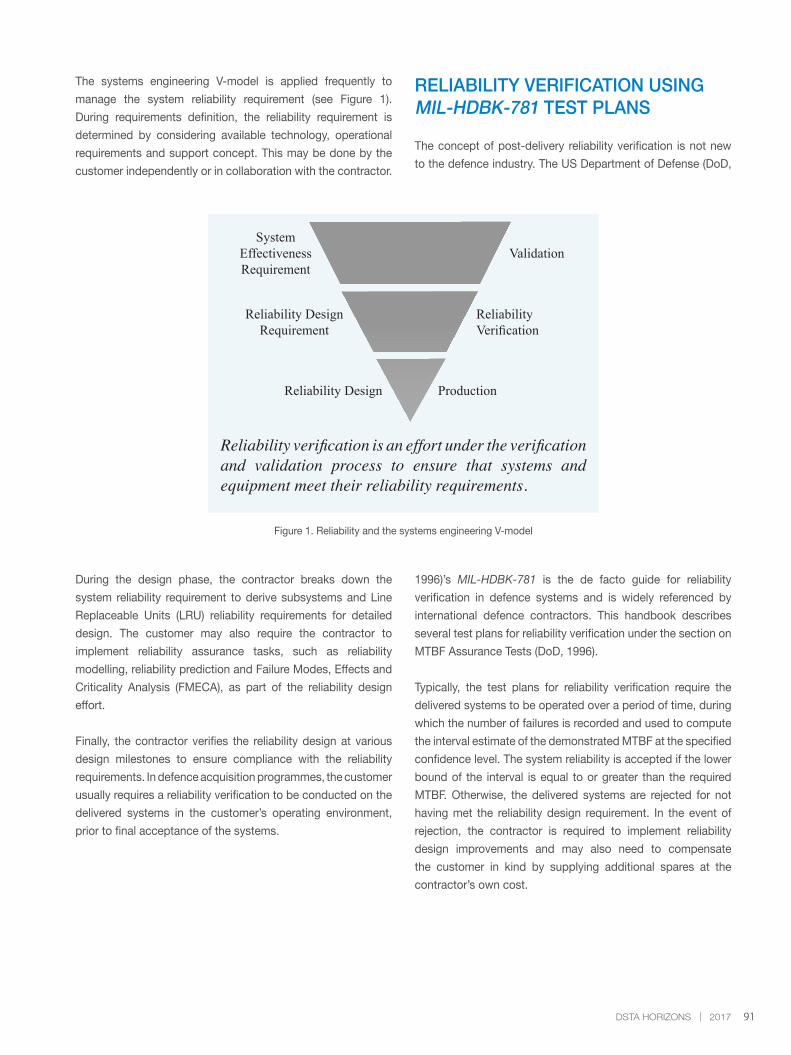
91DSTA HORIZONS | 2017
The systems engineering V-model is applied frequently to
manage the system reliability requirement (see Figure 1).
During requirements definition, the reliability requirement is
determined by considering available technology, operational
requirements and support concept. This may be done by the
customer independently or in collaboration with the contractor.
RELIABILITY VERIFICATION USING MIL-HDBK-781 TEST PLANS
The concept of post-delivery reliability verification is not new
to the defence industry. The US Department of Defense (DoD,
During the design phase, the contractor breaks down the
system reliability requirement to derive subsystems and Line
Replaceable Units (LRU) reliability requirements for detailed
design. The customer may also require the contractor to
implement reliability assurance tasks, such as reliability
modelling, reliability prediction and Failure Modes, Effects and
Criticality Analysis (FMECA), as part of the reliability design
effort.
Finally, the contractor verifies the reliability design at various
design milestones to ensure compliance with the reliability
requirements. In defence acquisition programmes, the customer
usually requires a reliability verification to be conducted on the
delivered systems in the customer’s operating environment,
prior to final acceptance of the systems.
1996)’s MIL-HDBK-781 is the de facto guide for reliability
verification in defence systems and is widely referenced by
international defence contractors. This handbook describes
several test plans for reliability verification under the section on
MTBF Assurance Tests (DoD, 1996).
Typically, the test plans for reliability verification require the
delivered systems to be operated over a period of time, during
which the number of failures is recorded and used to compute
the interval estimate of the demonstrated MTBF at the specified
confidence level. The system reliability is accepted if the lower
bound of the interval is equal to or greater than the required
MTBF. Otherwise, the delivered systems are rejected for not
having met the reliability design requirement. In the event of
rejection, the contractor is required to implement reliability
design improvements and may also need to compensate
the customer in kind by supplying additional spares at the
contractor’s own cost.
Figure 1. Reliability and the systems engineering V-model
ValidationSystem
EffectivenessRequirement
Reliability DesignRequirement
Reliability Design
ReliabilityVerification
Production
Reliability verification is an effort under the verification and validation process to ensure that systems and equipment meet their reliability requirements.
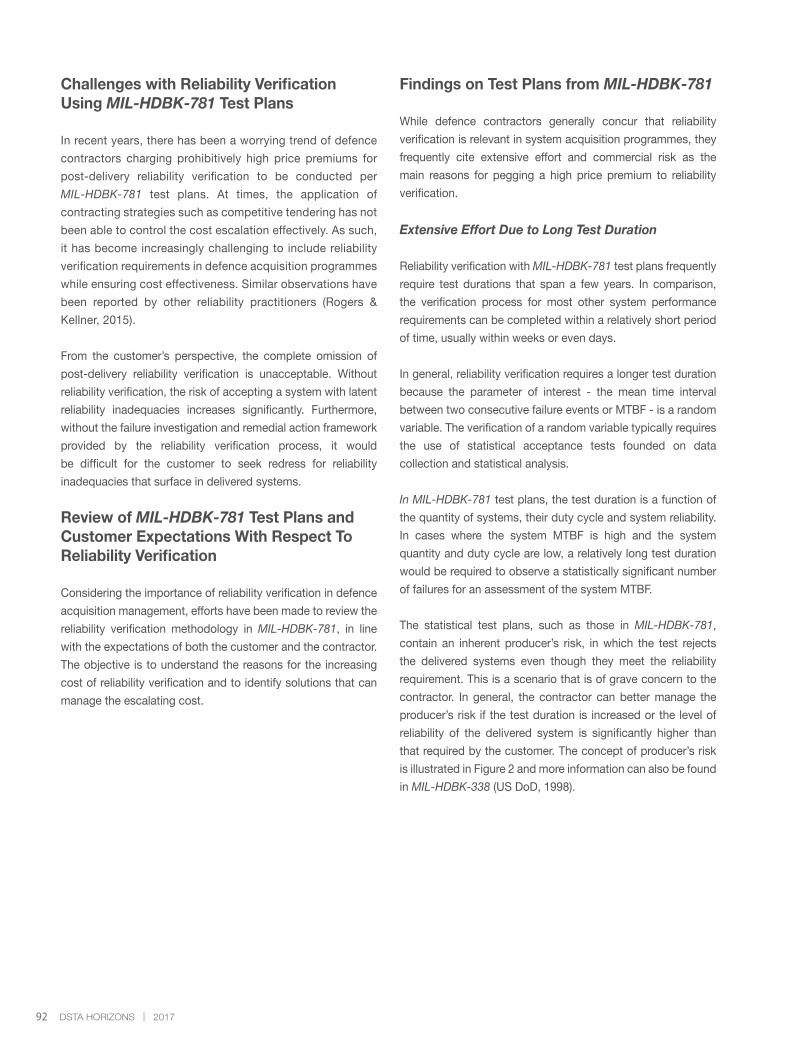
92 DSTA HORIZONS | 2017
Challenges with Reliability Verification Using MIL-HDBK-781 Test Plans
In recent years, there has been a worrying trend of defence
contractors charging prohibitively high price premiums for
post-delivery reliability verification to be conducted per
MIL-HDBK-781 test plans. At times, the application of
contracting strategies such as competitive tendering has not
been able to control the cost escalation effectively. As such,
it has become increasingly challenging to include reliability
verification requirements in defence acquisition programmes
while ensuring cost effectiveness. Similar observations have
been reported by other reliability practitioners (Rogers &
Kellner, 2015).
From the customer’s perspective, the complete omission of
post-delivery reliability verification is unacceptable. Without
reliability verification, the risk of accepting a system with latent
reliability inadequacies increases significantly. Furthermore,
without the failure investigation and remedial action framework
provided by the reliability verification process, it would
be difficult for the customer to seek redress for reliability
inadequacies that surface in delivered systems.
Review of MIL-HDBK-781 Test Plans and Customer Expectations With Respect To Reliability Verification
Considering the importance of reliability verification in defence
acquisition management, efforts have been made to review the
reliability verification methodology in MIL-HDBK-781, in line
with the expectations of both the customer and the contractor.
The objective is to understand the reasons for the increasing
cost of reliability verification and to identify solutions that can
manage the escalating cost.
Findings on Test Plans from MIL-HDBK-781
While defence contractors generally concur that reliability
verification is relevant in system acquisition programmes, they
frequently cite extensive effort and commercial risk as the
main reasons for pegging a high price premium to reliability
verification.
Extensive Effort Due to Long Test Duration
Reliability verification with MIL-HDBK-781 test plans frequently
require test durations that span a few years. In comparison,
the verification process for most other system performance
requirements can be completed within a relatively short period
of time, usually within weeks or even days.
In general, reliability verification requires a longer test duration
because the parameter of interest - the mean time interval
between two consecutive failure events or MTBF - is a random
variable. The verification of a random variable typically requires
the use of statistical acceptance tests founded on data
collection and statistical analysis.
In MIL-HDBK-781 test plans, the test duration is a function of
the quantity of systems, their duty cycle and system reliability.
In cases where the system MTBF is high and the system
quantity and duty cycle are low, a relatively long test duration
would be required to observe a statistically significant number
of failures for an assessment of the system MTBF.
The statistical test plans, such as those in MIL-HDBK-781,
contain an inherent producer’s risk, in which the test rejects
the delivered systems even though they meet the reliability
requirement. This is a scenario that is of grave concern to the
contractor. In general, the contractor can better manage the
producer’s risk if the test duration is increased or the level of
reliability of the delivered system is significantly higher than
that required by the customer. The concept of producer’s risk
is illustrated in Figure 2 and more information can also be found
in MIL-HDBK-338 (US DoD, 1998).
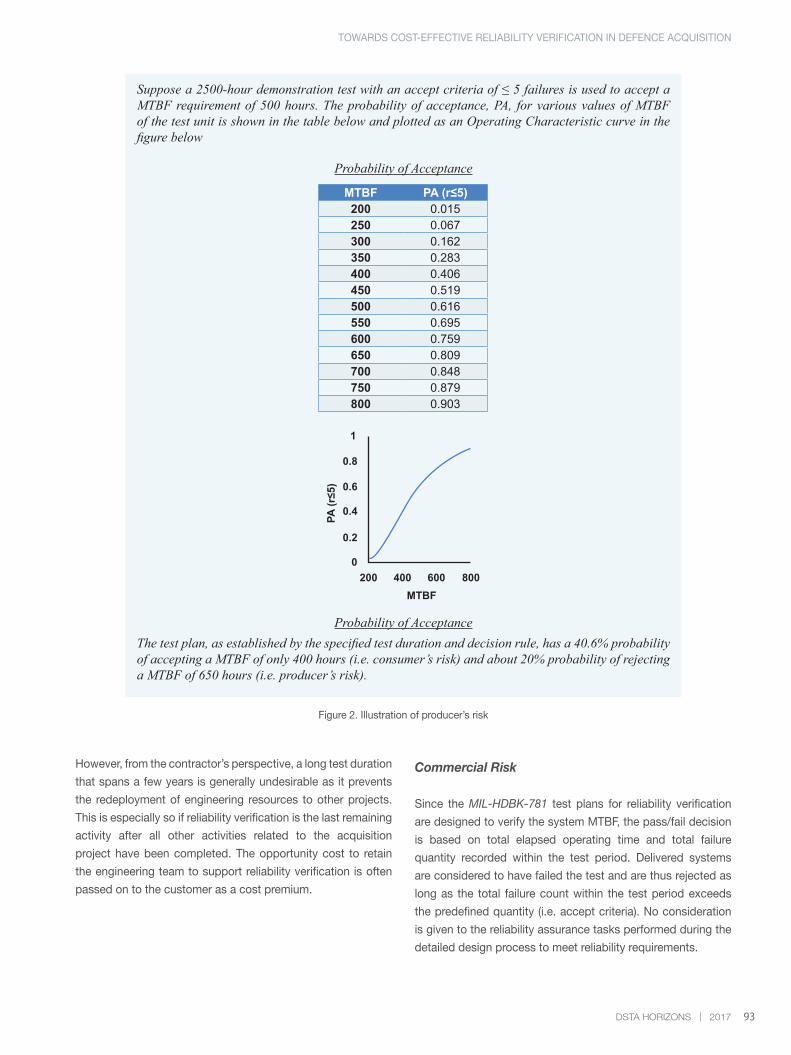
93DSTA HORIZONS | 2017
Figure 2. Illustration of producer’s risk
However, from the contractor’s perspective, a long test duration
that spans a few years is generally undesirable as it prevents
the redeployment of engineering resources to other projects.
This is especially so if reliability verification is the last remaining
activity after all other activities related to the acquisition
project have been completed. The opportunity cost to retain
the engineering team to support reliability verification is often
passed on to the customer as a cost premium.
Commercial Risk
Since the MIL-HDBK-781 test plans for reliability verification
are designed to verify the system MTBF, the pass/fail decision
is based on total elapsed operating time and total failure
quantity recorded within the test period. Delivered systems
are considered to have failed the test and are thus rejected as
long as the total failure count within the test period exceeds
the predefined quantity (i.e. accept criteria). No consideration
is given to the reliability assurance tasks performed during the
detailed design process to meet reliability requirements.
TOWARDS COST-EFFECTIVE RELIABILITY VERIFICATION IN DEFENCE ACQUISITION
Suppose a 2500-hour demonstration test with an accept criteria of ≤ 5 failures is used to accept a MTBF requirement of 500 hours. The probability of acceptance, PA, for various values of MTBF of the test unit is shown in the table below and plotted as an Operating Characteristic curve in the figure below
The test plan, as established by the specified test duration and decision rule, has a 40.6% probability of accepting a MTBF of only 400 hours (i.e. consumer’s risk) and about 20% probability of rejecting a MTBF of 650 hours (i.e. producer’s risk).
Probability of Acceptance
Probability of Acceptance
MTBF PA (r≤5)200 0.015250 0.067300 0.162350 0.283400 0.406450 0.519500 0.616550 0.695600 0.759650 0.809700 0.848750 0.879800 0.903
1
0.8
0.6
0.4
0.2
0200 400 600 800
PA (r
≤5)
MTBF
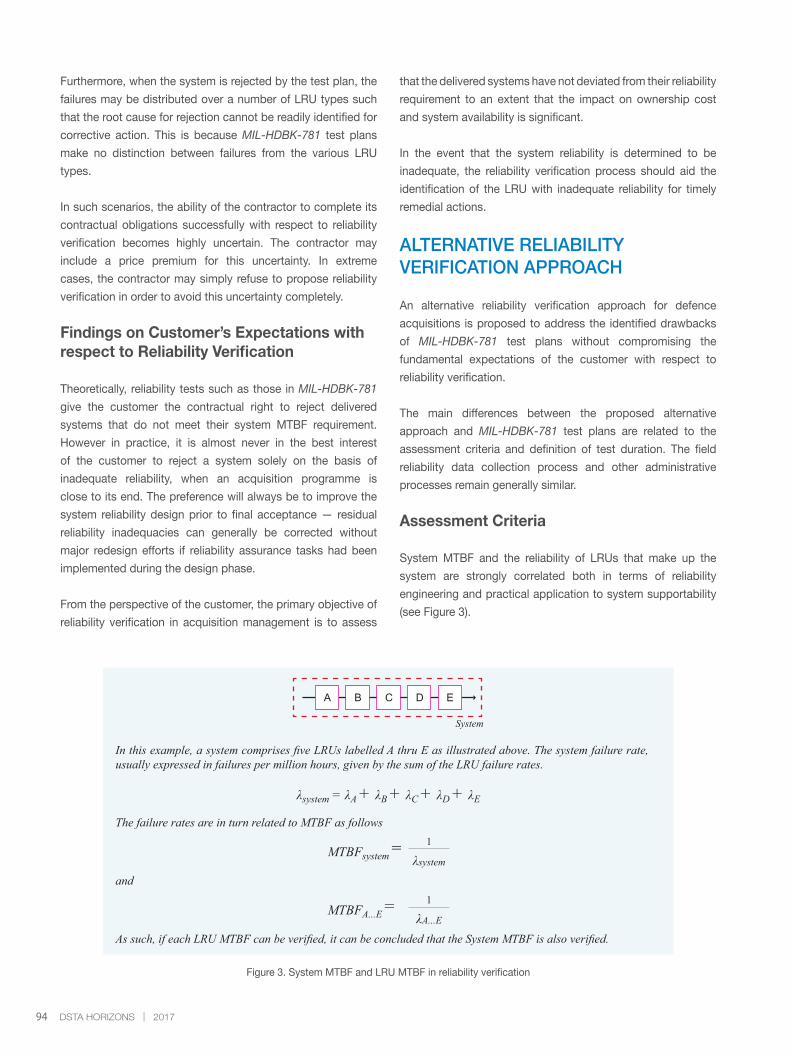
94 DSTA HORIZONS | 2017
Furthermore, when the system is rejected by the test plan, the
failures may be distributed over a number of LRU types such
that the root cause for rejection cannot be readily identified for
corrective action. This is because MIL-HDBK-781 test plans
make no distinction between failures from the various LRU
types.
In such scenarios, the ability of the contractor to complete its
contractual obligations successfully with respect to reliability
verification becomes highly uncertain. The contractor may
include a price premium for this uncertainty. In extreme
cases, the contractor may simply refuse to propose reliability
verification in order to avoid this uncertainty completely.
Findings on Customer’s Expectations with respect to Reliability Verification
Theoretically, reliability tests such as those in MIL-HDBK-781
give the customer the contractual right to reject delivered
systems that do not meet their system MTBF requirement.
However in practice, it is almost never in the best interest
of the customer to reject a system solely on the basis of
inadequate reliability, when an acquisition programme is
close to its end. The preference will always be to improve the
system reliability design prior to final acceptance — residual
reliability inadequacies can generally be corrected without
major redesign efforts if reliability assurance tasks had been
implemented during the design phase.
From the perspective of the customer, the primary objective of
reliability verification in acquisition management is to assess
that the delivered systems have not deviated from their reliability
requirement to an extent that the impact on ownership cost
and system availability is significant.
In the event that the system reliability is determined to be
inadequate, the reliability verification process should aid the
identification of the LRU with inadequate reliability for timely
remedial actions.
ALTERNATIVE RELIABILITY VERIFICATION APPROACH
An alternative reliability verification approach for defence
acquisitions is proposed to address the identified drawbacks
of MIL-HDBK-781 test plans without compromising the
fundamental expectations of the customer with respect to
reliability verification.
The main differences between the proposed alternative
approach and MIL-HDBK-781 test plans are related to the
assessment criteria and definition of test duration. The field
reliability data collection process and other administrative
processes remain generally similar.
Assessment Criteria
System MTBF and the reliability of LRUs that make up the
system are strongly correlated both in terms of reliability
engineering and practical application to system supportability
(see Figure 3).
Figure 3. System MTBF and LRU MTBF in reliability verification
In this example, a system comprises five LRUs labelled A thru E as illustrated above. The system failure rate, usually expressed in failures per million hours, given by the sum of the LRU failure rates.
The failure rates are in turn related to MTBF as follows
As such, if each LRU MTBF can be verified, it can be concluded that the System MTBF is also verified.
and
A B C D E
System
λsystem = λA + λB + λC + λD + λE
MTBFsystem =1
λsystem
MTBFA...E =1
λA...E
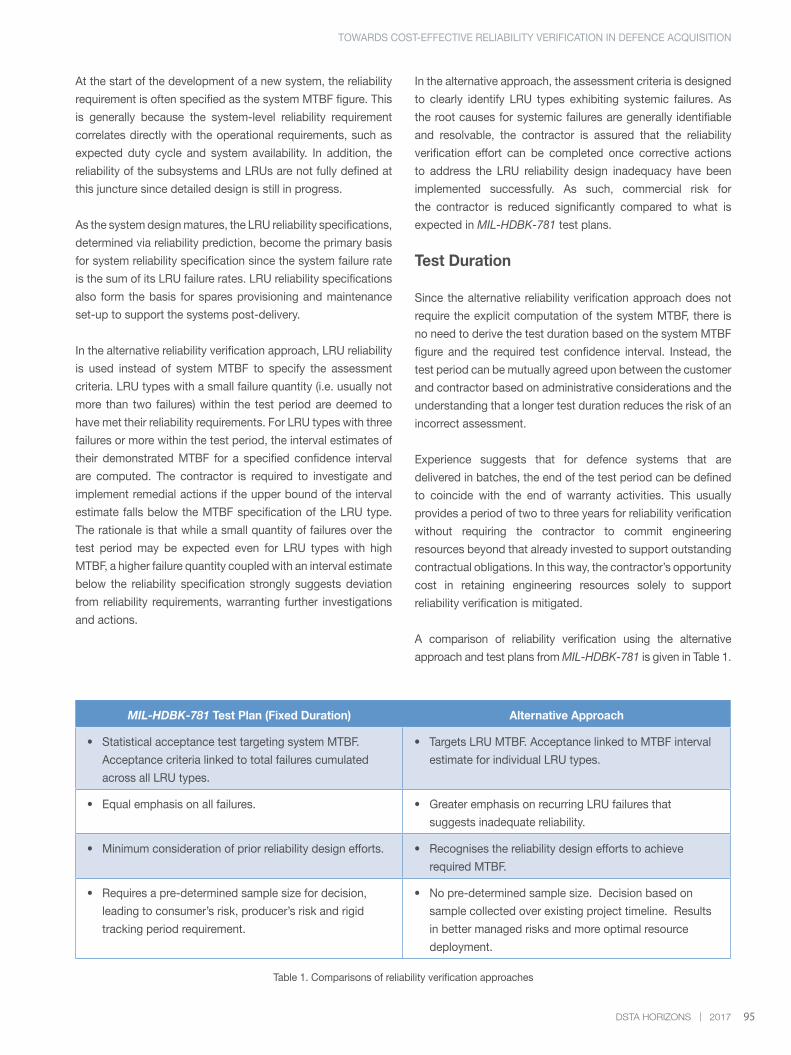
95DSTA HORIZONS | 2017
Table 1. Comparisons of reliability verification approaches
At the start of the development of a new system, the reliability
requirement is often specified as the system MTBF figure. This
is generally because the system-level reliability requirement
correlates directly with the operational requirements, such as
expected duty cycle and system availability. In addition, the
reliability of the subsystems and LRUs are not fully defined at
this juncture since detailed design is still in progress.
As the system design matures, the LRU reliability specifications,
determined via reliability prediction, become the primary basis
for system reliability specification since the system failure rate
is the sum of its LRU failure rates. LRU reliability specifications
also form the basis for spares provisioning and maintenance
set-up to support the systems post-delivery.
In the alternative reliability verification approach, LRU reliability
is used instead of system MTBF to specify the assessment
criteria. LRU types with a small failure quantity (i.e. usually not
more than two failures) within the test period are deemed to
have met their reliability requirements. For LRU types with three
failures or more within the test period, the interval estimates of
their demonstrated MTBF for a specified confidence interval
are computed. The contractor is required to investigate and
implement remedial actions if the upper bound of the interval
estimate falls below the MTBF specification of the LRU type.
The rationale is that while a small quantity of failures over the
test period may be expected even for LRU types with high
MTBF, a higher failure quantity coupled with an interval estimate
below the reliability specification strongly suggests deviation
from reliability requirements, warranting further investigations
and actions.
In the alternative approach, the assessment criteria is designed
to clearly identify LRU types exhibiting systemic failures. As
the root causes for systemic failures are generally identifiable
and resolvable, the contractor is assured that the reliability
verification effort can be completed once corrective actions
to address the LRU reliability design inadequacy have been
implemented successfully. As such, commercial risk for
the contractor is reduced significantly compared to what is
expected in MIL-HDBK-781 test plans.
Test Duration
Since the alternative reliability verification approach does not
require the explicit computation of the system MTBF, there is
no need to derive the test duration based on the system MTBF
figure and the required test confidence interval. Instead, the
test period can be mutually agreed upon between the customer
and contractor based on administrative considerations and the
understanding that a longer test duration reduces the risk of an
incorrect assessment.
Experience suggests that for defence systems that are
delivered in batches, the end of the test period can be defined
to coincide with the end of warranty activities. This usually
provides a period of two to three years for reliability verification
without requiring the contractor to commit engineering
resources beyond that already invested to support outstanding
contractual obligations. In this way, the contractor’s opportunity
cost in retaining engineering resources solely to support
reliability verification is mitigated.
A comparison of reliability verification using the alternative
approach and test plans from MIL-HDBK-781 is given in Table 1.
MIL-HDBK-781 Test Plan (Fixed Duration) Alternative Approach
• Statistical acceptance test targeting system MTBF.
Acceptance criteria linked to total failures cumulated
across all LRU types.
• Targets LRU MTBF. Acceptance linked to MTBF interval
estimate for individual LRU types.
• Equal emphasis on all failures. • Greater emphasis on recurring LRU failures that
suggests inadequate reliability.
• Minimum consideration of prior reliability design efforts. • Recognises the reliability design efforts to achieve
required MTBF.
• Requires a pre-determined sample size for decision,
leading to consumer’s risk, producer’s risk and rigid
tracking period requirement.
• No pre-determined sample size. Decision based on
sample collected over existing project timeline. Results
in better managed risks and more optimal resource
deployment.
TOWARDS COST-EFFECTIVE RELIABILITY VERIFICATION IN DEFENCE ACQUISITION
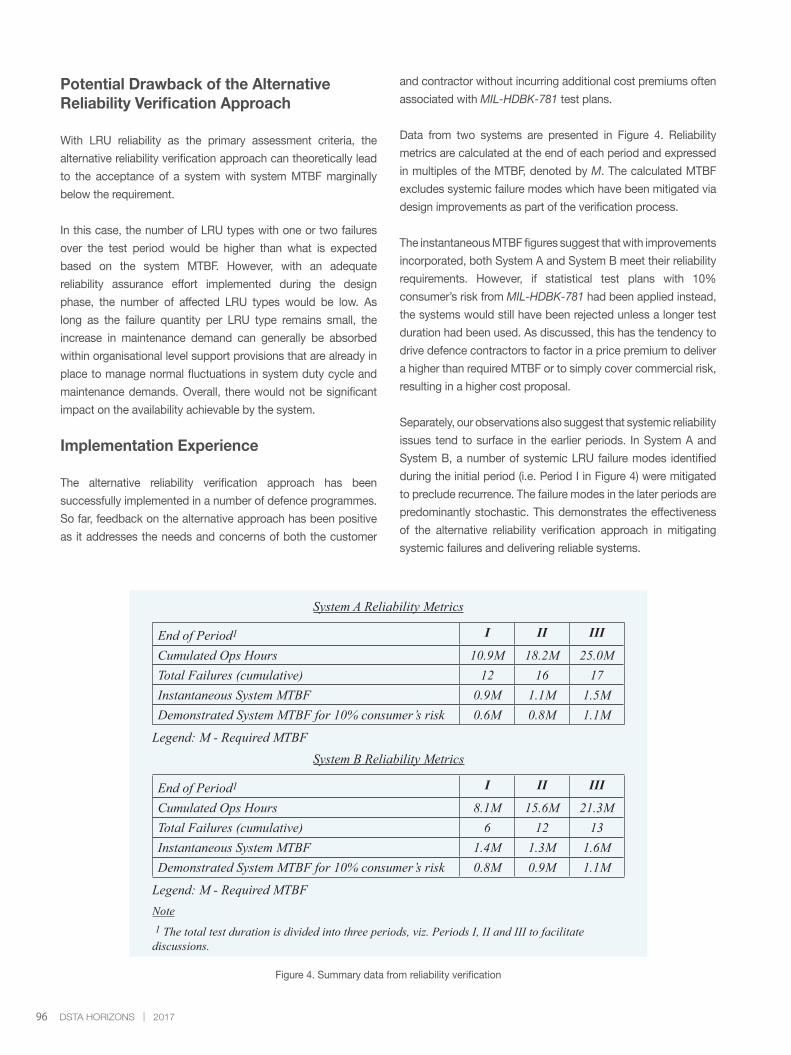
96 DSTA HORIZONS | 2017
Potential Drawback of the Alternative Reliability Verification Approach
With LRU reliability as the primary assessment criteria, the
alternative reliability verification approach can theoretically lead
to the acceptance of a system with system MTBF marginally
below the requirement.
In this case, the number of LRU types with one or two failures
over the test period would be higher than what is expected
based on the system MTBF. However, with an adequate
reliability assurance effort implemented during the design
phase, the number of affected LRU types would be low. As
long as the failure quantity per LRU type remains small, the
increase in maintenance demand can generally be absorbed
within organisational level support provisions that are already in
place to manage normal fluctuations in system duty cycle and
maintenance demands. Overall, there would not be significant
impact on the availability achievable by the system.
Implementation Experience
The alternative reliability verification approach has been
successfully implemented in a number of defence programmes.
So far, feedback on the alternative approach has been positive
as it addresses the needs and concerns of both the customer
Figure 4. Summary data from reliability verification
and contractor without incurring additional cost premiums often
associated with MIL-HDBK-781 test plans.
Data from two systems are presented in Figure 4. Reliability
metrics are calculated at the end of each period and expressed
in multiples of the MTBF, denoted by M. The calculated MTBF
excludes systemic failure modes which have been mitigated via
design improvements as part of the verification process.
The instantaneous MTBF figures suggest that with improvements
incorporated, both System A and System B meet their reliability
requirements. However, if statistical test plans with 10%
consumer’s risk from MIL-HDBK-781 had been applied instead,
the systems would still have been rejected unless a longer test
duration had been used. As discussed, this has the tendency to
drive defence contractors to factor in a price premium to deliver
a higher than required MTBF or to simply cover commercial risk,
resulting in a higher cost proposal.
Separately, our observations also suggest that systemic reliability
issues tend to surface in the earlier periods. In System A and
System B, a number of systemic LRU failure modes identified
during the initial period (i.e. Period I in Figure 4) were mitigated
to preclude recurrence. The failure modes in the later periods are
predominantly stochastic. This demonstrates the effectiveness
of the alternative reliability verification approach in mitigating
systemic failures and delivering reliable systems.
System A Reliability Metrics
End of Period1 I II III
Cumulated Ops Hours 10.9M 18.2M 25.0MTotal Failures (cumulative) 12 16 17Instantaneous System MTBF 0.9M 1.1M 1.5MDemonstrated System MTBF for 10% consumer’s risk 0.6M 0.8M 1.1M
Legend: M - Required MTBFSystem B Reliability Metrics
End of Period1 I II III
Cumulated Ops Hours 8.1M 15.6M 21.3MTotal Failures (cumulative) 6 12 13Instantaneous System MTBF 1.4M 1.3M 1.6MDemonstrated System MTBF for 10% consumer’s risk 0.8M 0.9M 1.1M
Legend: M - Required MTBFNote
1 The total test duration is divided into three periods, viz. Periods I, II and III to facilitate discussions.
97DSTA HORIZONS | 2017
CONCLUSION
In the application of systems engineering in defence acquisition
management, reliability verification is an important process to
ensure that delivered systems meet reliability requirements.
However, the escalating cost premium levied by defence
contractors for reliability verification using MIL-HDBK-781 test
plans made it increasingly challenging to implement reliability
verification in defence acquisition.
A review of the existing reliability verification processes was
conducted to articulate the verification objectives clearly and
to identify the cost drivers. Leveraging the findings of this
review, an alternative reliability verification approach for defence
acquisition was proposed by DSTA. Having implemented it in
a number of defence acquisition programmes, DSTA has found
the alternative reliability verification approach to be effective in
reducing the cost premium associated with MIL-HDBK-781 test
plans while continuing to deliver reliable systems.
REFERENCES
Department of Defense. (1996). Handbook for reliability test
methods, plans, and environments for engineering, development
qualification, and production (MIL-HDBK-781A). U.S.: Commander.
Space and Naval Warfare Systems Command.
Department of Defense. (1998). Military handbook: Electronic
reliability design handbook (MIL-HDBK-338B). U.S.: Air Force
Research Laboratory.
Rogers, S. C., & Kellner, D. W. (2015, January). Reliability
demonstration testing: Can we afford 80% confidence? In
Reliability and Maintainability Symposium, Palm Harbor, FL.
BIOGRAPHY
LEO Ding Yenn is Head Reliability,
Availability and Maintainability (DSTA
Masterplanning and Systems Architecting).
He leads his team in the development and
application of reliability, availability and
maintainability (RAM) methods, processes
and tools to achieve high availability in
defence systems. Ding Yenn graduated with
a Bachelor of Engineering (Mechanical) degree from Nanyang
Technological University in 1996.
TEO Yew Kheng is a Principal Engineer
(DSTA Masterplanning and Systems
Architecting). His role includes developing
new methods, processes and tools in
reliability, maintainability and quality
assurance. He has vast experience in
the acquisition management of defence
systems in areas of reliability, availability,
maintainability, supportability and quality assurance. Yew Kheng
graduated with a Bachelor of Engineering (Mechanical) degree
from the National University of Singapore (NUS) in 1983. He
further obtained a Master of Science (Management of Technology)
degree from NUS in 2001.
TOWARDS COST-EFFECTIVE RELIABILITY VERIFICATION IN DEFENCE ACQUISITION

98 DSTA HORIZONS | 2017
NOTES

99DSTA HORIZONS | 2017
NOTES

100 DSTA HORIZONS | 2017
NOTES

101DSTA HORIZONS | 2017
NOTES

102 DSTA HORIZONS | 2017
NOTES

103DSTA HORIZONS | 2017
NOTES

104 DSTA HORIZONS | 2017
NOTES