Total Revenues up $290,221 or 0.38% Municipal Court receipts are up $909,275, or 41.67% ($3.1M from $2.2M) Through September, 98% of budgeted revenues have been received Ending unassigned fund balance is estimated to be $16.1M or 21%
General Fund Current Property Tax Revenues
4
$22.2 $21.7
$2.6 $2.3
Total - $25.1 Total - $24.4
$0
$5
$10
$15
$20
$25
$30
FY 2015 FY 2016
Mill
ions
Jul - Sep Apr - Jun Jan - Mar Oct - Dec
Presenter
Presentation Notes
Property taxes make up 32% of FY16 budgeted revenues Current Property Taxes are down $730,889 or 3% Overall the total tax levied increased $1.1 Million to $38.7 Million Reason for the decrease shown is an approximate $0.03 shift from O&M to I&S FY16 debt service increased $1.6 Million due to first principal payment on 2014 GO Issue Under the current structure; every dollar of property tax collected $0.66 O&M and $0.34 debt service If asked: Majority of property taxes are collected during the first quarter and taxes become delinquent February 1 Early payment discount (3-2-1) for payments prior to December 31 Total lost revenue $649,937 O&M and $336,946 I&S = $986,883 Adjustable taxable value increased $142 Million to $4.9 Billion M&O shifted from $0.52290 to $0.49380 I&S shifted from $0.2269 to $0.25600 Total property tax rate = $0.7498
General Fund Sales Tax Revenues
5
$5.2 $5.2
$5.4 $5.4
$5.5 $5.6
$5.4 $5.5
$21.5 $21.8
$0
$2
$4
$6
$8
$10
$12
$14
$16
$18
$20
$22
FY 2015 FY 2016
Mill
ions
Jul - Sep Apr - Jun Jan - Mar Oct - Dec
Presenter
Presentation Notes
Sales taxes are up 1.21% or $261,013 from FY15 Sales Tax make up 29% of FY16 Budget Collected 98.5% of budgeted sales tax through June
General Fund Monthly Sales Tax Revenues
6
$1,6
33,2
46
$1,8
70,5
96
$1,6
70,1
76
$1,6
20,7
39
$2,1
82,9
65
$1,6
02,4
68
$1,6
66,4
63
$2,1
59,5
34
$1,6
85,4
63
$1,6
44,0
48
$2,0
41,7
49
$1,7
24,3
45
$1,6
32,1
00
$1,9
77,7
18
$1,6
06,8
20
$1,6
52,9
05
$2,2
38,8
34
$1,5
57,9
09
$1,7
61,2
41
$2,1
52,0
29
$1,6
97,9
72
$1,7
14,9
73
$1,9
92,0
73
$1,7
78,2
31
$0
$500,000
$1,000,000
$1,500,000
$2,000,000
$2,500,000
FY 2015 FY 2016
Presenter
Presentation Notes
Two month lag in report, spike in February represents December activity Fairly even month to month, with FY16 outpacing FY15 seven months (November, January, February, April, June, July, and September) Average monthly sales tax collection over the six month period is $1.8 Million
Expenditures are down 0.67% or $528,116 from FY15 Through September 97.8% of the budget has been used
Enterprise Funds 8
Killeen-Fort Hood Regional Airport Revenues
9
$640,210 $619,317
$743,678 $553,303
$537,735 $627,641
$697,631 $635,627
$2,619,254 $2,435,888
$0
$250,000
$500,000
$750,000
$1,000,000
$1,250,000
$1,500,000
$1,750,000
$2,000,000
$2,250,000
$2,500,000
$2,750,000
FY 2015 FY 2016
Jul - Sep Apr - Jun Jan - Mar Oct - Dec
Presenter
Presentation Notes
Operational Revenues are down 7% or $183,367. Fuel sales are down $59,589, Parking Lot Fees are down $61,579, Into Plane Fees are down $30,105 Collected 98% of budgeted operational revenue If asked: Enplanements are down 9% or 10,110 (100,220 compared to FY15 110,330) If asked: Deplaned trips are down 7% or 7,054 (99,654 compared to FY15 106,708)
Operational expenses are up 6.7% or $190,975 This is due to the Airport Master Plan and PFC Bridge projects. Both project’s expense will be reimbursed by either grant or PFC funds. Through September 67% of the budget has been spent
Skylark Field Revenues
11
$108,422 $87,419
$114,843 $88,102
$81,953 $90,881
$132,229
$116,643
$437,447
$383,045
$0
$50,000
$100,000
$150,000
$200,000
$250,000
$300,000
$350,000
$400,000
$450,000
$500,000
FY 2015 FY 2016
Jul - Sep Apr - Jun Jan - Mar Oct - Dec
Presenter
Presentation Notes
Revenues are down 12% or $54,402 Fuel sales are the major contributor at $68,973 85% of the budgeted operational revenues have been received
Skylark Field Expenses
12
$129,879 $104,347
$113,822 $92,761
$112,164
$83,183
$135,840
$140,949
$491,705
$421,240
$0
$50,000
$100,000
$150,000
$200,000
$250,000
$300,000
$350,000
$400,000
$450,000
$500,000
FY 2015 FY 2016
Jul - Sep Apr - Jun Jan - Mar Oct - Dec
Presenter
Presentation Notes
Expenses are down 14% or $70,465 Primary contributor is fuel costs - $62,642 Through September 74% of the budget has been spent Estimated fund balance - $701,049
Solid Waste Revenues
13
$3.7 $4.3
$4.1 $4.4
$4.3 $4.5
$4.6 $4.5
$16.7 $17.8
$0
$2
$4
$6
$8
$10
$12
$14
$16
$18
FY 2015 FY 2016
Mill
ions
Jul - Sep Apr - Jun Jan - Mar Oct - Dec
Presenter
Presentation Notes
Revenues have increased 6.5% or $1,093,120 Residential Fees up $927,982 Commercial Fees up $354,592 Collected 105% of budgeted revenue At the end of June, there were 47,591 SW customers; 1,516 more than the previous year
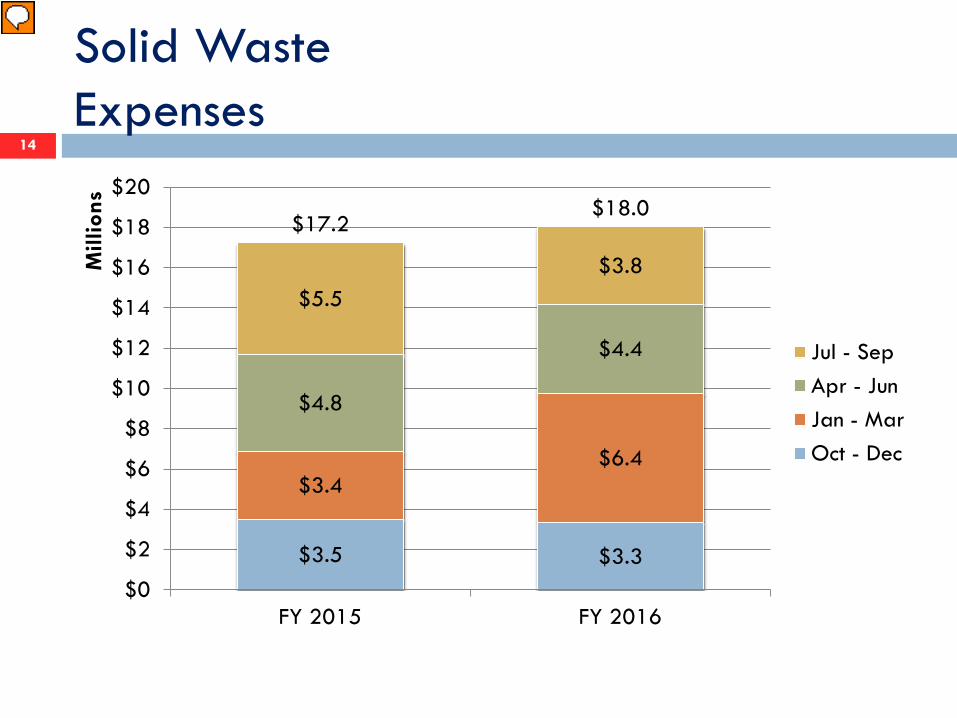
Solid Waste Expenses
14
$3.5 $3.3
$3.4 $6.4
$4.8
$4.4
$5.5 $3.8
$17.2 $18.0
$0
$2
$4
$6
$8
$10
$12
$14
$16
$18
$20
FY 2015 FY 2016
Mill
ions
Jul - Sep Apr - Jun Jan - Mar Oct - Dec
Presenter
Presentation Notes
Expense are up 4.6% or $794,237 Due to the Fleet Funding Program contribution of $1.7M If needed: Adjusted for the contribution, expenses would be down $905,763. Expenses are at 86% of budget through September Estimated fund balance $3.7M
Water and Sewer Revenues
15
$8.9 $11.1
$8.5 $8.8
$9.1 $9.4
$11.7 $11.5
$38.0 $40.9
$0
$4
$8
$12
$16
$20
$24
$28
$32
$36
$40
$44
FY 2015 FY 2016
Mill
ions
Jul - Sep Apr - Jun Jan - Mar Oct - Dec
Presenter
Presentation Notes
Revenues increased 7% or $2,830,578 Water sales increased $548,021 or 3% Sewer revenues increased $488,798 or 3% Funds for debt service in amount of $1,240,479 were moved from a debt service fund Adjusted for the debt service transfer revenues increased 4% ($1.59M) Collected 105% of budgeted revenue At the end of September, there were 48,288 Water customers – 1,523 more than prior year, and 46,584 sewer customers – 1,578 more customers than the previous year.
Water and Sewer Expenses
16
$9.4 $6.6
$9.6 $13.5
$9.8 $8.5
$13.2 $14.8
$42.1 $43.4
$0
$4
$8
$12
$16
$20
$24
$28
$32
$36
$40
$44
FY 2015 FY 2016
Mill
ions
Jul - Sep Apr - Jun Jan - Mar Oct - Dec
Presenter
Presentation Notes
Expenses are up $1,303,711 or 3% Fleet Funding contribution (if needed of $2.8M) Expenses are at 92% of budget Estimated fund balance - $11.8M
Drainage Utility Revenues
17
$936,252 $999,746
$1,014,563 $1,005,101
$1,051,492 $1,011,535
$1,012,611 $1,027,967
$4,014,918 $4,044,349
$0
$400,000
$800,000
$1,200,000
$1,600,000
$2,000,000
$2,400,000
$2,800,000
$3,200,000
$3,600,000
$4,000,000
$4,400,000
FY 2015 FY 2016
Jul - Sep Apr - Jun Jan - Mar Oct - Dec
Presenter
Presentation Notes
Revenues are up 0.73% or $29,431 Residential storm water fees are up $71,390 Commercial storm water fees are up $8,046 Revenues are at 103% of budget
Drainage Utility Expenses
18
$699,706 $567,013
$723,738 $870,511
$396,032 $836,971
$1,481,155 $1,206,211
$3,300,631 $3,480,706
$0
$400,000
$800,000
$1,200,000
$1,600,000
$2,000,000
$2,400,000
$2,800,000
$3,200,000
$3,600,000
FY 2015 FY 2016
Jul - Sep Apr - Jun Jan - Mar Oct - Dec
Presenter
Presentation Notes
Drainage expenses are up 5% or $180,075 Primary reason drainage maintenance projects Drainage expenses are at 78% of budget Estimated fund balance - $4.8M
Hotel/Motel Occupancy Tax Revenues
19
$611,416 $551,381
$570,546 $532,618
$667,563 $604,233
$605,170 $726,004
$2,454,695 $2,414,236
$0
$400,000
$800,000
$1,200,000
$1,600,000
$2,000,000
$2,400,000
$2,800,000
FY 2015 FY 2016
Jul - Sep Apr - Jun Jan - Mar Oct - Dec
Presenter
Presentation Notes
Revenues are down 1.6% or $40,459 Revenues are at 94% of budget Hotel/Motel tax audit in the upcoming months (Online reporting for hotel/motel owners)
Hotel/Motel Occupancy Tax Expenditures
20
$381,392 $292,463
$477,213 $548,607
$1,144,048
$539,871
$585,278
$1,084,537
$2,587,931 $2,465,478
$0
$400,000
$800,000
$1,200,000
$1,600,000
$2,000,000
$2,400,000
$2,800,000
FY 2015 FY 2016
Jul - Sep Apr - Jun Jan - Mar Oct - Dec
Presenter
Presentation Notes
Expenditures are down $122,453 or 5% Grants to the Arts is down - $99,221 Timing of 3 grant payments accounts for - $50,000 Expenditures are at 90% of budget Estimated fund balance $352,117