drying characteristics of saskatoon berries under ... · drying characteristics of saskatoon...
TRANSCRIPT

Drying Characteristics of Saskatoon Berries under
Microwave and Combined Microwave-Convection Heating
A Thesis Submitted to the
College of Graduate Studies and Research
in Fulfillment of the Requirements for the
Degree of Master of Science
in the Department of Agricultural and
Bioresource Engineering,
University of Saskatchewan, Saskatoon.
Thesis Submitted By
Lakshminarayana Reddy
Lakshminarayana Reddy, All rights reserved. March 2006.

ii
PERMISSION TO USE
In presenting this thesis in partial fulfillment of the requirements for a
postgraduate degree from the University of Saskatchewan, I agree that the
Libraries of this University may make it freely available for inspection. I further
agree that permission for copying of this thesis in any manner, in whole or in part,
for scholarly purposes may be granted by the professor or professors who
supervised my thesis work or, in their absence, by the Head of the Department or
Dean of the College in which my thesis work was done. It is understood that any
copying or publication or use of this thesis or parts thereof for financial gain shall
not be allowed without my written permission. It is also understood that due
recognition shall be given to me and to the University of Saskatchewan in any
scholarly use which may be made of any material in my thesis.
Requests for permission to copy or to make other use of material in this thesis in
whole or in part should be addressed to:
Head of the Department
Department of Agricultural and Bioresource Engineering
57 Campus Drive
University of Saskatchewan
Saskatoon, Saskatchewan S7N5A9

iii
DEDICATION
Dedicated to my Amma (mother)

iv
ACKNOWLEDGEMENT
I thank my parents, brothers and all family members for their support. My thanks
to Mr. Ramachandra, Dr. Ranganna and dearest friends Arun and Nagaraj for
their moral support, in fulfilling the thought of pursuing M. Sc. education abroad.
My special thanks to my supervisor Dr. Meda, who has been a mentor and has
supported right through the M. Sc. program.
I thank Dr. Panigrahi for his assistance and his constant support.
Mr. Wayne Morley (Electronics Technologist) was instrumental in technically
guiding in the electronics assembly and development of the microwave drying
system. My special thanks to him.
I thank Mrs. Grace Whittington, President and CEO, Riverbend plantations Inc.,
for providing us with saskatoon berries and all the support in carrying out this
research work.
My thanks to all the graduate advisory committee members who have constantly
helped in framing the research study.
Thanks to Mr. Bill Crerar and Mr. Louis Roth for helping in instrumentation work.
Finally, thanks to all my co-graduate students and Department of Agricultural and
Bioresource Engineering.
Special thanks to all the members of Saskatoon Kannada community for making
me feel this place the same as home.
Thanks to my supervisor‘s NSERC grant and Department of Agricultural and
Bioresource for funding.

v
ABSTRACT
The study on dehydration of frozen saskatoon berries and the need for dried
fruits have been strategically identified in the Canadian Prairies. The motivation
for this research was to find a suitable method for dehydration and extend
saskatoon berry shelf life for long term preservation. Microwave, convection and
microwave-convection combination drying processes were identified to finish-dry
saskatoon berries after osmotic dehydration, using sucrose and high fructose
corn syrup (HFCS) sugar solutions. Osmotic dehydration removes moisture in
small quantities introducing solutes into the fruit that acts as a preservative and
also reduces the total drying time.
Due to the very short harvesting season of saskatoon berries, an accelerated
process such as the microwave combination drying can reduce the moisture to
safe storage levels immediately after harvest. Untreated and osmotically
dehydrated berries were subjected to convection (control), microwave and
microwave-convection combination drying conditions at different product drying
temperatures (60, 70 and 80oC) until final moisture content was 25% dry basis. A
laboratory-scale microwave combination dryer was developed with integrated
temperature and moisture loss data acquisition systems using LabView 6i
software. A thin-layer cross flow dryer was used for convection-only drying and
for comparison.
Drying kinetics of the process were studied and curve fitting with five empirical
equations, including the Page equation, was carried out to determine drying
constant, R2 and standard error values. The microwave-combination drying
method proved to be the best for drying saskatoon berries. Dehydrated product
quality analyses were accomplished by measuring the color changes, rehydration
ratio and any structural changes, using a scanning electron microscope
technique.

vi
This research was instrumental in the modification and development of a novel
drying system for high-moisture agricultural materials (fruits). Microwave-
convection combination drying at 70oC, yielded good results with higher drying
rates and better end-product quality.

vii
TABLE OF CONTENTS
PERMISSION TO USE -------------------------------------------------------------------------- ii
DEDICATION-------------------------------------------------------------------------------------- iii
ACKNOWLEDGEMENT ------------------------------------------------------------------------ iv
ABSTRACT -----------------------------------------------------------------------------------------v
TABLE OF CONTENTS ----------------------------------------------------------------------- vii
LIST OF TABLES----------------------------------------------------------------------------------x
LIST OF FIGURES------------------------------------------------------------------------------- xi
LIST OF SYMBOLS AND GLOSSARY ---------------------------------------------------- xv
I. INTRODUCTION ------------------------------------------------------------------------------1
1.1 Objectives -----------------------------------------------------------------------------------2
1.2 Organization of the Thesis --------------------------------------------------------------3
II. LITERATURE REVIEW ---------------------------------------------------------------------4
2.1 Saskatoon Berries-------------------------------------------------------------------------4
2.2 Saskatoon Berry Composition----------------------------------------------------------6
2.3 Saskatchewan Fruit Sector -------------------------------------------------------------7
2.4 Fruit Pretreatment ----------------------------------------------------------------------- 10
2.4.1 Chemical Pretreatment -------------------------------------------------------------- 10
2.4.2 Osmotic Dehydration----------------------------------------------------------------- 10
2.5 Freezing vs. Drying --------------------------------------------------------------------- 12
2.6 Dehydration/Drying---------------------------------------------------------------------- 12
2.7 Electrical Properties of Foods -------------------------------------------------------- 13
2.7.1 General Principles – Microwave Parameters (Dielectric Properties) ----- 14
2.8 Microwave Drying ----------------------------------------------------------------------- 14
2.8.1 Microwave-Hot-Air Combination Drying ----------------------------------------- 15
2.9 End-product Quality Analysis--------------------------------------------------------- 16
2.10 Berry Drying Studies ------------------------------------------------------------------ 16
2.11 Summary--------------------------------------------------------------------------------- 17
III. MATERIALS AND METHODS---------------------------------------------------------- 18

viii
3.1. Experimental Plan and Procedure-------------------------------------------------- 18
3.1.1 Berry Sample Preparation ------------------------------------------------------- 19
3.1.2 Chemical Pretreatment -------------------------------------------------------------- 19
3.1.3 Osmotic Dehydration----------------------------------------------------------------- 20
3.1.4 Saskatoon Berry Drying ------------------------------------------------------------- 21
3.1.5 Microwave and Microwave-Convection Drying ----------------------------- 22
3.1.6 Convection Drying ----------------------------------------------------------------- 22
3.2 Analytical Procedures ------------------------------------------------------------------ 22
3.2.1 Moisture Content Determination------------------------------------------------ 23
3.2.2 Total Soluble Solids (TSS) Measurement------------------------------------ 23
3.2.3 Dielectric Properties Measurement and Sample Preparation ----------- 23
3.3 Dehydrated Product Quality Analysis----------------------------------------------- 26
3.3.1 Color Measurements -------------------------------------------------------------- 26
3.3.2 Rehydration Test ------------------------------------------------------------------- 27
3.3.3 Micro-structural Analysis --------------------------------------------------------- 27
3.4 Modeling of Drying Process----------------------------------------------------------- 30
3.4.1 Moisture Ratio Determination --------------------------------------------------- 30
3.5 Statistical Analysis ---------------------------------------------------------------------- 32
3.5.1 Chemical Pretreatment ----------------------------------------------------------- 32
3.5.2 Osmotic Dehydration-------------------------------------------------------------- 32
3.5.3 Drying Experiments---------------------------------------------------------------- 33
IV. DEVELOPMENT OF A MICROWAVE DRYER SYSTEM----------------------- 34
4.1. Configuration of Microwave-Convection Oven ---------------------------------- 34
4.2. Microwave and Convection System Instrumentation -------------------------- 35
4.3. Convection Air Temperature Controller Installation ---------------------------- 36
4.3.1 Airflow Rate Measurement------------------------------------------------------- 40
4.4 Data Acquisition Module Integration ------------------------------------------------ 40
4.4.1. Temperature Data Acquisition ------------------------------------------------- 41
4.4.2. Data Acquisition Software------------------------------------------------------- 42
4.4.3. Online Weight-Loss Measurement-------------------------------------------- 42
4.5. Standard Reference Material (Water) Testing----------------------------------- 46

ix
4.6 Summary ---------------------------------------------------------------------------------- 47
V. RESULTS AND DISCUSSION---------------------------------------------------------- 49
5.1. Chemical Pre-treatment Experiments --------------------------------------------- 49
5.1.1. Effect on Osmotic Dehydration ------------------------------------------------ 51
5.2. Osmotic Dehydration (OD) Experiments------------------------------------------ 53
5.2.1. Effect on Moisture Loss and Solid Gain ------------------------------------- 54
5.2.3. Effect on Dielectric Properties-------------------------------------------------- 58
5.3. Drying Characteristics ----------------------------------------------------------------- 60
5.3.1. Drying Time------------------------------------------------------------------------- 61
5.3.2. Effect of Drying Mode ------------------------------------------------------------ 64
5.3.3. Effect of Osmotic Dehydration on Drying------------------------------------ 67
5.4. Modeling of Drying Process---------------------------------------------------------- 68
5.4.1. Evaluation of Thin-layer Drying Equation ----------------------------------- 68
5.4.2. Data Analysis----------------------------------------------------------------------- 69
5.4.3. Quality Analysis-------------------------------------------------------------------- 75
5.5 Summary ---------------------------------------------------------------------------------- 79
VI. CONCLUSIONS --------------------------------------------------------------------------- 80
6.1. Recommendations for Future Work------------------------------------------------ 82
REFERENCES----------------------------------------------------------------------------------- 83
APPENDIX ---------------------------------------------------------------------------------------- 88
Appendix A1. Microwave Combination Drying at 60, 70 and 80oC--------------- 89
Appendix A2. Microwave drying at 60, 70 and 80oC--------------------------------- 91
Appendix A3. Convection drying at 60, 70 and 80oC -------------------------------- 93
Appendix A4. Temperature trends during microwave drying at 60oC.----------- 99
Appendix B1. Microwave drying of fresh blueberries ------------------------------ 100
Appendix C1. Dielectric properties of saskatoon berries ------------------------- 101
Appendix D1. Scanning Electron Microscope images of saskatoon berries - 105
Appendix E1. Digital Images of Experimental Setup ------------------------------ 106

x
LIST OF TABLES
Table 2.1 Nutrient values of berries grown in Western Canada -----------------------6
Table 2.2 Physico-chemical characteristics of five saskatoon cultivars--------------7
Table 2.3 Saskatchewan statistics for Horticulture products (2001 Census of
Agriculture) ------------------------------------------------------------------------------------8
Table 2.4 Canadian Statistics for Horticulture products (2001 Census of
Agriculture) ------------------------------------------------------------------------------------8
Table 2.5 Number of acres of fruit crops planted in the Province of Saskatchewan
in the year 2004------------------------------------------------------------------------------9
Table 2.6 Major fruit processing and research centers in the Province of
Saskatchewan--------------------------------------------------------------------------------9
Table 3.2 Drying models fitted for the drying data--------------------------------------- 31
Table 4.1 Measured output power of the microwave system------------------------- 47
Table 5.1 Moisture content and total soluble solids of osmotic dehydrated berries
after chemical pre-treatment------------------------------------------------------------ 50
Table 5.2 TSS and moisture content values during osmotic dehydration from 6 to
36 h duration-------------------------------------------------------------------------------- 54
Table 5.3 Drying time and drying rate for untreated saskatoon berries ----------- 63
Table 5.4 Drying time and drying rate for osmotic dehydration of saskatoon
berries with sucrose (60% and 24h). ------------------------------------------------- 67
Table 5.5 Coefficient of determination and standard error values for different
equations. ----------------------------------------------------------------------------------- 70
Table 5.6 Rehydration ratios of sucrose osmotic dehydrated berries at different
drying conditions--------------------------------------------------------------------------- 76
Table 5.7 Rehydration ratio of microwave-dried berries with and without osmotic
dehydration.--------------------------------------------------------------------------------- 77
Table 5.8 Hunterlab colorimeter parameters of untreated and sucrose pretreated
berries under microwave, convection and combination drying conditions--- 78

xi
LIST OF FIGURES
Figure 3.1 Stages of saskatoon berry drying / dehydration process. --------------- 18
Figure 3.2 Open-ended coaxial probe and adjustable platform. --------------------- 25
Figure 3.3 Photograph of SEM system with computer. -------------------------------- 29
Figure 3.4 Functional components and operating principle of Scanning Electron
Microscope (SEM).------------------------------------------------------------------------ 30
Figure 4.1 Front panels of the microwave drying system (left panel to set
microwave power and run-time and right panel to set and monitor convection
temperatures).------------------------------------------------------------------------------ 36
Figure 4.2 Teflon block fabricated to insert fibre optic temperature probes in to
the microwave cavity.--------------------------------------------------------------------- 37
Figure 4.3 An assembly of fibre optic temperature sensors and signal conditioner
for temperature measurement. --------------------------------------------------------- 37
Figure 4.4 Aerial view of the convection fan and the belt pulley arrangement. -- 38
Figure 4.5 Flowchart of the convection heating system explaining the working
operation of the convection heating circuit. ----------------------------------------- 39
Figure 4.6 Temperature data acquisition flowchart explaining the step-by-step
procedure adapted in temperature data acquisition.------------------------------ 40
Figure 4.7 Temperature data acquisition main screen of LabView 6i program.-- 41
Figure 4.8 Ohaus balance mounted on top of the microwave system to record
online weight loss data. ------------------------------------------------------------------ 42
Figure 4.9 Weight-loss data acquisition flowchart indicating the step-by-step
procedure adapted in temperature data acquisition.------------------------------ 43
Figure 4.10 Sample holder connected to a weighing scale by nylon string. ------ 44
Figure 4.11 Weight-loss data acquisition snap-shot of LabView program.-------- 44
Figure 4.12 Sample holder with saskatoon berry dried samples with temperature
sensors. -------------------------------------------------------------------------------------- 45
Figure 5.1 Saskatoon berries brix levels (TSS) after Chemical Pre-treatment and
6 h Osmotic Dehydration with high fructose corn syrup.------------------------- 50
Figure 5.2 Frozen berry cut section of the berry skin under SEM. ------------------ 52

xii
Figure 5.3 SEM of saskatoon berry osmotically dehydrated with 50% high
fructose corn syrup (HFCS) solution for 24 h without chemical pre-treatment.
------------------------------------------------------------------------------------------------- 52
Figure 5.4 SEM of saskatoon berry osmotically dehydrated with 50% sucrose
solution for 24 h without chemical pre-treatment. --------------------------------- 53
Figure 5.5 Moisture content during the 36 h osmotic dehydration in sucrose
solution at 40, 50 and 60% concentrations.----------------------------------------- 55
Figure 5.6 Moisture content during 36 h osmotic dehydration in high fructose corn
syrup (HFCS) solution at 40, 50 and 60% concentrations.---------------------- 55
Figure 5.7 TSS (in brix) during 36 h osmotic dehydration in sucrose solution at
40, 50 and 60% concentrations. ------------------------------------------------------- 56
Figure 5.8 TSS (in brix) during 36 h osmotic dehydration in high fructose corn
syrup solution at 40, 50 and 60% concentrations.--------------------------------- 57
Figure 5.9 Osmotic dehydration effects on dielectric properties after 12 and 24 h
durations at 50% high fructose corn syrup concentration. ---------------------- 58
Figure 5.10 Osmotic dehydration effects on dielectric properties at 40, 50 and
60% high fructose corn syrup concentrations and respective frequencies
(915 and 2450 MHz). --------------------------------------------------------------------- 59
Figure 5.11 Drying temperature trends at combination P1, P2 and P3 levels (60,
70 and 80oC respectively) and its effect on drying time. ------------------------- 62
Figure 5.12 Drying temperature trends at microwave P1, P2 and P3 power levels
(60, 70 and 80oC respectively) and its effect on drying time. ------------------- 62
Figure 5.13 Drying of untreated berries at 70oC under microwave, convection and
combination drying conditions. --------------------------------------------------------- 65
Figure 5.14 Microwave drying of osmotically treated and untreated berries at
70oC.------------------------------------------------------------------------------------------ 66
Figure 5.15 Midilli equation drying curve fit for sucrose osmotic dehydration
combination drying at 60oC.------------------------------------------------------------- 71
Figure 5. 16 Modified drying equation drying curve fit for sucrose combination
drying at 80oC. ----------------------------------------------------------------------------- 72

xiii
Figure 5.17 Midilli equation drying curve fit for sucrose osmotic dehydration
microwave drying at 70oC. -------------------------------------------------------------- 73
Figure 5.18 Midilli equation drying curve fit for sucrose osmotic dehydration
convection drying at 70oC .-------------------------------------------------------------- 74
Figure 5.19 Sharma’s equation drying model curve fit for combination drying
method at 60oC.---------------------------------------------------------------------------- 75
Figure A1 Microwave combination drying of untreated saskatoon berries at 60,
70 and 80oC temperatures and corresponding weight loss plotted against
time (min). ----------------------------------------------------------------------------------- 89
Figure A2 Microwave combination drying (weight, g) of sucrose osmotic
dehydrated saskatoon berries at 60, 70 and 80oC temperatures and
corresponding weight loss plotted against time (min). --------------------------- 90
Figure A3 Microwave drying (weight, g) of untreated saskatoon berries at 60, 70
and 80oC temperatures and corresponding moisture loss plotted against
time (min). ----------------------------------------------------------------------------------- 91
Figure A4 Microwave drying (weight, g) of sucrose osmotic dehydrated
saskatoon berries at 60, 70 and 80oC temperatures.----------------------------- 92
Figure A5 Convection drying (weight, g) of sucrose osmotic dehydrated
saskatoon berries at 60oC temperature. --------------------------------------------- 93
Figure A6 Convection drying (weight, g) of high fructose corn syrup osmotic
dehydrated saskatoon berries at 60oC temperature. ----------------------------- 94
Figure A7 Convection drying (weight, g) of untreated saskatoon berries at 60oC
temperature. -------------------------------------------------------------------------------- 95
Figure A8 Convection drying (weight, g) of sucrose osmotic dehydrated
saskatoon berries at 70oC temperature. --------------------------------------------- 96
Figure A9 Convection drying (weight, g) of untreated saskatoon berries at 70oC
temperature. -------------------------------------------------------------------------------- 97
Figure A10 Convection drying (weight, g) of untreated saskatoon berries at 80oC
temperature. -------------------------------------------------------------------------------- 98

xiv
Figure A11 Microwave drying product temperatures of high fructose corn syrup
treated saskatoon berries at 60oC product temperature and corresponding
air temperature (oC) plotted against time (min).------------------------------------ 99
Figure B1 Blueberries disintegrated structure after low power microwave drying.
----------------------------------------------------------------------------------------------- 100
Figure C1 Dielectric properties of frozen saskatoon berry syrup. ----------------- 101
Figure C2 Dielectric loss factor variation of saskatoon berry syrup after osmotic
dehydration with 40, 50 and 60% sucrose sugars solutions. ----------------- 101
Figure C.3 Effect of high fructose corn syrup Concentration on Osmotic
Dehydration. ------------------------------------------------------------------------------ 102
Figure C4 Dielectric loss factor (ε") variation with frequency of Fresh saskatoon
berries. ------------------------------------------------------------------------------------- 102
Figure C5 Dielectric properties of fresh whole, cut and syrup of berries.-------- 103
Figure C6 Dielectric constant (ε’) variation with frequency of frozen saskatoon
berries (whole and crushed). --------------------------------------------------------- 103
Figure C7 Dielectric constant and Loss factor variation with frequency of water.
----------------------------------------------------------------------------------------------- 104
Figure D1 Scanning electron microscope image of osmotically dehydrated
berries with 50% sucrose solution. -------------------------------------------------- 105
Figure E1 Frozen saskatoon berries. ----------------------------------------------------- 106
Figure E2 Thawed saskatoon berries placed in polycarbonate sample holder. 106
Figure E3 Panel to switch between preset and modified settings. ---------------- 107
Figure E4 Front panel with temperature controller and setup to monitor
convection and microwave run-time. ----------------------------------------------- 107
Figure E5 Inverter technology built in the Panasonic microwave-convection
system.------------------------------------------------------------------------------------- 108

xv
LIST OF SYMBOLS AND GLOSSARY
MC Moisture Content (%)
RH Relative Humidity (%)
m/s Airflow Rate Unit
brix Total Soluble Solids Unit
MR Moisture Ratio
k Drying Constant (h-1)
W Unit of Power (Watts)
V Unit of Voltage (Volts)
P1, P2 and P3 Microwave Power Levels (In-built)
MC/min Drying Rate Unit
Saskatoons saskatoon berries
OD Osmotic Dehydration
COR Coefficient of Rehydration
SEM Scanning Electron Microscope
TSS Total Soluble Solids
MW Microwave
RF Radio Frequency
DAQ Data Acquisition
HP Hewlett-Packard
I/O Input / output
HFCS High Fructose Corn Syrup
ε' Dielectric Constant
ε” Dielectric Loss Factor
L Lightness Indicator
a and b Chromacity Coordinates
∆Eab Total Color Difference
TSS Total Soluble Solids (brix)
MHz Unit of Frequency (Mega Hertz)

xvi
δ Loss angle of dielectric (dissipation factor)
FSA Food Standard Agency
EU European Union
SSR Solid State Relay
GLOSSARY OF TERMS
Equilibrium MC Moisture content of the material after it has been exposed to
(EMC) a particular environment for an infinitely long period of time.
Relative Humidity Defined as ratio of vapor pressure of water in the air to the
(RH) vapor pressure of water in saturated air at the same
temperature and atmospheric pressure.
Osmotic - Two-way counter flow of fluids from food material into an
Dehydration (OD) osmotic solution through a semi-permeable membrane.
U-Pick Harvesting operation for fruits where consumer picks fruits of
desired quality and quantity on the farm.

1
I. INTRODUCTION The technique of dehydration is probably the oldest method of food preservation
practiced by humankind. The removal of moisture prevents the growth and
reproduction of microorganisms causing decay and minimizes many of the
moisture-mediated deteriorative reactions. It brings about substantial reduction in
weight and volume, minimizing packaging, storage and transportation costs and
improves storability of the product under ambient temperatures. These features
are especially important for both developed and developing countries in military
feeding and new product formulations.
Saskatoon berries (Amelanchier alnifolia), also known as saskatoons are grown
primarily in the Prairie Provinces of Canada and the plains of the United States.
Up to nine varieties of saskatoons are reported according to their habitat,
flowering and ripening time, growth form and size, color, seediness and flavor for
production (Turner, 1997). Certain varieties are more likely to be dried fresh like
raisins for winter use, while others are cooked to the consistency of jam before
being dried. The berries are an excellent source of vitamin C, manganese,
magnesium, iron and a good source of calcium, potassium, copper and carotene.
The berries are also higher in protein, fat and fibre content, than most other fruits
(Turner et al., 1990).
The length of saskatoon berry harvest season ranges from 1 to 4 weeks. Many
producers are not able to harvest and sell their entire crop during the short
harvest season. Freezing on the farm has increased market flexibility for
consumers, producers and processors by extending the length of time
saskatoons are available. Frozen saskatoon berries are marketed for direct
consumption and for processed product manufacture.
2
A sharp rise in energy costs has promoted a dramatic upsurge in interest in
drying Worldwide over the last decade. Advances in techniques and
development of novel drying /processing methods have made available a wide
range of dehydrated products, especially instantly reconstitutable ingredients,
from fruits and vegetables with properties that could not have been foreseen
some years ago (Ratti and Mujumdar, 1995). Longer shelf-life, product diversity
and substantial volume reduction are the reasons for popularity of dried berries,
and this could be expanded further with improvements in product quality and
process applications. These improvements could increase the current degree of
acceptance of dehydrated berries (saskatoons, blueberries etc.) in the market.
Microwave and microwave-combination drying could be a possible alternative to
freezing of fresh berries. Freezing and storage of frozen berries are not only quite
expensive operations but also energy-intensive processes involving cold storage
logistics and economics, for the bulk of material.
1.1 Objectives
A very scant supply of data currently exists on processing (drying, processing,
packaging etc.) of fresh saskatoons to extend their shelf life. Even though drying
of horticultural crops (fruits, vegetables and spices) has been reported, there is
not much literature reported on drying/dehydration of saskatoon berries.
Therefore, the overall objective of this study was to develop an integrated drying
system suitable for berries (saskatoons, raspberries etc.) and in particular, to
study the drying behavior of saskatoons and to compare the drying
characteristics under microwave, convection and microwave-convection drying
methods with respect to drying, shrinkage and rehydration characteristics
obtained by these drying schemes.

3
The specific objectives of this research were:
1. to modify a domestic microwave oven and eventually develop the
microwave-convection combination drying system for real-time weight-loss
and temperature monitoring along with data acquisition,
2. to evaluate osmotic dehydration as a pre-treatment for drying and study its
effect on dielectric properties, drying rate, and final berry quality and
3. to conduct drying studies under microwave and microwave-convection
combination and convective (thin-layer) conditions using the newly
developed dryer and study the quality and sensory evaluation (rehydration
and color) characteristics.
1.2 Organization of the Thesis
This thesis is complete with six chapters, references and appendix sections.
Each chapter ends with a ‘Summary’ of that chapter.
Chapter II outlines the background research and review of literature;
Chapter III is the materials and methods section;
Chapter IV explains development of a microwave dryer system;
Chapter V is the results and discussion section;
Chapter VI is the conclusions section of the thesis.

4
II. LITERATURE REVIEW
According to Statistics Canada, in 2001 the food processing industry sector
contributed 6.3% to the Canadian Gross Domestic Product (GDP). This sector
was mainly comprised of meat processing, bakery, fruit and vegetable
processing (specialty products) industries (Statistics Canada, 2001).
The major fruit crops of Canada are apples, oranges, prairie berry and cherry
crops. Prairie fruits include blueberries, cranberries, saskatoon berries and
chokecherries. Many of these prairie fruits are gaining importance as a
commercial fruit crop and more and more producers are planting for diversified
commercial production /processing. This poses a need for research studies to
preserve and process for extended shelf-life of these crops (Statistics
Saskatchewan, 2001).
2.1 Saskatoon Berries
Amelanchiar alnifolia is the botanical name and this Prairie fruit belongs to the
rose family (Rosaceae). Saskatoon berry is also identified as juneberry, western
service berry and most commonly as saskatoons. Most common cultivars of
saskatoons are:
arborea (Downy serviceberry),
asiatica (Asian serviceberry),
canadensis (shadblow serviceberry) and
laevis (Allegheny serviceberry).
In the past two decades, saskatoons have gained importance as a commercial
fruit crop from being a wild fruit of the Prairies. Saskatchewan has a total of 376
hectares and Alberta the largest producer of saskatoons, lists 617 hectares of
saskatoon berry production, according to a 2001 census. Currently saskatoons

5
are being exported to United Kingdom (U.K.) after a 2004 European Union
agreement. There is an increasing demand for fresh and processed saskatoon
berries in the international market (Canada’s International Market Access
Priorities, 2005).
Researchers have started exploring the post harvest applications of saskatoon
berries from the past decade or so. After the research studies by Green and
Mazza (1986) on saskatoon berries (saskatoons) confirming that saskatoons are
rich in anthocyanins and antioxidants which prevent heart diseases and cancer,
more importance has been given to large-scale production of saskatoons. Green
and Mazza (1986) also confirmed that dried saskatoons can be used in
nutraceuticals, functional foods and extraction of bioactives.
The current post-harvest operation for fresh saskatoons is primarily to freeze the
berries within 2 h of harvest to make them available for year-round consumption.
Frozen berries are used to prepare processed products such as jams, jellies, fruit
extracts, and other products. It is noted that only 15% of the total saskatoon berry
production is sold as fresh fruit in the super markets due to the short shelf life of
the berries and loss of fruit integrity, flavor and quality only a few days after
harvest (Research and Discover, 2005). The harvest season also lasts for about
three weeks which leaves freezing as the only post-harvest process method to
preserve the produce. Very recently, processed saskatoons products have been
sold at retail outlets (e.g., Zellers, Co-op stores) in Western Canada.
Currently, little or no research studies are reported to explore the possibility of
drying (dehydration) saskatoon berries. Blueberries and grapes were
successfully dried to raisins (from grapes) by Kostaropoulus and Saravacos
(1995), Venkatachalapathy (1998) and Grabowski et al. (1994). Osmotic
dehydration pretreatment in grapes to infuse sugars and remove small quantities
of moisture was investigated by Venkatachalapathy (1998).

6
Saskatoon berries like other raisin crops such as grapes, cranberries, cherries
and blueberries have a protective waxy layer on the surface protecting the fruit
from weather changes, insect and parasite attack and controlling the rate of
transpiration (Mazliak 1970; Somogyi and Luh 1986; Somogyi et al., 1984). This
protective layer obstructs the removal of moisture during dehydration or drying.
Different chemical pretreatments using alkali or ethyl oleate with NaOH solutions
have yielded positive results in drying of blueberries, grapes and strawberries
(Kostaropoulus and Saravacos (1995), Venkatachalapathy (1998) and Tulasidas
et al., (1994)).
In this research, effort was made to investigate the application of advanced
drying techniques (microwave and microwave combination) to extend the shelf
life of saskatoon berries. An osmotic dehydration step was explored as a pre-
treatment operation in order to target the reduction of total drying time.
2.2 Saskatoon Berry Composition
Table 2.1 Nutrient values of berries grown in Western Canada
Per 100g Saskatoons Blueberries Strawberries Raspberries
Energy (Ca) 84.84 51 37 49
Protein (g) 1.33 0.42 0.7 0.91
Carbohydrate (g) 18.49 12.17 8.4 11.57
Total Lipid (g) 0.49 0.64 0.5 0.55
Total Fiber (g) 5.93 2.7 1.3 4.9
Vitamin C (mg) 3.55 2.5 59 25
Iron (mg) 0.96 0.18 1 0.75
Potassium (mg) 162.12 54 21 152
Vitamin A (IU) 35.68 100 27 130
Source of Data: Mazza and Davidson, 1993

7
The pH value of saskatoon berries varies between 4.2 and 4.4 due to the
presence of malic acid. Total soluble solids (TSS) range from 20 to 29.4%.
Sucrose levels are between 15.9 and 23.4%, and reducing sugars range from 8
to 12% of fresh fruit weight (Mazza 1979, Green and Mazza 1986). Chemical
composition of different prairie berries are listed in Table 2.1 and physico-
chemical characteristics of different saskatoon berry cultivars are listed in Table
2.2.
Table 2.2 Physico-chemical characteristics of five saskatoon cultivars
Cultivar 10 Berry
wt. pH Titrable acidity
Total Solids
Soluble Solids SS/Ac Anthocyanins
(g) (% malic acid) (% dry wt) (% sucrose) mg/100g
Honeywood 12.7 3.8 0.54 25.6 18.7 34.7 114
Northline 8 3.9 0.45 25.1 16.1 35.5 111
Porter 7.8 3.8 0.56 22.7 16.3 29.5 108
Regent 6.8 4.4 0.29 20.8 14.8 52.8 72
Smoky 10.1 4.5 0.25 27 16.3 66.2 68
Source: Mazza and Davidson, 1993
2.3 Saskatchewan Fruit Sector
Table 2.3 lists the total number of farms in Saskatchewan between 1985 and
2001. The number of hectares of berries and grapes has increased considerably
over this 20-year period. This shows that more farmers are planting berry crops
for their commercial value. Production statistics for the province of Saskatchewan
and Canada are listed in Table 2.3 and Table 2.4.

8
Table 2.3 Saskatchewan statistics for Horticulture products (2001 Census of
Agriculture)
(Saskatchewan) 1981 1986 1991 1996 2001
Total number of farms 67,318 63,431 60,840 56,995 50,598
Total berries and grapes (Ha) 8 120 225 443 542
Total vegetables (Ha) 595 491 422 477 397
1. Conversion factor: 1 hectare equals 2.471 acres.
2. Conversion factor: 1 square meter equals 10.76391 square feet.
Source: Statistics Canada, Census of Agriculture.
Table 2.4 Canadian Statistics for Horticulture products (2001 Census of
Agriculture)
(Canada) 1981 1986 1991 1996 2001
Total number of farms 318,361 293,089 280,043 276,548 246,923
Total berries and grapes (Ha) 31,458 40,470 45,759 57,523 69,165
Total vegetables (Ha) 117,216 116,573 122,594 127,697 133,851
1. Conversion factor: 1 hectare equals 2.471 acres.
2. Conversion factor: 1 square meter equals 10.76391 square feet.
Source: Statistics Canada, Census of Agriculture
In 2004, there were approximately 550 fruit growers in the province and an
estimated 728 hectares planted to fruit crops (Table 2.5). Producers and
processors originally focused on four major crops: saskatoon berry, strawberry,
chokecherry and sea buckthorn. The industry is now rapidly expanding
production to include a number of new crops (sour cherries and haskaps). With
recent developments in the domestic fruit program at the Department of Plant
Sciences, University of Saskatchewan, the industry is now also focusing on dwarf
sour cherries, blue honeysuckle (haskaps), dwarf apples and black currant.
There are 10 major processors marketing frozen and processed fruit and fruit

9
products in Saskatchewan (Table 2.6) and approximately 70 people employed in
the fruit processing industry.
Table 2.5 Number of acres of fruit crops planted in the Province of Saskatchewan
in the year 2004
No. Fruits Planted Hectares 1 Saskatoon berry 505
2 Strawberry 100
3 Dwarf Sour Cherry 60
4 Apple 40
5 Raspberry 40
6 Chokecherry 40
7 Blue Honeysuckle 8
8 Black Currant 6
Source: Canada's Fruit Industry, Government of Canada, http://ats.agr.ca Table 2.6 Major fruit processing and research centers in the Province of
Saskatchewan
No. Food Processing / Research Centre City 1 Berryview Farms Lloydminster 2 C and V Orchards Weyburn 3 Dawn Food Products (Canada) Ltd. Saskatoon 4 Gramma Beps Swift Current 5 Harvest Pie Pangam 6 Heavenly Hills Orchard Blaine Lake 7 Last Mountain Berry Farms Southey 8 Nature Berry Air Ronge 9 Parenteau's Saskatoon Berry Langham
10 Prairie Berries Inc. Keeler 11 Riverbend Plantation Saskatoon 12 Saskatchewan Food Development Centre Saskatoon 13 Saskatchewan Food Centre Saskatoon 14 University of Saskatchewan (Ag Eng. College)Saskatoon
Source: Canada's Fruit Industry, Government of Canada, http://ats.agr.ca

10
2.4 Fruit Pretreatment
Fruit pretreatments including chemical pretreatment, freezing, thawing and
osmotic dehydration can influence the dehydration and/or drying rate as well as
maintain the overall quality of the final product.
2.4.1 Chemical Pretreatment
As stated in an earlier section, the waxy layer on the skin of saskatoon berries
obstructs diffusion of solutes during dehydration and also slows down the drying
process. Alkaline dipping by Salunkhe et al, (1991) has shown improvement in
drying by forming fine cracks on the fruit surface. Ethyl esters dipping as a
pretreatment to drying produced a significant reduction in the drying time
(Tulasidas et al., 1993; Ponting and McBean, 1970)
2.4.2 Osmotic Dehydration
Osmotic dehydration is a complex process of counter-current mass transfer
between the plant tissue and a hypertonic solution. This leads to dehydration of
the material and changes in its chemical composition as well (Ratti and
Mujumdar, 1995). Hence, it must be expected that the properties of the material
dehydrated by osmosis will differ substantially from those dried by convection
methods.
The two-step combination of thermal drying after osmotic dehydration is noted as
an energy-efficient drying technology (Lewicki and Lenart, 1992; Grabowski and
Mujumdar, 1992; Grabowski et al. 1994). Osmotic dehydration removes
considerable amounts of moisture without any application of thermal energy and
also infuses sugars into the fruit (mainly aimed at raisin fruits such as saskatoon
berries, blueberries, cranberries, etc.) which also is a good self-preservative.

11
Osmotic dehydration followed by thermal drying (accelerated drying methods) in
combination with convection air or vacuum help reduce the moisture content to
safe storage levels with minimal loss of natural colorant and chemical
compositions (Tulasidas et al 1994). Saskatoons are rich in natural colorant and
also in anthocyanins which are antioxidants. Dried saskatoons can be used in the
manufacture of other processed bakery products such as cookies, icecreams,
cakes and snacks. It also has applications in the pharmaceutical industry for
extraction of nutraceuticals /functional foods and micro-encapsulation of bioactive
compounds and natural health ingredients.
Traditional drying methods such as flat bed, thin-layer cross-flow and cabinet
dryers have high demands in energy and time and compromise the nutritional
quality of the end-product because of over-exposure to high temperatures for
long durations. Anthocyanins are heat sensitive and therefore, adapting
conventional drying techniques may lead to loss of valuable antioxidants in
saskatoons (Green and Mazza, 1986). Mantius and Peterson (1995) have
successfully infused sugar into cranberries but minimal work is done on
successful thermal drying of berries after sugar infusion (Ramaswamy and
Nsonzi, 1998; Karathanos et al., 1995).
Mazza et al. (1993) were successful in getting a chewy texture by osmotic-hot air
combination drying of blueberries. Few data currently exist on processing (drying,
processing, packaging etc.) of fresh saskatoons to extend shelf life and improve
stability for packaging and distribution. Only 10-12% of fresh saskatoon berries
are sold fresh and the remaining are either frozen or canned. Dark pigmentation
(color) of the fruit with its high nutritional content and significant anthocyanin
content will make it an attractive fruit to consumers.

12
2.5 Freezing vs. Drying
The frozen fruit and vegetable industry uses large amounts of energy in order to
freeze the large quantity of water present in fresh products. Huxsoll (1982)
proved that a reduction in moisture content of the material directly has a direct
implication on reducing the refrigeration load during freezing. Other advantages
of partially concentrating fruits and vegetables by osmotic dehydration (OD) or
sugar infusion prior to freezing includes savings in packaging and distribution
costs and higher end-product quality Further drying of the product can be
performed for preservation or utilization for product preparations. This will also
allow better handling and transporting operations.
The advantages of drying of fruits and vegetables compared with freezing are
listed as follows (Ratti and Mujumdar, 1995):
• large energy consumption for freezing and also to maintain the fruit in frozen
condition until it is either consumed or processed,
• as the bulk volume is not reduced due to freezing, more storage space is
required that again adds to the storage costs,
• drying reduces the moisture content of the produce that has an impact of
lowering the microbiological activity in the fruit, and
• drying without freezing the product itself will avoid the energy consumption for
freezing and in new product /process development.
2.6 Dehydration/Drying
The term drying refers generally to the removal of moisture from a substance. It
is the most common and most energy-consuming food preservation process.
With literally hundreds of variants actually used in drying of particulate solids,
pastes, continuous sheets, slurries or solutions, it provides the most diversity
among food engineering unit operations (Ratti and Mujumdar 1995).

13
Dehydration is a means of preserving the safety and quality of foods at the
forefront of technological advancements in the food industry. It has greatly
extended the consumer acceptable shelf life of appropriate commodities from a
few days and weeks to months and years. The lower storage and transportation
costs associated with the reduction of weight and volume due to water removal
have provided additional economic incentives for widespread use of dehydration
processes (Ratti and Mujumdar 1995). The expanding variety of commercial
dehydrated foods available today has stimulated competition to maximize their
quality attributes, to improve the mechanization, automation, packaging, and
distribution techniques and to conserve energy at maintained quality.
2.7 Electrical Properties of Foods Microwave frequency is between 300 MHz and 300 GHz and located in the high
frequency range on the electromagnetic spectrum, and heating of a material by
electromagnetic waves in the above mentioned frequency is defined as
microwave heating (Risman, 1991). Measurement of dielectric properties gives
insight into material temperature profiles, heating homogeneity and heat
dissipation patterns.
Measurement of dielectric properties of agricultural material helps us understand
the electrical behavior, level of mechanical damage and also predict moisture
content and bulk density of the material based on the indirect nondestructive
method of determining the physical characteristics. Venkatesh et al. (1998) found
that size reduction or chopping of corn at comparable bulk densities and moisture
contents had different dielectric properties. Nelson (1973) reported that
agricultural material dielectric properties are dependent on moisture content, bulk
density and size of the material.

14
2.7.1 General Principles – Microwave Parameters (Dielectric Properties)
The dielectric properties of usual interest are the dielectric constant (∈’),
dielectric loss factor (∈”) and penetration depth (Dp). ∈’ and ∈” are the real and
imaginary parts, respectively, of relative complex permittivity (∈r).
The dielectric properties are often defined by the complex permittivity equation
(Nelson, 1973):
”j - ' r ∈∈=∈ (2.1)
Where,
∈r= Complex permittivity,
∈’= Dielectric constant (real part), and
∈”= Dielectric loss factor (imaginary part).
Values that can be presented are those of the dielectric constant, ε’, and the
dielectric loss factor, ∈”, respectively, the real and imaginary parts of the
complex
relative permittivity, ∈=∈’ - j∈” (Nelson, 1973). Values for the loss tangent, tan δ
=∈”/∈’ (where δ is loss angle of the material) can be calculated from the ∈’ and
∈” values. The dielectric constant, loss factor, and loss tangent (sometimes
called the dissipation factor) are dimensionless quantities.
2.8 Microwave Drying
Microwave heating increases interior product temperature that is dependent on
the dielectric properties of the material (as discussed above) and this is
enhanced by an internal pressure gradient.

15
Microwave heating has three main advantages (Van Arsdel et al., 1973):
• A penetrating quality of electromagnetic waves and distribution leading to
uniform heating (unlike conventional drying where the surface gets over-
heated or even damaged due to high temperatures);
• Selective absorption by water (liquid), which leads to a uniform moisture
profile within the material; and
• Ease of control due to rapid, volumetric heating response.
2.8.1 Microwave-Hot-Air Combination Drying
Microwave and convection heating may be applied simultaneously or at different
times. It has been proven that combination drying is an effective way particularly
when microwaves are introduced in the final stages of drying to reduce the
product moisture below 20% (Mudgett, 1989). Microwave application can be
effectively utilized in the falling rate period where hot-air drying is too slow
affecting the quality of the dried product with over exposure to hot-air conditions.
Application of microwave or combination drying technique for potato (Bouraout
et al. 1994), apple and mushroom (Funebo and Ohlsson 1998), carrots (Litvin et
al. 1998, Prabhanjan et al. 1995, Lin et al. 1998), raisins (Kostaropoulos and
Saravacos 1995, Tulasidas and Raghavan 1993), herbs (Giese 1992),
blueberries (Ramaswamy and Nsonzi 1998) and banana (Maskan 2000) has
been successfully experimented. These researchers also noted the improvement
in the end product quality along with the reduction of total drying time compared
to hot-air only drying. This technique combines the capability of microwaves to
heat the product internally (depending on the dielectric properties and interaction
of the material with electromagnetic energy) and enables faster removal of the
surface moisture due to conventional heating of the surroundings.

16
2.9 End-product Quality Analysis
Color and rehydration ratio are very important quality attributes of dehydrated
products. Processing steps such as slicing, cutting and drying always promote
the color changes, which may lead to reduction in visual, sensory and
organoleptic quality of the dried product.
Rehydration ratio of the dehydrated product, i.e., the ratio of weight of processed
food after rehydration to the weight of dehydrated processed food without water
(g dehydrated product/g dehydrated product), can be determined as described by
Ranganna (1986). The moisture content of both dehydrated and fresh berries
can be determined by oven drying (AOAC 930.04 1990).
2.10 Berry Drying Studies
The drying time of chemically pretreated grapes (ethyl oleate, alkalies, etc.,) was
cut down by half (Kostaropoulus and Saravacos 1995 and Gragowski et al.
1992). Venkatachalapathy (1998) observed significant difference in drying rates
using 3% ethyl oleate and 0.5% NaOH dipping for microwave drying of grapes,
but only a 10% improvement in convective drying rate. The most effective
treatment for surface waxy layer fruits was proved as ethyl esters of fatty acids,
especially oleic acid (Ponting and Mcbean, 2001).
Beaudry (2001) found osmotic dehydration as an advantage before thermal
drying considering that no heat is applied in this stage and also higher retention
of food characteristics like color, aroma, nutritional constituents and flavor
compounds. They studied drying of cranberries with microwave and convection
mode combination.

17
Tulasidas et al. (1993) and Yang and Atallah (1985) showed that microwave
convective drying of grapes and lowbush blueberries maintained the quality even
at higher drying rates. Reddy and Meda (2005) reported that drying of saskatoon
berries in microwave-combination condition could be an effective preservation
method for the short harvest seasoned fruit crop. Dielectric properties of
saskatoon berries were measured to observe the effects of osmotic dehydration
(Reddy et al., 2005) and reported that solute uptake due to osmotic dehydration
increased dielectric loss factor values. Yang et al. (1987) have studied the
combined process of osmotic dehydration and freeze drying to produce a raisin
type blueberry product and reported that the product exhibited good flavor,
texture and overall quality and long shelf stability.
2.11 Summary
This chapter essentially summarized various topics and aspects related to:
• Production, physico-chemical characteristics study of saskatoon berries,
• Dielectric properties measurement principles and techniques,
• Chemical pretreatment for berries / fruits,
• Osmotic dehydration technique and effect on drying methods,
• Drying techniques for agri-food / high moisture plant materials, and
• Development of microwave-convection drying system.
Saskatoon berry is now being recognized as a commercial fruit crop with its
nutraceutical & medicinal value. Processors have identified the potential of this
prairie fruit in the manufacture of various processed products. The main
drawback is the use of frozen berries in the manufacturing process compromising
the end product quality.
This research was aimed at developing a dried saskatoon berry product using
conventional, advanced and combination drying techniques.

18
III. MATERIALS AND METHODS
In this section, experimental plan, sample preparation, different analytical
techniques used, modeling studies on drying data and end-product quality
analysis methodologies will be discussed.
3.1. Experimental Plan and Procedure
To meet the proposed research objectives, research outlines stated in Figure 3.1
were followed in our experimental drying process. This involved procurement of
Northline saskatoon berries of 2005 harvest, from a producer in Saskatoon
region and storing them in the freezer (-15oC).
Frozen Saskatoon Berries
Chemical Pretreatment
Osmotic Dehydration
Microwave / Convection / Combination Drying
End Product Quality Analysis
Statistical Data Analysis
Figure 3.1 Stages of saskatoon berry drying / dehydration process.

19
Fresh berries were U-picked during the harvesting season. The next step was to
chemically pre-treat the berries prior to osmotic dehydration to verify the effect of
chemical pretreatment. Chemically pretreated berries were subjected to osmotic
dehydration using two solutes of three different concentrations. As a standard
practice for control treatment untreated berries were also used in the drying
process. The important and final step of our experiments was drying of untreated
and osmotic dehydration berries under microwave, convection and combination
drying methods. A quality change due to drying was analyzed by measuring the
color changes and rehydration-ratio after drying. All experiments were conducted
during summer and winter of 2005. The drying steps are detailed in the following
sections of this chapter.
3.1.1 Berry Sample Preparation
Frozen berries (Northline variety) of 2005-harvest season were procured from
Riverbend Plantations, Saskatoon. Prior to all experiments, frozen berries were
taken out of cold storage and thawed at room temperature for 2 h, until the
produce temperature was equilibrated. Initial moisture content and total soluble
solids (TSS) content were 76% and 15.8o brix, respectively. Prior to individual
drying experiments, the whole fruit samples were taken out of cold storage and
thawed for 2 h. The moisture content of each sample was measured individually.
3.1.2 Chemical Pretreatment
To study the effect of chemical pretreatment on osmotic dehydration an ethyl
oleate mixture was used. Chemical pretreatment tests were performed using a
solution of 2% ethyl oleate and 0.5% NaOH (mass basis) in distilled water. Liquid
ethyl oleate was previously kept in a freezer at –20oC, and granular NaOH at
ambient temperature. After thawing, the berries were wiped with soft tissue and
dipped into the prepared solution for different time periods of 60,120 and 180 s
separately. All experiments were done at room temperature (23oC). The

20
chemically pre-treated berries were then kept ready for osmotic dehydration
experiments.
3.1.3 Osmotic Dehydration
Osmotic dehydration was carried out with two osmotic agents: sucrose (solution),
commercially available fine granulated sugar with 99o brix, and high fructose corn
syrup (HFCS) of 70o brix. The effect of these two osmotic agents with respect to
dipping time was compared. Three concentration levels of sugar solution were
used in this study to compare the effect of the concentration of the osmotic
agents on osmotic dehydration. The sugar solution with 40, 50, and 60o brix
concentration were prepared and the chemically treated and untreated (thawed
but without treated with chemicals) saskatoon berries were immersed in the
osmotic reagents for a duration 6, 12, 18, 24 and 36 h, respectively.
Optimal chemical and mechanical pretreatments were determined, different
factors of osmotic dehydration were tested. These factors and their levels were
studied as below:
• Type of sugar agent (Crystal sucrose and liquid high fructose corn syrup);
• Concentration of sugar agent (40, 50 and 60o brix); and
• Time of osmotic dehydration (6,12, 18, 24 and 36 h).
Varied concentration of sugar solutions were prepared and equivalent weight of
berries were added. The solution was mixed and known weights of berries were
collected after every 6 h and washed with tap water to remove the solute on the
berry surface during each sampling.
For simplification, only two counter-diffusions are usually assumed to take place
in osmotic dehydration process, with one being the water diffusing out from the
inner cell to the surrounding solution and the other being the solute diffusing from
the surrounding solution into the cell. Water loss (WL, kg/kg fresh material) and

21
solute gain (SG, kg/kg fresh material) are two main parameters to consider in this
process. Both diffusion processes are interdependent.
3.1.4 Saskatoon Berry Drying
Drying is an important operation in the preservation of saskatoon berries, to
reduce the moisture content from 75% (60% after osmotic dehydration) to 25%
(or lower) in a very short time after harvest. The experiments conducted under
different drying conditions are listed in Table 3.1.
The following parameters were measured and maintained in the experiments:
• Product temperature: 60, 70, and 80oC (Microwave power levels: P1, P2
and P3),
• Airflow rate: 1 to 1.4 m/s,
• Relative humidity: 14-18%, and
• Final moisture content: 25%
Table 3.1 Experimental design indicating treatments, drying modes and power
levels (Numbers indicate the replicates).
Microwave Combination (MW + Convection)
Convection Pre-treatment Condition P1 P2 P3 P1 P2 P3 P1 P2 P3
60% Sucrose (24 h)
3 3 3 3 3 3 3 3 3
60% HFCS (24 h)
3 3 3 3 3 3 3 3 3
Untreated 3 3 3 3 3 3 3 3 3
Note: Convection air temperatures were higher (15oC) to maintain product
temperatures at 3 power levels of P1 (60), P2 (70), and P3 (80o)C.
HFCS stands for high fructose corn syrup.

22
3.1.5 Microwave and Microwave-Convection Drying
For all the microwave and microwave combination drying studies, a Panasonic
Microwave-Convection oven NNC980W (Panasonic Canada Ltd, Mississauga,
ON) that was developed into a stand-alone drying system was used. The dryer
system features and modifications are detailed in Chapter IV (Development of
dryer).
3.1.6 Convection Drying
For convection-only drying, a cross flow dryer in the bioprocessing laboratory
(ABE Dept., U of S) that was developed for thin layer drying of both high and low
moisture agricultural materials (Adapa et al. 2002), was successfully used. This
dryer had the following features and capabilities:
• Convection air temperature from 25 to 150oC;
• Relative humidity adjustment from 5 to 75%;
• Airflow rate from 0 to 2 m/s;
• Measurement of air (T-type thermocouples) and product temperatures
(Infrared sensor);
• Online moisture loss measurement; and
• Ability to record moisture loss, air temperature, product temperature, air
flow rate, and relative humidity during drying using a computer with
LabView 6i (National Instruments, Austin,TX) data acquisition software.
3.2 Analytical Procedures
Different analytical methods to determine the physical and electro-magnetic
properties of saskatoon berries are explained in this section.

23
3.2.1 Moisture Content Determination
Saskatoon berry samples of 5 g were dried in a vacuum oven at 70oC and 25 psi
for 7 h to assess their initial moisture contents. This experiment was carried out
in three replicates. The initial moisture content (MC) of the saskatoon berries was
determined as 76% dry basis (d.b.) according to AOAC 930.04 Standard (1990).
3.2.2 Total Soluble Solids (TSS) Measurement
Saskatoon berries were manually crushed and the fruit syrup was extracted
using cheesecloth. A digital hand held pocket Refractometer (PAL-1, 0-53o brix,
and PAL-2, 50-93o brix, ATAGO Co. Ltd, Japan) was used to determine the brix
level of the fruit syrup. The PAL-1 had a measuring range of 0 to 53o brix and
PAL-2 from 53 to 95o brix. For all measurements, 0.3 ml of the fruit extract
sample was used.
3.2.3 Dielectric Properties Measurement and Sample Preparation
In order to better understand the interaction of microwave and fruit samples, the
dielectric properties measurement was undertaken. Also, from modeling point of
view this information may be useful. Measurement of the dielectric properties
was performed with an open-ended coaxial probe connected to HP 8510B
Network Analyzer (Agilent Technologies, Santa Clara, CA) setup in
bioprocessing laboratory at the University of Saskatchewan. The analyzer
generates a microwave signal through the coaxial probes. The material is tested
by bringing in contact the flat surface of the probe with the material under test.
The fields at the end of the probe “fringe” into the material and change as they
come in contact with the material. The network analyzer detects the magnitude
and phase shift of the reflected signal and calculates the reflection coefficient.
Then graphically computer controlled software calculates the dielectric properties
from these data and display them as a function of frequency.

24
The coaxial probe (Figure 3.2) is a convenient and broadband technique for lossy
(materials with high dielectric loss factor values) liquids and solids. It is non-
destructive and little or no sample preparation is required for liquids or semi-
solids. In the case of a solid material under test, the material face must be
machined at least as flat as a probe face, as any air gap can be a significant
source of error. It operates at frequencies between 0.045 and 26.5 GHz. The
technique assumes the material under test to be non-magnetic and uniform
throughout.
The HP 8510 is a high performance microwave Vector Network Analyzer (VNA)
system. It consists of a HP 8510B, a Test Set (e.g. HP8515A S-Parameter Test
Set), and a microwave signal source (HP 8341B). This Agilent VEE (Vector
network analyzer driver) controls the HP 8510 "system" as a whole. That is,
commands issued through the HP 8510 driver also control the test set and the
signal source.
An HP software program provided the permittivity based on the measured
reflection coefficient (Engelder and Buffler 1991). For coaxial probe
measurements, the HP dielectric probe kit (HP 8510B) is utilized, which consists
of the probe, related software, and calibration standards. The calibration consists
of measuring three known standards with the probe (usually open air, short
block, and distilled water at room temperature). The calibration process removes
systematic errors from the measurement. The operating frequency range of the
system was set to 0.5 MHz to 5 GHz. All the measurements were taken at room
temperature (23oC) and constant bulk density. The menu driven software was
installed on the personal computer and the control algorithm based software
computes the complex permittivity of the material under test from the S-
parameter information, which was relayed from the vector network analyzer
(VNA).

25
To reduce cable flexure and probe motion errors during measurements, a fixture
was developed which securely clamps the probe (as shown in Figure 3.2) and its
cable in a vertical position. The fixture is equipped with a small table on which the
calibration standard or material under test is placed. This table is mounted to a
manually operated vertical position translator, which allows the operator to raise
the material under test up to the probe tip with high positional precision and with
the proper contact pressure.
Figure 3.2 Open-ended coaxial probe and adjustable platform.
All dielectric measurements were performed at room temperature (23oC).
Measurements for dielectric properties were performed using the HP Network
analyzer system on fresh and frozen saskatoon berries for the following different
fruit components:
• Whole berry,
• Cut berry,
• Berry paste, and
• Berry juice / syrup

26
Osmotic dehydration process that involves loss of moisture and solid gain can
affect the dielectric properties of the fruit. As the drying experiments involved
drying of untreated and osmotically dehydrated saskatoon berries under
microwave conditions, measurement of dielectric properties before and after
osmotic dehydration revealed the effect of osmotic dehydration on drying
characteristics and microwave absorption characteristics of the material.
3.3 Dehydrated Product Quality Analysis
Quality analysis by measuring color changes and rehydration ratio were carried
out to explain the effect of the drying process and conditions on final dried
product.
3.3.1 Color Measurements
The color measurements were done using Hunterlab Color Analyzer (Hunter
Associates Laboratory Inc., Reston, VA, U.S.A.). The Hunter L, a and b
coordinates of convection, microwave and microwave combination dried berries
was determined by measuring their respective L, a and b coordinates. After initial
calibration against standard white and black surface plates, three replicated
measurements for each sample were taken. The coordinate L being the lightness
indicator, a the greenness to redness indicator and b indicates blueness to
yellowness of an object. Color difference values ∆L, ∆a and ∆b were calculated
according to the following equations:
∆L = L-Lt (3.2)
∆a = a-at (3.3)
∆b = b-bt (3.4)
Where L, a and b are the measured values of the specimen and Lt, at, bt are
values of the target color. The target colors in this experiment are L, a and b of

27
the fresh saskatoon berry fruit. The total color difference ∆Eab is measured using
the L, a, b color coordinates and as defined by the Equation 3.5 (Minolta, 1991):
∆Eab = [(∆L)2 + (∆a)2 + (∆b)2]0.5 (3.5)
3.3.2 Rehydration Test
Rehydration tests of dried samples were performed using a recommended
method (Annon., 1991). A 500 ml beaker containing 150 ml of distilled water was
placed on a hot plate and covered with a watch glass. The water was brought to
the boiling point and a known quantity of the sample was added to the boiling
water and boiled for an additional 5 min. The mixture was transferred to a 7.5 cm
Buchner funnel covered with Whatman No. 4 filter paper. Water was drained out
until there were no more drops from the funnel. The sample was then removed
and weighed. Rehydration ratio was calculated as the ratio of mass of rehydrated
sample to that of the dehydrated sample. The coefficient of rehydration (COR) is
calculated by equation 3.6.
)M(M)M-(100 MCOR
fndh
inrh
−=
100 (3.6)
Where,
COR = Coefficient of rehydration,
Mrh = Mass of rehydrated sample (g),
Mdh = Mass of dehydrated sample (g),
Min = Initial moisture content of the sample before drying (%), and
Mfn = Moisture content of the dry sample (%).
3.3.3 Micro-structural Analysis
The Phillips Scanning Electron Microscope (SEM 505, Phillips, Holland
Electrons Optics, Eindhoven, and Netherland) was used to examine the

28
microstructure of the samples and study specimens that require higher
magnifications and greater depths of field that can be attained optically.
Saskatoon berries were observed for physical changes that occurred after
osmotic dehydration treatment and drying experiments. The photograph and
functional components of the scanning electron microscope is shown in Figure
3.3 and figure 3.4 respectively.
Samples were prepared in the following manner. The samples were kept free
from moisture and other contaminants as possible and then they were pinned
down to a sample holder using a conductive carbon tape that contained
adhesive on both the sides. The samples were first dried in a vacuum dryer at a
pressure of 1080 Pa and temperature of 31.5oC.

29
Figure 3.3 Photograph of SEM system with computer.

30
Figure 3.4 Functional components and operating principle of Scanning Electron
Microscope (SEM).
3.4 Modeling of Drying Process
Many researchers have adopted empirical drying models for simplicity and
accuracy. The simple type of drying model assumes that rate of exchange in
moisture content is proportional to the difference between moisture content and
equilibrium moisture content (EMC) of the material. This section deals with five
identified drying models reported in the literature and adapted to this work.
3.4.1 Moisture Ratio Determination
Moisture ratio was determined in order to compare each set of data, e.g., berries
at 60oC and different drying treatments (microwave, convection and
combination). Moisture ratio was calculated using following equation:

31
ei
e
MMMMMR−−
= (3.7)
Where,
MR = Moisture ratio,
M = Average moisture content, % (d.b.),
Mi = Initial moisture content, % (d.b.), and
Me = EMC, % (d.b.).
Based on extensive review of the literature, the drying models listed in Table 3.2
were adapted in this research. The moisture content data at different microwave,
combination and convection temperature (power levels) were fitted against drying
time, using the various models given in Table 3.2.
Table 3.2 Drying models fitted for the drying data
Model No. Name Drying Models References
1 Page Eqn. MR=exp(-k tn) Liu and Bakker-Arkema (1997)
2 Modified Drying Eqn. MR=a+exp(-k tn) Agrawal and Singh (1977)
3 Wang and Singh MR=1+at+bt2 Wang and Singh (1978)
4 Sharma et al. MR=a*exp(-bt)+c*exp(-dt) Sharma et al. (2005)
5 Midilli Equation MR=a*exp(-k(tn))+b*t Midilli et al. (2002)
Where,
MR = Moisture Ratio (Equation 3.7),
k = Drying constant, min-1
t = Drying time, min
a, b, c, and d = constants.

32
3.5 Statistical Analysis
Statistical methods adapted for different experiments are explained below.
3.5.1 Chemical Pretreatment
One-way analysis of variance (ANOVA) was performed to verify if there was any
significant difference in solute uptake between the control treatment and 3
chemical pre-treatment levels.
The factors for analysis considered include:
• 1 control treatment – Untreated berries,
• 3 treatments – 60, 120 and 180 s chemical pretreatment duration, and
• 3 replications.
3.5.2 Osmotic Dehydration
The three-factor randomized complete block design (RCBD) was used to verify
the effect of solutes, solute concentrations and time effect on solute uptake and
mass loss.
RCBD: After the experimental units are blocked, treatments are assigned at
random within each block such that each treatment occurs once in every block
(Albert et al., 1972). During the conduct of the experiment where the order of
processing the material may make a difference, units are processed by block and
in a completely random order within each block.

33
Model for RCBD is shown below:
Yij = µ + τi + βj + εij (3.8)
Where:
Yij = Observed value for the jth replicate of the ith treatment (where i=1 to t and j=1
to b),
µ = Grand mean,
τi = Treatment effect for the ith treatment; the treatment effects may be either
fixed or random,
βj = Block effect for the jth block, and
εij = Random error associated with the Yij experimental unit.
For osmotic dehydration, there were 3 treatments (i=3) and 3 replications (j=3).
The treatments were:
• Solutes – sucrose and high fructose corn syrup,
• Solute concentrations - 40, 50, and 60%, and
• Time - 6, 12, 18, 24, and 36 h.
3.5.3 Drying Experiments
Two-factor RCBD was used to verify the effect of 2 treatments and 3 replications
on drying time.
The treatments were:
• Drying modes – microwave, microwave-convection, and convection
drying, and
• Power level – 3 levels (60, 70 and 80oC product temperatures).

34
IV. DEVELOPMENT OF A MICROWAVE DRYER SYSTEM
In this research study, dryer development was a major contribution and majority
of the research time and effort was dedicated towards equipment modification.
Modification including installation of sensors, tools, data acquisition system and
other accessories were integrated into a domestic microwave-convection oven to
‘develop’ a laboratory scale microwave-convection combination dryer system.
This section explains the above mentioned points in detail. Modification of the
oven by installing necessary instrumentation for measurement systems
(temperature, weight-loss, etc) along with data acquisition system capabilities
were carried out.
4.1. Configuration of Microwave-Convection Oven
A commercially available Microwave-convection oven Panasonic (NNC980W)
(Panasonic Canada Ltd, Mississauga, ON) was used to develop a stand-alone
drying system. The system controls the microwave power output in continuous
mode rather than as a duty cycle. The dimensions of the cavity were 0.24 x 0.41
x 0.42 m. From the ceiling of the oven cavity, a blower fan forced the preheated
air through a meshed inlet into the cavity. A variable transformer controlled a pair
of electrical heaters of 1400 W capacity to supply heated air at varied
temperature levels.
The following design and operating features were built-in the commercial oven:
• 10 different modes of microwave power (220 – 1000 W);
• Inverter technology for variation of microwave power;
• The dimensions of the cavity are 0.24 x 0.41 x 0.42 m;
• Convection / Hot-air (1400 W) stream which operated independently and
also in combination with microwave at two set-point convection
temperatures;

35
• Convection fan running with a 12 V input voltage and a maximum air flow
rate of 1.5 m/s; and
• Humidity sensor at the outlet of convective air from the dryer system.
The following system modifications were identified to be developed into an
integrated combination dryer system:
• Separate controls for microwave and convection air;
• Temperature controller installation for convection air and fan control;
• Inserting fibre optic probes into the oven and making arrangements for
online temperature measurement using fibre optic sensors and record the
data using LabView 6i software;
• Sample holder design to dry approximately 100 g of berries; and
• Weighing the sample during drying to measure the real-time moisture loss
and record the data using LabView software.
4.2. Microwave and Convection System Instrumentation
There was an option to toggle between preset system conditions and modified
settings. The following were the preset settings:
• Microwave control was from the front panel (set different power levels and
time) both in manual and automatic manner;
• A second panel; convection panel in Figure 4.1, was integrated to the
system having two stopwatches, one for convection and the other one for
microwave. One digital counter with display was added to this circuitry to
count the number of times toggling between microwave and convection;
and
• Convection fan operation during convection / combination / manual mode
was continuous.

36
Figure 4.1 Front panels of the microwave drying system (left panel to set
microwave power and run-time and right panel to set and monitor convection
temperatures).
4.3. Convection Air Temperature Controller Installation
In manual control setting for convection air temperature adjustment, a OMEGA
CN9000A temperature controller (Omega Inc., Stamford, CT) was installed
(Figure 4.1). The temperature controller had a set point for temperature setting
ranging from room temperature to 150oC. Once the set point temperature was
reached, a solid-state relay (SSR) circuit switched off the connection stream,
which was in series with the temperature controller and heater filament system.
To acquire online temperature data, fibre optic probes were passed into the oven
cavity through a teflon block (Figure 4.2) attached on the side of the oven cavity
(as shown in Figure 4.3).
Microwave Panel
Convection Panel
Temp Controller

37
Figure 4.2 Teflon block fabricated to insert fibre optic temperature probes in to
the microwave cavity.
Figure 4.3 An assembly of fibre optic temperature sensors and signal conditioner
for temperature measurement.
Signal Conditioner
Fibre Optic Temp Probes

38
Based on the set of preliminary experiments, it was observed that the power
supply to the heater was 1400 W (maximum) all the time. The fan and heater
units turned off automatically when the set point temperature was reached. This
was not a favorable condition in a continuous drying system where the fan must
be running all the time to maintain constant airflow. An aerial view of the
convection fan, connected to the oven cavity fan is shown in Figure 4.4. To have
the convection fan running continuously, a rheostat was connected in series with
the temperature controller set-up and voltmeter was used to read the voltage
through the circuit. By varying the rheostat the resistance varied in the circuit
causing a change in voltage supply to the heater that was displayed on the
voltmeter. This circuit helped to supply a known voltage to the heater to attain the
set point temperature and maintain the same throughout. The Convection fan
supplied has a constant voltage of 12V to run continuously even when the heater
went off, maintaining a constant airflow rate (flowchart shown in Figure 4.5).
Figure 4.4 Aerial view of the convection fan and the belt pulley arrangement.

39
Figure 4.5 Flowchart of the convection heating system explaining the working operation of the convection heating circuit.
Set-point Temp in CN9000A
Temperature Controller
Solid State
Relay
Set-Point Temperature
Variable Rheostat
Power Meter
Heater and Fan
Circuit
Switch-Off
Heater
Thermocouple Temperature
Reading

40
4.3.1 Airflow Rate Measurement
Airflow rate measurement was carried out using a hot-wire anemometer at
different spots in the microwave chamber. Airflow variation at the sample holder
position was 1 ± 0.1 m/s around the sample holder location.
4.4 Data Acquisition Module Integration
Data acquisitions for temperature and weight loss were performed
simultaneously during drying using an IBM laptop (Pentium II) with programs
written in LabView 6i.
Figure 4.6 Temperature data acquisition flowchart explaining the step-by-step
procedure adapted in temperature data acquisition.

41
4.4.1. Temperature Data Acquisition
The Fiso four channel sensor and signal conditioner ((UMI 250, Fiso Canada,
Quebec, QC), -50 to 250oC, 0.01oC accuracy) computer modules are a family of
complete solutions designed for data acquisition systems based on personal
computers and other process based equipment’s with standards I/O ports.
The module converts four analog input signals to engineering units (shown in
Figure 4.6 and Figure 4.7) and transmits in ASCII format to any host with
standard RS-485 or 232C ports. The maximum number of channels for
temperature measurement was limited to four. The unit was interfaced to a
personal computer via an RS 232 serial port or USB post from the DAQ card.
Figure 4.7 Temperature data acquisition main screen of LabView 6i program.

42
4.4.2. Data Acquisition Software
In order to get continuous temperature and time data, the LabView 6i module
software was used for data acquisition. Data acquisition hardware was
connected to LabView through the Fiso UMI Signal conditioner module for
temperature data and through serial I/O port for weight loss data.
4.4.3. Online Weight-Loss Measurement
Ohaus Adventurer (Ohaus Corp., Mississauga, Ontario, Canada, 2004, 0.1g
accuracy) 800 g balance was mounted on top of the microwave oven (shown in
Figure 4.8). A sample holder specifically designed for drying of 100 g of sample,
made of polycarbonate, was hooked on to the below-balance hook (shown in
Figure 4.10 & Figure 4.11).
Figure 4.8 Ohaus balance mounted on top of the microwave system to record
online weight loss data.
Ohaus balance

43
This balance was connected to the laptop computer via Serial I/O post to record
the data at specific intervals using serial communication VI (LabView software
program shown in Figure 4.9 & Figure 4.11) and finally written onto a Microsoft
Excel (2003) spreadsheet. There was slight variation in the data acquisition
pattern due to convective air movement.
Figure 4.9 Weight-loss data acquisition flowchart indicating the step-by-step
procedure adapted in temperature data acquisition.

44
Figure 4.10 Sample holder connected to a weighing scale by nylon string.
Figure 4.11 Weight-loss data acquisition snap-shot of LabView program.

45
4.4.3.1. Weight-loss Calibration
Airflow movement surrounding the sample holder would cause change in weight
measurement. To overcome this problem, the Ohaus balance was calibrated to
acquire data after the sample holder stabilized with the air movement. Berries of
known mass (100 g) were placed in the sample holder (as shown in Figure 4.12)
with three fibre optic probes inserted into the berries. The data acquisition
software acquired data on the laptop and this weight was berry weight with error
factor due to air movement. Target final weight of the berries was predetermined
and it was possible to calculate actual berry weight by deducting the error factor
value.
Figure 4.12 Sample holder with saskatoon berry dried samples with temperature
sensors.

46
4.5. Standard Reference Material (Water) Testing The measurement of power output of the microwave oven was determined
calorimetrically (Khraisheh et al., 1997), i.e., the change of temperature of a
known mass of water for a known period of time. The basic equation is:
( )t
TmCp∆
∆=
187.4MWabs (4.1)
Where,
MWabs = Absorbed microwave power (W),
m = Mass of sample (g),
Cp = Specific heat of the material (kJ/kg-C),
∆T = Temperature rise in the water load (oC), and
∆t = Heating time (s).
Water into two one-liter beakers weighing 2,000 ± 5 g were placed in the center
of the oven, side-by-side in the width dimension of the cavity, and touching each
other. The beakers initially should be at ambient room temperature and the initial
water temperature should be 20°C ± 2°C (Buffler, 1993). The oven was run at all
inbuilt microwave power levels for 2 min and 2 s, the beakers were removed and
the final temperatures recorded. Absorbed microwave power is calculated from a
simplified formula of Equation (4.1):
( )21 ∆T∆T35P +×= (4.2)
Where,
P is the microwave power output (Watts)
∆T1 and ∆T2 are the temperature increases of the water in the two beakers (oC).

47
Power measurement was repeated three times, with the final oven power being
the average of the three readings (Table 4.1). If any individual measurement was
more than 5% away from the average, the complete test was repeated.
NOTE: The water in each vessel should be well stirred before measuring both
the starting and final temperature. A small object, such as a plastic spoon or the
handle of a wooden spoon works well.
Table 4.1 Measured output power of the microwave system
POWER LEVEL (Settings in Microwave)
MEASURED POWER (Watts)
P10 1000
P9 751
P8 682
P7 689
P6 628
P5 500
P4 392
P3 295
P2 (Pulsating) 295 (7 sec off and 14 sec on)
P1 (Pulsating) 295 (14 sec off and 7 sec on)
4.6 Summary
An existing domestic microwave oven was developed into an integrated
laboratory-scale drying system with the following capabilities:
• System Feasibility – The developed drying system can be used for drying
of varied agricultural / food materials under microwave, convection and
microwave-convection combination drying conditions,

48
• Microwave Power Control – Different output power levels of the
microwave can be selected depending on the power requirement to dry a
product,
• Convection Power Control – Output temperatures in the oven can be set
in the temperature controller (room temperature to 200oC) that is
maintained by the variable rheostat and the solid-state relay circuit,
• Temperature Measurement – Installed fibre optic temperature probes with
signal conditioner will measure online product and the drying environment
temperature that is recorded on the laptop with a LabView program, and
• Weight Measurement – Weighing scale mounted on top of the oven was
connected to the sample holder that acquired product weight loss data
online and these data were transferred to the laptop (connected through
serial port) with LabView program.

49
V. RESULTS AND DISCUSSION
In this chapter, drying experiments results obtained using the developed
laboratory-scale microwave drying system (discussed in detail in Chapter IV) will
be explained. Data obtained from chemical pre-treatment, dielectric properties
measurement, osmotic dehydration and final-drying experiments will be
presented with statistical analysis.
5.1. Chemical Pre-treatment Experiments
To assess the effect of ethyl esters (ethyl oleate) and NaOH on osmotic
dehydration (OD), untreated sample brix (TSS) measurement was used as a
control, as explained in Chapter 2.2.3.
Another factor to assess the effect of chemical pre-treatment was by observing
the berry surface under a scanning electron microscope (before and after
treatment) for any physical changes that might occur on the fruit surface (waxy
layer / epithelial tissues) of fresh and chemically pre-treated osmotically
dehydrated berries. Figure 5.1 shows the effect of different sugar concentration
(40, 50 and 60 obrix) on untreated and chemically pre-treated berries after 60,
120 and 180 s after 6 h of osmotic dehydration. The solute gain increased with
the increase of sugar concentration of the solution; fruit brix of untreated berries
was higher than pre-treated samples. Pre-treatment after 180 s showed higher
brix values for all three-sugar concentrations. One-way ANOVA on the results
shows chemical pre-treatment had no significant (P=0.753) effect on osmotic
dehydration process on saskatoon berries. Data for both high fructose corn syrup
and sucrose osmotic dehydration results is presented in Table 5.1.

50
15
18
21
24
40 50 60
HFCS Concentration (brix)
Sask
atoo
n be
rry
TSS
(brix
)Untreated Pretreatment 60s
Pretreatment 120s Pretreatment 180s
Figure 5.1 Saskatoon berries brix levels (TSS) after Chemical Pre-treatment and
6 h Osmotic Dehydration with high fructose corn syrup.
Table 5.1 Moisture content and total soluble solids of osmotic dehydrated berries
after chemical pre-treatment
Osmotic Agent
Chemical pre-treatment (sec)
Sugar Content (Brix)
Moisture Content (% wb)
Treatment Final Initial Initial Final Sucrose (P1)60 19.1 15.8 76 73.1
(P2)120 18.6 15.8 76 74 (P3)180 20.2 15.8 76 73
HFCS (P1) 60 16.9 15.8 76 72.7 (P2) 120 19.8 15.8 76 73.8 (P3)180 20.1 15.8 76 73.15 Untreated 19.5 15.8 76 73.8
Frozen berry surface layer sections were observed under SEM before and after
osmotic dehydration. Figure 5.2 shows a section of the fruit with waxy skin layer
and a spot on the fruit where the surface layer is peeled off exposing the
epithelial cell. The black color observed in the cell was mainly water and other
cellular constituents. These spots were more than at least five on a single whole

51
berry. The damage of the fruit might have occurred during the freezing process
or after freezing during storage. Frozen berries when packed in polythene bags
attach to each other that might have left scars on the berry surface while thawing.
From observation under SEM after osmotic dehydration, Figure 5.3 and Figure
5.4 showed white spots within the cell and were assumed to be sugar crystals /
molecules.
Preliminary Experiment with Blueberries: In the summer of 2005, a series of
microwave drying experiments were conducted with fresh blueberries available in
the market as a comparative study for saskatoon berries. It is reported that
blueberries have similar physical and chemical properties to that of saskatoon
berries. Even at low power microwave heating, the berries tend to rupture due to
the enormous heating capability of the microwaves. Results from the study are
presented in Appendix B1. This study suggests that frozen berries physical state
favors osmotic dehydration and drying but fresh berries should have a pre-
treatment step before dehydration.
5.1.1. Effect on Osmotic Dehydration
Solute uptake was assessed by measuring the TSS content of the fruit after each
stage of osmotic dehydration. Table 5.1, shows that pre-treatment had very
minimal or no significant effect in increasing the osmotic reaction for both
sucrose and high fructose corn syrup. One of the reasons for this could be the
immediate freezing of the fruit after harvest, which can disturb the integrity of
berry structure. This can be seen in Figure 5.2, when a whole berry is observed
under Scanning Electron Microscope (SEM), the wax coated epithelial layer is
disturbed and the epithelial cells are being exposed. These spots were more than
one region on a single fruit, which might as well help during osmotic dehydration
process for the two-way diffusion process.

52
Figure 5.2 Frozen berry cut section of the berry skin under SEM.
Figure 5.3 SEM of saskatoon berry osmotically dehydrated with 50% high
fructose corn syrup (HFCS) solution for 24 h without chemical pre-treatment.

53
Figure 5.4 SEM of saskatoon berry osmotically dehydrated with 50% sucrose
solution for 24 h without chemical pre-treatment.
5.2. Osmotic Dehydration (OD) Experiments
The effect of osmosis as a pre-treatment, mainly related to the improvement of
nutritional, sensory and functional properties of the products are analyzed. The
distinctive aspect of this process when compared to other dehydration methods
is the ‘direct formulation’ achievable through the selective incorporation of solutes
without modifying the food integrity. By balancing the two main osmotic effects,
water loss and soluble solids uptake, the functional properties of saskatoon
berries could be adapted to many different food systems, functional foods and
new product development. For simplification, only two counter-diffusions are
usually assumed to take place in the osmotic dehydration process, with one
being the water diffusing out from the inner cell to the surrounding solution and
the other being the solute diffusing from the surrounding solution into the cell.
Moisture loss (ML, %) and solute gain (SG, brix or TSS) are the main parameters
considered in this process.

54
5.2.1. Effect on Moisture Loss and Solid Gain Table 5.2 TSS and moisture content values during osmotic dehydration from 6 to
36 h duration
TSS (brix) Moisture Content (%)
Sucrose 6h 12h 18h 24h 6h 12h 18h 24h
40 19.5 21.1 22.1 23.0 75.3 73.7 73.3 71.4
50 21.0 23.1 26.0 26.7 75.0 71.6 70.3 68.0
60 23.7 28.4 27.6 30.5 74.4 69.0 67.1 63.1
HFCS 6h 12h 18h 24h 6h 12h 18h 24h
40 22.3 24.8 25.0 27.2 74.1 72.1 71.1 68.5
50 23.8 28.4 28.9 32.1 71.4 69.8 66.7 64.9
60 24.7 30.4 31.9 34.8 70.6 66.8 63.7 60.6
Figures 5.5 and 5.6 reveal the removal of water from saskatoon berries during
osmotic dehydration process using different concentrations of sucrose and high
fructose corn syrup solutions. It can be seen that solute gain increased with the
increasing osmotic solution concentration in the range of 40-60% (Figures 5.7
and 5.8). Rate of moisture loss and solute gain in sucrose solution during the
initial phase (6 h period) was very slow for all concentrations and a higher rate of
two-way diffusion was observed in the second phase (12 h period) of the osmotic
dehydration process. After the second phase osmotic dehydration process
follows a straight-line trend until the end of a 24 h period (1-day). The diffusion
rate after 24 h reduces very much and there is very less solute uptake during the
next 12 h period. Table 5.2 shows the mean values of moisture loss and solute
gain for the 36 h osmotic dehydration process and both the factors had
significant difference (P<0.05) with time, sugar solution concentration and
interaction effect of time and solution concentration.

55
60.00
65.00
70.00
75.00
80.00
Initial 6 12 18 24 36
Time (h)
Moi
stur
e C
onte
nt (%
d.b
.)40% 50% 60%
Sucrose C t ti
Figure 5.5 Moisture content during the 36 h osmotic dehydration in sucrose
solution at 40, 50 and 60% concentrations.
55.00
60.00
65.00
70.00
75.00
80.00
Initial 6 12 18 24 36
Time (h)
Moi
stur
e C
onte
nt (%
d.b
.)
40% 50% 60%
HFCS
Figure 5.6 Moisture content during 36 h osmotic dehydration in high fructose corn
syrup (HFCS) solution at 40, 50 and 60% concentrations.

56
5.2.2. Effect on Solute Gain
15.00
20.00
25.00
30.00
35.00
Initial 6 12 18 24 36
Time (h)
TSS
(brix
)
40% 50% 60%
Sucrose
Figure 5.7 TSS (in brix) during 36 h osmotic dehydration in sucrose solution at
40, 50 and 60% concentrations.
The kind of sugar utilized as osmotic substance strongly affects the kinetics of
water removal and the solid gain. By increasing the molar mass of solutes
(HFCS), a decrease of solute gain and an increase of moisture loss were
obtained, thus favoring weight loss and the dehydration aspect of the entire
process. Glucose that has low molecular weight has a more profound effect on
water activity depression than polysaccharides like sucrose (Argaiz et al., 1994).
Therefore, when compared to sucrose, high fructose corn syrup contributed to an
effective water removal rate.

57
15.00
20.00
25.00
30.00
35.00
40.00
Initial 6 12 18 24 36
Time (h)
Tota
l sol
uble
sol
ids
(brix
)
40% 50% 60%
HFCS Concentration
Figure 5.8 TSS (in brix) during 36 h osmotic dehydration in high fructose corn
syrup solution at 40, 50 and 60% concentrations.
As osmotic dehydration is effective at ambient temperature, heat damage to color
and flavor is minimized and the high concentration of the sugar surrounding fruit
material prevents discoloration. In fruits, the cell wall membranes are considered
as living biological units, which stretch and expand under the influence of growth
and turgor pressure generated inside the cells. In natural food systems, there is
also some leakage of solute (sugars, organic acids, minerals, salts, etc.) across
membrane layers. Though quantitatively negligible, it may be essential as far as
organo-leptic (sensory) or nutritional qualities are concerned. Therefore,
compared to single drying process, osmotic dehydration achieves a twofold
transformation of the food item, by both a decrease in water content and a solute
incorporation, which may result in a subsequent weight reduction.
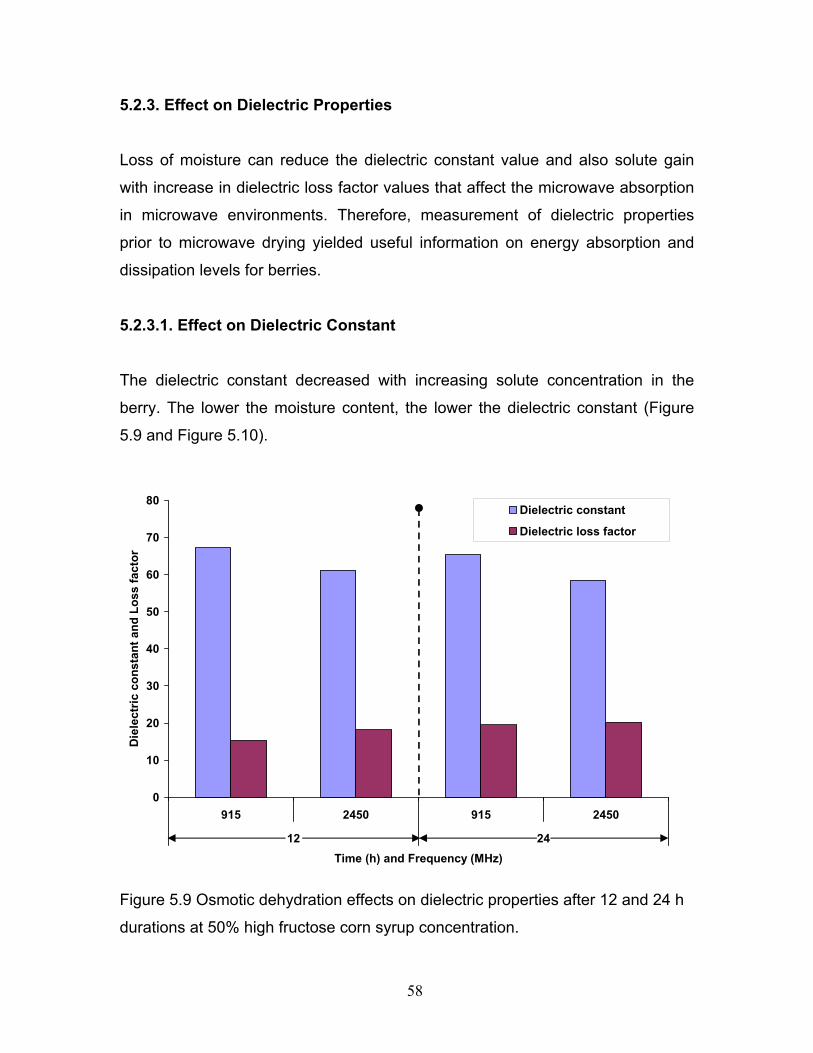
58
5.2.3. Effect on Dielectric Properties
Loss of moisture can reduce the dielectric constant value and also solute gain
with increase in dielectric loss factor values that affect the microwave absorption
in microwave environments. Therefore, measurement of dielectric properties
prior to microwave drying yielded useful information on energy absorption and
dissipation levels for berries.
5.2.3.1. Effect on Dielectric Constant
The dielectric constant decreased with increasing solute concentration in the
berry. The lower the moisture content, the lower the dielectric constant (Figure
5.9 and Figure 5.10).
0
10
20
30
40
50
60
70
80
915 2450 915 2450
12 24Time (h) and Frequency (MHz)
Die
lect
ric c
onst
ant a
nd L
oss
fact
or
Dielectric constant
Dielectric loss factor
Figure 5.9 Osmotic dehydration effects on dielectric properties after 12 and 24 h
durations at 50% high fructose corn syrup concentration.

59
This was expected, since water being a strong polar solvent in most foods, the
molecules reoriented in response to changes in field polarity. Therefore, water as
a component of food contributed to the dielectric constant response. As
discussed in Chapter III (section 3.2.3), the higher the ash content (mostly
composed of solutes), and the lower was the dielectric constant. Solutes bind
with water molecules and decrease their ability to reorient themselves in
response to the changing electromagnetic field direction and this lowers the
dielectric constant ((Engelder and Buffler, 1991).
0
10
20
30
40
50
60
70
915 2450 915 2450 915 2450
40 50 60Frequency (MHz) and Solution Concentration (%)
Die
lect
ric c
onst
ant a
nd L
oss
fact
or
Dielectric constant Dielectric loss factor
Figure 5.10 Osmotic dehydration effects on dielectric properties at 40, 50 and
60% high fructose corn syrup concentrations and respective frequencies (915
and 2450 MHz).

60
5.2.3.2. Effect on Dielectric Loss Factor
The moisture content-dielectric loss factor relationship reported in the literature is
complex. Funebo and Ohlsson (1999) indicated that dielectric loss factor of
maple syrup peaked at moisture content between 44 and 67% at 2800 MHz.
Dielectric loss factor of maple syrup also decreased with increasing moisture
content (35 to 98%) at 240 MHz. From Figures 5.9 and 5.10, it can be observed
that increasing solute concentration and decreasing moisture content in the
berry, resulted in an increase in dielectric loss factor values. For the two-step
drying approach, further reduction of moisture was achieved under microwave
conditions, as the sugar-infused berry favored improved distribution of
microwaves within the material and reduced the drying time and energy.
5.3. Drying Characteristics
Drying of osmotic dehydration pre-treated and untreated saskatoon berries was
done under:
• Microwave-only,
• Convection-only, and
• Microwave-convection combination conditions.
The dryer system described in chapter IV was used for microwave and
combination drying whereas, the thin-layer cross flow dryer discussed in chapter
2.3.2.1 was used for convection drying studies. Drying is a crucial step in
preservation of saskatoon berries, in bringing the moisture content from 75%
(60% after osmotic dehydration) to 25% (or lower) in a very short time after
harvest. Combined microwave-hot-air-drying was more effective in reducing the
moisture content of saskatoon berries without damaging the quality attributes of
the finished product. No similar work has been reported on saskatoon berry
drying and in fact, this is the first systematic study reported on dehydration of
saskatoon berries. The development of combined microwave-hot-air-drying

61
system to produce high quality dried saskatoons in relatively short time could
make significant contribution to the saskatoon berry industry.
Sugar infused into saskatoon berries during osmotic pre-treatment reduced
drying rates during the second drying period, and also osmotic dehydration
reduced the total energy consumption on top of the preferential sensory
characteristics of the final product. One energy-efficient drying technology was
osmotic dehydration in combination with the above-mentioned drying operations.
Such a hybrid technology was particularly advantageous when drying berries
because a significant fraction of moisture was removed non-thermally with
simultaneous infusion of desirable solutes. On the other hand, thermal drying
after osmotic dehydration was necessary to reduce moisture content to its final
value.
5.3.1. Drying Time
Drying temperature trends with time is shown in Figures 5.11 and 5.12 for berry
samples subjected to different drying conditions (60, 70 and 80oC). Higher drying
temperatures reduced the required drying time in all of the conditions in Table
5.2. It is apparent that drying rate decreased continuously with drying time. The
results indicated that diffusion was most likely physical mechanism governing
moisture movement in saskatoon berries. The results were generally in
agreement with some literature studies on drying of various food products
(Venkatachalapathy, 1998). Microwave drying alone without hot air resulted in
lower drying times than convection-only drying but combination drying was more
effective than microwave-only or convection conditions. The drying time in
microwaves can be reduced by 1.15 times at 60oC and 2.36 times at 70oC drying
temperature when compared to convection drying.

62
Figure 5.11 Drying temperature trends at combination P1, P2 and P3 levels (60,
70 and 80oC respectively) and its effect on drying time.
Figure 5.12 Drying temperature trends at microwave P1, P2 and P3 power levels
(60, 70 and 80oC respectively) and its effect on drying time.

63
Drying time varied from 26 to 200 min (Table 5.3) for the range of experimental
parameters. The drying time, in general, decreased with the increase in
microwave power level and further reduced the drying time during combination
drying. The decrease in drying time being more with the increase in power level,
in comparison to the increase in temperature indicating that the effect of
microwave power level was more significant than temperature in reducing the
drying time.
Table 5.3 Drying time and drying rate for untreated saskatoon berries
Microwave Mean Drying Time
(min.) Drying Rate (% MC/min.)
Product temperature of 60oC 165.67 0.31 Product temperature of 70oC 58.33 0.87 Product temperature of 80oC 44.33 1.15
Combination Product temperature of 60oC 116.67 0.44 Product temperature of 70oC 52.00 0.98
Product temperature of 80oC 40.00 1.28
Convection Product temperature of 60oC 192.33 0.27 Product temperature of 70oC 138.33 0.37
5.3.1.1. Effect of Product-drying-temperature
Convection drying time of untreated berries at 60oC product temperature was
192 min. to dry the berries from 76% to 25% moisture content and at product
temperature of 70oC the drying time reduced to 138 min. Microwave-combination
drying reduced drying time by 1.64 and 2.65 times to that required for convection
at the same product temperatures, respectively. This can be attributed to the
heating effect of microwaves to accelerate the diffusion of moisture from the
center of the product to the periphery and with surrounding hot-air conditions

64
moisture removal from the surface was also enhanced. These results explain that
the drying air heats the berry surface and minimizes the heat loss from the berry
that is volumetrically heated by microwave energy. Therefore, the majority of the
heat generated in berry by microwave energy could be used to heat and
evaporate the water in the berry efficiently. This results in a better diffusion
process contributing to an overall reduction in drying time and savings in energy.
As shown in Figure 5.11, in combination drying of untreated berries the drying
time was reduced as the product drying temperature increased. The temperature
trend in Figure 5.11 and Figure 5.12 shows that, the temperature rises in the first
few minutes and then it tends to stabilize after the moisture content of the
produce decreases. In the initial stages of drying, the moisture content is very
high resulting in higher microwave absorption as expected and observed. During
combination drying, because of the higher drying rates the temperature stabilizes
faster than in microwave drying.
5.3.2. Effect of Drying Mode
The drying time was reduced by nearly 45% in combination drying compared to
convection drying, for untreated and treated berries. Microwave drying also
reduced the drying time considerably over convection drying in both the cases.
The moisture content in the sample at different intervals was plotted against time
(Figure 5.13 and Figure 5.14) as moisture curves for treated and untreated
berries, respectively. The curves indicate the higher drying rate with microwave-
only and combination drying over convection drying at any given time. The hot air
drying method had a short constant rate period followed by a falling rate period.
This was also reflected in the slight case hardening of the product. Microwave
and combination drying had only a falling rate period in both cases. Combination
drying had a higher falling rate indicating a higher rate of mass transfer, which
resulted in a shorter drying time over hot-air and microwave drying. In general,
the time required to reduce the moisture content to any given value was

65
dependent on the drying conditions, being highest at microwave P1 (60oC) and
lowest at combination P3 (80oC).
Figure 5.13 Drying of untreated berries at 70oC under microwave, convection and
combination drying conditions.

66
Figure 5.14 Microwave drying of osmotically treated and untreated berries at
70oC.
The drying rates for microwave and combination were higher in the beginning of
the drying process and gradually reduced as the drying process progressed. The
reason for this was because of more radiation being absorbed in the center,
resulting in a faster moisture transfer compared to the diffusion rate from the
outer surface. Also, this resulted in a moisture build-up towards the product
surface during the initial period of the run. The drying rates increased with
increase in microwave power, other conditions remaining the same and thus
reducing the drying time.

67
5.3.3. Effect of Osmotic Dehydration on Drying
Osmotic dehydration as a pre-treatment for drying reduces moisture content by
up to 17% which reduces the total drying time, as shown in Table 5.4, to dry the
berries to 25% final moisture content.
Table 5.4 Drying time and drying rate for osmotic dehydration of saskatoon
berries with sucrose (60% and 24h).
Microwave Mean Drying Time (min)
Drying Rate (% MC/min)
Product temperature of 60oC 117 0.44Product temperature of 70oC 52 0.99Product temperature of 80oC 33 1.55
Combination Product temperature of 60oC 78 0.66Product temperature of 70oC 37 1.38Product temperature of 80oC 28 1.84
Convection Product temperature of 60oC 132 0.39Product temperature of 70oC 88 0.58
The effect of osmotic dehydration using sucrose and high fructose corn syrup on
the drying curves of saskatoon berries at 70oC under microwave conditions is
shown in Figure 5.14. The average moisture content (db) is plotted versus time, t
(min) for untreated and treated samples. No constant drying period was observed
at any of the conditions studies. It can be observed that treatment with sucrose or
high fructose corn syrup removed up to 10 or 19% of the initial moisture content
for saskatoons that were soaked in 40, 50 and 60% brix solutions, respectively.
There is a reduction of drying time for treated berries by 15-20% of that required
for microwave drying of untreated berries. This can be attributed to solvent
distribution within the material to cause uniform heating and also the osmotic
dehydration itself reduced the moisture content of the initial sample.

68
Secondary motivations for applying combined osmotic and microwave
dehydration as a pre-treatment were:
• Possibility to produce unique (new) products with better taste;
• Improved flavor characteristics and/or increased nutritional value;
• Prevention of oxidation of the product and color stabilization;
• Improvement of the texture of the product such as higher final bulk volume
of the product compared to heated air dehydration or microwave
dehydration without osmotic pre-treatment;
• Due to shrinkage and weight loss after drying, storage and transport costs
are reduced drastically; and
• Dried saskatoon berries after osmotic dehydration have various industrial
applications such as bakery foods, nutraceutical industry etc.
5.4. Modeling of Drying Process
Many researchers have adopted due to the consideration of simplicity and
accuracy, empirical models for drying data. The simple type of drying model
assumes that rate of exchange in moisture content is proportional to the
difference between moisture content and Equilibrium Moisture Content (EMC) of
the material. The moisture content data at different microwave, combination and
convection temperature (power levels) were fitted against drying time, using the
various models discussed in Chapter IV.
5.4.1. Evaluation of Thin-layer Drying Equation
Most of the researchers cited in the previous section adopted the fit standard
error and the coefficient of determination, R2 as the criteria to evaluate the
goodness of fit of the drying equation. Recently, residual plots have been
adopted to evaluate more thoroughly the adequacy of the drying models. If the
model can explain the observed values, the residuals would randomly distributed

69
due to possible measurement errors. If the fixed error exists in the predicted
model, the residual plots will indicate a significant pattern.
5.4.2. Data Analysis
Five thin-layer drying models were selected to evaluate the best fit to the drying
data. R2 and standard error values for these equations are presented in Table
5.5; from these, the Midilli equation gave the best curve fit (R2=0.99) for all
convection (Figure 5.18) and microwave combination drying results whereas, the
modified Page equation consistently gave the best fit (R2=0.98) for microwave
drying results as shown in Figure 5.17. In general, the modified Page equation,
the Sharma equation and the Midilli equation fit the combination-drying data very
well with good R2 value as shown in Figure 5.15, Figure 5.16 and Figure 5.19.

70
Table 5.5 Coefficient of determination and standard error values for different
equations. Modified Page Model Sharma’s Model Midilli Model
R2
Std. Error
(S.E) R2 Std. Error R2
Std. Error
(S.E)
Microwave _P2
0.98 1.15 - - - -
Microwave_P1
(Sucrose OD)
0.98 1.21 - - - -
Microwave_P2
(Sucrose OD)
0.97 2.04 - - - -
Microwave_P3
(Sucrose OD)
0.97 1.39 - - - -
Combination_P1
(Sucrose OD)
- - 0.99 0.50 0.99 0.18
Combination_P2
(Sucrose OD)
0.95 2.08 0.99 0.82 0.99 0.84
Combination_P3
(Sucrose OD)
0.97 1.67 0.99 0.24 0.99 0.13
Combination_P2
0.98 1.04 - - 0.98 1.25
Convection_P2 0.99 0.73 - - 0.98 2.22
Convection_P1
(Sucrose OD)
0.95 2.42 - - 0.99 0.42

71
Figure 5.15 Midilli equation drying curve fit for sucrose osmotic dehydration combination drying at 60oC.
For combination drying data of saskatoon berries after osmotic dehydration, the
Midilli equation fitted very well with R2 of 0.999 standard error of 0.129.
0 20 40 60 80Time (min)
25
30
35
40
45
50
55
60
65
MC
(% d
b)
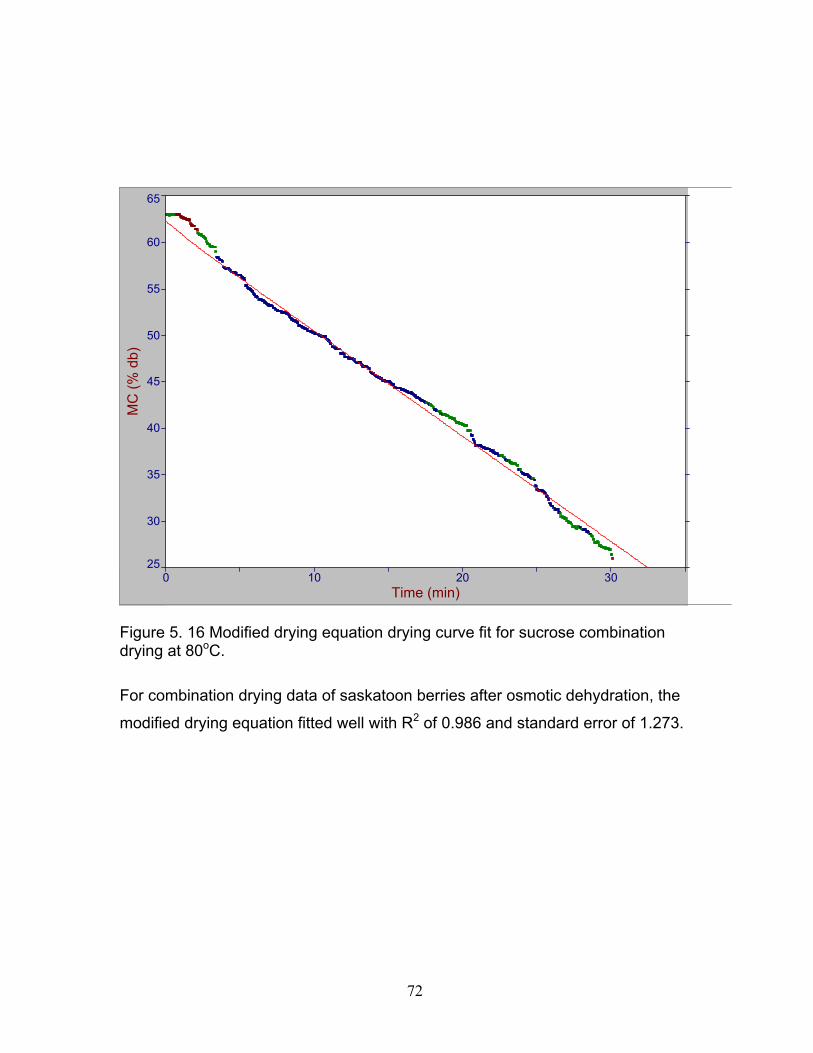
72
Figure 5. 16 Modified drying equation drying curve fit for sucrose combination drying at 80oC. For combination drying data of saskatoon berries after osmotic dehydration, the
modified drying equation fitted well with R2 of 0.986 and standard error of 1.273.
0 10 20 30Time (min)
25
30
35
40
45
50
55
60
65
MC
(% d
b)

73
Figure 5.17 Midilli equation drying curve fit for sucrose osmotic dehydration microwave drying at 70oC.
For microwave drying data of saskatoon berries after osmotic dehydration, the
Midilli drying equation fitted well with R2 of 0.995 and standard error of 0.788.
0 10 20 30 40 50Time (min)
25
30
35
40
45
50
55
60
65
MC
(% d
b)

74
Figure 5.18 Midilli equation drying curve fit for sucrose osmotic dehydration convection drying at 70oC .
For convection drying data of saskatoon berries after osmotic dehydration, the
Midilli drying equation fitted well with R2 of 0.995 and standard error of 0.782.
0 20 40 60 80Time (min)
20
25
30
35
40
45
50
55
60
65
MC
(% d
b)

75
Figure 5.19 Sharma’s equation drying model curve fit for combination drying method at 60oC. For combination drying data of saskatoon berries, the Sharma equation fitted well
with R2 of 0.998 and standard error of 0.579.
5.4.3. Quality Analysis
Dehydrated saskatoon berries were analyzed for the quality changes that might
have occurred due to all the different treatments. Re-hydration ratio and color
changes were the two main quality parameters considered.
0 2000 4000 600Time (min)
35
40
45
50
55
60
65
70
75
MC
(% d
b)

76
5.4.3.1 Rehydration Ratio
Changes in the original dimensions and shape occur simultaneously and water
diffusion affects the rate of the moisture loss during drying. Researchers have
pointed out that the volume change process is one of the main sources of error
for drying simulation models of biological products. There is significant volume
shrinkage during the drying process of high moisture content products such as
vegetables (Hatamipour and Mowla, 2002).
Untreated saskatoon berries dried under microwave at 60oC had a rehydration
ratio 0.24 that reduced with increasing the product temperature to 70oC and 80oC
(Table 5.6).
Table 5.6 Rehydration ratios of sucrose osmotic dehydrated berries at different
drying conditions
Treatments Rehydration Ratio
1 Microwave dried
At product temperature of 60oC 0.42
At product temperature of 70oC 0.40
At product temperature of 80oC 0.39
2 Combination dried
At product temperature of 60oC 0.43
At product temperature of 70oC 0.40
At product temperature of 80oC 0.40
3 Convection dried
At product temperature of 60oC 0.43
At product temperature of 70oC 0.43
At product temperature of 80oC 0.42

77
In general, the rehydration ratio decreased with increase in product temperatures
during drying. As Potter and Hotchkiss (1995) reported, increasing the
temperature caused distortion of cells and capillaries in plant tissue, which may
lead to textural changes, thus lowering the water absorption and adsorption
characteristics and affecting rehydration ability and rehydration ratio. Osmotic
dehydration with sucrose and high fructose corn syrup increases the rehydration
ratio by around twice that of untreated berries. Osmotic dehydrated berries with
high fructose corn syrup solution had significantly (P<0.05) higher rehydration
ratio when compared to sucrose solution. The drying method did not have a
significant effect on the rehydration ratio (Table 5.7).
Table 5.7 Rehydration ratio of microwave-dried berries with and without osmotic
dehydration.
Treatments Rehydration Ratio
1 Untreated
At product temperature of 60oC 0.24
At product temperature of 70oC 0.22
At product temperature of 80oC 0.21
2 Osmotic dehydration with Sucrose
At product temperature of 60oC 0.42
At product temperature of 70oC 0.40
At product temperature of 80oC 0.39
3 Osmotic dehydration with HFCS
At product temperature of 60oC 0.47
At product temperature of 70oC 0.47
At product temperature of 80oC 0.46

78
5.4.3.2 Color Analysis
HunterLab colorimeter values of dried saskatoon berries are shown in Table 5.8.
The Hunter ‘L’ measures lightness and varies from 100 for perfect white to zero
for black, approximately as the eye would evaluate it. Hunter ‘a’ measures
redness when positive and greenness when negative and ‘b’ measures
yellowness when positive and blueness when negative. The Hunter ‘L’, ‘a’, ‘b’
values for saskatoon berries decreased with the increase in drying temperature
during all drying modes. The total color difference was minimal for convection
drying, but for microwave and combination drying, the values were around 4 to 5.
Table 5.8 Hunterlab colorimeter parameters of untreated and sucrose pretreated
berries under microwave, convection and combination drying conditions
Sample ∆L ∆a ∆b ∆Eab
Untreated Microwave P1 -0.96 -1.41 0.67 1.83 Convection P2 -1.21 -1.38 0.01 1.84 Convection P3 -2.46 -2.23 -0.84 3.42
Sucrose Pretreated Microwave P2 -1.92 -2.00 -0.65 2.85 Microwave P3 -3.86 -3.29 -1.72 5.36 Convection P1 -0.62 -2.20 -0.46 2.34
Convection P2 -2.52 -1.56 -0.88 3.09
Combination P2 -2.29 -2.37 -0.83 3.40
Combination P3 -3.32 2.79 0.11 4.34
Table 5.8 revealed that the greatest color difference with all treatments was
obtained at the highest power level. The greater heating resulted in faster
darkening, with some possibility of occurrence of imperceptible burnt spots.

79
Microwave dried berries at 60oC product temperature gave least total color
difference of 1.83.
5.5 Summary
The laboratory scale microwave combination dryer was successfully developed
for drying of saskatoon berries under both microwave and microwave
combination conditions. Microwave combination drying resulted in lowered drying
time and also with increase in microwave power levels, drying time was reduced
significantly. Osmotic dehydration as a pretreatment to drying reduced up to 15%
moisture from the berries and also introduced solutes.

80
VI. CONCLUSIONS
Production of saskatoon berries as a commercial crop has gained importance in
North America and is being exported to other countries for consumption and
processing because of its unique sensory characteristics, nutraceutical value and
consumer acceptance. This also calls for new post-harvest techniques for shelf
life extension and further value-added processing in the manufacture of new
saskatoon berry based products. Freezing is the only post-harvest technique
reported to date to preserve the berries for year-long consumption. Therefore,
microwave and microwave combination drying technique following the osmotic
dehydration step, were explored in this study as a post-harvest preservation
technique for saskatoon berries.
i. The microwave-convection combination dryer system was developed and
successfully tested. The temperature and moisture loss data acquisition
systems had minimal problems to record real-time drying data.
ii. The developed drying system with the modified settings can be used for
drying / dehydration studies of other agricultural / food materials (e.g.
blueberries, beef etc.).
iii. The data obtained from drying of untreated and treated saskatoon berries
showed that microwave and microwave combination drying proves to be a
faster way of bringing moisture content to safer levels and also preserve
the product quality.
iv. The reported drying characteristics of saskatoon berries dried under
microwave, microwave-convection conditions were reasonable in
comparison to the reported literature, on similar fruit types.
v. Microwave drying of saskatoon berries at product temperatures of 60oC
and 70oC after osmotic dehydration retained their quality attributes in the
same range, but drying time at 70oC was about 50% less than at 60oC
drying time.

81
vi. Osmotic dehydration of saskatoon berries with high fructose corn syrup
sugar solution had 3% less moisture after 24 h period compared to
sucrose sugar solution treatment and this difference was significant.
vii. Drying after osmotic dehydration reduced the drying time in all drying
conditions studied because of the structural changes that may have
occurred at the surface (semi-permeable membrane) giving rise to higher
diffusion rates.
viii. Microwave drying had relatively higher drying rates than convection and
this was due to the higher dielectric loss factor value in osmotic
dehydrated berries that favored microwave absorption.
ix. Microwave combination drying was able to reduce the drying time by up to
20% than microwave-only.
x. LabView programs were developed for real-time temperature and weight-
loss measurement and data acquisition.

82
6.1. Recommendations for Future Work
i. Drying studies with fresh saskatoon berries during the harvesting season
can add more value to this research in developing a new post harvest
technique for saskatoon berries,
ii. Drying characteristics study at very low microwave power levels and to
compare the quality characteristics of the final product is suggested,
iii. Control of microwave power to the lowest possible level with a variable
rheostat and solid-state relay circuit and the temperature data can be
acquired from Fiso signal conditioner. Installation of a filament transformer
to the magnetron circuit to keep the filament to continuously run is a
prerequisite,
iv. Sample holder rotation system on the horizontal axis with 180o turn on
either side could improve the microwave distribution with in the material
and more even drying of the berries, and
v. Modeling of drying data and heat and mass transfer simulation using
FEM-Lab or advanced simulation software is also suggested.

83
REFERENCES
Adapa, P.K., S. Sokhansanj and G.J. Schoenau. 2002. Performance study of re-circulation cabinet dryer using a household dehumidifier. Drying Technology 22(8): 1673-1689. Albert, H, B and G. J. Liebermann. 1972. Engineering Statistics, 2nd edition. Englewood Cliffs, NJ: Prentice Hall Publishers. AOAC Standard. 1990. 930.04 - Moisture content in plants. In Official Methods of Analysis, 2nd edition, 69-81. Arlington, VA: Association of Official Analytical Chemists Inc. Argaiz, A., A. L. Malo, E. Palou and J. Welti. 1994. Osmotic dehydration of papaya with corn syrup solids. Drying Technology 12(7): 1709-1725. Beaudry, C. 2001. Evaluation of drying methods on osmotically dehydrated cranberries. Unpublished M.Sc. thesis. Montreal, QC: Department of Agricultural and Biosystems Engineering, McGill University. Bouraout, M., P. Richard and T. Durance. 1994. Microwave and convective drying of potato slices. Journal of Food Process Engineering 17: 353-363. Buffler, C. R. 1993. Microwave Cooking and Processing: Engineering Fundamentals for the Food Scientist. New York, NY: Van Nostrand Reinhold Publishers. Engelder, D. S. and C. R. Buffler. 1991. Measuring dielectric properties of food products at microwave frequencies. Microwave World 12(4): 6–15. Funebo, T. And T. Ohlsson. 1998. Microwave-assisted air dehydration of apple and mushroom. Journal of Food Engineering 38 : 353-367. Funebo, T. and T. Ohlsson. 1999. Dielectric properties of fruits and vegetables as a function of temperature and moisture content. Journal of Microwave Power and Electromagnetic Energy 34(1): 42-54. Grabowski, S. and A.S. Mujumdar. 1992. Solar-assisted osmotic dehydration. In: Drying of Solids, ed. A.S. Mujumdar, 367-404. New York, NY: International Science Publisher. Grabowski, S., A.S. Mujumdar, H.S. Ramaswamy, and C. Strumillo. 1994. Osmo-convective drying of grapes. Drying Technology 12(5): 1211-1219.

84
Green, R.C. and G. Mazza. 1986. Relationships between anthocyanins, total phenolics, carbohydrates, acidity and color of saskatoon berries. Canadian Institute of Food Science and Technology 19:107-113. Hatamipour, M. S. and D. Mowla. 2002. Shrinkage of carrots during drying in an inert medium fluidized bed. Journal of Food Engineering 55(3): 247-252. Huxsoll, C. C. 1982. Reducing the refrigeration load by partial concentration of food prior to freezing. Food Technology 5: 98-102. Kostaropoulos, A.E. and G.D. Saravacos. 1995. Microwave pretreatment of sun-dried raisins. Journal of Food Science 60: 344-347. Khraisheh, M. A., T. J. R. Cooper and T. R. A Magee. 1997. Microwave and air drying I. Fundemental considerations and assumptions for the simplified thermal calculations of volumetric power absorptions. Journal of Food Engineering 33: 207-219. Lenart, A. P. and P. Lewicki. 1990. Osmotic dehydration of apples at high temperature. In International Drying Symposium’ 89, eds. A. S. Mujumdar and M. Roques, 665-681. New York, NY: Hemisphere Publishing Co. Lewicki, P. and A. Lenart. 1990. Energy consumption during osmo-convection drying of fruits and vegetables. In: Drying of Solids, ed. A.S. Mujumdar, 354-366. New York, NY: International Science Publisher. Mantius, H. L. and P. R. Peterson. 1995. Fruit extraction and infusion. USA-Patent No. 5419251: 320 861. Maskan, M. 2000. Microwave/air and microwave finish drying of banana. Journal of Food Engineering 44: 71-78. Masi, P. and M. Riva. 1988. Modeling grape drying kinetics. In Preconcentration and Drying of Food Materials, ed. S. Bruin, 203-214. Amsterdam, The Netherlands: Elsevier Science. Mudgett, R.E., E. C. To and D.I. Wang. 1974. Dielectric Properties of food materials. Journal of Microwave Power 9: 303–315. Mazza, G. 1979. Development and consumer evaluation of a native fruit product. Canadian Institute of Food Science and Technology 12(4):166-169. Mazza, G. 1982. Chemical composition of saskatoon berries (Amelanchier alnifolia Nutt.). Journal of Food Science 47:1730-1731.

85
Mazza, G. and M.W. Hodgins. 1985. Benzaldehyde, a major aroma component of saskatoon berries. Horticultural Science 20:742-744. Mazza, G. 1986. Anthocyanins and other phenolic compounds of saskatoon berries (Amelanchier alnifolia Nutt.). Journal of Food Science 51: 1260-1264. Mazza, G. and C.G. Davidson. 1993. Saskatoon berry: A fruit crop for the prairies. In New Crops, eds. J. Janick and J.E. Simon, 516-519. New York, NY: Wiley Publishers. Mudgett R E. 1986. Electrical properties of foods. In Engineering Properties of Foods, eds. M.A. Rao and S. S. H. Rizvi, 389-457. New York, NY: Marcel Dekker, Inc. Mujumdar, A. S. 1995. Convective transport in infrared drying. In Drying'92, ed. A. S. Mujumdar, 695–703. Amsterdam, The Netherlands: Elsevier Science. Nelson, S. O. 1973. Electrical properties of agricultural products - a critical review. Transactions of ASAE 16: 384–400 Ponting, J. D. and D. M. McBean. 1970. Temperature and dipping treatment effects on drying rates and drying times of grapes, prunes and other waxy fruits. Food Technology 4: 633-649. Potter, N.N. and J.H. Hothchkiss. 1995. Food Science, 5th edition. New York, NY: Chapman and Hall Publishers. Prabhanjan, D.G., H.S. Ramaswamy and G.S.V. Raghavan. 1995. Microwave assisted convective air drying of thin layer carrots. Journal of Food Engineering 25: 283-293. Raghavan, G.S.V., V. Orsat and M.S.Venkatesh. 2005. Microwave Processing of Foods. Stewart Postharvest Review 1(2): 1-8. Ramaswamy, H.S. and F. Nsonzi. 1998. Convective air-drying kinetics of osmotically pre-treated blueberries. Drying technology 16(5): 743-759.
Ranganna, S. 1986. Hand Book of Analyses of Quality Control for Fruits and Vegetables. New Delhi, India: Tata McGraw Hill Publishing Co. Ltd. Ratti, C. and A. S. Mujumdar. 1995. Infrared drying. In Handbook of Industrial Drying, ed. A. S. Mujumdar, 567–588. New York, NY: Mercel Dekker Inc. Reddy, L. N., V. Meda and M.D. Pickard. 2004. Combined convection, microwave and infrared processing of agricultural materials. ASAE Paper No. 046100. St Joseph, MI: American Society of Agricultural Engineers.

86
Reddy, L. N., V. Meda and B. Shrestha. 2005. Dielectric properties of saskatoon berries (Amelanchiar alnifolia) at different pretreatment and osmotic conditions. Paper No. MB04-110. Winnipeg, MB: Canadian Society for Bioengineering. Reddy, L. N. and V. Meda. 2005. Osmotic dehydration and combination drying technique for prairie fruits. In Proceedings of International Microwave Power Institute, 71-74, Seattle, WA. July 13-15. Reach and Discover. 2005. Agricultural Research and Innovation in Alberta. Issue 4 Spring. http://www.fundingconsortium.ca/rdmag/rd05s_00.pdf (2008/01/14) Risman, P.O. 1991. Terminology and notation of microwave power and electromagnetic energy. Journal of Microwave Power and Electromagnetic Energy 26: 243 – 250. Sharma, G. P., R. C. Verma and P. Pathare. 2005. Thin-layer infrared radiation drying of onion slices. Journal of Food Engineering 67: 361-366. Somogyi, L,P. and B.S. Luh. 1986. Dehydration of foodstuffs. In Commercial Fruit Processing, 2nd Edition, eds. J.G. Woodroof and B.S. Luh, 353-405. Westport, CT: AVI Publishing Company. Somogyi, L.P, H.S. Ramaswamy and Y.H. Hui. 1996. Processing Fruits: Science and Technology – Biology, Principles and Applications, 14-24. Boca Raton, FL: CRC Press. Tulasidas, T.N., G.S.V. Raghavan and E.R. Norris. 1993. Microwave and convective drying of grapes. Transactions of ASAE 36(6): 1861-1865. Turner, N.J., C. L.C. Thompson, M.T. Thompson and A.Z. York. 1990. Thompson Ethnobotany, 253-257. Victoria, BC: Royal British Columbia Museum. Turner, N.J. 1997. Food Plants of Interior First Peoples. Vancouver, BC: UBC Press. Van Arsdel, W. B., M. J. Copley, A. I. Morgan. 1973. Food Dehydration, 2nd edition. Westport, CT: AVI Publishing Co. Venkatachalapathy, K. 1998. Combined osmotic and microwave drying of strawberries and blueberries. Ph. D. Thesis, Montreal, QC: Department of Agricultural and Biosystems Engineering, McGill University. Venkatesh, M. S. 1996. M. Sc. Thesis: Cavity perturbation technique for measurement of dielectric properties of some agri-food materials. Published

87
M.Sc. thesis, Montreal, QC: Department of Agricultural and Biosystems Engineering, McGill University. Venkatesh, M. S., E. St-Denis, G. S. V. Raghavan, P. Alvo and C. Akyel 1998. Dielectric properties of whole, chopped and powdered grain at various bulk densities. Journal of Canadian Agriculture Engineering 40 (3): 191-200. Venkatesh, M.S. and Raghavan, G.S.V. 2005. An Overview of Dielectric Properties Measuring Techniques. Canadian Biosystems Engineering 47: 715-730. Yang, C.S.T. and W.A. Atallah. 1985. Effect of four drying methods on the quality of intermediate moisture lowbush blueberries. Journal of Food Science 50: 1233-1237. Yang, A.P.P., C. Wills and C.S.T. Yang. 1987. Use of combination process of osmotic dehydration and freeze drying to produce a raisin type low bush blueberry product. Journal of Food Science 52: 1651-1653. Statistics Canada. 2004. Industry Profile (Canada’s Food Processing Industry) http://www.statcan.ca/english/freepub/15-515-XIE/2004001/index.htm (2008/01/14). Statistics Saskatchewan. 2005. Processing, Fruit Overview http://www.agriculture.gov.sk.ca/Fruit_Overview (2008/01/14). Canada Foreign Affairs. 2005. Canada's International Market Access Priorities 2005. http://www.dfait-maeci.gc.ca/tna-nac/2005/7_05-en.asp (2007/12/15). Saskatchewan Agriculture. 2005. Fruit and Vegetable Production Statistics. http://www.agr.gov.sk.ca/docs/statistics/crops/horticulture/fruitveggies040226.pdf (2007/12/15). Devonian Botanic Garden. http://www.devonian.ualberta.ca/natvgrdn.html (2008/01/14). Prairie Plant System Inc. 2007. Saskatoon Berries (Amelanchiar alnifolia Nutt.) http://www.prairieplant.com/saskatoon-berries.htm (2008/01/14) Saskatchewan Chamber of Commerce. 2005. Intensification comes in a Variety of Forms. http://www.saskchamber.com/documents/259Action_Saskatchewan_Special_Feature_11.pdf (2008/01/14). Riverbend Plantation. 2005. http://www.saskatoonberry.com (2008/01/14).

88
APPENDIX
This section includes all the additional data for drying, dielectric properties,
preliminary studies, scanning electron microscope images and also digital
images of microwave dryer system with individual instrumentation. Temperature
trends explained in Section 5.3.2 are presented at other drying conditions.

89
Appendix A1. Microwave Combination Drying at 60, 70 and 80oC
Drying data (weight, g) for untreated and osmotically dehydrated berries at
different product drying temperatures (60, 70 and 80oC) under microwave-
convection combination conditions with respect to time are shown in this part of
the appendix.
30
40
50
60
70
80
90
100
110
0 20 40 60 80 100 120
Time (min)
Wei
ght (
g)
Combination 60C Combination 70CCombination 80C
Figure A1 Microwave combination drying of untreated saskatoon berries at 60,
70 and 80oC temperatures and corresponding weight loss plotted against time
(min).

90
40
50
60
70
80
90
100
110
0 10 20 30 40 50 60 70 80 90
Time (min)
Wei
ght (
g)
Combination 60C Combination 70CCombination 80C
Figure A2 Microwave combination drying (weight, g) of sucrose osmotic
dehydrated saskatoon berries at 60, 70 and 80oC temperatures and
corresponding weight loss plotted against time (min).

91
Appendix A2. Microwave drying at 60, 70 and 80oC
Drying data (weight, g) for untreated and osmotically dehydrated berries at
different product drying temperatures (60, 70 and 80oC) under microwave
conditions with respect to time are shown in this part of the appendix.
0
20
40
60
80
100
120
0 20 40 60 80 100 120 140 160
Time (min)
Wei
ght (
g)
Microwave 60C Microwave 70CMicrowave 80C
Figure A3 Microwave drying (weight, g) of untreated saskatoon berries at 60, 70
and 80oC temperatures and corresponding moisture loss plotted against time
(min).

92
25
35
45
55
65
75
85
95
105
115
0 20 40 60 80 100 120
Time (min)
Wei
ght (
g)
Microwave 60C Microwave 70C Microwave 80C
Figure A4 Microwave drying (weight, g) of sucrose osmotic dehydrated
saskatoon berries at 60, 70 and 80oC temperatures.

93
Appendix A3. Convection drying at 60, 70 and 80oC
Drying data (weight, g) for untreated and osmotically dehydrated berries at
different product drying temperatures (60, 70 and 80oC) under convection
conditions with respect to time are shown in this part of the appendix.
0
20
40
60
80
100
0 10 20 30 40 50 60 70 80 90 100 110
Time (min)
Air Temperature(C)Product Temperature (C)Relative Humidity(%)Weight (g)
Figure A5 Convection drying (weight, g) of sucrose osmotic dehydrated
saskatoon berries at 60oC temperature.

94
0
20
40
60
80
100
120
0 10 20 30 40 50 60 70 80 90 100 110 120Time (min)
Air Temperature (C)Product Temperature (C)Relative Humidity (%)Weight (g)
Figure A6 Convection drying (weight, g) of high fructose corn syrup osmotic
dehydrated saskatoon berries at 60oC temperature.
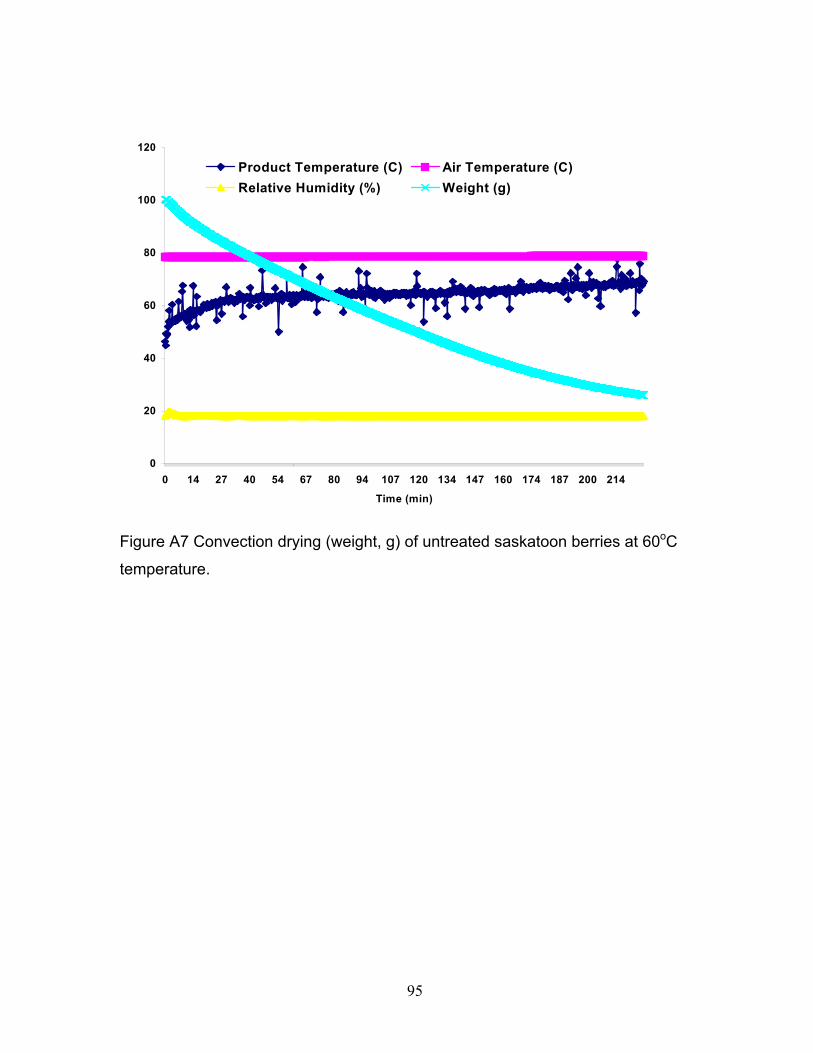
95
0
20
40
60
80
100
120
0 14 27 40 54 67 80 94 107 120 134 147 160 174 187 200 214
Time (min)
Product Temperature (C) Air Temperature (C)Relative Humidity (%) Weight (g)
Figure A7 Convection drying (weight, g) of untreated saskatoon berries at 60oC
temperature.

96
0
20
40
60
80
100
120
0 7 14 20 27 34 40 47 54 60 67 74
Time (min)
Air Temperature (C) Product Temperature (C)Relative Humidity (%) Weight (g)
Figure A8 Convection drying (weight, g) of sucrose osmotic dehydrated
saskatoon berries at 70oC temperature.

97
0
20
40
60
80
100
120
0 14 27 40 54 67 80 94 107 120
Time (min)
Product Temperature (C) Air Temperature (C)Relative Humidity (%) Weight (g)
Figure A9 Convection drying (weight, g) of untreated saskatoon berries at 70oC
temperature.

98
0
20
40
60
80
100
120
102 94 86 80 73 67 62 56 51 46 42 39 35Time (min)
Air Temperature (C) Product Temperature (C)Relative Humidity(%) Weight (g)
Figure A10 Convection drying (weight, g) of untreated saskatoon berries at 80oC
temperature.

99
Appendix A4. Temperature trends during microwave drying at 60oC.
Temperature variation at microwave power level P1 (refer Table 4.1) with time at
different locations of the sample holder.
0
10
20
30
40
50
60
70
80
1 21 41 61 81 101 121 141 161 181
Time (min)
Air Temperature (C)
Product Temperature1 (C)
Product Temperature2 (C)
Product Temperature3 (C)
Figure A11 Microwave drying product temperatures of high fructose corn syrup
treated saskatoon berries at 60oC product temperature and corresponding air
temperature (oC) plotted against time (min).
Note: Product temperatures are at three different locations on the sample holder.

100
Appendix B1. Microwave drying of fresh blueberries
Fresh blueberries in microwave environment and rupture due to high power
treatment.
Figure B1 Blueberries disintegrated structure after low power microwave drying.

101
Appendix C1. Dielectric properties of saskatoon berries
0
10
20
30
40
50
60
70
80
0.5
1.0
1.4
1.9
2.3
2.8
3.2
3.7
4.1
4.6
5.0
Frequency (GHz)
Frozen e' Frozen e"
Fresh e' Fresh e"
Figure C1 Dielectric properties of frozen saskatoon berry syrup.
10
12
14
16
18
20
22
24
26
28
0.5
1.0
1.4
1.9
2.3
2.8
3.2
3.7
4.1
4.6
5.0
Frequency (GHz)
ε"
40% 50% 60%
Figure C2 Dielectric loss factor variation of saskatoon berry syrup after osmotic
dehydration with 40, 50 and 60% sucrose sugars solutions.

102
0
5
10
15
20
25
30
35
40
40 50 60
Sugar Solution Concentration (Brix)
Sask
atoo
n B
errie
s B
rix6h 12h 18h 24h 36h
Figure C.3 Effect of high fructose corn syrup Concentration on Osmotic
Dehydration.
0
2
4
6
8
10
12
14
16
18
0.5
1.0
1.4
1.9
2.3
2.8
3.2
3.7
4.1
4.6
5.0
Frequency (0.5 - 5 GHz )
ε"
Whole berry Crushed
Figure C4 Dielectric loss factor (ε") variation with frequency of Fresh saskatoon
berries.

103
0
10
20
30
40
50
60
70
80
0.5 1.0 1.4 1.9 2.3 2.8 3.2 3.7 4.1 4.6 5.0
Frequency (0.5 to 5 GHz)
ε’ ε
”Cut e' Cut e" Whole e'Whole e" Paste e' Paste e"
Figure C5 Dielectric properties of fresh whole, cut and syrup of berries.
Figure C6 Dielectric constant (ε’) variation with frequency of frozen saskatoon
berries (whole and crushed).
0
5
10
15
20
25
30
35
40
45
50
0.5
1.0
1.4
1.9
2.3
2.8
3.2
3.7
4.1
4.6
5.0
Frequency (0.5 - 5 GHz)
ε'
Whole berry Crushed

104
0
10
20
30
40
50
60
70
80
90
0.5 1.0 1.4 1.9 2.3 2.8 3.2 3.7 4.1 4.6 5.0
Frequency (GHz)
Die
lect
ric P
rope
rtie
s
ε' ε''
Figure C7 Dielectric constant and Loss factor variation with frequency of water.

105
Appendix D1. Scanning Electron Microscope images of saskatoon berries
Figure D1 Scanning electron microscope image of osmotically dehydrated
berries with 50% sucrose solution.

106
Appendix E1. Digital Images of Experimental Setup
Figure E1 Frozen saskatoon berries.
Figure E2 Thawed saskatoon berries placed in polycarbonate sample holder.

107
Figure E3 Panel to switch between preset and modified settings.
Figure E4 Front panel with temperature controller and setup to monitor
convection and microwave run-time.
CN9000A Temperature Controller

108
Figure E5 Inverter technology built in the Panasonic microwave-convection
system.