drwg january 8, 2014| holyoke ma
DESCRIPTION
DRWG January 8, 2014| Holyoke MA. Doug Smith Manager of Demand Resource Administration. Demand Resource Performance During Summer 2013 Audits. Final Data. Summer 2013 DR Performance. - PowerPoint PPT PresentationTRANSCRIPT

DRWG JANUARY 8, 2014| HOLYOKE MA
DOUG SMITH
MANAGER OF DEMAND RESOURCE ADMINISTRATION
Demand Resource Performance During Summer 2013 Audits
Final Data

Summer 2013 DR Performance
• This presentation covers the aggregate results by load zone of Summer 2013 demand resource audits for the following resource types:– Real-time Demand Response (RTDR)– Real-time Emergency Generation (RTEG)– On-Peak and Seasonal Peak (non-dispatchable)
• Performance from the July 19, 2013 real-time dispatch of RTDR resources was covered in the November DRWG meeting: http://www.iso-ne.com/committees/comm_wkgrps/mrkts_comm/dr_wkgrp/mtrls/2013/nov62013/a02_july19_rtdr_performance.ppt.
2

3
RTDR Performance - Summer 2013 Audits
Load Zone Net CSO (MW) Final Performance (MW)
Percent of Final Performance to
Net CSO
CT 87 113 130%
ME 124 165 133%
NEMA 25 27 107%
NH 4 7 203%
RI 19 10 52%
SEMA 10 14 142%
VT 23 30 131%
WCMA 25 27 108%
Total 318 394 124%

4
RTDR Performance capped at Net CSO - Summer 2013 Audits
Load Zone Net CSO (MW) Final Performance (MW)
Percent of Final Performance to
Net CSO
CT 87 83 95%
ME 124 122 98%
NEMA 25 25 100%
NH 4 4 100%
RI 19 9 47%
SEMA 10 8 80%
VT 23 23 100%
WCMA 25 23 92%
Total 318 297 93%

RTDR Performance - Summer 2013 Audits
5

6
RTEG Performance - Summer 2013 Audits
Load Zone Net CSO (MW) Final Performance (MW)
Percent of Final Performance to
Net CSO
CT 74 74 100%
ME 7 8 114%
NEMA 20 25 125%
NH 11 12 109%
RI 9 14 156%
SEMA 10 11 110%
VT 2 4 200%
WCMA 20 21 105%
Total 153 169 110%

7
RTEG Performance capped at Net CSO - Summer 2013 Audits
Load Zone Net CSO (MW) Final Performance (MW)
Percent of Final Performance to
Net CSO
CT 74 63 85%
ME 7 7 100%
NEMA 20 19 95%
NH 11 11 100%
RI 9 9 100%
SEMA 10 9 90%
VT 2 2 100%
WCMA 20 19 95%
Total 153 139 91%

RTEG Performance - Summer 2013 Audits
8

9
On-Peak and Seasonal Peak Resource Performance Summer 2013 Audits
Load Zone Net CSO (MW) Final Performance (MW)
Percent of Final Performance to
Net CSO
CT 348 384 110%
ME 78 88 113%
NEMA 191 290 152%
NH 57 68 121%
RI 72 92 127%
SEMA 102 140 137%
VT 74 73 99%
WCMA 120 165 138%
Total 1042 1301 125%
10
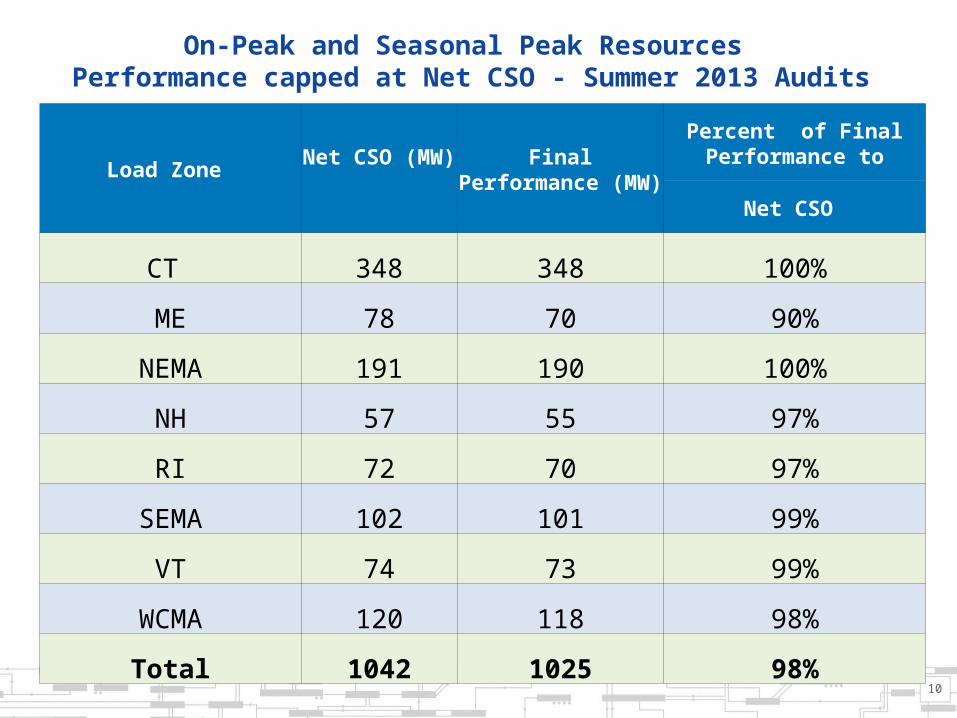
On-Peak and Seasonal Peak Resources Performance capped at Net CSO - Summer 2013 Audits
Load Zone Net CSO (MW) Final Performance (MW)
Percent of Final Performance to
Net CSO
CT 348 348 100%
ME 78 70 90%
NEMA 191 190 100%
NH 57 55 97%
RI 72 70 97%
SEMA 102 101 99%
VT 74 73 99%
WCMA 120 118 98%
Total 1042 1025 98%

On-Peak and Seasonal Peak Resources Performance Summer 2013 Audits
11

12