drs. steve hoff, andersen, and kerr - foaming at the pit: a research update
TRANSCRIPT

Progress on Pit Foaming(what we know, what we don’t know, what we’re doing)
2015 Iowa Pork Congress
Dan Andersen, PhDSteve Hoff, PhD
Dept. of Ag & Biosystems EngineeringIowa State University
Brian Kerr, PhDSteve Trabue, PhD
USDA-ARS National Center for Agriculture and the EnvironmentAmes, Iowa
January 28, 2015

Objectives for Today
Update on IPPA-funded Pit Foaming Research
Summarize Results
Precautionary Measures

Overall Foaming Requirements
Three-phase Process:
1. Gas generation (i.e. methane, hydrogen sulfide),
2. Surface tension reduction (surfactants; bio- or otherwise),
3. Bubble support structure (i.e. small fibers).
H2S
CH4
CH4
CH4
H2S
H2S
A surfactant causes surface to“elasticize”
Gases otherwise naturallyescaping at very low concentrations are trapped
Foam supported by bacteriaor fine fibers or ??

Photo courtesy of Dr. Larry Jacobson, UMN
Foam Creeping Through Slats (4 ft of foam case)
In-field Foaming
Foam Into Animal Occupied Zone
Photo courtesy of Dave Preisler, MPB;Dr. Larry Jacobson, UMN
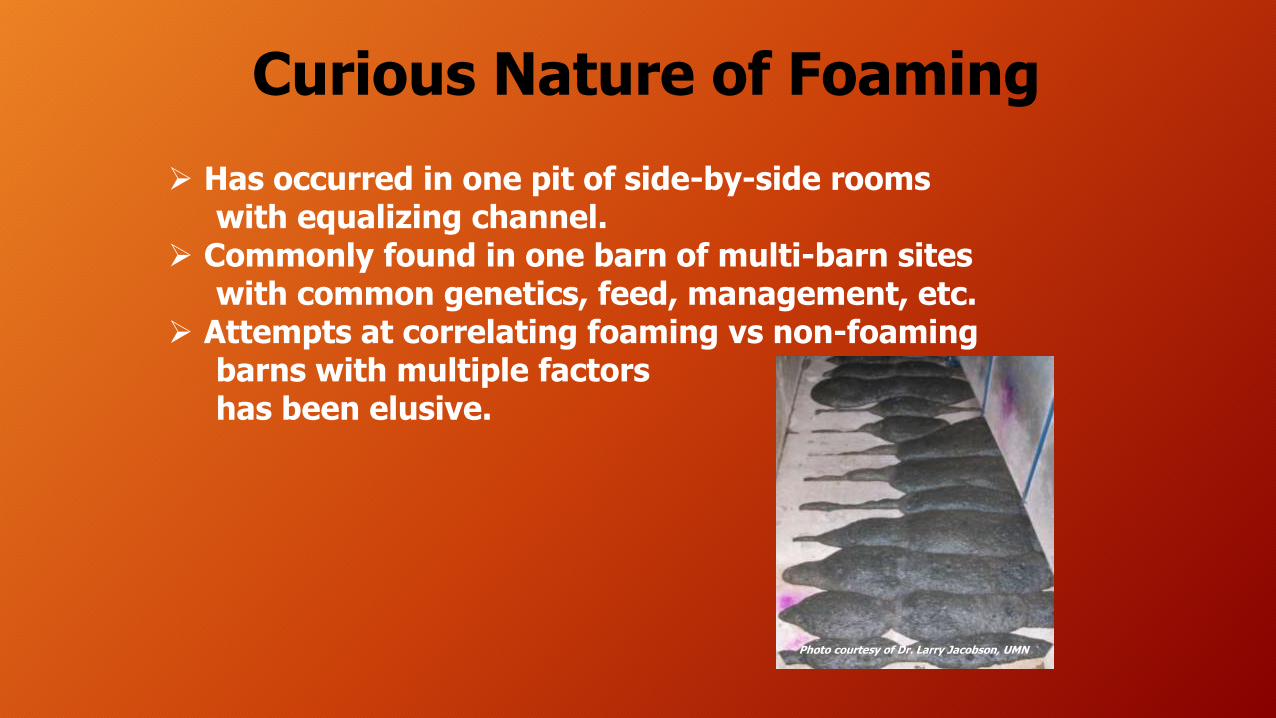
Curious Nature of Foaming
Has occurred in one pit of side-by-side roomswith equalizing channel.
Commonly found in one barn of multi-barn siteswith common genetics, feed, management, etc.
Attempts at correlating foaming vs non-foamingbarns with multiple factorshas been elusive.
Photo courtesy of Dr. Larry Jacobson, UMN

IPPA Funded Research Project
GOAL: Finding and Correctingthe Mechanisms of Foaming
Photo courtesy of Dr. Larry Jacobson, UMN

IPPA Funded Research Effort
Multi-state effort (ISU, UMN, UILL) involving 20+ academicprofessionals with expertise in manure management,chemistry, microbiology, feed rations, and digestibility
$1M investment over three years (we are finishing YR2)
Project managed by Iowa State University
Our team is working diligently to solve this problem

Multi-state Research Collaboration
• Feed trials
• Chemical composition
analysis
• Methane production
• Foaming potential
testing
ISU/USDA-ARS UMN
• Extensive producer
survey
• Microbial analysis
• Foaming potential
testing
UILL
• Organize all manure
sampling and
distribution
• Microbial analysis
Dan AndersenBrian KerrSteve Trabue
Chuck ClantonLarry JacobsonBo HuBrian Hetchler
Rich Gates, Angela Kent, Laura Pepple

Theory
• Biogas
Generation of methane, CO2 and
hydrogen sulfide.
• Surfactants
Materials that significantly
change the surface tension.
• Stabilizer
Increases the stability of foam
bubbles, like small fibers and
other hydrophobic particles.

Hypotheses - Mechanism
(1) Increased prevalence of foaming is due to increased biogas/methane production from the manure
(2) Elevated concentrations of surface active agents in foaming manures are causing greater gas capture
(3) Foam is being stabilized by small particles/proteins
(4) Differing physical, chemical, and biological properties are related to dietary inputs.
Hypotheses - Microbial
• Brief Background
• ARISA & Sequencing
• Site, Management, and Environmental Factor Database
• Objective 1 – Microbial community differences
• Objective 2 – Identify relevant microbes using sequencing
• Objective 3 – Use relational database with Obj’s 1 and 2
• Methanogen Sequencing

Manure Sampling SOP
A
B
C
D
foam/crust
transition
slurry
sludge
Samples were collected from discrete depths in the manure storage pit.
Samples from 2 Integrators
Over 60 Sites
Generated more than 2000 manure samples

Sample Summary: Cases
CLASSIFICATIONINTEGRATORA INTEGRATOR
B#OFSAMPLES #OFSAMPLES
NON-FOAMING 250 183
FOAMING 255 362
NOTTREATED 178 163TREATED 327 362
PREVIOUSPUMPOUT 24 18FALL2012 337 460
SPRING2013 142 38FALL2013 2 9
CASE1(FOAMING) 115 76CASE2(NON-FOAMING) 85 258CASE3(TRANSITION) 157 111CASE4(UNSTABLE) 148 80
TOTAL 505 525

Why Foam? Why Now?
Diet composition and particle size effects on nutrient excretion
Diet ID Diet Composition
Digestion/Excretion
Coefficient Output, kg1
Output
difference, kg
Estimated C
Equivalence, kg2
C-SBM 4.6% EE 63% (37%) 6,592
7.0% NDF 66% (34%) 9,223
17% CP 88% (12%) 7,905
45% Carbon 91% (9%) 15,694
C-SBM + FIBER 6.2% EE 63% (37%) 8,889 2,297 (+35%) 28%
13.8% NDF 68% (32%) 17,112 7,889 (+85%) 55%
17% CP 85% (15%) 9,881 1,976 (+25%) 17%
46% Carbon 87% (13%) 23,291 7,597 (+48%)
1Output based upon 310 kg feed/pig from wean-to-finish and 1,250 pigs/barn.2Lipid = 76% carbon; Protein = 53% carbon; Fiber = 45% carbon.

Dietary Tidbits
• Averaged across 3 trials in our metabolism/tank studies, high fiber diets increased manure carbon by approximately 40%.
• Intact fats are less digestible than ‘added’ fats (e.g., 65% versus 85%, respectively).
• We do not know any interactive effects between fiber and lipid type, or between fiber and lipid level.
• On average, grinding to a finer particle size, 374 vs 631 m, improved FAT, FIBER, CP, and C digestibility by 30, 8, 3, and 3%, respectively. In general, finer grinding improves digestibility of low-digestible ingredients more than high-digestible ingredients.
• DDGS of 340 μm exhibited an FAT digestibility of 75% compared to 57% for DDGS of 650 μm
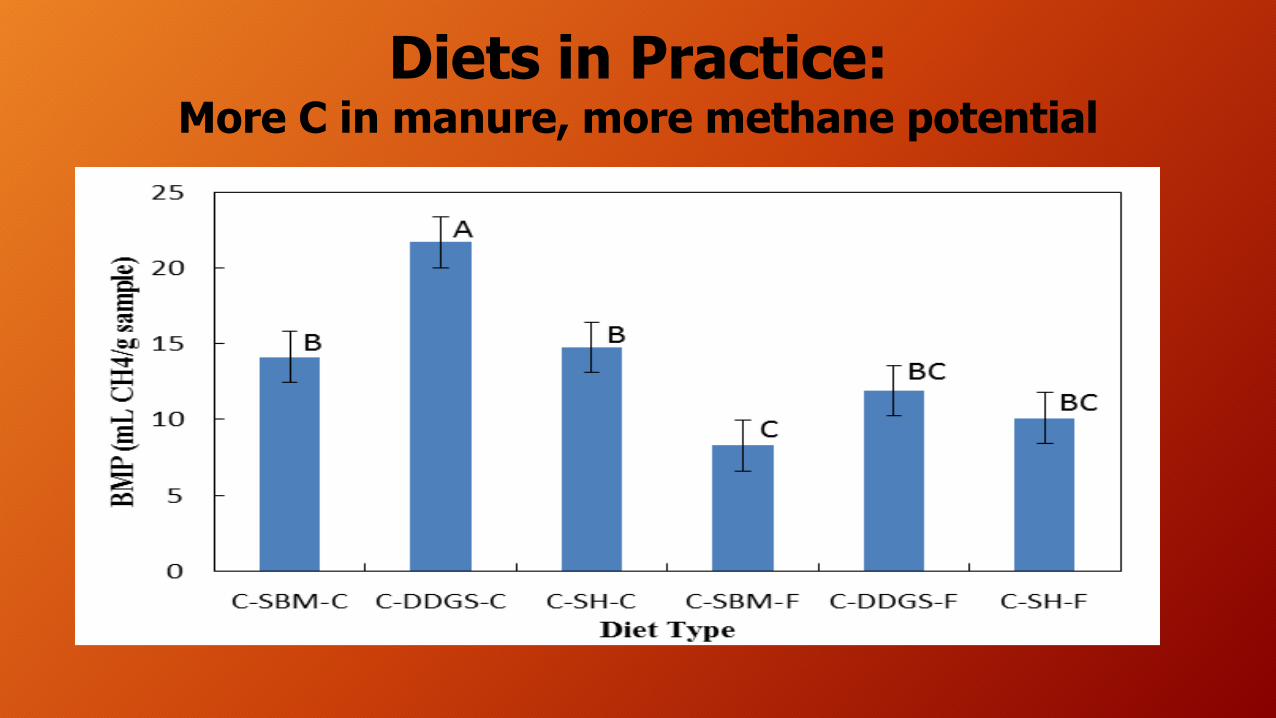
Diets in Practice:More C in manure, more methane potential

How do you study the gas phase?
MPRL
L ∗ day=(Methane %
1100)(Biogas Produced mL + Vheadspace) × ρmanure(
gmL)
Mass of sample g × incubation period(minutes)×1440 minutes
day
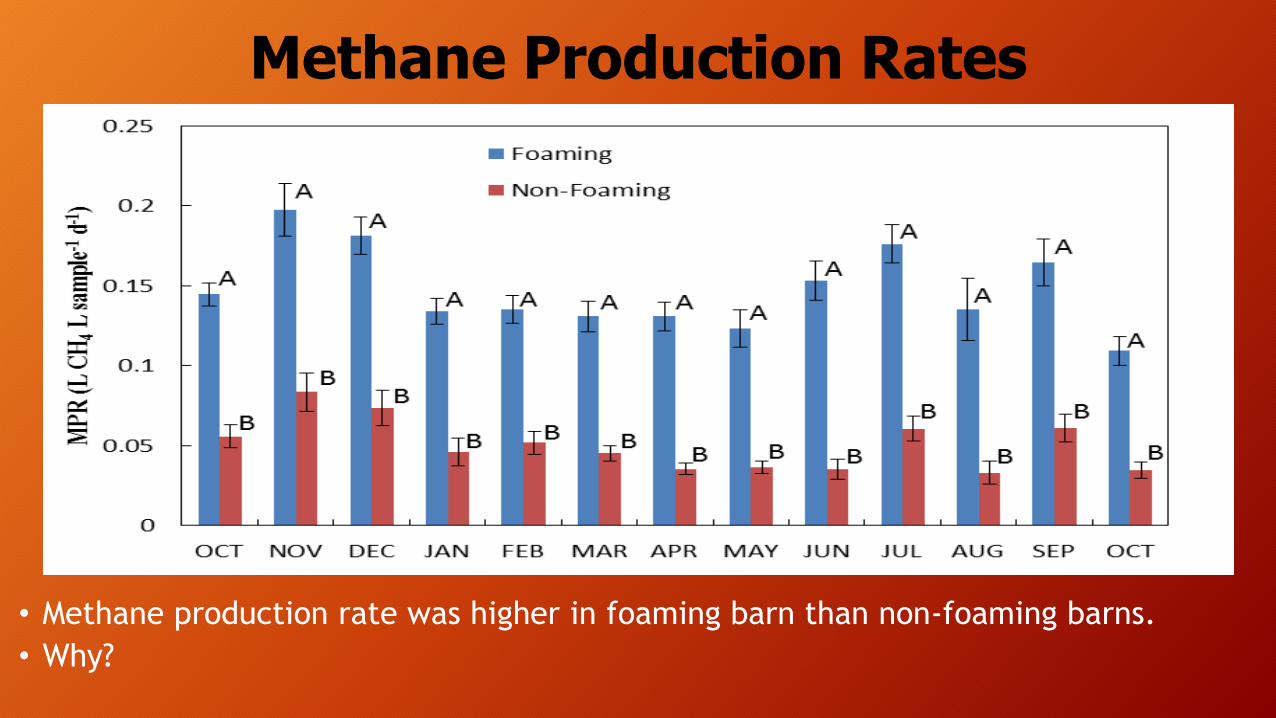
Methane Production Rates
• Methane production rate was higher in foaming barn than non-foaming barns.
• Why?

What would cause this difference?
• Quantity of carbon inputs?• TS, VS, VFA
• Source of carbon?• BMP, VFA
• Differences in microbes?• Degraders, methanogens, sulfate reducers
• Microbial community structure
• Response to different carbon substrates?• Differences in pathways/response to substrate?

Quantity of Food?
0
2
4
6
8
10
12
A B C D
Tota
l Sol
ids
(%)
Sample Depth
Foaming Non-FoamingA
DE
B C
A A
0
1
2
3
4
5
6
7
8
9
A B C D
Vola
tile
Solid
s (%
)
Sample Depth
Foaming Non-FoamingA
CD
BB
A A

Quality of Food?
• Difference between foaming and non-foaming, but non-foaming is better and driven by VFA’s
• More solids deeper in the manure, but quality of those solids is lower
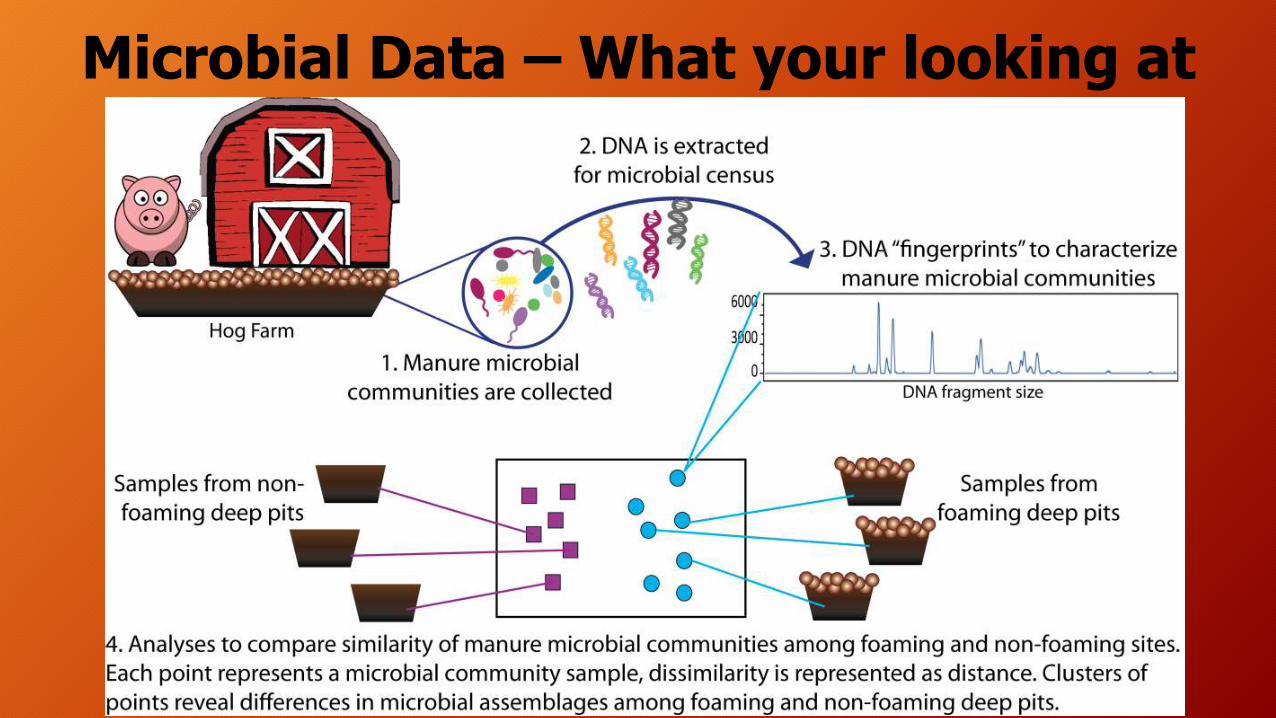
Microbial Data – What your looking at

Microbial Differences?
• Foaming and non-foaming sites have distinct microbial communities
• Sequencing Data

Microbial Richness (Diversity)
Integrator A Integrator B

So which microbes are these?
• Differences in relative abundance of dominant taxa are associated with
foaming—but no new microbes.
0%
2%
4%
6%
8%
10%
12%
14%
16%
18%
20%
non.foaming
foaming

So can these microbes be related to management practices?

So what is influencing these microbes?
Integrator B

Is this related to functionality?
Integrator B

So do they like a certain food better?

What about surfactants?
Difference between F and NF – driven by VFA concentrations
Difference between B and C&D driven by ??? (oil/long chain fatty acids)
What is role of particles/proteins?
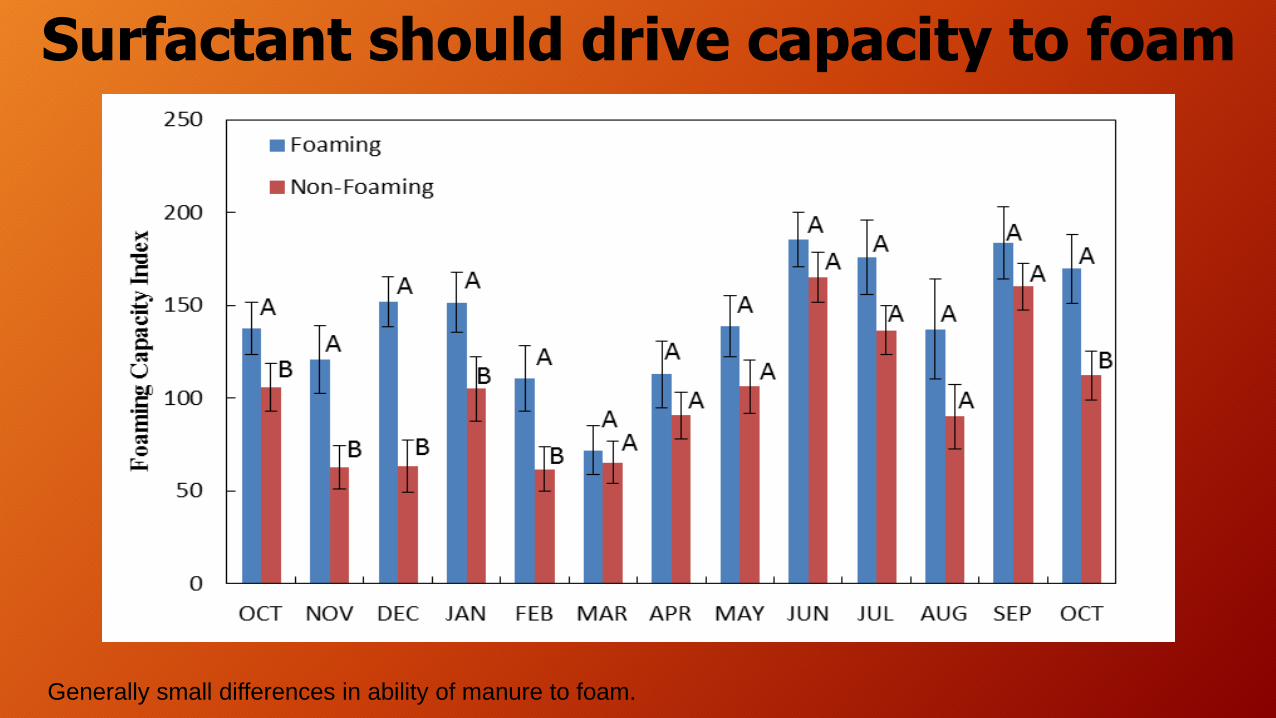
Surfactant should drive capacity to foam
Generally small differences in ability of manure to foam.

What stabilizes foam?
0
1
2
3
4
5
6
7
8
9
A B C D
Vola
tile
Sol
ids
(%)
Sample Depth
Foaming Non-FoamingA
CD
BB
A A
• What did we notice about samples that stabilized
• Solids rich, but finer looking solids, not big chunks
• Liquid drained more slowly from the foam
• Sort of set up, with solids in bubble matrix
• Good foams grey/brown (protein), bad foams were white/clear (fats/oils)

Foam is really stable
0
200
400
600
800
1000
1200
1400
1600
1800
A B C D
Foa
m H
alf-
Lif
e (M
inut
es)
Sample Depth
Foaming
Non-Foaming
AB B B BB

The foam stays wet - viscous
0
2
4
6
8
10
12
Foam Foaming Manure Non-FoamingManure
Visc
osity
(cP)
As Is
Centrifuged
Filtered
A
BB
a
b b1
2 2
Its not just the solids, something else is giving us viscosity in the foam.
-sugar, oil, lipopolysaccharides, proteins? Microbial goo

but… Particles hold it together
0
0.1
0.2
0.3
0.4
0.5
0.6
0.7
0.8
0.9
1
0.01 0.1 1 10 100 1000
Frac
tion
of P
artic
les F
inne
r
Particle Size (um)
Foam
Foaming Manure
Non-foaming Manure
0
20
40
60
80
100
120
140
160
180
200
Foam Foaming Manure Non-foamingManure
Aver
ag P
artic
le S
ize (u
m)

Does diet influence these particles?
0.00
0.04
0.08
0.12
0.16
0.20
0.0 0.3 2.0 16.0 128.0 1,024.0
Frac
tion
of P
arti
cles
in
Size
Cla
ss
Particle Size (μm)
C-SBM-C C-DDGS-C
C-SH-C C-SBM-F
C-DDGS-F C-SH-F
Greater percent of particles were fine silt particles from inoculated manure (p < 0.05) & courser grind (p = 0.1254)

If you add these particles will make foam?
Yes…. But they have to interact with proteins
Add moving particles from foaming manure to non-
foaming manure will make it foam.
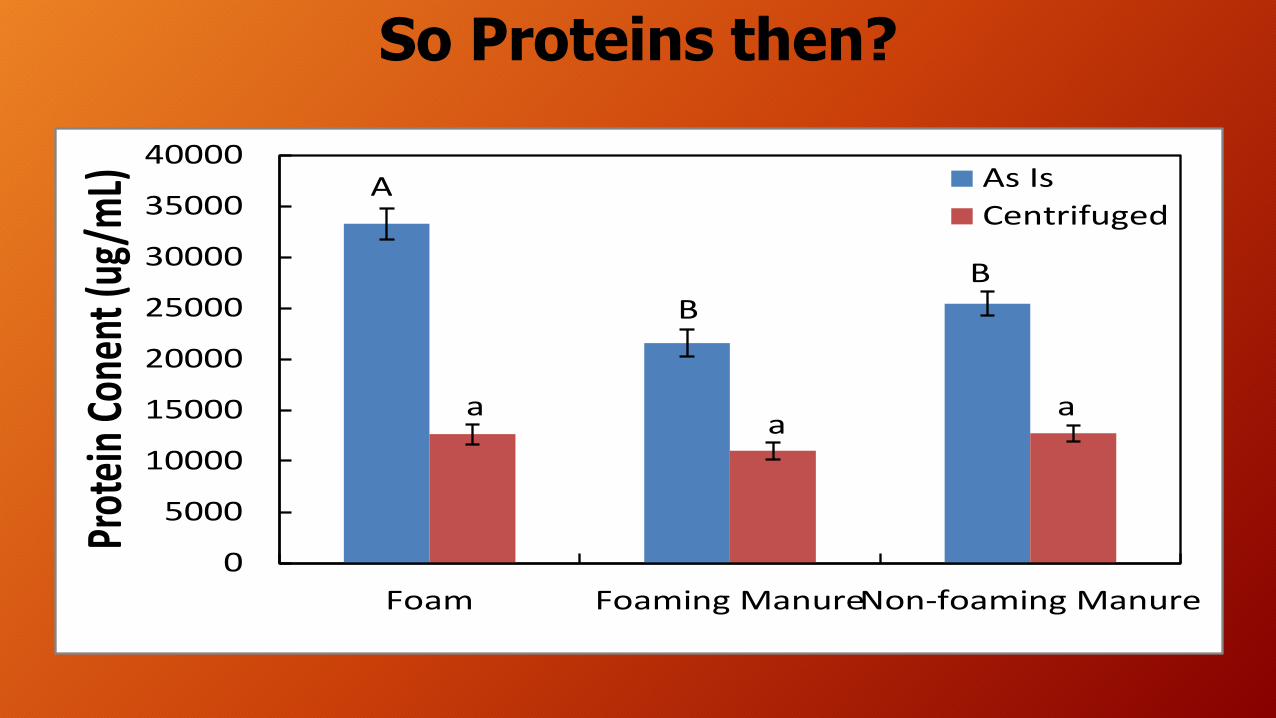
So Proteins then?
0
5000
10000
15000
20000
25000
30000
35000
40000
Foam Foaming ManureNon-foaming Manure
Prot
ein
Cone
nt (u
g/m
L) As Is
CentrifugedA
B
B
aa
a

So remove proteins, stop foam?
• Removal of protein strongly reduces foaming capability and stability

What’s holding the proteins together?Total Carbohydrates
mg
g-1 m
anur
e
0.0
0.5
1.0
1.5
2.0
2.5 Foam
Foam Manure C
Non-Foam Manure C
Total Hemicellulose
g g-1
man
ure
0
200
400
600
800
1000
Foam
Foam Manure C
Non-Foam Manure C0.977
0.7980.783

So what do we know now?• High fiber feed ingredients have reduced nutrient digestibility increasing
levels of C reaching the pit.
• Efficiencies in both the processing of these new C inputs and fermentation of fatty acid material have resulted in increased levels of methane production.
• Higher levels of methane production have resulted in separation (i.e., translocation) and concentration of biological material into a foam layer.
• The foam layer itself showed unique characteristics:• Solids Enriched with Fine Particles (Proteins)
• Enhanced Foam Stability
• Higher Total Carbohydrates
• Liquid is viscous

Precautionary Measures
Any attempt to break-up foam WILL releaseexplosive levels of methane. Therefore….
1. All ignition sources OFF (i.e. pilot lights, welding),2. Set ventilation at 30 cfm/pig space minimum,
- Use open curtains if ≥ 10 mph wind, OR,- Use fans* + ceiling inlets if calm
3. Make sure ceiling inlets operational,4. Vacate barn, then finally,5. Foam/pit can be disturbed.
* In a 1000-hd barn, equates to 2-48” or 3-36” or 6-24” fans

Ventilation Strategies(1000-hd Finisher)
6-24” fans or 3-36” fans or 2-48” fans+ operational ceiling inlet system +
curtains closed
OR
Curtains Open with Wind of ≥ 10 mph
But NOT
Curtains Open, Calm ConditionsReliance on Fans

Precautionary Measures (NPB)
http://www.pork.org/filelibrary/November2009%20PCRSE.pdf

Precautionary Measures (ISU)
http://www.agronext.iastate.edu/immag/

Precautionary Measures (UMN)
http://www1.extension.umn.edu/agriculture/manure-management-and-air-quality/

Questions, comments, discussion?