drought monitoring using rainfall, evapotranspiration and
TRANSCRIPT

_____________________________________________________________________________________________________ *Corresponding author: E-mail: [email protected];
Journal of Scientific Research & Reports 26(8): 133-144, 2020; Article no.JSRR.62235 ISSN: 2320-0227
Drought Monitoring Using Rainfall, Evapotranspiration and Streamflow Data: A Case Study of Kaduna River Catchment Area (Nigeria)
A. Dare1*, E. J. Zakka1, Maikano Samson2, A. O. Afolabi1,
S. O. Okechalu3 and B. Amos3
1Department of Agricultural and Bio-Environmental Engineering Technology, Federal College of
Forestry Mechanization, Afaka, Kaduna State, Nigeria. 2Department of Agricultural and Forestry Technology, Federal College of Forestry Mechanization,
Afaka, Kaduna State, Nigeria. 3Department of Horticulture and Landscape Technology, Federal College of Forestry Mechanization,
Afaka, Kaduna State, Nigeria.
Authors’ contributions
This work was carried out in collaboration among all authors. Author AD designed the study, and
wrote the first draft of the manuscript. Authors EJZ and MS managed the analyses of the study. Authors AOA, SOO and BA managed the literature searches. All authors read and approved the final
manuscript.
Article Information
DOI: 10.9734/JSRR/2020/v26i830303 Editor(s):
(1) Dr. Rahul Kumar Jaiswal, National Institute of Hydrology, India. Reviewers:
(1) ucian Sfîcă, Alexandru Ioan Cuza University, Romania. (2) Suchit Kumar Rai, Indian Grassland and Fodder Research Institute (IGFRI), India.
Complete Peer review History: http://www.sdiarticle4.com/review-history/62235
Received 15 August 2020 Accepted 21 October 2020
Published 18 November 2020
ABSTRACT
Drought is defined as the lack of adequate precipitation, either rain or snow that causes reduced soil moisture or groundwater, diminished streamflow, crop damage and a general water shortage. The objective of this study focuses on meteorological and hydrological drought monitoring in river Kaduna catchment area. Standardized Precipitation Index (SPI) and Reconnaissance Drought Index (RDI) drought indices were used to characterize meteorological drought while Streamflow Drought Index (SDI) was used for hydrological drought monitoring for a period of 34 years (1967 – 2001). DrinC software, a drought indices calculator, was used for the calculation of SPI, RDI, and SDI respectively. The drought severity classification based on meteorological and hydrological
Original Research Article

Dare et al.; JSRR, 26(8): 133-144, 2020; Article no.JSRR.62235
134
drought indices gave 33% and 37% drought conditions period with the year 1967 – 2001. Based on these indexes, the drought characteristics of the catchment area were investigated by analyzing meteorological data from 1967 to 2001. The results of this analysis show that more non-drought/normal conditions were predominant than drought conditions. During the period under study (34 years), only one-year return period of extreme drought condition.
Keywords: Meteorological drought; hydrological drought; river Kaduna catchment; Standardized
Precipitation Index (SPI); Reconnaisance Drought Index (RDI); Streamflow Drought Index (SDI); Drought Indices Calculator (DrinC).
1. INTRODUCTION The main cause of a drought is the lack of precipitation for widespread period of time and considering its effect on hydrological process, the precipitation lack will make lower in soil moisture, ground water, and streamflow. Using the potential evapotranspiration in addition to the precipitation as the key variables for assessing the severity of drought, a promising drought index, the reconnaissance drought index (RDI), was proposed [1, 2]. RDI has been used in several regions and is gaining ground, mainly due to its low data requirements and its high sensitivity and resilience [3,4,5]. The most crucial aspect of drought is the significant decrease of streamflow and the lower water storage in reservoirs, conventionally referred to as “hydrological drought”. For developing drought assessment models, the understanding of concept of drought is necessary. Regions where a majority of the population is dependent on water supply from streams or rivers are affected severely by occurrence of hydrological drought. Agricultural drought causes despair in population and livestock in the whole region. The reduction in streamflow can lead to additional pressure on government resources. These resources could be meant for being utilized in other productive purposes. According to Awosika et al.,[6] stated that due to global warming, droughts are predicted to turn into more prominent in some of the dry regions of world.
2. METHODOLOGY
2.1 Study Area River Kaduna drainage basin lies between latitude 9°30’N and latitude 11°45’N; longitude 7°03’E and longitude 8°30 ‘E with a total basin area of approximately 21,065 km2 (Fig. 1). The basin enclosed major rivers such as Kubanni, Galma, Tubo which are tributaries to the main River Kaduna and a greater part of the Kaduna metropolis. The basin lies on the High Plains of
Northern Nigeria at altitude of about 670m above sea level and situated within the Northern Guinea Savannah. Typical of the savannah climate, River Kaduna drainage basin experiences distinct wet and dry seasons. Relative Humidity is high only during the rainy season, but drops during the dry season [7].
2.2 Data Availability The monthly precipitation amount, air temperature and stream flow data was obtained from five meteorological and streamflow gauge stations (Point A to E) within the study area for 34 years (1967 to 2001) as shown in Fig. 1 and details on each stations were shown in Table 1. The few missing data within the time series was derived through extrapolation procedures. These data were obtained daily and later prepared at monthly and annual level for further analysis. All these data were obtained from the Weather and Streamflow Record book of Kaduna State Waterboard, Kaduna State and Nigerian Meteorological Agency (NiMet). The period of 34 years was concluded due to data accessibility constraint. 2.3 Drought Indices Calculation DrinC was used for the drought indices calculation. Monthly and annual rainfall data from 1967 to 2001 obtained from the meteorological stations was prepared in Excel 2013 which was used as an input to DrinC for SPI program calculation. Input files are created and one by one and SPI values are computed for each station on 1, 3, 6, 12-months’ time scales. Database is created for SPI results from 1967-2001. Average monthly temperature for the period under study was prepared in Microsoft Excel 2013 and was imported into the calculator for potential evapotranspiration calculation based on the method of Blaney Criddle method. RDI was calculated in same time series as SPI. The input data used was monthly precipitation and evapotranspiration data. The monthly streamflow

Dare et al.; JSRR, 26(8): 133-144, 2020; Article no.JSRR.62235
135
data in m3sec
-1 was prepared using excel and
after that imported into the calculator for SDI calculation. All the output from the calculator was in Microsoft excel format from which graphs was plotted for further analysis. 2.3.1 Standardized Precipitation Index SPI For the SPI calculation, the equation below was used [8,9,10] found the gamma distribution to fit well to the climatological precipitation time series. The gamma distribution is defined by its frequency or probability density function:
�(�) =�
���(�)������/�, ��� � > 0 (1)
Where, �(�) = gamma distribution, α and � = shape and scale parameters respectively, � = precipitation amount
Γ(α) = gamma function. Parameters α and � of the gamma pdf (probability density function) are estimated for each station and for each time scale of interest (1, 3, 6, 12 months, etc.). Maximum likelihood estimations of α and � are:
� =�
���1 + �1 +
��
�� , � =
�̅
�, �ℎ��� � = ln(�̅) −
∑ ��(�)
� (2)
Where, n = number of observations, �� = mean Precipitation amount
Since the gamma function is undefined for � = 0 and a precipitation distribution may contain zeros, the cumulative probability becomes:
�(�) = � + (1 − �)�(�) (3)
Where, � = probability of zero precipitation, �(�)= cumulative probability of the incomplete gamma function.
2.3.2 Reconnaissance Drought Index (RDI)
The (RDI) was based on the equation below ([1]; [2]);
��(�)
=∑ �������
∑ (���)������
,� = 1(1)� ��� � = 1(1)� (4)
Where; ��� and ����� = precipitation and potential
evapotranspiration of the j-th month of the i-th year N = total number of years of the available data.
By assuming that the lognormal distribution is applied, the following equation can be used for the calculation of RDIst:
�����(�)
=�(�)���
��� (5)
Where, y(i) = ln(ak
(i) ),�� = arithmetic mean; �� y= standard deviation 2.3.3 Streamflow Drought Index (SDI) According to Nalbantis [11], if a time series of monthly streamflow volumes Qi,jis available, in which i denotes the hydrological year and j the
Table 1. Meteorological and stream gauging stations within River Kaduna Watershed
S/NO Meteorological Stations Stream Gauging
Stations Stream Gauging Coordinates
1 Point A Nimet (Nigeria Meteorological Agency), Kaduna
At River Tubo 7°17’40”E; 10°28’11”N
2 Point B Wusasa HydroMet. Station At River Wusasa 7°19’30”E; 10°41’13”N
3 Point C Zango Kartarf HydroMet Station
At River Chalwe 7°49’49”E 9°37’50”N
4 Point D Kaduna South HydroMet Station
At River Kaduna 7°8’40”E; 10°13’18”N
5 Point E Kauru HydroMet Station At River Kwasau 7°44’29”E; 10°4’28”N 6 Point F Zaria HyroMet Station At River Zaria dam
Intake 7°3529”E; 10°32’57”N

Fig. 1. Nigeria map showing states and drainage map o
month within that hydrological year (j = 1 for October and j = 12 for September), Vobtained based on the equation:
Dare et al.; JSRR, 26(8): 133-144, 2020; Article no.
136
map showing states and drainage map of Kaduna State
month within that hydrological year (j = 1 for October and j = 12 for September), Vi,k can be
��,� = ∑ ��,� � = 1,2,…… ������
1,2,……,12 � = 1,2,3,4
; Article no.JSRR.62235
f Kaduna State
=
(6)

Dare et al.; JSRR, 26(8): 133-144, 2020; Article no.JSRR.62235
137
Where, Vi,k = Cumulative streamflow volume for the i-th hydrological year and the k-th reference period, k= 1 for October-December, k= 2 for October-March, k= 3 for October-June, and k = 4 for October-September. Based on the cumulative streamflow volumes Vi,k, the Streamflow Drought Index (SDI) is defined for each reference period k of the i-th hydrological year as follows:
����,� =��,�����
�� � = 1,2,3,4 (7)
Where, �� k and sk = respectively the mean and the standard deviation of cumulative streamflow volumes of the reference period k as these are estimated over a long period of time. In this definition the truncation level is set to ��k although other values based on rational criteria could be also used.
3. RESULTS AND DISCUSSION
3.1 Rainfall and Evaporation Characteristics
Rainfall analysis was done annually and monthly. The rainfall analysis especially for drought risk study include information concerning the precipitation amount trends, start of dry period, number of dry month, and start of rainy season. Rainfall data obtained during 34 years from five stations show the average annual rainfall as 1230 mm. The lowest average was 1038 mm in 1971 recorded at Kaduna South HydroMet station and the highest was as high as 1481mm in 1980 recorded at Kaduna North HydroMet station. Trend analysis of precipitation showed a slight decrease of precipitation amounts in the last 34 years. Fig. 2 shows an decreasing of annual rainfall pattern
3.2 SPI Analysis A drought event starts when SPI value reaches -1.0 and ends when SPI becomes positive again. The SPI calculation shows that the SPI 1-month time scale was -3.11 indicating extremely dry condition experienced in 1970-71 and 1.88 indicating no dry condition, -1.96 for 3-month time scale indicating severe dry conditions in 1988-89 and 1.42 (wet condition) in 1977-78, -3.89 for 6-month time scale (1982-83) indicating a period of extremely dry condition and 1.33 in 1977-78 indicating wet conditions, and -2.01 for 12-month time scale indicating extremely dry conditions in 1989 -90 while 1.78 showed wet conditions in 1979-80. Fig.s 3 – 6 describe the differences of drought frequencies and their duration as the result of different SPI time scales. 3.3 RDI Analysis RDI drought classification threshold is the same as SPI. So, RDI is calculated in various time scales as shown in Figs. 7-10. RDIst calculation shows that the RDIst 1-month time scale is -2.55 indicating extremely dry condition experienced in 1988-89 and 1.65 indicating no dry condition, -2.45 for 3-month time scale indicating severe dry conditions in 1988-89 and 1.51 (wet condition) in 1977-78, -3.88 for 6-month time scale (1982-83) indicating a period of extremely dry condition and 1.36 in 1977-78 indicating wet conditions, and -1.99 for 12-month time scale indicating extremely dry conditions in 1989 -90 while 1.87 showed wet conditions in 1974-75. Also, Fig. 11 shows the frequency of drought severity classification as characterized by RDIst.
Fig. 2. Trend line of annual rainfall
0
200
400
600
800
1000
1200
1400
1600
0 5 10 15 20 25 30 35 40
Rai
nfa
ll (m
m)
Years

Dare et al.; JSRR, 26(8): 133-144, 2020; Article no.JSRR.62235
138
Fig. 3. SPI values for the River Kaduna Catchment for October reference period against years
Fig. 4. SPI values for the River Kaduna Catchment for October to December reference periods
against years
Fig. 5. SPI values for the River Kaduna Catchment for October to March reference periods against years
-2.50
-2.00
-1.50
-1.00
-0.50
0.00
0.50
1.00
1.50
2.00
19
67
-1
96
81
96
8 -
19
69
19
69
-1
97
01
97
0 -
19
71
19
71
-1
97
21
97
2 -
19
73
19
73
-1
97
41
97
4 -
19
75
19
75
-1
97
61
97
6 -
19
77
19
77
-1
97
81
97
8 -
19
79
19
79
-1
98
01
98
0 -
19
81
19
81
-1
98
21
98
2 -
19
83
19
83
-1
98
41
98
4 -
19
85
19
85
-1
98
61
98
6 -
19
87
19
87
-1
98
81
98
8 -
19
89
19
89
-1
99
01
99
0 -
19
91
19
91
-1
99
21
99
2 -
19
93
19
93
-1
99
41
99
4 -
19
95
19
95
-1
99
61
99
6 -
19
97
19
97
-1
99
81
99
8 -
19
99
19
99
-2
00
02
00
0 -
20
01
SPI V
alu
es
Years
1 SPI
-2.50
-2.00
-1.50
-1.00
-0.50
0.00
0.50
1.00
1.50
2.00
19
67
-1
96
81
96
8 -
19
69
19
69
-1
97
0
19
70
-1
97
11
97
1 -
19
72
19
72
-1
97
31
97
3 -
19
74
19
74
-1
97
51
97
5 -
19
76
19
76
-1
97
71
97
7 -
19
78
19
78
-1
97
91
97
9 -
19
80
19
80
-1
98
11
98
1 -
19
82
19
82
-1
98
31
98
3 -
19
84
19
84
-1
98
51
98
5 -
19
86
19
86
-1
98
71
98
7 -
19
88
19
88
-1
98
91
98
9 -
19
90
19
90
-1
99
11
99
1 -
19
92
19
92
-1
99
31
99
3 -
19
94
19
94
-1
99
51
99
5 -
19
96
19
96
-1
99
71
99
7 -
19
98
19
98
-1
99
91
99
9 -
20
00
20
00
-2
00
1
SPI V
alu
es
Years
3 SPI
-5.00
-4.00
-3.00
-2.00
-1.00
0.00
1.00
2.00
19
67
-1
96
8
19
68
-1
96
9
19
69
-1
97
0
19
70
-1
97
1
19
71
-1
97
2
19
72
-1
97
3
19
73
-1
97
4
19
74
-1
97
5
19
75
-1
97
6
19
76
-1
97
7
19
77
-1
97
8
19
78
-1
97
9
19
79
-1
98
0
19
80
-1
98
1
19
81
-1
98
2
19
82
-1
98
3
19
83
-1
98
4
19
84
-1
98
5
19
85
-1
98
6
19
86
-1
98
7
19
87
-1
98
8
19
88
-1
98
9
19
89
-1
99
0
19
90
-1
99
1
19
91
-1
99
2
19
92
-1
99
3
19
93
-1
99
4
19
94
-1
99
5
19
95
-1
99
6
19
96
-1
99
7
19
97
-1
99
8
19
98
-1
99
9
19
99
-2
00
0
20
00
-2
00
1
SPI V
alu
es
Years
6 SPI

Dare et al.; JSRR, 26(8): 133-144, 2020; Article no.JSRR.62235
139
Fig. 6. SPI values for the River Kaduna Catchment for October to September reference periods against years
Fig. 7. RDIst values for the River Kaduna Catchment for October reference period against years
Fig. 8. RDIst values for the River Kaduna Catchment for October to December reference period
against years
-3.00
-2.00
-1.00
0.00
1.00
2.00
19
67
-1
96
8
19
68
-1
96
9
19
69
-1
97
0
19
70
-1
97
1
19
71
-1
97
2
19
72
-1
97
3
19
73
-1
97
4
19
74
-1
97
5
19
75
-1
97
6
19
76
-1
97
7
19
77
-1
97
8
19
78
-1
97
9
19
79
-1
98
0
19
80
-1
98
1
19
81
-1
98
2
19
82
-1
98
3
19
83
-1
98
4
19
84
-1
98
5
19
85
-1
98
6
19
86
-1
98
7
19
87
-1
98
8
19
88
-1
98
9
19
89
-1
99
0
19
90
-1
99
1
19
91
-1
99
2
19
92
-1
99
3
19
93
-1
99
4
19
94
-1
99
5
19
95
-1
99
6
19
96
-1
99
7
19
97
-1
99
8
19
98
-1
99
9
19
99
-2
00
0
20
00
-2
00
1
SPI V
alu
es
Years
12 SPI
-3.00
-2.50
-2.00
-1.50
-1.00
-0.50
0.00
0.50
1.00
1.50
2.00
19
67
-1
96
8
19
68
-1
96
9
19
69
-1
97
0
19
70
-1
97
1
19
71
-1
97
2
19
72
-1
97
3
19
73
-1
97
4
19
74
-1
97
5
19
75
-1
97
6
19
76
-1
97
7
19
77
-1
97
8
19
78
-1
97
9
19
79
-1
98
0
19
80
-1
98
1
19
81
-1
98
2
19
82
-1
98
3
19
83
-1
98
4
19
84
-1
98
5
19
85
-1
98
6
19
86
-1
98
7
19
87
-1
98
8
19
88
-1
98
9
19
89
-1
99
0
19
90
-1
99
1
19
91
-1
99
2
19
92
-1
99
3
19
93
-1
99
4
19
94
-1
99
5
19
95
-1
99
6
19
96
-1
99
7
19
97
-1
99
8
19
98
-1
99
9
19
99
-2
00
0
20
00
-2
00
1
RD
I Val
ues
Years
1 RDI
-3.00
-2.00
-1.00
0.00
1.00
2.00
19
67
-1
96
81
96
8 -
19
69
19
69
-1
97
01
97
0 -
19
71
19
71
-1
97
21
97
2 -
19
73
19
73
-1
97
41
97
4 -
19
75
19
75
-1
97
61
97
6 -
19
77
19
77
-1
97
81
97
8 -
19
79
19
79
-1
98
01
98
0 -
19
81
19
81
-1
98
21
98
2 -
19
83
19
83
-1
98
41
98
4 -
19
85
19
85
-1
98
61
98
6 -
19
87
19
87
-1
98
81
98
8 -
19
89
19
89
-1
99
01
99
0 -
19
91
19
91
-1
99
21
99
2 -
19
93
19
93
-1
99
41
99
4 -
19
95
19
95
-1
99
61
99
6 -
19
97
19
97
-1
99
81
99
8 -
19
99
19
99
-2
00
02
00
0 -
20
01
RD
I Val
ues
Years
3 RDI

Fig. 9. RDIst values for the River Kaduna Catchment for October to March reference periods
Fig. 10. RDIst values for the River Kaduna Catchment for October to September reference
Fig. 11. Frequency of droughts (1967
-5.00
-4.00
-3.00
-2.00
-1.00
0.00
1.00
2.00
19
67
-1
96
81
96
8 -
19
69
19
69
-1
97
01
97
0 -
19
71
19
71
-1
97
21
97
2 -
19
73
19
73
-1
97
41
97
4 -
19
75
RD
I Val
ues
-3.00
-2.00
-1.00
0.00
1.00
2.00
3.00
19
67
-1
96
8
19
68
-1
96
9
19
69
-1
97
0
19
70
-1
97
1
19
71
-1
97
2
19
72
-1
97
3
19
73
-1
97
4
19
74
-1
97
5
19
75
-1
97
6
RD
I Val
ues
32%
6%
Drought Severity classification
Severe wet Conditions
Normal condition dry
Dare et al.; JSRR, 26(8): 133-144, 2020; Article no.
140
values for the River Kaduna Catchment for October to March reference periods against years
values for the River Kaduna Catchment for October to September reference
periods against years
Frequency of droughts (1967 – 2001) characterised by RDIst
19
75
-1
97
61
97
6 -
19
77
19
77
-1
97
81
97
8 -
19
79
19
79
-1
98
01
98
0 -
19
81
19
81
-1
98
21
98
2 -
19
83
19
83
-1
98
41
98
4 -
19
85
19
85
-1
98
61
98
6 -
19
87
19
87
-1
98
81
98
8 -
19
89
19
89
-1
99
01
99
0 -
19
91
19
91
-1
99
21
99
2 -
19
93
19
93
-1
99
41
99
4 -
19
95
19
95
-1
99
61
99
6 -
19
97
19
97
-1
99
8
Years
6 RDI
19
75
-1
97
6
19
76
-1
97
7
19
77
-1
97
8
19
78
-1
97
9
19
79
-1
98
0
19
80
-1
98
1
19
81
-1
98
2
19
82
-1
98
3
19
83
-1
98
4
19
84
-1
98
5
19
85
-1
98
6
19
86
-1
98
7
19
87
-1
98
8
19
88
-1
98
9
19
89
-1
99
0
19
90
-1
99
1
19
91
-1
99
2
19
92
-1
99
3
19
93
-1
99
4
19
94
-1
99
5
19
95
-1
99
6
19
96
-1
99
7
19
97
-1
99
8
Years
12 RDI
6% 9%
35%
6%12%
Drought Severity classification
Severe wet Conditions Moderate wet Normal conditions wet
Normal condition dry Moderate drought Severe drought
; Article no.JSRR.62235
values for the River Kaduna Catchment for October to March reference periods
values for the River Kaduna Catchment for October to September reference
19
98
-1
99
91
99
9 -
20
00
20
00
-2
00
1
19
97
-1
99
8
19
98
-1
99
9
19
99
-2
00
0
20
00
-2
00
1

Dare et al.; JSRR, 26(8): 133-144, 2020; Article no.JSRR.62235
141
3.4 SDI Analysis
The Streamflow Drought Index (SDI) series were graphically compared for each reference period as shown in Figs. 12-15. From the reference periods the following were observed: Mild drought conditions was observed in the year 1968-69, 1970-71, 1973-74, 1980-81, 1983-86, 1994-95, 1996-97 and 1998-99 for one month SDI reference period; for 3 months reference period in the year 1970-71, 1973-74, 1980-81, 1983-86, 1991-93, 1996-97 and 1998-99; also for six months reference period in the year 1970-71, 1973-74, 1980-81, 1983-86, 1991-93, 1994-
95, 1996-97, 1998-99; and finally for annual reference period mild drought was observed in the year 1970-71, 1975-77, 1981-83, 1984-85, 1987-89, 1990-91, 1992-93. Moderate drought condition was only observed in the annual reference period in the year 1985-86 and 1991-92. Severe drought condition was observed in the year 1968-69 and extreme drought condition was observed in the year 1983-84 under the annual time scale. Fig. 16 also shows a prevalent non – drought condition of about 63% with 37% observed drought scenarios.
Fig. 12. SDI series for the River Kaduna Catchment for October reference period (1 month)
Fig. 13. SDI series for the River Kaduna Catchment for the reference period October to December (3 months)
-2.50
-2.00
-1.50
-1.00
-0.50
0.00
0.50
1.00
1.50
2.00
19
67
-1
96
8
19
68
-1
96
9
19
69
-1
97
0
19
70
-1
97
1
19
71
-1
97
2
19
72
-1
97
3
19
73
-1
97
4
19
74
-1
97
5
19
75
-1
97
6
19
76
-1
97
7
19
77
-1
97
8
19
78
-1
97
9
19
79
-1
98
0
19
80
-1
98
1
19
81
-1
98
2
19
82
-1
98
3
19
83
-1
98
4
19
84
-1
98
5
19
85
-1
98
6
19
86
-1
98
7
19
87
-1
98
8
19
88
-1
98
9
19
89
-1
99
0
19
90
-1
99
1
19
91
-1
99
2
19
92
-1
99
3
19
93
-1
99
4
19
94
-1
99
5
19
95
-1
99
6
19
96
-1
99
7
19
97
-1
99
8
19
98
-1
99
9
19
99
-2
00
0
20
00
-2
00
1
SDI V
alu
es
Years
1 SDI
-2.50
-2.00
-1.50
-1.00
-0.50
0.00
0.50
1.00
1.50
2.00
19
67
-1
96
8
19
68
-1
96
9
19
69
-1
97
0
19
70
-1
97
1
19
71
-1
97
2
19
72
-1
97
3
19
73
-1
97
4
19
74
-1
97
5
19
75
-1
97
6
19
76
-1
97
7
19
77
-1
97
8
19
78
-1
97
9
19
79
-1
98
0
19
80
-1
98
1
19
81
-1
98
2
19
82
-1
98
3
19
83
-1
98
4
19
84
-1
98
5
19
85
-1
98
6
19
86
-1
98
7
19
87
-1
98
8
19
88
-1
98
9
19
89
-1
99
0
19
90
-1
99
1
19
91
-1
99
2
19
92
-1
99
3
19
93
-1
99
4
19
94
-1
99
5
19
95
-1
99
6
19
96
-1
99
7
19
97
-1
99
8
19
98
-1
99
9
19
99
-2
00
0
20
00
-2
00
1
SDI V
alu
es
Years
3 SDI
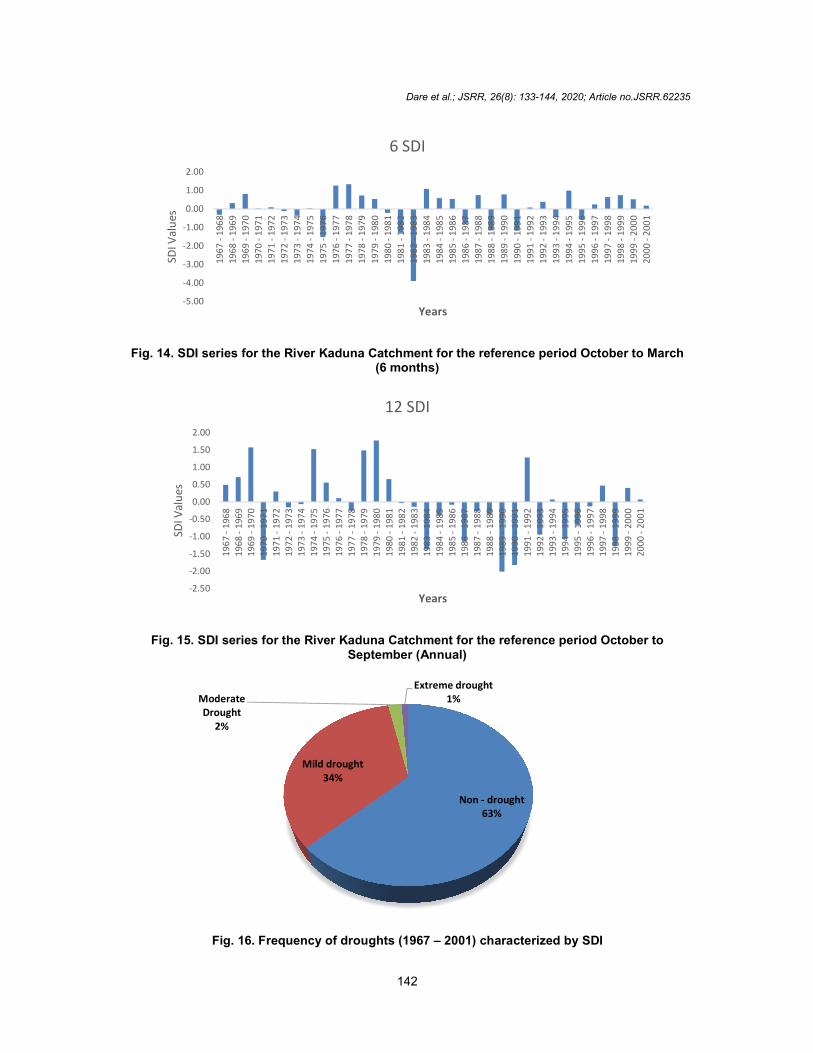
Fig. 14. SDI series for the River Kaduna Catchment for the reference period October to March
Fig. 15. SDI series for the River Kaduna Catchment for the reference period October to
Fig. 16. Frequency of droughts (1967
-5.00
-4.00
-3.00
-2.00
-1.00
0.00
1.00
2.00
19
67
-1
96
8
19
68
-1
96
9
19
69
-1
97
0
19
70
-1
97
1
19
71
-1
97
2
19
72
-1
97
3
19
73
-1
97
4
19
74
-1
97
5
19
75
-1
97
6
SDI V
alu
es
-2.50
-2.00
-1.50
-1.00
-0.50
0.00
0.50
1.00
1.50
2.00
19
67
-1
96
8
19
68
-1
96
91
96
9 -
19
70
19
70
-1
97
1
19
71
-1
97
21
97
2 -
19
73
19
73
-1
97
4
19
74
-1
97
5
19
75
-1
97
6
SDI V
alu
es
Mild drought
Moderate Drought
2%
Dare et al.; JSRR, 26(8): 133-144, 2020; Article no.
142
SDI series for the River Kaduna Catchment for the reference period October to March (6 months)
SDI series for the River Kaduna Catchment for the reference period October to September (Annual)
Frequency of droughts (1967 – 2001) characterized by SDI
19
75
-1
97
6
19
76
-1
97
7
19
77
-1
97
8
19
78
-1
97
9
19
79
-1
98
0
19
80
-1
98
1
19
81
-1
98
2
19
82
-1
98
3
19
83
-1
98
4
19
84
-1
98
5
19
85
-1
98
6
19
86
-1
98
7
19
87
-1
98
8
19
88
-1
98
9
19
89
-1
99
0
19
90
-1
99
1
19
91
-1
99
2
19
92
-1
99
3
19
93
-1
99
4
19
94
-1
99
5
19
95
-1
99
6
19
96
-1
99
7
19
97
-1
99
8
Years
6 SDI
19
75
-1
97
6
19
76
-1
97
7
19
77
-1
97
81
97
8 -
19
79
19
79
-1
98
0
19
80
-1
98
1
19
81
-1
98
21
98
2 -
19
83
19
83
-1
98
4
19
84
-1
98
5
19
85
-1
98
61
98
6 -
19
87
19
87
-1
98
8
19
88
-1
98
9
19
89
-1
99
01
99
0 -
19
91
19
91
-1
99
2
19
92
-1
99
31
99
3 -
19
94
19
94
-1
99
5
19
95
-1
99
6
19
96
-1
99
71
99
7 -
19
98
Years
12 SDI
Non - drought63%
Mild drought34%
Extreme drought 1%
; Article no.JSRR.62235
SDI series for the River Kaduna Catchment for the reference period October to March
SDI series for the River Kaduna Catchment for the reference period October to
19
97
-1
99
8
19
98
-1
99
9
19
99
-2
00
0
20
00
-2
00
1
19
97
-1
99
8
19
98
-1
99
9
19
99
-2
00
02
00
0 -
20
01

Dare et al.; JSRR, 26(8): 133-144, 2020; Article no.JSRR.62235
143
3.5 Overall Drought Monitoring
During the period under study (34 years), only one year show extreme drought condition. The temperature based calculation of potential evapotranspiration used in RDI calculation showed almost equal values with the precipitation based calculation, in view of this it is recommended that methods that consider more climatic data should be used for the potential evapotranspiration calculation i.e. using Penman Monteith method. Also, a modified DrinC software should be developed taking into considerations different drought indices calculation input to enable proper results comparison. Moreover, there was a little similarity as shown between SPI and RDI indices since the two monitored meteorological drought while SDI indices shows hydrological drought. The region shows over all minimal drought conditions but moreover the deficits that might be experienced could be balanced by irrigation approach in the area of agricultural production, and also creation of reservoirs across river tributaries will help to mitigate the effects of drought in the region.
4. CONCLUSION
Based on Standardized Precipitation Index (SPI), Reconnaissance Drought Index (RDI) and Streamflow Drought Index (SDI) indexes, the drought characteristics of the catchment area were investigated by analyzing meteorological and streamflow data from 1967 to 2001. The results of this analysis show that more non-drought/normal conditions were predominant than drought conditions. Only few years showed extremely dry conditions, but the normal conditions also need careful attention before the average annual rainfall wouldn’t sustain ecological demands. The results from this study could also be used for comparison or as a guide for neighbouring states around the study area which will help to mitigate adverse effect of drought on them through proper preparedness.
CONSENT
Not applicable for this study
ETHICAL APPROVAL
Not Applicable for this study.
ACKNOWLEDGEMENTS
The Authors acknowledge the efforts of the Kaduna State Waterboard and the Nigeria
Meteorological Agency for assisting in providing the secondary used in this research.
COMPETING INTERESTS Authors have declared that no competing interests exist.
REFERENCES 1. Tsakiris G, Vangelis H. Establishing a
Drought Index incorporating evapotranspiration. European Water. 2005;9/10:3-11.
2. Tsakiris G, Pangalou D, Vangelis H. Regional drought assessment based on the Reconnaissance Drought Index (RDI). Water Resources Management. 2007b;21:821-833
3. Asadizarch MA, Malekinezhad H, Mobin MH, Dastorani MT, Kousari MR. Drought monitoring by reconnaissance drought index (RDI) in Iran. Water Resources Mgt. 2011;25(13):3485–504.
4. Khalili D, Farnoud T, Jamshidi H, Kamgar-Haghighi AA, Zand-Parsa S. Comparability analyses of the SPI and RDI meteorological drought indices in different climatic zones. Water Resources Management. 2011;25 (6):1737–57.
5. Elagib NA, Elhag MM. Major Climate indicators of ongoing drought in Sudan. J Hydrol; 2011;409(3–4):612–25.
6. Awosika L, Diop ES, Downing TE, El-Raey M, Le Sueur D, Magadza CHD, Tour S, Vogel C. Chapter 2: Africa, IPCC Special Report on The Regional Impacts of Climate Change An Assessment of Vulnerability; 1998.
7. Sawa BA, Buhari B. Temperature variability and outbreak of meningitis and measles in Zaria, northern Nigeria. Resc. J. Appl. Sci. Egnr. Technol. 2010;3(5):399-402.
8. McKee TB, Doeskin NJ, Kleist J. The relationship of drought frequency and duration to time scales. In: Proceedings of the Eighth Conference on Applied Climatology, Anaheim, CA. American Meteorological Society. Boston, MA. 1993;179-184.
9. Edwards DC, McKee TB. Characteristics of 20th century drought in the United States at multiple time scales. Climatology Report Number 97-2, Colorado State University, Fort Collins, Colorado; 1997.

Dare et al.; JSRR, 26(8): 133-144, 2020; Article no.JSRR.62235
144
10. Thom HCS. A note on the gamma distribution. Monthly Weather Review. 1958;86:117-122.
11. Nalbantis Ι. Drought and Streamflow. European Water. 2008;23/24:65- 76.
_______________________________________________________________________________ © 2020 Dare et al.; This is an Open Access article distributed under the terms of the Creative Commons Attribution License (http://creativecommons.org/licenses/by/4.0), which permits unrestricted use, distribution, and reproduction in any medium, provided the original work is properly cited.
Peer-review history: The peer review history for this paper can be accessed here:
http://www.sdiarticle4.com/review-history/62235